compositional and structual effects on...
TRANSCRIPT

COMPOSITIONAL AND STRUCTUAL EFFECTS ON THE HIGH-TEMPERATURE OXIDATION AND HOT CORROSION BEHAVIOR OF MCrAlY COATING
COMPOSITIONS AT 900℃
by
Lingpeng Chen
B. S. in Metallurgical Science and Engineering, Central South University, 2013
Submitted to the Graduate Faculty of
Swanson School of Engineering in partial fulfillment
of the requirements for the degree of
Master of Science in Materials Science and Engineering
University of Pittsburgh
2018

ii
UNIVERSITY OF PITTSBURGH
SWANSON SCHOOL OF ENGINEERING
This thesis was presented
by
Lingpeng Chen
It was defended on
April 6, 2018
and approved by
Brian Gleeson, PhD, Professor, Department of Mechanical Engineering and Materials Science
Jung-Kun Lee, PhD, Associate Professor, Department of Mechanical Engineering and
Materials Science
Wei Xiong, PhD, Assistant Professor, Department of Mechanical Engineering and Materials
Science
Thesis Advisor: Brain Gleeson, PhD, Professor, Department of Mechanical Engineering and
Materials Science

iii
Copyright © by [Author’s name]
[year]
Copyright © by Lingpeng Chen
2018

iv
Hot corrosion is a highly accelerated surface degradation process that has been found in gas
turbine engines. To increase the hot-corrosion resistance of engine components, a coating is
often used to isolate the gas phase and deposited salt from the base alloy. In practice, MCrAlY
(M=Co, Ni or Co+Ni)-based coatings are often used. The hot-corrosion resistance of MCrAlY-
based coatings relies on the formation of a continuous Al2O3 scale in the corrosive environment.
Thus, an understanding of the compositional and microstructural factors affecting the high-
temperature corrosion behavior of MCrAlY-based coating compositions is needed.
The main aim of this study was to assess the influences of overall composition, phase
volume fraction and phase composition of MCrAlY-based alloys on oxidation behavior and hot
corrosion resistance. By heat-treating at different temperatures, a given alloy could have different
phase volume fractions and phase compositions. Comparing the performance of different
structural variations of the same alloys under oxidation and hot corrosion conditions, the
influence of phase volume fraction and phase composition could be investigated. The results
showed that aluminum content in the alloys is the key factor determining oxidation behavior.
Higher aluminum content resulted in a thicker oxide scale. In addition, the steady-state oxidation
rate was determined by the total aluminum content in the alloy. For hot corrosion, higher Cr
content could promote the rapid establishment of a continuous Al2O3 layer. Higher Al content is
COMPOSITIONAL AND STRUCTUAL EFFECTS ON THE HIGH-TEMPERATURE
OXIDATION AND HOT CORROSION BEHAVIOR OF MCrAlY COATING
COMPOSITIONS AT 900℃
Lingpeng Chen, M.S.
University of Pittsburgh, 2018

v
beneficial to the formation of thicker aluminum oxide layer, while phase volume fraction and
phase composition were not found to have obvious influence on hot-corrosion resistance.

vi
TABLE OF CONTENTS
ACKNOWLEDGEMENTS .................................................................................................... XIII
1.0 INTRODUCTION ........................................................................................................ 1
2.0 SUPERALLOYS FOR HIGH-TEMPERATURE APPLICATIONS ..................... 3
2.1 SUPERALLOYS IN GAS TURBINE ENGINES ............................................. 3
2.2 COMPOSITION, STRUCTURE, AND PROPERTY OF SUPERALLOYS. 6
2.3 COATINGS FOR SUPERALLOYS .................................................................. 8
3.0 HOT CORROSION AND OXIDATION ................................................................. 12
3.1 OXIDATION ...................................................................................................... 12
3.1.1 Metal oxidation .............................................................................................. 12
3.1.2 Alloy oxidation ............................................................................................... 17
3.2 HOT CORROSION ........................................................................................... 26
3.2.1 Basics of hot corrosion .................................................................................. 26
3.2.2 High temperature (Type I) hot corrosion .................................................... 32
3.2.3 Low temperature (Type II) hot corrosion ................................................... 39
3.3 AIMS OF CURRENT STUDY ......................................................................... 46
4.0 EXPERIMENTAL PROCEDURES ........................................................................ 47
4.1 SAMPLE PREPARATION .............................................................................. 47
4.2 OXIDATION TESTING ................................................................................... 48
vii
4.3 HOT CORROSION TESTING ........................................................................ 49
5.0 RESULTS AND DISCUSSION ................................................................................ 50
5.1 SUPERALLOYS ................................................................................................ 50
5.1.1 Alloy microstructures .................................................................................... 50
5.1.2 High Temperature Oxidation ....................................................................... 61
5.1.3 High-temperature (900°C) hot corrosion .................................................... 75
5.2 CONCLUSIONS ................................................................................................ 85
6.0 SUMMARY ................................................................................................................ 86
7.0 FUTURE WORK ....................................................................................................... 87
BIBLIOGRAPHY ....................................................................................................................... 88

viii
LIST OF TABLES
Table 1. Solubility of O2 in molten Na2SO4 ................................................................................. 35
Table 2. Solubility of SO2 in molten Na2SO4 ............................................................................... 35
Table 3. Free energies of formation for sulfides and oxides at 1123K (Kcal/mol S or O) ........... 37
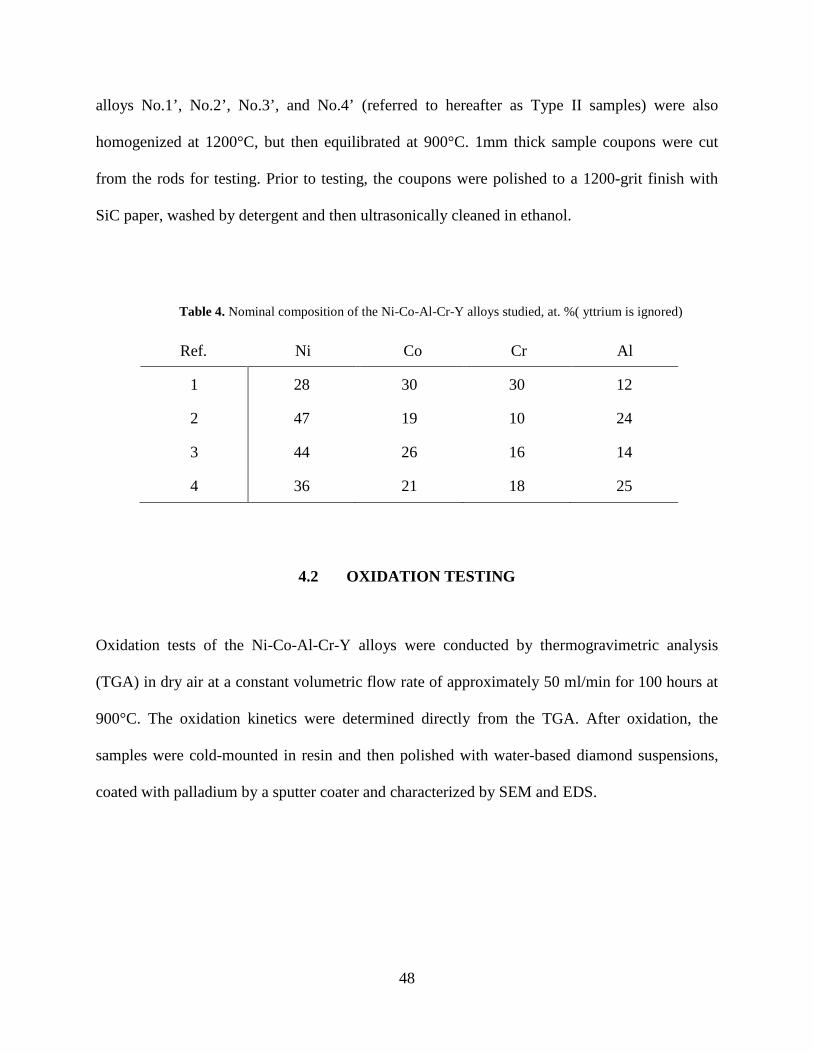
Table 4. Nominal composition of the Ni-Co-Al-Cr-Y alloys studied, at. %( yttrium is ignored) 48
Table 5. Measured phase compositions of Ni-Co-Al-Cr-Y samples, at. %( yttrium is ignored).. 52
Table 6. Averaged measured phase volume fractions of Ni-Co-Al-Cr alloys .............................. 53
Table 7. Comparison of the calculated and measured phase compositions of Ni-Co-Al-Cr-Y
samples, at. %. (calculated composition/ measured composition) .................................... 56
Table 8. Comparison of the calculated and measured phase volume fractions of Ni-Co-Al-Cr-Y
samples. (calculated phase volume fraction/measured phase volume fraction) ............... 58
Table 9. Aluminum oxide layer and β-depletion layer thickness, oxidation rate constant and
aluminum content of Type I and Type II samples ............................................................ 70
Table 10. Calculated and measured thicknesses of β-depletion zone of samples No.2 and No.2’ 75

ix
LIST OF FIGURES
Figure 1. Section of gas turbine engine .......................................................................................... 4
Figure 2. Ni-Al phase diagram ........................................................................................................ 7
Figure 3. Co-Al phase diagram ....................................................................................................... 8
Figure 4. Relative oxidation and corrosion resistance of high temperature coating systems ....... 11
Figure 5. Ni-O phase diagram ....................................................................................................... 13
Figure 6. Transverse section of pure nickel oxidized in air at 1000°C for 3 hours ...................... 14
Figure 7. Weight change per square centimeter of oxidized nickel .............................................. 15
Figure 8. Al-O phase diagram ....................................................................................................... 15
Figure 9. Cr-O phase diagram ....................................................................................................... 16
Figure 10. Micrograph of Ni-2Cr-4Al superalloy after 20h oxidation in 0.1 atm of oxygen at
1000°C .............................................................................................................................. 18
Figure 11. Ni-Al-Cr system phase diagram at 1000°C ................................................................ 18
Figure 12. Micrograph of Ni-20Cr-2Al after 21h oxidation in 0.1 atm of oxygen at 1100°C ..... 19
Figure 13. Ni-Al-Cr system phase diagram at 1100°C ................................................................. 19
Figure 14. Micrograph of Ni-20Cr-4Al after 20h oxidation in 0.1 atm of oxygen at 1200°C ..... 20
Figure 15. Ni-Al-Cr system phase diagram at 1200°C ................................................................. 20

x
Figure 16. Oxygen solubility in the Ni-Cr-AI alloys as a function of Cr concentration at 1200°C
........................................................................................................................................... 24
Figure 17. The change of the slope of the diffusion path at the scale/alloy interface as a function
of Cr concentration at 1200°C .......................................................................................... 24
Figure 18. Summary diagram showing Type I and Type II hot corrosion ................................... 27
Figure 19. Schematic drawing illustrating hot corrosion of metals and alloys ............................. 28
Figure 20. A thermodynamic stability diagram for the Na–O–S system at constant temperature 29
Figure 21. Measured oxide solubilities in fused Na2SO4 at 927°C (1200 k) and 1 atm O2 .......... 31
Figure 22. The thermodynamic stability diagram of nickel in Ni-S-O system ............................. 33
Figure 23. High temperature hot corrosion process of pure nickel ............................................... 34
Figure 24. Na2SO4-NiSO4 system phase diagram [60] ................................................................ 39
Figure 25. Superimposed stability diagrams of Ni–O–S and Na–O–S systems at 700°C [55] .... 41
Figure 26. Schematic representation of microstructural evolution and transport processes during
reaction of nickel with Na2SO4 in O2–0.1SO2 at 700°C [55] ........................................... 42
Figure 27. The critical value of SO3 pressure required to form liquid Na2SO4-NiSO4 solution at
different temperatures ....................................................................................................... 43
Figure 28. Na2SO4-CoSO4 system phase diagram ........................................................................ 45
Figure 29. Critical value of SO3 pressure required to form (A) liquid Na2SO4-CoSO4 solution
from Co3O4, (B) liquid Na2SO4-CoSO4 solution from CoO, (C) solid CoSO4 from Co3O4
at different temperatures ................................................................................................... 45
Figure 30. Micrographs of Ni-Co-Al-Cr-Y samples..................................................................... 51
Figure 31. Ni-Co-Al-Cr alloys phase diagrams at (A) 19, (B) 26, and (C) 30 at. % Co and (1)
900°C, (2)1100°C, and (3)1200°C .................................................................................... 55

xi
Figure 32. Calculated phase equilibria of Ni-Co-Al-Cr alloys with respect to temperature ........ 57
Figure 33. Ni-Co-Al-Cr alloys phase diagrams at 1100°C ........................................................... 59
Figure 34. Comparison of (a) Calculated and (b) measured phase compositions for No.1, No.1’,
No.2 and No.2 samples ..................................................................................................... 60
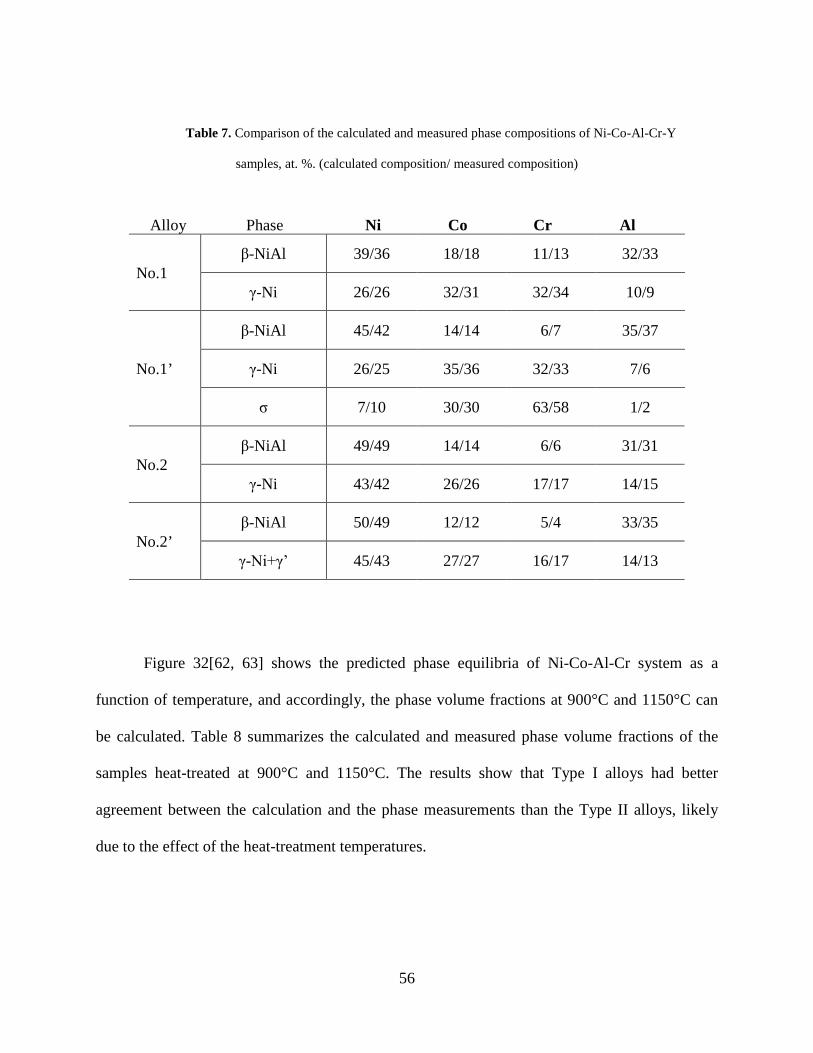
Figure 35. Micrographs of 100h oxidation of (a) No.1 and (b) No.1’, (c) No.2 and (d) No.2’, (e)
No.3 and (f) No.3’, and (g) No.4 and (h) No.4’ samples at 900°C ................................... 62
Figure 36. Weight change of samples with respect to time .......................................................... 65
Figure 37. Weight change of samples with respect to time .......................................................... 66
Figure 38. Square of mass gain of sample No.1' versus oxidation time ....................................... 67
Figure 39. Square of mass gains of alloys with respect to oxidation time.................................... 70
Figure 40. Oxidation rate constant of Ni-Co-Cr-Al alloys ........................................................... 71
Figure 41. Arrhenius plot of rate constants for experimental data from this thesis and various
other studies ...................................................................................................................... 72
Figure 42. The flat Al diffusion through the alloy to the alloy/scale interface ............................. 74
Figure 43. Micrographs of sample No.1 with high temperature hot corrosion at 900°C with
Na2SO4 for (a) 1h, (b) 20h and (c) 100h .......................................................................... 76
Figure 44. Micrographs of sample No.4 with high temperature hot corrosion at 900°C with
Na2SO4 for (a) 1h, (b) 20h and (c) 100h ........................................................................... 78
Figure 45. Micrographs of sample No.2 with high temperature hot corrosion at 900°C with
Na2SO4 for (a) 1h, (b) 20h and (c) 100h .......................................................................... 79
Figure 46. Micrographs of sample No.3 with high temperature hot corrosion at 900°C with
Na2SO4 for (a) 1h, (b) 20h and (c) 100h .......................................................................... 81

xii
Figure 47. Micrographs of samples (a) No.1’, (b) No.2’, (c) No.3’, and (d) No.4’ with high
temperature hot corrosion at 900°C with Na2SO4 for 100h ............................................ 84

xiii
ACKNOWLEDGEMENTS
At first, I would like to thank my thesis advisor Professor Gleeson of Swanson School of
Engineering at University of Pittsburgh: thank you for your patience and instruction although I
had waste so much time to complete my thesis and your guidance which steered me in the right
direction when I ran into a trouble spot.
I would also like to thank Patrick T. Brennan for his help in revision of my thesis. In
addition, I would like to express my gratitude to Xu Liu and Wei Zhao because of their
instruction in my experiments.
Nevertheless, I would like to thank my family: my parents and little brother for their
spiritual support throughout writing the thesis.
1
1.0 INTRODUCTION
Hot corrosion is a highly accelerated surface degradation process which is generally separated
into two forms: Type I hot corrosion, which is in the temperature range of 850-1000°C; and Type
II hot corrosion, which is in the temperature range of 600-800°C [1, 2]. The earliest report of hot
corrosion was the accelerated degradation of stainless steel superheater supports [3]. In this
incident, corroded marine boilers were covered in sodium sulfate and it was shown that this salt
had a significant role in the corrosion process. Since then, hot corrosion has been reported in
other applications such as engines burning natural gas and gas turbines [1, 4]. Components
subjected to hot corrosion have several similarities: all operated at high temperature (generally
from 700°C to 900°C); were exposed to impurities from the environment, like sodium sulfate
and chlorides; and were maintained at high temperature for an extended period (at least 225
hours) [4].
In high-temperature applications, MCrAl (M=Co, Ni or Co+Ni)-based superalloys are the
commonly used due primarily to their high-temperature strength [5]. To increase the hot
corrosion resistance of components, a coating is often used to isolate the gas phase and deposited
salt from the base alloy [6]. In practice, the coating methods consist of one of two types:
diffusion aluminide coatings and overlay MCrAlY-based coatings. These coatings are generally
designed to form a protective Al2O3 scale in corrosive environments. Thus, studies on the hot

2
corrosion and oxidation resistance of MCrAlY-based overlay coating are needed to determine
their high-temperature properties.
This thesis covers the oxidation and hot corrosion of model MCrAlY-based overlay
coatings whose compositions were systematically varied to control phase volume fractions and
chemistries. The thesis is organized as follows:
Chapter 2 provides a background on superalloys used in practice, with a focus on their
compositions, structures and properties.
Chapter 3 discovers the oxidation and hot corrosion mechanisms of metals and alloys.
Chapter 4 covers the experimental procedures used for sample preparation and oxidation and
hot corrosion testing of the Ni-Co-Cr-Al-Y alloys and overlay coatings
Chapter 5 presents the results and a discussion of the oxidation and hot corrosion
experiments that are conducted.
Chapter 6 and Chapter 7 provide a thesis summary and proposed future work, respectively.

3
2.0 SUPERALLOYS FOR HIGH-TEMPERATURE APPLICATIONS
High-temperature superalloys are typically based on nickel and/or cobalt with additions such as
aluminum, iron and chromium. These specialized alloys are primarily designed for high-
temperature strength [5]. With different compositions, superalloys have various properties. With
regard to high-temperature strength, additions like Cr, Mo, and Ta can provide solid-solution
strengthening by dissolving into base metal solid solution. The addition of carbon to these alloys
leads to enhanced strength by formation of carbides. And the precipitation of intermetallic
phases, such as γ'-Ni3(Al, Ti), in the matrix can lead to significant strengthening.
With regard to oxidation and corrosion resistance, chromium and aluminum addition can
lead to the formation of a protective dense oxide layer on the surface of superalloys, which can
isolate the environment from the base superalloy. Different concentrations of Al and Cr have
different abilities to form a protective scale. Stringer [4] reported that generally at least 15% Cr
is required in nickel-based alloys for hot corrosion resistance between 750°C to 900°C.
2.1 SUPERALLOYS IN GAS TURBINE ENGINES
Superalloys are commonly used in the gas turbine engines of aircraft and ships. In this section,
gas turbine engines will be the main focus.

4
Gas turbine engines were developed in the middle of the 20th century, around the time of
World War II. Now they are widely used on commercial aircraft. Due to the high-temperature
operating environment, gas turbine engines are susceptible to hot corrosion and oxidation. Figure
1 presents a schematic of a gas turbine engine section. From this figure, the gas engine is divided
into the following three main parts: compressor; combustor; and turbine.
The compressor, which is connected to the air inlet, or intake, compresses air to
effectively combust fuel. In the compressor, the stationary and rotating blades form several
stages. Each successive stage increases the pressure of compressed air.
Figure 1. Section of gas turbine engine
The high-pressure air from the compressor is directed into the combustor where fuel is
sprayed by a series of nozzles to nebulize it and mix it with the compressed air. Due to the large
specific surface area of the nebulized fuel and the high air pressure, the gas temperature in the
combustor can be above 1900°C [1]. This extremely high temperature from the fuel combustion

5
is beyond the operating limit of superalloys, so that the superalloy component in the hot stages
need to be internally cooled.
The exhaust gas exiting from the combustor is at a high temperature and extreme
pressure. When it passes through the turbine, the gas expands and drives rotating blades in the
turbine section. This also drives the central shaft connected to the blades which provide energy
for the compressor, fuel pump and other accessories. To protect blades in the turbine, corrosion-
resistant coatings are often used in conjunction with cooling schemes.
After the turbine, high speed gas exits the engine through a nozzle and provides thrust.
What commonly results are that the superalloys in the engine degrade by elevated temperatures,
corrosive deposits and oxidizing gases.
At this high temperature, the reactivity of superalloy constituents are significantly raised,
and the reaction rates are increased to a large extent. The combination of high activities and
accelerated reaction rates contribute to the hot corrosion.
Sodium sulfate is a common corrosive deposit in gas turbine engines. The main sources
of sodium are fuel and intake air [1,4]. In fuel, sodium is dissolved in the oil from contamination
of seawater; and in air, it is suspended due to evaporation of seawater or pollutants. Sulfur is also
from fuel combustion and air. Oil may contain a considerable amount of sulfur, and although the
concentration is decreased in the refining process, remnant sulfur will exist [1]. In addition,
sulfur may be ingested from sources such as sulfur-containing gases released by active volcanoes
[4]. This also contributes to the formation of sulfates. Sodium chloride is another important
deposit due to its abundance in seawater. In the combustion process, sodium chloride can
transform to sodium sulfate at high temperature [7].

6
2.2 COMPOSITION, STRUCTURE, AND PROPERTY OF SUPERALLOYS
Superalloys used for high-temperature applications are based on nickel and/or cobalt, which have
a relatively high melting point and solubility for other elements. Cr, Al, Fe, C, Mo etc., are the
commonly used alloying additions [8]. Generally, Al and Cr can form protective oxide layers
that reduce the hot corrosion rate, and Mo and C confer excellent mechanical properties by solid-
solution strengthening or forming an intermetallic phase in the alloy.
In nickel-based superalloys, several phases form according to different solute elements
being metallic or nonmetallic. Figure 2[9] shows the Ni-Al phase diagram. Gamma (γ) phase is
an FCC solid solution of nickel and the base constituent of nickel-based superalloys. At higher
temperature, the solubility of additions is large enough to form a signal gamma phase, while at
lower temperature, a gamma-prime (γ') phase based on Ni3Al precipitates. γ' is an intermetallic
phase which has a slightly different lattice parameter from that of the γ phase; thus, it hardens the
nickel-based superalloys when dispersed as discrete participates in the γ matrix [5]. Below
650°C, gamma double-prime (γ")-Ni3Nb may precipitate. This γ" phase, which is body-centered
tetragonal, has a large difference in lattice parameter in comparison with γ matrix phase and can
significantly improve the mechanical strength of nickel-based superalloys [8]. Finally, carbide
phases, which can form at grain boundaries and inhibit grain- boundary motion, forms in alloys
with a relatively high carbon concentration [10, 11].
Compared with nickel, cobalt has better resistance to the high temperature (Type I) hot
corrosion [12], although its mechanical strength at high temperature is inferior. So, it is common
to mix nickel with cobalt to achieve superior properties. Figure 3 shows the Co-Al phase diagram
[13].

7
In addition, some refractory elements like Ru can extend the creep rupture life and
increase the steady-state creep activation energy of superalloys [14]. These additions can also
improve mechanical strength of superalloys by solid-solution strengthening.
Figure 2. Ni-Al phase diagram

8
Figure 3. Co-Al phase diagram
2.3 COATINGS FOR SUPERALLOYS
Raising the gas temperature in the combustor and turbine improves the engine thermal
efficiency. To increase the operating temperature in gas turbine engine, novel material design,
cooling technologies and manufacturing methods are applied; in addition, coatings provide
another crucial method to extend the service life of the superalloys and reduce hot corrosion and
oxidation.
Diffusion coatings are formed by enriching the alloy surface with aluminum, chromium
or silicon, which can form a protective oxide layer Al2O3, Cr2O3, and SiO2, respectively, during
exposure at high-temperature environments. The addition of platinum in diffusion coatings is
helpful for formation of an adherent oxide layer, which increases long-term resistance to
9
oxidation attack [1, 6, 15]. Improved coating methods, like depositing an interlayer in the
coatings can also promote hot corrosion and oxidation resistance [6].
Overlay coatings were developed after diffusion coatings as a means to better control
composition. Overlay coatings generally have good adherence to the substrate and excellent
high-temperature ductility. Overlay coatings are typically M-Al-Cr-Y in composition, where M
is nickel, cobalt or both. The addition of cobalt into NiCrAlY alloys can improve the ductility
and as a result, the service life is expanded [16]. In an MCrAlY alloy, nickel provides reasonable
oxidation resistance, while cobalt confers hot corrosion resistance at least at high temperature. In
addition, Y in the coating can extend the long term-cyclic oxidation resistance with optimized
concentration and surface condition [16-19]. In oxidation process, yttrium is bonded to oxygen
and enriched at splat boundaries. Besides, yttrium can also segregate at the coating surface [20].
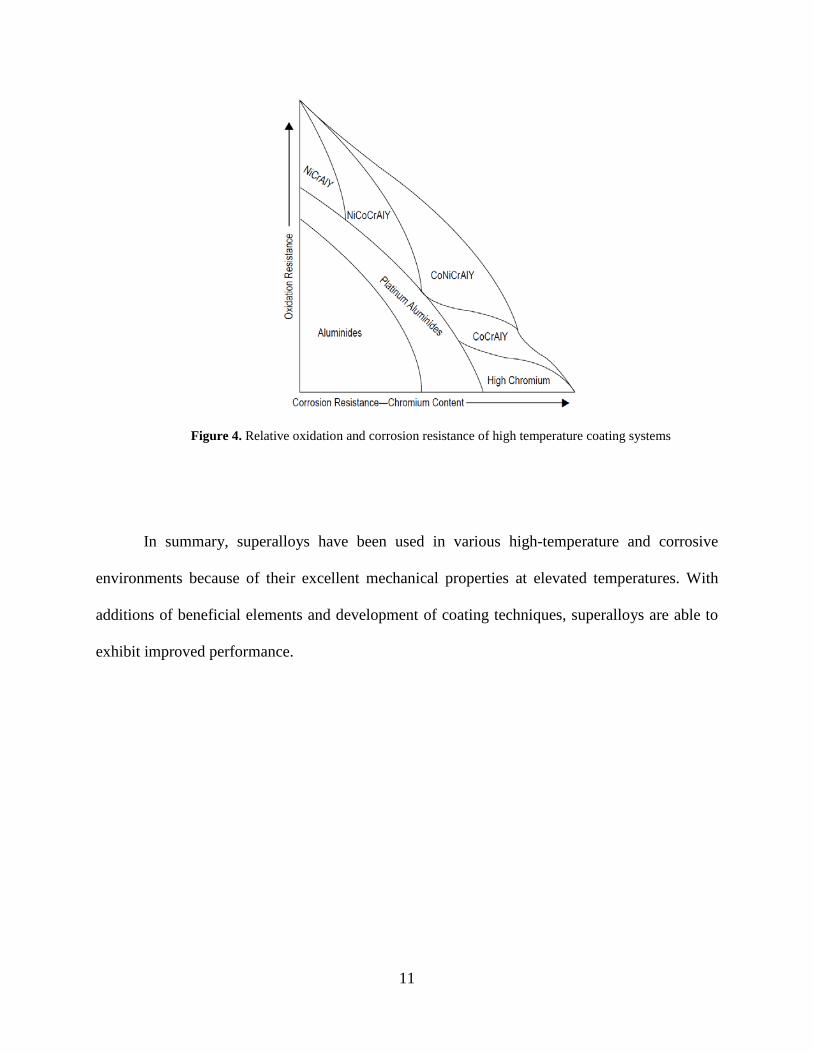
Figure 4[17] summaries the oxidation and hot corrosion resistance of some overlay coatings.
High-aluminum and low-chromium overlay coatings have resistance to high temperature (Type
I) hot corrosion, while overlay coatings with low-aluminum and high-chromium contents resist
low temperature (Type II) hot corrosion [1, 6]. Alloyed with several oxygen-active elements,
overlay coatings can be highly resistant to various critical environments. For example, overlay
coatings alloyed with platinum attain scales with less defects and stronger cyclic oxidation
resistance [6]. Nijdam and Sloof [21] found that the trace elements, like Ta and Re, could
increase the aluminum concentration in the alloy at the oxide/alloy interface. Pint [22] proposed
that the segregation of reactive-element ions could inhibit interfacial void growth in β-NiAl and
improve scale adhesion.
In practice, overlay coatings are deposited on a given substrate by different methods.
Electron-beam physical vapor deposition (EB-PVD), argon-shrouded plasma spray and high
10
velocity oxyfuel (HVOF) spraying process are commonly used. Different methods can result in a
variation in overlay coating microstructure. Nijdam and Sloof [23] studied the microstructure of
a NiCoCrAlY overlay coating deposited by electron beam physical vapor deposition. They
concluded that the overlay coating was composed of small equiaxed grains at the bottom and
large columnar grains at the top, which consisted of a periodic arrangement of γ and β lamellae.
Fritscher and Lee [24] studied the microstructure of a low-pressure plasma sprayed NiCoCrAlY
overlay coating and found that the coating was stratified in three layers: the thickest layer
containing γ and β grains near the substrate; a thin fibrous layer in the middle; and a thin porous
layer with amorphous grains on the outer edge of scale.
A new type of overlay coating, termed “smart coating”, was developed to provide high
temperature corrosion protection over a wide range of operating conditions [25, 26]. Smart
coatings can provide considerable protection to oxidation as well as Type I and Type II hot
corrosion. For high-temperature oxidation and Type I hot corrosion, nickel-base alloys
containing aluminum and chromium can decrease reaction rate effectively. However, cobalt-base
alloys with a high concentration of chromium outperform nickel-base alloys at low temperatures
at which Type II hot corrosion predominates. This is evidenced in Figure 4. Accordingly, a smart
coating is composed of a standard MCrAlY alloy which is preheated to form a chromium-rich
intermediate layer [25].
Under high temperature oxidation and hot corrosion, the coating can form Al2O3 to
prevent further reaction. The chromium-rich interlayer acts as a diffusion barrier and restricts
aluminum diffusion into the coating [27]. In low temperature Type II hot corrosion, the
intermediate layer can form a chromium-rich oxide layer limiting the corrosion rate.
11
Figure 4. Relative oxidation and corrosion resistance of high temperature coating systems
In summary, superalloys have been used in various high-temperature and corrosive
environments because of their excellent mechanical properties at elevated temperatures. With
additions of beneficial elements and development of coating techniques, superalloys are able to
exhibit improved performance.

12
3.0 HOT CORROSION AND OXIDATION
3.1 OXIDATION
As discussed in the last chapter, in gas turbine engines, coatings of superalloys play a critical
role. In high-temperature application with corrosive environments, oxygen-active metals in
overlay coatings, i.e., Al and Cr, react with oxygen in the environment to form protective oxide
layers. These layers are generally dense and have low solubility of oxygen, which is beneficial to
retarding the hot corrosion and expanding the service life.
3.1.1 Metal oxidation
In this section, oxidation of Ni, Al and Cr, which are main components of overlay coatings, shall
be discussed.
Figure 5[28] is the Ni-O phase diagram. The melting point of Ni is 1455°C, which is
higher than the working temperature of superalloys. This means that nickel-based superalloys
can be solid phase and maintain decent mechanical strength during operation. The thermal
stability and crystal structure are key factors as to why nickel-based superalloys are
predominantly used in practice. The oxygen solubility in Ni is also important in hot corrosion
because it determines the oxidation rate. Neumann [28] proposed that the maximum oxygen
solubility in Ni is approximately 0.05 at. %, which is relatively low.

13
With regard to the thermodynamics of the Ni-NiO system, the relevant equilibrium
equation below the eutectic temperature is [28]:
Ni + (g) = NiO
(1000K to 1713K)
When T=1273K, the calculated . Such a low oxygen pressure
means that, at the working temperature of superalloys, oxidation of the nickel base metal is
thermodynamically favored.
Figure 5. Ni-O phase diagram
14
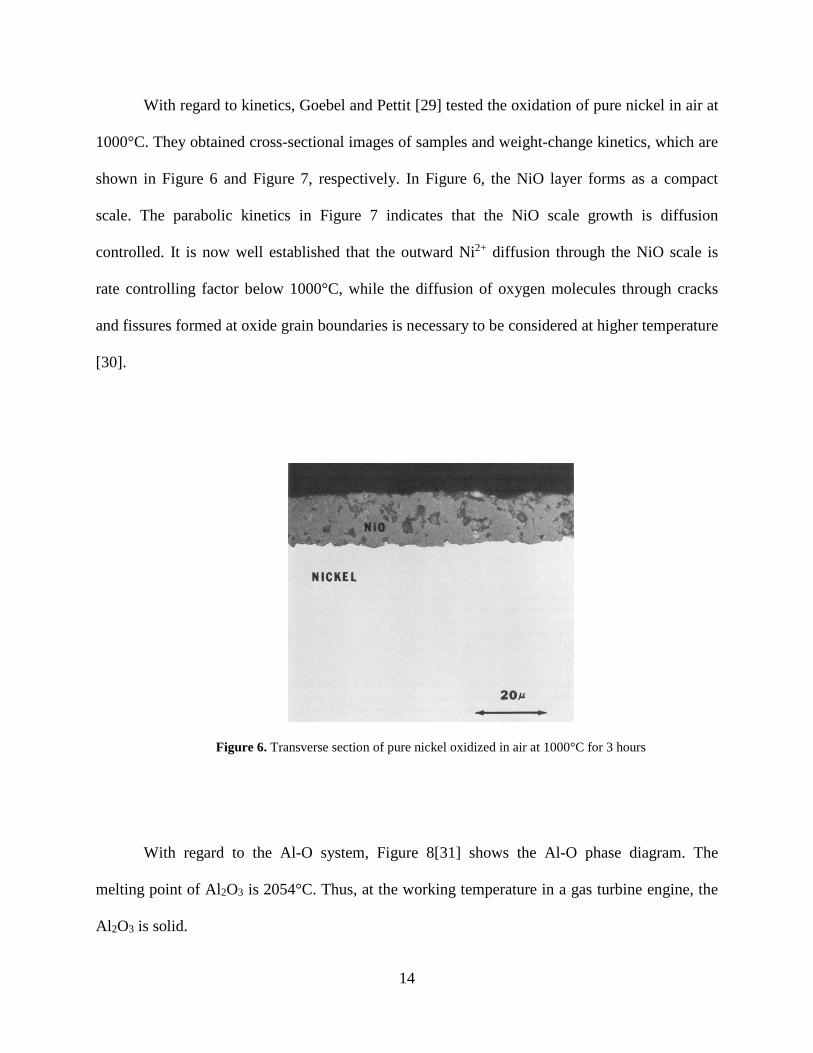
With regard to kinetics, Goebel and Pettit [29] tested the oxidation of pure nickel in air at
1000°C. They obtained cross-sectional images of samples and weight-change kinetics, which are
shown in Figure 6 and Figure 7, respectively. In Figure 6, the NiO layer forms as a compact
scale. The parabolic kinetics in Figure 7 indicates that the NiO scale growth is diffusion
controlled. It is now well established that the outward Ni2+ diffusion through the NiO scale is
rate controlling factor below 1000°C, while the diffusion of oxygen molecules through cracks
and fissures formed at oxide grain boundaries is necessary to be considered at higher temperature
[30].
Figure 6. Transverse section of pure nickel oxidized in air at 1000°C for 3 hours
With regard to the Al-O system, Figure 8[31] shows the Al-O phase diagram. The
melting point of Al2O3 is 2054°C. Thus, at the working temperature in a gas turbine engine, the
Al2O3 is solid.

15
Figure 7. Weight change per square centimeter of oxidized nickel
Figure 8. Al-O phase diagram

16
According to the phase diagram, the thermodynamically stable phase of Al-O system at
working temperature is α-Al2O3. In general, α-Al2O3 is stable thermodynamically and kinetically
at high temperature applications with enough oxygen [31].
Similar to Al, Cr can react with oxygen to form an oxide layer during high-temperature
exposure. Figure 9 [32] shows a Cr-O phase diagram. The melting point of Cr2O3 is 2540°C, and
at working temperature of gas turbine engine, Cr-O system is Cr2O3 as long as the pressure of
oxygen is high enough.
Figure 9. Cr-O phase diagram

17
3.1.2 Alloy oxidation
Oxidation of alloy is much more complex than pure metal oxidation due to:
a. Different metals in the alloy have different oxygen affinities.
b. More complex product may form.
c. The potential for internal oxidation.
d. The solubility of oxygen is different in different metals.
The degree of complexity of alloy oxidation changes depending on the environment. In
practice, the gas phase is air, which consists of about 21% oxygen. Oxidation of an alloy
composed of nickel, aluminum and chromium in air is the main subject of this section.
Giggins and Pettit [33] conducted oxidation exposures of Ni-Cr-Al alloys between
1000°C and 1200°C and partitioned the Ni-Cr-Al phase diagram into three regions having
different oxidation behaviors. Figure 10 is a cross-sectional image of Ni-2Cr-4Al alloy after 20h
oxidation in 0.1 atm of oxygen at 1000°C. A dense NiO scale formed above an internal oxide
subscale, which consists of Cr2O3, Al2O3 and Ni (Cr, Al)2O4. This type of microstructure shows
that, in a low-chromium and low-aluminum nickel-based alloy, NiO is formed preferentially due
to its high concentration and Cr and Al can form internal precipitates. Alloys whose
concentration is in region I in Figure 11 show this type of microstructure.
With increasing Al and Cr concentrations, the oxidation behaviors of Ni-Cr-Al alloys
change from a NiO layer to Al2O3 and Cr2O3 scales. Figure 12 shows a cross-sectional image of
Ni-20Cr-2Al alloy after 21h oxidation in 0.1 atm of oxygen at 1100°C. An outer Cr2O3 layer
formed above the internal Al2O3 subscale. The dense Cr2O3 layer and Al2O3 precipitates prove
that Cr and Al reacted in preference to Ni with oxygen in the same condition. The Ni-20Cr-2Al
alloy composition in region II is shown in Figure 13.

18
Figure 10. Micrograph of Ni-2Cr-4Al superalloy after 20h oxidation in 0.1 atm of oxygen at 1000°C
Figure 11. Ni-Al-Cr system phase diagram at 1000°C

19
Figure 12. Micrograph of Ni-20Cr-2Al after 21h oxidation in 0.1 atm of oxygen at 1100°C
Figure 13. Ni-Al-Cr system phase diagram at 1100°C
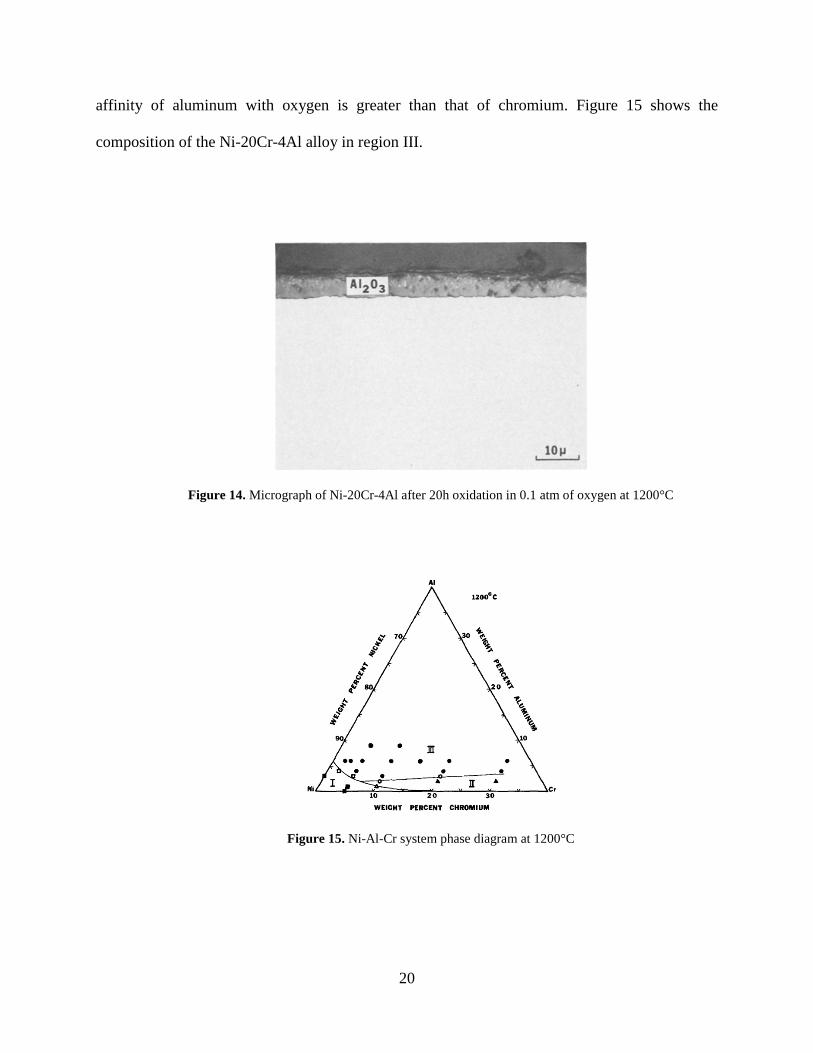
Figure 14 shows the microstructure of Ni-20Cr-4Al alloy after 20h oxidation in 0.1 atm
of oxygen at 1200°C. The dense Al2O3 scale covering the alloy substrate indicates that the
20
affinity of aluminum with oxygen is greater than that of chromium. Figure 15 shows the
composition of the Ni-20Cr-4Al alloy in region III.
Figure 14. Micrograph of Ni-20Cr-4Al after 20h oxidation in 0.1 atm of oxygen at 1200°C
Figure 15. Ni-Al-Cr system phase diagram at 1200°C

21
The different oxidation microstructures that can be seen with the composition variation of
Ni-Cr-Al alloys clearly show that the oxidation behavior is highly dependent on the alloy
composition. Giggins and Pettit [33] proposed that oxidation of Ni-Cr-Al alloys occurs in two
stages: the transient stage and the steady-state stage.
During the transient oxidation stage, the surface layer of the alloy is rapidly oxidized.
This rapidly formed but thin oxide layer is a mixture of NiO, Al2O3 and Cr2O3 of composition
that is dependent on the alloy composition. Because the oxidation rate is fast, generally the
duration of the transient oxidation stage for most Ni-Cr-Al alloys was less than 1 hour, the
diffusion of oxygen in the oxide and the outward diffusion of metals in the substrate are not
critical factors [33].
The end of the transient oxidation stage corresponds to the establishment of a reaction-
product assemblage that is time independent. This corresponds to the steady-state stage. Because
the oxygen pressure required to form Al2O3 and Cr2O3 is significantly lower than that for NiO
[34], diffusing oxygen preferentially reacts with Al and Cr to form Al2O3 and Cr2O3. When
concentrations of Cr and Al are insufficient (compositions in region I), Al2O3 and Cr2O3 form a
discontinuous subscale, while NiO forms a continuous layer (Figure 10). When a continuous
dense NiO layer forms, oxidation rate is controlled by Ni2+ cation transportation through the
NiO.
When the composition of the Ni-Cr-Al alloy moves into either region II or region III, the
Cr or Al content is sufficient to form a continuous Al2O3 or Cr2O3 layer. As shown in Figure 12,
the dense continuous Cr2O3 layer and the internal Al2O3 precipitates imply that the oxidation
mechanism of Ni-20Cr-2Al is different from that of Ni-2Cr-4Al. Generally, during steady-state
stage oxidation, metals react with oxygen to form corresponding oxides by virtue of the diffusion

22
of aluminum and chromium from the interior of the alloy to the surface and oxygen from the
surface to the interior of the alloy. In the Ni-20Cr-2Al alloy, the high concentration of chromium
causes a continuous Cr2O3 layer and the discontinuous Al2O3 subscale form below after a certain
period. After the formation of the dense continuous Cr2O3 layer, the oxidation rate is controlled
by the diffusions of oxygen and chromium through the Cr2O3 layer. If the composition of Ni-Cr-
Al system is in region III, like the Ni-20Cr-4Al alloy, the dense layer changes from Cr2O3 to
Al2O3. In this case, the aluminum content is sufficient to form a continuous layer when the
oxygen pressure is lower than that required for Cr2O3 formation, and thus the subscale of Cr2O3
is not observed in the Figure 14. When the continuous Al2O3 layer forms, the rate-determining
step is diffusion of oxygen and aluminum through the Al2O3 layer.
In summary, the oxidation mechanism of Ni-Cr-Al alloys is determined by the aluminum
and chromium concentrations. When the alloy composition lies in region I, a continuous dense
NiO scale forms above a subscale composed of the mixture of Cr2O3, Al2O3 and Ni (Cr, Al) 2O4.
However, when the composition lies in region II or region III, the formed continuous layer is
Cr2O3 or Al2O3 respectively.
It should be noted that the oxidized surface microstructures of Ni-2Cr-4Al and Ni-20Cr-
4Al have different continuous layers even though the amount of aluminum content is the same.
This shows that adding chromium promotes the formation of Al2O3. Giggins and Pettit [33]
proposed that this phenomenon is caused by initial oxidation of chromium primarily, which
could reduce oxygen permeability into the alloy, and then the oxygen potential is lowered to a
level which is insufficient to form NiO. As a result, the oxidation of aluminum is allowed to
predominate in the oxidation process.

23
Guan and Smeltzer [35] came to this same conclusion on the benefits of Cr. They
calculated the oxygen solubility in Ni-Al-Cr alloys with different alloy compositions and
established the boundary condition between internal and external oxidation in the ternary system
alloy. They found that the addition of chromium could affect the oxygen solubility and diffusion
in the Ni-Al-Cr alloy system. Figure 16 [35] is the plot of the oxygen solubility in Ni-Cr-AI
alloys with respect to chromium concentration at 1200°C. The oxygen solubility decreases
dramatically with increasing chromium concentration. Figure 17 from the same study [35] goes
on to show the change of the slope of the diffusion path at the scale-alloy interface as a function
of chromium concentration at 1200°C. It shows that the chromium concentration strongly
influences the oxygen distribution path. In summary, the addition of chromium can reduce the
oxygen concentration required to form continuous Al2O3 layers by two mechanisms: (1)
chromium can reduce the oxygen solubility in Ni-Al-Cr alloys; and (2) chromium can modify the
distribution of oxygen and prevent oxygen super-saturation in the alloy; which is required for the
formation of NiO. Because of the difference of lattice mismatch, nucleation and growth of Cr2O3
is easier than Al2O3 in Ni-Cr-Al alloy [36]. This means that earlier formed Cr2O3 can protect Al
in the alloy, which would extend the alloy service life.

24
Figure 16. Oxygen solubility in the Ni-Cr-AI alloys as a function of Cr concentration at 1200°C
Figure 17. The change of the slope of the diffusion path at the scale/alloy interface as a function of Cr
concentration at 1200°C

25
Some researchers studied the protectiveness of dense oxide layers against sulfidation and
hot corrosion. Pope and Birks [37] measured the penetration of sulfur into NiO scale. First, they
oxidized a nickel specimen in pure oxygen at 1000°C to obtain the dense NiO layer; when the
desired oxide scale formed, the gas was shifted to the mixture of CO and CO2; finally, SO2 was
added into the CO-CO2 mix to stabilize sulfide formation. The result shows that the dense NiO
layer is penetrated by sulfur after the first several hours, even though the SO2 pressure is as low
as 0.05 atm. The penetration of oxide scale by sulfur is dominated by the transport of SO2
molecules through physical defects in the scale as opposed to the dissolution and diffusion of
sulfur.
Otsuka and Rapp [38] conducted experiments to test the hot corrosion of pre-oxidized
nickel with a Na2SO4 deposit at 900°C. After the pre-oxidation, the specimen which had a dense
NiO scale were deposited with Na2SO4 and heated in 0.1% SO2-O2 gas atmosphere at 900°C for
4 hours. By the electrochemical method, they found that the oxide layer could retard the hot
corrosion until the oxide scale was penetrated by melting salt. A thicker or less-defect layer was
found to be more resistant to hot corrosion. The hot corrosion occurring around 900°C is called
Type I hot corrosion, which will be discussed in more detail in the next section.
Santoro and Barrett [39] tested various Ni-Cr-Al alloys to determine which compositions
have the best resistance to hot corrosion. Their results showed that Ni-33Al and Ni-30Cr-20Al
alloys had optimal oxidation and hot corrosion resistance by forming dense protective Al2O3
layer. These experiments also showed that the addition of chromium decreases the required
aluminum content to form a continuous Al2O3 scale layer.
Oxidation mechanisms of MCrAlY overlay coatings are similar to those of Ni-Cr-Al
alloys. The difference is that addition of Co can influence the transportation of Cr and Al. For

26
example, because Cr diffuses more slowly in Co than in Ni, the required Cr in overlay coatings is
larger than in standard Ni-Cr-Al alloys [12]. In practice, the oxidation features of overlay
coatings depend on various factors when overlay coatings are deposited on the superalloy
[12,40,41]. Coating density, extent of connected porosity in the coating, and ease of penetration
for oxidizing molecules through the coating are the major factors [40]. These factors are
determined by alloy composition, deposition method, coating microstructure as well as
interdiffusion between the coating and substrate [12].
3.2 HOT CORROSION
Deposit-induced corrosion at high temperature is often termed hot corrosion. Several reviews
and specific papers on hot corrosion have been published [e.g. 2, 39, 42, 43, 44]. The study of
hot corrosion is important to comprehending a key degradation mechanism of superalloys.
3.2.1 Basics of hot corrosion
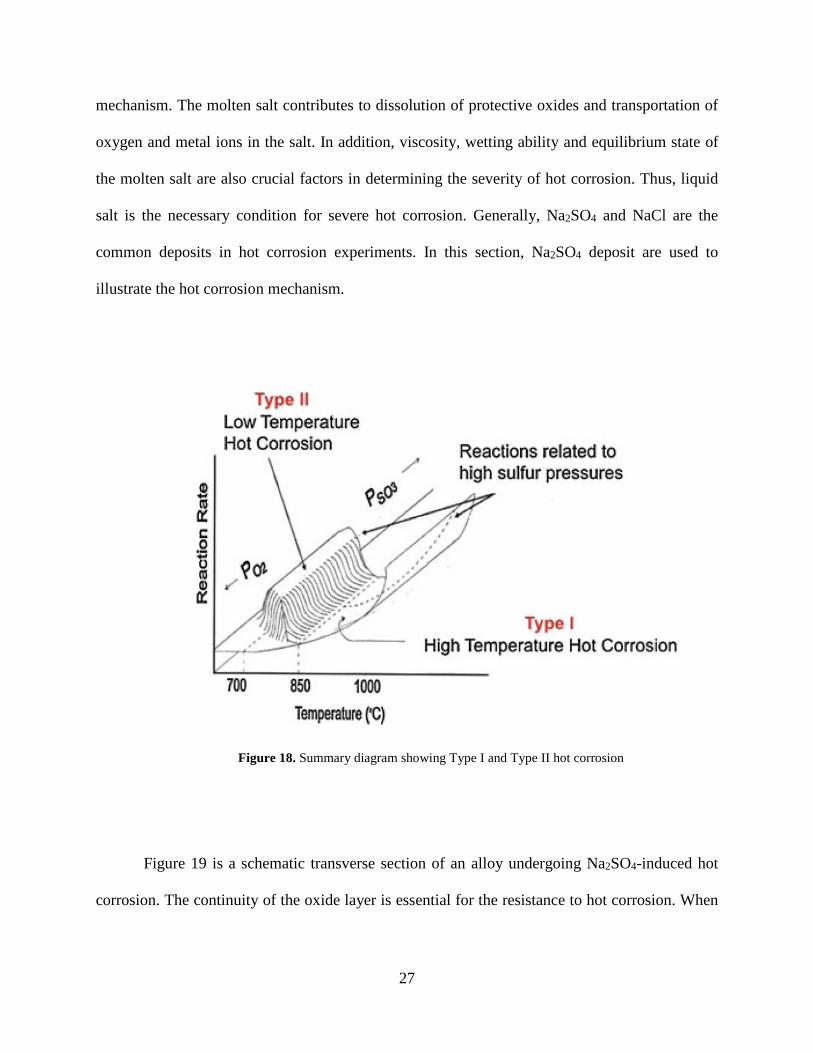
Hot corrosion is generally categorized as one of two types: Type I hot corrosion, also called high
temperature hot corrosion, occurs between 850-1000°C which is above the melting temperature
of the salt; and Type II hot corrosion, also called low temperature hot corrosion, occurs between
600-800°C, which is below the melting temperature of the salt. Figure 18 [2] shows different
regions of Type I and Type II hot corrosion.
The accelerated degradation at high temperature is dictated by the state of deposit on
metal or alloy because whether the deposit melts or not has significant influence on the oxidation
27
mechanism. The molten salt contributes to dissolution of protective oxides and transportation of
oxygen and metal ions in the salt. In addition, viscosity, wetting ability and equilibrium state of
the molten salt are also crucial factors in determining the severity of hot corrosion. Thus, liquid
salt is the necessary condition for severe hot corrosion. Generally, Na2SO4 and NaCl are the
common deposits in hot corrosion experiments. In this section, Na2SO4 deposit are used to
illustrate the hot corrosion mechanism.
Figure 18. Summary diagram showing Type I and Type II hot corrosion
Figure 19 is a schematic transverse section of an alloy undergoing Na2SO4-induced hot
corrosion. The continuity of the oxide layer is essential for the resistance to hot corrosion. When

28
cracks and channels form in the oxide scale, the molten salt penetrates and contacts the alloy
directly. The result is severe hot corrosion since no metal is intrinsically resistant to molten salt.
According to proposed mechanisms [2], in the initial stages of hot corrosion, the most
active metals in alloy, commonly aluminum and chromium, react with oxygen dissolved in
Na2SO4 to form an oxide layer. This oxide layer prevents the direct contact between the molten
salt and the alloy substrate. The oxidation of metals consumes oxygen in the liquid salt and the
chemistry of Na2SO4 deposit will consequently change. Then, the oxide layer reacts with the
deposit and dissolves in the molten salt. Where there is no protective oxide layer, the severe hot
corrosion will occur.
Figure 19. Schematic drawing illustrating hot corrosion of metals and alloys

29
At the hot corrosion temperature, the chemical constitution of molten Na2SO4 are
represented in Equations (1) and (2):
(1)
or
(2)
Figure 20[44] is the thermodynamic stability diagram for the Na-O-S system at constant
temperature. It is obvious that the composition of molten salt at a given temperature is
determined by the and by either or . Thus, formation and consumption of oxide
ions can change the composition of the molten salt. Besides, when is constant, the basicity of
the molten salt is defined by or .
Figure 20. A thermodynamic stability diagram for the Na–O–S system at constant temperature

30
In Na2SO4-induced hot corrosion, there are two oxide dissolution mechanisms: basic
fluxing and acidic fluxing. Basic fluxing is caused by reactions between the basic component of
sodium sulfate, Na2O (or O2-) and the oxide layer, as shown in Equations (3) to (5); while acidic
fluxing involves the decomposition of the oxide layer by reaction with the acid component and
SO3, as shown in Equations (6) to (8) [44]:
(3)
MO + (4)
(5)
MO + (6)
MO = (7)
(8)
Here, M represents the metal.
In basic fluxing, the salt reaction with the oxide reduces the oxide ion concentration in
salt and consequently favors the forward reactions (1) or (2). In acidic fluxing, the decomposition
of oxide increases the oxide ion concentration in the salt and drives reactions (1) or (2) in the
reverse direction. Thus, the composition of molten salt changes according to different fluxing
mechanisms.
In molten salt, oxide ion concentration changes gradually with the development of
fluxing, and the solubility of the oxide varies with the concentration of oxide ion. Figure 21
[43,45] shows different oxides solubilities in molten Na2SO4 at 927°C (1200 k) and 1 atm O2. In
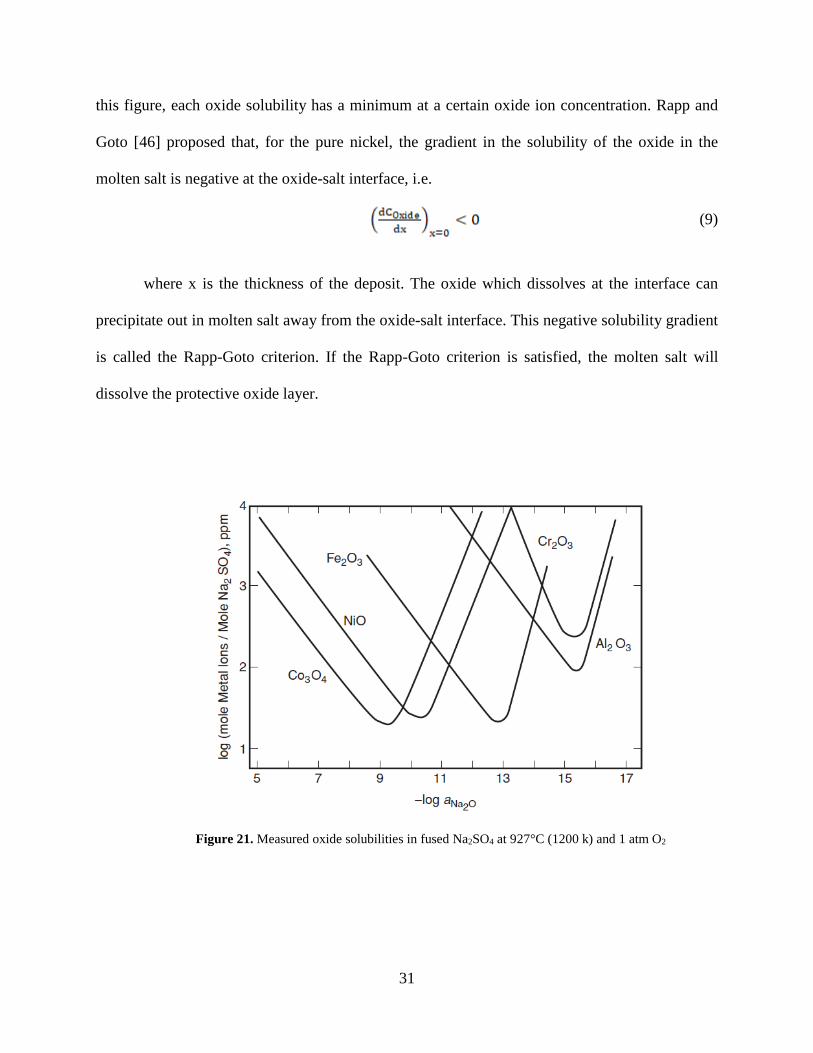
31
this figure, each oxide solubility has a minimum at a certain oxide ion concentration. Rapp and
Goto [46] proposed that, for the pure nickel, the gradient in the solubility of the oxide in the
molten salt is negative at the oxide-salt interface, i.e.
(9)
where x is the thickness of the deposit. The oxide which dissolves at the interface can
precipitate out in molten salt away from the oxide-salt interface. This negative solubility gradient
is called the Rapp-Goto criterion. If the Rapp-Goto criterion is satisfied, the molten salt will
dissolve the protective oxide layer.
Figure 21. Measured oxide solubilities in fused Na2SO4 at 927°C (1200 k) and 1 atm O2

32
3.2.2 High temperature (Type I) hot corrosion
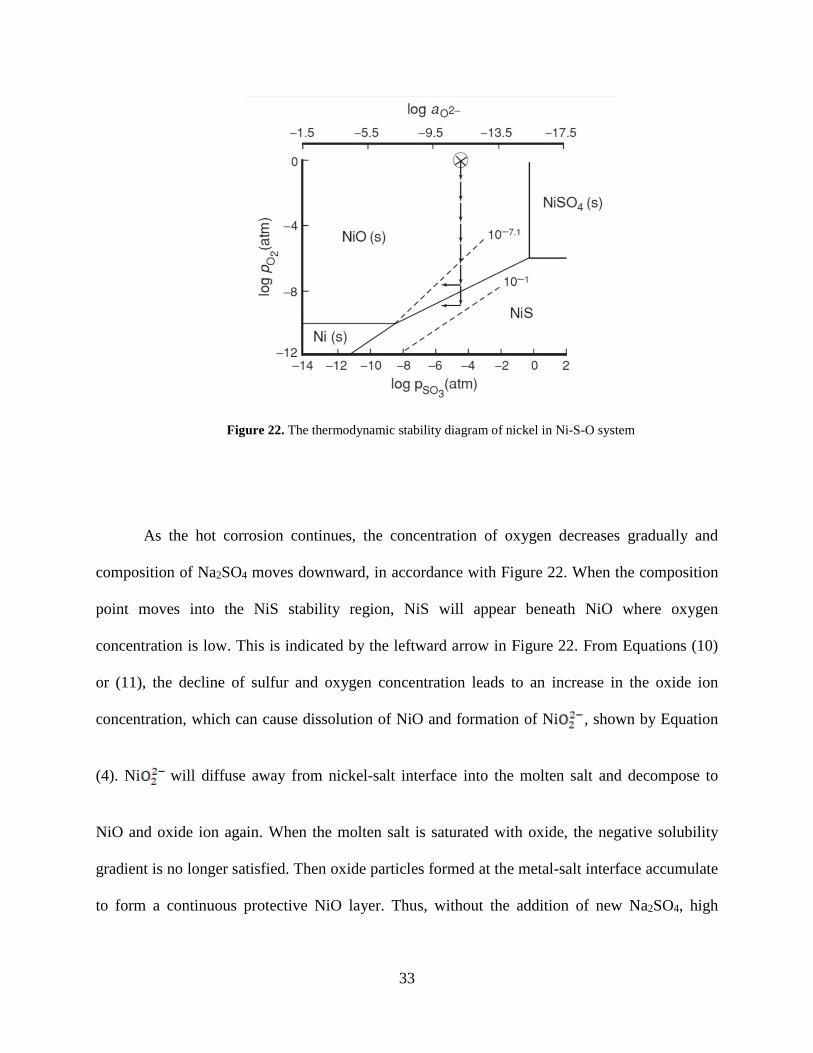
For pure nickel oxidized in pure oxygen, high temperature hot corrosion is caused by basic
fluxing of the protective NiO layer. Figure 22 [2] shows the thermodynamic stability diagram of
nickel in Ni-S-O system at 1000°C. The mark indicates the deposited composition of Na2SO4.
The Na2SO4 decomposition reaction can be illustrated by Equations (10) and (11) [44]:
(10)
or
(11)
In the initial stage of high temperature hot corrosion, the composition point of Na2SO4
lies in the NiO(s) stability region. Because of the oxidation of metal at the salt-metal interface,
the oxygen concentration in Na2SO4 decreases. As a result, oxide ion and sulfur concentration
increase due to the decomposition of Na2SO4, described by Equations (10) or (11). The
downward arrows in Figure 22 shows the change of Na2SO4 composition due to the removal of
oxygen. This reaction path for basic fluxing was also shown in Figure 20.
33
Figure 22. The thermodynamic stability diagram of nickel in Ni-S-O system
As the hot corrosion continues, the concentration of oxygen decreases gradually and
composition of Na2SO4 moves downward, in accordance with Figure 22. When the composition
point moves into the NiS stability region, NiS will appear beneath NiO where oxygen
concentration is low. This is indicated by the leftward arrow in Figure 22. From Equations (10)
or (11), the decline of sulfur and oxygen concentration leads to an increase in the oxide ion
concentration, which can cause dissolution of NiO and formation of Ni , shown by Equation
(4). Ni will diffuse away from nickel-salt interface into the molten salt and decompose to
NiO and oxide ion again. When the molten salt is saturated with oxide, the negative solubility
gradient is no longer satisfied. Then oxide particles formed at the metal-salt interface accumulate
to form a continuous protective NiO layer. Thus, without the addition of new Na2SO4, high

34
temperature hot corrosion of pure nickel is not self-sustaining. The whole hot corrosion process
of pure nickel is summarized schematically in Figure 23 [44].
Figure 23. High temperature hot corrosion process of pure nickel
When SO2 is added into the gas phase, the amount of metal sulfide increases due to the
transport of sulfur from that gas. Andresen [47] measured the solubilities of oxygen and sulfur
dioxide in molten Na2SO4, and the calculated Henry's law solubility constants. The results are
summarized in Tables 1 and 2. From these two tables, solubilities of oxygen and sulfur dioxide
are extremely low. Generally, oxygen and sulfur are transported via instead of SO2 or O2
[48]. Even so, the addition of SO2 or, more specially, SO3 in gas phase will influence hot
corrosion mechanism.

35
Table 1. Solubility of O2 in molten Na2SO4
Expt. No. Temp (℃) KH×107 mole·cm-3·atm-1 1 902 2.05 2 901 1.88 3 903 1.82 4 903 1.72 10 904 1.80 14 904 2.11 5 961 2.55 11 965 2.71 12 966 2.58 13 961 2.64
Table 2. Solubility of SO2 in molten Na2SO4
Expt. No. Temp (℃) KH×106 mole·cm-3·atm-1 1 902 1.62 2 901 0.91 3 901 0.63 12 902 1.21 4 961 1.88 5 961 2.36 6 961 2.64 8 955 3.18
Lillerud et al. [49] studied the reaction mechanism of high-purity nickel in 96% O2 and
4% SO2 at 700-900°C.They found that inward migration of sulfur through microchannels in the
scale in the form of SO2 molecules is the main manner of sulfur transportation.
Misra and Whittle [50] studied the effects of SO2 and SO3 on the Na2SO4-induced
corrosion of nickel. They found that the addition of sulfurous gas into the environment could
increase the weight gain. With small amount of sulfur in the gas phase, e.g. 0.104% SO2 in air,
basic fluxing is predominant in hot corrosion and NiS forms beneath the NiO layer. While if

36
sulfur in gas phase is relatively high, e.g. 10% SO2 in air, the reaction mechanism will be acidic
fluxing. In high-concentration sulfur gas, NiS can form at the beginning of the reaction. Because
the reaction between Ni and SO3 can produce NiS and NiO, the scale morphology is the mixture
of oxide and sulfide of nickel. As hot corrosion continues, NiS is oxidized to NiO and released
sulfur diffuses into metal to form NiS again. As a result, more sulfides form beneath the oxide
layer. This process is a sulfidation-oxidation mechanism.
In summary, the high-temperature hot corrosion of pure nickel deposited with Na2SO4 is
dominated by basic fluxing when the concentration of sulfur in gas is low, while the hot
corrosion occurs by acidic fluxing when there is a substantial amount of sulfur in gas.
For Ni-Cr-Al alloy, the mechanism of high temperature hot corrosion is similar to that of
pure nickel. As discussed in the last section, oxidation of Ni-Cr-Al alloy can result in a
continuous protective layer that consists of Al2O3 and/or Cr2O3, depending on the alloy
composition. The formation of Al2O3 and Cr2O3 can decrease the oxygen partial pressure in
molten salt and the oxygen ion concentration is increased by decomposition of Na2SO4. In high
temperature hot corrosion, the protective oxide layer will be dissolved in molten salt. The
mechanism can be described by Equations (12) - (13):
(12)
(13)
Thus, aluminum and chromium in Ni-Cr-Al alloy can consume Na2SO4. And
consequently, other metals in the alloy will be intact. Besides, formation of metal sulfide beneath
the oxide layer is important as well. Table 3 [51] shows the free energies of formation for
sulfides and oxides at 1123K. The free energy of formation of Cr2S3 is lower than that of NiS,

37
which means Cr2S3 formation is thermodynamically preferred. Thus, the addition of chromium
can not only form the protective layer, but may preferentially react with sulfur. To that end,
Goebel and Pettit [52] illustrated that chromium could form sulfide preferentially in Ni-Al-Cr
alloys and transform NiS to CrS.
Table 3. Free energies of formation for sulfides and oxides at 1123K (Kcal/mol S or O)
Sulfide -△G1123K Oxide -△G1123K FeS 21.9 FeO 45.0 NiS 15.4 NiO 32.0 CoS 17.0 CoO 37.5 CrS 34.9 Cr2O3 66.5
Al2S3 41.7 Al2O3 104.8
Some alloying elements can react with the Na2SO4 and form corresponding acidic oxide,
which can accelerate the hot corrosion. Taking molybdenum as the example, typical reactions are
shown in Equations (14) - (18) [44]:
(14)
(15)
(16)
(17)
(18)

38
During high temperature hot corrosion, acidic MoO3 dissolves Al2O3, Cr2O3 and NiO at
the metal-salt interface where the MoO3 activity is sufficiently high. Vaporization of MoO3 can
shift Equations (16) - (18) towards left side and produce Al2O3, Cr2O3 and NiO in molten salt
above the metal-salt interface. This keeps the concentration of near the gas phase lower
than that at the metal-salt interface, which is the driving force for the outward movement of
ions in the molten salt. This type of hot corrosion is called alloy-induced acidic fluxing
[44], which is self-sustaining and can cause catastrophic corrosion.
Some researchers have also tested the properties of nickel-based alloys which contain
molybdenum. Bornstein [53] proposed that the addition of Mo and V could impart sulfidation
resistance to the alloy by decreasing the oxide ion content of molten Na2SO4. In the low-
concentration oxide ion environment, the oxide layer will keep continuous and prevent the
further sulfidation. Bornstein further reported that only a low concentration of molybdenum,
below that necessary for precipitation of a molybdenum-rich phase to occur, can provide
sulfidation resistance to the alloy.
Misra [54] tested nickel-base superalloys containing molybdenum with Na2SO4 deposit in
SO2-O2 atmosphere at 950°C. The author found that the corrosion is affected by SO2 pressure in
atmosphere. At lower levels of SO2 (<0.24%), superalloys undergo catastrophic corrosion in the
presence of Na2SO4 deposit. However, when SO2 is higher than 1%, the incorporation of MoO3
into molten salt, i.e. Equation (15), is restricted. No Mo was detected in the molten salt. The hot
corrosion is caused by the high SO2 pressure in atmosphere.

39
3.2.3 Low temperature (Type II) hot corrosion
Type II hot corrosion, or low temperature hot corrosion, occurs between 600 and 800°C. Low
temperature hot corrosion studies have shown that the presence of liquid salt is necessary for
accelerated hot corrosion [55-60]. In the hot corrosion tests of nickel below the melting point of
Na2SO4 (i.e. 884°C), Na2SO4 is solid in the absence of SO3. If the partial pressure of SO3 is
larger than 10-4 atm, a Na2SO4-NiSO4 liquid solution can form above the eutectic temperature of
671°C. Figure 24[60] shows the Na2SO4-NiSO4 system phase diagram.
Figure 24. Na2SO4-NiSO4 system phase diagram [60]
40
For low temperature hot corrosion of pure nickel, the binary molten salt is formed by
reaction between nickel and sulfur trioxide dissolved in molten salt. This type of hot corrosion is
called gas-phase induced acidic fluxing. As mentioned previously, solubilities of oxygen and
sulfur dioxide in molten Na2SO4 is extremely low. Oxygen and sulfur are transported via
generally. The transposition of SO3 into salt is given by Equations (19) and (20):
(19)
or
(20)
At the initial stage of low temperature hot corrosion, nickel is oxidized to NiO. Then SO3,
in the form of , in molten salt reacts with NiO to form NiSO4. When the concentration of
NiSO4 is sufficient to form Na2SO4-NiSO4 liquid solution, severe corrosion occurs. Figure 25[55]
shows the stability diagram of the Ni–O–S system superimposed on that of the Na–O–S system
at 700°C. The ‘X’ marks the gas mixture composition point of O2–0.1SO2 at 700°C. This
composition is located in the liquid Na2SO4-NiSO4 region, which means solid Na2SO4 may
transform to liquid Na2SO4-NiSO4 solution.

41
Figure 25. Superimposed stability diagrams of Ni–O–S and Na–O–S systems at 700°C [55]
Gheno and Gleeson [55] studied the mechanism of low temperature hot corrosion of pure
nickel at 700°C. Figure 26 is the schematic representation of the microstructural evolution of
Na2SO4-induced low temperature hot corrosion of nickel in O2–0.1SO2 at 700°C. First, the
oxidized nickel reacts with sulfur trioxide to form the liquid Na2SO4-NiSO4 solution on the
nickel surface, shown in Figure 26(a). Because of the relatively low SO3 pressure in the gas
phase, the liquid Na2SO4-NiSO4 solution is not stable. The liquid solution is easy to decompose
into NiO and solid Na2SO4-NiSO4 solution. Thus, the liquid Na2SO4-NiSO4 solution can be only
stable near the gas phase where the SO3 pressure is sufficient. In the deeper region of molten salt,
NiO and solid Na2SO4-NiSO4 solution are more stable as indicated in Figure 26(b). As the
reaction proceeds, the oxygen pressure at the salt-metal interface becomes low due to the
oxidation of nickel and positive solubility gradient of oxygen. As a result, nickel sulfide will
form along the NiO grain boundaries. The netlike sulfide is shown in Figure 26(b). Sulfur is

42
generally transported by SO2-SO3. As the hot corrosion continues, the diffusion of oxygen into
nickel transforms the nickel sulfide to nickel oxide shown in Figure 26(c). This transformation
process is determined by the balance between sulfidation and oxidation rates of the nickel.
Overall, it is manifested as an oxidation–sulfidation process.
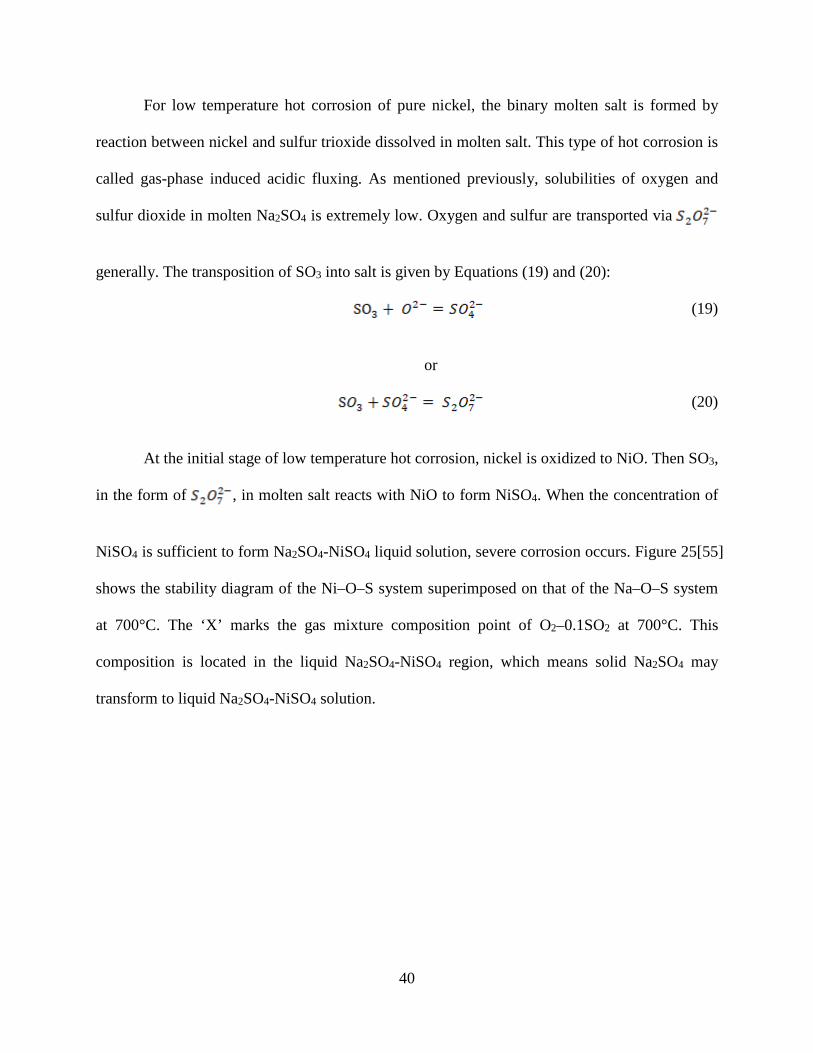
With regard to low temperature hot corrosion at different temperatures, Lillerud and
Kofstad [60] presented an estimated phase diagram, shown in Figure 27, which illustrates the
critical SO3 pressure required to form liquid Na2SO4-NiSO4 solution at different temperatures.
This is consistent with Figure 25.
Figure 26. Schematic representation of microstructural evolution and transport processes during reaction of
nickel with Na2SO4 in O2–0.1SO2 at 700°C [55]
43
Figure 27. The critical value of SO3 pressure required to form liquid Na2SO4-NiSO4 solution at different
temperatures
The low temperature hot corrosion mechanism of alloys is difficult to describe
completely because the effects are different for different alloys, depending upon alloy
composition [44]. There are some features about this type of hot corrosion. First, the corrosion
rate of low temperature hot corrosion is greater at low temperatures compared to higher
temperatures. This characteristic comes from the need to form liquid sulfate solutions, which
needs high SO3 partial pressure in atmospheres. And higher SO3 partial pressure is required
when the corrosion temperature is higher, shown in Figure 27. Besides, higher temperature will
restrict the formation of SO3 from SO2 and O2 [44]. Second, in low temperature hot corrosion,
the microstructures of corroded alloys often consisted of pits that extended into these alloys [2].

44
Finally, aluminum and chromium in the alloy cannot form a continuous oxide layer. The
distributions of chromium and aluminum in the corrosion product are the same as those in the
alloy, which means they are transformed to porous oxide in situ with little or no diffusion,
different from high temperature hot corrosion [2, 44].
For cobalt-based alloys, the mechanism of low temperature hot corrosion had been
proposed by several researchers. Luthra [48] formulated a low temperature hot corrosion
mechanism for Co-Cr-Al-Y alloys. Figure 28 [2] shows the Na2SO4-CoSO4 phase diagram and
Figure 29 [48, 59] shows the critical SO3 pressure required to form liquid Na2SO4-CoSO4
solution at different temperatures. Compared to the Na2SO4-NiSO4 system, the Na2SO4-CoSO4
system has a lower eutectic temperature, which means it is easier to form a liquid solution.
Furthermore, a lower SO3 pressure is needed to form a liquid solution. After the formation of a
liquid Na2SO4-CoSO4 solution on the surface of the substrate, outwards diffusing Co2+ ions react
with SO3 or O2 around the salt-gas interface to form CoSO4/Co3O4 and Co3+ ions. This is shown
in Equations (20) and (21):
(20)
(21)
The generated Co3+ ions diffuse inwards to the scale-alloy interface and transform again
to new Co2+ ions. This transformation is completed by the reaction of Co3+ ions with Co2+ ions
and electrons form inner scale. Because of the diffusion of cobalt, aluminum and chromium can
only be oxidized in situ rather than form the continuous oxide layer.

45
Figure 28. Na2SO4-CoSO4 system phase diagram
Figure 29. Critical value of SO3 pressure required to form (A) liquid Na2SO4-CoSO4 solution from Co3O4, (B)
liquid Na2SO4-CoSO4 solution from CoO, (C) solid CoSO4 from Co3O4 at different temperatures

46
Comparison between low temperature hot corrosion of nickel-based and cobalt-based
alloys was conducted by Luthra and Shores [58]. They tested the low temperature hot corrosion
of Ni-30Cr and Co-30Cr and found that the hot corrosion rate of Co-30Cr was higher than that of
Ni-30Cr under the same test conditions. Misra and Whittle [61] concluded that the minimum of
SO3 pressure required to form liquid binary salt solution in cobalt-based alloy was almost an
order of magnitude lower than that in nickel-based alloy, which is shown above. Therefore, the
addition of cobalt into nickel-based alloy may cause severe low temperature hot corrosion.
3.3 AIMS OF CURRENT STUDY
The main aim of this research is to better determine the influences of alloy compositions, phase
compositions and phase volume fractions of Ni-Cr-Co-Al-Y alloys on their oxidation
performance and hot-corrosion resistance. As discussed in the previous sections, aluminum and
chromium are constituents in Ni-Co-Cr-Al systems for providing resistance to oxidation and hot
corrosion resistance. However, there are few studies about the effect of phase composition and
phase volume fraction on oxidation and hot-corrosion behavior. This thesis will investigate the
influence of these two factors by controlling alloy composition and phase species.
Four specific Ni-Cr-Co-Al-Y alloys having different compositions were chosen to be
tested under oxidation and hot corrosion conditions at 900°C. Each of the four alloys was heat-
treated at two different temperatures to generate two structural variants of the same alloy, i.e.,
different phase volume fractions and phase compositions.

47
4.0 EXPERIMENTAL PROCEDURES
In this section, the procedures used for sample preparation, oxidation, and high temperature hot
corrosion of Ni-Co-Al-Cr-Y alloys having different compositions are described.
4.1 SAMPLE PREPARATION
Ni-Co-Al-Cr-Y alloys were tested to assess their oxidation and hot corrosion resistances.
Because the concentrations of yttrium in the alloys are low and nominally the same in all
samples (0.18 at. %), the influence of yttrium is not considered in this study. The Ni-Co-Al-Cr
alloy compositions that were prepared are shown in Table 4. The aluminum content order from
low to high is denoted as Ref.1, Ref.3, Ref.2 and Ref.4. It should be noted that the aluminum
content between samples Ref.1 and Ref.3 and between samples Ref.2 and Ref.4 are almost same.
This can be used to explain the different performances of different alloys in the oxidation and hot
corrosion experiments discussed later.
The Ni-Co-Al-Cr-Y alloys were prepared by Ar-arc melting followed by drop-casting
into 10mm diameter rods. The cast rods were then heat-treated at different temperatures to
produce different phase volume fractions and phase compositions. A set of alloys No.1, No.2,
No.3, and No.4 (referred to hereafter as Type I samples) were vacuum heat-treated at 1200°C for
6 hours to homogenize and then equilibrated at 1150°C for 48 hours in vacuum. Another set of
48
alloys No.1’, No.2’, No.3’, and No.4’ (referred to hereafter as Type II samples) were also
homogenized at 1200°C, but then equilibrated at 900°C. 1mm thick sample coupons were cut
from the rods for testing. Prior to testing, the coupons were polished to a 1200-grit finish with
SiC paper, washed by detergent and then ultrasonically cleaned in ethanol.
Table 4. Nominal composition of the Ni-Co-Al-Cr-Y alloys studied, at. %( yttrium is ignored)
Ref. Ni Co Cr Al
1 28 30 30 12
2 47 19 10 24
3 44 26 16 14
4 36 21 18 25
4.2 OXIDATION TESTING
Oxidation tests of the Ni-Co-Al-Cr-Y alloys were conducted by thermogravimetric analysis
(TGA) in dry air at a constant volumetric flow rate of approximately 50 ml/min for 100 hours at
900°C. The oxidation kinetics were determined directly from the TGA. After oxidation, the
samples were cold-mounted in resin and then polished with water-based diamond suspensions,
coated with palladium by a sputter coater and characterized by SEM and EDS.

49
4.3 HOT CORROSION TESTING
Isothermal hot-corrosion experiments were conducted in a horizontal tube furnace in the static
air.
Before being slid into the hot zone of the furnace, samples were deposited with 2-3
mg/cm2 Na2SO4 on one of the flat surfaces. Na2SO4 was redeposited every 20 hours. Na2SO4 was
deposited by spraying a saturated aqueous solution of Na2SO4 on the flat surface of a given
sample that was heated on a hot plate to around 150°C (i.e., the water quickly evaporated and left
a solid deposit of Na2SO4). The Na2SO4 aqueous solution was prepared by dissolving laboratory
grade reagents into deionized water. After the hot corrosion experiments, the specimens were
mounted, polished with oil-based diamond suspensions to retain water-soluble reaction products,
coated with palladium by a sputter coater and characterized by SEM and EDS.
50
5.0 RESULTS AND DISCUSSION
5.1 SUPERALLOYS
In this section, alloy compositions and phase compositions and volume fractions of the Type I
and Type II samples are examined and analyzed. The results are compared, where possible, to
literature, and the effects of differences in alloy composition, phase composition and volume
fraction on oxidation and hot corrosion behavior of the alloys are assessed.
5.1.1 Alloy microstructures
Figure 30 shows the microstructures of the Ni-Co-Al-Cr-Y alloys. The ordered B1 β-NiAl has a
relatively high aluminum content; and the face-centered cubic γ-Ni phase contains relatively high
chromium content [5]. Accordingly, the phases in the alloy samples were identified based on
their measured phase compositions, which are listed in Table 5 and marked in Figure 30. The γ-
Ni+γ’-Ni3Al phases are indicated in the No.2’ and No.3’ images and such an equilibrium is the
result of the higher Al contents and lower Cr contents in the phase than that in γ-Ni phase of
other samples. The volume fractions of γ’-Ni3Al are very low and its size is too small to reveal in
samples No.2’ and No.3’. Some bright white particles were identified by EDS as yttrium-
enriched in the No.2, No.3, No.3’, No.4, and No.4’ samples. It is seen that samples No.2/No.2’

51
and No.4/No.4’ have significantly more β-NiAl phase, which is consistent with their high Al
contents.
Figure 30. Micrographs of Ni-Co-Al-Cr-Y samples

52
Table 5. Measured phase compositions of Ni-Co-Al-Cr-Y samples, at. %( yttrium is ignored)
Alloy Phase Ni Co Cr Al
No.1 β-NiAl (dark phase) 36 18 13 33
γ-Ni (matrix) 26 31 34 9
No.1’
β-NiAl (dark phase) 42 14 7 37
γ-Ni(matrix) 25 36 33 6
σ (light grey phase) 10 30 58 2
No.2 β-NiAl (dark phase) 49 14 6 31
γ-Ni (matrix) 42 26 17 15
No.2’ β-NiAl (dark phase) 49 12 4 35
γ-Ni+γ’(grey phase) 43 27 17 13
No.3 β-NiAl (dark phase) 48 14 5 33
γ-Ni (matrix) 43 27 17 13
No.3’ β-NiAl (dark phase) 50 12 5 33
γ-Ni+γ’(grey phase) 42 27 18 12
No.4 β-NiAl (dark phase) 40 17 11 32
γ-Ni (grey phase) 29 30 32 9
No.4’
β-NiAl (dark phase) 43 14 6 37
γ-Ni (grey phase) 25 35 34 6
σ (light grey phase) 10 30 58 2

53
The heat-treatment of the alloy samples at 900°C caused γ’-Ni3Al phase formation in
samples No.2’ and No.3’, but no γ’-Ni3Al formation was found after the heat-treatment at 1150°
C. The phase volume fractions of the alloy samples were measured from their microstructures,
and the results are listed in Table 6.
Table 6. Averaged measured phase volume fractions of Ni-Co-Al-Cr alloys
Type I samples Type II samples
No.1 No.2 No.3 No.4 No.1’ No.2’ No.3’ No.4’
β-NiAl 0.14 0.62 0.06 0.67 0.23 0.56 0.13 0.63
γ-Ni 0.86 0.38 0.94 0.33 0.67 0.44 0.87
0.33
γ’-Ni3Al - - - - - -
σ phase - - - - 0.10 - - 0.04
Figure 31[62] presents isothermal phase diagrams of Ni-Co-Al-Cr at 900°C, 1100°C, and
1200°C; the alloy compositions are indicated. Based on Figure 31, four alloys consist of β and γ
phases at 1100°C and 1200°C, and thus, it is inferred that they also consist of β and γ phases at
1150°C, which is consistent with the microstructural results that were presented above. The
calculated phase compositions of the samples No.1, No.1’, No.2, No.2’, based on Figure 31, are
listed in Table 7, including the measured phase compositions of the alloy samples. It is seen that
the calculated and measured phase compositions in samples No.2 and No.2’ are more consistent,
within 1 at. %, than the difference of phase compositions in samples No.1 and No.1’.

54

55
Figure 31. Ni-Co-Al-Cr alloys phase diagrams at (A) 19, (B) 26, and (C) 30 at. % Co and (1) 900°C,
(2)1100°C, and (3)1200°C
56
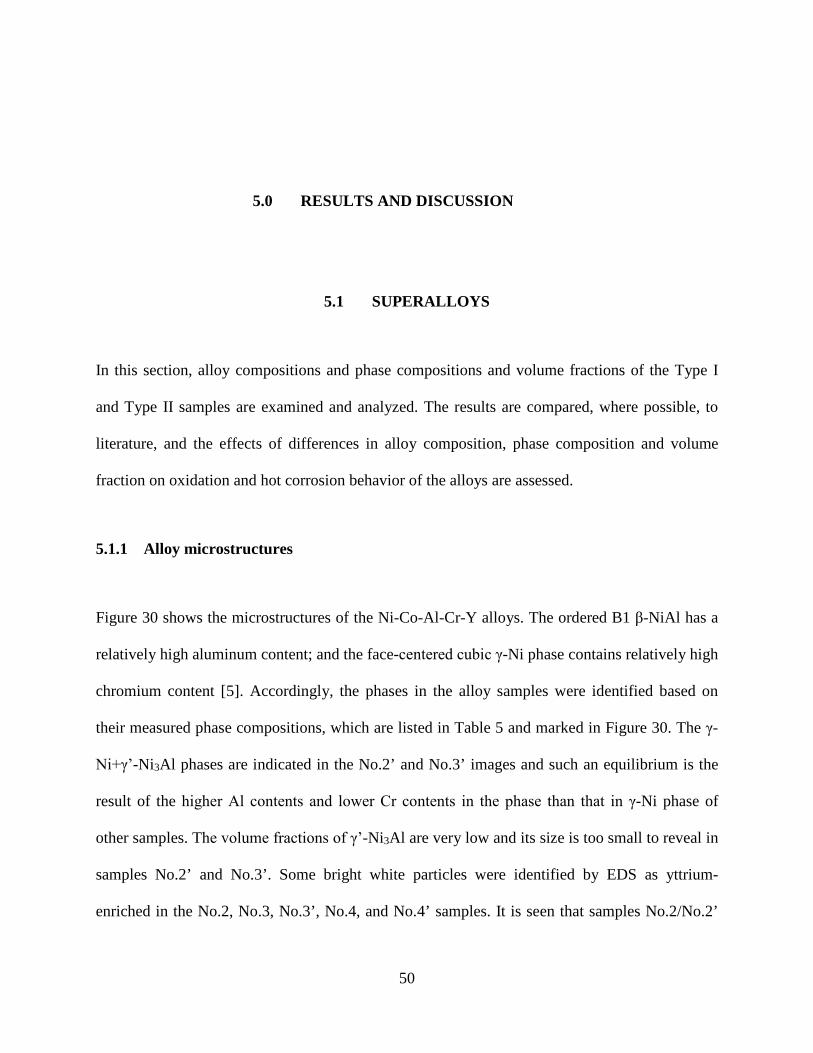
Figure 32[62, 63] shows the predicted phase equilibria of Ni-Co-Al-Cr system as a
function of temperature, and accordingly, the phase volume fractions at 900°C and 1150°C can
be calculated. Table 8 summarizes the calculated and measured phase volume fractions of the
samples heat-treated at 900°C and 1150°C. The results show that Type I alloys had better
agreement between the calculation and the phase measurements than the Type II alloys, likely
due to the effect of the heat-treatment temperatures.
Table 7. Comparison of the calculated and measured phase compositions of Ni-Co-Al-Cr-Y
samples, at. %. (calculated composition/ measured composition)
Alloy Phase Ni Co Cr Al
No.1 β-NiAl 39/36 18/18 11/13 32/33
γ-Ni 26/26 32/31 32/34 10/9
No.1’
β-NiAl 45/42 14/14 6/7 35/37
γ-Ni 26/25 35/36 32/33 7/6
σ 7/10 30/30 63/58 1/2
No.2 β-NiAl 49/49 14/14 6/6 31/31
γ-Ni 43/42 26/26 17/17 14/15
No.2’ β-NiAl 50/49 12/12 5/4 33/35
γ-Ni+γ’ 45/43 27/27 16/17 14/13

57
Figure 32. Calculated phase equilibria of Ni-Co-Al-Cr alloys with respect to temperature

58
Table 8. Comparison of the calculated and measured phase volume fractions of Ni-Co-Al-Cr-Y samples.
(Calculated phase volume fraction / Measured phase volume fraction)
Type I samples Type II samples
No.1 No.2 No.3 No.4 No.1’ No.2’ No.3’ No.4’
β-NiAl 0.12 /0.14
0.62 /0.62
0.05 /0.06
0.67 /0.67
0.20 /0.23
0.54 /0.56
0.10 /0.13
0.63 /0.63
γ-Ni 0.88 /0.86
0.38 /0.38
0.95 /0.94
0.33 /0.33
0.71 /0.67 0.37+0.09
/0.44 0.76+0.14
/0.87
0.31 /0.33
γ’-Ni3Al - - - - - -
σ phase - - - - 0.09 /0.10 - - 0.06
/0.04
For the Type I samples, it is noted that, the measured γ-Ni and β-NiAl phase
compositions in samples No.1 and No.4 are similar, and they are also similar for samples No.2
and No.3. Figure 33 shows the 1100°C phase diagram of the Ni-Co-Al-Cr alloy [62], and it is
seen that the compositions of No.1/No.4 alloys and No.2/No.3 alloys locate in the same tie lines,
which indicate that γ-Ni and β-NiAl compositions in No.1/No.4 and No.2/No.3 alloys are very
similar. For the alloys heat-treated at 1150°C, the measured phase compositions in samples
No.1/No.4 and samples No.2/No.3 are very similar. Moreover, the measured γ-Ni and β-NiAl
volume fractions in the alloys studied are in good agreement with the calculated amounts shown
in Figure 33.

59
Figure 33. Ni-Co-Al-Cr alloys phase diagrams at 1100°C
The Type II alloy samples that were heat-treated at 900°C showed more complicated
microstructures. For example, samples No.2’ and No.3’ contained the ordered L12 γ’-Ni3Al
phase, and No.1’ and No.4’ samples contained tetragonal σ phase, along with β-NiAl and γ-Ni
phases as the major phases existed in the alloys. Similar with the phase composition relationships
in Type I alloys, the phases of Type II samples No1’/No4’ and samples No2’/No3’ showed
similar compositions.
However, it is noted that the phase volume fractions of the alloys studied do not exhibit
similar relationship as their phase compositions. This is due to the fact that the phase volume
fraction depends on their alloy composition.
From Table 7, the calculated and measured phase compositions of samples No.2 and
No.2’ match better than that of samples No.1 and No.1’. Figure 34 presents a comparison of

60
these alloy compositions. The possible reason is of the diffusivities of alloying elements in the
different phases. Thus, the samples No.2 and No.2’, which have the highest amount of β-NiAl,
are generally closest to the predicted equilibrium. This may be because the rates of diffusion are
higher in β-NiAl than in γ-Ni [5].
In summary, the alloy studied showed the difference of phases, phase compositions, and
phase volume fractions, especially for Type I and Type II alloys, which could result in different
performance of their oxidation and hot corrosion behaviors.
Figure 34. Comparison of (a) Calculated and (b) measured phase compositions for No.1, No.1’, No.2 and
No.2 samples

61
5.1.2 High Temperature Oxidation
High temperature oxidation tests of Ni-Co-Al-Cr-Y alloys were conducted from thermal
gravimetric analysis (TGA). TGA is a method of thermal analysis in which mass changes are
continuously measured with respect to time, in this case at a constant temperature [64]. In this
section, alloys were oxidized in flowing air (50 ml/min) at 900°C for 100 hours.
Figure 35 shows the cross-sectional SEM images of Ni-Co-Al-Cr-Y samples after 100h
oxidation. A continuous oxide scale was formed on all samples, and it was inferred based on
chemical analysis by EDS to be aluminum oxide. In addition, there were some oxides formed
above or within the aluminum oxide scale in some samples, like sample No.1. These oxides were
inferred to be Ni and Co-rich oxides. Voids and non-planarities at the scale/alloy interface and
inward and outward protrusions of the oxide scale were present. Moreover, some filamentary
protrusions of the scale at the scale/gas interface are found on samples No.2/No.2’ and
No.4/No.4’. Besides, it should be noted that only γ phase is present in the subsurface region at
the alloy/oxide interface shown in Figure 35. These regions comprised of γ phase are called β-
depletion zones.
The oxidation kinetics of the Ni-Cr-Al alloys could be divided into two stages: the
transient stage and the steady-state stage. Different constituents of Ni-Cr-Al alloys result in
different oxidation behaviors. Obviously, all tested samples were above the critical amount of
aluminum content to form a Al2O3-rich scale. There have been many previous studies on the
oxidation behavior of M-Cr-Al (M is Ni/Co or combination of Ni and Co) alloys which form
Al2O3-rich scale [65-71]. In the transient stage, and if the oxygen potential is sufficient to
stabilize the oxide of the major alloying constituents, NiO and CoO, nuclei of NiO/CoO, Cr2O3,
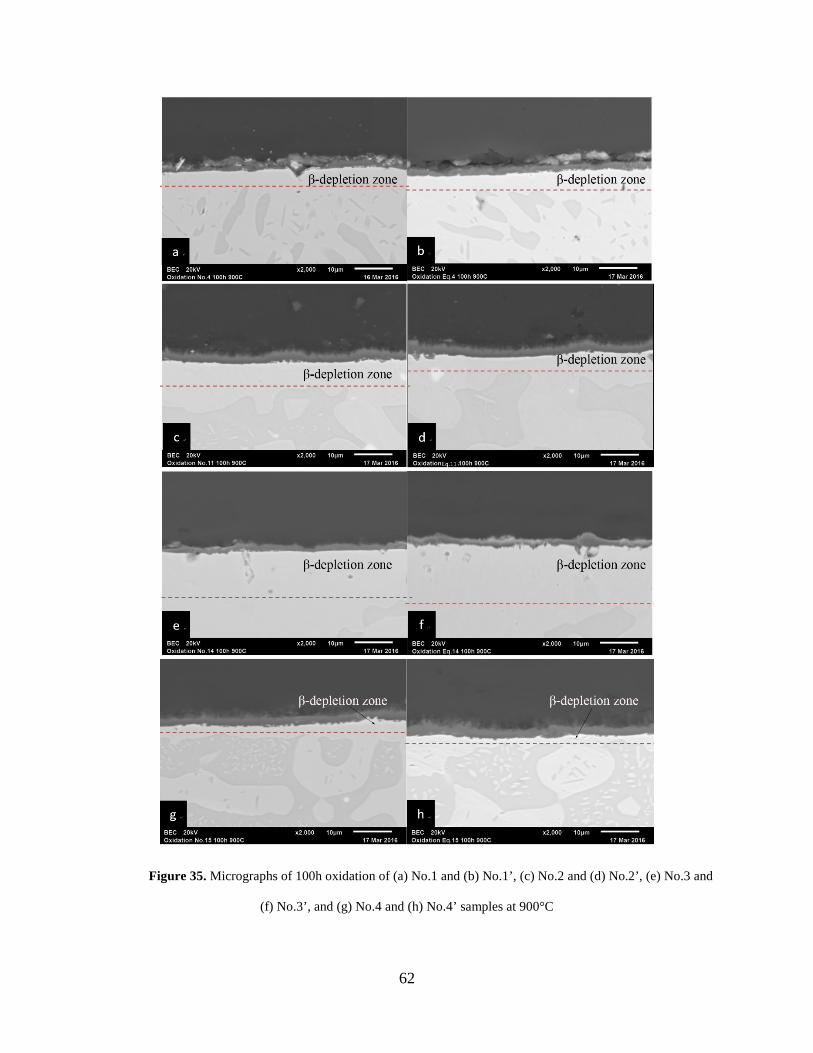
62
Figure 35. Micrographs of 100h oxidation of (a) No.1 and (b) No.1’, (c) No.2 and (d) No.2’, (e) No.3 and
(f) No.3’, and (g) No.4 and (h) No.4’ samples at 900°C
63
and Al2O3 tend to form on the alloy surface. With further oxide growth, a continuous oxide layer
develops, which generally signifies the beginning of the steady-state stage. Then, the oxygen
partial pressure at the scale/alloy interface decreases as the Al2O3 is established [70]. Thus,
Al2O3 was the primary oxide forming during the steady-state stage; while other oxides were only
stable at the oxide/gas interface. Because the continuous oxide scale prevented the direct contact
between the alloy and gas environment, the transport of reactants through the scale was a
determinant factor during the steady-stage oxidation [65, 70].
In the transient stage of oxidation, various oxide particles form above the alloy surface.
The metastable γ-Al2O3 may form at the early time, then transform to the intermediate θ-Al2O3
and finally to the stable α-Al2O3 at 900°C [66-68]. The reaction between NiO/CoO and Al2O3
forms the NiAl2O3, which are the bright particles in samples No.1/No.1’ shown in Figure 35. The
formation of Cr2O3 could act as sympathetic nucleation sites for the transformation from γ-
Al2O3/θ-Al2O3 to α-Al2O3 and accelerate the oxidation rate [69, 70]. The lateral growth of oxide
particles resulted in a continuous oxide layer and the commencement of the steady-state stage.
Thus, the transport of aluminum and oxygen through the scale eventually becomes the rate-
controlling factor, as diffusion with Al2O3 is extremely slow [65]. It has been generally
concluded in past studies that oxygen and aluminum diffusion along scale grain-boundaries is the
main transport path due to the very low rates of diffusion in the Al2O3 lattice [66]. Some
researchers have deduced that inward oxygen diffusion controls Al2O3 scale growth [22, 66]
while some others have concluded that outward diffusion of aluminum predominates [67, 68],
and still others inferred that both Al and O diffusion are important during steady-state stage [70,
71]. A critical factor here is whether or not the Al2O3 scale is doped with a reactive element
(RE), such as Y and/or Hf. In such a case of RE-doped Al2O3 scale growth, it is now well

64
accepted that oxygen is the principal grain-boundary diffusing constituent of the Al2O3 scale
[65].
As shown in samples No.1/No.1’, NiAl2O4 particles, which are believed to have formed
during the transient stage, were present above or through the aluminum oxide layer. This
suggests that, in the steady-state stage of the scale growth, oxygen diffused through the scale,
reacted with aluminum from the alloy and formed Al2O3 at the scale/alloy interface, which was
below these NiAl2O4 particles. In other words, the NiAl2O4 particles formed in the transient
initial stage of oxidation severed as markers of the original gas/alloy interface. The NiAl2O4
particles were at the scale surface, especially in sample No.1’, indicating that the inward oxygen
diffusion dominated the transport processes. In samples No.1, No.2’ and No.3’, some voids and
non-planarities appeared in the alloy at the scale/alloy interface. It seemed that these defects
were not caused by the scale configuration coming from the lateral growth of oxide grains or the
thermal stresses during cooling because the scale overlaying these defects was flat and did not
exhibit any fracture [65, 71]. These voids and non-planarities may have come from the selective
removal of aluminum to form the Al2O3 scale [65, 66]. The protrusion from the oxide scale
overlaying the localized intrusion in sample No.3’ also indicated the presence of outward
aluminum diffusion [65]. In addition, filamentary protrusions on the oxide scale at the scale/gas
interface were observed in samples No.2/No.2’ and No.4/No.4’. Some researchers ascribed these
whisker-like features to the growth by outward aluminum transport [66].
Figures 36 and 37 present the measured weight-change kinetics of the Ni-Co-Al-Cr
samples. After 100h oxidation, alloys with different compositions have different weight changes
during oxidation. Samples No.4 and No.4’ have the highest weight changes, while mass gains of
samples No.1 and No.1’ are the lowest among the Type I and Type II samples. The order of

65
weight change from low to high is: No.1 (No.1’), No.3 (No.3’), No.2 (No.2’) and No.4 (No.4’),
which is consistent with the order of aluminum content from low to high in the Type I and Type
II samples.
Figure 36. Weight change of samples with respect to time

66
Figure 37. Weight change of samples with respect to time
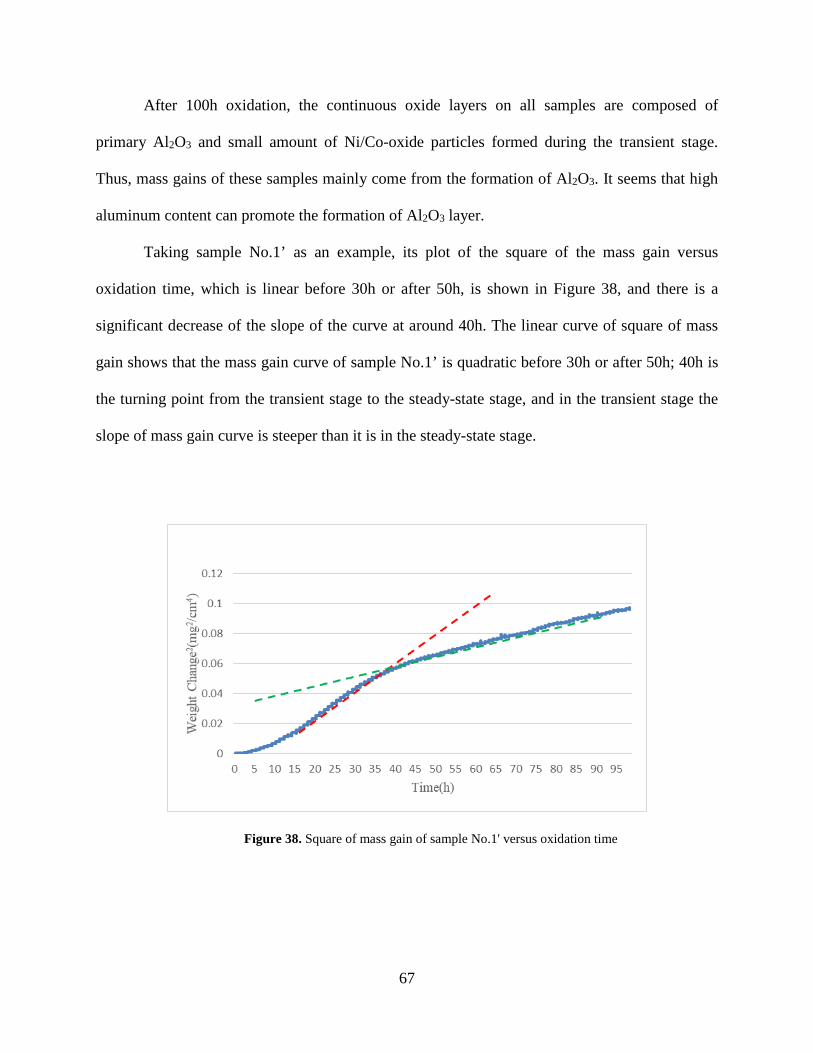
67
After 100h oxidation, the continuous oxide layers on all samples are composed of
primary Al2O3 and small amount of Ni/Co-oxide particles formed during the transient stage.
Thus, mass gains of these samples mainly come from the formation of Al2O3. It seems that high
aluminum content can promote the formation of Al2O3 layer.
Taking sample No.1’ as an example, its plot of the square of the mass gain versus
oxidation time, which is linear before 30h or after 50h, is shown in Figure 38, and there is a
significant decrease of the slope of the curve at around 40h. The linear curve of square of mass
gain shows that the mass gain curve of sample No.1’ is quadratic before 30h or after 50h; 40h is
the turning point from the transient stage to the steady-state stage, and in the transient stage the
slope of mass gain curve is steeper than it is in the steady-state stage.
Figure 38. Square of mass gain of sample No.1' versus oxidation time

68
Although the Type I and corresponding Type II samples have same alloy composition,
phase constitutions and phase volume fractions are different as a result of the different heat-
treatment. Comparing mass gains of Type I samples and corresponding Type II samples,
considerable differences exist, especially between samples No.1 and No.1’ and between samples
No.3 and No.3’. This difference may result from various factors. In Figure 36, the mass gain of
sample No.1’ is significantly higher than that of sample No.1 and the difference was substantial
at first 30h, which responds to the transient stage. However, the higher weight change of sample
No.3’ is obtained after 30h while the weight change of sample No.3 is almost same with that of
sample No.3’ before 30h. In Figure 30, samples No.1 and No.1’ have same alloy composition,
while the β phase size in sample No.1’ is smaller than that in sample No.1, Chromium in fine β
phase particles were oxidized to form Cr2O3 nuclei, which promoted the formation of α-Al2O3
oxide particles during the transient stage [70]. The finer β structure with more grain boundaries
in sample No.1’ may have promoted the formation of Cr2O3 nuclei and resulting aluminum oxide
particles during the transient stage. In contrast, the weight change of sample No.3’ is higher than
that of sample No.3 after 30h. In Figure 35, there are some oxide nodules protruding from the
scale into the gas phase in sample No.3’, while the protrusion is absent in sample No.3. As
shown above, these protrusions and voids below the scale may come from the outward aluminum
diffusion through the scale. Some researchers proposed that during the steady-state stage both
anions and cations can diffuse along the same boundaries through the scale without reacting with
each other [22]. The additional outward aluminum diffusion in sample No.3’ may be beneficial
for the formation of aluminum oxide scale during the steady-state stage.
As shown above, in Figures 36 and 37, the oxidation of the alloys consisted of two stages:
the transient stage and the steady-state stage. During the transient stage, the alloy surface is

69
oxidized and oxide particles begin to form. When the continuous oxide layer forms, the transient
stage transitions to the steady-state stage. In the transient stage, the slopes of the mass-gain
curves are steeper than those in the steady-state stage. This means oxidation in the transient stage
is faster than in the steady-state stage. During the oxidation process, the weight-change curves at
the steady-state stage should follow the parabolic rate law (22) [73]:
(22)
where Δm is the mass gain per unit area, kp is the oxidation rate constant and t is the oxidation
time. Figure 39 shows the square of mass gains of the alloys with respect to the oxidation time
from 50h to 100h. The slopes of these curves represent the oxidation rate constant . During the
steady-state stage, all curves are approximately linear, which indicates that are the parabolic
rate constants, which have been summarized in Table 9 and Figure 40. Comparing of Type I
and corresponding Type II samples, all Type II samples oxidized faster than corresponding Type
I samples. In Table 9, aluminum contents of β-NiAl in Type II samples are higher than these in
corresponding Type I samples, although they have same alloy composition. Some researchers
mentioned the importance of β-NiAl in MCrAlY coating alloys. Salam et al. [72] proposed that
the increase of β-NiAl content in the MCrAlY coating alloy can extend the lifetime of the
coating alloy because β-NiAl is the main Al reservoir. This implies that the aluminum content of
β-NiAl has a significant influence on the oxidation rate.
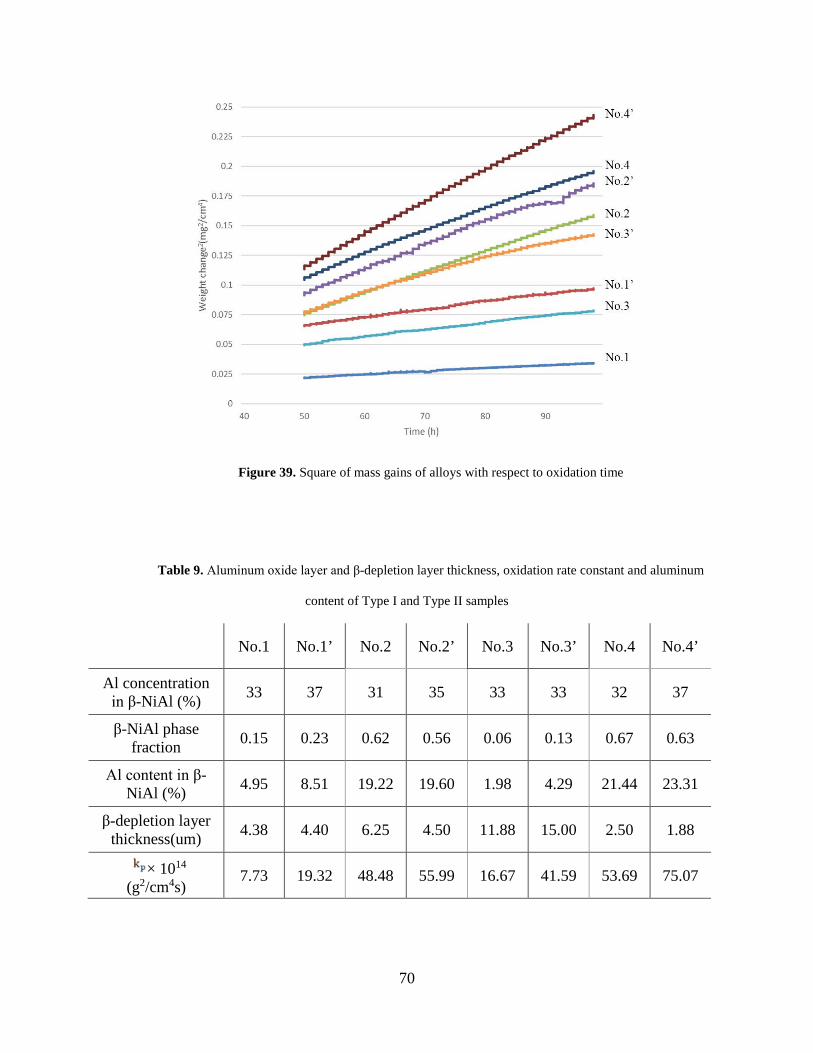
70
Figure 39. Square of mass gains of alloys with respect to oxidation time
Table 9. Aluminum oxide layer and β-depletion layer thickness, oxidation rate constant and aluminum
content of Type I and Type II samples
No.1 No.1’ No.2 No.2’ No.3 No.3’ No.4 No.4’
Al concentration in β-NiAl (%) 33 37 31 35 33 33 32 37
β-NiAl phase fraction 0.15 0.23 0.62 0.56 0.06 0.13 0.67 0.63
Al content in β-NiAl (%) 4.95 8.51 19.22 19.60 1.98 4.29 21.44 23.31
β-depletion layer thickness(um) 4.38 4.40 6.25 4.50 11.88 15.00 2.50 1.88
× 1014 (g2/cm4s)
7.73 19.32 48.48 55.99 16.67 41.59 53.69 75.07

71
Figure 40. Oxidation rate constant of Ni-Co-Cr-Al alloys
Figure 41 compares rate constants from this study to other studies. The straight lines in
Figure 41 show rate constants of oxidation of NiAl [75] at different temperatures. Al2O3 with
different structures have different oxidation rate constants. The steady-state rate constants of
tested alloys at 900℃ are shown in Figure 41, and the transient rate constants of samples No.1’
and No.3 are also illustrated to be compared with the steady-state rate constants. The transient
rate constants of samples No.1’ and No.3 are higher than the steady-state rate constants of the
two alloys. It is coincident with the theory that reactant transport during the steady-stage stage is
slower than that during the transient stage. Besides, the rate constants of most tested alloys are
higher than that of NiAl, no matter which kind of Al2O3 is formed during the oxidation of NiAl.
This may come from the beneficial effect of Cr on the transformation of Al2O3 scale [75].

72
Figure 41. Arrhenius plot of rate constants for experimental data from this thesis and various other studies
The presence of β-depletion zones in Figure 35 was caused by the selective removal of Al
in the substrate to form aluminum oxide. This suggested that β-NiAl is a main contributor to the
oxide layer formation. The distance between red dashed line and continuous oxide layer is the β-
depletion zone thickness. The measured β-depletion zone thicknesses are shown in Table 9.
Thickness of the β-depletion zone is influenced by alloy composition, alloy microstructure,
oxidation temperature and aluminum content in alloy [72].
As discussed above, the oxidation of Ni-Co-Cr-Al alloys are controlled by the diffusion
of reactants through the scale during the steady-state stage. Some researchers [76] analyzed
EPMA line profiles of Ni-Al-Cr-Pt alloys and concluded that the Al diffusion profile in the β-
depletion zone is flat (the flat profile A in Figure 42). Thus, we can assume that the aluminum
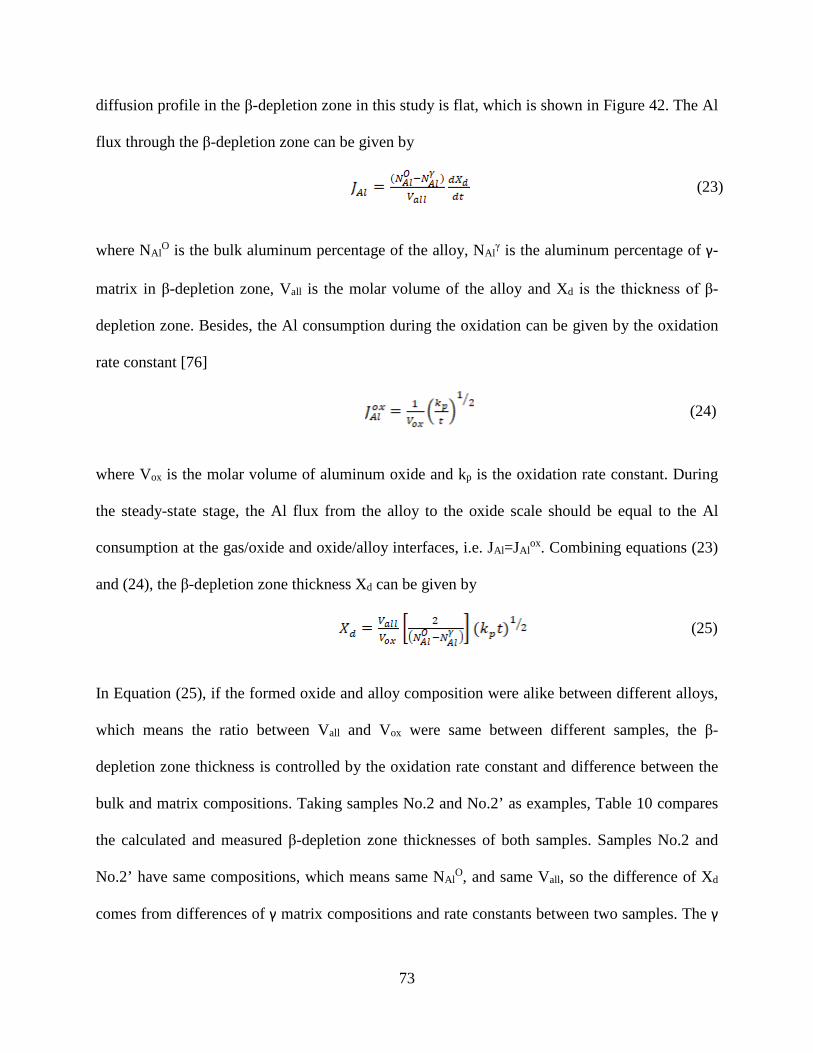
73
diffusion profile in the β-depletion zone in this study is flat, which is shown in Figure 42. The Al
flux through the β-depletion zone can be given by
(23)
where NAlO is the bulk aluminum percentage of the alloy, NAl
γ is the aluminum percentage of γ-
matrix in β-depletion zone, Vall is the molar volume of the alloy and Xd is the thickness of β-
depletion zone. Besides, the Al consumption during the oxidation can be given by the oxidation
rate constant [76]
(24)
where Vox is the molar volume of aluminum oxide and kp is the oxidation rate constant. During
the steady-state stage, the Al flux from the alloy to the oxide scale should be equal to the Al
consumption at the gas/oxide and oxide/alloy interfaces, i.e. JAl=JAlox. Combining equations (23)
and (24), the β-depletion zone thickness Xd can be given by
(25)
In Equation (25), if the formed oxide and alloy composition were alike between different alloys,
which means the ratio between Vall and Vox were same between different samples, the β-
depletion zone thickness is controlled by the oxidation rate constant and difference between the
bulk and matrix compositions. Taking samples No.2 and No.2’ as examples, Table 10 compares
the calculated and measured β-depletion zone thicknesses of both samples. Samples No.2 and
No.2’ have same compositions, which means same NAlO, and same Vall, so the difference of Xd
comes from differences of γ matrix compositions and rate constants between two samples. The γ

74
matrix composition is related with the β phase fraction when the alloy composition is constant.
Higher β phase fraction results in lower aluminum content in γ matrix and resulting higher NAlO-
NAlγ. Besides, as discussed above, the higher aluminum content in alloy contributes to the higher
oxidation rate constant. Thus, low β phase fraction and high aluminum content in the alloy are
beneficial to the formation of thick β-depletion zone.
In Table 10, the measured thicknesses of β-depletion zone are significantly different from
the calculated values. This may come from various factors. The model used to calculate the β-
depletion zone thickness is clearly too simplified. In Figure 42, profile B is more likely to be the
actual Al diffusion profile in consideration of the Al diffusion in the matrix. Because the Al
supply to form an Al2O3 scale is much greater for profile B than A, the β-depletion zone
thickness is consequently over predicted for a given Al2O3-scale thickness. In addition, lack of
consideration of other oxide formation during the transient stage may cause the significant
difference.
Figure 42. The flat Al diffusion through the alloy to the alloy/scale interface
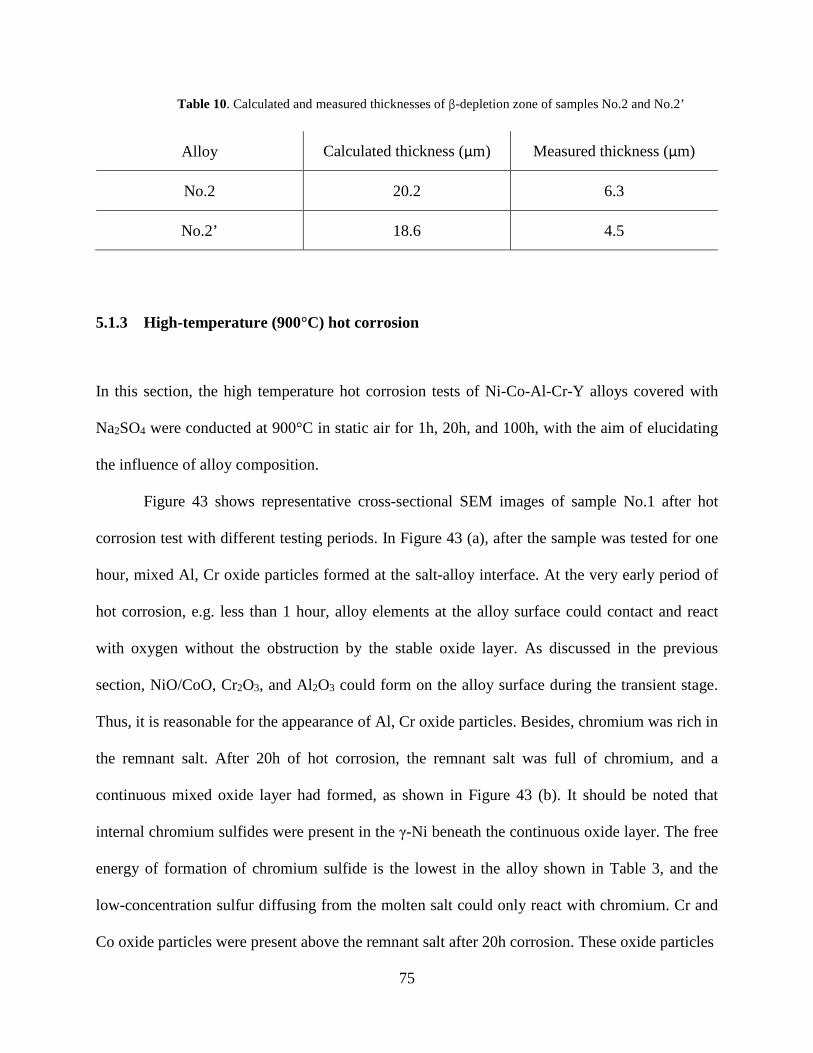
75
Table 10. Calculated and measured thicknesses of β-depletion zone of samples No.2 and No.2’
Alloy Calculated thickness (μm) Measured thickness (μm)
No.2 20.2 6.3
No.2’ 18.6 4.5
5.1.3 High-temperature (900°C) hot corrosion
In this section, the high temperature hot corrosion tests of Ni-Co-Al-Cr-Y alloys covered with
Na2SO4 were conducted at 900°C in static air for 1h, 20h, and 100h, with the aim of elucidating
the influence of alloy composition.
Figure 43 shows representative cross-sectional SEM images of sample No.1 after hot
corrosion test with different testing periods. In Figure 43 (a), after the sample was tested for one
hour, mixed Al, Cr oxide particles formed at the salt-alloy interface. At the very early period of
hot corrosion, e.g. less than 1 hour, alloy elements at the alloy surface could contact and react
with oxygen without the obstruction by the stable oxide layer. As discussed in the previous
section, NiO/CoO, Cr2O3, and Al2O3 could form on the alloy surface during the transient stage.
Thus, it is reasonable for the appearance of Al, Cr oxide particles. Besides, chromium was rich in
the remnant salt. After 20h of hot corrosion, the remnant salt was full of chromium, and a
continuous mixed oxide layer had formed, as shown in Figure 43 (b). It should be noted that
internal chromium sulfides were present in the γ-Ni beneath the continuous oxide layer. The free
energy of formation of chromium sulfide is the lowest in the alloy shown in Table 3, and the
low-concentration sulfur diffusing from the molten salt could only react with chromium. Cr and
Co oxide particles were present above the remnant salt after 20h corrosion. These oxide particles

76
Figure 43. Micrographs of sample No.1 with high temperature hot corrosion at 900°C with Na2SO4 for (a)
1h, (b) 20h and (c) 100h

77
might form during the first few hours. When the hot corrosion time was increased to 100 hours,
the continuous oxide layer was composed of Al2O3 primarily, and the remnant salt is also full of
chromium. The enriched chromium in the remnant salt may come from the dissolution of
chromium oxide formed during the transient stage.
Figure 44 shows cross-sectional SEM images of sample No.4 after 900°C hot corrosion
test. Sample No.4 has higher Al content while lower Cr content than sample No.1. Like sample
No.1, at the first few hours of hot corrosion, mixed oxide particles appeared at the alloy-salt
interface. With longer time corrosion, the continuous oxide layer comprised of Al and Cr oxide
formed. After 100h hot corrosion, the continuous oxide layer was primarily comprised of Al2O3.
Although both samples formed a continuous oxide layer, there are some differences between
samples No.1 and No.4 after 100h hot corrosion. The continuous oxide layer in sample No.4 is
thicker than that in sample No.1 and internal chromium sulfide particles did not appear in the
substrate in sample No.4.
Figure 45 presents cross-sectional SEM images of sample No.2 after hot corrosion test at
900°C. This sample has a similar aluminum content with sample No.4, which is the highest
among Type I samples, but the lowest chromium content among Type I samples. After 20h hot
corrosion exposure, a continuous layer consisted of Al oxide and Cr oxide formed. However,
when the corrosion time extended to 100 hours, severe corrosion was found (Figure 45(c)), and
the continuous oxide layer disappeared. The chromium-rich salt accompanied with nickel-rich
mixed oxide was on the top of the corroded alloy and oxide containing all alloy elements was
beneath them. Chromium sulfide was also present in sample No.4.

78
Figure 44. Micrographs of sample No.4 with high temperature hot corrosion at 900°C with Na2SO4 for (a)
1h, (b) 20h and (c) 100h
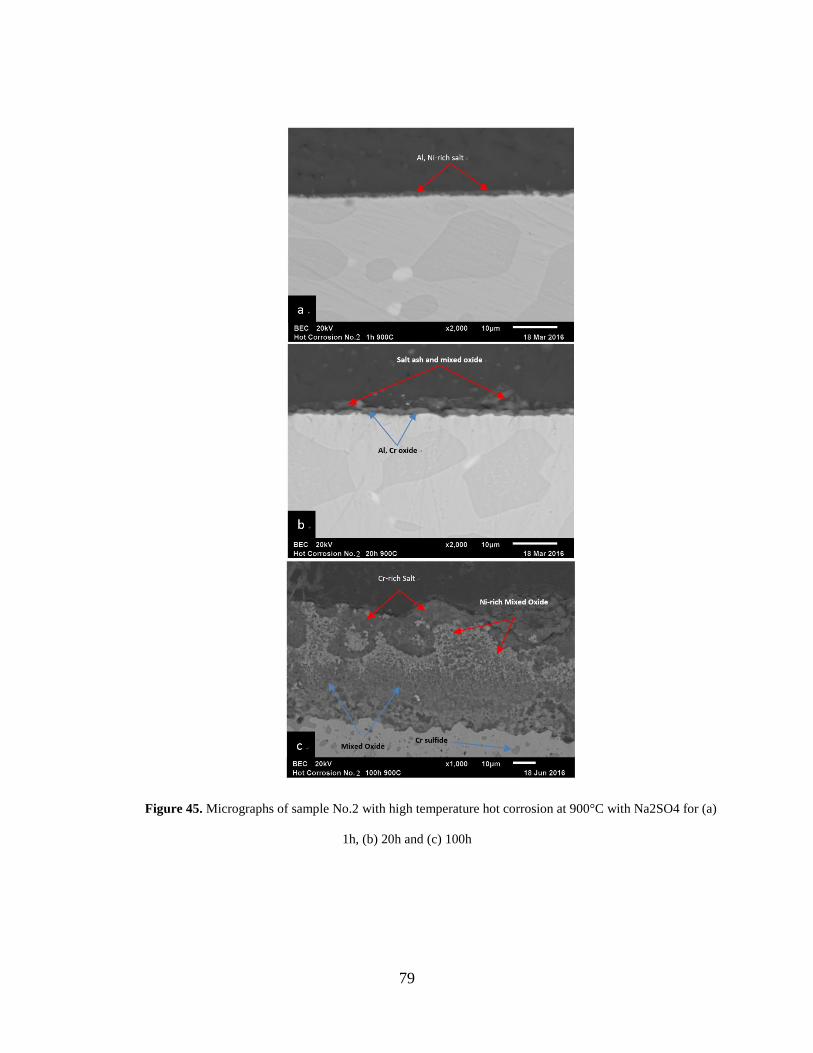
79
Figure 45. Micrographs of sample No.2 with high temperature hot corrosion at 900°C with Na2SO4 for (a)
1h, (b) 20h and (c) 100h

80
Sample No.3 also suffered severe hot corrosion like sample No.2, shown in Figure 46.
The chromium content is higher than sample No.2, but aluminum content is lower. Although a
protective oxide layer comprised of Al oxide and Cr oxide formed in 20h hot corrosion, it
disappeared after 100h hot corrosion. In Figure 46(c), a mixed oxide layer rich in nickel and
cobalt formed on the top. Beneath the oxide layer, there was a large amount of mixed oxide
containing all alloy elements. In addition, internal chromium sulfides formed in the substrate.
Comparing with sample No.2, the corrosion scales were thicker, and the amount of chromium
sulfide was larger.
Four Type I samples showed different hot corrosion behaviors. A continuous aluminum
oxide layer formed in samples No.1 and No.4, while samples No.2 and No.3 suffered severe hot
corrosion after 100h hot corrosion. Because these samples were comprised of β-NiAl and γ phase,
which means they have similar structure, and tested at the same environment, the difference of
corrosion condition comes from the difference of alloy composition.
As mentioned above, catastrophic degradation in Type I hot corrosion in this thesis could
occur when the dissolution of aluminum oxide layer in the molten salt and resulting basic fluxing
of Na2SO4 occur, while the protective oxide layer is unable to reform, and the molten salt contact
directly with the alloy [77]. During hot corrosion tests, all Type I samples formed a continuous
oxide layer after 20h hot corrosion. After 100h hot corrosion, aluminum oxide layers in samples
No.1 and No.4 were still present, while in samples No.2 and No.3 were absent. Thus, different
performances after 100h hot corrosion come from different abilities of these samples to reform
oxide layers. Because the continuous oxide layers formed after 20h hot corrosion were
comprised of mixed Al, Cr oxide, we can infer that aluminum and chromium content in alloys
dominated the resistance to hot corrosion.

81
Figure 46. Micrographs of sample No.3 with high temperature hot corrosion at 900°C with Na2SO4 for (a)
1h, (b) 20h and (c) 100h

82
In Table 4, samples No.1 and No.3 are shown to have a similar Al content, which is
around 13 at. %, and samples No.2 and No.4 have a similar Al content of about 24 at. %. Both
samples No.3 and No.4 have about 17 at. % Cr. Comparing the corroded performance of samples
No.1 and No.3, although both samples have similar Al content, samples No.1 formed a
continuous aluminum oxide layer, while sample No.3 had been corroded significantly. This
suggests that the difference comes from the difference of Cr content in both samples. The Cr
concentration in sample No.1 is 30 at. %, while in sample No.3 it is only 16 at. %. Higher Cr
content in sample No.1 contributes to the better corrosion resistance. The same observation holds
for samples No.2 and No.4. The Cr concentration in sample No.4, which is 18 at. %, is larger
than the 10 at. % in sample No.2 and results in a continuous oxide layer. To illustrate the
influence of aluminum content, we can compare corrosion conditions of samples No.3 and No.4.
Sample No.4 has higher Al content than sample No.3, although both samples have similar Cr
concentration, and thus sample No.4 had a continuous oxide layer rather than the severe
corrosion in sample No.3.
For samples No.1 and No.4, both samples had a continuous aluminum oxide scale after
100h hot corrosion. The difference is thickness of the oxide layer. As mentioned above, the
ability of the alloy to reform the aluminum oxide layer during hot corrosion is the determinant
factor for the hot corrosion resistance, and β-NiAl is the main Al reservoir during oxidation. It is
reasonable to infer that β-NiAl in the alloy can act as the potential aluminum source for the
reformation of aluminum oxide layer during the hot corrosion. The thicker oxide layer in sample
No.4 may arise from the higher phase volume fraction of β-NiAl.
For samples No.2 and No.3, although continuous oxide layers formed after 20h hot
corrosion, these layers were destroyed after 100h hot corrosion. In sample No.2, there were some

83
Ni-rich mixed oxide between salt and mixed oxide above the alloy. The Ni-rich mixed oxide may
be formed by the oxidation of remnant γ phase where aluminum and chromium in β-NiAl had
been consumed by oxidation. In sample No.3, a Co, Ni mixed oxide layer was present at the top
of mixed oxide. This may also come from the oxidation of remnant γ phase. Besides, without the
protection of continuous aluminum oxide layer, sulfur diffused into the alloy and formed a large
amount of chromium sulfide in the alloy, as shown in samples No.2 and No.3.
In summary, the hot corrosion resistance of Type I samples varied significantly with Al
and Cr content. In this thesis, all Type I samples formed a continuous oxide layer after 20h hot
corrosion. After 100h hot corrosion, different abilities of these samples to reform oxide layers
resulted in different performances. In samples with high chromium content, i.e. samples No.1
and No.4, a close aluminum oxide layer was present, while the alloy was corroded severely in
samples having low chromium content, i.e. samples No.2 and No.3, although sample No.2 had
same aluminum content as sample No.4. This shows chromium can promote the reformation of
aluminum oxide layer when the oxide scale has formed. Besides, thicker aluminum oxide layer
in sample No.4 compared with that in sample No.1 implies that high aluminum content can
contribute to the formation of aluminum oxide layer.
Figure 47 shows the cross-sectional SEM images of Type II samples after 100h hot
corrosion tests at 900°C. Comparing samples No.1’ and No.4’, the continuous oxide layer in
sample No.4’ is thicker than that in sample No.1’. Samples No.2’ and No.3’ underwent severe
hot corrosion and the corrosion of sample No.3’ is the most severe. These observations are
aligned with the Type I samples. The only difference is that chromium sulfide is absent in
sample No.1’ as opposed to the presence of chromium sulfide in sample No.1. This is probably

84
because sulfur diffusing into the alloy during the first few hours is negligible due to the fast
formation of the oxide layer.
Performances of Type I and Type II samples, which have same alloy composition but
different phase volume fractions and phase compositions, are analogous in hot corrosion. Thus,
we can conclude that phase volume fraction and phase composition do not have obvious
influence on the resistance of hot corrosion.
Figure 47. Micrographs of samples (a) No.1’, (b) No.2’, (c) No.3’, and (d) No.4’ with high temperature hot
corrosion at 900°C with Na2SO4 for 100h

85
5.2 CONCLUSIONS
The oxidation and high temperature hot corrosion testing of Ni-Co-Al-Cr-Y alloys was
conducted to study the influence of alloy composition, phase composition and phase volume
fraction on degradation resistance.
In the oxidation case, aluminum content in alloys is a key factor and β-NiAl in alloy
contributes to the formation of the oxide layer primarily. High aluminum content can promote
the formation of Al2O3 layer and contribute to the thickening of the oxide scale. In the transient
stage, different phase size impacts the mass gain during oxidation. The alloy aluminum content
and aluminum content in β-NiAl have influences on the steady-state stage oxidation rate. Besides,
the β-depletion zone thickness is promoted by the low β phase fraction and high aluminum
content in the alloy.
In high temperature hot corrosion, the hot corrosion resistance varied significantly with
Al and Cr content while phase volume fraction and phase composition do not have obvious
influence on the resistance of hot corrosion. Different abilities of alloys to reform oxide layers
during the steady-state stage result in different hot corrosion resistance. Higher Cr content in
alloys can promote the rapid establishment of a continuous oxide layer and the reformation of
aluminum oxide layer when the oxide scale has formed. High aluminum content can also
contribute to the formation of aluminum oxide layer. The significant presence of chromium
sulfide in samples No.2 and No.3 imply that cracks in the protective oxide layer will accelerate
the inward penetration of sulfur.

86
6.0 SUMMARY
In high temperature applications, MCrAl (M=Co, Ni or Co+Ni)-based alloys are commonly used
due to their outstanding hot corrosion and oxidation resistance. They are designed to form
protective Al2O3 layers in oxidative and corrosive environments. Variation in the composition of
alloys leads to different oxidation and hot corrosion resistance.
Ni-Co-Cr-Al-Y alloys were oxidized to study the influence of alloy composition, phase
composition, and phase volume fraction on formation rate of aluminum oxide. Higher aluminum
content in alloys results in thicker oxide layer and β-NiAl in alloy contributes to the formation of
the oxide layer primarily. The alloy aluminum content and aluminum content in β-NiAl have
influences on the steady-state stage oxidation rate. Besides, the β-depletion zone thickness is
promoted by the low β phase fraction and high aluminum content in the alloy.
The hot corrosion resistance of Ni-Co-Cr-Al-Y alloys varied significantly with Al and Cr
content while phase volume fraction and phase composition do not have obvious influence on the
resistance of hot corrosion. High Cr content in alloys can promote the rapid establishment of a
continuous oxide layer and the reformation of aluminum oxide layer when the oxide scale has
formed. Higher Al content is beneficial to the formation of thicker aluminum oxide layer.

87
7.0 FUTURE WORK
In this thesis, the influence of alloy composition, phase composition, and phase volume fraction
on oxidation and high temperature hot corrosion resistance of Ni-Co-Cr-Al-Y alloys was studied.
There are still some factors that need to be considered. For example, the distribution and shape of
the different phases may have an impact on the oxidation and hot corrosion resistance. The
influence of the considered factors should also be studied for the case of low temperature hot
corrosion.
In future work, to obtain more details of oxidation and corrosion products, more detailed
characterizations, e.g. XRD, can be used. In addition, more test conditions will be conducted.
Longer exposure time, cyclic-testing, and different test temperatures can give a better
understanding of degradation resistance of Ni-Co-Cr-Al-Y alloys.

88
BIBLIOGRAPHY
[1] N. Eliaz, G. shemesh, and R.M. Latanision. Hot corrosion in gas turbine components. Engineering Failure Analysis, 9(1): 31-43, 2002.
[2] Fred Pettit. Hot Corrosion of Metals and Alloys. Oxidation of Metals, 76(1-2): 1-21, 2011.
[3] Shirley H.. Effects of Sulphate-Chloride Mixtures in Fuel-Ash Corrosion of Steels and High-Nickel Alloys. The Journal of the Iron and Steel Institute, 182: 144-153, 1956.
[4] John Stringer. Hot Corrosion of High-Temperature Alloys. Annual Review of Materials Science, 7(1): 477-509, 1977.
[5] G. P. Sabol, R. Strckler. Microstructure of Nickel-based Superalloys. physica status solidi (b), 35(1): 11-52, 1969.
[6] J.R. Nicholls. Advances in Coating Design for High-Performance Gas Turbines. MRS bulletin, 28(9): 659-670, 2003.
[7] M. A. DeCRESCENTE, N. S. BORNSTEIN. Formation and Reactivity Thermodynamics of Sodium Sulfate with Gas Turbine Alloys. Corrosion-NACE, 24(5): 127-133, 1968.
[8] Tresa M. Pollock, Sammy Tin. Nickel-Based Superalloys for Advanced Turbine Engines: Chemistry, Microstructure, and Properties. Journal of Propulsion and Power, 22(2): 361-374, 2006.
[9] Noriyoshi Kumazawa, Yasuyoshi Fukui, and Daisaku Nara. Novel Concept to Detect an Optimum Thixoforming Condition of Al-Al3Ni Functionally Graded Material by Wavelet Analysis for Online Operation. Materials, 4(12): 2183-2196, 2011.
[10] L.R. Liu, T. Jin, N.R. Zhao, X.F. Sun, H.R. Guan, and Z.Q. Hu. Formation of carbides and their effects on stress rupture of a Ni-base single crystal superalloy. Materials Science and Engineering, 361(1-2): 191-197, 2003.
[11] S. TIN, T.M. POLLOCK. Stabilization of Thermosolutal Convective Instabilities in Ni-Based Single-Crystal Superalloys: Carbide Precipitation and Rayleigh Numbers. Metallurgical and Materials Transactions A, 34(9): 1953-1967, 2003.

89
[12] D. Seo, K. Ogawa, Y. Suzuki, K. Ichimura, T. Shoji, and S. Murata. Comparative study on oxidation behavior of selected MCrAlY coatings by elemental concentration profile analysis. Applied Surface Science, 255(5): 2581-2590, 2008.
[13] H. Okamoto. Supplemental Literature Review of Binary Phase Diagrams: Ag-Yb, Al-Co, Al-I, Co-Cr, Cs-Te, In-Sr, Mg-Ti, Mn-Pd, Mo-O, Mo-Re, Ni-Os, and V-Zr. Journal of Phase Equilibria and Diffusion, 37(6): 726-737, 2016.
[14] R.A. Hobbs, L. Zhang, C.M.F. Rae, and S. Tin. The effect of ruthenium on the intermediate to high temperature creep response of high refractory content single crystal nickel-base superalloys. Materials Science and Engineering, 489(1-2): 65-76, 2008.
[15] G.W. Goward. Low-Temperature Hot Corrosion in Gas Turbines: a Review of Causes and Coating Therefor. Journal of Engineering for Gas Turbines and Power, 108: 421-425, 1986.
[16] G.W. Goward. Progress in coatings for gas turbine airfoils. Surface and Coatings Technology, 108-109: 73-79, 1998.
[17] J.R. Nicholls. Designing Oxidation-Resistant Coatings. JOM, 52(1): 28-35, 2000.
[18] H.M. Tawancy, N.M. Abbas, and A. Bennett. Role of Y during high temperature oxidation of an M-Cr-Al-Y coating on an Ni-base superalloy. Surface and Coatings Technology, 68-69: 10-16, 1994.
[19] N.M. Yanar, E.M. Meier, F.S. Pettit, and G.H. Meier. The effect of yttrium content on the oxidation-induced degradation of NiCoCrAlY coatings and the influence of surface roughness on the oxidation of NiCoCrAlY and platinum aluminide coatings. Materials at High Temperature, 26(3): 331-338, 2009.
[20] C. Serrano Vergel, C. Kwakernaak, T.J. Nijdam, and W.G. Sloof. Yttrium and oxygen distributions in MCrAlY coatings after deposition, annealing and oxidation. Materials at High Temperature, 26(2): 153-159, 2009.
[21] T.J. Nijdam, W.G. Sloof. Modelling of composition and phase changes in multiphase alloys due to growth of an oxide layer. Acta Materialia, 56(18): 4972-4983, 2008.
[22] B. A. Pint. Experimental Observations in Support of the Dynamic-Segregation Theory to Explain the Reactive-Element Effect. Oxidation of Metals, 45(1-2): 1-37, 1996.
[23] T.J. Nijdam, W.G. Sloof. Microstructural evolution of a MCrAlY coating upon isothermal annealing. Materials Characterization, 59(12): 1697-1704, 2008.
[24] K. Fritscher and Y.-T. Lee. Investigation of an as-sprayed NiCoCrAlY overlay coating-microstructure and evolution of the coating. Materials and Corrosion, 56(1): 5-14, 2005.
[25] J.R. Nicholls, N.J. Simms, W.Y. Chan, H.E. Evans. Smart overlay coatings-concept and practice. Surface and Coatings Technology, 149(2-3): 236-244, 2002.
90
[26] I. Gurrappa. Influence of alloying elements on hot corrosion of superalloys and coatings: necessity of smart coatings for gas turbine engines. Materials Science and Technology, 19(2): 178-183, 2003.
[27] Jun Ma, Su Meng Jiang, Jun Gong, and Chao Sun. Composite coatings with and without an in situ forming Cr-based interlayer: Preparation and oxidation behaviour. Corrosion Science, 53(9): 2894-2901, 2011.
[28] J. P. Neumann, T. Zhong, and Y. A. Chang. The Ni-O (Nickel-Oxygen) system. Journal of Phase Equilibria, 5(2): 141-144, 1984.
[29] J. A. Goebel, F. S. Pettit. Na2SO4-induced accelerated oxidation (hot corrosion) of nickel. Metallurgical and Materials Transactions B, 1(7): 1943-1954, 1970.
[30] N. Halem, M. Abrudeanu, and G. Petot-Ervas. Al effect in transport properties of nickel oxide and its relevance to the oxidation of nickel. Materials Science and Engineering B, 176(13): 1002-1009, 2011.
[31] H. A. Wriedt. The Al-O (Aluminum-Oxygen) system. Journal of Phase Equilibria, 6(6): 548-553,1985.
[32] Erwin Povoden, A. Nicholas Grundy, and Ludwig J. Gauckler. Thermodynamic reassessment of the Cr-O system in the framework of solid oxide fuel cell (SOFC) research. Journal of Phase Equilibria and Diffusion, 27(4): 353-362, 2006.
[33] G. S. Giggins, F. S. Pettit. Oxidation of Ni‐Cr‐Al Alloys Between 1000° and 1200° C. Journal of the Electrochemical Society, 118(11): 1782-1790, 1971.
[34] M. J. Pomeroy. Coatings for gas turbine materials and long term stability issues. Materials & Design, 26(3): 223-231, 2005.
[35] S. W. Guan, W. W. Smeltzer. Oxygen solubility and a criterion for the transition from internal to external oxidation of ternary alloys. Oxidation of Metals, 42(5): 375-391, 1994.
[36] G.Y. Liang, C. Zhu, X.Y. Wu, and Y. Wu. The formation model of Ni-Cr oxides on NiCoCrAlY-sprayed coating. Applied Surface Science, 257(15): 6468-6473, 2011.
[37] M. C. Pope, N. Birks. The penetration by sulfur of NiO scales growing on nickel. Oxidation of Metals, 12(2): 173-181, 1978.
[38] Nobuo Otsuka, Robert A. Rapp. Hot Corrosion of Preoxidized Ni by a Thin Fused Na2SO4 Film at 900°C. Journal of the Electrochemical Society, 137(1): 46-52, 1990.
[39] Gilbert J. Santoro, Charles A. Barrett. Hot Corrosion Resistance of Nickel-Chromium-Aluminum Alloys. Journal of the Electrochemical Society, 125(2): 271-278, 1978.

91
[40] H. E. Evans, M. P. Taylor. Oxidation of high-temperature coatings. Proceedings of the Institution of Mechanical Engineers, Part G: Journal of Aerospace Engineering, 220(1): 1-10, 2006.
[41] M. P. Taylor. An oxidation study of an MCrAlY overlay coating. Materials at High Temperatures, 22(3-4): 433-436, 2005.
[42] J. A. Goebel, F. S. Pettit, and G. W. Goward. Mechanisms for the hot corrosion of nickel-base alloys. Metallurgical and Materials Transactions B, 4(1): 261-278, 1973.
[43] Robert A. Rapp. Chemistry and electrochemistry of the hot corrosion of metals. Corrosion-NACE, 42(10): 568-577, 1986.
[44] Neil Birks, Gerald H. Meier, and Fred S. Pettit. Introduction to the High-Temperature Oxidation of Metals. Cambridge University Press, 2006.
[45] Y. S. Zhang, R. A. Rapp. Solubilities of CeO2, HfO2 and Y2O3 in Fused Na2SO4-30 mol% NaVO3 and CeO2 in Pure Na2SO4 at 900 C. Corrosion, 43(6): 348-352, 1987.
[46] R. A. Rapp, and K. S. Goto. The hot corrosion of metals by molten salts. Proceedings of the Second International Symposium on Molten Salts, 81(10): 159, 1981.
[47] Rolf E. Andresen. Solubility of oxygen and sulfur dioxide in molten sodium sulfate and oxygen and carbon dioxide in molten sodium carbonate. Journal of the Electrochemical Society, 126(2): 328-334, 1979.
[48] K. L. Luthra. Low Temperature Hot Corrosion of Cobalt-Base Alloys: Part II. Reaction Mechanism. Metallurgical Transactions A, 13(10): 1853-1864, 1982.
[49] K. P. Lillerud, B. Haflan, and P. Kofstad. On the Reaction Mechanism of Nickel with SO2+O2/SO3. Oxidation of Metals, 21(3-4): 119-134, 1984.
[50] A. K. Misra, and D. P. Whittle. Effects of SO2 and SO3 on the Na2SO4 Induced Corrosion of Nickel. Oxidation of Metals, 22(1-2): 1-33, 1984.
[51] S. Mrowec, and K. Przybylski. Transport Properties of Sulfide Scales and Sulfidation of Metals and Alloys. Oxidation of Metals, 23(3-4): 107-139, 1985.
[52] J. A. Goebel, and F. S. Pettit. The Influence of Sulfides on the Oxidation Behavior of Nickel-Base Alloys. Metallurgical and Materials Transactions B, 1(12): 3421-3429, 1970.
[53] N. S. Bornstein, M. A. DeCrescente, and H. A. Roth. The Relationship Between Relative Oxide Ion Content of Na2SO4, the Presence of Liquid Metal Oxides and Sulfidation Attack. Metallurgical Transactions, 4(8): 1799-1810, 1973.

92
[54] A. K. Misra. Mechanism of Na2SO4-Induced Corrosion of Molybdenum Containing Nickel‐Base Superalloys at High Temperatures II. Corrosion in O2+SO2 Atmospheres. Journal of the Electrochemical Society, 133(5): 1038-1042, 1986.
[55] Thomas Gheno, Brain Gleeson. On the Hot Corrosion of Nickel at 700°C. Oxidation of Metals, 84(5-6): 567-584, 2015.
[56] Thomas Gheno, Maryam Zahiri Azar, Arthur H. Heuer, and Brain Gleeson. Reaction morphologies developed by nickel aluminides in type II hot corrosion conditions: The effect of chromium. Corrosion Science, 101: 32-46, 2015.
[57] Michael N. Task, Brain Gleeson, Frederick S. Pettit, and Gerald H. Meier. Compositional Factors Affecting Protective Alumina Formation Under Type II Hot Corrosion Conditions. Oxidation of Metals, 80(5-6): 541-552, 2013.
[58] K. L. Luthra, D. A. Shores. Mechanism of Na2SO4 Induced Corrosion at 600°-900°C. Journal of the Electrochemical Society, 127(10): 2202-2210, 1980.
[59] K. L. Luthra. Mechanism of low temperature hot corrosion. High temperature corrosion, 507-512, 1983.
[60] Karl Petter Lillerud, Per Kofstad. Sulfate-Induced Hot Corrosion of Nickel. Oxidation of Metals, 21(5-6): 233-270, 1984.
[61] A. K. Misra, D. P. Whittle, and W. L. Worrell. Thermodynamics of Molten Sulfate Mixtures. Journal of the Electrochemical Society, 129(8): 1840-1845, 1982.
[62] Thomas Gheno, Xuan L. Liu, Greta Lindwall, Zi-Kui Liu, and Brain Gleeson. Experimental study and thermodynamic modeling of the Al–Co–Cr–Ni system. Science and Technology of Advanced Materials, 16(5): 055001, 2015.
[63] Xuan L. Liu, Greta Lindwall, Thomas Gheno, and Zi-Kui Liu. Thermodynamic modeling of Al–Co–Cr, Al–Co–Ni, Co–Cr–Ni ternary systems towards a description for Al–Co–Cr–Ni. CALPHAD: Computer Coupling of Phase Diagrams and Thermochemistry, 52: 125-142, 2016.
[64] A. W. Coats, J. P. Redfern. Thermogravimetric Analysis. A Review. Analyst, 88(1053): 906-924, 1963.
[65] Stott, F. Howard. The oxidation of alumina-forming alloys. Materials Science Forum, 251: 19-32, 1997.
[66] Prescott, R., and M. J. Graham. The formation of aluminum oxide scales on high-temperature alloys. Oxidation of metals, 38(3-4): 233-254, 1992.
[67] Doychak, J., J. L. Smialek, and T. E. Mitchell. Transient oxidation of single-crystal β-NiAl. Metallurgical Transactions A, 20(3): 499-518, 1989.

93
[68] Rybicki, George C., and James L. Smialek. Effect of the θ-α-Al2O3 transformation on the oxidation behavior of β-NiAl + Zr. Oxidation of Metals, 31(3-4): 275-304, 1989.
[69] Klumpes, R., et al. The influence of chromium on the oxidation of β‐NiAl at 1000°C. Materials and Corrosion, 47(11): 619-624, 1996.
[70] Brumm, M. W., and H. J. Grabke. The oxidation behaviour of NiAl--I. phase transformations in the alumina scale during oxidation of NiAl and NiAl-Cr alloys. Corrosion science, 33(11): 1677-1690, 1992.
[71] Stott, F. H., G. C. Wood, and F. A. Golightly. The isothermal oxidation behaviour of Fe-Cr-Al and Fe-Cr-Al-Y alloys at 1200°C. Corrosion Science, 19(11): 869-887, 1979.
[72] S. Salam, P. Y. Hou, Y.-D. Zhang, H.-F. Wang, C. Zhang, and Z.-G. Yang. Compositional effects on the high-temperature oxidation lifetime of MCrAlY type coating alloys. Corrosion Science, 95: 143-151, 2015.
[73] Daniel Monceau, Bernard Pieraggi. Determination of Parabolic Rate Constants from a Local Analysis of Mass-Gain Curves. Oxidation of Metals, 50(5-6): 477-493, 1998.
[74] Aaron, Jill M., et al. A phenomenological description of the rate of the aluminum/oxygen reaction in the reaction-bonding of alumina. Journal of the European Ceramic Society, 25(15): 3413-3425, 2005.
[75] Grabke, H. J., M. W. Brumm, and B. Wagemann. The oxidation of NiAl. Materials and Corrosion, 47(12): 675-677, 1996.
[76] Heidloff, Andrew James. Development of Pt-modified γ-Ni+ γ'-Ni3Al-based alloys for high-temperature applications. Iowa State University, 2009.
[77] Earl A. Gulbransen, Kenneth F. Andrew. Oxidation Studies on the Iron-Chromium-Aluminum Heater Alloys. Journal of the Electrochemical Society, 106(4), 294-302, 1959.