compound development - hans-joachim-graf.com tire cmpd dev.pdf · dr. hans-joachim graf 2 compound...
TRANSCRIPT

Compound Development
Advantage of Compound Developmentwith thePC-Program “GrafCompounder”
Tire Industry TechInternational Conference on Tire Manufacturing TechnologyBangkok, March 2012Organized by:
Dr. Hans-Joachim Grafwww.hans-joachim-graf.com

Dr. Hans-Joachim Graf 2
Compound Development
➨ Advantage of a PC-Program● Motivation for Program Development● Description of the GrafCompounder?● Comparison with Statistic Experimental Design (DoE) ● Combination of Grafcompounder with DoE● Advantages / Summary

Dr. Hans-Joachim Graf 3
Motivation for Program Development
➨ Compound database is a kind of happen stance data➨ Program developments and patents were dealing with “Neuronal
Network Algorithmen” to create recipes from compound databases.

Dr. Hans-Joachim Graf 4
Motivation for Program Development
Mid size - / Large company: Recipes in use ~ 500 – 2000
Laboratory recipes ~ 1000/year
Cost of Recipe Development in a
Laboratory ~ 500 US$/Recipe
=Invest of 500.000 US$/year
Recipe is used 1 Timeper
Project / Evaluation
Reinvention Time*)~ 1- 2 Jahre!
*) personal Estimation
Plant- andLaboratory Recipes
Dr. Hans-Joachim Graf 5
Motivation for Program Development➨ Question:
● Why we can hardly take Compound Databases as working capital,Saving time and effort in our daily work?
■ Avoiding reinvention■ Increase our compounding knowledge.■ Gaining room for really new ideas in compound development

Dr. Hans-Joachim Graf 6
Motivation for Program Development
➨ Patent EP 0865 890 A1 (Bridgestone) is dealing with compounds used in tire manufacturing
● Dependency of factor – response relationship with none linear regression equation.
● Usage of a function to determine boundary conditions.
● Identification of a compound with targeted properties.

Dr. Hans-Joachim Graf 7
Motivation for Program Development
➨ The patent US 7541122B2 (Fa. Honeywell) deal with „empirical“ DoE with the help of neuronal network algorithm
● Datenbase from historical compound data
● Elimination of foulty data sets out of the data base
● Calculation of a compound with the help of none linear neuronal network algorithm
● Building of a equation for the simulation of the correlation between factors (compound ingredients) and responses (properties).

Dr. Hans-Joachim Graf 8
Motivation for Program Development
➨ Commerzialisation of Compound Calculation with neuronal network algorithm
● CAD-CHEM■ Program needed a huge database ■ Prediction was still inaccurate ■ Program was taken from the market.
Dr. Hans-Joachim Graf 9
Motivation for Program Development
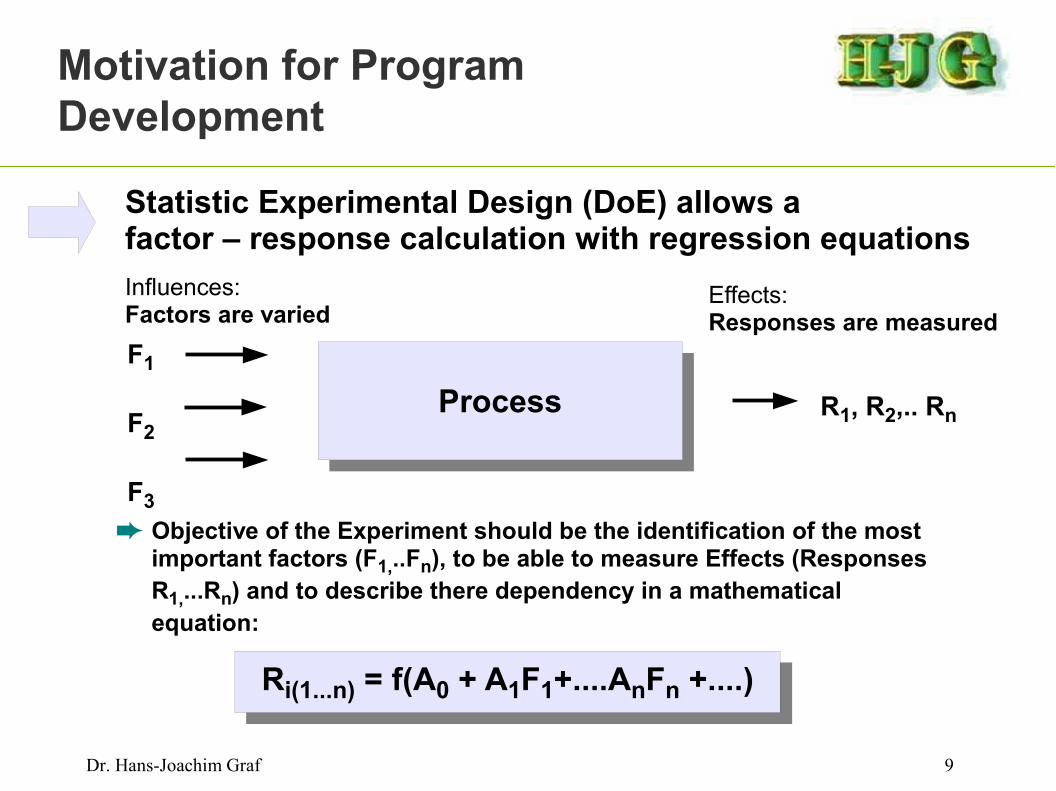
ProcessProcessF1
F2
F3
Influences:Factors are varied
Effects:Responses are measured
R1, R2,.. Rn
➨ Objective of the Experiment should be the identification of the most important factors (F1,..Fn), to be able to measure Effects (Responses R1,...Rn) and to describe there dependency in a mathematical equation:
Ri(1...n) = f(A0 + A1F1+....AnFn +....)Ri(1...n) = f(A0 + A1F1+....AnFn +....)
Statistic Experimental Design (DoE) allows a factor – response calculation with regression equations

Dr. Hans-Joachim Graf 10
Design Guidefor GrafCompounder
● Calculation with linear relations ships■ Most DoE shows a linear model equation is sufficiently
accurate.■ Math should be based on linear relationships, but allow
multiple small steps during calculations. ● Identification of faulty data in the compound database
should be easy● Program should work correctly even with a smaller
database● Program should be compatible with all type of calculation
programs

Dr. Hans-Joachim Graf 11
Descriptionof GrafCompounder➨ GrafCompounder
● Table calculation software■ Based on Java■ Import / Export function for communication■ Allows automatic mixing of compounds and manual mixing■ Calculates property data■ Shows data composition of the result■ Import / Export of result

Dr. Hans-Joachim Graf 12
Descriptionof GrafCompounder
➨Analysis of a recipe database with Multiple Linear Iteration (MLI)
■ Search criteria manageable with different weights!■ Recipe Selection (Exclusion of unwanted recipes
during analysis)● Avoid Analysis of none compatible Polymers
■ Automatic an Manual Mode● Simulation of Blends of Compounds
■ Property Data should be from a trustworthy source, if not your own

Dr. Hans-Joachim Graf 13
Descriptionof GrafCompounder
➨ Analysis based on ● Measurables● Targets● Weights● Rating functions shows the
distance between values and target
● Iteration in small steps from different starting points
● Check of maximum agreement with the target
➨ Report of Results● Recipe● All calculable physical properties
■ Missing data left out● Show all Recipes with their
percentage used in an analysis
Dr. Hans-Joachim Graf 14
Description of GrafCompounder
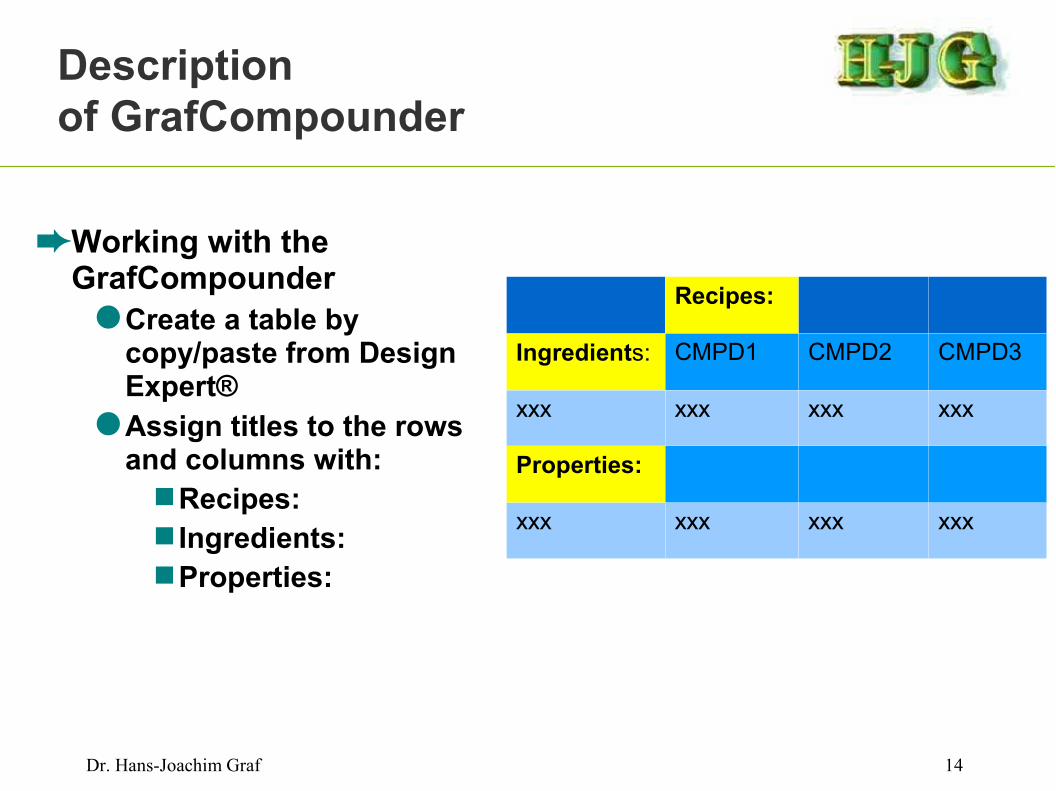
➨Working with the GrafCompounder
● Create a table by copy/paste from Design Expert®
● Assign titles to the rows and columns with:
■ Recipes:■ Ingredients:■ Properties:
Recipes:
Ingredients: CMPD1 CMPD2 CMPD3
xxx xxx xxx xxx
Properties:
xxx xxx xxx xxx

Dr. Hans-Joachim Graf 15
Comparison DoE versus GrafCompounder
➨Testing the MLI-method a database is needed, which can be analyzed in different ways.
● 1. Example■ Oil / Filler DoE (with own Experiments)■ Factors: Filler 1, Filler 2, Filler3 and Oil
● 2. ExampleDoE published by DuPont Dow in 1998
■ Factors: ENB, DTDC, S, MBT, TiTBD, ZdiBC, DTP
● Same Optimization criteria will be used in DoE Software (Design Expert®) and in GrafCompounder.
Dr. Hans-Joachim Graf 16
Comparison DoE versus GrafCompounder
●1. Example■ Oil / Filler DoE (based on own experiments)■ Factors: Filler 1, Filler 2, Filler 3 and Oil

Dr. Hans-Joachim Graf 17
Comparison DoE versus GrafCompounder
➨ DoE with 4 FactorsPolymer used was Vistalon 8600
➨ Factor Name Units Minimum Maximum● A C6630 phr 60.00 95.00
B CaCO3 phr 10.00 70.00C Clay phr 10.00 50.00D Oil phr 70.00 95.00
● A fractional factorial DoE with 11 compounds only!

Dr. Hans-Joachim Graf 18
Comparison DoE versus GrafCompounder
➨Rheological Data are examined
● MV and T5 can be measured quite accurate.Both are significant with a linear model equation
Design-Expert® SoftwareMV
Color points by value ofMV:
41
18
Actual
Pre
dic
ted
Predicted vs. Actual
15.00
20.00
25.00
30.00
35.00
40.00
45.00
15.00 20.00 25.00 30.00 35.00 40.00 45.00
MV
Design-Expert® SoftwareT5
Color points by value ofT5:
5.67
3.55
Actual
Pre
dic
ted
Predicted vs. Actual
3.00
3.50
4.00
4.50
5.00
5.50
6.00
3.50 4.00 4.50 5.00 5.50 6.00
T5
Dr. Hans-Joachim Graf 19
Comparison DoE versus GrafCompounder
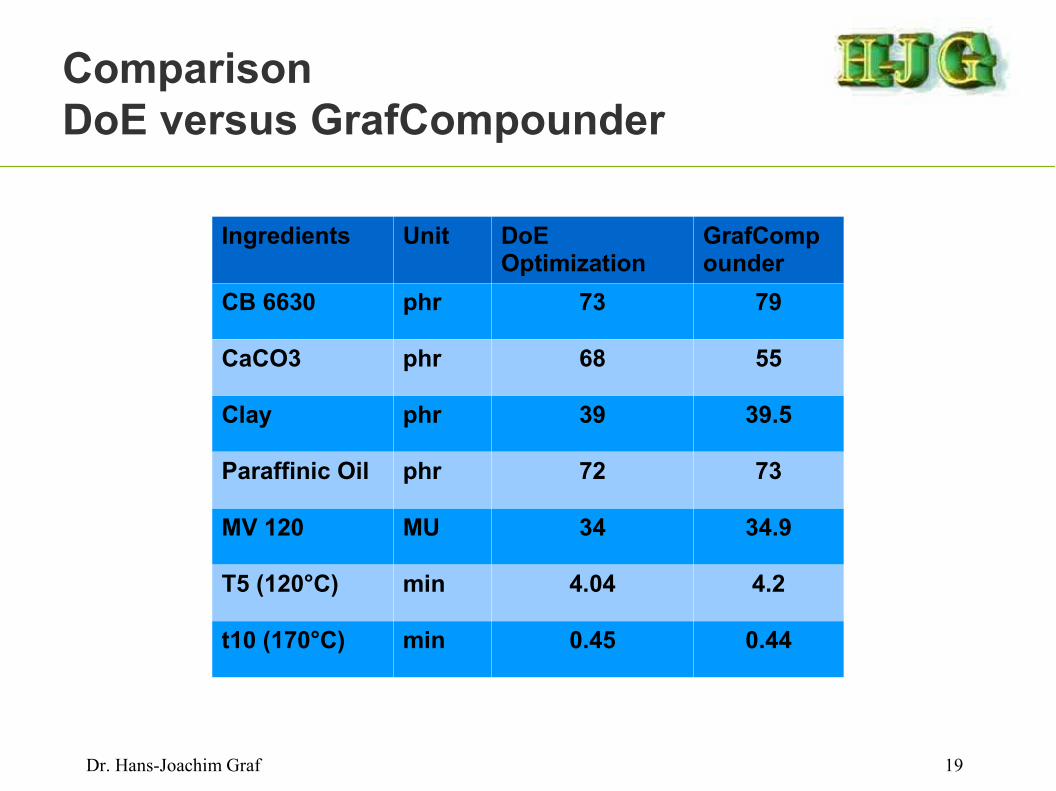
Ingredients Unit DoEOptimization
GrafCompounder
CB 6630 phr 73 79
CaCO3 phr 68 55
Clay phr 39 39.5
Paraffinic Oil phr 72 73
MV 120 MU 34 34.9
T5 (120°C) min 4.04 4.2
t10 (170°C) min 0.45 0.44

Dr. Hans-Joachim Graf 20
➨ Optimization area calculated with Design Expert
➨ Solution given by GrafCompounder
➨ With an additional boundary condition: take same amount of CB 6630 similar to Optimization Value in Design Expert
Design-Expert® SoftwareFactor Coding: ActualOverlay Plot
MVT5t10
X1 = A: C6630X2 = B: CaCO3
Actual FactorsC: Clay = 39.00D: Oil = 72.00
60.00 67.00 74.00 81.00 88.00 95.00
10.00
16.00
22.00
28.00
34.00
40.00
46.00
52.00
58.00
64.00
70.00Overlay Plot
A: C6630
B: C
aCO
3
MV: 33.274 MV: 36.000
T5: 4.000
T5: 4.200
t10: 0.448
MV: 34.291T5: 4.106t10: 0.440X1 79.03X2 54.61
Comparison DoE versus GrafCompounder

Dr. Hans-Joachim Graf 21
Comparison DoE versus GrafCompounder
Ingredients Unit DoEOptimization
GrafCompounder
CB 6630 phr 73 73
CaCO3 phr 68 61
Clay phr 39 32
Paraffinic Oil phr 72 70
MV 120 MU 34 34.1
T5 (120°C) min 4.04 4.1
t10 (170°C) min 0.45 0.45

Dr. Hans-Joachim Graf 22
➨ Optimization area calculated with Design Expert
➨ Solution given by GrafCompounderwith the additional condition(CC 6630 – 73 phr)
Design-Expert® SoftwareFactor Coding: ActualOverlay Plot
MVT5t10
X1 = A: C6630X2 = B: CaCO3
Actual FactorsC: Clay = 32.30D: Oil = 70.00
60.00 67.00 74.00 81.00 88.00 95.00
10.00
16.00
22.00
28.00
34.00
40.00
46.00
52.00
58.00
64.00
70.00Overlay Plot
A: C6630
B: C
aCO
3
MV: 34.300 MV: 36.000
T5: 3.902
T5: 4.100
t10: 0.435t10: 0.439
MV: 34.008T5: 4.032t10: 0.436X1 72.16X2 60.84
Comparison DoE versus GrafCompounder

Dr. Hans-Joachim Graf 23
Comparison DoE versus GrafCompounder
Ingredients Unit DoEOptimization
GrafCompounder
DoEPoint Prediction
CB 6630 phr 73 73 73
CaCO3 phr 68 61 61
Clay phr 39 32 32
Paraffinic Oil phr 72 70 70
MV 120 MU 34 34.1 34.2 + 3
T5 (120°C) min 4.04 4.1 4.01 + 0.25
t10 (170°C) min 0.45 0.45 0.43 + 0.07
Dr. Hans-Joachim Graf 24
Comparison DoE versus GrafCompounder
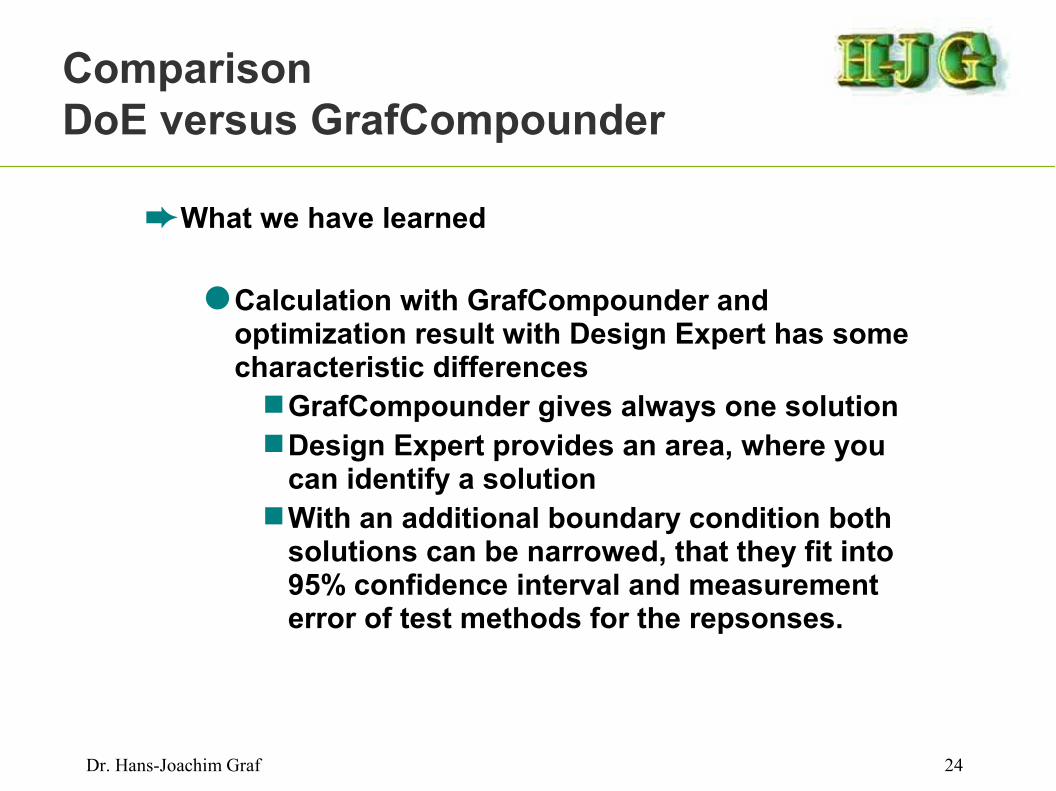
➨ What we have learned
● Calculation with GrafCompounder and optimization result with Design Expert has some characteristic differences
■ GrafCompounder gives always one solution■ Design Expert provides an area, where you
can identify a solution■ With an additional boundary condition both
solutions can be narrowed, that they fit into 95% confidence interval and measurement error of test methods for the repsonses.

Dr. Hans-Joachim Graf 25
Comparison DoE versus GrafCompounder
● 2. Example● DoE published by DuPont Dow in 1998
■ Factors: ENB, DTDC, S, MBT, TiTBD, ZdiBC, DTP■ DoE with 41 Experiments

Dr. Hans-Joachim Graf 26
DoE Analysis and Result
➨Tensile at break is significant with linear model
● Sulfur has larger influence followed by DTDC and TiBTD, but negative
➨ Elongation is significant with quadratic model, but linear model is a sufficient fit
● Sulfur has the largest influence followed by DTDC
➨ Hardness is sufficient significant with linear model as well
● Main influence Sulfur, DTDC
Design-Expert® SoftwareZD
Color points by value ofZD:
561
141
Actual
Pre
dic
ted
Predicted vs. Actual
100.00
200.00
300.00
400.00
500.00
600.00
100.00 200.00 300.00 400.00 500.00 600.00
Design-Expert® SoftwareZF
Color points by value ofZF:
14.5
6.6
Actual
Pre
dic
ted
Predicted vs. Actual
6.00
8.00
10.00
12.00
14.00
16.00
6.00 8.00 10.00 12.00 14.00 16.00
Elongation
Tensile

Dr. Hans-Joachim Graf 27
DoE Analysis and Result
➨Selection of responses for the test with graphical optimization:
● Hardness65°ShA - 70°ShA
● Tensile at break11MPa – 12 MPa
● Elongation of Break350 % - 400 %
➨Flag points to one solution
Design-Expert® SoftwareFactor Coding: ActualOverlay Plot
ZFZDHardness
X1 = A: A:ENBX2 = C: C:Sulfur
Actual FactorsB: B:DTDC = 2.11D: D:MBT = 1.01E: E:TiBTD = 1.50F: F:ZDiBC = 1.50G: G:DTP = 1.50
5.00 6.00 7.00 8.00 9.00
0.30
0.60
0.90
1.20
1.50Overlay Plot
A: A:ENB
C: C
:Sul
fur
ZF: 11.000
ZF: 12.000
ZD: 300.000
ZD: 350.000
Hardness: 67.000
ZF: 11.214ZD: 335.106Hardness: 66.470X1 5.58X2 0.44

Dr. Hans-Joachim Graf 28
DoE Analysis and Result
➨Factor values giving this result
● ENB: 5,58%● Sulfur – 0.44 phr● DTDC – 2.11 phr● MBT – 1.00 phr● TiBTD – 1.50 phr● ZdiBC – 1.50 phr● DTP – 1.50 phr
Design-Expert® SoftwareFactor Coding: ActualOverlay Plot
ZFZDHardness
X1 = A: A:ENBX2 = C: C:Sulfur
Actual FactorsB: B:DTDC = 2.11D: D:MBT = 1.01E: E:TiBTD = 1.50F: F:ZDiBC = 1.50G: G:DTP = 1.50
5.00 6.00 7.00 8.00 9.00
0.30
0.60
0.90
1.20
1.50Overlay Plot
A: A:ENB
C: C
:Sul
fur
ZF: 11.000
ZF: 12.000
ZD: 300.000
ZD: 350.000
Hardness: 67.000
ZF: 11.214ZD: 335.106Hardness: 66.470X1 5.58X2 0.44
Dr. Hans-Joachim Graf 29
DoE Analysis and Result
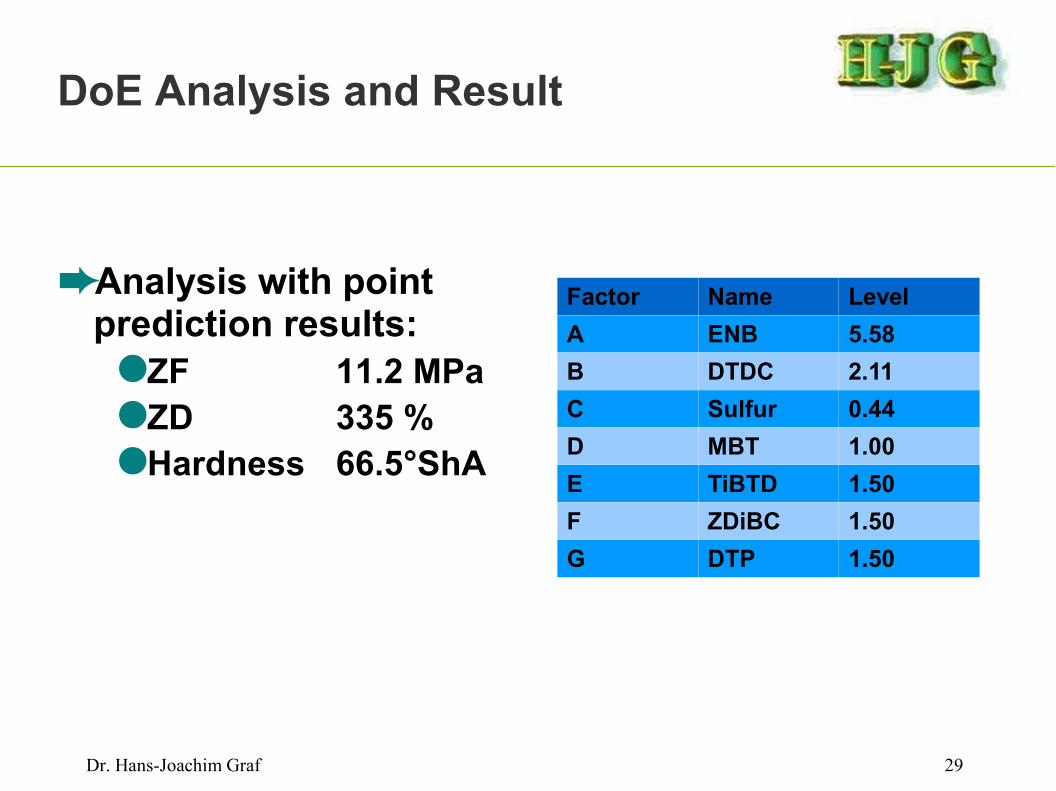
➨Analysis with point prediction results:
●ZF 11.2 MPa●ZD 335 %●Hardness 66.5°ShA
Factor Name LevelA ENB 5.58B DTDC 2.11C Sulfur 0.44D MBT 1.00E TiBTD 1.50F ZDiBC 1.50G DTP 1.50
Dr. Hans-Joachim Graf 30
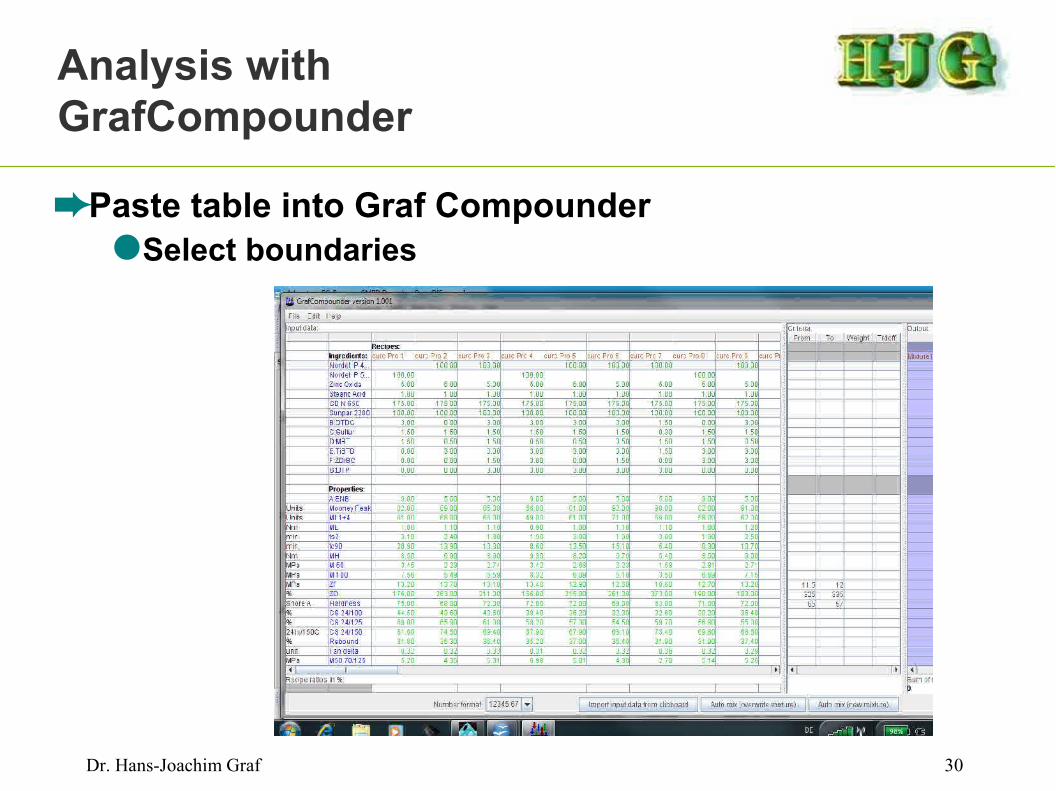
Analysis with GrafCompounder
➨Paste table into Graf Compounder● Select boundaries

Dr. Hans-Joachim Graf 31
Analysis with GrafCompounder
➨Paste table into GrafCompounder
●Select boundaries● ZF-MPa : 11.5-12.0● ZD-% : 325-335● H-°ShA : 65-67
Ingredients ResultA: ENB 6.5B:DTDC 0.98C:Sulfur 0.93D:MBT 1E:TiBTD 1.51F:ZDiBC 1.33G:DTP 1.45
ZF 11.5ZD 325Hardness 67

Dr. Hans-Joachim Graf 32
Analysis with Design Expert®
➨Run OptimizationGraphical
● Select same boundaries● ZF-MPa : 11.5-12.0● ZD-% : 325-335● H-°ShA : 65-67
Design-Expert® SoftwareFactor Coding: ActualOverlay Plot
ZFZDHardness
X1 = A: A:ENBX2 = C: C:Sulfur
Actual FactorsB: B:DTDC = 0.98D: D:MBT = 1.00E: E:TiBTD = 1.51F: F:ZDiBC = 1.33G: G:DTP = 1.44
5.00 6.00 7.00 8.00 9.00
0.30
0.60
0.90
1.20
1.50Overlay Plot
A: A:ENB
C: C
:Sul
fur
ZF: 11.498
ZF: 12.000
ZD: 325.062
ZD: 335.107
Hardness: 66.013
Hardness: 67.489

Dr. Hans-Joachim Graf 33
Compare Result Design Expert® vs GrafCompounder
Design-Expert® SoftwareFactor Coding: ActualOverlay Plot
ZFZDHardness
X1 = A: A:ENBX2 = C: C:Sulfur
Actual FactorsB: B:DTDC = 0.98D: D:MBT = 1.00E: E:TiBTD = 1.51F: F:ZDiBC = 1.33G: G:DTP = 1.44
5.00 6.00 7.00 8.00 9.00
0.30
0.60
0.90
1.20
1.50Overlay Plot
A: A:ENB
C: C
:Sul
fur ZF: 11.498
ZF: 12.000
ZD: 325.062
ZD: 335.107
Hardness: 66.013
Hardness: 67.489
ZF: 11.536ZD: 306.017Hardness: 68.146X1 6.50X2 0.98
➨ Boundary Conditions● Select boundaries● ZF-MPa : 11.5-12.0● ZD-% : 325-335● H-°ShA : 65-67
➨ The Design Expert optimization graph shows the location of the result as a yellow area, but GrafCompounder result is tagged with a flag.

Dr. Hans-Joachim Graf 34
Analysis with GrafCompounder
➨ Boundary Conditions● Select boundaries● ZF-MPa : 11.5-12.0● ZD-% : 325-335● H-°ShA : 65-67
Ingredients ResultGrafCompounder
ResultDesign Expert®
ENB 6.5 5.45C:Sulfur 0.93 0.88B:DTDC 0.98 0.98D:MBT 1 1E:TiBTD 1.51 1.51F:ZDiBC 1.33 1.33G:DTP 1.45 1.44ZF 11.5 11.5ZD 325 330Hardness 67 67.5
+) Note: Accelerators are preset!

Dr. Hans-Joachim Graf 35
Conclusion
➨Compounds in databases are type of happen stance data
●Which can not analyzed with a systematic approach today
●DoE in each case needs data based on a planned experiment.
➨GrafCompounder allows to search a database for a possible solution using targets
●At minimum you get an very good idea about the center point in a DoE