comprehensive annual financial reportfalmouthinstitute.com/files/fi099/financial clark county...
TRANSCRIPT

COMPREHENSIVEANNUAL FINANCIALREPORTJuly 1, 2014 - June 30, 2015 Las Vegas, Nevada

This page intentionally left blank

Comprehensive Annual
Financial Report
July 1, 2014 - June 30, 2015 Las Vegas, Nevada
Las Vegas-Clark County Library District7060 W. Windmill Lane
Las Vegas, Nevada 89113
Prepared by:Th e Business Offi ce of the
Las Vegas-Clark County Library District7060 W. Windmill Lane
Las Vegas, Nevada 89113
Under the direction of theDeputy Director/Chief Financial Offi cer

This page intentionally left blank

PageINTRODUCTORY SECTION
Letter of Transmittal 7Certificate of Achievement for Excellence in Financial Reporting 11Board of Trustees 12Organizational Chart 13
FINANCIAL SECTION
Independent Auditors' Report on Financial Statementsand Supplementary Information 17
Management's Discussion and Analysis 21
Basic Financial Statements:
Government-Wide Financial Statements:
Statement of Net Position 33Statement of Activities 35
Fund Financial Statements:
Balance Sheet 39Reconciliation of the Balance Sheet to
the Statement of Net Position 40Statement of Revenues, Expenditures and
Changes in Fund Balances 41Reconciliation of the Statement of Revenues, Expenditures and
Changes in Fund Balances to the Statement of Activities 42
Notes to Basic Financial Statements 45
Las Vegas-Clark County Library DistrictRAFRAFRAF
Table of ContentsFor the Fiscal Year Ended June 30, 2015

PageRequired Supplementary Information:
Schedule of Revenues, Expenditures, and Changes in FundBalance - Budget and Actual - General Fund 65
Schedule of Funding Progress - Postemployment Benefits Other Than Pensions 66
Multiple-Employer Cost-Sharing Defined Benefit Pension Plan:Proportionate Share of the Collective Net Pension Liability Information 67Proportionate Share of Statutorily Required Pension Contribution Information 68
Notes to Required Supplementary Information 69
Combining and Individual Fund Statements and Schedules:
Major Funds:
Debt Service FundSchedule of Revenues, Expenditures and Changes in Fund
Balance - Budget and Actual 77
Non-Major Funds:
Special Revenue Funds and Permanent FundCombining Balance Sheet 83Combining Statement of Revenues, Expenditures, and
Changes in Fund Balances 84Schedule of Revenues, Expenditures and Changes in Fund
Balance - Budget and Actual - Grant Fund 85Schedule of Revenues, Expenditures and Changes in Fund
Balance - Budget and Actual - Gift Fund 86
Independent Auditors' Report on Internal Control Over Financial Reporting and on Compliance and Other Matters Based on an Audit of Financial Statements Performed in Accordance with Government Auditing Standards 87
Table of Contents (continued)
Las Vegas-Clark County Library District
For the Fiscal Year Ended June 30, 2015

Table PageSTATISTICAL SECTION
Net Position by Component 1 93Changes in Net Position 2 94Fund Balances, Governmental Funds 3 95Changes in Fund Balances, Governmental Funds 4 96General Governmental Revenues by Source 5 97Principal Property Tax Payers 6 98Schedule of Property Tax Rates - Direct and Overlapping Governments 7 99Assessed and Estimated Actual Value of Taxable Property in Clark County 8 100Property Tax Levies and Collections for Clark County 9 101Ratio of Net General Bonded Debt to Assessed Value and Net
Bonded Debt per Capita 10 102Computation of Legal Debt Margin 11 103General Obligation Direct and Overlapping Government Debt 12 104Demographic Statistics - Clark County 13 105Principal Employers 14 106Full-Time Equivalent Employees by Function 15 107Circulation Summary 16 108Capital Assets Statistics by Function/Program 17 109
SINGLE AUDIT AND ACCOMPANYING INFORMATION
Independent Auditors' Report on Compliance with Requirements That Could Have a Direct andMaterial Effect on each Major Program, and on Internal Control over Compliance in Accordancewith OMB Circular A-133 and Schedule of Expenditures of Federal Awards 113
Schedule of Expenditures of Federal Awards 115
Notes to Schedule of Expenditures of Federal Awards 116
Schedule of Findings and Questioned Costs 117
Las Vegas-Clark County Library District
Table of Contents (continued)For the Fiscal Year Ended June 30, 2015

This page intentionally left blank

INTRODUCTORY SECTION

This page intentionally left blank

December 18, 2015
To the Board of Trustees and the Citizens of the City of Las Vegas and Clark County, Nevada:
Nevada Revised Statutes (NRS) 354.624(6) require the Las Vegas-Clark County Library District (the District) to submit, within six months of the close of each fiscal year, a “complete set” of financial statements presented in accordance with accounting principles generally accepted in the United States and audited by a firm of independent certified public accountants in accordance with auditing standards generally accepted in the United States and the standards applicable to financial audits contained in Government Auditing Standards, issued by the Comptroller General of the United States. Pursuant to that requirement, the Comprehensive Annual Financial Report for the District as of and for the year ended June 30, 2015, is hereby submitted.
This report consists of management's representations concerning the finances of the District. Consequently, management assumes full responsibility for the completeness and reliability of all information presented in this report. To provide a reasonable basis for making these representations, District management has established a comprehensive internal control framework that is designed, among other things, both to protect the District's assets from loss, theft, or misuse and to compile sufficient reliable information for the preparation of the District’s financial statements in conformity with accounting principles generally accepted in the United States. Because the cost of internal controls should not outweigh their benefits, the District’s comprehensive framework of internal controls has been designed to provide reasonable rather than absolute assurance that the District’s financial statements will be free from material misstatement. As management, we assert that, to the best of our knowledge and belief, this Comprehensive Annual Financial Report is complete and reliable in all material respects.
The District’s basic financial statements were audited by Piercy Bowler Taylor & Kern, Certified Public Accountants & Business Advisors. The goal of the independent audit was to provide reasonable assurance that the basic financial statements of the District as of and for the year ended June 30, 2015, are free of material misstatement. The independent audit involved examining, on a test basis, evidence supporting the amounts and disclosures in the financial statements, assessing the accounting principles used and significant estimates made by management, and evaluating the overall financial statement presentation. The independent auditors concluded, based upon the audit, that there was a reasonable basis for rendering an unqualified opinion that the District’s basic financial statements as of and for the year ended June 30, 2015, are fairly presented in all material respects in conformity with accounting principles generally accepted in the United States. The Independent Auditors’ Report on Financial Statements and Supplementary Information is presented as the first component of the financial section of this report. In addition, the Independent Auditors’ Report on Internal Control over Financial Reporting and on Compliance and Other Matters Based on an Audit of Financial Statements Performed in Accordance with Government Auditing Standards is presented as the last component of the financial section of this report.
Accounting principles generally accepted in the United States require that management provide a narrative introduction, overview, and analysis to accompany the financial statements in a specified form called Management's Discussion and Analysis (MD&A). This letter of transmittal is designed to complement the MD&A and should be read in conjunction with it. The District’s MD&A can be found immediately following the report of the independent auditors.
Profile of the District
The District was created in 1985 by the Nevada State Legislature to form a single taxing entity for the City of Las Vegas (the City) and the Clark County Library District. It replaced the Clark County Library District and has a
7

contractual arrangement with the City to operate the City’s libraries. The District serves all persons living in the 7,927 square miles of Clark County (the County) except for those living in the incorporated City of North Las Vegas and those living in areas served by the Henderson and Boulder City Library Districts.
The District is governed by a ten-member Board of Trustees (the Board), with five members appointed by the Clark County Board of Commissioners (the County Commission) and five appointed by the Las Vegas City Council (the City Council), all with staggered four-year terms of office and a two-term limit. There is no potential for the District to provide a financial benefit to, or impose a financial burden on, the City or the County. The Board is an independent policy body that is separate from the County Commission and the City Council. The Board appoints an Executive Director for the District and has exclusive policy and budget authority for the programs, activities and level of services provided by the District. The County serves in a ministerial capacity as the taxing authority, even though the District is fiscally independent of the County.
The District’s Board may propose the issuance of general obligation bonds for the purpose of acquiring, constructing or improving buildings and other real property to be used for District purposes or for purchasing books, materials or equipment for newly constructed libraries. However, the Board cannot issue bonds or any other form of indebtedness unless a public hearing on the proposal is first held before the County Commission and the City Council. After such public hearing, the County Commission and the City Council may each adopt a resolution that supports or opposes in whole or in part the District’s proposal and transmit the resolution to the Clark County Debt Management Commission for consideration. If the Clark County Debt Management Commission approves, the question of issuing the bonds must be submitted to the electorate of the District for a vote. If a majority of the electors voting on the question favors the proposal, the Board shall issue the bonds as general obligations of the District pursuant to the provisions of the Local Government Securities Law. Bonds issued for purchasing books, materials or equipment for newly constructed libraries must be redeemed within five years after issuance and bonds for construction must be redeemed within a maximum of 20 years.
The District adopts an annual budget, which serves as the foundation for financial planning and control. Prior to April 15, the District submits the tentative budget for the next fiscal year, commencing on July 1, to the Department of Taxation of the State of Nevada (the State). The City Council and the County Commission have the ability to reject the tentative budget prior to its submission to the State. The District is required to hold a public hearing on the proposed budget, conducted on the third Thursday in May, and to adopt a final budget on or before June 1. The appropriated budget controls are required, by NRS, to be exercised at the function level. The Executive Director of the District is authorized to transfer budget amounts between functions within a fund. However, Board approval is required for all transfers between funds.
The District provides broadly decentralized services through large branch libraries rather than the traditional smaller branches. Fourteen urban libraries are distributed over an area of 436 square miles in the Las Vegas metropolitan area, including Meadows Library, an outreach branch located inside the Stupak Community Center. Eleven outlying libraries serve the vast area of the County, outside the metropolitan Las Vegas area, providing library service to largely rural towns and communities over an area of 7,491 square miles.
Factors Affecting Financial Condition
Local economy. Previous recessionary effects of the national economy were not as traumatic on Las Vegas as they were on other metropolitan areas until the “Great Recession” as it is now known. The State’s economy, up until the Great Depression of 1929, relied solely on railroading, mining and ranching. To counter the effects of the Depression, the State Legislature passed legislation legalizing gambling in 1931. Today, the Las Vegas-Clark County metropolitan area enjoys a multi-faceted economy with industries that include professional services, transportation, construction, banking and finance, manufacturing, hospitality, recreation and gaming. While the resort and gaming industries (tourism) remain the mainstay of the local economy, industrial parks, retirement communities, distribution centers and light manufacturing provide a balance to the service intensity of the local economy.
However, during the Great Recession, the Las Vegas metropolitan area saw large layoffs due to drops in business income in its major local industries, which resulted in an unusually high rate of unemployment of 14%. Despite a
8

decline in the unemployment rate from 8.2% at June 2014 to the current rate of 7.3%, Las Vegas still has one of the highest unemployment rates in the nation that is well above its pre-recession lows of 4.6%.
Regardless of the fact that the Las Vegas valley is one of the top five communities in the nation for home foreclosures, it continues to see a strong uptick in the construction of new homes due to low interest rates. With low interest rates, the pricing of existing homes has been stabilizing with some modest increase in growth over the past two years. This is good news from the standpoint that revenue from property taxes has increased during the fiscal year just ended, and is now expected to increase again over the next several fiscal years.
The Las Vegas valley has also seen a steady month-over-month growth in sales tax revenues over the past year. Over the same period, tourism has shown to be resilient with an increased number of tourists visiting Las Vegas who are spending their leisure time dining and on entertainment.
Long-term financial planning. In past efforts to maintain the sustainability of District operations, permanent cuts of approximately $4.9 million were realized in prior years. The cuts included the elimination of 96 positions, reduced expenditures on library materials, and a reduction in urban branch hours from 72 per week to 60. Also, the District was able to get a two-year agreement from its employees’ unions to maintain salaries at current levels, and to decrease its union related healthcare costs over the same time period. This concession eliminated the need to make further cuts in staffing levels or to reduce its current seven-days-a-week operation.
To provide the District with a sustainable operation for the coming and subsequent fiscal years, the District had to make major cuts in expenditures over the last several years to be in line with its revenues forecasted for the next five to ten years. To continue with this effort, the District will have to closely monitor the local economy regarding housing prices and sales, consumer spending, and the local travel and tourism industry. Based on these factors, the District will make annual adjustments to its budgeted expenditures.
Other efforts include maintaining a higher ending fund balance, higher than the 5% to 10% ratio of ending fund balance to the general fund expenditures, which is considered a healthy financial cushion. The implementation of the above-mentioned measures reflects the District’s conservative and sound stewardship of resources during the past volatile economic period.
Collections for the District’s secondary funding source (consolidated sales tax) have stabilized to levels between $18 and $20 million after years of double-digit percentage decreases due to slowdowns in spending by tourists and Las Vegas locals. Accordingly, the District will continue to adjust its operating expenditures to match revised revenue forecasts.
During April 2011, the District opened the new Windmill Library and Service Center to the public and staff. This building houses a 28,879-square-foot library (which includes a 300-seat auditorium and an additional 7,354 square feet for future expansion) and an 88,257-square-foot service center, which allows for the centralization of all library support functions and a materials handling center. The construction of the Windmill Library and Service Center was secured through medium-term financing of $50 million and was completed on time and under budget.
At June 30, 2013, in keeping with the viability of its long-term planning strategy, the District transferred a combined $45 million from the general fund ($16M) and the capital projects fund ($29M) to the debt service fund to cover the remaining six years of outstanding bond payments. At June 30, 2015, the outstanding combined principal and interest balance was $30.5 million, payable over the next four years with the final payment due in 2019.
Relevant financial policies. It is the District’s policy that “one time” resource inflows not be used for operating purposes. Accordingly, the District normally maintains a general fund balance from 10% to 12% of operating expenditures. Any surplus exceeding this threshold may be transferred to the capital projects fund’s programs.
Major initiatives. The District has established capital related programs in the capital projects fund to finance the acquisition, replacement or construction of major capital projects and facilities. This fund includes seven programs to accumulate available resources that will be appropriated in subsequent budget years. These programs are the Integrated Library Systems, Technology Replacements and Upgrades, Building Repair and Maintenance, Capital Construction, Library Materials, Vehicle Purchase and Replacement, and Furniture Purchase and Replacement.
9

Awards and Acknowledgements
The Government Finance Officers Association of the United States and Canada (GFOA) awarded a Certificate of Achievement for Excellence in Financial Reporting to the Las Vegas-Clark County Library District for its Comprehensive Annual Financial Report for the fiscal year ended June 30, 2014. In order to be awarded a Certificate of Achievement, a government must publish an easily readable and efficiently organized Comprehensive Annual Financial Report. This report must satisfy both generally accepted accounting principles and applicable legal requirements.
A Certificate of Achievement is valid for a period of one year only. We believe that our current Comprehensive Annual Financial Report continues to meet the Certificate of Achievement Program’s requirements and we are submitting it to the GFOA to determine its eligibility for another certificate.
Preparation of this CAFR could not have been accomplished without the efforts and dedication of the staff of the Business Office and Marketing Departments. A special thanks to the firm of Piercy Bowler Taylor & Kern, Certified Public Accountants & Business Advisors, for its timely and professional service to the District as its independent auditors.
We wish to commend the members of the District’s Board of Trustees for their continued interest in conducting the financial operations of the District in a responsible and prudent manner.
Respectfully submitted,
Dr. Ronald R. Heezen Frederick James, CPA Executive Director Deputy Director/Chief Financial Officer
10

11

Board of Trustees
Michael SaundersChair
Randy EnceVice Chair
Marilyn Francis DrakeKeiba Crear Jose L. Melendrez
Sheila Moulton Felipe A. Ortiz
Dr. Ronald R. Heezen Executive Director
Robin Wadley-Munier
Ydoleena YturraldeSecretary
Shannon Bilbray-AxelrodTreasurer
July 2015
LIBRARY DISTRICT MISSION STATEMENT“The Las Vegas-Clark County Library District provides welcoming and inspiring spaces for reading, learning and
achieving, and the tools and resources that families, children, teens and adults need to succeed. The Library is committedto building communities of people who can come together to pursue their individual and group aspirations.”
October 2015
12

July 2013
Public Services
Note: For organizational detail, see Department Overviews.
13

This page intentionally left blank

FINANCIAL SECTION

This page intentionally left blank


MANAGEMENT’SDISCUSSION and ANALYSIS

This page intentionally left blank

Las Vegas-Clark County Library District
Management’s Discussion and Analysis For the Fiscal Year Ended June 30, 2015
______________________________________________________________________________
As management of the Las Vegas-Clark County Library District (the District), we offer readers of the Annual Financial Report this narrative overview and analysis of the financial activities of the District as of and for the fiscal year ended June 30, 2015. We encourage readers to consider the information presented here in conjunction with additional information provided in our letter of transmittal, which can be found on pages 7-10 of this report.
Financial Highlights
• The assets of the District exceeded its liabilities at the close of the most recent fiscal year by $151,382,536(net position). Of this amount, $21,924,101 (unrestricted net position) may be used to meet the District’songoing obligations to citizens and creditors.
• The District’s total net position increased by $2,341,053 (2%), which is $20,710 (1%) less than the prioryear net position increase. This decrease is primarily attributable to higher personnel expenditures in thecurrent year. The District expects to continue to experience net position increases in future years partiallyas a result of improving tax revenues and the District continuing its conservative spending practices, whichare designed to provide fiscal stability, but not to adversely affect the provision of library services.
• As of the close of the current fiscal year, the District’s governmental funds reported combined ending fundbalances of $64,289,156, a decrease of $2,645,987 (3.9%) from the prior year. Approximately 27% of thetotal fund balance ($17,156,400) is available for spending at the District’s discretion (unassigned fundbalance).
• At the end of the current fiscal year, unassigned fund balance for the general fund was $17,156,400, 34% oftotal general fund expenditures.
• The District’s general obligation debt decreased by $6,035,000 (19%) during the current fiscal year, due toscheduled bond principal payments.
Overview of the Financial Statements
This discussion and analysis is intended to serve as an introduction to the District’s basic financial statements. The District’s basic financial statements are comprised of three components: 1) government-wide financial statements, 2) fund financial statements, and 3) notes to the financial statements. This report also contains supplementaryinformation in addition to the basic financial statements themselves.
Government-wide financial statements. The government-wide financial statements are designed to provide readers with a broad overview of the District’s finances in a manner similar to a private-sector business.
The statement of net position presents information on all of the District’s assets and deferred outflows of resource and liabilities and deferred inflows of resources, with the difference reported as net position. Over time, increases or decreases in net position may serve as a useful indicator of whether the financial position of the District is improving or deteriorating.
The statement of activities presents information showing how the District’s net assets changed during the most recent fiscal year. All changes in net position are reported as soon as the underlying event giving rise to the change
21

Las Vegas-Clark County Library District
Management’s Discussion and Analysis (continued) For the Fiscal Year Ended June 30, 2015
______________________________________________________________________________
occurs, regardless of the timing of related cash flows. Thus, revenues and expenses are reported in this statement for some items that will only result in cash flows in future fiscal periods (e.g., uncollected taxes and earned but unused vacation leave).
Both of the government-wide financial statements present the governmental activities of the District, which are principally supported by property taxes and intergovernmental revenues.
The government-wide financial statements can be found on pages 11-13 of this report.
Fund financial statements. A fund is a grouping of related accounts that is used to maintain accounting control over resources that have been segregated for specific activities or objectives. The District, like other state and local governments, uses fund accounting to ensure and demonstrate compliance with finance-related legal requirements. All of the funds of the District are categorized as governmental funds. The District does not currently maintain any proprietary or fiduciary funds.
Governmental funds. Governmental funds are used essentially to account for the same functions reported as governmental activities in the government-wide financial statements. However, unlike the government-wide financial statements, fund financial statements focus on near-term inflows and outflows of expendable resources, as well as on balances of expendable resources available at fiscal year end. Such information may be useful in evaluating the District’s near-term financing requirements.
Because the focus of fund financial statements is narrower than that of the government-wide financial statements, it is useful to compare the information presented for governmental funds with similar information presented for governmental activities in the government-wide financial statements. By doing so, readers may better understand the long-term impact of the District’s near-term financing decisions. Both the balance sheet and the statement of revenues, expenditures and changes in fund balances provide a reconciliation to facilitate this comparison between governmental funds and governmental activities.
The District maintains seven governmental funds. Information is presented separately in the balance sheet and in the statement of revenues, expenditures and changes in fund balances for the general, debt service and capital projects funds, all of which are considered to be major funds. Data from the remaining four non-major governmental funds is combined into a single, aggregated presentation. Individual fund data for each of these non-major governmental funds is provided in the form of combining statements elsewhere in this report.
The fund financial statements can be found on pages 15-18 of this report.
Notes to basic financial statements. The notes provide additional information that is essential to a full understanding of the data provided in the government-wide and fund financial statements.
The notes to basic financial statements can be found on pages 19-36 of this report.
Required supplementary information. In addition to the basic financial statements and accompanying notes, this report also presents certain required supplementary information. The District adopts an annual appropriated budget for its general fund and a budgetary comparison schedule has been provided to demonstrate the District’s compliance with this budget. This section also includes certain information related to the District’s net pension liability and other postemployment benefit obligations.
22

Las Vegas-Clark County Library District
Management’s Discussion and Analysis (continued) For the Fiscal Year Ended June 30, 2015
______________________________________________________________________________
The required supplementary information can be found on pages 37-41 of this report.
Other information. The combining statements referred to earlier in connection with the four non-major governmental funds are presented immediately following the required supplementary information.
The combining statements and individual fund schedules can be found on pages 43-48 of this report.
Government-wide Financial Analysis
As previously noted, net position may serve as a useful indicator over time of a government’s financial position. In the case of the District, at the close of the most recent fiscal year, assets exceeded liabilities by $151,382,536.
By far, the largest portion of the District’s net position (68%) is its investment in capital assets (land, buildings, improvements, library media materials, and furniture and equipment), less any related debt used to acquire these assets, which are used to provide services to citizens; consequently, these assets are not available for future expenditures. Although the District’s investment in its capital assets is reported net of related debt, it should be noted that the resources needed to repay this debt must be provided from other sources since the capital assets themselves cannot be used to liquidate these liabilities.
Las Vegas-Clark County Library District Net Position
June 30, 2015 2014
(Restated) Capital assets $ 156,551,393 $ 158,654,218 Other assets 68,752,934 71,536,213
225,304,327 230,190,431
Deferred outflows of resources 5,500,569 5,000,442
Long-term liabilities outstanding 57,992,429 73,426,091 Other liabilities 12,556,575 12,723,299
70,549,004 83,149,390
Deferred inflows of resources 8,873,356
Net position: Net investment in capital assets 129,077,870 124,927,270 Restricted 380,565 461,109 Unrestricted 21,924,101 23,653,104
$ 151,382,536 $ 149,041,483
Resources that are subject to external restrictions on how they may be used represent an additional portion of the District’s net assets (0.2%). The remaining balance of unrestricted net assets ($21,924,101) may be used to meet the District’s ongoing obligations.
At the current fiscal year end, the District has positive balances in all three categories of net assets. The same situation was true for the prior fiscal year.
23

Las Vegas-Clark County Library District
Management’s Discussion and Analysis (continued) For the Fiscal Year Ended June 30, 2015
______________________________________________________________________________
There was an increase of $4,150,600 (3.3%) in net investment in capital assets. This increase resulted from normal business operations and depreciation. See the discussion on capital assets for further explanations.
Governmental activities. Governmental activities increased the District’s net position by $2,341,053 (2%). Key elements of this increase are as follows:
Las Vegas-Clark County Library District Changes in Net Position
Year Ended June 30, 2015 2014
Revenues: Program revenues: Charges for services $ 1,912,010 $ 1,995,572 Operating grants and contributions 1,040,401 901,829 General revenues: Property taxes 36,689,006 36,548,070 Intergovernmental consolidated taxes 19,457,174 18,345,024 Other 707,548 532,521
59,806,139 58,323,016
Expenses: Culture and recreation 56,210,061 54,507,423 Long-term debt interest 1,255,025 1,453,830
57,465,086 55,961,253
Change in net position 2,341,053 2,361,763
Net position, beginning of year, as previously reported 187,453,307 185,091,544 Adjustment (38,411,824) . Net position, beginning of year, as adjusted 149,041,483 185,091,544
Net position, end of year $ 151,382,536 $ 187,453,307
• Operating grants and contributions increased by $138,572 (15%) due to normal variations in the types ofgrants received by the District.
• Property taxes increased $140,936 (0.4%) while intergovernmental consolidated taxes increased$1,112,150 (6%). The increase in property taxes in Southern Nevada is primarily due to recoveringproperty values and the effect of a statutory limit on the increase of property taxes in any single year. Theincrease in intergovernmental consolidated taxes is due to increased consumer spending (tourist and local).
• Other revenues increased $175,027 (33%) due primarily to an increase in investment interest.
• Culture and recreation expenses increased $1,702,638 (3%). This change can be primarily attributed toincreases in personnel costs ($613,630), services and supplies ($488,178) and depreciation ($600,834).
• Interest expense relative to long-term debt decreased $198,805 (14%) primarily due to decreasing interestas bonds approach retirement.
24

Las Vegas-Clark County Library District
Management’s Discussion and Analysis (continued) For the Fiscal Year Ended June 30, 2015
______________________________________________________________________________
Financial Analysis of the District’s Funds
As noted earlier, the District uses fund accounting to better ensure and demonstrate compliance with finance-related legal requirements.
The focus of the District’s governmental funds is to provide information on near-term inflows, outflows, and balances of expendable resources. Such information is useful in assessing the District’s financing requirements. In particular, unassigned fund balance may serve as a useful measure of the District’s net resources available for spending at fiscal year end.
Other Taxes 32.5%
Charges for Services
3.2%
Property Taxes 61.4%
Other Revenues 1.2%
Operating Grants and Contributions
1.7%
Revenues by Source
Culture and Recreation
Interest on Long-term Debt
Expenses and Program Revenues
Program Revenues
Expenses
25

Las Vegas-Clark County Library District
Management’s Discussion and Analysis (continued) For the Fiscal Year Ended June 30, 2015
______________________________________________________________________________
At June 30, 2015, the District’s governmental funds reported combined ending fund balances of $64,289,156, a decrease of $2,645,987 (3.9%) from the prior year. Approximately 27% of the total fund balance ($17,156,400) constitutes unassigned fund balance, which is available for spending at the District’s discretion. The remainder of the combined ending fund balances is not available for spending because it has already been restricted or assigned to 1) pay debt service ($30,643,644), 2) the acquisition, construction or improvement of capital assets ($16,108,547),3) grant and other programs ($370,565), or 4) generate income to pay for the purchase of library media materials($10,000).
The general fund is the chief operating fund of the District. At June 30, 2015, the fund balance of the general fund was $17,156,400. As a measure of the general fund’s liquidity, it may be useful to compare fund balance to total fund expenditures. Unassigned fund balance represents 34% of total general fund expenditures.
The fund balance of the District’s general fund decreased by $736,841 (4%) during the current fiscal year. The change in fund balance is primarily due to increases in personnel costs, services and supplies expenditures and transfers to other funds, which were offset by increases in intergovernmental consolidated taxes.
The debt service fund has a total fund balance of $30,643,644, all of which is assigned for the payment of debt service. The decrease in fund balance during the current year in the debt service fund was $7,304,750 (19%) from the prior year, due to normal debt interest and principal payments.
The capital projects fund has a total fund balance of $16,108,547. The net increase in fund balance during the current year in the capital projects fund was $5,476,148 (52%) from the prior year. The primary reason for the increase was transfers from other funds.
The aggregate non-major funds have a combined total fund balance of $380,565. The net decrease in fund balance during the current year in the aggregate non-major funds was $80,544 (17%) from the prior year, and was due to increased spending in the expendable trust fund.
General Fund Budgetary Highlights
During the year, revenues were more than the final budgetary estimate by $790,876 (1.4%) primarily due to higher property tax and intergovernmental consolidated tax collections, and expenditures were less than the final budgetary estimate by $4,441,097 (8%), primarily due to the District’s conservative spending practices. All functions were within appropriation authority. Actual ending fund balance was $10,654,001 (164%) more than the final budgetary estimate.
Additional information on the District’s general fund budget can be found on pages 24-25, 37 and 41 of this report.
Capital Asset and Debt Administration
Capital assets. The District’s investment in capital assets as of June 30, 2015, amounts to $156,551,393 (net of accumulated depreciation). This investment in capital assets includes land, buildings, improvements, library media materials, and furniture and equipment. The net decrease in the District’s investment in capital assets for the current fiscal year was $2,102,825 (1.3%).
26

Las Vegas-Clark County Library District
Management’s Discussion and Analysis (continued) For the Fiscal Year Ended June 30, 2015
______________________________________________________________________________
Major capital asset events during the current fiscal year included the following:
• Construction in progress additions were purchased at a cost of $56,246 for the construction of newbuildings.
• The District purchased library media materials, at a cost of $7,907,903, an increase of $566,022 from theprior fiscal year purchases.
• Furniture and equipment additions were purchased at a cost of $494,414.
• Depreciation expense for the fiscal year was $10,552,325.
Capital assets at year end were as follows:
Las Vegas-Clark County Library District Capital Assets (net of accumulated depreciation)
June 30, 2015 2014
Land $ 4,396,578 $ 4,396,578 Construction in progress 56,246 Buildings 97,914,669 100,632,368 Improvements 428,115 657,407 Library media materials 48,622,517 46,840,656 Furniture and equipment 5,133,268 6,127,209
$ 156,551,393 $ 158,654,218
Additional information on the District’s capital assets can be found on pages 22 and 28 of this report.
Long-term debt. At June 30, 2015, the District had total bonded debt outstanding of $27,055,000, all of which is backed by the full faith and credit of the District.
Las Vegas–Clark County Library District Outstanding Debt General Obligation Bonds
June 30, 2015 2014
Bond issue series: 2009 $ 27,055,000 $ 33,090,000
The District’s total long-term debt decreased by $6,035,000 (18%), as a result of repayments made during the current fiscal year. All of the District’s general obligation bonds were issued with AAA and AA ratings.
State statutes limit the amount of general obligation debt the District may issue to 10% of its total assessed valuation. The current debt limitation for the District is $203,302,408, which is significantly in excess of the District’s outstanding general obligation debt.
Additional information on the District’s long-term debt can be found on pages 23 and 29 of this report.
27

Las Vegas-Clark County Library District
Management’s Discussion and Analysis (continued) For the Fiscal Year Ended June 30, 2015
______________________________________________________________________________
Economic Factors and Next Year’s Budgets and Rates
• The unemployment rate for Clark County is currently 7%, which is a decrease from a rate of 7.9% a yearago. The United States national average unemployment rate is 5.5% and the State’s average unemploymentrate is 6.9%.
• Inflationary trends in the District are comparable to the United States national indices.
• Businesses, within Clark County, reported taxable sales of $3.27 billion, an increase from sales of $3.08billion reported in the previous year.
• Gaming establishments, within Clark County, reported gaming revenues of $709.6 million, a 10.2%decrease from the $790.4 million reported in the prior fiscal year.
All of these factors were considered in preparing the District’s budget for the 2016 fiscal year.
The unassigned fund balance (actual) in the general fund increased 4% to $17,156,400 from the prior year. This amount is $10,654,001 higher than the final budgeted ending fund balance for the 2015 fiscal year.
Requests for Information
The accompanying financial report is designed to provide a general overview of the District’s finances for all those with an interest. Questions concerning any of the information provided in this report or requests for additional financial information should be addressed to the District’s Business Office, 7060 West Windmill Lane, Las Vegas, Nevada 89113.
28

BASIC FINANCIAL STATEMENTS

This page intentionally left blank

GOVERNMENT-WIDEFINANCIAL STATEMENTS

This page intentionally left blank

ASSETSCash and cash equivalents:
Unrestricted 19,585,362$ Restricted 10,000
Investments 43,493,271 Receivables:
Taxes 1,224,324 Interest 95,590 Other, net 146,484
Due from other governments 3,550,576 Prepaid items 647,327 Property and equipment, net of accumulated depreciation:
Land 4,396,578 Construction in progress 56,246 Buildings 97,914,669 Improvements 428,115 Library media materials 48,622,517 Furniture and equipment 5,133,268
Total assets 225,304,327
DEFERRED OUTFLOWS OF RESOURCESDeferred amounts related to pensions 5,500,569
LIABILITIESAccounts payable 1,510,509 Accrued payroll 1,593,860 Deposits payable 101,300 Accrued interest payable 676,375 General obligation bonds payable, including unamortized premiums:
Due within one year 6,280,000 Due in more than one year 21,193,523
Accrued compensated absences:Due within one year 2,394,531 Due in more than one year 2,194,078
Obligation for postemployment benefits other than pensions, due in more than one year 198,165 Net pension liability, due in more than one year 34,406,663
Total liabilities 70,549,004
Governmental Activities
Las Vegas-Clark County Library District
Statement of Net PositionJune 30, 2015
33

DEFERRED INFLOWS OF RESOURCESDeferred amounts related to pensions 8,873,356
NET POSITIONNet investment in capital assets 129,077,870 Restricted for:
Grant programs 146,753 Other programs 223,812 Permanent fund principal, nonexpendable 10,000
Unrestricted 21,924,101
Total net position 151,382,536$
Las Vegas-Clark County Library District
Statement of Net Position (Continued)June 30, 2015
Governmental Activities
34
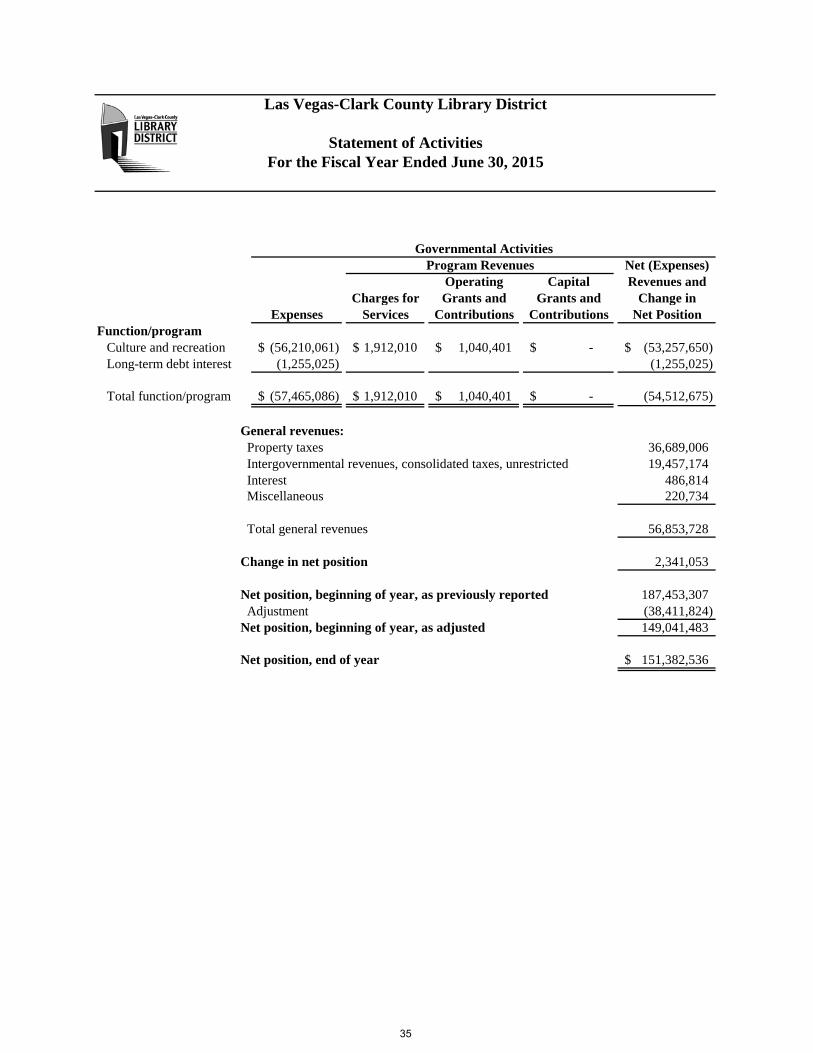
Net (Expenses)Operating Capital Revenues and
Charges for Grants and Grants and Change inExpenses Services Contributions Contributions Net Position
Function/programCulture and recreation (56,210,061)$ 1,912,010$ 1,040,401$ -$ (53,257,650)$ Long-term debt interest (1,255,025) (1,255,025)
Total function/program (57,465,086)$ 1,912,010$ 1,040,401$ -$ (54,512,675)
General revenues:Property taxes 36,689,006 Intergovernmental revenues, consolidated taxes, unrestricted 19,457,174 Interest 486,814 Miscellaneous 220,734
Total general revenues 56,853,728
Change in net position 2,341,053
Net position, beginning of year, as previously reported 187,453,307 Adjustment (38,411,824)
Net position, beginning of year, as adjusted 149,041,483
Net position, end of year 151,382,536$
Program Revenues
Las Vegas-Clark County Library District
Statement of ActivitiesFor the Fiscal Year Ended June 30, 2015
Governmental Activities
35

This page intentionally left blank

FUND FINANCIALSTATEMENTS

This page intentionally left blank

AggregateDebt Capital Non-Major
General Service Projects Funds TotalASSETS
Cash and cash equivalents:Unrestricted 11,196,435$ 4,771,756$ 3,353,021$ 264,150$ 19,585,362$ Restricted 10,000 10,000
Investments 4,428,584 25,828,221 13,236,466 43,493,271 Receivables:
Taxes 1,203,775 20,549 1,224,324 Interest 14,627 49,611 31,352 95,590 Other, net 89,685 56,799 146,484
Due from other governments 3,418,182 132,394 3,550,576
Total assets 20,351,288$ 30,670,137$ 16,620,839$ 463,343$ 68,105,607$
LIABILITIESAccounts payable 949,523$ 6,028$ 512,292$ 42,666$ 1,510,509$ Accrued payroll 1,553,748 40,112 1,593,860 Deposits payable 101,300 101,300
Total liabilities 2,604,571 6,028 512,292 82,778 3,205,669
DEFERRED INFLOWSOF RESOURCESUnavailable revenue,
property taxes 590,317 20,465 610,782
FUND BALANCESNonspendable:
Permanent fund principal 10,000 10,000 Restricted for:
Grant programs 146,753 146,753 Other programs 223,812 223,812
Assigned to:Capital projects 16,108,547 16,108,547 Debt service 30,643,644 30,643,644
Unassigned 17,156,400 17,156,400
Total fund balances 17,156,400 30,643,644 16,108,547 380,565 64,289,156
Total liabilities, deferredinflows of resources and fund balances 20,351,288$ 30,670,137$ 16,620,839$ 463,343$ 68,105,607$
Major Funds
Las Vegas-Clark County Library District
Balance SheetJune 30, 2015
Governmental Funds
39

Fund balances 64,289,156$
Amounts reported in the statement of net positionare different because:
Capital assets used in governmental activities are notcurrent financial resources; and therefore, arenot reported in governmental funds:
Capital assets 242,024,174$ Less accumulated depreciation (85,472,781) 156,551,393
Long-term liabilities, including bonds payable, are notdue and payable in the current period; and therefore,are not reported in governmental funds:
Bonds payable (27,055,000) Bond interest payable (676,375) Unamortized bond premiums (418,523) (28,149,898)
Compensated absences (4,588,609) Obligation for postemployment benefits other than pensions (198,165)
Net pension liability (34,406,663) Deferred outflows of resources related to pensions 5,500,569 Deferred inflows of resources related to pensions (8,873,356) (37,779,450)
Prepaid items represent current fund expenditures thatbenefit future periods; and therefore, are not reported ingovernmental funds. 647,327
Unavailable revenue represents amounts that are not availableto fund current expenditures; and therefore, are notreported as revenues in governmental funds. 610,782
Net position 151,382,536$
Las Vegas-Clark County Library District
Reconciliation of the Balance Sheetto the Statement of Net Position
June 30, 2015
40

AggregateDebt Capital Non-Major
General Service Projects Funds TotalRevenues
Property taxes 36,724,582$ 2,092$ 36,726,674$ Intergovernmental revenues,
consolidated taxes 19,457,174 19,457,174 Grants 865,263$ 865,263 Charges for services 1,912,010 1,912,010 Interest 14,165 353,783 118,866$ 486,814 Contributions 175,138 175,138 Miscellaneous 217,945 2,789 220,734
Total revenues 58,325,876 355,875 118,866 1,043,190 59,843,807
ExpendituresCulture and recreation:
Salaries and wages 24,798,416 271,992 25,070,408 Employee benefits 8,746,263 117,896 8,864,159 Supplies and services 9,479,987 31,475 2,348,079 607,973 12,467,514 Capital outlay 7,938,051 394,639 125,873 8,458,563
Debt service:Principal 6,035,000 6,035,000 Interest 1,594,150 1,594,150
Total expenditures 50,962,717 7,660,625 2,742,718 1,123,734 62,489,794
Excess (deficiency) of revenuesover (under) expenditures 7,363,159 (7,304,750) (2,623,852) (80,544) (2,645,987)
Other financing sources (uses)Transfers in 8,100,000 8,100,000 Transfers out (8,100,000) (8,100,000)
Net change in fund balances (736,841) (7,304,750) 5,476,148 (80,544) (2,645,987)
Fund balances, beginning of year 17,893,241 37,948,394 10,632,399 461,109 66,935,143
Fund balances, end of year 17,156,400$ 30,643,644$ 16,108,547$ 380,565$ 64,289,156$
Major Funds
Las Vegas-Clark County Library District
Statement of Revenues, Expendituresand Changes in Fund Balances
For the Fiscal Year Ended June 30, 2015
Governmental Funds
41
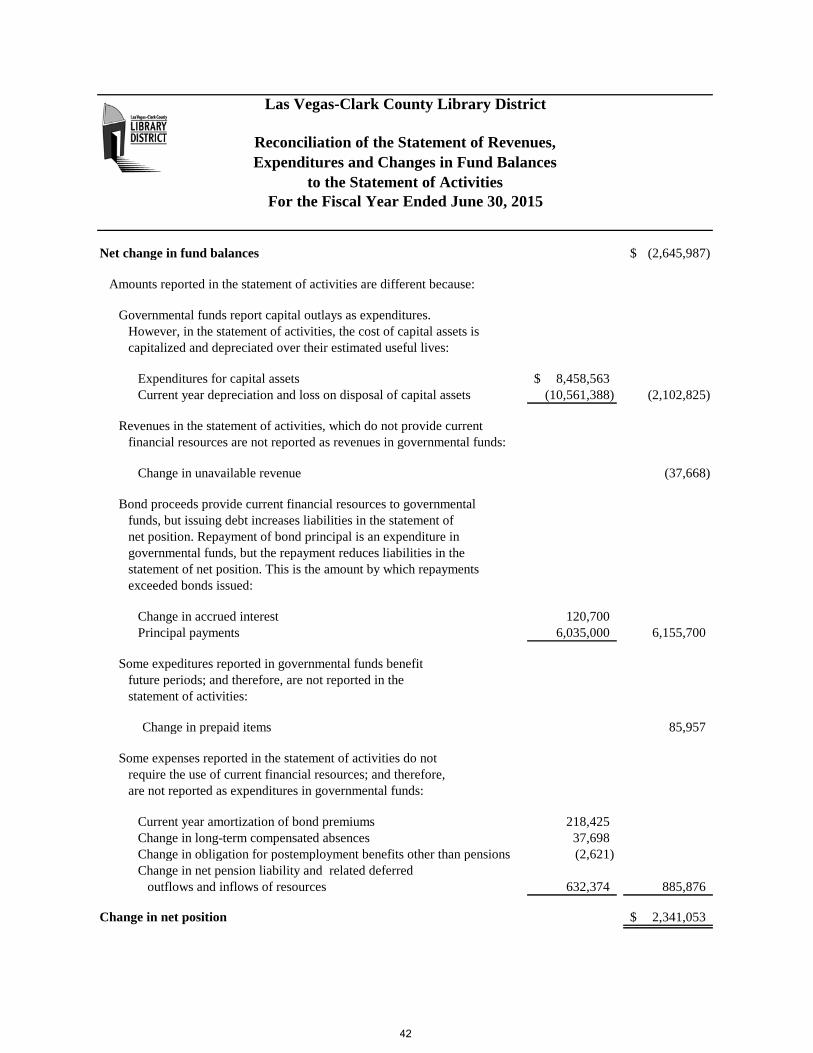
Net change in fund balances (2,645,987)$
Amounts reported in the statement of activities are different because:
Governmental funds report capital outlays as expenditures.However, in the statement of activities, the cost of capital assets iscapitalized and depreciated over their estimated useful lives:
Expenditures for capital assets 8,458,563$ Current year depreciation and loss on disposal of capital assets (10,561,388) (2,102,825)
Revenues in the statement of activities, which do not provide currentfinancial resources are not reported as revenues in governmental funds:
Change in unavailable revenue (37,668)
Bond proceeds provide current financial resources to governmentalfunds, but issuing debt increases liabilities in the statement ofnet position. Repayment of bond principal is an expenditure ingovernmental funds, but the repayment reduces liabilities in thestatement of net position. This is the amount by which repaymentsexceeded bonds issued:
Change in accrued interest 120,700 Principal payments 6,035,000 6,155,700
Some expeditures reported in governmental funds benefitfuture periods; and therefore, are not reported in thestatement of activities:
Change in prepaid items 85,957
Some expenses reported in the statement of activities do notrequire the use of current financial resources; and therefore,are not reported as expenditures in governmental funds:
Current year amortization of bond premiums 218,425 Change in long-term compensated absences 37,698 Change in obligation for postemployment benefits other than pensions (2,621) Change in net pension liability and related deferred
outflows and inflows of resources 632,374 885,876
Change in net position 2,341,053$
Reconciliation of the Statement of Revenues,Expenditures and Changes in Fund Balances
to the Statement of Activities
Las Vegas-Clark County Library District
For the Fiscal Year Ended June 30, 2015
42

NOTES TO BASIC FINANCIAL STATEMENTS

This page intentionally left blank

Las Vegas-Clark County Library District
Notes to Basic Financial Statements For the Fiscal Year Ended June 30, 2015
______________________________________________________________________________
Note 1. Summary of Significant Accounting Policies
The Reporting Entity
The Las Vegas-Clark County Library District (the District) was established in 1985 under the provisions of Chapter 379 of the Nevada Revised Statutes (NRS) and serves all persons living in Clark County, Nevada (the County), except for those living in the incorporated area of North Las Vegas and the library districts of Henderson and Boulder City, Nevada. The District is governed by a Board of Trustees (the Board), which consists of ten members, five appointed by the Board of County Commissioners and five appointed by the Las Vegas City Council, all of whom have staggered terms of office and may be removed for cause at any time.
Governmental Accounting Standards Board (GASB) Statement No. 14, The Financial Reporting Entity, as amended by Statement No. 39, Determining Whether Certain Organizations are Component Units and Statement No. 61, The Financial Reporting Entity: Omnibus, defines the reporting entity as the primary government and those component units for which the primary government is financially accountable and other organizations for which the nature and significance of their relationship with the primary government is such that exclusion would cause the reporting entity’s financial statements to be misleading or incomplete. Financial accountability is defined as the appointment of a voting majority of the organization’s governing board, and either the ability of the primary government to impose its will on the organization or the possibility that the organization will provide a financial benefit to or impose a financial burden on the primary government. In addition to financial accountability, component units can be other organizations in which the economic resources received or held by that organization are entirely or almost entirely for the direct benefit of the primary government, the primary government is entitled to or has the ability to otherwise access a majority of the economic resources received or held by that organization and the resources to which the primary government is entitled or has the ability to otherwise access are significant to the primary government.
The District has complied with GASB Statement Nos. 14, 39 and 61 by examining its position relative to the County and the City of Las Vegas (the City) and determined that there are no requirements that would cause the basic financial statements of the District to be included in either of the entities’ comprehensive annual financial reports (CAFR). The Las Vegas-Clark County Library District Foundation, Inc. (the Foundation), a Nevada Non-Profit Corporation, was formed in 2002 for the exclusive purpose of providing aid, support, and assistance in the promotion, growth, and improvement of the District. Although the District expects to receive a future financial benefit from the Foundation, the District is not required to provide financial support to the Foundation, does not appoint a voting majority of the members of the Foundation’s Board of Directors or have the ability to otherwise control or impose its will on the Foundation, does not have immediate access to the Foundation’s resources, and the Foundation’s resources are not significant to the District. Therefore, the Foundation is not considered to be and is not reported as a component unit of the District. Furthermore, no other entities were determined to be component units of the District.
Basic Financial Statements
The government-wide financial statements include a statement of net position and a statement of activities and present consolidated information for the District’s nonfiduciary activities, which are comprised of governmental activities and are accounted for in governmental fund types. The effect of interfund activity has been removed from these statements. The District does not currently maintain any business or fiduciary fund types.
Included in the statement of net position are capital assets and long-term liabilities including general obligation bonds, employee benefit and pension obligations and compensated absences. Net position is classified as 1) net investment in capital assets, 2) restricted, or 3) unrestricted.
45

Las Vegas-Clark County Library District
Notes to Basic Financial Statements (continued) For the Fiscal Year Ended June 30, 2015
______________________________________________________________________________
The statement of activities demonstrates the degree to which the direct expenses of a given function or segment are offset by program revenues. Direct expenses are those that are clearly identifiable with a specific function or segment. Program revenues include 1) charges to customers or applicants who purchase, use, or directly benefit from goods, services, or privileges provided by a given function or segment, and 2) grants and contributions, which are restricted to meeting the operational or capital requirements of a particular function or segment. Taxes and other revenues not restricted for use by a particular function or segment are reported as general revenues. Separate fund financial statements are provided with each major individual governmental fund reported in a separate column. Fund financial statements include a balance sheet and a statement of revenues, expenditures and changes in fund balances. Schedules are presented to reconcile fund balances presented in the fund financial statements to net position presented in the government-wide financial statements. Measurement Focus, Basis of Accounting, and Financial Statement Presentation Government-wide Financial Statements The government-wide financial statements are presented using the economic resources measurement focus and the accrual basis of accounting. Revenues are recorded when earned and expenses are recorded when a liability is incurred, regardless of the timing of the related cash flows. Property taxes are recognized as revenues in the year for which they are levied. Grants and similar items are recognized as revenue as soon as all eligibility requirements imposed by the provider have been met. Fund Financial Statements The fund financial statements are reported using the current financial resources measurement focus and the modified accrual basis of accounting. Revenues are recognized in the accounting period in which they become both measurable and available. Revenues are considered to be available when they are collectible within the current period or soon enough thereafter to pay liabilities of the current period. For this purpose, the District considers revenues to be available if they are collected within 60 days of the current fiscal year end. The primary revenue sources, which have been treated as susceptible to accrual by the District, are property taxes, intergovernmental consolidated taxes, grants and interest. All other revenue sources are considered to be measurable and available only when cash is received by the District. Expenditures generally are recorded when the liability is incurred, as under accrual accounting. However, debt service expenditures, as well as expenditures related to compensated absences, obligations for pensions and other postemployment benefits, and claims and judgments are recorded only when payment is due. The District classifies and reports the following as major governmental funds:
General Fund – The general fund is the general operating fund of the District. It is used to account for all financial resources except those required to be accounted for in another fund.
Debt Service Fund – The debt service fund is used to account for the accumulation of resources for and the
payment of general long-term debt principal, interest and related costs. Capital Projects Fund – The capital projects fund is used to account for financial resources to be used for
the improvement, acquisition or construction of major capital assets.
46

Las Vegas-Clark County Library District
Notes to Basic Financial Statements (continued) For the Fiscal Year Ended June 30, 2015
______________________________________________________________________________
Additionally, the District reports the following governmental fund types:
Special Revenue Funds – The special revenue funds are used to account for the proceeds of specific revenue sources that are legally or otherwise restricted to expenditures for specific purposes (other than capital projects and debt service).
Permanent Fund – The permanent fund accounts for financial resources that are legally restricted to the extent that only earnings, and not principal, may be used for purposes that support the District’s programs. Pursuant to the trust agreement, the earnings of this fund are restricted for the purchase of library media materials.
The District has no nongovernmental fund types.
Assets, Liabilities, and Net Position or Fund Balance
Deposits and Investments
The District’s cash equivalents are considered to be short-term investments with original maturities of three months or less from the date of acquisition.
Investments are stated at fair value as determined by quoted market prices, regardless of the length of time remaining to maturity.
Receivables, Payables and Transfers
During the course of operations, individual funds engage in numerous transactions with one another for goods provided or services rendered. The resulting payables and receivables that are outstanding at year end are reported as due to/from other funds. Transactions that constitute reimbursements to a fund for expenditures initially made from it that are properly applicable to another fund, are recorded as expenditures in the reimbursing fund and as reductions of expenditures in the fund that is reimbursed.
Upon the certification of tax rates by the State of Nevada (the State) Tax Commission, the County Commission levies the tax rate for the fiscal period beginning with the succeeding July 1. Effective upon the tax levy on July 1 each year, a perpetual lien is recorded against the property assessed until the tax and any penalty charges and interest, which may accrue thereon, are paid. The County Assessor assesses all real and personal property and the County Treasurer bills and collects the District’s share of property taxes. Real property taxes are due on the third Monday in August of each year and may be paid in quarterly installments on or before the third Monday in August and first Mondays in October, January and March. In the event of nonpayment, the County Treasurer is authorized to hold the property for two years, subject to redemption upon payment of taxes, penalties and costs, together with interest from the date the taxes were due until paid. If delinquent taxes are not paid within the two-year redemption period, the County Treasurer obtains a deed to the property free of all encumbrances. Upon receipt of a deed, the County Treasurer may sell the property to satisfy the tax lien. The County Treasurer remits on a monthly basis current and delinquent property tax collections to the District.
Property taxes receivable that are not expected to be collected within 60 days of year end are classified as unavailable revenue in the fund financial statements rather than current revenue since the asset is not available to satisfy current obligations. Unearned revenues arise when the District receives resources before it has a legal claim to them as when property taxes for the following tax year are received before year end. Other receivables are shown net of an allowance for uncollectible amounts.
47

Las Vegas-Clark County Library District
Notes to Basic Financial Statements (continued) For the Fiscal Year Ended June 30, 2015
______________________________________________________________________________
Restricted Assets
Financial resources that are legally restricted to the extent that only earnings, and not principal, may be used are reported as restricted assets in both the government-wide and fund financial statements.
Prepaid Items
Certain payments to vendors reflect costs applicable to future periods and are recorded as expenditures in the fund financial statements and as prepaid items in the government-wide financial statements. In the fund financial statements, prepaid items are recorded as expenditures when purchased rather than when consumed.
Capital Assets
Capital assets are reported only in the government-wide financial statements. These assets include land, buildings, library media materials, furniture and equipment, and construction in progress. All purchased capital assets are valued at cost where historical records are available and, where no historical records exist, at estimated historical cost. Donated capital assets are valued at their estimated fair value on the date received. The District has a capitalization threshold of $5,000.
The cost of normal maintenance and repairs that do not significantly increase the functionality of the assets or materially extend the assets’ lives are not capitalized. Major outlays for capital assets and improvements are capitalized as the projects are constructed.
Capital assets are depreciated using the straight-line method over the following estimated useful lives:
Assets Years
Buildings and improvements 5-50 Library media materials 5 Furniture and equipment 5-20
Compensated Absences
It is the District’s policy to permit employees to accumulate earned vacation and sick leave benefits that would be paid to them upon separation from District service if not previously taken. Accrued vacation and sick leave are reported in the government-wide financial statements. A liability for compensated absences is reported in the fund financial statements only to the extent that payment is due, for example, as a result of employee resignations and retirements prior to year end. Expenditures for compensated absences are recognized by the applicable fund when paid.
Deferred Compensation Plan
The District offers its employees a deferred compensation plan (the Plan) created in accordance with Internal Revenue Code Section 457. The Plan, available to all District employees, permits participants to defer a portion of their salary until future years. The deferred compensation is not available to employees until termination, retirement, death or an unforeseeable emergency.
The Plan assets are held in trust outside the control of the District. Since the assets, liabilities and income of the Plan are not considered those of the District and are not subject to the claims of the District’s general creditors, they are not reported in the government-wide or fund financial statements.
48
Las Vegas-Clark County Library District
Notes to Basic Financial Statements (continued) For the Fiscal Year Ended June 30, 2015
______________________________________________________________________________
Postemployment Benefits Other Than Pensions (OPEB)
Effective July 1, 2008, the District implemented the provisions of GASB Statement No. 45, Accounting and Financial Reporting by Employers for Postemployment Benefits Other Than Pensions. In accordance with the transition rules of the statement, the District elected to apply its measurement and recognition requirements on a prospective basis and set its beginning net OPEB obligation at zero for the year ended June 30, 2009. The annual OPEB cost reported in the accompanying financial statements is based on the annual required contribution (ARC) of the District, calculated by using an actuarial valuation based upon the same methods and assumptions applied in determining the plan’s funding requirements. The net OPEB obligation at year end is determined by adding the annual OPEB cost to the net OPEB obligation at the beginning of the year and deducting any contributions to the plan during the year.
Multiple-Employer Cost-Sharing Defined Benefit Pension Plan
The District uses the same basis used in the Public Employees’ Retirement System of Nevada’s (PERS) Comprehensive Annual Financial Report, for reporting its proportionate share of the PERS collective net pension liability, deferred outflows and inflows of resources related to pensions, and pension expense, including information related to PERS fiduciary net position. Benefit payments (including refunds of employee contributions) are recognized by PERS when due and payable in accordance with the benefit terms. PERS investments are reported at fair value.
Deferred Inflows and Outflows of Resources
Deferred outflows of resources, represents a consumption of net position or fund balance that applies to future periods; and therefore, will not be recognized as an outflow of resources (expense/expenditure) until then. The government-wide statement of net position reports 1) the changes in proportion and differences between actual contributions and proportionate share of contributions related to pensions, which will be amortized over the average expected remaining service life of all employees that are provided with pension benefits, and 2) contributions made subsequent to the measurement date, which will be recognized in the subsequent year.
Deferred inflows of resources represent an acquisition of net position that applies to a future period(s) and so will not be recognized as an inflow of resources (revenue) until that time. The governmental funds balance sheet reports unavailable property tax revenues, which will be recognized as revenue in the period that the amounts become available. The government-wide statement of net position reports 1) the differences between expected and actual experience and changes of assumptions, which will be amortized over the average expected remaining service life of all employees that are provided with pension benefits, and 2) the net difference between projected and actual earnings on investments, which will be amortized over five years.
Long-term Obligations
In the government-wide financial statements, long-term obligations are reported as liabilities, net of unamortized bond premiums in the statement of net position. Bond premiums are deferred and amortized over the life of the related bonds using the effective interest method.
In the fund financial statements, bond premiums and issuance costs are recognized during the current period. The face amount of debt issued is reported as other financing sources. Premiums received on debt issuances are reported as other financing sources while discounts on debt issuances are reported as other financing uses. Issuance costs, whether or not withheld from the actual debt proceeds received, are reported as debt service expenditures.
49

Las Vegas-Clark County Library District
Notes to Basic Financial Statements (continued) For the Fiscal Year Ended June 30, 2015
______________________________________________________________________________
Fund Balance
Governmental fund balances are classified and reported as follows:
• Nonspendable fund balances include items that cannot be spent. This includes amounts that are not in aspendable form (for example, inventories and prepaid items) and amounts that are legally or contractuallyrequired to remain intact, such as a permanent fund principal balance.
• Restricted fund balances have constraints placed upon the use of the resources either by an external party orimposed by law through a constitutional provision or enabling legislation.
• Committed fund balances can be used only for specific purposes pursuant to constraints imposed by formalaction (resolution) of the Board, the District’s highest level of decision-making authority. These constraintsremain binding unless removed or changed in the same manner used to create the constraints.
• Assigned fund balance includes amounts that are constrained by the District’s intent to be used for aspecific purpose, but are neither restricted nor committed. Such intent is expressed by the Board orappropriately authorized officials. The District’s Chief Financial Officer has been authorized by the Boardin the budget approval process to make all fund balance assignments, which for the year ended June 30,2015, included the assignment of $30,643,644 and $16,108,547, with the intent that these funds be used fordebt service and capital projects, respectively. Constraints imposed on the use of assigned fund balancescan be removed or changed without formal Board action. For governmental funds, other than the generalfund, this is the classification for residual amounts that are not restricted, committed or nonspendable.
• Unassigned fund balance is the classification used by the general fund for residual amounts not included inthe four categories described above.
Prioritization and Use of Available Resources
When both restricted resources and other resources (i.e., committed, assigned, and unassigned) can be used for the same purposes, it is the District’s policy to use restricted resources first. Furthermore, when committed, assigned, and unassigned resources can be used for the same purpose, it is the District’s policy to use committed resources first, assigned second, and unassigned last.
Note 2. Stewardship, Compliance and Accountability
Budgetary Information
The District adopts annual budgets for all funds except for the capital projects fund, which adopts a project-length budget, the expendable trust special revenue fund and the permanent fund, which are not budgeted. All budget augmentations made during the current year were as prescribed by law. All budgets are adopted on a basis consistent with accounting principles generally accepted in the United States and used by the District for financial reporting.
The District uses the following procedures to establish, modify, and control budgetary data:
1. Prior to April 15, the District submits the tentative budget for the next fiscal year, commencing on July 1,to the State Department of Taxation. The City Council and the Board of County Commissioners have the
50

Las Vegas-Clark County Library District
Notes to Basic Financial Statements (continued) For the Fiscal Year Ended June 30, 2015
______________________________________________________________________________
ability to reject the tentative budget prior to its submission to the State. The budget, as submitted, contains the proposed expenditures and the means of financing them.
2. The State Department of Taxation notifies the District of its acceptance of the tentative budget.
3. Public hearings are conducted on the third Thursday in May.
4. After all changes have been noted and the hearings closed, the District’s Board adopts the budget on orbefore June 1.
5. Augmentations of the budget are accomplished through formal Board action.
6. The NRS require budget controls to be exercised at the function level. The Executive Director of theDistrict is authorized to transfer budget amounts between functions within a fund. However, the Board’sapproval is required for all transfers between funds.
7. The District cannot expend any money, incur any liability, or enter into any contract, which by its termsinvolves the expenditure of money in excess of the amount appropriated for a given function, except forbond payments, short-term financing payments, and any other long-term contracts expressly authorized bylaw.
8. All unencumbered appropriations lapse at the fiscal year end, except for amounts appropriated for specificcapital projects or Federal and State grant expenditures.
Prior Year Adjustment
Net position as of July 1, 2014, has been retroactively adjusted to reflect the effect of adopting GASB Statement No. 68, Accounting and Financial Reporting for Pensions - An Amendment of GASB Statement No. 27, resulting in increases in deferred outflows of resources ($5,000,442) and liabilities ($43,412,266) and a decrease in net position ($38,411,824).
New Accounting Pronouncements
In February 2015, the GASB issued Statement No. 72, Fair Value Measurement and Application, effective for periods beginning after June 15, 2015. This Statement provides guidance for determining a fair value measurement for financial reporting purposes. This Statement also provides guidance for applying fair value to certain investments and disclosures related to all fair value measurements. Management has not yet completed its assessment of this statement.
In June 2015, the GASB issued Statement No. 73, Accounting and Financial Reporting for Pensions and Related Assets That Are Not within the Scope of GASB Statement No. 68, and Amendments to Certain Provisions of GASB Statements No. 67 and No. 68. The requirements of this statement that address accounting and financial reporting by employers and governmental nonemployer contributing entities for pensions that are not within the scope of GASB Statement 68 are effective for fiscal years beginning after June 15, 2016, and the requirements of this statement that address financial reporting for assets accumulated for purposes of providing those pensions are effective for fiscal years beginning after June 15, 2015. The requirements of this statement for pension plans that are within the scope of GASB Statement 67 or for pensions that are within the scope of GASB Statement 68 are effective for fiscal years beginning after June 15, 2015. This Statement establishes requirements for defined benefit pensions that are not within the scope of GASB Statement No. 68, Accounting and Financial Reporting for Pensions, as well as for the
51

Las Vegas-Clark County Library District
Notes to Basic Financial Statements (continued) For the Fiscal Year Ended June 30, 2015
______________________________________________________________________________
assets accumulated for purposes of providing those pensions. In addition, it establishes requirements for defined contribution pensions that are not within the scope of GASB Statement 68. It also amends certain provisions of GASB Statement No. 67, Financial Reporting for Pension Plans, and GASB Statement 68 for pension plans and pensions that are within their respective scopes. Management has completed its assessment of this statement and determined that the District does not have any pension plans that are not subject to the scope of GASB Statement Nos. 67 and 68; and therefore, that this statement will not have a material effect on the District’s financial position or changes therein.
In June 2015, the GASB issued Statement No. 74, Financial Reporting for Postemployment Benefit Plans Other Than Pension Plans, effective for periods beginning after June 15, 2016. This statement addresses the usefulness of information about postemployment benefits other than pensions (OPEB) included in the general purpose external financial reports of state and local governmental OPEB plans for making decisions and assessing accountability. Management has not yet completed its assessment of this statement.
In June 2015, the GASB issued Statement No. 75, Accounting and Financial Reporting by Employers for Postemployment Benefits Other Than Pensions, effective for periods beginning after June 15, 2017. This statement addresses the accounting and financial reporting by state and local governments for postemployment benefits other than pensions (OPEB) and the information provided by state and local governmental employers about financial support for OPEB that is provided by other entities. Management has not yet completed its assessment of this statement.
In June 2015, the GASB issued Statement No. 76, The Hierarchy of Generally Accepted Accounting Principles for State and Local Governments, effective for periods beginning after June 15, 2015. This statement identifies, in the context of the current governmental financial reporting environment, the hierarchy of generally accepted accounting principles (GAAP), which consists of the sources of accounting principles used to prepare financial statements of state and local governmental entities in conformity with GAAP and the framework for selecting those principles. Management has completed its assessment of this statement and determined that it will not have a material effect on the District’s financial position or changes therein.
In August 2015, the GASB issued Statement No. 77, Tax Abatement Disclosures, effective for periods beginning after December 15, 2015. This statement addresses the need for financial statements prepared by state and local governments in conformity with generally accepted accounting principles to provide citizens and taxpayers, legislative and oversight bodies, municipal bond analysts, and others with information they need to evaluate the financial health of governments, make decisions, and assess accountability. Management has not yet completed its assessment of this statement.
Note 3. Detailed Notes on all Funds
Deposits and Investments
The District has a formal investment policy that is designed to ensure conformity with the NRS and to limit exposure to investment risks as described in the following paragraphs.
Allowable District investments include obligations of the U.S. Treasury and U.S. agencies, not to exceed ten years maturity; negotiable notes or short-term negotiable bonds issued by other local governments of the State; bankers’ acceptances eligible for rediscount with Federal Reserve Banks, not to exceed 180 days maturity and 20% of total investments; commercial paper having an “A-1” rating or equivalent, not to exceed 270 days maturity and 20% of
52

Las Vegas-Clark County Library District
Notes to Basic Financial Statements (continued) For the Fiscal Year Ended June 30, 2015
______________________________________________________________________________
total investments; and money market mutual funds invested only in federal government agency securities with an “AAA” rating or equivalent or in repurchase agreements fully collateralized by such securities.
When investing monies, the District is required to comply with the NRS. District monies must be deposited with federally insured banks. The District is authorized to use demand accounts, time accounts and certificates of deposit. The NRS do not specifically require collateral for demand deposits, but do specify that collateral for time deposits may be of the same type as those described for permissible State investments. Permissible State investments are similar to allowable District investments, described above, except that some State investments are for longer terms and include securities issued by municipalities outside of the State.
The District has a written custodial tri-party collateral agreement with a Bank’s Trust Department for demand deposits and certificates of deposit. The custodial agreement pledges securities totaling 102% of the District’s deposits.
At year end, the District’s carrying amount of deposits was $14,409,061, and the bank balance was $14,445,927. The Federal Depository Insurance Corporation (FDIC) covered $250,000 of the bank balance at fiscal year end. However, the District’s bank balance is collateralized with securities held by the pledging bank’s trust department or agent in the District’s name up to 102% of the average bank balance in excess of the FDIC limit. The District often carries cash and cash equivalents on deposit with financial institutions in excess of federally-insured limits, and the risk of losses related to such concentrations, as a result of continuing economic instability, is not subject to estimation at this time.
Interest rate risk is the risk that changes in market interest rates will adversely affect the fair value of an investment. Generally, the longer the maturity of an investment the greater the sensitivity of its fair value to changes in market interest rates. In accordance with the District’s investment policy, one of the ways that the District manages its exposure to interest rate risk is by purchasing a combination of short-term and long-term investments and by timing cash flows from maturities so that a portion of the portfolio is maturing or coming close to maturity evenly over time as necessary to provide the cash flow and liquidity needed for operations.
At June 30, 2015, the District had the following investments and maturities:
Reported Investment Maturities (In Years)
Investments: amount/fair
value Less than 1 1 to 3 3 to 5
U.S. Treasuries $ 11,549,713 $ 2,001,170 $ 9,548,543 U.S. Agencies 31,943,558 13,617,637 17,308,114 $ 1,017,807
$ 43,493,271 $ 15,618,807 $ 26,856,657 $ 1,017,807
Generally, credit risk is the risk that an issuer of an investment will not fulfill its obligation to the holder of the investment. This is measured by the assignment of a rating by a nationally recognized statistical organization. The District’s investment policy mitigates this risk by limiting investments to the safest types of securities, pre-qualifying entities (e.g., financial institutions, intermediaries, advisors), and diversifying its investment portfolio. At June 30, 2015, all of the District’s investments were rated “AAA” or “AA.”
The District’s policy places no limits on the amount that can be invested in any one issuer beyond that stipulated by the NRS.
53

Las Vegas-Clark County Library District
Notes to Basic Financial Statements (continued) For the Fiscal Year Ended June 30, 2015
______________________________________________________________________________
In addition to the District’s investment in U.S. Treasuries, investments in any one issuer that represents 5% or more of the District’s total investments at June 30, 2015, were as follows:
Issuer Investment Type Reported amount/
fair value
Federal National Mortgage Association U.S. Agencies $ 14,774,959 Federal Home Loan Bank U.S. Agencies 14,559,035
Property and Equipment
Changes in capital assets for the year ended June 30, 2015, are as follows:
Balance July 1, 2014 Increases Decreases
Balance June 30, 2015
Capital assets not being depreciated: Land $ 4,396,578 $ 4,396,578 Construction in progress . $ 56,246 56,246
4,396,578 56,246 4,452,824
Capital assets being depreciated: Buildings 135,556,808 135,556,808 Improvements 3,515,834 3,515,834 Library media materials 78,067,760 7,907,903 $ (4,938,134) 81,037,529 Furniture and equipment 17,746,417 494,414 (779,652) 17,461,179
234,886,819 8,402,317 (5,717,786) 237,571,350
Less accumulated depreciation for: Buildings (34,924,440) (2,717,699) (37,642,139) Improvements (2,858,427) (229,292) (3,087,719) Library media materials (31,227,104) (6,126,042) 4,938,134 (32,415,012) Furniture and equipment (11,619,208) (1,479,292) 770,589 (12,327,911)
(80,629,179) (10,552,325) 5,708,723 (85,472,781)
$ 158,654,218 $ (2,093,762) $ (9,063) $ 156,551,393
Interfund Transfers
Interfund transfers for the year ended June 30, 2015, were as follows:
Transfer out Transfer in Amount
General fund Capital projects fund $ 8,100,000
Transfers are used to move revenues to finance various programs that are accounted for in other funds in accordance with budgetary authorizations.
Operating Lease Commitments
The District leases certain facilities under a non-cancelable operating lease, which expires (including renewal periods) in May 2020. Rent expense resulting from such leases was $16,613 for the year ended June 30, 2015.
54

Las Vegas-Clark County Library District
Notes to Basic Financial Statements (continued) For the Fiscal Year Ended June 30, 2015
______________________________________________________________________________
At June 30, 2015, approximate future minimum lease payments were as follows:
Years ending June 30,
2016 16,500 2017 16,500 2018 16,500 2019 16,500 2020 13,750
General Obligation Bonds
The District issues general obligation bonds to provide funds for the improvement, acquisition or construction of major capital assets. These bonds constitute general obligations of the District, and the full faith and credit of the District are pledged for the payment of principal and interest.
General obligation bonds outstanding at June 30, 2015, were as follows:
Bond issue series Maturity
date Original amount
Interest rate
Balance June 30, 2015
2009 January 2019 $ 50,000,000 3.00-5.00 % $ 27,055,000
Annual debt service requirements to maturity were as follows:
Years ending June 30, Principal Interest Total
2016 $ 6,280,000 $ 1,352,750 $ 7,632,750 2017 6,590,000 1,038,750 7,628,750 2018 6,920,000 709,250 7,629,250 2019 7,265,000 363,250 7,628,250
$27,055,000 $ 3,464,000 $ 30,519,000
Changes in Long-term Liabilities
Long-term liability activity for the year ended June 30, 2015, was as follows:
Balance July 1, 2014 Additions Reductions
Balance June 30, 2015
Due within one year
(Restated) Bond issue series: 2009 $ 33,090,000 $ (6,035,000) $ 27,055,000 $ 6,280,000
Compensated absences 4,626,307 $ 2,298,430 (2,336,128) 4,588,609 2,394,531 Obligation for postemployment benefits other than pensions 195,544 116,332 (113,711) 198,165 Net pension liability 43,412,266 4,558,709 (13,564,312) 34,406,663 .
$ 81,324,117 $ 6,973,471 $ (22,049,151) $ 66,248,437 $ 8,674,531
The compensated absences, obligation for postemployment benefits other than pensions and net pension liability are normally liquidated by the general fund.
55

Las Vegas-Clark County Library District
Notes to Basic Financial Statements (continued) For the Fiscal Year Ended June 30, 2015
______________________________________________________________________________
Note 4. Other Information Risk Management The District is exposed to various risks of loss related to torts; theft of, or damage to, or destruction of assets; errors and omissions; injuries to employees; and natural disasters. The District maintains a risk management program to assess coverage of potential risks of loss. Under this program, the District participates in workers’ compensation and unemployment programs provided by the State. For all other risks, the District purchases insurance coverage subject to nominal deductibles. Settled claims and awards have not exceeded this commercial coverage in any of the past three fiscal years. Contingent liabilities In the ordinary course of its operations, claims are filed against the District. It is the opinion of management that these claims will not result in any material adverse effect on the District’s financial statements. The District does not accrue for estimated future legal and defense costs, if any, to be incurred in connection with outstanding or threatened litigation and other disputed matters, but rather records such period costs when the services are rendered. Multiple-Employer Cost-Sharing Defined Benefit Pension Plan The District’s employees are covered by the Public Employees’ Retirement System of Nevada (PERS), which was established by the Nevada Legislature in 1947, effective July 1, 1948, and is governed by the Public Employees Retirement Board (the PERS Board) whose seven members are appointed by the governor. The District does not exercise any control over PERS. PERS is a cost-sharing, multiple-employer, defined benefit public employees’ retirement system which includes both regular and police/fire members. PERS is administered to provide a reasonable base income to qualified employees who have been employed by a public employer and whose earnings capacities have been removed or substantially impaired by age or disability. Benefits, as required by NRS, are determined by the number of years of accredited service at time of retirement and the member’s highest average compensation in any 36 consecutive months with special provisions for members entering the system on or after January 1, 2010. Benefit payments to which participants or their beneficiaries may be entitled under the plan include pension benefits, disability benefits, and survivor benefits. Monthly benefit allowances for members are computed as 2.5% of average compensation for each accredited year of service prior to July 1, 2001. For service earned on and after July 1, 2001, this multiplier is 2.67% of average compensation. For members entering the system on or after January 1, 2010, there is a 2.5% multiplier. PERS offers several alternatives to the unmodified service retirement allowance which, in general, allow the retired employee to accept a reduced service retirement allowance payable monthly during his or her lifetime and various optional monthly payments to a named beneficiary after his or her death.
56

Las Vegas-Clark County Library District
Notes to Basic Financial Statements (continued) For the Fiscal Year Ended June 30, 2015
______________________________________________________________________________
Post-retirement increases are provided by authority of NRS 286.575 - .579, which for members entering the system before January 1, 2010, is equal to the lesser of:
1. 2% per year following the third anniversary of the commencement of benefits, 3% per year followingthe sixth anniversary, 3.5% per year following the ninth anniversary, 4% per year following the twelfthanniversary and 5% per year following the fourteenth anniversary, or
2. The average percentage increase in the Consumer Price Index (or other PERS Board approved index)for the three preceding years.
In any event, a member’s benefit must be increased by the percentages in paragraph 1, above, if the benefit of a member has not been increased at a rate greater than or equal to the average of the Consumer Price Index (All Items) (or other PERS Board approved index) for the period between retirement and the date of increase.
For members entering the system on or after January 1, 2010, the post-retirement increases are the same as above, except that the increases do not exceed 4% per year.
Regular members are eligible for retirement at age 65 with five years of service, at age 60 with 10 years of service, or at any age with thirty years of service. Regular members entering the System on or after January 1, 2010, are eligible for retirement at age 65 with five years of service, or age 62 with 10 years of service, or any age with thirty years of service. Police/fire members are eligible for retirement at age 65 with five years of service, at age 55 with ten years of service, at age 50 with twenty years of service, or at any age with twenty-five years of service. Police/fire members entering the system on or after January 1, 2010, are eligible for retirement at age 65 with five years of service, or age 60 with ten years of service, or age 50 with twenty years of service, or at any age with thirty years of service. Only service performed in a position as a police officer or firefighter may be counted toward the eligibility for retirement as police/fire accredited service.
The normal ceiling limitation on the monthly benefit allowances is 75% of average compensation. However, a member who has an effective date of membership before July 1, 1985, is entitled to a benefit of up to 90% of average compensation. Both regular and police/fire members become fully vested as to benefits upon completion of five years of service.
The authority for establishing and amending the obligation to make contributions and member contribution rates rests with NRS. New hires, in agencies which did not elect the employer-pay contribution (EPC) plan prior to July 1, 1983, have the option of selecting one of two alternative contribution plans. Contributions are shared equally by employer and employee in which employees can take a reduced salary and have contributions made by the employer or can make contributions by a payroll deduction matched by the employer.
PERS’s basic funding policy provides for periodic contributions at a level pattern of cost as a percentage of salary throughout an employee’s working lifetime in order to accumulate sufficient assets to pay benefits when due. PERS receives an actuarial valuation on an annual basis for determining the prospective funding contribution rates required to fund the system on an actuarial reserve basis. Contributions actually made are in accordance with the required rates established by NRS. These statutory rates are increased/decreased pursuant to NRS 286.421 and 286.450. The actuarial funding method used is the entry age normal cost method. It is intended to meet the funding objective and result in a relatively level long-term contributions requirement as a percentage of salary.
For the fiscal years ended June 30, 2014 and 2015, the required employer/employee matching rate was 13.25% for regular and 20.75% for police/fire members. The EPC rate was 25.75% for regular and 40.50% for police/fire members.
57
Las Vegas-Clark County Library District
Notes to Basic Financial Statements (continued) For the Fiscal Year Ended June 30, 2015
______________________________________________________________________________
Effective July 1, 2015, the required contribution rates for regular members will be 14.5% and 28% for employer/employee matching and EPC, respectively. The required contribution rates for police/fire members will remain the same. PERS issues a publicly available Comprehensive Annual Financial Report that includes financial statements and required supplemental information. This report is available on the PERS website, www.nvpers.org under publications. PERS collective net pension liability was measured as of June 30, 2014, and the total pension liability used to calculate the net pension liability was determined by an actuarial valuation as of that date. For this purpose, certain actuarial valuation assumptions are stipulated by GASB and may vary from those used to determine the prospective funding contribution rates. The total PERS pension liability was determined using the following actuarial assumptions (based on the results of an experience review completed in 2013), applied to all periods included in the measurement:
Actuarial valuation date June 30, 2014 Inflation rate 3.50% Payroll growth 5.00%, including inflation Investment rate of return 8.00%, including inflation Discount rate 8.00% Productivity pay increase 0.75% Consumer price index 3.50% Actuarial cost method Entry age normal and level percentage of payroll Projected salary increases Regular: 4.60% to 9.75%, depending on service
Police/Fire: 5.25% to 14.50%, depending on service Rates include inflation and productivity increases
At June 30, 2014, assumed mortality rates and projected life expectancies for selected ages were as follows:
Regular Members Mortality Rates Expected Years of Life Remaining Age Males Females Males Females 40 0.10% 0.05% 41.1 44.4 50 0.17% 0.12% 31.6 34.7 60 0.55% 0.42% 22.4 25.4 70 1.82% 1.39% 14.3 17.0 80 5.65% 3.79% 7.7 10.1
Police/Fire Members Mortality Rates Expected Years of Life Remaining Age Males Females Males Females 40 0.10% 0.06% 40.2 42.5 50 0.19% 0.15% 30.7 32.8 60 0.63% 0.54% 21.5 23.6 70 2.02% 1.72% 13.5 15.5 80 6.41% 4.63% 7.1 9.0
These mortality rates and projected life expectancies are based on the following:
• For non-disabled male regular members – RP-2000 Combined Healthy Mortality Table projected to 2013 with Scale AA
58

Las Vegas-Clark County Library District
Notes to Basic Financial Statements (continued) For the Fiscal Year Ended June 30, 2015
______________________________________________________________________________
• For non-disabled female regular members – RP-2000 Combined Healthy Mortality Table, projected to2013 with Scale AA, set back one year
• For all non-disabled police/fire members – RP-2000 Combined Healthy Mortality Table projected to 2013with Scale AA, set forward one year
• For all disabled regular members and all disabled police/fire members – RP-2000 Disabled RetireeMortality Table projected to 2013 with Scale AA, set forward three years
PERS’s policies which determine the investment portfolio target asset allocation are established by the PERS Board. The asset allocation is reviewed annually and is designed to meet the future risk and return needs of PERS. The following target asset allocation policy was adopted as of June 30, 2014:
Asset Class Target
Allocation
Long-term Geometric Expected Real
Rate of Return *
Domestic equity 42% 5.50% International equity 18% 5.75% Domestic fixed income 30% 0.25% Private markets 10% 6.80% ________ * These geometric return rates are combined to produce the long-term expected
rate of return by adding the long-term expected inflation rate of 3.5%.
The discount rate used to measure the total pension liability was 8.00% as of June 30, 2014 and 2013. The projection of cash flows used to determine the discount rate assumed that employee and employer contributions will be made at the rate specified by NRS. Based on that assumption, PERS’s fiduciary net position at June 30, 2014, was projected to be available to make all projected future benefit payments of current active and inactive employees. Therefore, the long-term expected rate of return on pension plan investments (8%) was applied to all periods of projected benefit payments to determine the total pension liability as of June 30, 2014.
The District’s proportionate share of the net pension liability at year end, calculated using the discount rate of 8.00%, as well as what the District’s proportionate share of the net pension liability would be if it were calculated using a discount rate that is 1% lower (7.00%) or 1% higher (9.00%) than the current discount rate was as follows:
1% Decrease in Discount Rate Discount Rate
1% Increase in Discount Rate
Net pension liability $ 53,506,124 $ 34,406,663 $ 18,530,148
Detailed information about PERS fiduciary net position is available in the PERS Comprehensive Annual Financial Report, available on the PERS website, www.nvpers.org under publications. PERS fiduciary net position and additions to/deductions from it have been determined on the same basis used in the PERS Comprehensive Annual Financial Report. PERS financial statements are prepared in accordance with accounting principles generally accepted in the United States of America applicable to governmental accounting for fiduciary funds. Benefit payments (including refunds of employee contributions) are recognized when due and payable in accordance with the benefit terms. Investments are reported at fair value.
The District’s proportionate share (amount) of the collective net pension liability was $34,406,663, which represents 0.33014% of the collective net pension liability. Contributions for employer pay dates within the fiscal year ending
59

Las Vegas-Clark County Library District
Notes to Basic Financial Statements (continued) For the Fiscal Year Ended June 30, 2015
______________________________________________________________________________
June 30, 2014, were used as the basis for determining each employer’s proportionate share. Each employer’s proportion of the net pension liability is based on their combined employer and member contributions relative to the total combined employer and member contributions for all employers for the period ended June 30, 2014.
For the year ended June 30, 2015, the District’s pension expense was $4,558,709 and its reported deferred outflows and inflows of resources related to pensions were as follows:
Deferred Outflows
of Resources
Deferred Inflows
of Resources
Differences between expected and actual experience $ 1,646,548 Net difference between projected and actual earnings on investments 7,226,808 Changes in proportion and differences between actual contributions and proportionate share of contributions $ 309,485 Contributions subsequent to measurement date 5,191,083
At June 30, 2014, the average expected remaining service life is 6.70 years.
Deferred outflows of resources related to pensions resulting from contributions subsequent to the measurement date totaling $5,191,083 will be recognized as a reduction of the net pension liability in the year ending June 30, 2016. Other amounts reported as deferred outflows and inflows of resources related to pensions will be recognized in pension expense as follows:
Years ending June 30,
2016 $ (2,022,481) 2017 (2,022,481) 2018 (2,022,481) 2019 (2,022,481) 2020 (278,793) Thereafter (195,155)
Changes in the District’s net pension liability were as follows:
Net pension liability, beginning of year $ 43,412,266 Pension expense 4,558,709 Employer contributions (5,000,442) Net new deferred outflows and inflows (8,563,870)
Net pension liability, end of year $ 34,406,663
At June 30, 2015, $395,536 payable to PERS, equal to the June 2015 required contribution, was included in accounts payable.
Postemployment Benefits Other Than Pensions (OPEB)
In accordance with NRS, the District provides other postemployment benefits to retirees by participating in the State’s Public Employee Benefit Plan (PEBP), an agent multiple-employer defined benefit plan administered by a nine member governing board. PEBP provides medical, prescription, dental and vision benefits to retirees. The PEBP issues a publicly available financial report that includes financial statements and required supplementary information. This report may be obtained by writing to the following address: Public Employee Benefit Plan, 901 South Stewart Street, Suite 101, Carson City, NV 89701.
60

Las Vegas-Clark County Library District
Notes to Basic Financial Statements (continued) For the Fiscal Year Ended June 30, 2015
______________________________________________________________________________
Eligibility and subsidy requirements are governed by NRS and can only be amended through legislation. In 2008, NRS were amended. As a result of this amendment, the number of retirees for whom the District is obligated to provide postemployment benefits is limited to eligible employees who retired from District service prior to September 1, 2008. The District does not provide any other postemployment benefits (either directly or indirectly).
The District is required to provide a subsidy, based on years of service for its retirees that have enrolled in the PEBP. The subsidy is paid on a pay-as-you-go basis and is set by the State Legislature. In current fiscal year this subsidy ranged from $9 to $637 per retiree, per month.
Annual OPEB cost for the plan is calculated based on the annual required contribution (ARC), an amount actuarially determined in accordance with the parameters of GASB Statement No. 45. The ARC represents a level of funding that, if paid on an ongoing basis, is projected to cover normal cost each year and to amortize any unfunded actuarial liabilities (or funding excess) over a period not to exceed thirty years. The District’s annual OPEB cost for the year, the amount contributed to the plan and the changes in the District’s net OPEB obligation for the current fiscal year were as follows:
Annual required contribution (ARC) $ 119,760 Interest on net OPEB obligation 6,844 Adjustment to ARC (10,272) Annual OPEB cost 116,332 Contributions made (113,711)
Increase in net OPEB obligation 2,621 Net OPEB obligation beginning of year 195,544
Net OPEB obligation end of year $ 198,165
The schedule of funding progress is presented as required supplementary information to provide multi-year trend information that shows whether the actuarial value of plan assets is increasing or decreasing over time relative to the actuarial accrued liability for benefits.
Valuation date
Actuarial value of assets
Actuarial accrued liability (AAL)
Unfunded actuarial accrued liability (UAAL)
Funded ratio
Annual covered payroll
UAAL as a percent of covered payroll
July 1, 2014 $ -0- $ 2,202,637 $ 2,202,637 0% N/A* N/A* ____________ * PEBP is a closed plan; and therefore, there are no current District employees covered by the PEBP.
The District’s annual OPEB cost, employer contributions, the percentage of annual cost contributed to the plan and the net OPEB obligations were as follows:
Year Ended
Annual OPEB cost
OPEB cost contributed
Percentage contributed
Net OPEB obligation
June 30, 2015 $ 116,332 $ 113,711 98% $ 198,165 June 30, 2014 131,946 120,674 91% 195,544 June 30, 2013 132,004 128,602 97% 184,272
61

Las Vegas-Clark County Library District
Notes to Basic Financial Statements (continued) For the Fiscal Year Ended June 30, 2015
______________________________________________________________________________
Actuarial Methods and Assumptions Projections of benefits are based on the substantive plan (the plan as understood by the employer and plan members) and include the types of benefits provided at the valuation date and the pattern of sharing benefit costs between the District and the plan members at that point. Actuarial calculations reflect a long-term perspective and employ methods and assumptions that are designed to reduce short-term volatility in actuarial accrued liabilities and the actuarial value of assets. Significant methods and assumptions are as follows:
Actuarial valuation date July 1, 2014 Actuarial cost method Projected unit credit Amortization method Level dollar, open Amortization period 30 years Asset valuation method No assets in trust Actuarial assumptions: Total retirees 46 Average retiree age 68.3 years Average retiree life expectancy 19.8 years Estimated Inflation Rate 3% Investment rate of return 3.5% Projected salary increases N/A* Projected medical Inflation: Fiscal year 2015 Actual benefit levels Fiscal year 2016 7% Fiscal year 2017 6.5% Fiscal year 2018 6% Fiscal year 2019 5.5% Fiscal year 2020 and subsequent years 5% _______________ * PEBP is a closed plan; and therefore, there are no current District employees covered by the PEBP.
Actuarial valuations of an ongoing plan involve estimates of the value of reported amounts and assumptions about the probability of occurrence of events far into the future. Amounts determined regarding the funded status of the plan and the annual required contributions of the employer are subject to continual revision as actual results are compared with past expectations and new estimates are made about the future. Note 5. Subsequent Events In October 2015, the District transferred the Las Vegas Library branch building to the City of Las Vegas in exchange for $7,000,000 and a parcel of land.
62

REQUIRED SUPPLEMENTARY INFORMATION

This page intentionally left blank

Variance to Original Final Actual Final Budget
RevenuesProperty taxes 36,300,000$ 36,300,000$ 36,724,582$ 424,582$ Intergovernmental revenues,
consolidated taxes 18,500,000 18,500,000 19,457,174 957,174 Charges for services 2,325,000 2,325,000 1,912,010 (412,990) Interest 50,000 50,000 14,165 (35,835) Miscellaneous 360,000 360,000 217,945 (142,055)
Total revenues 57,535,000 57,535,000 58,325,876 790,876
ExpendituresCulture and recreation:
Salaries and wages 25,742,290 25,742,290 24,798,416 943,874 Employee benefits 9,821,286 9,821,286 8,746,263 1,075,023 Supplies and services 11,414,238 11,414,238 9,479,987 1,934,251 Capital outlay 8,426,000 8,426,000 7,938,051 487,949
Total expenditures 55,403,814 55,403,814 50,962,717 4,441,097
Excess of revenuesover expenditures 2,131,186 2,131,186 7,363,159 5,231,973
Other financing usesTransfers out (8,100,000) (8,100,000) (8,100,000)
Net change in fund balance (5,968,814) (5,968,814) (736,841) 5,231,973
Fund balance, beginning of year 12,471,213 12,471,213 17,893,241 5,422,028
Fund balance, end of year 6,502,399$ 6,502,399$ 17,156,400$ 10,654,001$
Budget
Las Vegas-Clark County Library District
Schedule of Revenues, Expenditures and Changesin Fund Balance - Budget and Actual - General Fund
For the Fiscal Year Ended June 30, 2015
65

Valuation Date
Actuarial value of assets
Actuarial accrued liability (AAL)
Unfunded actuarial
accrued liability (UAAL)
Funded ratio
Annual covered payroll
UAAL as apercent of covered payroll
July 1, 2014 $ -0- 2,202,637$ 2,202,637$ 0% N/A* N/A*
July 1, 2011 -0- 2,486,159 2,486,159 0% N/A* N/A*
July 1, 2008 -0- 4,444,208 4,444,208 0% N/A* N/A*
_______________* PEBP is a closed plan; and therefore, there are no current employees covered by the PEBP.
Las Vegas-Clark County Library District
Schedule of Funding ProgressPostemployment Benefits Other Than Pensions
For the Fiscal Year Ended June 30, 2015
66
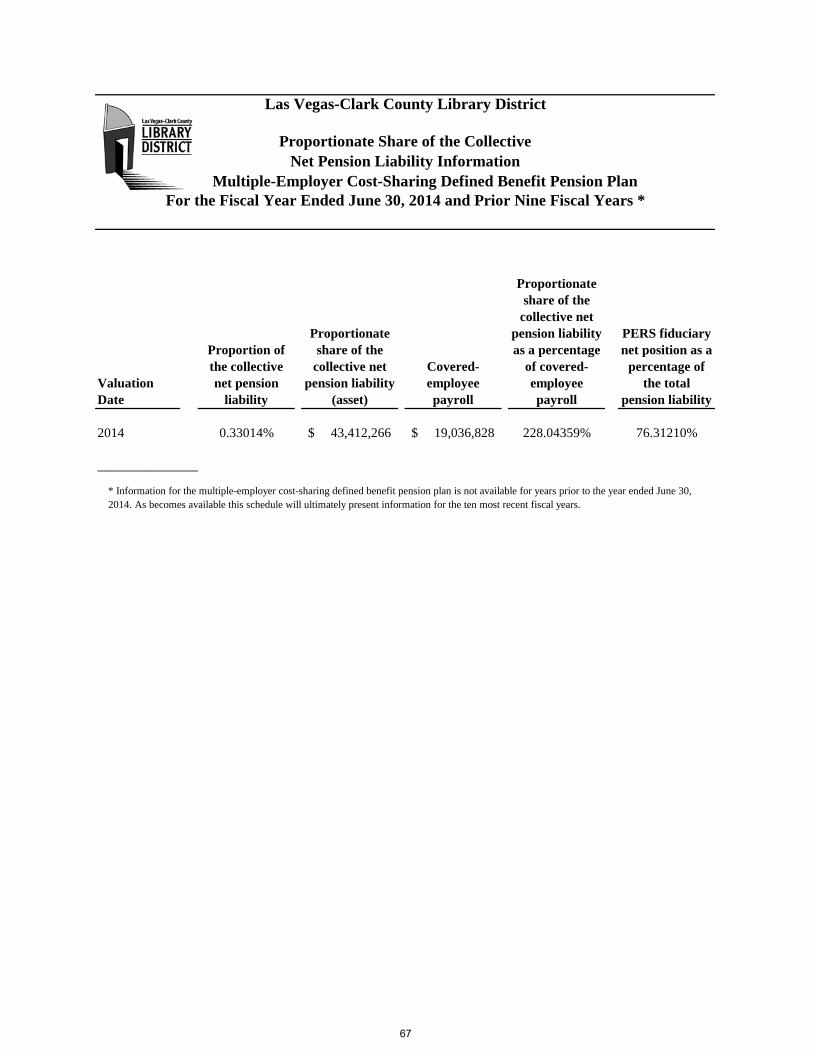
Valuation Date
Proportion of the collective net pension
liability
Proportionate share of the
collective net pension liability
(asset)
Covered-employee payroll
Proportionateshare of the
collective net pension liability as a percentage
of covered-employee payroll
PERS fiduciary net position as a
percentage of the total
pension liability
2014 0.33014% 43,412,266$ 19,036,828$ 228.04359% 76.31210%
_______________
Las Vegas-Clark County Library District
Proportionate Share of the CollectiveNet Pension Liability Information
Multiple-Employer Cost-Sharing Defined Benefit Pension PlanFor the Fiscal Year Ended June 30, 2014 and Prior Nine Fiscal Years *
* Information for the multiple-employer cost-sharing defined benefit pension plan is not available for years prior to the year ended June 30,2014. As becomes available this schedule will ultimately present information for the ten most recent fiscal years.
67

Valuation Date
Statutorily required
contribution
Contributions in relation to
the statutorily required
contribution
Contribution deficiency
(excess)
Covered-employee payroll
Contributions as a percentage
of covered-employee payroll
2015 5,191,083$ 5,191,083$ $ -0- 19,776,530$ 26.24870%
_______________
Las Vegas-Clark County Library District
Proportionate Share of Statutorily RequiredPension Contribution Information
Multiple-Employer Cost-Sharing Defined Benefit Pension PlanFor the Fiscal Year Ended June 30, 2015 and Prior Nine Fiscal Years *
* Information for the multiple-employer cost-sharing defined benefit pension plan is not available for years prior to the year ended June 30,2015. As becomes available this schedule will ultimately present information for the ten most recent fiscal years.
68

Las Vegas-Clark County Library District
Notes to Required Supplementary Information For the Fiscal Year Ended June 30, 2015
______________________________________________________________________________
Note 1. Budget Information The accompanying required supplementary schedule of revenues, expenditures and changes in fund balance presents the original adopted budget, the final amended budget, and actual general fund data. The original budget was adopted on a basis consistent with the Las Vegas-Clark County Library District’s (the District) financial accounting policies and accounting principles generally accepted in the United States. All amendments made to the original budget were as prescribed by law and similarly consistent. Additional budgetary information can be found in Note 2 to the District’s basic financial statements. Note 2. Multiple-Employer Cost-Sharing Defined Benefit Pension Plan For the year ended June 30, 2015, there were no changes in the pension benefit plan terms to the actuarial methods and assumptions used in the actuarial valuation report dated June 30, 2014. Additional information related to the multiple-employer cost-sharing defined benefit pension plan can be found in Note 4 to the District’s basic financial statements. Note 3. Postemployment Benefits Other Than Pensions For the year ended June 30, 2015, no significant events occurred that would have affected; and therefore, would have changed the benefit provision, size or composition of those covered by the other postemployment benefit plans, or the actuarial methods and assumptions used in the actuarial valuation reports dated July 1, 2014, July 1, 2011 and July 1, 2008. The actuarial accrued liability and unfunded actuarial accrued liability involve estimates of the value of reported amounts and assumptions about the probability of occurrence of events far into the future. The estimates are subject to continual revision. Additional information related to postemployment benefits other than pensions can be found in Note 4 to the District’s basic financial statements.
69

This page intentionally left blank

COMBINING andINDIVIDUAL FUND STATEMENTS andSCHEDULES

This page intentionally left blank

Major Funds

This page intentionally left blank

Debt Service FundThe debt service fund is used to account for the accumulation of resources for and the payment of long-term debt.

This page intentionally left blank

Variance to Original Final Actual Final Budget
RevenuesProperty taxes 2,092$ 2,092$ Interest 75,000$ 75,000$ 353,783 278,783
Total revenues 75,000 75,000 355,875 280,875
ExpendituresCulture and recreation:
Supplies and services 60,000 60,000 31,475 28,525 Debt service:
Principal 6,035,000 6,035,000 6,035,000 Interest 1,594,150 1,594,150 1,594,150
Total expenditures 7,689,150 7,689,150 7,660,625 28,525
Net change in fund balance (7,614,150) (7,614,150) (7,304,750) 309,400
Fund balance, beginning of year 37,948,394 37,948,394 37,948,394
Fund balance, end of year 30,334,244$ 30,334,244$ 30,643,644$ 309,400$
Budget
Las Vegas-Clark County Library District
Schedule of Revenues, Expenditures and Changes inFund Balance - Budget and Actual - Debt Service Fund
For the Fiscal Year Ended June 30, 2015
77

This page intentionally left blank

Non-Major Funds

This page intentionally left blank

Special Revenue FundsSpecial revenue funds are used to account for the proceeds of specifi c revenue sources that are legally or otherwise restricted to expenditures for specific purposes.
The grant fund accounts for revenues and expenditures of monies received from State and Federal grants.
The gift fund accounts for gifts to the District accepted by the Board of Trustees.
The expendable trust accounts for fi nancial resources where both the earnings and principal may be used for purposes that support the District’s programs.
Permanent FundThe permanent fund accounts for fi nancial resources that are legally restricted to the extent that only earnings, and not principal, may be used for purposes that support the District’s programs.

This page intentionally left blank
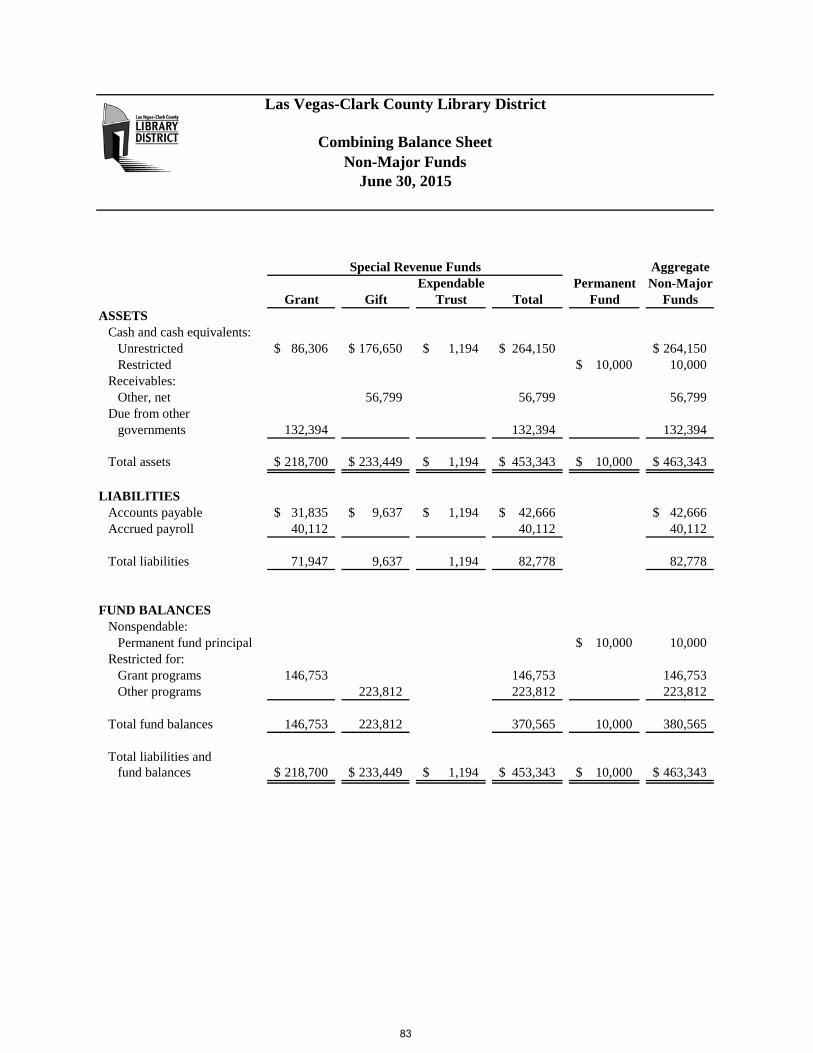
AggregateExpendable Permanent Non-Major
Grant Gift Trust Total Fund FundsASSETS
Cash and cash equivalents:Unrestricted 86,306$ 176,650$ 1,194$ 264,150$ 264,150$ Restricted 10,000$ 10,000
Receivables:Other, net 56,799 56,799 56,799
Due from othergovernments 132,394 132,394 132,394
Total assets 218,700$ 233,449$ 1,194$ 453,343$ 10,000$ 463,343$
LIABILITIESAccounts payable 31,835$ 9,637$ 1,194$ 42,666$ 42,666$ Accrued payroll 40,112 40,112 40,112
Total liabilities 71,947 9,637 1,194 82,778 82,778
FUND BALANCESNonspendable:
Permanent fund principal 10,000$ 10,000 Restricted for:
Grant programs 146,753 146,753 146,753 Other programs 223,812 223,812 223,812
Total fund balances 146,753 223,812 370,565 10,000 380,565
Total liabilities and fund balances 218,700$ 233,449$ 1,194$ 453,343$ 10,000$ 463,343$
Special Revenue Funds
Las Vegas-Clark County Library District
Combining Balance SheetNon-Major Funds
June 30, 2015
83

AggregateExpendable Permanent Non-Major
Grant Gift Trust Total Fund FundsRevenuesGrants 865,263$ 865,263$ 865,263$ Contributions 175,138$ 175,138 175,138 Miscellaneous 2,789 2,789 2,789
Total revenues 865,263 177,927 1,043,190 1,043,190
ExpendituresCulture and recreation:Salaries and wages 242,545 29,447 271,992 271,992 Employee benefits 103,712 14,184 117,896 117,896 Supplies and services 400,130 124,077 83,766$ 607,973 607,973 Capital outlay 118,876 6,997 125,873 125,873
Total expenditures 865,263 174,705 83,766 1,123,734 1,123,734
Net change in fund balances 3,222 (83,766) (80,544) (80,544)
Fund balances,beginning of year 146,753 220,590 83,766 451,109 10,000$ 461,109
Fund balances, end of year 146,753$ 223,812$ -$ 370,565$ 10,000$ 380,565$
Special Revenue Funds
Las Vegas-Clark County Library District
Combining Statement of Revenues, Expendituresand Changes in Fund Balances
Non-Major FundsFor the Fiscal Year Ended June 30, 2015
84

Variance to Original Final Actual Final Budget
RevenuesGrants 1,300,000$ 1,300,000$ 865,263$ (434,737)$
ExpendituresCulture and recreation:
Salaries and wages 380,000 380,000 242,545 137,455 Employee benefits 110,000 110,000 103,712 6,288 Supplies and services 400,000 400,000 400,130 (130) Capital outlay 410,000 410,000 118,876 291,124
Total expenditures 1,300,000 1,300,000 865,263 434,737
Net change in fund balance
Fund balance, beginning of year 146,755 146,755 146,753 (2)
Fund balance, end of year 146,755$ 146,755$ 146,753$ (2)$
Budget
Las Vegas-Clark County Library District
Schedule of Revenues, Expenditures and Changes inFund Balance - Budget and Actual - Grant Fund
For the Fiscal Year Ended June 30, 2015
85

Variance to Original Final Actual Final Budget
RevenuesContributions 300,000$ 300,000$ 175,138$ (124,862)$ Miscellaneous 200,000 200,000 2,789 (197,211)
Total revenues 500,000 500,000 177,927 (322,073)
ExpendituresCulture and recreation:
Salaries and wages 60,000 60,000 29,447 30,553 Employee benefits 40,000 40,000 14,184 25,816 Supplies and services 300,000 300,000 124,077 175,923 Capital outlay 100,000 100,000 6,997 93,003
Total expenditures 500,000 500,000 174,705 325,295
Net change in fund balance 3,222 3,222
Fund balance, beginning of year 219,423 219,423 220,590 1,167
Fund balance, end of year 219,423$ 219,423$ 223,812$ 4,389$
Budget
Las Vegas-Clark County Library District
Schedule of Revenues, Expenditures and Changes inFund Balance - Budget and Actual - Gift Fund
For the Fiscal Year Ended June 30, 2015
86


STATISTICAL SECTION

This page intentionally left blank

Financial Trends InformationThese schedules contain trend information to help the reader understand how the District's financialperformance and well-being have changed over time.
Table One Net Position by ComponentTable Two Changes in Net PositionTable Three Fund Balances, Governmental FundsTable Four Changes in Fund Balances, Governmental Funds
Revenue CapacityThese schedules present information to help the reader assess the District's most significant localrevenue source, property taxes.
Table Five General Governmental Revenues by SourceTable Six Principal Property Tax PayersTable Seven Schedule of Property Tax Rates - Direct and Overlapping GovernmentsTable Eight Assessed and Estimated Actual Value of Taxable Property in Clark CountyTable Nine Property Tax Levies and Collections for Clark County
Debt CapacityThese schedules present information to help the reader assess the affordability of the District's current levelsof outstanding debt and the District's ability to issue additional debt in the future.
Table Ten Ratio of Net General Bonded Debt to Assessed Value and Net Bonded Debt per CapitaTable Eleven Computation of Legal Debt MarginTable Twelve General Obligation Direct and Overlapping Government Debt
Demographic and Economic InformationThese schedules offer demographic and economic indicators to help the reader understand the environment within which the District's financial activities take place.
Table Thirteen Demographic Statistics - Clark CountyTable Fourteen Principal Employers
Operating InformationThese schedules contain service and infrastructure data to help the reader understand how the informationin the District's financial report relates to the services the District provides and the activities it performs.
Table Fifteen Full-Time Equivalent Employees by FunctionTable Sixteen Circulation SummaryTable Seventeen Capital Assets Statistics by Function/Program
Las Vegas-Clark County Library District
Statistical TablesJune 30, 2015
91

This page intentionally left blank

2006
2007
2008
2009
2010
2011
2012
2013
2014
2015
Gov
ernm
enta
l Act
ivit
ies
Net
inve
stm
ent i
n ca
pita
l ass
ets
61,0
45,3
85$
69,1
66,2
19$
85,7
48,2
61$
110,
947,
823
$
117,
524,
364
$
125,
034,
812
$
128,
554,
069
$
125,
799,
958
$
124,
927,
270
$
129,
077,
870
$
Res
tric
ted
7,51
4,94
1
7,
757,
316
8,73
8,44
1
7,
981,
664
11,9
66,5
98
12,0
25,6
69
7,88
5,46
3
45
9,94
4
461,
109
38
0,56
5
Unr
estr
icte
d23
,951
,098
35
,374
,184
37
,351
,037
27
,606
,406
34
,048
,157
41
,383
,677
44
,791
,443
58
,831
,642
62
,064
,928
21
,924
,101
T
otal
Gov
ernm
enta
l Act
iviti
es N
et P
ositi
on92
,511
,424
$
11
2,29
7,71
9$
13
1,83
7,73
9$
14
6,53
5,89
3$
16
3,53
9,11
9$
17
8,44
4,15
8$
18
1,23
0,97
5$
18
5,09
1,54
4$
18
7,45
3,30
7$
15
1,38
2,53
6$
(un
aud
ited
)L
ast
Ten
Fis
cal Y
ears
Net
Pos
itio
n b
y C
omp
onen
tT
able
On
e
Las
Veg
as-C
lark
Cou
nty
Lib
rary
Dis
tric
t
93

2006
2007
2008
2009
2010
2011
2012
2013
2014
2015
EX
PE
NS
ES
Gov
ern
men
tal A
ctiv
ites
:C
ultu
re a
nd r
ecre
atio
n44
,322
,565
$
47,8
55,9
99$
53
,788
,690
$
58,1
67,6
89$
54
,660
,313
$
49,8
27,1
92$
51
,462
,073
$
52,2
70,3
09$
54
,507
,423
$
56
,210
,061
$
In
tere
st o
n lo
ng-t
erm
deb
t1,
455,
850
1,
256,
120
1,
069,
978
1,
377,
053
2,
550,
600
2,
283,
357
2,
027,
418
1,
619,
751
1,
453,
830
1,25
5,02
5
Tot
al G
over
nem
enta
l Act
iviti
es E
xpen
ses
45,7
78,4
15
49
,112
,119
54,8
58,6
68
59
,544
,742
57,2
10,9
13
52
,110
,549
53,4
89,4
91
53
,890
,060
55,9
61,2
53
57,4
65,0
86
PR
OG
RA
M R
EV
EN
UE
SG
over
nm
enta
l Act
ivit
es:
Cha
rges
for
ser
vice
s2,
140,
499
2,
103,
100
2,
304,
081
2,
314,
298
2,
285,
086
2,
305,
611
2,
298,
715
2,
154,
897
1,
995,
572
1,91
2,01
0
O
pera
ting
gran
ts a
nd c
ontr
ibut
ions
1,08
0,46
9
1,39
3,70
6
1,37
7,35
1
746,
911
872,
812
1,18
4,57
1
893,
351
944,
139
901,
829
1,
040,
401
Tot
al G
over
nem
enta
l Act
iviti
es P
rogr
am R
even
ues
3,22
0,96
8
3,49
6,80
6
3,68
1,43
2
3,06
1,20
9
3,15
7,89
8
3,49
0,18
2
3,19
2,06
6
3,09
9,03
6
2,89
7,40
1
2,
952,
411
Tot
al P
rim
ary
Gov
ernm
ent N
et (
Exp
ense
s)/R
even
ues
(42,
557,
447)
(45,
615,
313)
(51,
177,
236)
(56,
483,
533)
(54,
053,
015)
(48,
620,
367)
(50,
297,
425)
(50,
791,
024)
(53,
063,
852)
(5
4,51
2,67
5)
GE
NE
RA
L R
EV
EN
UE
S
Gov
ern
men
tal A
ctiv
ites
:T
axes
:A
d va
lore
m38
,210
,744
43,5
43,7
06
48
,920
,483
52,9
04,1
82
53
,047
,378
46,8
20,8
00
39
,418
,245
36,9
69,2
97
36
, 548
,070
36
,689
,006
O
ther
18,3
09,3
80
18
,760
,634
18,4
02,0
65
16
,352
,780
15,0
17,6
57
15
,622
,697
16,5
04,1
08
17
,366
,883
18,3
45,0
24
19, 4
57,1
74
Inte
rest
1,06
1,89
8
2,22
4,63
7
2,65
4,12
5
1,20
3,87
1
1,26
7,47
8
322,
065
203,
912
71,1
91
381,
508
48
6,81
4
Mis
cella
neou
s39
3,97
5
87
2,63
1
74
0,58
3
72
0,85
4
1,
723,
728
75
9,84
4
64
2,88
2
24
4,22
2
15
1,01
3
220,
734
Tot
al G
over
nem
enta
l Act
iviti
es G
ener
al R
even
ues
57,9
75,9
97
65
,401
,608
70,7
17,2
56
71
,181
,687
71,0
56,2
41
63
,525
,406
56,7
69,1
47
54
,651
,593
55,4
25,6
15
56,8
53,7
28
CH
AN
GE
IN
NE
T P
OS
ITIO
NT
otal
Pri
mar
y G
over
nmen
t Cha
nge
in N
et P
ositi
on15
,418
,550
$
19,7
86,2
95$
19
,540
,020
$
14,6
98,1
54$
17
,003
,226
$
14,9
05,0
39$
6,
471,
722
$
3,
860,
569
$
2,
361,
763
$
2,34
1,05
3$
(una
udit
ed)
Las
t T
en F
isca
l Yea
rsC
hang
es in
Net
Pos
itio
nT
able
Tw
o
Las
Veg
as-C
lark
Cou
nty
Lib
rary
Dis
tric
t
94
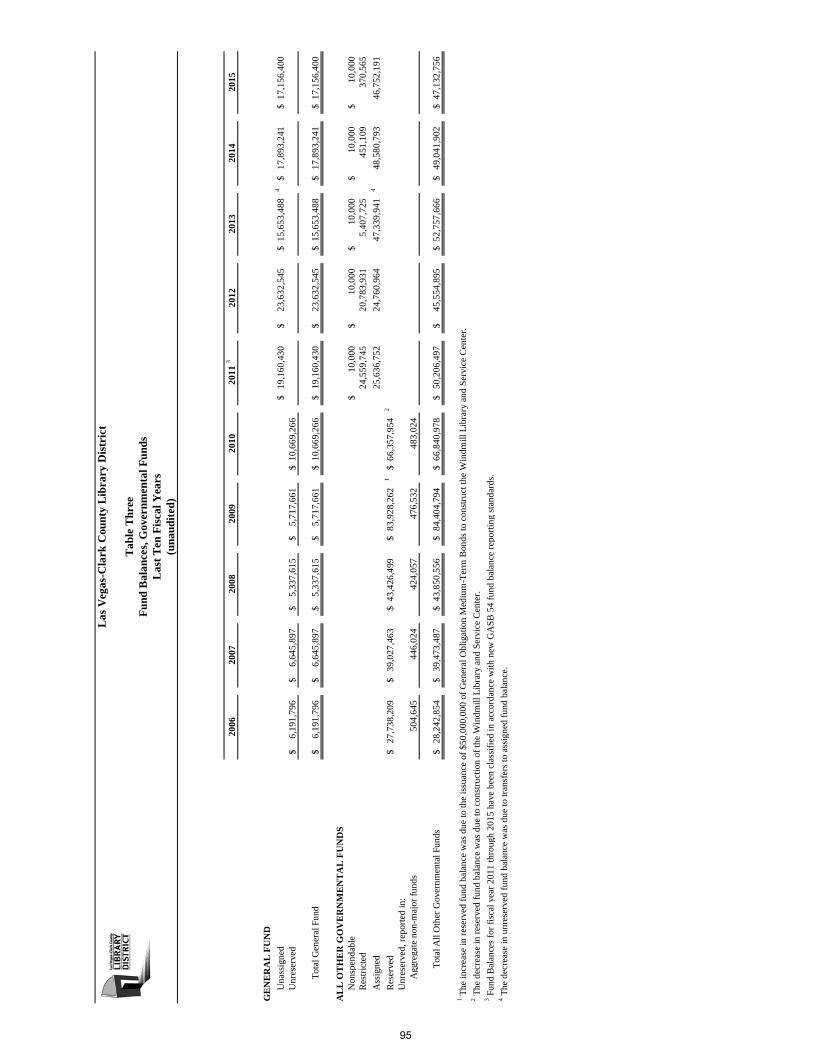
2006
2007
2008
2009
2010
2011
320
1220
1320
1420
15
GE
NE
RA
L F
UN
D
Una
ssig
ned
19,1
60,4
30$
23
,632
,545
$
15
,653
,488
$
417
,893
,241
$
17,1
56,4
00$
U
nres
erve
d6,
191,
796
$
6,
645,
897
$
5,
337,
615
$
5,
717,
661
$
10
,669
,266
$
Tot
al G
ener
al F
und
6,19
1,79
6$
6,64
5,89
7$
5,33
7,61
5$
5,71
7,66
1$
10,6
69,2
66$
19
,160
,430
$
23,6
32,5
45$
15,6
53,4
88$
17
,893
,241
$
17,1
56,4
00$
AL
L O
TH
ER
GO
VE
RN
ME
NT
AL
FU
ND
SN
onsp
enda
ble
10,0
00$
10
,000
$
10
,000
$
10,0
00$
10
,000
$
Res
tric
ted
24,5
59,7
45
20
,783
,931
5,
407,
725
45
1,10
9
37
0,56
5
Ass
igne
d25
,636
,752
24,7
60,9
64
47,3
39,9
41
4
48,5
80,7
93
46
,752
,191
Res
erve
d27
,738
,209
$
39,0
27,4
63$
43
,426
,499
$
83,9
28,2
62$
1
66,3
57,9
54$
2
Unr
eser
ved,
rep
orte
d in
:A
ggre
gate
non
-maj
or f
unds
504,
645
446,
024
424,
057
476,
532
483,
024
Tot
al A
ll O
ther
Gov
ernm
enta
l Fun
ds28
,242
,854
$
39,4
73,4
87$
43
,850
,556
$
84,4
04,7
94$
66
,840
,978
$
50,2
06,4
97$
45
,554
,895
$
52
,757
,666
$
49,0
41,9
02$
47
,132
,756
$
1 The
incr
ease
in r
eser
ved
fund
bal
ance
was
due
to th
e is
suan
ce o
f $5
0,00
0,00
0 of
Gen
eral
Obl
igat
ion
Med
ium
-Ter
m B
onds
to c
onst
ruct
the
Win
dmill
Lib
rary
and
Ser
vice
Cen
ter.
2 The
dec
reas
e in
res
erve
d fu
nd b
alan
ce w
as d
ue to
con
stru
ctio
n of
the
Win
dmill
Lib
rary
and
Ser
vice
Cen
ter.
3 Fun
d B
alan
ces
for
fisc
al y
ear
2011
thro
ugh
2015
hav
e be
en c
lass
ifie
d in
acc
orda
nce
with
new
GA
SB
54
fund
bal
ance
rep
ortin
g st
anda
rds.
4 The
dec
reas
e in
unr
eser
ved
fund
bal
ance
was
due
to tr
ansf
ers
to a
ssig
ned
fund
bal
ance
.
(una
udit
ed)
Las
t T
en F
isca
l Yea
rsF
und
Bal
ance
s, G
over
nmen
tal F
unds
Las
Veg
as-C
lark
Cou
nty
Lib
rary
Dis
tric
t
Tab
le T
hree
95

Fis
cal Y
ear
En
ded
Ju
ne
30,
2006
2007
2008
2009
2010
2011
2012
2013
2014
2015
RE
VE
NU
ES
Tax
es38
,157
,840
$
43,5
06,2
80$
48
,535
,406
$
52,5
19,4
04$
52
,840
,566
$
46,9
64,6
34$
39
,677
,405
$
37,2
38,3
59$
36
,679
,479
$
36,7
26,6
74$
In
terg
over
nmen
tal r
even
ues
18,5
87,3
55
19
,412
,265
18,9
70,3
63
16
,731
,429
16,4
29,3
93
15
,622
,697
16,5
04,1
08
17
,366
,883
18,3
45,0
24
19
,457
,174
Gra
nts
847,
865
1,01
3,81
6
1,
052,
777
613,
153
667,
224
93
6,00
1
624,
286
778,
939
74
4,34
3
86
5,26
3
C
harg
es f
or s
ervi
ces
2,14
0,49
9
2,10
3,10
0
2,
304,
081
2,31
4,29
8
2,28
5,08
6
2,
305,
611
2,29
8,71
5
2,15
4,89
7
1,
995,
572
1,
912,
010
In
tere
st1,
061,
898
2,
224,
637
2,65
4,12
5
1,
203,
871
1,
267,
478
322,
065
20
3,91
2
71
,191
381,
508
486,
814
Con
trib
utio
ns23
2,60
4
37
9,89
0
324,
574
13
3,75
8
20
5,58
8
248,
570
26
9,06
5
16
5,20
0
157,
486
175,
138
Mis
cella
neou
s11
6,00
0
22
1,00
0
172,
285
34
2,20
5
31
1,99
2
759,
844
64
2,88
2
24
4,22
2
151,
013
220,
734
Tot
al R
even
ues
61,1
44,0
61
68
,860
,988
74,0
13,6
11
73
,858
,118
74,0
07,3
27
67
,159
,422
60,2
20,3
73
58
,019
,691
58,4
54,4
25
59
,843
,807
EX
PE
ND
ITU
RE
SC
ultu
re a
nd r
ecre
atio
n:S
alar
ies
and
wag
es20
,744
,981
21,7
86,1
83
22
,574
,934
23,7
34,6
56
25
,358
,689
23,0
37,1
10
23
,387
,955
23,1
54,9
18
23
,970
,365
25,0
70,4
08
E
mpl
oyee
ben
efit
s5,
508,
891
5,
789,
566
6,97
4,24
8
7,
679,
737
7,
987,
041
7,99
7,67
4
7,
941,
164
8,
038,
605
8,59
4,91
6
8,86
4,15
9
Sup
plie
s an
d se
rvic
es8,
680,
277
9,
378,
527
11,3
77,5
64
14
,258
,214
11,4
50,4
98
9,
438,
927
9,90
8,87
7
11,1
89,9
19
11
,749
,579
12,4
67,5
14
C
apit
al o
utla
y12
,189
,557
13,2
49,1
57
23
,031
,997
31,8
62,5
91
33
,132
,712
25,6
17,1
91
7,
607,
351
8,
782,
135
7,98
4,22
6
8,45
8,56
3
Deb
t Ser
vice
:P
rinc
ipal
6,93
0,00
0
5,62
0,00
0
5,
825,
000
6,05
0,00
0
6,32
5,00
0
6,
610,
000
9,23
5,00
0
5,63
5,00
0
5,
805,
000
6,
035,
000
In
tere
st1,
578,
319
1,
352,
819
1,16
1,08
1
95
5,28
1
2,
365,
598
2,60
1,83
7
2,
319,
513
1,
995,
400
1,82
6,35
0
1,59
4,15
0
Tot
al E
xpen
ditu
res
55,6
32,0
25
57
,176
,252
70,9
44,8
24
85
,162
,741
86,6
19,5
38
75
,302
,739
60,3
99,8
60
58
,795
,977
59,9
30,4
36
62
,489
,794
OT
HE
R F
INA
NC
ING
SO
UR
CE
S (
US
ES
)T
rans
fers
in10
,500
,000
11,7
00,0
00
13
,500
,000
12,8
95,0
00
11
,315
,117
8,90
3,50
0
7,
629,
500
46
,799
,036
6,60
0,00
0
8,10
0,00
0
Tra
nsfe
r ou
t(1
0,50
0,00
0)
(11,
700,
000)
(1
3,50
0,00
0)
(12,
895,
000)
(1
1,31
5,11
7)
(8,9
03,5
00)
(7,6
29,5
00)
(46,
799,
036)
(6
,600
,000
)
(8,1
00,0
00)
B
ond
Issu
ance
50,0
00,0
00
B
ond
Pre
miu
m2,
238,
907
Tot
al O
ther
Fin
anci
ng S
ourc
es (
Use
s)52
,238
,907
Net
Cha
nge
in F
und
Bal
ance
s5,
512,
036
$
11
,684
,736
$
3,06
8,78
7$
40
,934
,284
$
(12,
612,
211)
$ (8
,143
,317
)$
(1
79,4
87)
$
(7
76,2
86)
$
(1
,476
,011
)$
(2,6
45,9
87)
$
Deb
t ser
vice
as
a pe
rcen
tage
of n
onca
pita
l exp
endi
ture
s20
%16
%15
%13
%16
%19
%22
%15
%15
%14
%
(una
udit
ed)
Cha
nges
in F
und
Bal
ance
s, G
over
nmen
tal F
unds
Las
t T
en F
isca
l Yea
rs
Las
Veg
as-C
lark
Cou
nty
Lib
rary
Dis
tric
t
Tab
le F
our
96

IntergovernmentalFiscal Property ConsolidatedYear Taxes Sales Tax * Interest Other Total
2006 38,157,840$ 18,587,355$ 1,061,898$ 3,336,968$ 61,144,061$
2007 43,506,280 19,412,265 2,224,637 3,717,806 68,860,988
2008 48,535,406 18,402,065 2,654,125 4,422,015 74,013,611
2009 52,519,404 16,731,429 1,203,871 3,403,414 73,858,118
2010 52,840,566 16,429,393 1,267,478 3,469,890 74,007,327
2011 46,964,634 15,622,697 322,065 4,250,026 67,159,422
2012 39,677,405 16,504,108 203,912 3,834,948 60,220,373
2013 37,238,359 17,366,883 744,343 2,670,106 58,019,691
2014 36,679,479 18,345,024 381,508 3,048,414 58,454,425
2015 36,726,674 19,457,174 486,814 3,173,145 59,843,807
__________
*Previously called Supplemental City-County Relief Tax and Motor Vehicle Tax.
Last Ten Fiscal Years(unaudited)
Las Vegas-Clark County Library District
Table FiveGeneral Governmental Revenues by Source
97

2006 2015Percent of Percent of
Assessed Total Assessed Assessed Total AssessedTaxpayer Value Rank Valuation Value Rank Valuation
MGM Mirage 3,244,575,419$ 1 5.31% 3,164,727,682$ 1 5.50%
Nevada Energy 656,433,148 4 1.08% 2,005,977,837 2 3.49%
Caesar's Entertainment, Inc. 1,623,779,567 3 2.82%
Las Vegas Sands Corporation 997,888,951 4 1.74%
Wynn Las Vegas, LLC 405,069,669 8 0.66% 853,434,852 5 1.48%
Station Casinos Incorporated 441,315,596 7 0.72% 552,630,398 6 0.96%
Boyd Gaming Corporation 506,071,544 5 0.83% 292,763,981 7 0.51%
Nevada Property 1 LLC 275,029,024 8 0.48%
General Growth Properties 1,240,865,631 3 2.03%
Pulte Homes 372,171,914 9 0.61%
Focus Property Group 280,670,553 10 0.46%
Venetian Casino Resort LLC 476,090,088 6 0.78%
Harrah's Club 1,383,216,922 2 2.27%
Eldorado Energy LLC 209,865,386 9 0.37%
Hilton Grand Vacations 190,040,774 10 0.33%
Total, ten largest taxpayers 9,006,480,484$ 14.75% 10,166,138,452$ 17.68%
Clark County Assessed Valuation 61,060,915,772$ 57,491,891,230$
Source: Clark County Assessor's Office.
Fiscal Year 2015 and 2006(unaudited)
Las Vegas-Clark County Library District
Table SixPrincipal Property Tax Payers
98

2005
-06
2006
-07
2007
-08
2008
-09
2009
-10
2010
-11
2011
-12
2012
-13
2013
-14
2014
-15
Las
Veg
as-C
lark
Cou
nty
Lib
rary
Dis
tric
t0.
0866
0.08
660.
0866
0.08
090.
0909
0.10
110.
0942
0.09
420.
0942
0.09
42C
ount
ywid
e:C
lark
Cou
nty
Fund
s0.
6425
0.64
160.
6541
0.63
910.
6391
0.63
910.
6391
0.63
910.
6391
0.63
91C
lark
Cou
nty
Scho
ol D
istr
ict
1.30
341.
3034
1.30
341.
3034
1.30
341.
3034
1.30
341.
3034
1.30
341.
3034
Stat
e of
Nev
ada
0.17
000.
1700
0.17
000.
1850
0.18
500.
1850
0.18
500.
1850
0.18
500.
1850
Citi
es:
Bou
lder
City
0.18
440.
2038
0.21
880.
2188
0.26
000.
2600
0.26
000.
2600
0.26
000.
2600
Hen
ders
on0.
7108
0.71
080.
7108
0.71
080.
7108
0.71
080.
7108
0.71
080.
7108
0.71
08L
as V
egas
0.77
740.
7777
0.77
150.
7715
0.77
150.
7715
0.77
150.
7715
0.77
150.
7715
Mes
quite
0.55
200.
5520
0.55
200.
5520
0.55
200.
5520
0.55
200.
5520
0.55
200.
5520
Nor
th L
as V
egas
1.00
371.
1637
1.15
871.
1637
1.16
371.
1637
1.16
371.
1637
1.16
371.
1637
Uni
ncor
pora
ted
Tow
ns:
Bun
kerv
ille
0.02
000.
0200
0.02
000.
0200
0.02
000.
0200
0.02
000.
0200
0.02
000.
0200
Ent
erpr
ise
0.20
640.
2064
0.20
640.
2064
0.20
640.
2064
0.20
640.
2064
0.20
640.
2064
Indi
an S
prin
gs0.
0200
0.02
000.
0200
0.02
000.
0200
0.02
000.
0200
0.02
000.
0200
0.02
00L
augh
lin0.
8146
0.81
460.
8146
0.84
160.
8416
0.84
160.
8416
0.84
160.
8416
0.84
16M
oapa
Tow
n0.
2344
0.23
440.
2344
0.23
440.
1094
0.10
940.
1094
0.10
940.
1094
0.10
94M
oapa
Val
ley
0.02
000.
0200
0.02
000.
0200
0.02
000.
0200
0.02
000.
0200
0.02
000.
0200
Mou
nt C
harl
esto
n0.
0200
0.02
000.
0200
0.02
000.
0200
0.02
000.
0200
0.02
000.
0200
0.02
00Pa
radi
se0.
2064
0.20
640.
0206
0.02
060.
2064
0.20
640.
2064
0.20
640.
2064
0.20
64Se
arch
light
0.12
230.
1222
0.12
120.
1212
0.06
000.
0200
0.02
000.
0200
0.02
000.
0200
Spri
ng V
alle
y0.
2064
0.20
640.
2064
0.20
640.
2064
0.20
640.
2064
0.20
640.
2064
0.20
64Su
mm
erlin
0.20
640.
2064
0.20
640.
2064
0.20
640.
2064
0.20
640.
2064
0.20
640.
2064
Sunr
ise
Man
or0.
2064
0.20
640.
2064
0.20
640.
2064
0.20
640.
2064
0.20
640.
2064
0.20
64W
hitn
ey0.
2064
0.20
640.
2064
0.20
640.
2064
0.20
640.
2064
0.20
640.
2064
0.20
64W
inch
este
r0.
2064
0.20
640.
2064
0.20
640.
2064
0.20
640.
2064
0.20
640.
2064
0.20
64O
ther
:B
ould
er C
ity L
ibra
ry D
istr
ict
0.16
250.
1555
0.14
050.
1405
0.14
850.
1595
0.17
550.
2030
0.20
300.
2030
Cla
rk C
ount
y Fi
re D
epar
tmen
t0.
2197
0.21
970.
2147
0.21
470.
2197
0.21
970.
2197
0.21
970.
2197
0.21
97C
oyot
e Sp
ring
Val
ley
Gro
undw
ater
Bas
in0.
0522
0.04
960.
0052
0.00
390.
0018
0.00
230.
0000
0.00
000.
0000
0.00
00E
mer
genc
y 91
1 D
istr
ict
0.00
500.
0050
0.00
500.
0050
0.00
500.
0050
0.00
500.
0050
0.00
500.
0050
Hen
ders
on L
ibra
ry D
istr
ict
0.05
330.
0533
0.05
820.
0590
0.05
810.
0577
0.05
750.
0586
0.05
860.
0594
Kyl
e C
anyo
n W
ater
Dis
tric
t0.
0351
0.03
510.
0346
0.03
460.
0346
0.03
460.
0000
0.00
000.
0000
0.00
00L
as V
egas
Art
esia
n B
asin
0.00
130.
0009
0.00
080.
0008
0.00
110.
0015
0.00
000.
0000
0.00
000.
0000
Las
Veg
as M
etro
Pol
ice
- M
pwer
- C
ity0.
2800
0.28
000.
2800
0.28
000.
2800
0.28
000.
2800
0.28
000.
2800
0.28
00L
as V
egas
Met
ro P
olic
e -
Mpw
er -
Cou
nty
0.28
000.
2800
0.28
000.
2800
0.28
000.
2800
0.28
000.
2800
0.28
000.
2800
Low
er M
oapa
Gro
undw
ater
Bas
in0.
0000
0.00
000.
0000
0.00
000.
0006
0.00
080.
0000
0.00
000.
0000
0.00
00M
ount
Cha
rles
ton
Fire
Dep
artm
ent
0.88
130.
8813
0.88
130.
8913
0.88
130.
8813
0.88
130.
8813
0.88
130.
8813
Mud
dy R
iver
Spr
ings
Are
a G
roun
dwat
er B
asin
0.07
850.
0000
0.00
000.
0000
0.00
000.
0000
0.00
000.
0000
0.00
000.
0000
Nor
th L
as V
egas
Lib
rary
Dis
tric
t0.
0632
0.06
320.
0632
0.06
320.
0632
0.06
320.
0632
0.06
320.
0632
0.06
32
____
____
__*
Per
$100
of
asse
ssed
val
ue.
Con
stitu
tiona
l lim
it is
$3.
64 o
n an
y on
e ar
ea's
com
bine
d ta
x ra
te.
Sour
ce: C
lark
Cou
nty
Com
ptro
ller's
Off
ice.
Las
Veg
as-C
lark
Cou
nty
Lib
rary
Dis
tric
t
Tab
le S
even
Sch
edu
le o
f P
rop
erty
Tax
Rat
es *
- D
irec
t an
d O
verl
app
ing
Gov
ern
men
tsL
ast
Ten
Fis
cal Y
ears
(un
aud
ited
)
99

Tot
alT
otal
Ass
esse
d V
alu
eD
irec
tT
otal
Rea
l an
das
a P
erce
nta
ge o
fF
isca
lT
axP
erso
nal
Est
imat
edT
otal
Est
imat
edY
ear
Rea
lP
erso
nal
Tot
alR
ate
Mar
ket
Val
ue
Mar
ket
Val
ue
2006
61,0
60,9
15,7
72$
5,
787,
270,
132
$
66
,848
,185
,904
$
0.
6425
190,
994,
816,
868
$
35
%
2007
87,4
05,0
16,1
48
5,
954,
162,
886
93
,359
,179
,034
0.
6146
266,
740,
511,
525
35
%
2008
102,
349,
025,
402
6,
300,
900,
438
10
8,64
9,92
5,84
0
0.63
9131
0,42
8,35
9,54
2
35%
2009
106,
988,
178,
756
5,
817,
306,
838
11
2,80
5,48
5,59
4
0.63
9132
2,30
1,38
7,41
1
35%
2010
86,9
61,0
01,8
65
4,
772,
231,
316
91
,733
,233
,181
0.
6391
262,
094,
951,
945
35
%
2011
60,4
20,4
31,1
99
3,
706,
515,
345
64
,126
,946
,544
0.
6391
183,
219,
847,
268
35
%
2012
53,3
42,7
94,9
97
3,
369,
755,
692
56
,712
,550
,689
0.
6391
162,
035,
859,
110
35
%
2013
48,9
63,1
46,0
30
4,
303,
923,
931
53
,267
,069
,961
0.
6391
152,
191,
628,
459
35
%
2014
49,8
09,2
43,4
48
4,
906,
452,
131
54
,715
,695
,579
0.
6391
156,
330,
558,
797
35
%
2015
57,4
91,8
91,2
30
5,
099,
798,
428
62
,591
,689
,658
0.
6391
178,
833,
399,
022
35
%__
____
____
Sou
rce:
Cla
rk C
ount
y A
sses
sor's
Off
ice.
Not
e: P
rope
rty
in C
lark
Cou
nty
is r
eass
esse
d ea
ch y
ear.
Pro
pert
y is
ass
esse
d at
35%
per
cent
of
estim
ated
act
ual v
alue
.
Las
Veg
as-C
lark
Cou
nty
Lib
rary
Dis
tric
t
Pro
per
ty V
alu
e A
sses
sed
Tab
le E
igh
tA
sses
sed
an
d E
stim
ated
Act
ual
Val
ue
of T
axab
le P
rop
erty
in C
lark
Cou
nty
Las
t T
en F
isca
l Yea
rs(u
nau
dit
ed)
100

Cou
nty
Tax
Col
lect
ion
s in
Fis
cal
Lev
ied
for
th
e P
erce
nta
geS
ub
seq
uen
tP
erce
nta
geY
ear
Fis
cal Y
ear
Am
oun
tof
Lev
yY
ears
Am
oun
tof
Lev
y
2006
1,63
9,44
0,07
5$
1,63
2,19
1,29
7$
99
.56%
7,17
4,96
1$
1,
639,
366,
258
$
99
.99%
2007
1,92
7,50
4,17
2
1,90
9,96
4,72
3
99
.09%
16,7
09,7
90
1,92
6,67
4,51
3
99.9
9%
2008
2,18
0,15
1,41
0
2,14
4,48
1,51
9
98
.36%
25,9
22,9
75
2,17
0,40
4,49
4
99.5
5%
2009
2,35
9,50
8,21
8
2,31
0,90
5,96
8
97
.94%
30,1
12,9
90
2,34
1,01
8,95
8
99.2
2%
2010
2,26
7,77
9,83
8
2,21
6,52
4,82
5
97
.74%
32,6
07,2
31
2,24
9,13
2,05
6
99.1
8%
2011
1,77
0,12
7,14
2
1,73
6,37
4,71
8
98
.09%
22,5
50,1
72
1,73
6,37
4,71
8
98.0
9%
2012
1,60
0,89
5,12
2
1,57
6,91
3,22
9
98
.50%
17,6
94,7
91
1,57
6,91
3,22
9
98.5
0%
2013
1,46
0,62
3,23
5
1,44
6,10
1,30
2
99
.01%
10,4
47,3
87
1,45
6,54
8,68
9
99.7
2%
2014
1,46
7,94
4,83
9
1,45
3,56
3,81
0
99
.02%
10,6
17,5
46
1,46
4,15
4,35
6
99.7
4%
2015
1,51
6,99
3,05
9
1,50
6,09
8,69
7
99
.28%
*1,
506,
098,
697
99
.28%
____
____
__*N
ot a
vaila
ble
at ti
me
of p
rint
ing.
Sour
ce: C
lark
Cou
nty
Tre
asur
er's
Off
ice.
(un
aud
ited
)
Col
lect
ed w
ith
in t
he
Fis
cal Y
ear
of t
he
Lev
yT
otal
Col
lect
ion
s to
Dat
e
Las
Veg
as-C
lark
Cou
nty
Lib
rary
Dis
tric
t
Tab
le N
ine
Pro
per
ty T
ax L
evie
s an
d C
olle
ctio
ns
for
Cla
rk C
oun
tyL
ast
Ten
Fis
cal Y
ears
101
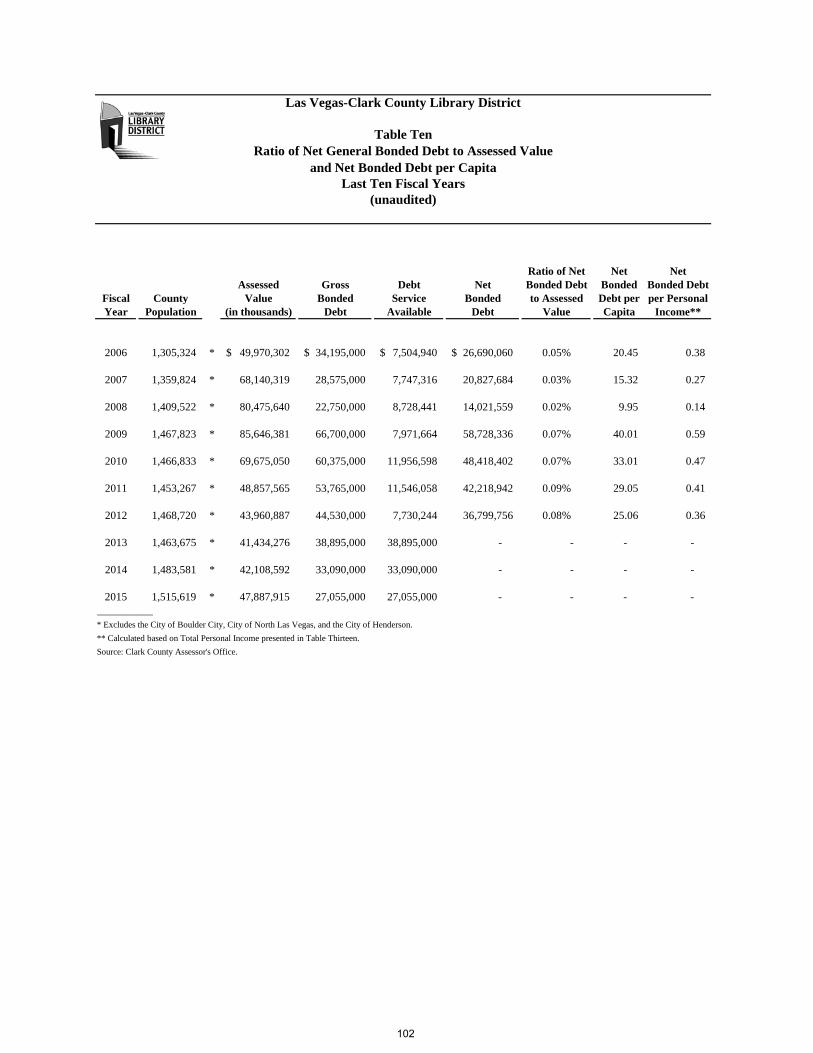
Ratio of Net Net NetAssessed Gross Debt Net Bonded Debt Bonded Bonded Debt
Fiscal County Value Bonded Service Bonded to Assessed Debt per per PersonalYear Population (in thousands) Debt Available Debt Value Capita Income**
2006 1,305,324 * 49,970,302$ 34,195,000$ 7,504,940$ 26,690,060$ 0.05% 20.45 0.38
2007 1,359,824 * 68,140,319 28,575,000 7,747,316 20,827,684 0.03% 15.32 0.27
2008 1,409,522 * 80,475,640 22,750,000 8,728,441 14,021,559 0.02% 9.95 0.14
2009 1,467,823 * 85,646,381 66,700,000 7,971,664 58,728,336 0.07% 40.01 0.59
2010 1,466,833 * 69,675,050 60,375,000 11,956,598 48,418,402 0.07% 33.01 0.47
2011 1,453,267 * 48,857,565 53,765,000 11,546,058 42,218,942 0.09% 29.05 0.41
2012 1,468,720 * 43,960,887 44,530,000 7,730,244 36,799,756 0.08% 25.06 0.36
2013 1,463,675 * 41,434,276 38,895,000 38,895,000 - - - -
2014 1,483,581 * 42,108,592 33,090,000 33,090,000 - - - -
2015 1,515,619 * 47,887,915 27,055,000 27,055,000 - - - - __________* Excludes the City of Boulder City, City of North Las Vegas, and the City of Henderson.
** Calculated based on Total Personal Income presented in Table Thirteen.
Source: Clark County Assessor's Office.
Table Ten
Las Vegas-Clark County Library District
(unaudited)Last Ten Fiscal Years
Ratio of Net General Bonded Debt to Assessed Valueand Net Bonded Debt per Capita
102

Ass
esse
d va
lue
of a
ll ta
xabl
e pr
oper
ty in
the
L
as V
egas
-Cla
rk C
ount
y L
ibra
ry D
istr
ict
2,30
3,57
4,08
3$
Deb
t lim
it ap
plic
able
to th
e L
as V
egas
-Cla
rk C
ount
y L
ibra
ry D
istr
ict
(1
0% o
f as
sess
ed v
alue
)23
0,35
7,40
8$
Am
ount
of
debt
app
licab
le to
the
debt
lim
it -
Gen
eral
Obl
igat
ion
Bon
ds o
f th
e L
as V
egas
-Cla
rk C
ount
y L
ibra
ry D
istr
ict
27,0
55,0
00
Leg
al d
ebt m
argi
n20
3,30
2,40
8$
Fis
cal Y
ear
En
ded
Ju
ne
30,
2006
2007
2008
2009
2010
2011
2012
2013
2014
2015
Deb
t lim
it5,
277,
041,
898
$
7,37
4,82
6,15
6$
8,72
4,50
8,65
4$
11
,280
,548
,559
$ 7,
484,
818,
853
$
5,27
3,55
9,10
3$
4,
765,
985,
606
$
4,
489,
071,
304
$
4,
572,
605,
789
$
230,
357,
408
$
T
otal
net
deb
t sub
ject
to li
mita
tion
34,1
95,0
00
28
,575
,000
22
,750
,000
66,7
00,0
00
60
,375
,000
53,7
65,0
00
44
,530
,000
38,8
95,0
00
33,0
90,0
00
27
,055
,000
Leg
al d
ebt m
argi
n5,
242,
846,
898
$
7,34
6,25
1,15
6$
8,70
1,75
8,65
4$
11
,213
,848
,559
$ 7,
424,
443,
853
$
5,21
9,79
4,10
3$
4,
721,
455,
606
$
4,
450,
176,
304
$
4,
539,
515,
789
$
203,
302,
408
$
Tot
al n
et d
ebt s
ubje
ct to
lim
itatio
nas
a p
erce
ntag
e of
deb
t lim
it0.
65%
0.39
%0.
26%
0.59
%0.
81%
1.02
%0.
93%
0.87
%0.
72%
11.7
4%
____
____
__S
ourc
e: L
VC
CL
D D
ebt M
anag
emen
t Pol
icy
2015
Jun
e 30
, 201
5(u
nau
dite
d)
Las
Veg
as-C
lark
Cou
nty
Lib
rary
Dis
tric
t
Tab
le E
leve
nC
ompu
tati
on o
f L
egal
Deb
t M
argi
n
103
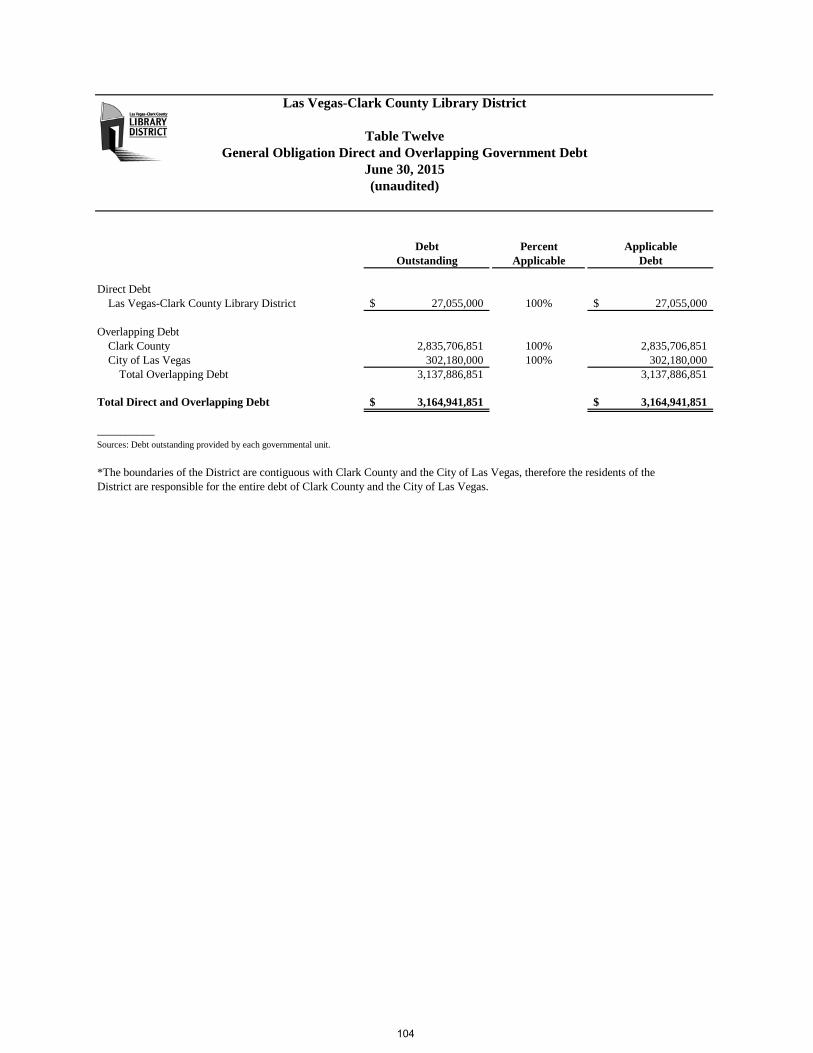
Debt Percent ApplicableOutstanding Applicable Debt
Direct DebtLas Vegas-Clark County Library District 27,055,000$ 100% 27,055,000$
Overlapping DebtClark County 2,835,706,851 100% 2,835,706,851City of Las Vegas 302,180,000 100% 302,180,000
Total Overlapping Debt 3,137,886,851 3,137,886,851
Total Direct and Overlapping Debt 3,164,941,851$ 3,164,941,851$
__________Sources: Debt outstanding provided by each governmental unit.
*The boundaries of the District are contiguous with Clark County and the City of Las Vegas, therefore the residents of theDistrict are responsible for the entire debt of Clark County and the City of Las Vegas.
(unaudited)
Las Vegas-Clark County Library District
Table TwelveGeneral Obligation Direct and Overlapping Government Debt
June 30, 2015
104

Tot
alP
er C
apit
aC
alen
dar
Cou
nty
Per
sona
lP
erso
nal
Med
ian
Scho
olU
nem
ploy
men
t
Yea
rP
opul
atio
n*In
com
e**
Inco
me*
*A
ge*
Enr
ollm
ent*
** R
ate
****
*
2006
1,81
5,70
0
59,7
93,2
50$
37
,089
$
47.5
303,
000
4.00
%
2007
1,87
4,83
7
69,4
45,8
00
38
,281
50.1
308,
000
6.50
%
2008
1,95
4,31
9
77,2
78,6
00
40
,353
35.7
311,
417
6.30
%
2009
1,98
6,14
6
99,6
20,8
09
37
,691
35.7
311,
240
12.3
0%
2010
1,49
3,69
9
99,8
51,3
79
36
,919
35.3
309,
476
14.6
0%
2011
1,45
3,26
7
103,
956,
791
38
,173
35.3
309,
893
14.0
0%
2012
1,46
8,72
0
103,
076,
310
37
,361
35.4
308,
447
11.6
0%
2013
1,46
3,67
5
108,
593,
284
38
,920
36.2
311,
429
9.60
%
2014
1,48
3,58
1
****
****
36.4
314,
643
7.70
%
2015
1,51
5,61
9
****
****
36.8
318,
040
7.00
%__
____
____
* So
urce
: Nev
ada
Stat
e D
emog
raph
er
** S
ourc
e: B
urea
u of
Eco
nom
ic A
naly
sis
***
Sour
ce: C
lark
Cou
nty
Scho
ol D
istr
ict
****
Not
ava
ilabl
e at
tim
e of
pri
ntin
g
****
* So
urce
: Bur
eau
of L
abor
Sta
tistic
s
(un
aud
ited
)L
ast
Ten
Cal
end
ar Y
ears
Las
Veg
as-C
lark
Cou
nty
Lib
rary
Dis
tric
t
Tab
le T
hir
teen
Dem
ogra
ph
ic S
tati
stic
s -
Cla
rk C
oun
ty
105

2006 2015Percent of Percent of
Total County Total CountyTaxpayer Employees Rank Employment Employees Rank Employment
Clark County School District 35,000 1 3.94% 35,000 1 3.66%
Clark County 9,750 2 1.10% 8,250 2 0.86%
MGM Grand Hotel/Casino 8,250 3 0.86%
Wynn Las Vegas LLC 8,250 4 0.86%
Bellagio LLC 8,250 5 0.86%
Aria Resort & Casino LLC 7,750 6 0.81%
Mandalay Bay Resort & Casino 8,250 3 0.93% 7,250 7 0.76%
University of Nevada-LV 5,750 4 0.65% 5,250 8 0.55%
Caesar's Palace Hotel & Casino 5,250 6 0.59% 5,250 9 0.55%
Las Vegas Metropolitan Police 4,750 7 0.54% 4,750 10 0.50%
Mirage Casino Hotel 5,750 5 0.65%
Rio Suite Hotel & Casino 4,250 8 0.48%
University Medical Center 3,750 9 0.42%
Flamingo Hotel & Casino 3,750 10 0.42%
Source: Clark County Comptroller's Office
Fiscal Year 2015 and 2006(unaudited)
Las Vegas-Clark County Library District
Table FourteenPrincipal Employers
106

Fis
cal Y
ear
En
ded
Ju
ne
30,
2006
2007
2008
2009
2010
2011
2012
2013
2014
2015
FU
NC
TIO
N/P
RO
GR
AM
Cul
ture
and
rec
reat
ion
493
500
528
523
466
462
463
468
485
496
Las
Veg
as-C
lark
Cou
nty
Lib
rary
Dis
tric
t
Tab
le F
ifte
enF
ull-
Tim
e E
qu
ival
ent
Em
plo
yees
by
Fu
nct
ion
Las
t T
en F
isca
l Yea
rs(u
nau
dit
ed)
107

Percent LibraryFiscal Increase MediaYear Circulation* (Decrease) Materials*
2006 10,396,713 (3.41%) 2,710,591
2007 10,593,661 2% 2,815,628
2008 12,170,182 15% 2,925,000
2009 13,242,715 9% 6,096,673
2010 13,744,009 4% 6,399,227
2011 12,637,724 (8%) 5,851,591
2012 13,449,178 6.4% 6,649,948
2013 13,574,331 1.0% 7,093,436
2014 13,757,192 1.33% 7,085,910
2015 13,418,861 (2.46%) 6,964,109 __________* Source: Las Vegas-Clark County Library District
Last Ten Fiscal Years (unaudited)
Las Vegas-Clark County Library District
Table SixteenCirculation Summary
108
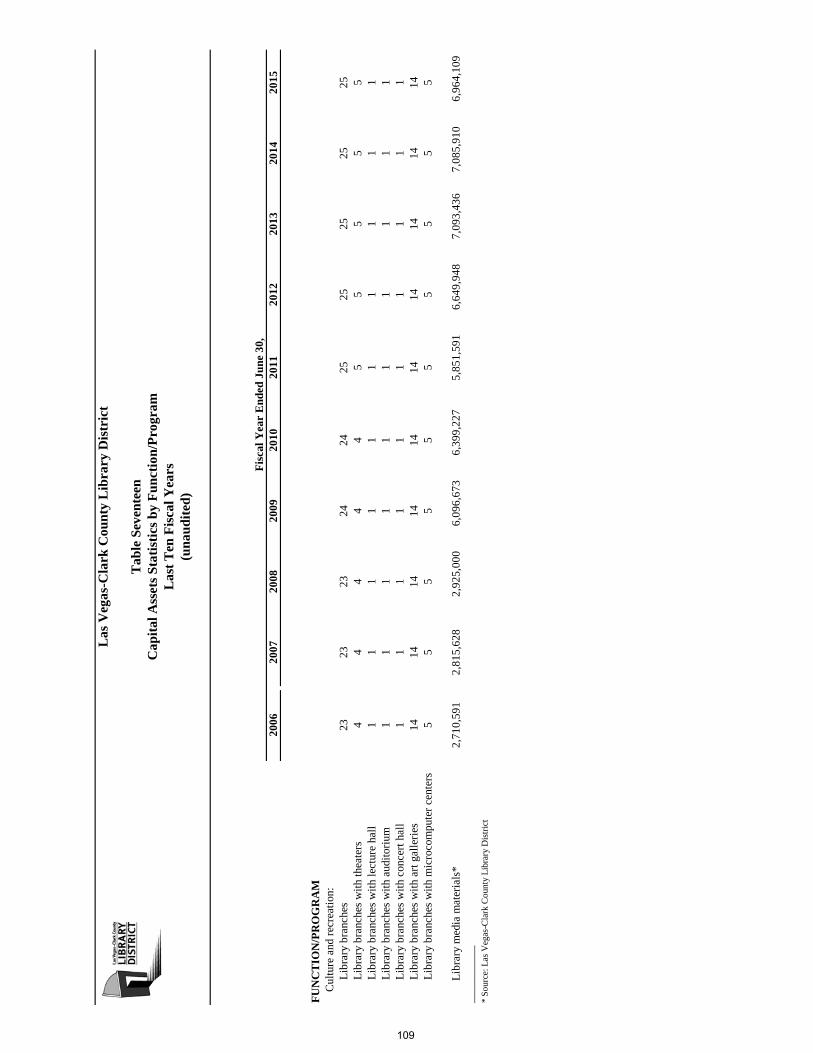
Fis
cal Y
ear
End
ed J
une
30,
2006
2007
2008
2009
2010
2011
2012
2013
2014
2015
FU
NC
TIO
N/P
RO
GR
AM
Cul
ture
and
rec
reat
ion:
Lib
rary
bra
nche
s23
2323
2424
2525
2525
25
L
ibra
ry b
ranc
hes
wit
h th
eate
rs4
44
44
55
55
5
L
ibra
ry b
ranc
hes
wit
h le
ctur
e ha
ll1
11
11
11
11
1
L
ibra
ry b
ranc
hes
wit
h au
dito
rium
11
11
11
11
11
Lib
rary
bra
nche
s w
ith
conc
ert h
all
11
11
11
11
11
Lib
rary
bra
nche
s w
ith
art g
alle
ries
1414
1414
1414
1414
1414
Lib
rary
bra
nche
s w
ith
mic
roco
mpu
ter
cent
ers
55
55
55
55
55
Lib
rary
med
ia m
ater
ials
*2,
710,
591
2,81
5,62
82,
925,
000
6,09
6,67
36,
399,
227
5,85
1,59
16,
649,
948
7,09
3,43
67,
085,
910
6,96
4,10
9
__
____
____
* S
ourc
e: L
as V
egas
-Cla
rk C
ount
y L
ibra
ry D
istr
ict
Cap
ital
Ass
ets
Stat
isti
cs b
y F
unct
ion/
Pro
gram
Las
t T
en F
isca
l Yea
rs
Las
Veg
as-C
lark
Cou
nty
Lib
rary
Dis
tric
t
Tab
le S
even
teen
(una
udit
ed)
109

This page intentionally left blank
SINGLE AUDIT ANDACCOMPANYING INFORMATION

This page intentionally left blank


Pass-throughFederal Entity
Federal Grantor/Pass-through CFDA IdendifyingGrantor / Program Title Number Number Expenditures
Institute of Museum and Library Services
National Leadership Grants 45.312 44,695$
U.S. Department of Education, Office of Vocational and Adult Education
Passed Through State of Nevada, Department of Education
Adult Education, Basic Grants to States 84.002 * 14-607-32000 739,08314-608-32000
Total federal assistance expended 783,778$
Las Vegas - Clark County Library District
Schedule of Expenditures of Federal AwardsFor the Fiscal Year Ended June 30, 2015
* A "major" program.
115
Las Vegas-Clark County Library District
Notes to Schedule of Federal Expenditures of Federal Awards For the Fiscal Year Ended June 30, 2015
______________________________________________________________________________
Note 1. Reporting Entity
The accompanying supplementary schedule of expenditures of federal awards presents the activity of all federal financial assistance programs of the Las Vegas-Clark County Library District (the District). The reporting entity is defined in Note 1 to the basic financial statements. The schedule includes all expended federal financial assistance received directly from federal agencies as well as passed through other government agencies.
Note 2. Basis of Presentation
The accompanying schedule of expenditures of federal awards includes the federal grant activity of the District and is presented on the accrual basis of accounting. The information in this schedule is presented in accordance with the requirements of OMB Circular A-133, Audits of States, Local Governments and Non-Profit Organizations. Therefore, some amounts presented in this schedule may differ from amounts presented in, or used in the preparation of, the basic financial statements.
116

Las Vegas – Clark County Library District
Schedule of Findings and Questioned Costs For the Fiscal Year Ended June 30, 2015
Section I - Summary of Auditors' Results:
Financial Statements:
Type of auditors' report issued:
Internal control over financial reporting:
Material weaknesses identified?
Significant deficiencies identified that are not considered to be material weaknesses?
Noncompliance material to financial statements?
Federal Awards:
Internal control over major programs:
Material weaknesses identified?
Significant deficiencies identified that are not considered to be material weaknesses?
Type of auditors' report issued on compliance for major programs:
Any audit findings disclosed that are required to be reported in accordance with Circular A-133, Section .510(a)?
Identification of major programs:
CFDA Number: Name of Federal Program or Cluster:
Dollar threshold used to distinguish between Type A and Type B programs:
Auditee qualified as low-risk auditee?
Section II – Findings relating to the financial statements, which are required to be reported in accordance with auditing standards generally accepted in the United States and Government Auditing Standards:
Section III – Findings and questioned costs for federal awards, including audit findings as defined in Circular A-133 Section .510(a):
Unmodified
No
None reported
No
No
None reported
Unmodified
No
84.002 U.S. Department of Education, Office
of Vocational and Adult Education, Adult Education, Basic Grants to States
$300,000
Yes
None reported
None reported
117

Las Vegas-Clark County Library District Service Area and Branch Locations
123456789
1011121314
1516171819202122232425
Centennial HillsClark CountyEnterpriseLas VegasMeadowsRainbowSahara WestSpring ValleySummerlinSunriseWest CharlestonWest Las VegasWhitneyWindmill
Urban Branches Outlying BranchesBlue DiamondBunkervilleGoodspringsIndian Springs LaughlinMesquiteMoapa TownMoapa ValleyMt. CharlestonSandy ValleySearchlight
All urban branches are open Monday – Thursday from 10 a.m. to 8 p.m. and Friday, Saturday and Sunday from 10 a.m. to 6 p.m. Outlying branch hours vary; please call for hours.
702.734.READ
Las Vegas-Clark County Library District Service Area and Branch Locations
123456789
1011121314
1516171819202122232425
Centennial HillsClark CountyEnterpriseLas VegasMeadowsRainbowSahara WestSpring ValleySummerlinSunriseWest CharlestonWest Las VegasWhitneyWindmill
Urban Branches Outlying BranchesBlue DiamondBunkervilleGoodspringsIndian Springs LaughlinMesquiteMoapa TownMoapa ValleyMt. CharlestonSandy ValleySearchlight
All urban branches are open Monday – Thursday from10 a.m. to 7 p.m. and Friday, Saturday and Sunday from 10 a.m. to 6 p.m. Outlying branch hours vary; please call for hours.
734-READ
Map not to scale.N
Deer Springs Way
Jone
s Bl
vd.
Mar
ylan
d Pk
wy.
Nel
lis B
lvd.D
uran
go D
r.
Gra
nd C
anyo
n
Rain
bow
Blv
d.
Cheyenne Ave.
Lake Mead Blvd.
E. Shelbourne
Harris Ave.
Tropicana Ave.
Flamingo Rd.
Bonanza Rd.
Charleston Blvd.
W. Windmill Ln.
Sahara Ave.
Las Vegas B
lvd.
2
117
12
13
4 10
5
6
8
9
3
14
1
Fort
Apa
che
Summerlin Pkwy.
Henderson
NorthLas Vegas
15
16
1724
25
18
19
2021
22
23
118