comprehensive annual financial report -...
TRANSCRIPT

Comprehensive Annual Financial Report
City of Lynwood, California Year ended June 30, 2009
with Report of Independent Auditors
CITY OF LYNWOOD COMPREHENSIVE ANNUAL FINANCIAL REPORT
CITY MANAGEMENT Roger L. Haley – City Manager
Robert S. Torres – Assistant City Manager – Administration & Community Services Lorry Hempe – Assistant City Manager – Development
Dan Ojeda – Public Works Jonathan Colin – Development Services
Perry Brents – Recreation and Community Services Alfredo Lopez – Human Resources
Sarah Withers – Redevelopment Deborah Jackson – Neighborhood Services
PROJECT TEAM Robert S. Torrez – Assistant City Manager – Administration & Community Services
Christy Valencia – Finance Manager May Tan – Accounting / Auditing Supervisor
Patricia Tarin – Financial Analyst Maria Luna – Billing & Collections Supervisor Miguel Angel Cervantes – Administrative Aide
Jaime Rivas – Payroll Specialist Lilly Mojarro – Accounting Technician
Monica Castellanos – Accounting Technician Joe Udeochu – Accounting Technician Jamel Goodloe – Graphics Technician

City of Lynwood Table of Contents
PAGEINTRODUCTORY SECTION Letter of Transmittal 1 Organizational Chart 7 FINANCIAL SECTION Report of Independent Auditors 8
Management’s Discussion and Analysis 10
Government-wide Financial Statements
Statement of Net Assets 19Statement of Activities 20
Fund Financial Statements Balance Sheet 22Reconciliation of the Balance Sheet of Governmental Funds to the Statement of Net Assets 24Statement of Revenues, Expenditures, and Changes in Fund Balances 25Reconciliation of the Statement of Revenues, Expenditures, and Changes in Fund Balances of Governmental Funds to the Statement of Activities 27
Proprietary Funds Statement of Net Assets 28Statement of Revenues, Expenses, and Changes in Fund Net Assets 29
Statement of Cash Flows 30 Fiduciary Funds
Statement of Fiduciary Assets and Liabilities 31
Notes to Financial Statements 32 REQUIRED SUPPLEMENTARY INFORMATION
Schedule of Revenues, Expenditures, and Changes in Fund Balance - Budget and Actual – General Fund 80Schedule of Revenues, Expenditures, and Changes in Fund Balance - Budget and Actual – Redevelopment Agency Low/Mod Housing Area “A” Special Revenue Fund 81Schedule of Revenues, Expenditures, and Changes in Fund Balance - Budget and Actual – HUD Home Program Special Revenue Fund 82California Public Retirement – Schedules of Funding Progress 83Notes to Required Supplementary Information 84
SUPPLEMENTAL INFORMATION
Budgetary Comparison Schedule – Other Major Funds Schedule of Revenues, Expenditures, and Changes in Fund Balance - Budget and Actual – Major Capital Projects Funds
Redevelopment Agency Low/Mod Housing Area “A” Special Revenue Fund 85 Capital Improvement Projects Capital Projects Fund 86 2002 HUD Section 108 Loan Capital Projects Fund 87
City of Lynwood Table of Contents
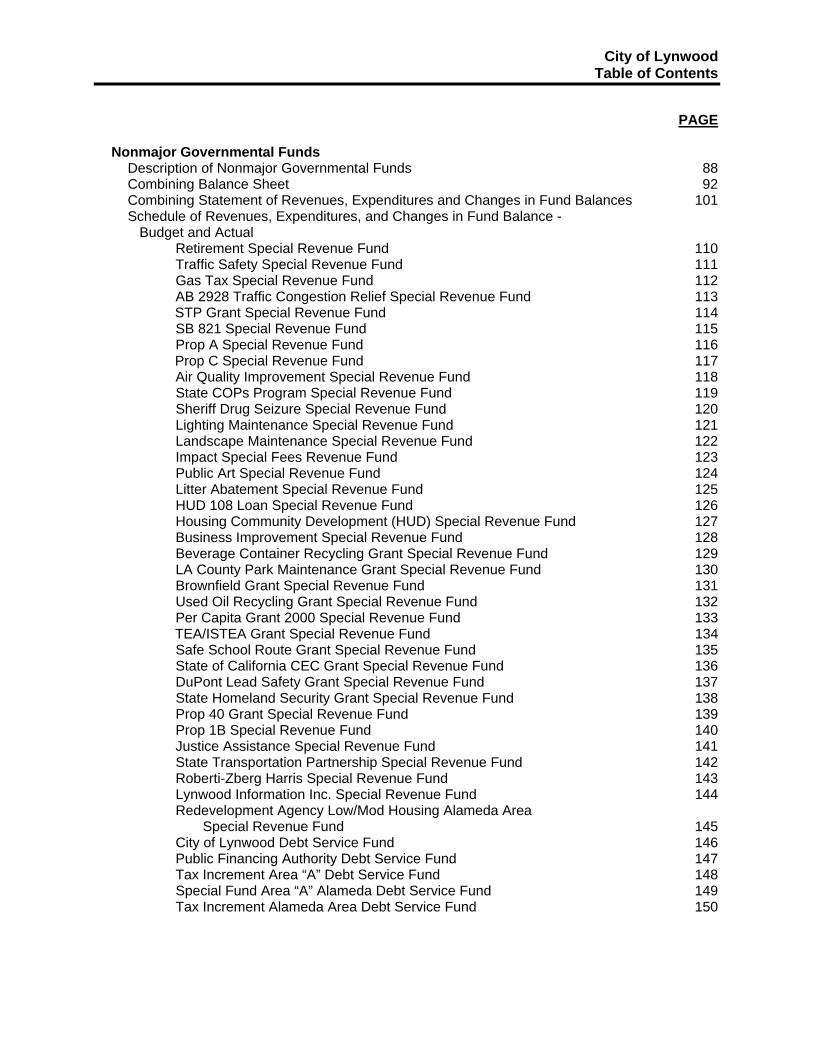
PAGE Nonmajor Governmental Funds
Description of Nonmajor Governmental Funds 88Combining Balance Sheet 92Combining Statement of Revenues, Expenditures and Changes in Fund Balances 101Schedule of Revenues, Expenditures, and Changes in Fund Balance - Budget and Actual
Retirement Special Revenue Fund 110Traffic Safety Special Revenue Fund 111Gas Tax Special Revenue Fund 112AB 2928 Traffic Congestion Relief Special Revenue Fund 113
STP Grant Special Revenue Fund 114SB 821 Special Revenue Fund 115Prop A Special Revenue Fund 116
Prop C Special Revenue Fund 117Air Quality Improvement Special Revenue Fund 118State COPs Program Special Revenue Fund 119Sheriff Drug Seizure Special Revenue Fund 120Lighting Maintenance Special Revenue Fund 121Landscape Maintenance Special Revenue Fund 122Impact Special Fees Revenue Fund 123Public Art Special Revenue Fund 124Litter Abatement Special Revenue Fund 125HUD 108 Loan Special Revenue Fund 126Housing Community Development (HUD) Special Revenue Fund 127Business Improvement Special Revenue Fund 128Beverage Container Recycling Grant Special Revenue Fund 129LA County Park Maintenance Grant Special Revenue Fund 130Brownfield Grant Special Revenue Fund 131Used Oil Recycling Grant Special Revenue Fund 132Per Capita Grant 2000 Special Revenue Fund 133
TEA/ISTEA Grant Special Revenue Fund 134Safe School Route Grant Special Revenue Fund 135State of California CEC Grant Special Revenue Fund 136DuPont Lead Safety Grant Special Revenue Fund 137State Homeland Security Grant Special Revenue Fund 138Prop 40 Grant Special Revenue Fund 139Prop 1B Special Revenue Fund 140Justice Assistance Special Revenue Fund 141State Transportation Partnership Special Revenue Fund 142Roberti-Zberg Harris Special Revenue Fund 143Lynwood Information Inc. Special Revenue Fund 144Redevelopment Agency Low/Mod Housing Alameda Area Special Revenue Fund 145City of Lynwood Debt Service Fund 146Public Financing Authority Debt Service Fund 147Tax Increment Area “A” Debt Service Fund 148Special Fund Area “A” Alameda Debt Service Fund 149Tax Increment Alameda Area Debt Service Fund 150

City of Lynwood Table of Contents
PAGE Nonmajor Governmental Funds (continued)
Park Replacement Capital Projects Fund 151Capital Grant Loan Capital Projects Fund 1522003 Lease Refunding Bonds Capital Projects Fund 153Redevelopment Project Area “A” Taxable Bond Proceeds Fund 154Redevelopment Project Alameda Area Capital Projects Fund 155
Internal Service Fund Description of Internal Service Funds 156 Combining Statements of Net Assets 157 Combining Statement of Revenues, Expenses and Changes in Net Assets 158 Combining Statement of Cash Flows 159
Agency Fund
Statement of Changes in Assets and Liabilities 160
STATISTICAL SECTION (UNAUDITED) Description of Statistical Section Contents 161Net Assets by Component 162Changes in Net Assets – Expenses and Program Revenues 163Changes in Net Assets – General Revenues 164Fund Balances of Governmental Funds 165Changes in Fund Balances of Governmental Funds 167
Tax Revenues by Source of Governmental Funds 169Assessed Value 170Direct and Overlapping Property Tax Rates 172Principal Property Taxpayers 173Property Tax Levies and Collections 174Taxable Sales by Category 175Direct and Overlapping Sales Tax Rates 177Principal Sales Tax Remitters 178Ratios of General Bonded Debt Outstanding 179Ratios of Outstanding Debt by Type 180Direct and Overlapping Governmental Activities Debt 182Legal Debt Margin Information 183Pledged Revenue Coverage 185Demographic and Economic Statistics 187Principal Employers 188Full-Time Equivalent City Government Employees by Function/Program 189Operating Indicators by Function/Program 190Capital Asset Statistics by Function/Program 191

(This page intentionally left blank.)

1

(This page intentionally left blank.)

2

(This page intentionally left blank.)

3

(This page intentionally left blank.)
4

(This page intentionally left blank.)
5

(This page intentionally left blank.)
6

(This page intentionally left blank.)

Lynwood Residents
Commissions&
BoardsCity Council
City Treasurer
City Clerk
City ManagerCity Attorney
ACM / Administrative&
Community Services
Finance &
Administration
Human Resources
Recreation &Community
Services
NeighborhoodServices Redevelopment Public Works
DevelopmentServices
ACM / Development
Public Safety Contracts
(County SheriffCounty Fire)
Community Affairs CommissionCDBG Advisory BoardPersonnel BoardPlanning CommissionPublic Safety CommissionRecreation & Parks CommissionTraffic & Safety CommissionWomen CommissionYouth Commission
Volunteer Boards/CommissionSenior Advisory BoardVeterans Affairs Commission
Admin. ServicesBudget Office
Intergov. RelationsMarketing
Organizational Chart
7


FINANCIAL SECTION

(This page intentionally left blank.)


(This page intentionally left blank.)

(This page intentionally left blank.)

City of Lynwood Management’s Discussion and Analysis
June 30, 2009
10
The discussion and analysis of the City of Lynwood’s financial performance provides readers of the City’s financial statements an overview and analysis of the City’s financial activities for the fiscal year ended June 30, 2009. We encourage readers to consider information noted below in conjunction with the basic financial statements.
FINANCIAL HIGHLIGHTS
• The City’s total assets as of June 30, 2009 were $198.6 million and total liabilities were $65.1 million. The assets exceeded liabilities by $133.5 million (net assets).
• During the fiscal year, the City’s general fund uses (including expenditures and transfers out) exceeded sources (including revenues and transfers in) by slightly over $400,000. The transfers totaled slightly over $580,000. The year-end fund balance for the General Fund was $9.7 million of which $164,456 was reserved for long-term advances.
• Total revenues from all sources were $58.3 million and total expenditures were $54.9 million. Of the total revenues, program revenues were $23.2 million. Program revenues are broken into three categories: Charges for services at $16.2 million, operating contributions and grants at $5.6 million; and capital contributions and grants at $1.4 million.
ROAD MAP FOR THE FY 2008-09 FINANCIAL AUDIT REPORT The Management’s Discussion and Analysis section is intended to serve as the introduction to the City’s basic financial statements, which contain the basic financial data, as well as important supplemental information. Included in this report are the activities of the City of Lynwood and its component units (the Lynwood Redevelopment Agency, the Lynwood Public Financing Authority, the Lynwood Utility Authority, and the Lynwood Information Incorporated). The activities are presented using the integrated approach prescribed by the Government Accounting Standards Board (GASB) Statement No. 34. Also per GASB Statement No. 34, certain interfund receivables, payables, and other interfund activities have been eliminated from the financial statements as they do not have any net impact on the financial statements as a whole. The City’s basic financial statements contain a number of elements. The Statement of Net Assets and the Statement of Activities provide information about the activities of the City as a whole and present a longer-term view of the City’s finances. Fund Financial Statements explain how these services were financed in the short term as well as what remains for future spending. Fund financial statements also report the City’s operations in more detail than the government-wide statements, by providing information about the City’s most significant funds. The remaining statements provide financial information about activities for which the City acts solely as a trustee or agent for the benefit of those outside of the government. Reporting the City as a Whole: Statement of Net Assets and Statement of Activities One of the most important questions on the City’s finances is, “Is the City as a whole better off or worse off as a result of this year’s activities?” The Statement of Net Assets and the Statement of Activities report information about the City as a whole and about its activities in a way that helps answer this question. These statements include all assets and liabilities using the accrual basis of accounting, which is similar to the accounting used by most private sector companies. All of the current year’s revenues and expenses are taken into account regardless of when cash is received or paid.

City of Lynwood Management’s Discussion and Analysis
June 30, 2009
11
These two statements provide detail on the City’s net assets and changes affecting them. The City’s net assets – the difference between the total assets and liabilities – are ways to measure the City’s overall financial health, or financial position. Over time, increases or decreases in the City’s net assets may be a good indicator of whether its financial health is improving or deteriorating. However, the need exists to consider other non-financial factors, such as changes in the City’s property tax base and the condition of the City’s roads, to assess the overall health of the City. The Statement of Net Assets and the Statement of Activities present information about the following:
• Governmental Activities - All of the City’s basic services are considered to be governmental activities, including general government, community development, public safety, public works, parks and recreation, and redevelopment. Property taxes, sales taxes, charges for services, franchise fees and other similar revenue sources pay for most of these activities.
• Component Units - The City’s governmental activities include the blending of three separate
legal entities - the Lynwood Redevelopment Agency, the Lynwood Public Financing Authority, and the Lynwood Information Incorporated. Although legally separate, these “component units” are important because the City is financially accountable for them. The Lynwood Utility Authority is included in the business-type activities in the Statement of Net Assets and Activities.
Reporting the City’s Most Significant Funds: Fund Financial Statements The fund financial statements provide detailed information about the most significant funds, and not the City as a whole. Some funds are required to be established by State law and by bond covenants. However, the City Council establishes many other funds to help control and manage money for particular purposes or to show that it is meeting legal responsibilities for using certain taxes, grants, and other restricted sources. The City’s two kinds of funds – governmental and proprietary – use different accounting approaches.
• Governmental Funds - Most of the City’s basic services are reported in governmental funds, which focus on how money flows into and out of those funds, and the balance left at year-end that is available for spending. These funds are reported using an accounting method called the modified accrual basis of accounting, which measures cash and all other financial assets that can readily be converted to cash. The governmental fund statements provide a detailed short-term view of the City’s general government operations and the basic services it provides. Governmental fund information helps to determine whether there are more or less financial resources that can be spent in the near future to finance the City’s programs. We describe the relationship (or differences) between governmental activities (reported in the Statement of Net Assets and the Statement of Activities) and governmental funds in the reconciliation following the fund financial statements.
Proprietary Funds – Proprietary funds are used to account for operations that are financed and operated in a manner similar to business enterprises. When the City charges other entities or its own department for certain services it provides, these services are generally reported in proprietary funds. Proprietary funds are reported in the same way as in the Statement of Net Assets and the Statement of Activities. The City uses internal service funds to report activities that provide services for the City’s other programs and activities, such as the City’s Garage Fund and Insurance Fund.
City of Lynwood Management’s Discussion and Analysis
June 30, 2009
12
Reporting the City’s Fiduciary Responsibilities: Fiduciary Funds The City is the trustee, or fiduciary, for certain amounts held on behalf of developers, property owners, and others. The City’s fiduciary activities are reported in separate Statements of Fiduciary Net Assets. These activities have been excluded from the City’s other financial statements because the City cannot use these assets to finance its operations. The City is responsible for ensuring that the assets reported in these funds are used for their intended purposes.
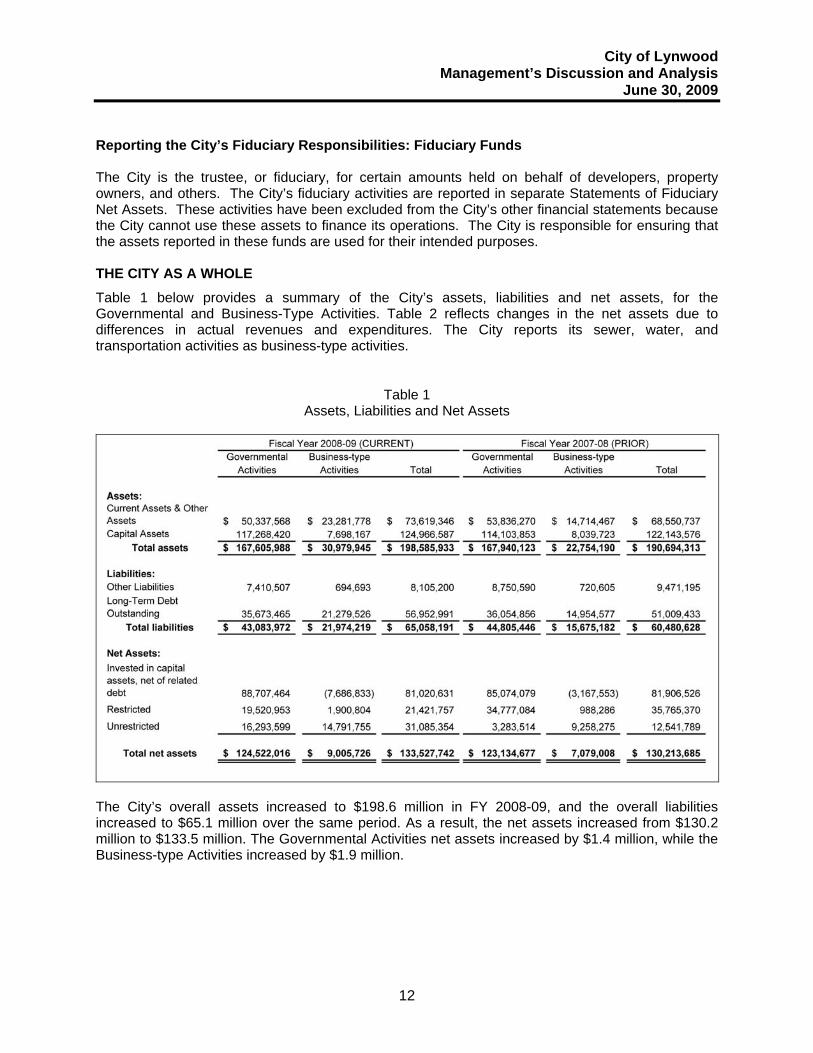
THE CITY AS A WHOLE Table 1 below provides a summary of the City’s assets, liabilities and net assets, for the Governmental and Business-Type Activities. Table 2 reflects changes in the net assets due to differences in actual revenues and expenditures. The City reports its sewer, water, and transportation activities as business-type activities.
Table 1 Assets, Liabilities and Net Assets
The City’s overall assets increased to $198.6 million in FY 2008-09, and the overall liabilities increased to $65.1 million over the same period. As a result, the net assets increased from $130.2 million to $133.5 million. The Governmental Activities net assets increased by $1.4 million, while the Business-type Activities increased by $1.9 million.

City of Lynwood Management’s Discussion and Analysis
June 30, 2009
13
Table 2
Changes in Net Assets
The City’s overall net assets increased since the beginning of the year, from $130.2 million to $133.5 million. The reason for the increase is the positive difference between the actual revenues of $58.3 million and the actual expenditures of $54.9 million. As reflected in the above table, the positive revenue/expenditure difference is a net $3.3 million. Governmental Activities is a surplus of $1.4 million; and Business-Type Activities is surplus of $1.9 million.
Compared to FY 2007-08, the City’s overall revenues decreased from $61.6 million to $58.3 million. The overall expenditures increased from $52.1 million to $54.9 million.

City of Lynwood Management’s Discussion and Analysis
June 30, 2009
14
GOVERNMENTAL ACTIVITIES Table 3 presents the cost of each of the City’s Governmental Activities: general government, public safety, public works, community development, parks and recreation, and interest on long-term debt, along with each program’s net cost (total cost less revenues generated by the activities.) The net cost shows the financial burden that was placed on the City’s taxpayers by each of these functions.
Table 3 Governmental Activities
Net Cost of Services
The cost of the City’s Governmental Activities increased from $44.5 million in FY 2007-08 to $46.1 million in FY 2008-09 primarily due to increased costs of public safety services, costs of city-wide services as well as salaries and benefits. The program revenue generated by these activities has decreased from $16.7 million to $13.2 million. As a result of the respective changes in the revenues and expenditures, the net cost of the Government Activities was $33.0 million in FY 2008-09, $5.1 million more than the net cost of $27.9 million recorded in FY 2007-08. Overall, the cost of government in FY 2008-09 exceeded the program revenues generated to support it.
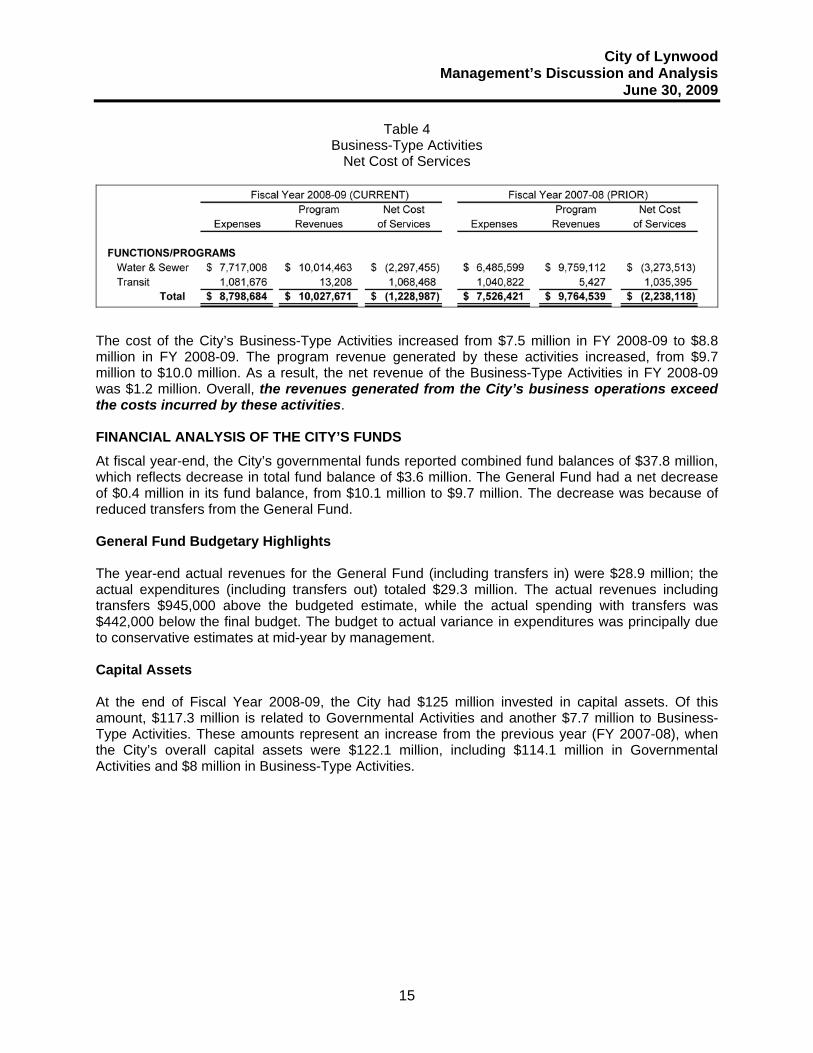
BUSINESS-TYPE ACTIVITIES Table 4 reflects the cost of the City’s Business-Type Activities: water, sewer and transit, along with the programs’ net cost. The net revenue for these activities was $1.2 million in FY 2008-09, with the transit services having a net cost of over $1.1 million, as opposed to the net revenue of $2.3 million recorded in the water and sewer program.
City of Lynwood Management’s Discussion and Analysis
June 30, 2009
15
Table 4 Business-Type Activities
Net Cost of Services
The cost of the City’s Business-Type Activities increased from $7.5 million in FY 2008-09 to $8.8 million in FY 2008-09. The program revenue generated by these activities increased, from $9.7 million to $10.0 million. As a result, the net revenue of the Business-Type Activities in FY 2008-09 was $1.2 million. Overall, the revenues generated from the City’s business operations exceed the costs incurred by these activities.
FINANCIAL ANALYSIS OF THE CITY’S FUNDS At fiscal year-end, the City’s governmental funds reported combined fund balances of $37.8 million, which reflects decrease in total fund balance of $3.6 million. The General Fund had a net decrease of $0.4 million in its fund balance, from $10.1 million to $9.7 million. The decrease was because of reduced transfers from the General Fund.
General Fund Budgetary Highlights The year-end actual revenues for the General Fund (including transfers in) were $28.9 million; the actual expenditures (including transfers out) totaled $29.3 million. The actual revenues including transfers $945,000 above the budgeted estimate, while the actual spending with transfers was $442,000 below the final budget. The budget to actual variance in expenditures was principally due to conservative estimates at mid-year by management. Capital Assets At the end of Fiscal Year 2008-09, the City had $125 million invested in capital assets. Of this amount, $117.3 million is related to Governmental Activities and another $7.7 million to Business-Type Activities. These amounts represent an increase from the previous year (FY 2007-08), when the City’s overall capital assets were $122.1 million, including $114.1 million in Governmental Activities and $8 million in Business-Type Activities.

City of Lynwood Management’s Discussion and Analysis
June 30, 2009
16
Table 5 Capital Assets
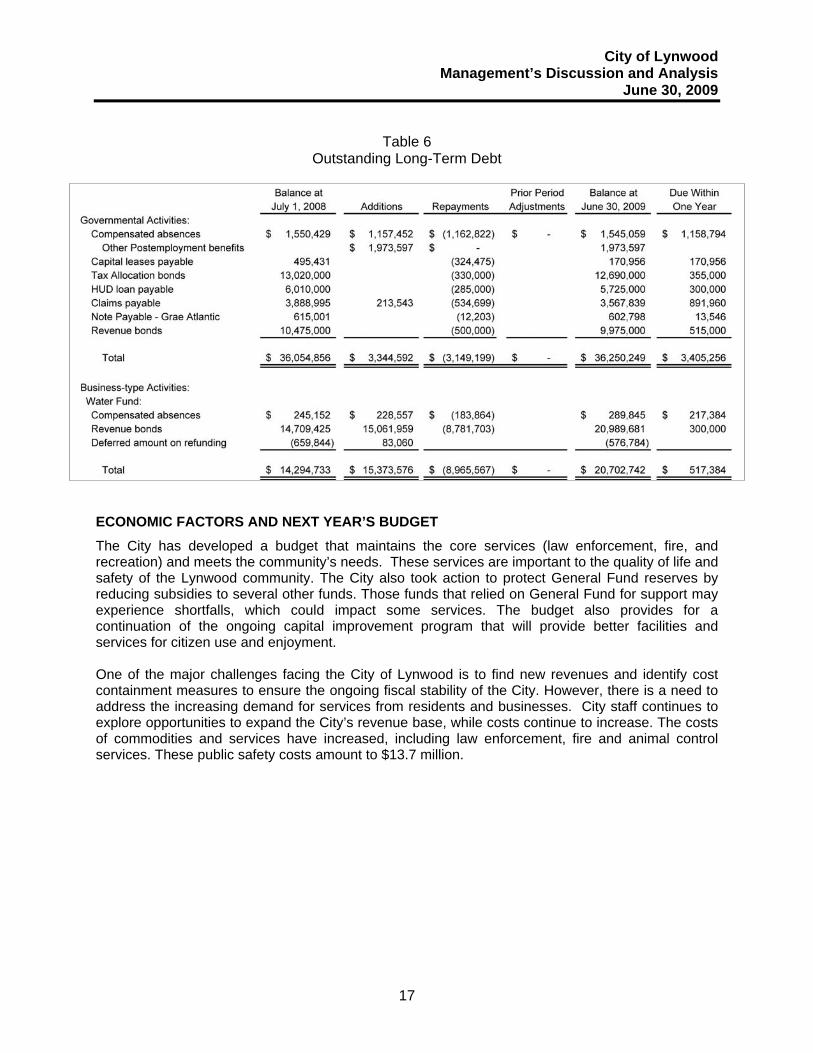
The City has a number of capital projects planned or in progress. The amount budgeted for these in FY 2009-10 was $21.8 million, of which $4.2 million represents new projects. The City’s major projects include several street improvements, with Long Beach Boulevard and Martin Luther King Boulevard. In addition to street projects, the City’s focus includes the improvement of water mains, water wells, sewer system, as well as traffic signals and parks. Long-Term Debt At fiscal year-end, the City’s governmental activities accounted for approximately $35.4 million in tax allocation and revenue bonds, a HUD loan, claims payable, compensated absences, and accrual for Postemployment benefits. Another $15 million was outstanding for the business-type activities. Two new bonds issues were issued on November 25, 2008 and May 28, 2009 for the Lynwood Utility Authority. On November 25, 2008, the Lynwood Utility Authority issued $9,755,000 of 2008 Series A Enterprise Revenue Bonds; the proceeds were used to refund the outstanding Lynwood Public Financing Authority Water Revenue Bonds Series 1995. On May 28, 2009, the Lynwood Utility Authority issued $5,735,000 of 2009 Series A Enterprise Revenue Bonds; the proceeds were used to refund the outstanding Lynwood Utility Authority Water Revenue Bonds Series 1999. These bond issues will be paid from and secured by the net revenues of the water and sewer enterprise of the City.
City of Lynwood Management’s Discussion and Analysis
June 30, 2009
17
Table 6
Outstanding Long-Term Debt
ECONOMIC FACTORS AND NEXT YEAR’S BUDGET The City has developed a budget that maintains the core services (law enforcement, fire, and recreation) and meets the community’s needs. These services are important to the quality of life and safety of the Lynwood community. The City also took action to protect General Fund reserves by reducing subsidies to several other funds. Those funds that relied on General Fund for support may experience shortfalls, which could impact some services. The budget also provides for a continuation of the ongoing capital improvement program that will provide better facilities and services for citizen use and enjoyment. One of the major challenges facing the City of Lynwood is to find new revenues and identify cost containment measures to ensure the ongoing fiscal stability of the City. However, there is a need to address the increasing demand for services from residents and businesses. City staff continues to explore opportunities to expand the City’s revenue base, while costs continue to increase. The costs of commodities and services have increased, including law enforcement, fire and animal control services. These public safety costs amount to $13.7 million.

City of Lynwood Management’s Discussion and Analysis
June 30, 2009
18
CONTACTING THE CITY’S FINANCIAL MANAGEMENT This Comprehensive Annual Financial Report is intended to provide Lynwood citizens, taxpayers, customers, investors and creditors with a general overview of the City’s finances. If you have any questions about this report, or need additional fiscal information, contact the Department of Finance and Administration at 11330 Bullis Road, Lynwood, CA 90262, phone (310) 603-0220.

(This page intentionally left blank.)

City of Lynwood Statement of Net Assets
June 30, 2009
See notes to financial statements. 19
Governmental Business-typeActivities Activities Total
Assets:Cash and investments $ 30,509,664 $ 10,259,387 $ 40,769,051 Receivables:
Intergovernmental 3,434,338 - 3,434,338 Accounts 1,464,495 2,482,614 3,947,109 Interest 58,061 29,187 87,248 Notes and loans 4,212,720 - 4,212,720
Internal balances 62,738 (62,738) - Restricted assets:
Cash and investments 176,243 - 176,243 Cash and investments with fiscal agents 4,971,799 9,798,191 14,769,990
Land held for resale 4,655,826 - 4,655,826 Deferred charges, net of accumulated amortization 791,684 775,137 1,566,821 Capital assets not being depreciated 88,414,162 37,252 88,451,414 Capital assets, net of accumulated depreciation 28,854,258 7,660,915 36,515,173
Total assets 167,605,988 30,979,945 198,585,933 Liabilities:
Accounts payable and accrued liabilities 5,958,630 500,375 6,459,005 Accrued interest payable 588,334 85,966 674,300 Deposits 863,543 108,352 971,895 Noncurrent liabilities:
Due within one year 3,405,256 517,384 3,922,640 Due in more than one year 32,268,209 20,762,142 53,030,351
Total liabilities 43,083,972 21,974,219 65,058,191
Net assets:Invested in capital assets, net of
related debt 88,707,464 (7,686,833) 81,020,631 Restricted for:
Retirement 841,043 - 841,043 Housing 4,347,122 - 4,347,122 Debt service 3,746,094 1,900,804 5,646,898 Development projects 10,586,694 - 10,586,694
Unrestricted 16,293,599 14,791,755 31,085,354
Total net assets $ 124,522,016 $ 9,005,726 $ 133,527,742

20
Charges Operating Capitalfor Grants and Grants and
Expenses Services Contributions ContributionsGovernmental activities:
General government $ 12,089,347 $ 1,667,834 $ - $ - Public safety 17,461,248 1,587,339 87,475 - Public works 8,213,775 2,436,899 4,014,600 - Community development 3,028,869 - 1,477,138 1,432,067 Parks and recreation 3,620,892 434,508 33,686 - Interest and fiscal charges 1,728,377 - - -
Total governmental activities 46,142,508 6,126,580 5,612,899 1,432,067
Business-type activities:Water and sewer 7,717,008 10,014,463 - - Transit 1,081,676 13,208 - -
Total business-type activities 8,798,684 10,027,671 - -
Total $ 54,941,192 $ 16,154,251 $ 5,612,899 $ 1,432,067
General revenues:Taxes:
Property taxesUtility usersSales and use taxesFranchise taxesBusiness license taxesOther taxes
Use of money and propertyMiscellaneous
TransfersTotal general revenues and transfers
Change in net assets
Net assets - beginning of yearNet assets - end of year
Functions/Programs
Program Revenues

City of Lynwood Statement of Activities
Year ended June 30, 2009
See notes to financial statements. 21
Net (Expense) Revenue andChanges in Net Assets
Governmental Business-typeActivities Activities Total
$ (10,421,513) $ - $ (10,421,513) (15,786,434) - (15,786,434) (1,762,276) - (1,762,276)
(119,664) - (119,664) (3,152,698) - (3,152,698) (1,728,377) - (1,728,377)
(32,970,962) - (32,970,962)
- 2,297,455 2,297,455 - (1,068,468) (1,068,468) - 1,228,987 1,228,987
(32,970,962) 1,228,987 (31,741,975)
19,303,986 - 19,303,986 5,949,307 - 5,949,307 4,391,476 - 4,391,476 1,305,288 - 1,305,288
434,513 - 434,513 1,600,134 - 1,600,134
638,296 182,418 820,714 1,250,614 - 1,250,614 (515,313) 515,313 -
34,358,301 697,731 35,056,032
1,387,339 1,926,718 3,314,057
123,134,677 7,079,008 130,213,685 $ 124,522,016 $ 9,005,726 $ 133,527,742
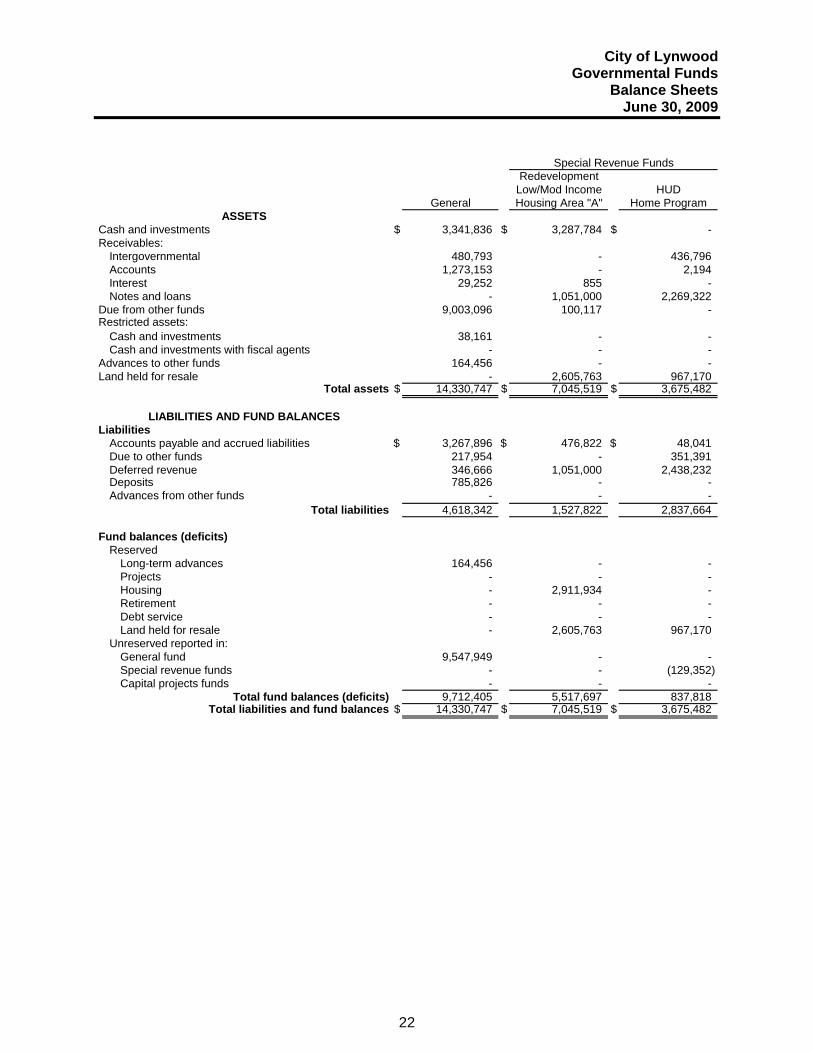
City of Lynwood Governmental Funds
Balance Sheets June 30, 2009
22
RedevelopmentLow/Mod Income HUD
General Housing Area "A" Home Program
Cash and investments $ 3,341,836 $ 3,287,784 $ - Receivables:
Intergovernmental 480,793 - 436,796 Accounts 1,273,153 - 2,194 Interest 29,252 855 - Notes and loans - 1,051,000 2,269,322
Due from other funds 9,003,096 100,117 - Restricted assets:
Cash and investments 38,161 - - Cash and investments with fiscal agents - - -
Advances to other funds 164,456 - - Land held for resale - 2,605,763 967,170
$ 14,330,747 $ 7,045,519 $ 3,675,482
LiabilitiesAccounts payable and accrued liabilities $ 3,267,896 $ 476,822 $ 48,041 Due to other funds 217,954 - 351,391 Deferred revenue 346,666 1,051,000 2,438,232 Deposits 785,826 - - Advances from other funds - - -
4,618,342 1,527,822 2,837,664
Fund balances (deficits)Reserved
Long-term advances 164,456 - - Projects - - - Housing - 2,911,934 - Retirement - - - Debt service - - - Land held for resale - 2,605,763 967,170
Unreserved reported in:General fund 9,547,949 - - Special revenue funds - - (129,352) Capital projects funds - - -
9,712,405 5,517,697 837,818 $ 14,330,747 $ 7,045,519 $ 3,675,482
LIABILITIES AND FUND BALANCES
Total liabilities
Total fund balances (deficits)Total liabilities and fund balances
Special Revenue Funds
ASSETS
Total assets

City of Lynwood Governmental Funds
Balance Sheets June 30, 2009
See notes to financial statements. 23
Redevelopment Capital 2002 HUD Nonmajor Total
Project Improvement Section 108 Governmental GovernmentalArea "A" Projects Loan Funds Funds
$ 494,721 $ 2,529,315 $ 6,408,121 $ 13,978,173 $ 30,039,950
- - 2,516,749 3,434,338 688 - - 187,746 1,463,781
- - - 27,954 58,061 207,365 - - 685,033 4,212,720
- - - 291,035 9,394,248
58,082 - - - 96,243 - - 4,971,799 4,971,799
957,380 - - - 1,121,836 1,082,893 - - - 4,655,826
$ 2,801,129 $ 2,529,315 $ 6,408,121 $ 22,658,489 $ 59,448,802
$ 476,667 $ 798,458 $ - $ 715,161 $ 5,783,045 - - - 7,426,787 7,996,132
207,365 - - 1,834,383 5,877,646 77,717 - - - 863,543
- - - 1,121,836 1,121,836 761,749 798,458 - 11,098,167 21,642,202
- - - - - 164,456 - 1,730,857 6,408,121 2,447,716 10,586,694 - - - 1,435,188 4,347,122 - - - 841,043 841,043 - - - 4,334,428 4,334,428
1,082,893 - - - 4,655,826
- - - - 9,547,949 - - - 5,028,848 4,899,496
956,487 - - (2,526,901) (1,570,414) 2,039,380 1,730,857 6,408,121 11,560,322 37,806,600
$ 2,801,129 $ 2,529,315 $ 6,408,121 $ 22,658,489 $ 59,448,802
Capital Projects Funds

(This page intentionally left blank.)

City of Lynwood Reconciliation of the Balance Sheet of Governmental Funds
to the Statement of Net Assets June 30, 2009
See notes to financial statements. 24
Total governmental fund balances $ 37,806,600
Amounts reported for governmental activities in the Statement of Net Assetsare different because:
Capital assets used in governmental activities are not financial resources and, therefore, are not reported in the governmental funds (including internal service fund capitalassets in the amount of $1,232,426)
Governmental capital assets $ 139,866,730 Less accumulated depreciation (22,598,310) 117,268,420
Governmental funds report the effect of issuance costs, premiums, discounts,and gains or losses on debt refundings when the debt is first issued, whereasthese amounts are deferred and amortized in the Statement of Activities
Deferred issuance costs (net of amortization of $552,523) 791,684 Deferred loss on refunding (net of amortization of $714,626) 576,784 1,368,468
Receivables that are not available to pay for current-period expendituresare deferred in the governmental funds. In the Statement of Net Assets,these receivables are recognized as earned income. 5,877,646
Long-term liabilities are not due and payable in the current period and therefore, are not reported in the governmental funds:
Tax allocation bonds (12,690,000) Notes payable - Grae Atlantic (602,798) Capital leases payable (170,956) Compensated absences (1,545,059) HUD loan payable (5,725,000) Claims payable (3,567,839) Revenue bonds (9,975,000) Other postemployment benefits (1,973,597) (36,250,249)
Accrued interest payable from the current portion of interest due onlong-term debt has not been reported in the governmental funds. (588,334)
Internal service funds are used by management to charge the costs of certain activities, such as self-insurance, to individual funds. Theassets and liabilities of the internal service funds must be added to thestatement of net assets (net of capital assets and long-term liabilitiesabove) (960,535)
Net assets of governmental activities $ 124,522,016

25
RedevelopmentLow/Mod Income HUD
General Housing Area "A" Home ProgramRevenues
Taxes and assessments $ 19,025,999 $ - $ - Licenses and permits 782,452 - - Fines, forfeitures and penalties 1,154,073 - - Use of money and property 349,104 32,487 - Intergovernmental 318,601 - 1,460,778 Charges for services 3,319,380 - - Administrative support 1,208,409 - - Program income - - - Miscellaneous 754,841 - -
26,912,859 32,487 1,460,778
ExpendituresCurrent:
General government 4,889,229 159,109 - Public safety 15,068,602 - - Public works 4,372,216 - - Community development 37,521 1,828,407 858,075 Parks and recreation 3,535,156 - - Pass through to other agencies - - -
Capital outlay - - 1,397,582 Debt service:
Principal payment - 48,241 - Interest and fiscal charges - 128,138 -
27,902,724 2,163,895 2,255,657
(989,865) (2,131,408) (794,879)
Other financing sources (uses)Transfers in 1,954,712 1,427,632 - Transfers out (1,372,204) - -
582,508 1,427,632 -
(407,357) (703,776) (794,879)
as restated 10,119,762 6,221,473 1,632,697 $ 9,712,405 $ 5,517,697 $ 837,818 Fund balances (deficits) - end of year
Special Revenue
Excess of revenues over (under) expenditures
Net other financing sources (uses)
Net change in fund balances
Fund balances (deficits) - beginning of year,
Total revenues
Total expenditures

City of Lynwood Governmental Funds
Statement of Revenues, Expenditures, and Changes in Fund Balances Year ended June 30, 2009
See notes to financial statements. 26
Redevelopment Capital 2002 HUD Nonmajor TotalProject Improvement Section 108 Governmental Governmental
Area "A" Projects Loan Funds Funds
$ - $ - $ - $ 13,399,070 $ 32,425,069 - - - 133,017 915,469 - - - 6,126 1,160,199
4,969 - 41,001 210,735 638,296 - 34,485 - 5,111,967 6,925,831 - - - 392,626 3,712,006 - - - - 1,208,409 - - - 45,966 45,966
11,800 - - 3,017 769,658 16,769 34,485 41,001 19,302,524 47,800,903
644,848 - - 1,712,822 7,406,008 - - 2,384,753 17,453,355 - - 2,901,180 7,273,396
1,468,480 - - 664,216 4,856,699 - - - 3,535,156 - - 552,052 552,052
1,811 4,744,444 - 1,812 6,145,649
12,203 - - 2,019,269 2,079,713 67,651 - - 1,401,200 1,596,989
2,194,993 4,744,444 - 11,637,304 50,899,017
(2,178,224) (4,709,959) 41,001 7,665,220 (3,098,114)
2,182,581 4,532,781 - 3,598,244 13,695,950 - - (12,839,059) (14,211,263)
2,182,581 4,532,781 - (9,240,815) (515,313)
4,357 (177,178) 41,001 (1,575,595) (3,613,427)
2,035,023 1,908,035 6,367,120 13,135,917 41,420,027 $ 2,039,380 $ 1,730,857 $ 6,408,121 $ 11,560,322 $ 37,806,600
Capital Projects

THIS PAGE LEFT INTENTIONALLY BLANK

City of Lynwood Governmental Funds
Reconciliation of the Statement of Revenues, Expenditures, and Changes in Fund Balances of Governmental Funds to the Statement of Activities
Year ended June 30, 2009
See notes to financial statements. 27
Net change in fund balances - total governmental funds $ (3,613,427)
Amounts reported for governmental activities in the Statement of Activitiesare different because:
Governmental funds report capital outlays as expenditures. However, in the Statementof Activities, the cost of those assets is allocated over the estimated useful lives as depreciation expense. This is the amount by which depreciation exceeded capitalexpense in the current period:
Capital outlay $ 4,394,387 Depreciation expense (1,194,668) 3,199,719
Governmental funds report the effect of issuance costs, premiums, discounts,and gains or losses on debt refundings when the debt is first issued, whereasthese amounts are deferred and amortized in the Statement of Activities.These amounts represent amortization during the fiscal year:
Amortization of deferred issuance costs and deferred loss on refunding (157,308)
Certain notes receivable are reported in the governmental funds as expendituresand then offset by deferred revenue as they are not available to pay currentexpenditures. Likewise, when the note is collected, it is reflected as revenue.This is the net change between notes receivable collected and issued. 2,626,213
Repayment of debt principal is an expenditure in the governmental funds, but in the statement of net assets, the repayment reduces long-term liabilities. Neither transaction, however, has any effect on net assets.
Principal repayment of tax allocation bonds 330,000 Principal retirement of capital leases 324,475 Principal repayment of HUD loan payable 285,000 Principal repayment of notes payable - Grae Atlantic 12,203 Principal repayment of revenue bonds 500,000 1,451,678
Some expenses reported in the Statement of Activities do not require the use of currentfinancial resources and therefore are not reported as expenditures in the governmentalfunds:
Interest on bonds and loan payable 25,920 Other postemployment benefits (1,973,597) Net change in claims payable (927,112) Net change in compensated absences (36,220) (2,911,009)
Internal service funds used by management to charge the costs of certain activities,such as self-insurance, to individual funds. The net revenues (expenses) of theinternal service funds are reported with governmental activities. 791,473
Change in net assets of governmental activities $ 1,387,339
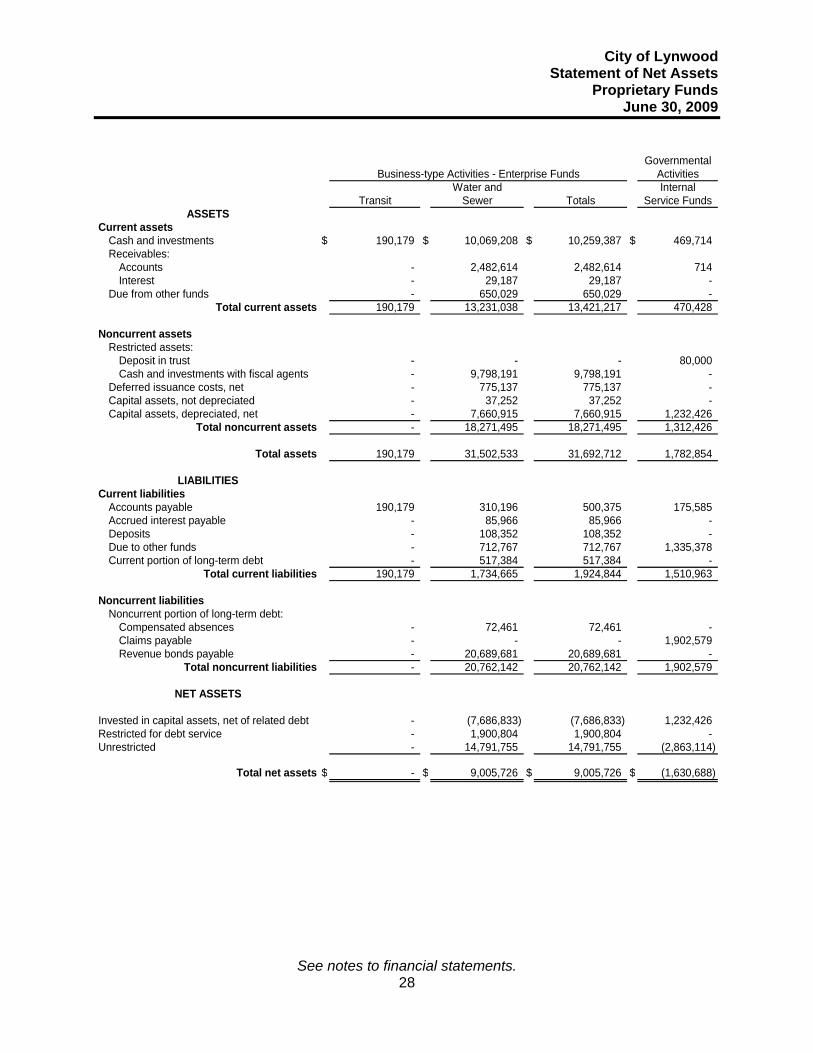
City of Lynwood Statement of Net Assets
Proprietary Funds June 30, 2009
See notes to financial statements. 28
Governmental
ActivitiesWater and Internal
Transit Sewer Totals Service Funds
Current assetsCash and investments $ 190,179 $ 10,069,208 $ 10,259,387 $ 469,714 Receivables:
Accounts - 2,482,614 2,482,614 714 Interest - 29,187 29,187 -
Due from other funds - 650,029 650,029 - Total current assets 190,179 13,231,038 13,421,217 470,428
Noncurrent assetsRestricted assets:
Deposit in trust - - - 80,000 Cash and investments with fiscal agents - 9,798,191 9,798,191 -
Deferred issuance costs, net - 775,137 775,137 - Capital assets, not depreciated - 37,252 37,252 - Capital assets, depreciated, net - 7,660,915 7,660,915 1,232,426
Total noncurrent assets - 18,271,495 18,271,495 1,312,426
190,179 31,502,533 31,692,712 1,782,854
Current liabilitiesAccounts payable 190,179 310,196 500,375 175,585 Accrued interest payable - 85,966 85,966 - Deposits - 108,352 108,352 - Due to other funds - 712,767 712,767 1,335,378 Current portion of long-term debt - 517,384 517,384 -
190,179 1,734,665 1,924,844 1,510,963
Noncurrent liabilitiesNoncurrent portion of long-term debt:
Compensated absences - 72,461 72,461 - Claims payable - - - 1,902,579 Revenue bonds payable - 20,689,681 20,689,681 -
Total noncurrent liabilities - 20,762,142 20,762,142 1,902,579
Invested in capital assets, net of related debt - (7,686,833) (7,686,833) 1,232,426 Restricted for debt service - 1,900,804 1,900,804 - Unrestricted - 14,791,755 14,791,755 (2,863,114)
$ - $ 9,005,726 $ 9,005,726 $ (1,630,688)
Business-type Activities - Enterprise Funds
NET ASSETS
LIABILITIES
Total current liabilities
Total net assets
ASSETS
Total assets

City of Lynwood Statement of Revenues, Expenses, and Changes in Fund Net Assets
Proprietary Funds Year ended June 30, 2009
See notes to financial statements. 29
Governmental
ActivitiesWater and Internal
Transit Sewer Totals Service FundsOperating revenues
Sales and service charges $ 13,208 $ 10,014,463 $ 10,027,671 $ 2,233,695 Total operating revenues 13,208 10,014,463 10,027,671 2,233,695
Operating expensesAdministration - 1,226,324 1,226,324 - Insurance - - - 520,059 Claims - - - 599,125 Water utility - 4,385,941 4,385,941 - Sewer utility - 608,486 608,486 - Garage - - - 287,887 Transit 1,081,676 - 1,081,676 - Depreciation - 355,254 355,254 35,151
Total operating expenses 1,081,676 6,576,005 7,657,681 1,442,222
(1,068,468) 3,438,458 2,369,990 791,473
Nonoperating revenues (expenses)Use of money and property - 182,418 182,418 - Interest expense - (1,123,126) (1,123,126) - Amortization expense - (17,877) (17,877) -
Net nonoperating revenues (expenses) - (958,585) (958,585) -
Income (loss) before transfers (1,068,468) 2,479,873 1,411,405 791,473
TransfersTransfers in 1,068,468 - 1,068,468 - Transfers out - (553,155) (553,155) -
Change in net assets - 1,926,718 1,926,718 791,473
Total net assets (deficit) - beginning of year - 7,079,008 7,079,008 (2,422,161)
Total net assets (deficit) - end of year $ - $ 9,005,726 $ 9,005,726 $ (1,630,688)
Operating income (loss)
Business-type Activities - Enterprise Funds

City of Lynwood Statement of Cash Flows
Proprietary Funds Year ended June 30, 2009
See notes to financial statements. 30
GovernmentalActivities
Water and InternalTransit Sewer Totals Service Funds
Cash flows from operating activities:Receipts from customers and users $ 13,208 $ 9,796,431 $ 9,809,639 $ 2,233,695 Payments to suppliers (931,065) (4,151,531) (5,082,596) (1,002,166) Payments for claims - - - (1,063,391) Payments to employees (130,950) (2,152,860) (2,283,810) (42,473)
Net cash provided by (used in) operating activities (1,048,807) 3,492,040 2,443,233 125,665
Cash flows from noncapital financing activities:Received from other funds 1,068,468 - 1,068,468 - Paid to other funds - 553,155 553,155 -
Net cash provided by noncapital financing activities 1,068,468 553,155 1,621,623 -
Cash flows from capital and related financing activitiesAcquisition of capital assets - (403,488) (403,488) - Proceeds from long-term debt - 17,936,694 17,936,694 - Principal payments on long-term debt - (8,870,000) (8,870,000) - Interest paid on long-term debt - (798,010) (798,010) -
Net cash provided by (used in)capital and related financing activities - 7,865,196 7,865,196 -
Cash flows from investing activitiesDeposits in trust - - - (80,000) Interest received - 196,792 196,792 -
Net cash provided by (used in)investing activities - 196,792 196,792 (80,000)
Net change in cash and investments 19,661 12,107,183 12,126,844 45,665
Cash and investments - beginning of year 170,518 7,760,216 7,930,734 424,049 Cash and investments - end of year $ 190,179 $ 19,867,399 $ 20,057,578 $ 469,714
Reconciliation of operating income (loss) to net cashprovided by (used in) operating activities:
Operating income (loss) $ (1,068,468) $ 3,438,458 $ 2,369,990 $ 791,473 Adjustments to reconcile operating income (loss) to
net cash provided by (used in) operating activities:Depreciation - 355,254 355,254 35,151 Changes in operating assets and liabilities:
(Increase) decrease in accounts receivables - (151,831) (151,831) (714) Increase (decrease) in accounts payable 19,661 (83,640) (63,979) (236,693) Increase (decrease) in claims payable - - - (1,248,267) Increase (decrease) in deposits - 20,472 20,472 - Increase (decrease) in due to other funds - (86,673) (86,673) 784,715 Total adjustments 19,661 53,582 73,243 (665,808)
Net cash provided by (used in) operating activities $ (1,048,807) $ 3,492,040 $ 2,443,233 $ 125,665
Business-type Activities - Enterprise Funds

City of Lynwood Statement of Fiduciary Funds
June 30, 2009
See notes to financial statements. 31
AgencyFund
Notes and loans receivables $ 54,506
Deferred revenue $ 54,506
Assets
Liabilities
City of Lynwood Notes to Financial Statements
Year ended June 30, 2009
32
NOTE 1 SUMMARY OF SIGNIFICANT ACCOUNTING POLICIES
The financial statements of the City of Lynwood (City) have been prepared in conformity with accounting principles generally accepted in the United States of America (USGAAP) as applied to governmental units. The Governmental Accounting Standards Board (GASB) is the accepted standard-setting body for establishing governmental accounting and financial reporting principles. The more significant of the government's accounting policies are described below.
Description of the Reporting Entity The City of Lynwood was incorporated in 1921, under the laws of the State of California. The City of Lynwood is a reporting entity which includes the following component units:
Lynwood Redevelopment Agency Lynwood Public Financing Authority Lynwood Information, Inc.
As required by accounting principles generally accepted in the United States of America, these financial statements present the City and its component units, entities for which the City is considered to be financially accountable. The City is considered to be financially accountable for an organization if the City appoints a voting majority of that organization's governing body and the City is either able to impose its will on that organization, or there is a potential for that organization to provide specific financial benefits to or impose specific financial burdens on the City. The City is also considered to be financially accountable if an organization is fiscally dependent upon the City (i.e., it is unable to adopt its budget, levy taxes, set rates or charges, or issue bonded debt without approval from the City). In certain cases, other organizations are included as component units if the nature and significance of their relationship with the City are such that their exclusion would cause the City's financial statements to be misleading or incomplete. All of the City's component units are considered to be blended component units because, in all cases, the City Council serves as the governing board for each component unit. Blended component units, although legally separate entities, are, in substance, part of the City's operations, therefore data from these units are reported with the interfund data of the primary government.
The Lynwood Redevelopment Agency and the Lynwood Information, Inc. issue separate component unit statements. Upon their completion, the financial statements of the component units can be obtained at City Hall. The following entities are considered to be component units of the City.

City of Lynwood Notes to Financial Statements
Year ended June 30, 2009
33
NOTE 1 SUMMARY OF SIGNIFICANT ACCOUNTING POLICIES (CONTINUED) Lynwood Redevelopment Agency
The Redevelopment Agency was established in 1973, pursuant to the State of California Health and Safety Code Section 33000. Its purpose is to prepare and carry out plans for the improvement, rehabilitation, and development of blighted areas within the territorial limits of the City of Lynwood. Lynwood Public Financing Authority The Lynwood Public Financing Authority was formed in 1993, by a joint powers agreement between the City of Lynwood and the Lynwood Redevelopment Agency. It was created to acquire and finance the acquisition of public capital improvements necessary or convenient for the operation of the City or Agency. Lynwood Information, Inc. Lynwood Information, Inc. (LlI) was founded as a non-profit corporation in 1981. Its purpose was to educate and inform the residents of the City of Lynwood about matters of concern to the City and its residents through a bi-monthly newsletter. The newsletter has since evolved into a quarterly publication. In January 1983, the corporation was restructured so as to include cable television as an additional means of informing the public. During the year, the operations of LII were transferred to the General Fund of the City.
Government-wide and Fund Financial Statements The government-wide financial statements (i.e., the statement of net assets and the statement of activities) report information on all of the nonfiduciary activities of the primary government and its component units. For the most part, the effect of interfund activity has been removed from these statements. Governmental activities, which normally are supported by taxes and intergovernmental revenues, are reported separately from business-type activities, which rely to a significant extent on fees and charges for support. The statement of activities demonstrates the degree to which the direct expenses of a given function or segments are offset by program revenues. Direct expenses are those that are clearly identifiable with a specific function or segment. Program revenues include: (1) charges to customers or applicants who purchase, use, or directly benefit from goods, services, or privileges provided by a given function or segment and (2) grants and contributions that are restricted to meeting the operational or capital requirements of a particular function or segment. Taxes and other items not properly included among program revenues are reported instead as general revenues. Separate financial statements are provided for governmental funds, proprietary funds, and fiduciary funds, even though the latter are excluded from the government-wide financial statements. Major individual governmental funds and major individual enterprise funds are reported as separate columns in the fund financial statements.

City of Lynwood Notes to Financial Statements
Year ended June 30, 2009
34
NOTE 1 SUMMARY OF SIGNIFICANT ACCOUNTING POLICIES (CONTINUED)
Measurement Focus, Basis of Accounting, and Financial Statement Presentation The government-wide financial statements are reported using the economic resources measurement focus and the accrual basis of accounting, as are the proprietary fund and fiduciary fund financial statements. Revenues are recorded when earned and expenses are recorded when the liability is incurred, regardless of the timing of the related cash flows. Property taxes are recognized as revenues in the fiscal year for which they are levied. Grants and similar items are recognized as revenue as soon as all eligibility requirements imposed by the provider have been met. Governmental fund financial statements are reported using the current financial resources measurement focus and the modified accrual basis of accounting. Revenues are recognized as soon as they are both measurable and available. Revenues are considered to be available when they are collectible within the current period. For this purpose, the government considers revenues to be available if they are collected within 60 days of the end of the current fiscal period. Expenditures generally are recorded when the liability is incurred, as under accrual accounting. However, debt service expenditures, as well as expenditures related to compensated absences and claims and judgments, are recorded only when payment is due. Property taxes, franchise taxes, licenses, and interest associated with the current fiscal period are all considered to be susceptible to accrual, therefore they have been recognized as revenues of the current fiscal period. Only the portion of special assessments receivable due within the current fiscal period is considered to be susceptible to accrual as revenue of the current period. All other revenue items are considered to be measurable and available only when cash is received by the government. The City reports the following major governmental funds:
The General Fund is the City's primary operating fund. It accounts for all financial resources of the general government, except those required to be accounted for in other funds. Redevelopment Aqencv Area "A" Low/Mod Income Housing Area "A" Special Revenue Fund - This fund receives transfers from tax increment funds (20% of gross tax increment received) and uses these funds for redevelopment related purposes and set aside for low-and-moderate-income housing. HUD Home Program Special Revenue Fund - This fund accounts for revenue received from Housing and Urban Development and the State of California to provide financial assistance for affordable housing programs. Redevelopment Agency Area "A" Capital Projects Funds - These funds account for redevelopment project capital outlays in each of their respective project areas.

City of Lynwood Notes to Financial Statements
Year ended June 30, 2009
35
NOTE 1 SUMMARY OF SIGNIFICANT ACCOUNTING POLICIES (CONTINUED)
The Capital Improvement Projects Capital Projects Fund - This fund accounts for the financial resources used for the acquisition and construction of the City's capital projects. These improvements include improvements to the City's infrastructure, housing, and redevelopment projects. The 2002 HUD Section 108 Loan Capital Projects Fund - This fund accounts for the proceeds of the $7 million loan the City received from HUD to be used for capital projects within the City.
The City reports the following major proprietary funds:
The Transit Enterprise Fund - This fund accounts for revenue received from Dial-A-Taxi fares and Prop "A" and Prop "C" transfers to cover costs of transportation programs such as Dial-A-Taxi and transportation administration. The Water Enterprise Fund - This fund accounts for revenue received from user fees for water and sewer usage. The Water Fund also pays for water billing, water utility, sewer services, and improvements to the water system.
The City reports the following other fund types: The Internal Service Funds account for financial transactions related to City's Garage Department, Information Technology, and self-insurance programs. These services are provided to other City departments or agencies on a cost reimbursement basis. The Agency Funds are used to report resources held by the City in a purely custodial capacity, which involves only the receipt, temporary investment, and remittance of fiduciary resources to individuals, private organizations, or other governments.
Private-sector standards of accounting and financial reporting issued prior to December 1, 1989, generally are followed in both the government-wide and proprietary fund financial statements to the extent that those standards do not conflict with or contradict guidance of the Governmental Accounting Standards Board (GASB). For proprietary fund type activities, the City has elected to apply all applicable GASB pronouncements as well as any applicable pronouncements of the Financial Accounting Standards Board (FASB), the Accounting Principles Board (APB), or any Accounting Research Bulletins (ARB) issued on or before November 30, 1989, unless they contradict or conflict with GASB pronouncements.
As a general rule, the effect of interfund activity has been eliminated from the government-wide financial statements. Exceptions to this general rule are charges between the government's proprietary funds function and various other functions of the government. Elimination of these charges would distort the direct costs and program revenues reported for the various functions concerned.

City of Lynwood Notes to Financial Statements
Year ended June 30, 2009
36
NOTE 1 SUMMARY OF SIGNIFICANT ACCOUNTING POLICIES (CONTINUED) Amounts reported as program revenues include: 1) charges to customers or applicants for goods, services, or privileges provided, 2) operating grants and contributions and 3) capital grants and contributions, including special assessments. Internally dedicated resources are reported as general revenues rather than as program revenues. Likewise, general revenues include all taxes. Proprietary funds distinguish operating revenues and expenses from nonoperating items. Operating revenues and expenses generally result from providing services and producing and delivering goods in connection with a proprietary fund's principal ongoing operations. The principal operating revenues of the Enterprise Funds and of the Internal Service Funds are charges to customers for sales and services. Operating expenses for the Enterprise Funds and the Internal Service Funds include the cost of sales and services, administrative expenses, and depreciation on capital assets. All revenues and expenses not meeting this definition are reported as nonoperating revenues and expenses. When both restricted and unrestricted resources are available for use, it is the City’s policy to use restricted resources first, then unrestricted resources as they are needed.
Assets, Liabilities, Net Assets or Equity Cash and Cash Equivalents For purposes of the statement of cash flows, the City considers cash and cash equivalents as short term, highly liquid investments that are both readily convertible to known amounts of cash and so near their maturity that they present insignificant risk of changes in value because of changes in interest rates. The City follows the practice of pooling cash and investments of all funds except for funds required to be held by outside fiscal agents under the provisions of bond indentures and funds for the Lynwood Redevelopment Agency. Cash equivalents have an original maturity date of three months or less from the date of purchase. Cash and Investments Investments are reported in the accompanying balance sheet at fair value, except for nonparticipating certificates of deposit and investment contracts that are reported at cost because they are not transferable and they have terms that are not affected by changes in market interest rates. Changes in fair value that occur during a fiscal year are recognized as investment income reported for that fiscal year. Investment income includes interest earnings, changes in fair value, and any gains or losses realized upon the liquidation, maturity, or sale of investments. The City pools cash and investments of all funds, except assets held by .fiscal agents. Each fund's share in this pool is displayed in the accompanying financial statements as cash and investments. Investment income earned by the pooled investments is allocated to the various funds based on each fund's average cash and investment balance.

City of Lynwood Notes to Financial Statements
Year ended June 30, 2009
37
NOTE 1 SUMMARY OF SIGNIFICANT ACCOUNTING POLICIES (CONTINUED) Receivables and Payables Activity between funds that are representative of lending/borrowing arrangements outstanding at the end of the fiscal year are referred to as interfund receivables/interfund payables (i.e., the current portion of interfund loans) or advances to/from other funds (the noncurrent portion of interfund loans). Any residual balances outstanding between the governmental activities and the business-type activities are reported in the government-wide financial statements as internal balances. Advances between funds, as reported in the fund financial statements, are offset by a fund balance reserve account in the applicable governmental funds to indicate that they are not available for appropriation and are not expendable available financial resources. All trade and tax receivables are shown net of any allowance for uncollectible accounts, if applicable, and estimated refunds due. Property Taxes Property taxes in the State of California are administered for all local agencies at the County level, and consist of secured, unsecured, and utility tax rolls. The following is a summary of major policies and practices relating to property taxes: Property Valuations - are established by the Assessor of the County of Los Angeles for the secured and unsecured property tax rolls; the utility property tax rolls are valued by the State Board of Equalization. Under the provisions of Article XIlIA of the State Constitution (Proposition 13 adopted by the voters on June 6, 1978) properties are assessed at 100% of full value. From this base of assessment, subsequent annual increases in valuation are limited to a maximum of 2%. However, increases to full value are allowed for property improvements or upon change in ownership. Personal property is excluded from these limitations, and is subject to annual reappraisal. Tax Levies - are limited to 1 % of full value which results in a tax rate of $1.00 per $100 assessed valuation, under the provisions of Proposition 13. Tax rates for voter-approved indebtedness are excluded from this limitation. The City's share of the $1.00 varies depending on the tax rate area and it ranges from $0.0125 to $0.0730. Tax Levy Dates - are attached annually on January 1 preceding the fiscal year for which the taxes are levied. The fiscal year begins July 1 and ends June 30 of the following year. Taxes are levied on both real and unsecured personal property as it exists at that time. Liens against real estate, as well as the tax on personal property, are not relieved by subsequent renewal or change in ownership.

City of Lynwood Notes to Financial Statements
Year ended June 30, 2009
38
NOTE 1 SUMMARY OF SIGNIFICANT ACCOUNTING POLICIES (CONTINUED)
Tax Levy Apportionments - Due to the nature of the City-wide maximum levy, it is not possible to identify general purpose tax rates for specific entities. Under state legislation adopted subsequent to the passage of Proposition 13, apportionments to local agencies are made by the county auditor-controller based primarily on the ratio that each agency represented of the total City-wide levy for the three years prior to fiscal year 1979. Property Tax Administration Fees - The State of California FY 1990-91 Budget Act authorized counties to collect an administrative fee for collection and distribution of property taxes. Property taxes are recorded as net of administrative fees withheld during the fiscal year. Restricted Assets Certain proceeds of the City's long-term debt, as well as certain resources set aside for their repayment, are classified as restricted assets on the statement of net assets because they are maintained in separate bank accounts and their use is limited by applicable bond covenants. In the absence of specific statutory provisions governing the issuance of bonds, certificates, or leases, these funds may be invested in accordance with the ordinance, resolutions, and indentures specifying the types of investments its trustees or fiscal agents may make. These ordinances, resolutions, and indentures are generally more restrictive than the City's general investment policy. In no instance have additional types of investments been authorized that are not permitted by the City's general investment policy. Capital Assets Capital assets, which include property, plant, equipment, and infrastructure assets (e.g., roads, bridges, sidewalks, traffic lights and signals, street lights, and similar items), are reported in the applicable governmental or business-type activities in the government-wide financial statements. Capital assets are defined by the City as assets with an initial, individual cost of $5,000 (including infrastructure) or more and an estimated useful life in excess of one year. Such capital assets are recorded at historical cost or estimated historical cost if purchased or constructed. Donated capital assets are recorded at estimated fair value at the date of donation. The cost of normal maintenance and repairs that do not add to the value of the capital asset or materially extend capital asset lives are not capitalized. Major outlays for capital assets and improvements are capitalized as projects are constructed. Interest incurred during the construction phase of capital assets of business-type activities is included as part of the capitalized value of the assets constructed. No interest was capitalized during the year ended June 30, 2009.
City of Lynwood Notes to Financial Statements
Year ended June 30, 2009
39
NOTE 1 SUMMARY OF SIGNIFICANT ACCOUNTING POLICIES (CONTINUED)
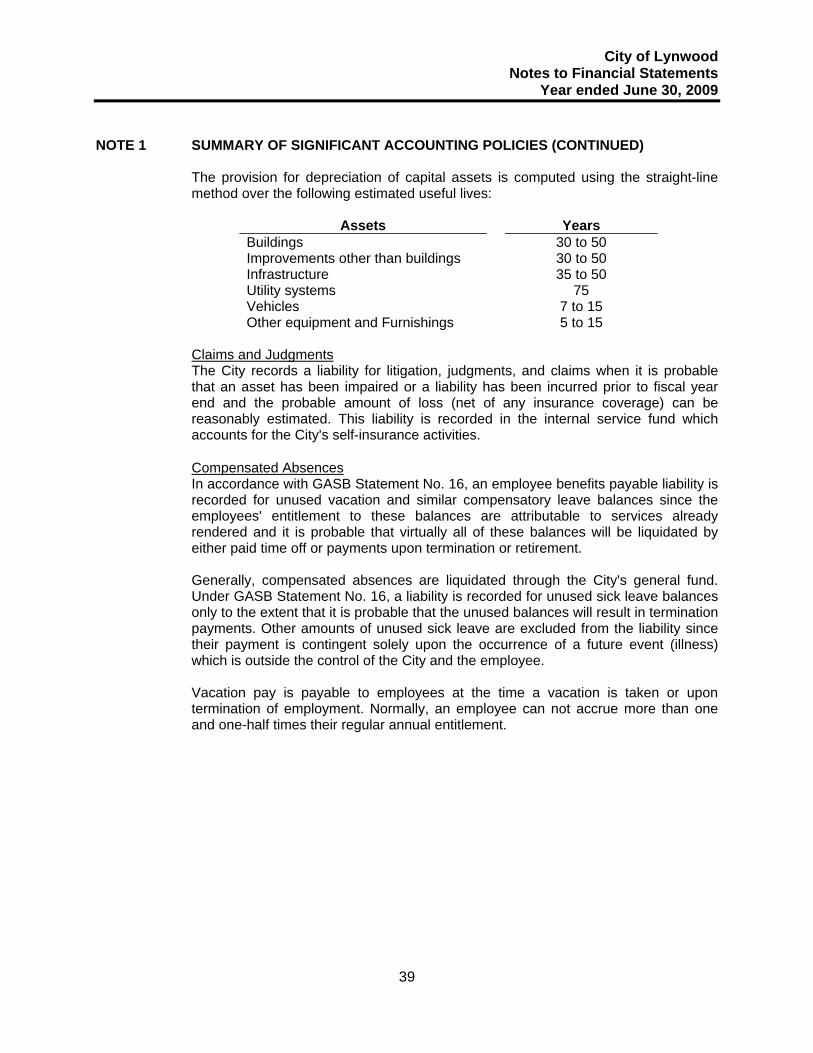
The provision for depreciation of capital assets is computed using the straight-line method over the following estimated useful lives:
Assets Years Buildings 30 to 50 Improvements other than buildings 30 to 50 Infrastructure 35 to 50 Utility systems 75 Vehicles 7 to 15 Other equipment and Furnishings 5 to 15
Claims and Judgments The City records a liability for litigation, judgments, and claims when it is probable that an asset has been impaired or a liability has been incurred prior to fiscal year end and the probable amount of loss (net of any insurance coverage) can be reasonably estimated. This liability is recorded in the internal service fund which accounts for the City's self-insurance activities. Compensated Absences In accordance with GASB Statement No. 16, an employee benefits payable liability is recorded for unused vacation and similar compensatory leave balances since the employees' entitlement to these balances are attributable to services already rendered and it is probable that virtually all of these balances will be liquidated by either paid time off or payments upon termination or retirement. Generally, compensated absences are liquidated through the City's general fund. Under GASB Statement No. 16, a liability is recorded for unused sick leave balances only to the extent that it is probable that the unused balances will result in termination payments. Other amounts of unused sick leave are excluded from the liability since their payment is contingent solely upon the occurrence of a future event (illness) which is outside the control of the City and the employee. Vacation pay is payable to employees at the time a vacation is taken or upon termination of employment. Normally, an employee can not accrue more than one and one-half times their regular annual entitlement.

City of Lynwood Notes to Financial Statements
Year ended June 30, 2009
40
NOTE 1 SUMMARY OF SIGNIFICANT ACCOUNTING POLICIES (CONTINUED) Long-term Obligations In the government-wide financial statements, and proprietary fund types fund financial statements, long-term debt and other long-term obligations are reported as liabilities in the applicable governmental activities, business-type activities, or proprietary fund type statement of net assets. Initial-issue bond premiums and discounts, as well as issuance costs, are deferred and amortized over the life of the bonds using the straight-line method. The difference between the reacquisition price of refunding bonds and the net carrying amount of refunded debt (deferred amount on refunding) is amortized over the shorter of the life of the refunding debt or remaining life of the refunded debt. Bond issuance costs, including deferred refunding amounts, are reported as deferred bond issuance costs. Amortization of bond premiums or discounts, issuance costs, and deferred amounts on refunding is included in interest expense in the Statement of Activities. In the fund financial statements, governmental fund types recognize bond premiums, discounts, and issuance costs during the period issued. The face amount of debt issued is reported as other financing sources. Premiums received are reported as other financing sources, while discounts are reported as other financing uses. Issuance costs, whether or not withheld from the actual debt proceeds received, are reported as debt service expenditures. In the government-wide financial statements and proprietary fund financial statements, net assets are reported in three categories: net assets invested in capital assets - net of related debt, restricted net assets, and unrestricted net assets. Restricted net assets represent net assets restricted by parties outside of the City (such as creditors, grantors, contributors, and laws and regulations of other governments) and include unspent proceeds of bonds issued to acquire or construct capital assets. The City's other restricted net assets are temporarily restricted (ultimately expendable assets). All other net assets are considered unrestricted.
Net Assets and Fund Equity In the fund financial statements, governmental funds report reservations of fund balance for amounts that are not available for appropriation or are legally restricted by outside parties for use for a specific purpose. Designations of fund balance represent tentative management plans that are subject to change. Estimates The preparation of basic financial statements in conformity with accounting principles generally accepted in the United States of America requires management to make estimates and assumptions that affect the reported amounts of assets and liabilities and disclosure of contingent assets and liabilities at the date of the financial statements and the reported amounts of revenue and expenses/expenditures during the reporting period. Actual results could differ from those estimates.

City of Lynwood Notes to Financial Statements
Year ended June 30, 2009
41
NOTE 1 SUMMARY OF SIGNIFICANT ACCOUNTING POLICIES (CONTINUED) New Accounting Pronouncements GASB No. 50 – GASB has issued Statement No. 50 which amends applicable disclosure and required supplementary information (RSI) requirements of Statement No. 25 “Financial Reporting for Defined Benefit Pension Plans and Note Disclosures for Defined Contribution Plans” and Statement No. 27 “Accounting for Pensions by State and Local Government Employers,” to conform with the requirements of Statement No. 43 “Financial Reporting for Postemployment Benefit Plans Other than Pension Plans” and Statement No. 45 “Accounting and Financial Reporting by Employers for Postemployment Benefits Other than Pensions.” The requirements of this Statement become effective for fiscal periods beginning after June 15, 2007, except for the requirements related to the use of the entry age actuarial cost method for the purpose of reporting a surrogate funded status and the funding progress of plans that use the actuarial cost method, which are effective for periods for which the financial statements and RSI contain information resulting from actuarial valuation as of June 15, 2007, or later. Early implementation is encouraged.
GASB No. 51 – GASB has issued Statement No. 51 “Accounting and Financial Reporting for Intangible Assets”. This Statement establishes accounting and financial reporting requirements for intangible assets to reduce inconsistencies in the accounting and financial reporting of these assets among state and local governments thereby enhancing comparability of the accounting and financial reporting of such assets. The requirements of this Statement become effective for fiscal periods beginning after June 15, 2009. The provisions of this Statement are generally required to be applied retroactively. For governments that were classified as phase 1 or phase 2 governments for the purpose of implementing Statement No. 34, retroactive reporting is required for intangible assets acquired in fiscal years ending after June 30, 1980, except for those considered to have indefinite useful lives as of the effective date of this Statement and those that would be considered internally generated. Retroactive reporting of these intangible assets by phase 3 governments is encouraged but not required. Retroactive reporting is not required but is permitted for intangible assets considered to have indefinite useful lives as of the effective date of this Statement and those considered to be internally generated. GASB No. 52 - GASB has issued Statement No. 52, Land and Other Real Estate Held as Investments by Endowments. This statement improves the quality of financial reporting by requiring endowments to report their land and other real estate investments at fair value, creating consistency in reporting among similar entities that exist to invest resources for the purpose of generating income. This Statement is effective for financial statements for periods beginning after June 15, 2008.

City of Lynwood Notes to Financial Statements
Year ended June 30, 2009
42
NOTE 1 SUMMARY OF SIGNIFICANT ACCOUNTING POLICIES (CONTINUED) New Accounting Pronouncements (continued) GASB No. 53 - GASB has issued Statement No. 53, Accounting and Financial Reporting for Derivative Instruments. Statement 53 is intended to improve how state and local governments report information about derivative instruments—financial arrangements used by governments to manage specific risks or make investments—in their financial statements. The Statement specifically requires governments to measure most derivative instruments at fair value in their financial statements that are prepared using the economic resources measurement focus and the accrual basis of accounting. The guidance in this Statement also addresses hedge accounting requirements and is effective for financial statements for reporting periods beginning after June 15, 2009, with earlier application encouraged.
GASB No. 54 - GASB has issued Statement No. 54, Fund Balance Reporting and Fund Type Definitions. This Statement establishes fund balance classifications that comprise a hierarchy based primarily on the extent to which a government is bound to observe constraints imposed upon the use of the resources reported in governmental funds. This Statement also provides for additional fund classification as restricted, committed, assigned, and unassigned based on the relative strength of the constraints that control how specific amounts can be spent. The requirements of this Statement are effective for financial statements for periods beginning after June 15, 2010. GASB No. 55 - GASB has issued Statement No. 55, The Hierarchy of Generally Accepted Accounting Principles for State and Local Governments. The objective of this Statement is to incorporate the hierarchy of generally accepted accounting principles (GAAP) for state and local governments into the Governmental Accounting Standards Board’s (GASB) authoritative literature. The Board does not expect that this Statement will result in a change in current practice. GASB No. 56 - GASB has issued Statement No. 56, Codification of Accounting and Financial Reporting Guidance Contained in the AICPA Statements on Auditing Standards. The objective of this Statement is to incorporate into the Governmental Accounting Standards Board’s (GASB) authoritative literature certain accounting and financial reporting guidance presented in the American Institute of Certified Public Accountants’ Statements on Auditing Standards. This Statement addresses three issues not included in the authoritative literature that establishes accounting principles—related party transactions, going concern considerations, and subsequent events. This Statement does not establish new accounting standards but rather incorporates the existing guidance (to the extent appropriate in a governmental environment) into the GASB standards.

City of Lynwood Notes to Financial Statements
Year ended June 30, 2009
43
NOTE 2 STEWARDSHIP, COMPLIANCE, AND ACCOUNTABILITY
Encumbrances Encumbrances are estimations of costs related to unperformed contracts for goods and services. These commitments are recorded for budgetary control purposes in the General, Special Revenue, and similar governmental funds. Encumbrances outstanding at fiscal year-end are reported as a reservation of fund balance. They represent the estimated amount of the expenditure ultimately to result if unperformed contracts in-process at fiscal year-end are completed. They do not constitute expenditures or estimated liabilities. Continuing Appropriations The unexpended and unencumbered appropriations that are available and recommended for continuation are approved by the City Council for carryover to the following fiscal year. These commitments are reported as a reservation of fund balance. Budget Basis of Accounting Budgets for governmental funds are adopted on a basis consistent with accounting principles generally accepted in the United States of America (US GAAP). Deficit Fund Balances/Net Assets The following funds contained a deficit fund balance/net assets as of June 30, 2009:
Internal Service Fund Self-insurance $ 3,299,853Nonmajor Governmental Funds: Special Revenue Funds: Traffic Safety 1,138,307 STP Grant 116,551 SB 821 27,776 Lighting Maintenance 788,106 Landscape Maintenance 763,235 Housing Community Development (HUD) 567,350 Brownfield Grant 21,277 Per Capita Grant 2000 61,554 Safe School Route 298,961 TEA/ISTEA Grant 280,392 State of California CEC Grant 4,079 Justice Assistance 92,152 State Transportation Partnership 95,656 Capital Projects Fund: Park Replacement 2,572,247

City of Lynwood Notes to Financial Statements
Year ended June 30, 2009
44
NOTE 2 STEWARDSHIP, COMPLIANCE, AND ACCOUNTABILITY (CONTINUED) The above deficit fund balances/net assets have occurred because of the spending of funds prior to the receipt of revenues. The fund balances/net assets will be restored in the near future as revenues are received. Excess of Expenditures Over Appropriations
Fund
Final Appropriations
Expenditures
Excess
Major Governmental Fund: Special Revenue Fund: Redevelopment Low/Mod Income Housing Area “A” $ 2,058,073 $ 2,163,895 $ 105,822 Nonmajor Governmental Funds: Special Revenue Fund: STP Grant - 110,671 110,671 Housing Community Development(HUD) 1,648,914 1,912,191 233,277 Safe School Route - 298,961 298,961 Prop 40 - 360 360 Justice Assistance 60,000 92,152 32,152 State Transportation Partnership
-
95,656 95,656
Lynwood Information, Inc. - 104,893 104,893 Debt Service Fund: City of Lynwood 1,366,488 1,366,491 3 Tax increment area “A” 1,117,552 1,311,263 193,711 Special Funds area A
“Alameda”
24,000
121,075 97,075 Tax increment Alameda Area
65,129
83,584 18,455

City of Lynwood Notes to Financial Statements
Year ended June 30, 2009
45
NOTE3 CASH AND INVESTMENTS Cash and investments are reported as follows:
Governmental Business-typeActivities Activities Totals
Cash and investments $ 30,509,664 $ 10,259,387 $ 40,769,051 Restricted cash and investments: Cash and investments 176,243 - 176,243 Cash and investments with fiscal agents 4,971,799 9,798,191 14,769,990
$ 35,657,706 $ 20,057,578 $ 55,715,284
Cash and investments at June 30, 2009 consisted of the following: Petty cash $ 3,790 Deposits 3,843,947 Investments 51,867,547
$ 55,715,284
a. Investments Authorized by the California Government Code and the City’s Investment Policy
The table below identifies the investment types that are authorized for the City by the California Government Code (or the City's investment policy, where more restrictive). The table also identifies certain provisions of the California Government Code (or the City's investment policy, where more restrictive) that address interest rate risk, credit risk, and concentration of credit risk. This table does not address investments of debt proceeds held by bond trustee that are governed by the provisions of debt agreements of the City, rather than the general provisions of the California Government Code or the City's investment policy.

City of Lynwood Notes to Financial Statements
Year ended June 30, 2009
46
NOTE3 CASH AND INVESTMENTS (CONTINUED)
Maximum MaximumMaximum Percentage Investment in
Authorized Investment Type Maturity of Portfolio One IssuerLocal Agency Investment Fund (State Pool) N/A None $40 millionU.S. Treasury Obligations 5 years None NoneU.S. Government Agency Issues 5 years None NoneTime Deposits N/A 25% NoneInsured Passbook Savings Deposits with Banks and Savings and Loans N/A None NoneNegotiable Certificates of Deposit 5 years 30% NoneCommercial Paper 180 days 15% 10%Mutual Funds (must be comprised of eligible securities permitted under this policy) N/A None NoneMoney Market Funds (must be comprised of eligible securities permitted under this policy) N/A None NoneMedium Term Corporate Notes 5 years 30% 15%
b. Investments Authorized by Debt Agreements
Investment of debt proceeds held by bond trustees are governed by provisions of the debt agreements, rather than the general provisions of the California Government Code or the Agency's investment policy. The table below identifies the investment types that are authorized for investments held by bond trustee. The table also identifies certain provisions of these debt agreements that address interest rate risk, credit risk, and concentration of credit risk.
Maximum Maximum
Maximum Percentage Investment inAuthorized Investment Type Maturity of Portfolio One Issuer
Local Agency Investment Fund (State Pool) N/A None $40 millionU.S. Treasury Obligations N/A None NoneU.S. Government Agency Issues N/A None NoneCertificates of Deposit N/A None NoneCommercial Paper N/A None NoneMutual Funds (must be comprised of eligible securities permitted under this policy) N/A None NoneMoney Market Funds (must be comprised of eligible securities permitted under this policy) N/A None None

City of Lynwood Notes to Financial Statements
Year ended June 30, 2009
47
NOTE3 CASH AND INVESTMENTS (CONTINUED)
c. Disclosures Relating to Interest Rate Risk
Interest rate risk is the risk that changes in market interest rates will adversely affect the fair value of an investment. Generally, the longer the maturity of an investment, the greater the sensitivity of its fair value to changes in market interest rates. One of the ways that the City manages its exposure to interest rate risk is by purchasing a combination of shorter-term and longer-term investments and by timing cash flows from maturities so that a portion of the portfolio is maturing or coming close to maturity evenly over time as necessary to provide the cash flow and liquidity needed for operations. Information about the sensitivity of the fair values of the City's investments (including investments held by bond trustee) to market interest rate fluctuations is provided by the following table that shows the distribution of the City's investments by maturity:
12 Months 13 to 24 25 to 60 More than
Investment Type Totals or Less Months Months 60 MonthsState investment pool $ 23,263,909 $ 23,263,909 $ - $ - $ - Money market funds 7,504,472 7,504,472 - - - Time deposits 6,329,176 6,329,176 - - - Held by bond trustees: Money market funds 14,769,990 14,769,990 - - -
Totals $ 51,867,547 $ 51,867,547 $ - $ - $ -
d. Investments with Fair Values Highly Sensitive to Interest Rate Fluctuations
The City has no investments (including investments held by bond trustees) that are highly sensitive to interest rate fluctuations (to a greater degree than already indicated in the information provided above).
e. Disclosures Relating to Credit Risk
Generally, credit risk is the risk that an issuer of an investment will not fulfill its obligation to the holder of the investment. This is measured by the assignment of a rating by a nationally recognized statistical rating organization. Presented below is the minimum rating required by (where applicable) the California Government Code, the City's investment policy, or debt agreements, and the actual rating as of fiscal year end for each investment type.

City of Lynwood Notes to Financial Statements
Year ended June 30, 2009
48
NOTE3 CASH AND INVESTMENTS (CONTINUED)
Minimum ExemptLegal from Not
Investment Type Totals Rating Disclosure AAA AA A RatedState investment pool $ 23,263,909 N/A $ - $ - $ - $ - $ 23,263,909 Money market funds 7,504,472 N/A - - - - 7,504,472 Time deposits 6,329,176 N/A - - - - 6,329,176 Held by bond trustees: Money market funds 14,769,990 N/A - 14,769,990 - - -
Totals $ 51,867,547 $ - $ 14,769,990 $ - $ - $ 37,097,557
f. Concentration of Credit Risk
The investment policy of the City contains limitations on the amount that can be invested in any one issuer. Investments in any one issuer (other than U.S. Treasury securities, mutual funds, and external investment pools) that represent 5% or more of total City investments are as follows:
US Bank - Time Deposits $ 3,089,832
Investments in any one issuer that represent 5% or more of total investments by reporting unit (governmental activities, major funds, and nonmajor funds) are as follows: $3,089,832 of cash and investments reported in the Redevelopment Low/Mod Housing Area "A" Special Revenue Fund, Redevelopment Project Area "A" Capital projects Fund, Redevelopment Low/Mod Housing Alameda Area Special Revenue Fund, Tax Increment Area "A" Special Revenue Fund, Tax Increment Alameda Area Special Revenue Fund, Redevelopment Project Alameda Area Capital Project Fund, and Redevelopment Project Area "A" Taxable Bond Proceeds Capital Project Fund are held in the form of time deposits issued by US Bank. These investments mature by June 30, 2010.
City of Lynwood Notes to Financial Statements
Year ended June 30, 2009
49
NOTE3 CASH AND INVESTMENTS (CONTINUED)
g. Custodial Credit Risk
Custodial credit risk for deposits is the risk that, in the event of the failure of a depository financial institution, a government will not be able to recover its deposits or will not be able to recover collateral securities that are in the possession of an outside party. The custodial credit risk for investments is the risk that, in the event of the failure of the counterparty (e.g. broker-dealer) to a transaction, a government will not be able to recover the value of its investment or collateral securities that are in the possession of another party. The California Government Code and the City's investment policy do not contain legal or policy requirements that would limit the exposure to custodial credit risk for deposits or investments, other than the following provision for deposits; The California Government Code requires that a financial institution secure deposits made by state or local governmental units by pledging securities in an undivided collateral pool held by a depository regulated under state law (unless so waived by the governrnent unit). The fair value of the pledged securities in the collateral pool must equal at least 110% of the total amount deposited by the public agencies. California law also allows financial institutions to secure City deposits by pledging first trust deed mortgage notes having a value of 150% of the secured public deposits.
As of June 30, 2009, $9,817,434 of the City's deposits with financial institutions, which include money market accounts, time deposits, are in excess of federal depositary insurance limits and were held in collateralized accounts per the California Government Code. As of June 30, 2009, the City’s investments in the following investment types were held by the same broker-dealer (counterparty) that was used by the City to buy the securities:
Reported
Investment Type AmountTime deposits $ 3,147,914
h. Investment in State Investment Pool The City is a voluntary participant in the Local Agency Investment Fund (LAIF) that
is regulated by the California Government Code under the oversight of the Treasurer of the State of California. The fair value of the City's investment in this pool is reported in the accompanying financial statements at amounts based upon the City's pro-rata share of the fair value provided by LAIF for the entire LAIF portfolio (in relation to the amortized cost of that portfolio). The balance available for withdrawal is based on the accounting records maintained by LAIF, which are recorded on an amortized cost basis. At June 30, 2009, the total fair value of LAIF, including accrued interest was approximately $50.89 billion. The fair value of the City’s investment in the pool is $23.3 million. LAIF’s and the City’s exposure to risk (credit, market, or legal) is not currently available.
City of Lynwood Notes to Financial Statements
Year ended June 30, 2009
50
NOTE 4 LONG-TERM RECEIVABLES
The City of Lynwood and Lynwood Redevelopment Agency have acquired several parcels of land as part of their primary purpose to develop or redevelop blighted properties. The City records these parcels as "land held for resale" in its financial records. The property is being carried at its net realizable value which is estimated to be equal to cost. At June 30, 2009, the net realizable value for land held for resale totaled $4,655,826, with this amount offset by a reservation of fund balance.
NOTE 5 NOTES AND LOANS RECEIVABLE
Parcels of land have been sold to commercial real estate developers in exchange for various loans. Such loans have terms ranging from 3 to 10 years, with interest rates ranging from 3% to 10%. The recognition of revenue from the sale of the land has been deferred on such loans until they are repaid since the amounts do not meet the availability criteria. In several loan agreements, a portion of the entire principal amount will be forgiven upon the completion of the project. In this case, an allowance account is established to reduce the balance of loans receivable. The Agency also extended rehabilitation loans to property owners for the rehabilitation and improvement of commercial buildings. As of June 30, 2009, the long-term receivables balance was $4,212,720. (This amount is net of an allowance in the amount of $4,045,000). Outstanding
Balance June 30, 2009
In 1999, the Agency extended a loan to a developer for financial assistance on the Marketplace/Lynwood Town Center project. The loan in the amount of $1,975,000 will be forgiven after the completion of the project. An allowance in the amount of $1,975,000 has been established because of future forgiveness of the loan. $ - The Agency extended a rehabilitation loan to a property owner for the rehabilitation and improvement of a real property known as Marketplace or Lynwood Town Center. The loan in the amount of $2,000,000 bears no interest and was intended to be forgiven upon the Agency’s issuance of a certificate of completion when the entire project is finished. An allowance of $2,000,000 has been established because of future forgiveness of the loan. -
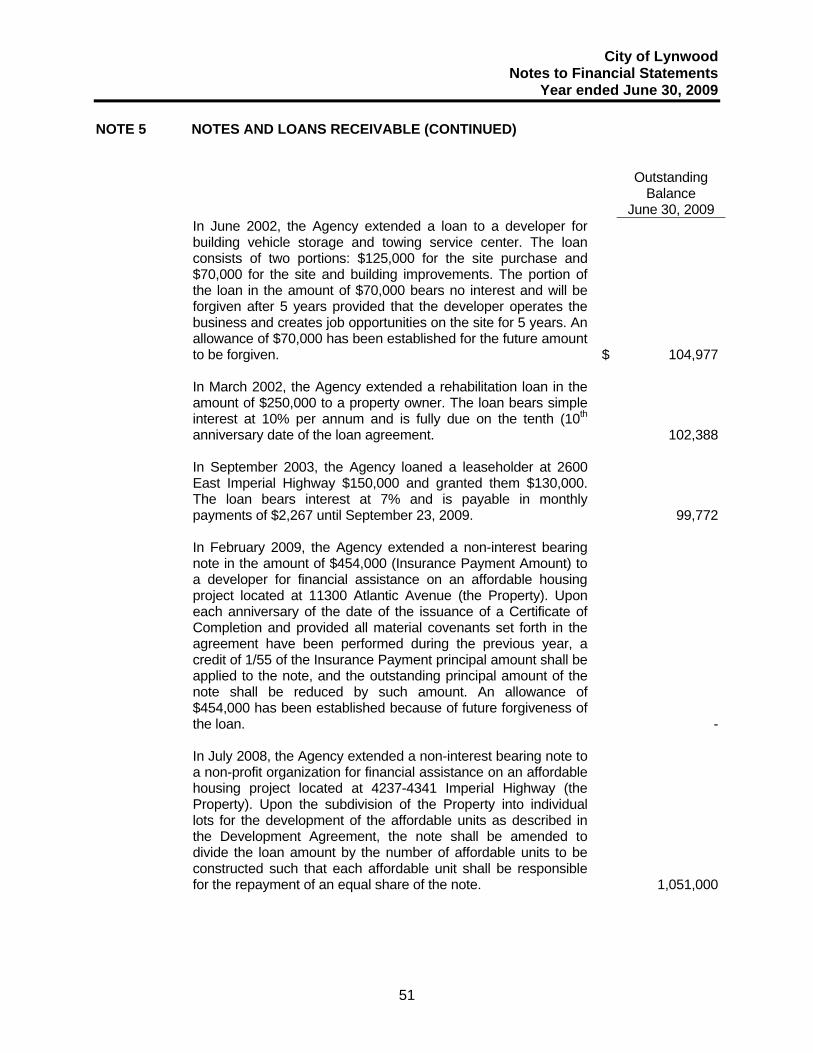
City of Lynwood Notes to Financial Statements
Year ended June 30, 2009
51
NOTE 5 NOTES AND LOANS RECEIVABLE (CONTINUED)
Outstanding Balance
June 30, 2009 In June 2002, the Agency extended a loan to a developer for building vehicle storage and towing service center. The loan consists of two portions: $125,000 for the site purchase and $70,000 for the site and building improvements. The portion of the loan in the amount of $70,000 bears no interest and will be forgiven after 5 years provided that the developer operates the business and creates job opportunities on the site for 5 years. An allowance of $70,000 has been established for the future amount to be forgiven. $ 104,977 In March 2002, the Agency extended a rehabilitation loan in the amount of $250,000 to a property owner. The loan bears simple interest at 10% per annum and is fully due on the tenth (10th anniversary date of the loan agreement. 102,388 In September 2003, the Agency loaned a leaseholder at 2600 East Imperial Highway $150,000 and granted them $130,000. The loan bears interest at 7% and is payable in monthly payments of $2,267 until September 23, 2009. 99,772
In February 2009, the Agency extended a non-interest bearing note in the amount of $454,000 (Insurance Payment Amount) to a developer for financial assistance on an affordable housing project located at 11300 Atlantic Avenue (the Property). Upon each anniversary of the date of the issuance of a Certificate of Completion and provided all material covenants set forth in the agreement have been performed during the previous year, a credit of 1/55 of the Insurance Payment principal amount shall be applied to the note, and the outstanding principal amount of the note shall be reduced by such amount. An allowance of $454,000 has been established because of future forgiveness of the loan. - In July 2008, the Agency extended a non-interest bearing note to a non-profit organization for financial assistance on an affordable housing project located at 4237-4341 Imperial Highway (the Property). Upon the subdivision of the Property into individual lots for the development of the affordable units as described in the Development Agreement, the note shall be amended to divide the loan amount by the number of affordable units to be constructed such that each affordable unit shall be responsible for the repayment of an equal share of the note. 1,051,000

City of Lynwood Notes to Financial Statements
Year ended June 30, 2009
52
NOTE 5 NOTES AND LOANS RECEIVABLE (CONTINUED)
Outstanding
Balance June 30, 2009
The City has received funding from the Department of Housing and Urban Development for the purpose of assisting (through zero or low interest deferred loans) residents and commercial enterprises to rehabilitate their homes and businesses. Some of the loans have maturity dates while others are due upon sale of the underlying property. $ 2,854,583
Net long-term receivables $ 4,212,720 NOTE 6 ACCOUNTS RECEIVABLE The following is a list of accounts receivable at June 30, 2009:
Receivable Allowance NetGovernmental Activities: Intergovernmental $ 3,434,338 $ - $ 3,434,338 Accounts (including taxes) 1,464,495 - 1,464,495 Interest 58,061 - 58,061
$ 4,956,894 $ - $ 4,956,894
Business-type Activities: Accounts 2,833,380 350,766 2,482,614 Interest 29,187 - 29,187
$ 2,862,567 $ 350,766 $ 2,511,801
NOTE 7 DEFERRED CHARGES
Deferred charges consist of issuance costs of certain debt issues. The City defers and amortizes the costs of issuance charged for each debt issue. The total costs deferred as a result of the issuance of the 1999 Tax Allocation Bonds was $790,163. The amortization period ranges from 154 months to 346 months depending on the maturity date of the bonds. Accumulated amortization as of June 30, 2009 was $347,246.

City of Lynwood Notes to Financial Statements
Year ended June 30, 2009
53
NOTE 7 DEFERRED CHARGES (CONTINUED)
The City has deferred costs of issuance, discounts on its 1999 Revenue Bonds. The total amount deferred at June 30, 2009 (net of accumulated amortization of $89,795) was $187,094. The 1993 issue is being amortized over 303 months and the 1999 issue over 358 months. The City also paid costs of issuance arising from the issuance of the 2003 Revenue Refunding Bonds. These costs amounted to $277,155 and are also amortized over 168 months. The accumulated amortization of the costs as of June 30, 2009 was $115,482. In November 2003, the City of Lynwood issued $6,930,000 of Enterprise Revenue Bonds. Total issue costs relating to the issue was $370,026. The period of amortization is 366 months and the accumulated amortization as of June 30, 2009 was $56,616. In November 2008, the City of Lynwood issued $9,755,000 of Enterprise Revenue Bonds. Total issue costs relating to the issue was $294,942. The period of amortization is 360 months and the accumulated amortization as of June 30, 2009 was $6,145. In May 2009, the City of Lynwood issued $5,735,000 of Enterprise Revenue Bonds. Total issue costs relating to the issue was $172,930. The period of amortization is 240 months and the accumulated amortization as of June 30, 2009 was $1,088. All amortization is computed using the straight-line method which approximates the effective interest and bonds outstanding method. All amortization is shown as a component of interest expense on long-term debt in the statement of activities.
NOTE 8 INTERFUND ACTIVITY
The following represents the City’s interfund activity for the fiscal year ended June 30, 2009. Current Interfund Balances Current interfund balances arise in the normal course of business and are expected to be repaid shortly after the end of the fiscal year. The following is a summary of current interfund balances as of June 30, 2009:
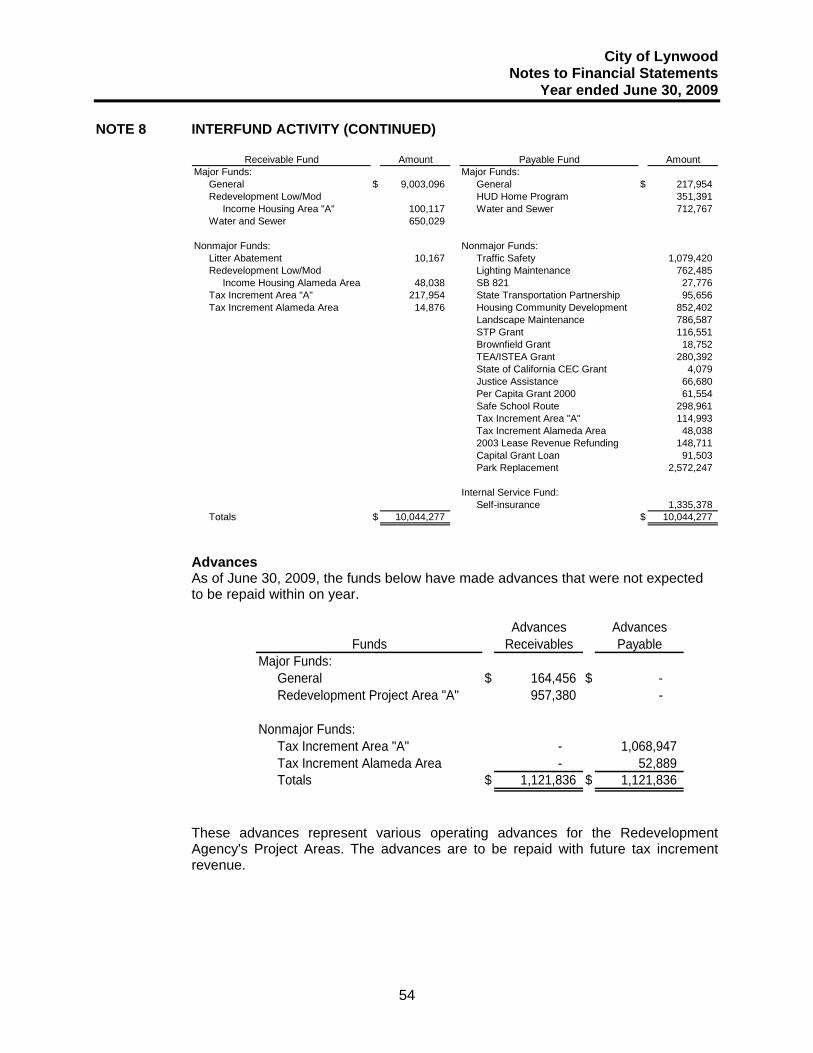
City of Lynwood Notes to Financial Statements
Year ended June 30, 2009
54
NOTE 8 INTERFUND ACTIVITY (CONTINUED)
Amount AmountMajor Funds: Major Funds:
General $ 9,003,096 General $ 217,954 Redevelopment Low/Mod HUD Home Program 351,391 Income Housing Area "A" 100,117 Water and Sewer 712,767 Water and Sewer 650,029
Nonmajor Funds: Nonmajor Funds:Litter Abatement 10,167 Traffic Safety 1,079,420 Redevelopment Low/Mod Lighting Maintenance 762,485 Income Housing Alameda Area 48,038 SB 821 27,776 Tax Increment Area "A" 217,954 State Transportation Partnership 95,656 Tax Increment Alameda Area 14,876 Housing Community Development 852,402
Landscape Maintenance 786,587 STP Grant 116,551 Brownfield Grant 18,752 TEA/ISTEA Grant 280,392 State of California CEC Grant 4,079 Justice Assistance 66,680 Per Capita Grant 2000 61,554 Safe School Route 298,961 Tax Increment Area "A" 114,993 Tax Increment Alameda Area 48,038 2003 Lease Revenue Refunding 148,711 Capital Grant Loan 91,503 Park Replacement 2,572,247
Internal Service Fund:Self-insurance 1,335,378
Totals $ 10,044,277 $ 10,044,277
Receivable Fund Payable Fund
Advances As of June 30, 2009, the funds below have made advances that were not expected to be repaid within on year.
Advances AdvancesReceivables Payable
Major Funds:General $ 164,456 $ - Redevelopment Project Area "A" 957,380 -
Nonmajor Funds:Tax Increment Area "A" - 1,068,947 Tax Increment Alameda Area - 52,889 Totals $ 1,121,836 $ 1,121,836
Funds
These advances represent various operating advances for the Redevelopment Agency's Project Areas. The advances are to be repaid with future tax increment revenue.

City of Lynwood Notes to Financial Statements
Year ended June 30, 2009
55
NOTE 8 INTERFUND ACTIVITY (CONTINUED)
Transfers With Council approval, resources may be transferred from one City fund to another. The purpose of the majority of the transfers is to reimburse a fund that has made expenditures on behalf of another fund.
Transfer in Transfer outMajor Governmental Funds:
General $ 1,954,712 $ 1,372,204 Redevelopment Low/Mod Income Housing Area "A" 1,427,632 - Redevelopment Project Area "A" 2,182,581 - Capital Improvement Projects 4,532,781 -
Nonmajor Governmental Funds:Traffic Safety 1,342,604 - Lighting Maintenance - 221,127 Gas Tax - 1,342,604 Retirement - 1,716,192 Air Quality Improvement - 100,000 SB 821 - 87,700 Housing Community Development - 26,699 Prop A - 826,989 Landscape Maintenance - 179,334 Robert-Zberg Harris - 316,960 Prop C - 985,850 STP Grant - 5,880 Prop 1B - 1,352,866 TEA//ISTEA Grant - 2,802 LA County Park Maintenance Grant - 67,672 AB 2928 Traffic Congestion Relief - 138,606 State of California CEC Grant - 4,079 Per Capita Grant 2000 - 293,512 Prop 40 Grant 360 - Redevelopment Low/Mod Income Housing Alameda Area 279,239 - Tax increment Area "A" - 3,610,213 Tax Increment Alameda Area 27 1,011,645 Public Financing Authority 10,486 - City of Lynwood 1,233,149 - 2003 Lease Revenue refunding - 4,723 Redevelopment Project Alameda Area 732,379 - Capital Project Loan - 35,470 Park Replacement - 508,136
Major Enterprise Fund:Transit 1,068,468 - Water and Sewer - 553,155 Totals $ 14,764,418 $ 14,764,418
Funds

City of Lynwood Notes to Financial Statements
Year ended June 30, 2009
56
NOTE 9 CAPITAL ASSETS
Governmental Activities Capital asset governmental activity for the year ended June 30, 2009 was as follows:
Balance Balance
July 1, 2008 Additions Deletions June 30, 2009
Governmental ActivitiesCapital assets not being depreciated Land $ 35,174,105 $ 847,505 $ (807,537) $ 35,214,073 Rights of way 22,904,319 - - 22,904,319 Trees 287,627 - - 287,627 Construction in progress 28,357,485 3,923,245 (2,272,587) 30,008,143 Total capital assets not being depreciated 86,723,536 4,770,750 (3,080,124) 88,414,162
Capital assets being depreciated: Buildings and improvements 10,170,224 34,487 - 10,204,711 Machinery and equipment 733,741 396,698 - 1,130,439 Infrastructure Roadways, curbs and gutters 24,138,054 2,132,075 - 26,270,129 Sidewalks and medians 5,941,024 - - 5,941,024 Other street appurtenances 4,517,408 140,500 - 4,657,908 Total capital assets being depreciated 45,500,451 2,703,760 - 48,204,211
Less accumulated depreciation for: Buildings and improvements (4,587,214) (205,388) - (4,792,602) Machinery and equipment (576,135) (255,986) - (832,121) Infrastructure Roadways, curbs and gutters (10,017,328) (498,206) - (10,515,534) Sidewalks and medians (2,246,171) (140,275) - (2,386,446) Other street appurtenances (1,960,864) (94,813) - (2,055,677) Total accumulated depreciation (19,387,712) (1,194,668) - (20,582,380)
Capital assets being depreciated, net 26,112,739 1,509,092 - 27,621,831
Governmental activities capital assets, net $ 112,836,275 $ 6,279,842 $ (3,080,124) $ 116,035,993
Internal Service Fund (Allocated to Governmental Activities)
Balance BalanceJuly 1, 2008 Additions Deletions June 30, 2009
Capital assets being depreciated: Machinery and equipment $ 3,248,357 $ - $ - $ 3,248,357 Total capital assets being depreciated 3,248,357 - - 3,248,357
Less accumulated depreciation for: Machinery and equipment (1,980,779) (35,151) - (2,015,930) Total accumulated depreciation (1,980,779) (35,151) - (2,015,930)
Capital assets being depreciated, net $ 1,267,578 $ (35,151) $ - $ 1,232,427

City of Lynwood Notes to Financial Statements
Year ended June 30, 2009
57
NOTE 9 CAPITAL ASSETS (CONTINUED)
Total Governmental Activities
Balance BalanceJuly 1, 2008 Additions Deletions June 30, 2009
Governmental ActivitiesCapital assets not being depreciated Land $ 35,174,105 $ 847,505 $ (807,537) $ 35,214,073 Rights of way 22,904,319 - - 22,904,319 Trees 287,627 - - 287,627 Construction in progress 28,357,485 3,923,245 (2,272,587) 30,008,143 Total capital assets not being depreciated 86,723,536 4,770,750 (3,080,124) 88,414,162
Capital assets, being depreciated: Buildings and improvements 10,170,224 34,487 - 10,204,711 Machinery and equipment 3,982,098 396,698 - 4,378,796 Infrastructure Roadways, curbs and gutters 24,138,054 2,132,075 - 26,270,129 Sidewalks and medians 5,941,024 - - 5,941,024 Other street appurtenances 4,517,408 140,500 - 4,657,908 Total capital assets, being depreciated 48,748,808 2,703,760 - 51,452,568
Less accumulated depreciation for: Buildings and improvements (4,587,214) (205,388) - (4,792,602) Machinery and equipment (2,556,914) (291,137) - (2,848,051) Infrastructure Roadways, curbs and gutters (10,017,328) (498,206) - (10,515,534) Sidewalks and medians (2,246,171) (140,275) - (2,386,446) Other street appurtenances (1,960,864) (94,813) - (2,055,677) Total accumulated depreciation (21,368,491) (1,229,819) - (22,598,310)
Capital assets, being depreciated, net 27,380,317 1,473,941 - 28,854,258
Governmental Activities Capital Assets, Net $ 114,103,853 $ 6,244,691 $ (3,080,124) $ 117,268,420
Depreciation expense was charged to functions/programs of the City's governmental activities as follows:
InternalGovernmental Service Total
General government $ 193,737 $ - $ 193,737 Public safety 7,893 - 7,893 Public works 905,228 35,151 940,379 Community development 2,074 - 2,074 Parks and recreation 85,736 - 85,736
$ 1,194,668 $ 35,151 $ 1,229,819

City of Lynwood Notes to Financial Statements
Year ended June 30, 2009
58
NOTE 9 CAPITAL ASSETS (CONTINUED) Business-type Activities
Capital asset business-type activity (Water activity) for the year ended June 30, 2009 was as follows:
Balance BalanceJuly 1, 2008 Additions Deletions June 30, 2009
Water Activity:Capital assets not being depreciated Land $ 37,252 $ - $ - $ 37,252 Total capital assets not being depreciated 37,252 - - 37,252
Capital assets being depreciated: Buildings and improvements 35,499 13,698 - 49,197 Infrastructure 13,096,117 - - 13,096,117 Total capital assets being depreciated 13,131,616 13,698 - 13,145,314
Less accumulated depreciation for: Buildings and improvements (9,230) (710) - (9,940) Infrastructure (5,119,915) (354,544) - (5,474,459) Total accumulated depreciation (5,129,145) (355,254) - (5,484,399)
Capital assets being depreciated, net 8,002,471 (341,556) - 7,660,915
Water capital assets, net $ 8,039,723 $ (341,556) $ - $ 7,698,167
Depreciation expense was charged to functions/programs of the City's business-type activities as follows: Business-type Activities: Water $355,254
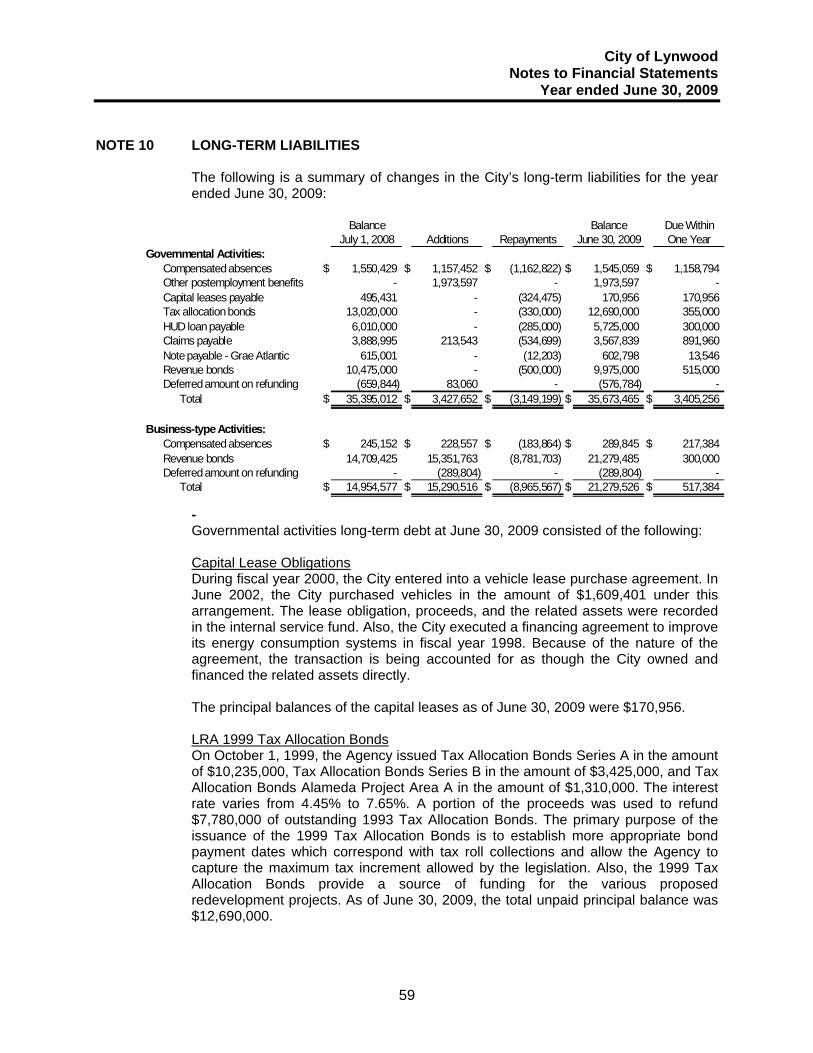
City of Lynwood Notes to Financial Statements
Year ended June 30, 2009
59
NOTE 10 LONG-TERM LIABILITIES
The following is a summary of changes in the City’s long-term liabilities for the year ended June 30, 2009:
Governmental long-Governmental activities long-term debt at June 30, 2009 consisted of the following: Capital Lease Obligations During fiscal year 2000, the City entered into a vehicle lease purchase agreement. In June 2002, the City purchased vehicles in the amount of $1,609,401 under this arrangement. The lease obligation, proceeds, and the related assets were recorded in the internal service fund. Also, the City executed a financing agreement to improve its energy consumption systems in fiscal year 1998. Because of the nature of the agreement, the transaction is being accounted for as though the City owned and financed the related assets directly. The principal balances of the capital leases as of June 30, 2009 were $170,956.
LRA 1999 Tax Allocation Bonds On October 1, 1999, the Agency issued Tax Allocation Bonds Series A in the amount of $10,235,000, Tax Allocation Bonds Series B in the amount of $3,425,000, and Tax Allocation Bonds Alameda Project Area A in the amount of $1,310,000. The interest rate varies from 4.45% to 7.65%. A portion of the proceeds was used to refund $7,780,000 of outstanding 1993 Tax Allocation Bonds. The primary purpose of the issuance of the 1999 Tax Allocation Bonds is to establish more appropriate bond payment dates which correspond with tax roll collections and allow the Agency to capture the maximum tax increment allowed by the legislation. Also, the 1999 Tax Allocation Bonds provide a source of funding for the various proposed redevelopment projects. As of June 30, 2009, the total unpaid principal balance was $12,690,000.
Balance Balance Due WithinJuly 1, 2008 Additions Repayments June 30, 2009 One Year
Governmental Activities:Compensated absences $ 1,550,429 $ 1,157,452 $ (1,162,822) $ 1,545,059 $ 1,158,794 Other postemployment benefits - 1,973,597 - 1,973,597 - Capital leases payable 495,431 - (324,475) 170,956 170,956 Tax allocation bonds 13,020,000 - (330,000) 12,690,000 355,000 HUD loan payable 6,010,000 - (285,000) 5,725,000 300,000 Claims payable 3,888,995 213,543 (534,699) 3,567,839 891,960 Note payable - Grae Atlantic 615,001 - (12,203) 602,798 13,546 Revenue bonds 10,475,000 - (500,000) 9,975,000 515,000 Deferred amount on refunding (659,844) 83,060 - (576,784) -
Total $ 35,395,012 $ 3,427,652 $ (3,149,199) $ 35,673,465 $ 3,405,256
Business-type Activities:Compensated absences $ 245,152 $ 228,557 $ (183,864) $ 289,845 $ 217,384 Revenue bonds 14,709,425 15,351,763 (8,781,703) 21,279,485 300,000 Deferred amount on refunding - (289,804) - (289,804) -
Total $ 14,954,577 $ 15,290,516 $ (8,965,567) $ 21,279,526 $ 517,384

City of Lynwood Notes to Financial Statements
Year ended June 30, 2009
60
NOTE 10 LONG-TERM LIABILITIES (CONTINUED)
HUD Section 108 Loan Payable On August 8, 2002, the Department of Housing and Urban Development loaned $7 million to the City of Lynwood. The funds are to be used for expansion, rehabilitation, and development of the Plaza De Mexico project. The interest rate charged on the loan varies from 5.0% to 6.0% and the final maturity date of the loan is August 8, 2021. Principal payments are due every August 1 starting in 2004 and interest is to be paid semi-annually. The City has received $875,000 in Federal Brownfield Grant funds to assist in the payment of principal and interest. The balance of the loan outstanding at June 30, 2009 was $5,725,000. Claims Payable The City is self insured for general liability and workers' compensation claims. The City records losses for claims incurred but not reported when the probable amount of loss can be reasonably estimated. Total amount of estimated claims outstanding at June 30, 2009 is $3,567,839. Note Payable - Grae Atlantic On July 18, 2000, the Agency executed a Disposition and Development Agreement (DDA) with Grae Ventures, LLC for the development of a commercial project at the corner of Atlantic Avenue and Imperial Highway. The agreement stipulates that the Agency will contribute $635,900 through a Tax increment Loan Agreement. The Agency began monthly payments to Grae Ventures, LLC during the fiscal year ended June 30, 2007. Payments are $79,853 per year at an interest rate of 11 %. The final payment is due during the fiscal year ending June 30, 2026. The balance as of June 30, 2009 is $602,798. Lynwood Public Financing Authority 1999 Lease Revenue Refunding Bonds On October 28, 1999 the Lynwood Public Financing Authority issued $3,760,000 of 1999 Lease Revenue Refunding Bonds. The proceeds plus bond funds from the 1996 Revenue Bonds in the amount of $151,141 will be used to pay costs of issuance, fund a reserve account, finance improvements, and to refund the Authority's 1996 Revenue Bonds in the amount of $1,440,000. Interest on the bonds is payable semi-annually each September 1 and March 1. The principal matures each September 1 beginning in 2019 and maturing in 2029. The bonds have interest rates of 6.25% and 6.30%. The outstanding balance of the bonds at June 30, 2009 is $3,760,000. Lynwood Public Financing Authority 2003 Lease Revenue Refunding Bonds Series A and B On September 3, 2003, the Lynwood Public Financing Authority issued $8,630,000 of 2003 Lease Revenue Refunding Bonds. The proceeds along with remaining funds from the 1993 issue will be used to advance refund the 1993 Lynwood Public Financing Authority Revenue Bonds Series A, pay costs of issuance, fund a reserve account, and fund certain projects within the City (corporate yard land purchase and improvements to the City owned property). Interest on the Bonds is payable semi-annually each March 1 and September 1 beginning on March 1, 2004. Principal matures each September 1 beginning in 2004 and maturing in 2018. Interest rates on the bonds vary between 2.125% and 5.00% for the Series A bonds and 1.65% and 2.36% for the Series B bonds. The outstanding balance of the bonds at June 30, 2009 was $6,215,000.

City of Lynwood Notes to Financial Statements
Year ended June 30, 2009
61
NOTE 10 LONG-TERM LIABILITIES (CONTINUED)
Business-type long-term debt at June 30, 2009 consisted of the following: Revenue Bonds Payable, Water Fund 1995 Series A On November 22, 1995, the City of Lynwood issued $4,500,000 of Water Revenue Bonds, Series 1995. The proceeds were used to improve, renovate, and expand the City's water distribution system, fund a reserve, and pay cost of issuance. The Bonds carry interest rates of 6.15%, 6.50%, and 7.25% and mature in 2021. Interest is payable semi-annually every December 1 and June 1 with principal due every June 1 beginning in 1997. The bonds were refunded during the year through the issuance of the Revenue Bonds, 2008 Series A. Revenue Bonds Payable, Water Fund Series 1999 On October 28, 1999, the Lynwood Public Financing Authority issued Revenue Bonds in the amount of $5,850,000 in order to pay for discounts and costs of issuance, and finance improvements to the water distribution system. The bonds consist of $580,000 of serial bonds maturing in part each June 1 beginning in 2000 and ending in 2011. Interest rates on the serial bonds vary from 3.8% to 5.25%. The issue also consists of $5,270,000 of term bonds with maturity dates beginning on June 1, 2022. These term bonds have interest rates at 5.85% and 5.90%. The bonds were refunded during the year through the issuance of the Revenue Bonds, 2009 Series A. Lynwood Utility Authority 2003 Enterprise Revenue Bonds On November 20, 2003, the Lynwood Utility Authority issued $6,930,000 of 2003 Enterprise Revenue Bonds, the proceeds which were used to pay costs of issuance, and to improve, renovate and expand the City's Water and Sewer System. The City paid a reserve policy premium in-lieu of funding a reserve account. The bonds consist of $1,450,000 of serial bonds maturing from 2004 through 2013 and $5,480,000 of term bonds maturing on June 1 of 2020, 2025, and 2034. The serial bonds carry interest at rates of 1.00% to 3.625% and mature June 1, 2013. Interest is payable semi-annually every December 1 and June 1 with principal due June 1 beginning in 2006. The term bonds carry interest at 5%. The bonds will be paid from and secured by the net revenues of the water distribution system and the wastewater collection system of the City. The City has covenanted that the net revenues in each year will be greater than or equal to the debt service payments on these bonds and any other parity debt. The principal balance outstanding at June 30, 2009 including unamortized premium of $27,716 was $6,077,716.
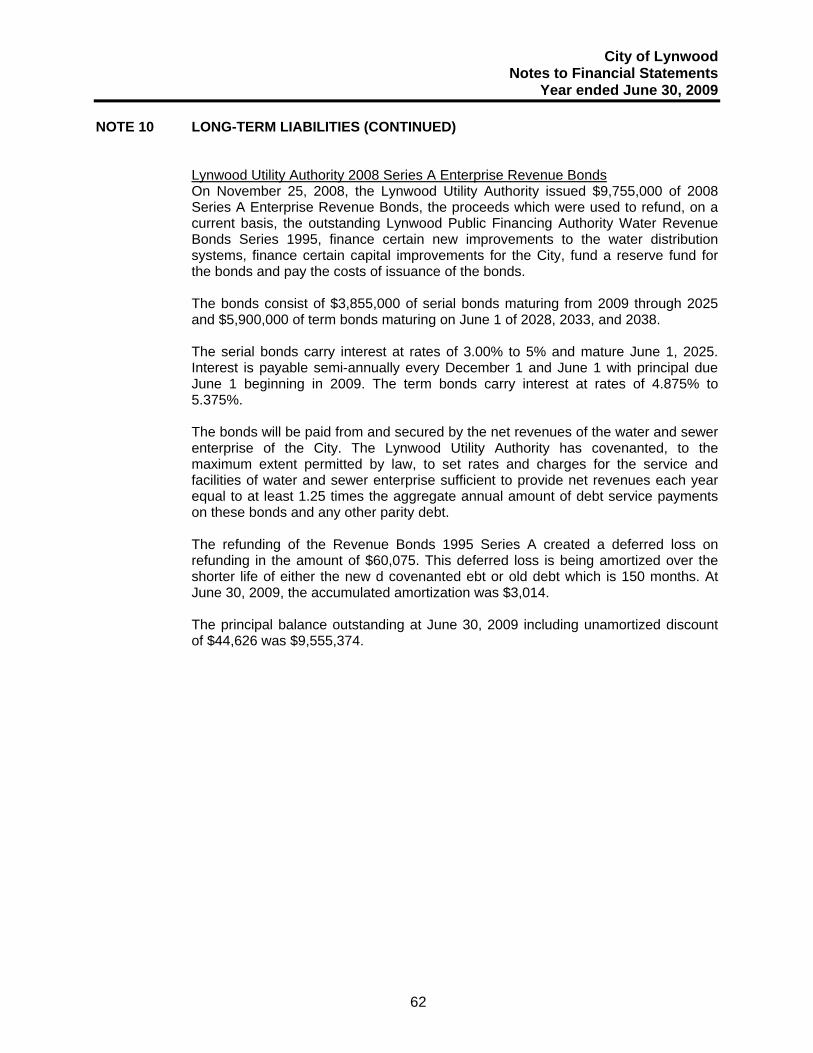
City of Lynwood Notes to Financial Statements
Year ended June 30, 2009
62
NOTE 10 LONG-TERM LIABILITIES (CONTINUED)
Lynwood Utility Authority 2008 Series A Enterprise Revenue Bonds On November 25, 2008, the Lynwood Utility Authority issued $9,755,000 of 2008 Series A Enterprise Revenue Bonds, the proceeds which were used to refund, on a current basis, the outstanding Lynwood Public Financing Authority Water Revenue Bonds Series 1995, finance certain new improvements to the water distribution systems, finance certain capital improvements for the City, fund a reserve fund for the bonds and pay the costs of issuance of the bonds. The bonds consist of $3,855,000 of serial bonds maturing from 2009 through 2025 and $5,900,000 of term bonds maturing on June 1 of 2028, 2033, and 2038. The serial bonds carry interest at rates of 3.00% to 5% and mature June 1, 2025. Interest is payable semi-annually every December 1 and June 1 with principal due June 1 beginning in 2009. The term bonds carry interest at rates of 4.875% to 5.375%. The bonds will be paid from and secured by the net revenues of the water and sewer enterprise of the City. The Lynwood Utility Authority has covenanted, to the maximum extent permitted by law, to set rates and charges for the service and facilities of water and sewer enterprise sufficient to provide net revenues each year equal to at least 1.25 times the aggregate annual amount of debt service payments on these bonds and any other parity debt. The refunding of the Revenue Bonds 1995 Series A created a deferred loss on refunding in the amount of $60,075. This deferred loss is being amortized over the shorter life of either the new d covenanted ebt or old debt which is 150 months. At June 30, 2009, the accumulated amortization was $3,014. The principal balance outstanding at June 30, 2009 including unamortized discount of $44,626 was $9,555,374.

City of Lynwood Notes to Financial Statements
Year ended June 30, 2009
63
NOTE 10 LONG-TERM LIABILITIES (CONTINUED) Lynwood Utility Authority 2009 Series A Enterprise Revenue Bonds On May 28, 2009, the Lynwood Utility Authority issued $5,735,000 of 2009 Series A Enterprise Revenue Bonds, the proceeds which were used to refund, on a current basis, the outstanding Lynwood Public Financing Authority Water Revenue Bonds Series 1999, fund a reserve fund for the bonds and pay the costs of issuance of the bonds. The bonds consist of $3,745,000 of serial bonds maturing from 2012 through 2026 and $1,990,000 of term bonds maturing on June 1 of 2029. The serial bonds carry interest at rates of 2.50% to 5.00% and mature June 1, 2026. Interest is payable semi-annually every December 1 and June 1 with principal due June 1 beginning in December 2009. The term bonds carry interest at rates of 5.00%. The bonds will be paid from and secured by the net revenues of the water and sewer enterprise of the City. The Lynwood Utility Authority has covenanted, to the maximum extent permitted by law, to set rates and charges for the service and facilities of water and sewer enterprise sufficient to provide net revenues each year equal to at least 1.25 times the aggregate annual amount of debt service payments on these bonds and any other parity debt. The refunding of the Revenue Bonds 1999 Series A created a deferred loss on refunding in the amount of $233,228. This deferred loss is being amortized over the shorter life of either the new debt or old debt which is 241 months. At June 30, 2009, the accumulated amortization was $485. The principal balance outstanding at June 30, 2009 including unamortized discount of $88,605 was $5,646,395. Governmental Long-term Debt Amortization The schedules of annual requirements to amortize all governmental (except for compensated absences and claims payable) long-term debt outstanding as of June 30, 2009 including interest are as follows:
Year ending June 30, Principal Interest Total2010 $ 170,956 $ 3,778 $ 174,734
Capital Leases Payable

City of Lynwood Notes to Financial Statements
Year ended June 30, 2009
64
NOTE 10 LONG-TERM LIABILITIES (CONTINUED)
Governmental Long-term Debt Amortization (continued)
Year ending June 30, Principal Interest Total2010 $ - $ 602,483 $ 602,483 2011 - 602,483 602,483 2012 - 602,483 602,483 2013 - 602,483 602,483 2014 395,000 590,929 985,929
2015-2019 2,370,000 2,566,350 4,936,350 2020-2024 3,195,000 1,755,102 4,950,102 2025-2029 4,275,000 660,652 4,935,652
Totals $ 10,235,000 $ 7,982,965 $ 18,217,965
1999 Tax Allocation Bonds A:
Year ending June 30, Principal Interest Total2010 $ 315,000 $ 95,963 $ 410,963 2011 335,000 71,336 406,336 2012 370,000 44,370 414,370 2013 395,000 15,109 410,109
Totals $ 1,415,000 $ 226,778 $ 1,641,778
1999 Tax Allocation Bonds B
Year ending June 30, Principal Interest Total2010 $ 40,000 $ 64,130 $ 104,130 2011 40,000 61,740 101,740 2012 45,000 59,062 104,062 2013 45,000 56,227 101,227 2014 50,000 53,235 103,235
2015-2019 305,000 212,784 517,784 2020-2024 415,000 100,328 515,328
2025 100,000 3,150 103,150 Totals $ 1,040,000 $ 610,656 $ 1,650,656
1999 Tax Allocation Bonds Alameda
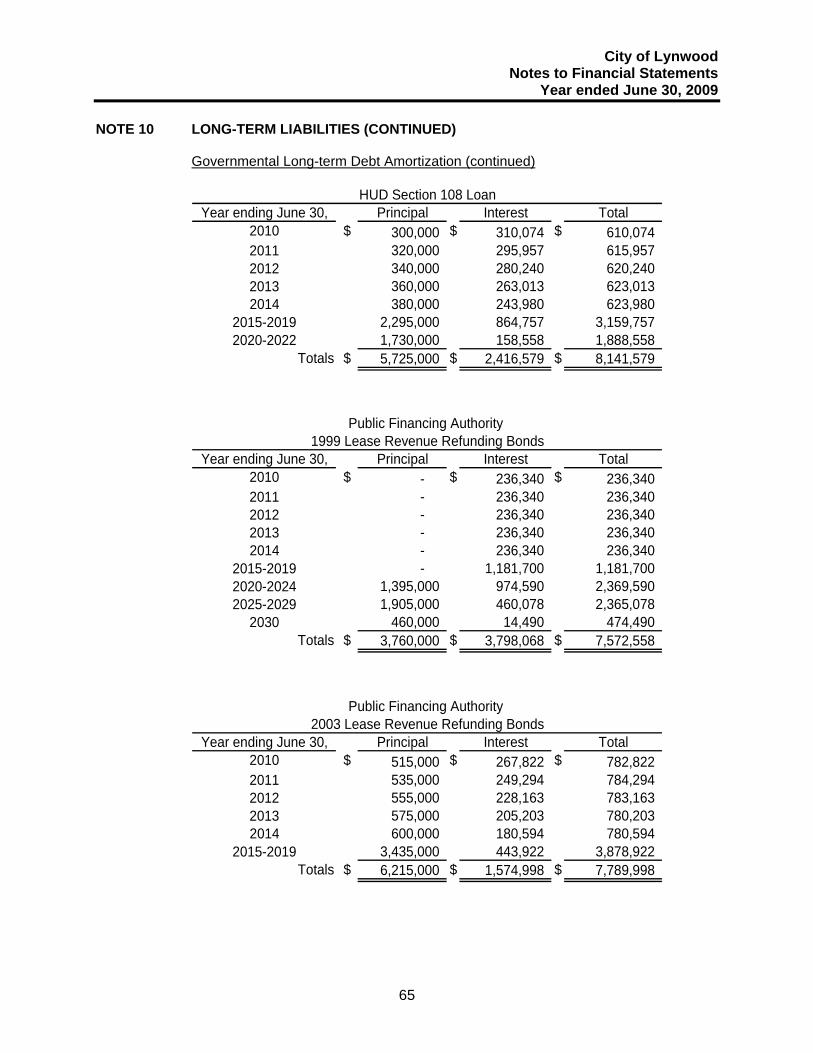
City of Lynwood Notes to Financial Statements
Year ended June 30, 2009
65
NOTE 10 LONG-TERM LIABILITIES (CONTINUED)
Governmental Long-term Debt Amortization (continued)
Year ending June 30, Principal Interest Total2010 $ 300,000 $ 310,074 $ 610,074 2011 320,000 295,957 615,957 2012 340,000 280,240 620,240 2013 360,000 263,013 623,013 2014 380,000 243,980 623,980
2015-2019 2,295,000 864,757 3,159,757 2020-2022 1,730,000 158,558 1,888,558
Totals $ 5,725,000 $ 2,416,579 $ 8,141,579
HUD Section 108 Loan
Year ending June 30, Principal Interest Total2010 $ - $ 236,340 $ 236,340 2011 - 236,340 236,340 2012 - 236,340 236,340 2013 - 236,340 236,340 2014 - 236,340 236,340
2015-2019 - 1,181,700 1,181,700 2020-2024 1,395,000 974,590 2,369,590 2025-2029 1,905,000 460,078 2,365,078
2030 460,000 14,490 474,490 Totals $ 3,760,000 $ 3,798,068 $ 7,572,558
Public Financing Authority 1999 Lease Revenue Refunding Bonds
Year ending June 30, Principal Interest Total2010 $ 515,000 $ 267,822 $ 782,822 2011 535,000 249,294 784,294 2012 555,000 228,163 783,163 2013 575,000 205,203 780,203 2014 600,000 180,594 780,594
2015-2019 3,435,000 443,922 3,878,922 Totals $ 6,215,000 $ 1,574,998 $ 7,789,998
2003 Lease Revenue Refunding BondsPublic Financing Authority

City of Lynwood Notes to Financial Statements
Year ended June 30, 2009
66
NOTE 10 LONG-TERM LIABILITIES (CONTINUED)
Governmental Long-term Debt Amortization (continued)
Year ending June 30, Principal Interest Total2010 $ 13,546 $ 66,308 $ 79,854 2011 15,036 64,818 79,854 2012 16,690 63,164 79,854 2013 18,526 61,328 79,854 2014 20,564 59,290 79,854
2015-2019 142,158 257,112 399,270 2020-2024 239,544 159,726 399,270 2025-2026 136,734 22,951 159,685
Totals $ 602,798 $ 754,712 $ 1,357,495
Note Payable - Grae Atlantic
Year ending June 30, Principal Interest Total2010 $ 1,354,502 $ 1,646,898 $ 3,001,400 2011 1,245,036 1,581,968 2,827,004 2012 1,326,690 1,513,822 2,840,512 2013 1,393,526 1,439,703 2,833,229 2014 1,445,564 1,364,368 2,809,932
2015-2019 8,547,158 5,526,625 14,073,783 2020-2024 6,974,544 3,148,304 10,122,848 2025-2029 6,416,734 1,146,831 7,563,565
2030 460,000 14,490 474,490 Totals $ 29,163,754 $ 17,383,009 $ 46,546,763
Total Long-term Debt

City of Lynwood Notes to Financial Statements
Year ended June 30, 2009
67
NOTE 10 LONG-TERM LIABILITIES (CONTINUED) Business-type Long-term Debt Amortization
The schedules of annual requirements to amortize all business-type long-term debt outstanding as of June 30, 2009 including interest are as follows:
Year ending June 30, Principal Interest Total2010 $ 135,000 $ 293,113 $ 428,113 2011 140,000 289,062 429,062 2012 145,000 284,512 429,512 2013 150,000 279,438 429,438 2014 155,000 274,000 429,000
2015-2019 890,000 1,246,500 2,136,500 2020-2024 1,135,000 1,001,000 2,136,000 2025-2029 1,450,000 687,500 2,137,500 2030-2034 1,850,000 286,500 2,136,500
Plus - premium 27,716 - 27,716 Totals $ 6,077,716 $ 4,355,125 $ 10,719,341
2003 Enterprise Revenue Bonds
Year ending June 30, Principal Interest Total2010 $ 165,000 $ 472,606 $ 637,606 2011 170,000 467,656 637,656 2012 175,000 461,706 636,706 2013 185,000 455,581 640,581 2014 190,000 446,331 636,331
2015-2019 1,110,000 2,086,106 3,196,106 2020-2024 1,390,000 1,805,156 3,195,156 2025-2029 1,740,000 1,447,781 3,187,781 2030-2034 2,230,000 963,863 3,193,863 2035-2038 2,245,000 309,331 2,554,331
Less - discount (44,626) - (44,626) Totals $ 9,555,374 $ 8,916,117 $ 18,471,491
2008 Enterprise Revenue Bonds

City of Lynwood Notes to Financial Statements
Year ended June 30, 2009
68
NOTE 10 LONG-TERM LIABILITIES (CONTINUED) Business-type Long-term Debt Amortization
Year ending June 30, Principal Interest Total2010 $ - $ 265,872 $ 265,872 2011 - 263,675 263,675 2012 30,000 263,675 293,675 2013 45,000 262,775 307,775 2014 100,000 261,650 361,650
2015-2019 555,000 1,254,088 1,809,088 2020-2024 1,835,000 1,081,925 2,916,925 2025-2029 3,170,000 486,038 3,656,038
Less - discount (88,605) - (88,605) Totals $ 5,646,395 $ 4,139,698 $ 9,786,093
2009 Enterprise Revenue Bonds
Year ending June 30, Principal Interest Total2010 $ 300,000 $ 1,031,591 $ 1,331,591 2011 310,000 1,020,393 1,330,393 2012 350,000 1,009,893 1,359,893 2013 380,000 997,794 1,377,794 2014 445,000 981,981 1,426,981
2015-2019 2,555,000 4,586,694 7,141,694 2020-2024 4,360,000 3,888,081 8,248,081 2025-2029 6,360,000 2,621,319 8,981,319 2030-2034 4,080,000 1,250,363 5,330,363 2035-2038 2,245,000 309,331 2,554,331
Less - discount (105,515) - (105,515) Totals $ 21,279,485 $ 17,697,440 $ 38,976,925
Total Long-term Debt
NOTE 11 DEFINED BENEFIT PENSION PLAN
Plan Description The City contributes to two single-employer defined benefit pension plans: Employees Retirement Plan (Miscellaneous Plan) and Fire Retirement Plan (Safety Plan). Each plan provides retirement and disability benefits, annual cost-of-living adjustments, and death benefits to plan members and beneficiaries. These plans are part of the Public Agency portion of the California Public Employees Retirement System (CaIPERS), an agent multiple-employer plan administered by CaIPERS, which acts as a common investment and administrative agent for the participating public employers within the State of California.

City of Lynwood Notes to Financial Statements
Year ended June 30, 2009
69
NOTE 11 DEFINED BENEFIT PENSION PLAN (CONTINUED)
A menu of benefit provisions as well as other requirements is established by State statutes within the Public Employees' Retirement law. The City selects optional benefit provisions from the benefit menu by contract with CalPERS and adopts those benefits through local ordinance. CalPERS issues a separate comprehensive annual financial report for each plan. Copies of the CaIPERS' annual financial report may be obtained from the CalPERS Executive Office, 400 P Street, Sacramento, CA 95814. Effective November 1, 2000, the fire department was transferred to Los Angeles County (County). As a result, certain safety members (employees of the fire department) of CalPERS have ceased to be employed by the fire department of the City and have been employed by the County, and upon such transfer, these safety members have become members of Los Angeles County Employees Retirement Association (LACERA). Effective June 28, 2002, CalPERS and the Board of Retirement of LACERA entered into an agreement to terminate CaIPERS' liability related to these safety members and for LACERA to assume liability, and to transfer employee and employer contributions with interests from the City's safety plan with CalPERS to LACERA, for safety members transferred to the County. However, this agreement does not apply to safety members who have retired on or before the effective date of this agreement. These retirees will continue to receive their pension benefits from the City's safety plan with CaIPERS. Funding Policy Active plan members are required to contribute 8% for miscellaneous members of their annual covered salary. The City is required to contribute the actuarially determined remaining amounts necessary to fund the benefits for its members. The actuarial methods and assumptions used are those adopted by the CalPERS Board of Administration. The required employer contribution rate for fiscal year 2007/08 was 19.113% for miscellaneous employees. The contribution requirements of the plan members are established by State statute and the employer contribution rates are established and may be amended by CaIPERS.

City of Lynwood Notes to Financial Statements
Year ended June 30, 2009
70
NOTE 11 DEFINED BENEFIT PENSION PLAN
Three-Year Trend Information - Miscellaneous Plan Annual Pension Cost For the year ended June 30, 2009, the City's annual pension cost of $1,678,342 for PERS was equal to the City's required and actual contributions. The required contribution was determined as part of the June 30, 2006, actuarial valuation using the entry age normal actuarial cost method. The actuarial assumptions included (a) a 7.75% investment rate of return (net of administrative expenses); (b) projected salary increases that vary by age, length of service and type of employment from 3.25 % to 14.45%, (c) a 3.0% inflation rate; (d) a 3.25% payroll growth rate; and (e) a merit scale varying by duration of employment coupled with an assumed annual inflation component of 3.0% and an annual production growth of 0.25%. The actuarial value of the Plan's assets was determined using a technique that smoothes the effect of short-term volatility in the market value of investments over a three-year period. Initial unfunded liabilities are amortized over a closed period that depends on the Plan's date of entry into CaIPERS. Subsequent Plan amendments are amortized as a level percentage of pay over a closed 20-year period. Gains and losses that occur in the operation of the Plan are amortized over a rolling period which results in an amortization of 10% of unamortized gains and losses each year. If the Plan's accrued liability exceeds the actuarial value of Plan assets, then the amortization payment on the total unfunded liability may not be lower than the payment calculated over a 30-year amortization period.
Three-year Trend Information for PERS (In Thousands)
Three-Year Trend Information - Miscellaneous Plan
Fiscal Annual Pension Percentage of Net PensionYear Ending Cost (APC) APC contributed Obligation6/30/2007 $ 1,411,788 100% $ - 6/30/2008 1,660,098 100% - 6/30/2009 1,678,342 100% -
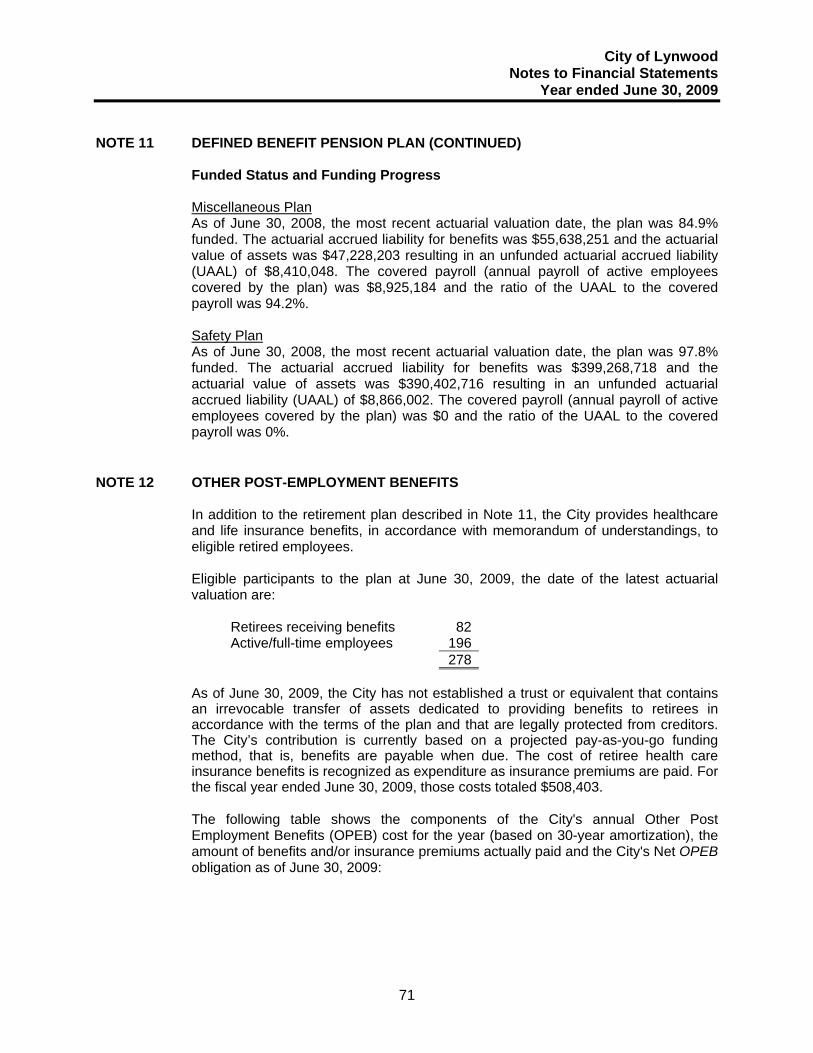
City of Lynwood Notes to Financial Statements
Year ended June 30, 2009
71
NOTE 11 DEFINED BENEFIT PENSION PLAN (CONTINUED)
Funded Status and Funding Progress Miscellaneous Plan As of June 30, 2008, the most recent actuarial valuation date, the plan was 84.9% funded. The actuarial accrued liability for benefits was $55,638,251 and the actuarial value of assets was $47,228,203 resulting in an unfunded actuarial accrued liability (UAAL) of $8,410,048. The covered payroll (annual payroll of active employees covered by the plan) was $8,925,184 and the ratio of the UAAL to the covered payroll was 94.2%. Safety Plan As of June 30, 2008, the most recent actuarial valuation date, the plan was 97.8% funded. The actuarial accrued liability for benefits was $399,268,718 and the actuarial value of assets was $390,402,716 resulting in an unfunded actuarial accrued liability (UAAL) of $8,866,002. The covered payroll (annual payroll of active employees covered by the plan) was $0 and the ratio of the UAAL to the covered payroll was 0%.
NOTE 12 OTHER POST-EMPLOYMENT BENEFITS
In addition to the retirement plan described in Note 11, the City provides healthcare and life insurance benefits, in accordance with memorandum of understandings, to eligible retired employees.
Eligible participants to the plan at June 30, 2009, the date of the latest actuarial valuation are:
Retirees receiving benefits 82Active/full-time employees 196 278
As of June 30, 2009, the City has not established a trust or equivalent that contains an irrevocable transfer of assets dedicated to providing benefits to retirees in accordance with the terms of the plan and that are legally protected from creditors. The City’s contribution is currently based on a projected pay-as-you-go funding method, that is, benefits are payable when due. The cost of retiree health care insurance benefits is recognized as expenditure as insurance premiums are paid. For the fiscal year ended June 30, 2009, those costs totaled $508,403. The following table shows the components of the City's annual Other Post Employment Benefits (OPEB) cost for the year (based on 30-year amortization), the amount of benefits and/or insurance premiums actually paid and the City's Net OPEB obligation as of June 30, 2009:

City of Lynwood Notes to Financial Statements
Year ended June 30, 2009
72
NOTE 12 OTHER POST-EMPLOYMENT BENEFITS (CONTINUED)
Amount
Annual required contribution $ 2,482,000 Interest on net OPEB obligation - Annual OPEB cost (expense) 2,482,000 Contributions to irrevocable trust - Premium payments including benefit payments 508,403 Increase in net OPEB obligation 1,973,597 Net OPEB obligation - beginning of year - Net OPEB obligation - end of year $ 1,973,597
The Annual Required Contribution (ARC) is an amount actuarially determined in accordance with the parameters of GASB Statement 45. The ARC represents a level of funding that, if paid on an ongoing basis, is projected to cover the normal cost each year and amortize any unfunded actuarial liabilities (or funding excess) over a period not to exceed 30 years. The City's annual OPEB cost, the percentage of annual OPEB cost contributed to the plan, and the net OPEB obligation for 2009 were:
Fiscal Year Ended
Annual
OPEB Cost
Percentage of Annual OPEB
Cost Contributed
Net OPEB Obligation
6/30/09 $2,482,000 20% $1,974,000
The funded status of the plan as of June 30, 2009, the plan's most recent actuarial valuation date, was:
Actuarial accrued liability (AAL) $ 27,232,000 Actuarial value of plan assets - Unfunded actuarial accrued liability (UAAL) $ 27,232,000 Funded ratio (actuarial value of plan assets AAL) - Covered Payroll $ 9,340,000 UAAL as a percentage of covered payroll 292%Normal cost $ 1,480,000
The normal cost for the plan is the amount that the liabilities are expected to increase during the year based on increased eligibility and service. Normal cost is the value of benefits expected to be earned during the year, based on certain methods and assumptions.
City of Lynwood Notes to Financial Statements
Year ended June 30, 2009
73
NOTE 12 OTHER POST-EMPLOYMENT BENEFITS (CONTINUED)
In the June 30, 2009 actuarial valuation, the entry age normal actuarial cost method was used to value liabilities. Wherever normal cost is stated, this cost method is assumed. The actuarial assumptions included a 4.25% discount rate (assuming the Plan will not be pre-funded), an annual non-Medicare eligible HMO medical cost trend rate for 2011 of 8.4% and 2012 of 7.8% (PPO – 2011 of 9.0% and 2012 of 8.3%) decreasing to 4.5% on year 2017, a 3% general inflation rate, and a 3.25% aggregate payroll increase. The UAAL is being amortized as a level percentage of projected payroll over 30 years on a closed group basis.
NOTE 13 NET ASSETS AND FUND BALANCE RESERVATIONS
GASB Statement No. 34 adds the concept of Net Assets, which is measured on the full accrual basis, to the concept of Fund Balance, which is measured on the modified accrual basis. Net Assets Net Assets are divided into three captions under GASB Statement No. 34. These captions apply only to Net Assets as determined at the government-wide level, and are described below: Invested in Capital Assets, net of related debt describes the portion of Net Assets which is represented by the current net book value of the Agency's capital assets, less the outstanding balance of any debt issued to finance these assets. Restricted describes the portion of Net Assets which is restricted as to use by the terms and conditions of agreements with outside parties, governmental regulations, laws, or other restrictions which the Agency cannot unilaterally alter. These principally include developer fees received for use on capital projects, debt service requirements, and redevelopment funds restricted to low and moderate income housing purposes. Unrestricted describes the portion of Net Assets which are not restricted as to use. Included in restricted net assets are those which are restricted due to enabling legislation. The total amount of restricted net assets due to enabling legislation is $6,038,248. Fund Balances Fund balances consist of reserved and unreserved amounts. Reserved fund balances represent that portion of fund balance which is legally segregated. The City has established certain fund balance reserve accounts to report amounts which represent resources not available for appropriation. a. Amounts reserved for long-term advances indicate that repayments are not
available as a resource to meet expenditures of the current fiscal year.

City of Lynwood Notes to Financial Statements
Year ended June 30, 2009
74
NOTE 13 NET ASSETS AND FUND BALANCE RESERVATIONS (CONTINUED)
b. The reserve for notes receivable indicates that repayments are not available as a
resource to meet expenditures of the current fiscal year. c. Amounts reserved for continuing projects in governmental funds are unexpended
appropriations on incomplete capital improvement projects which have been carried forward into the new fiscal year.
d. The reserve for housing represents the 20% housing set aside money in the
Lynwood Redevelopment Agency. e. The reserve for retirement represents amounts set aside to be used to fund
employees' retirement in the future. f. The reserve for debt service represents funds available for the payment of
principal and interest on long-term debt. g. The reserve for land held for resale in the capital projects funds is equal to the
amount of land inventory available for sale to developers for development purposes in future years.
h. The reserve for prepaid items is equal to the amount of prepaid items. The reserve for encumbrances represents purchase orders that were issued, but invoices which were not received nor paid for goods and services prior to June 30, 2009.
NOTE 14 RISK MANAGEMENT
The City is a member of Independent Cities Risk Management Authority (ICRMA). The Independent Cities Risk Management Authority (ICRMA) was established in 1980 to provide excess insurance coverage, risk management and self-insurance services for California cities. ICRMA is a Joint Powers Authority JPA directed by a Governing Board consisting of one representative from each Member City. ICRMA offers members excess liability, excess workers’ compensation, property and special events coverage. Currently there are twenty-two member cities. ICRMA maintains a management services agreement with Bickmore Risk Services to provide staff services to the Authority. Liability Program ICRMA provides coverage on an occurrence basis to Members of the Liability Program between the Members' Self-Insured Retentions (SIR’s) and $2 million. The City of Lynwood currently has a SIR of $200,000. Members pay an annual premium consisting of two components: o risk premium - to fund losses as estimated by ICRMA’s independent actuary
and to fund the cost of reinsurance o administrative premium - to pay management and operations costs
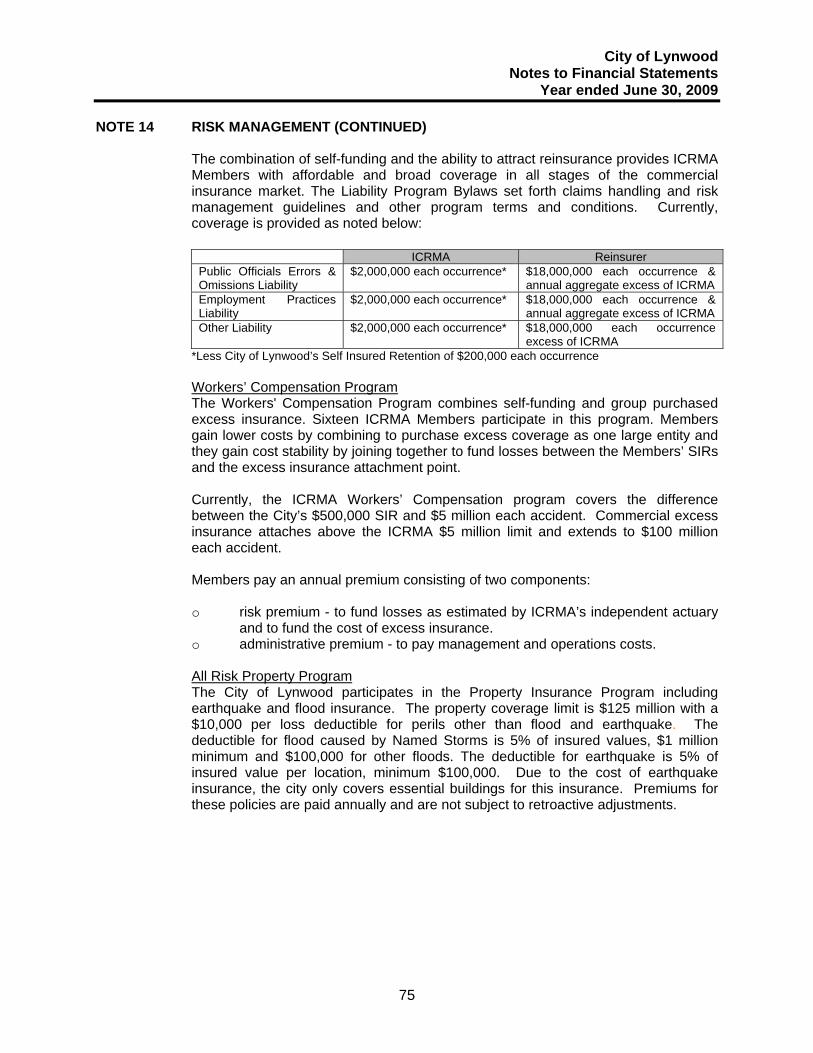
City of Lynwood Notes to Financial Statements
Year ended June 30, 2009
75
NOTE 14 RISK MANAGEMENT (CONTINUED)
The combination of self-funding and the ability to attract reinsurance provides ICRMA Members with affordable and broad coverage in all stages of the commercial insurance market. The Liability Program Bylaws set forth claims handling and risk management guidelines and other program terms and conditions. Currently, coverage is provided as noted below:
ICRMA Reinsurer Public Officials Errors & Omissions Liability
$2,000,000 each occurrence* $18,000,000 each occurrence & annual aggregate excess of ICRMA
Employment Practices Liability
$2,000,000 each occurrence* $18,000,000 each occurrence & annual aggregate excess of ICRMA
Other Liability $2,000,000 each occurrence* $18,000,000 each occurrence excess of ICRMA
*Less City of Lynwood’s Self Insured Retention of $200,000 each occurrence Workers’ Compensation Program The Workers' Compensation Program combines self-funding and group purchased excess insurance. Sixteen ICRMA Members participate in this program. Members gain lower costs by combining to purchase excess coverage as one large entity and they gain cost stability by joining together to fund losses between the Members’ SIRs and the excess insurance attachment point. Currently, the ICRMA Workers’ Compensation program covers the difference between the City’s $500,000 SIR and $5 million each accident. Commercial excess insurance attaches above the ICRMA $5 million limit and extends to $100 million each accident. Members pay an annual premium consisting of two components: o risk premium - to fund losses as estimated by ICRMA’s independent actuary
and to fund the cost of excess insurance. o administrative premium - to pay management and operations costs. All Risk Property Program The City of Lynwood participates in the Property Insurance Program including earthquake and flood insurance. The property coverage limit is $125 million with a $10,000 per loss deductible for perils other than flood and earthquake. The deductible for flood caused by Named Storms is 5% of insured values, $1 million minimum and $100,000 for other floods. The deductible for earthquake is 5% of insured value per location, minimum $100,000. Due to the cost of earthquake insurance, the city only covers essential buildings for this insurance. Premiums for these policies are paid annually and are not subject to retroactive adjustments.
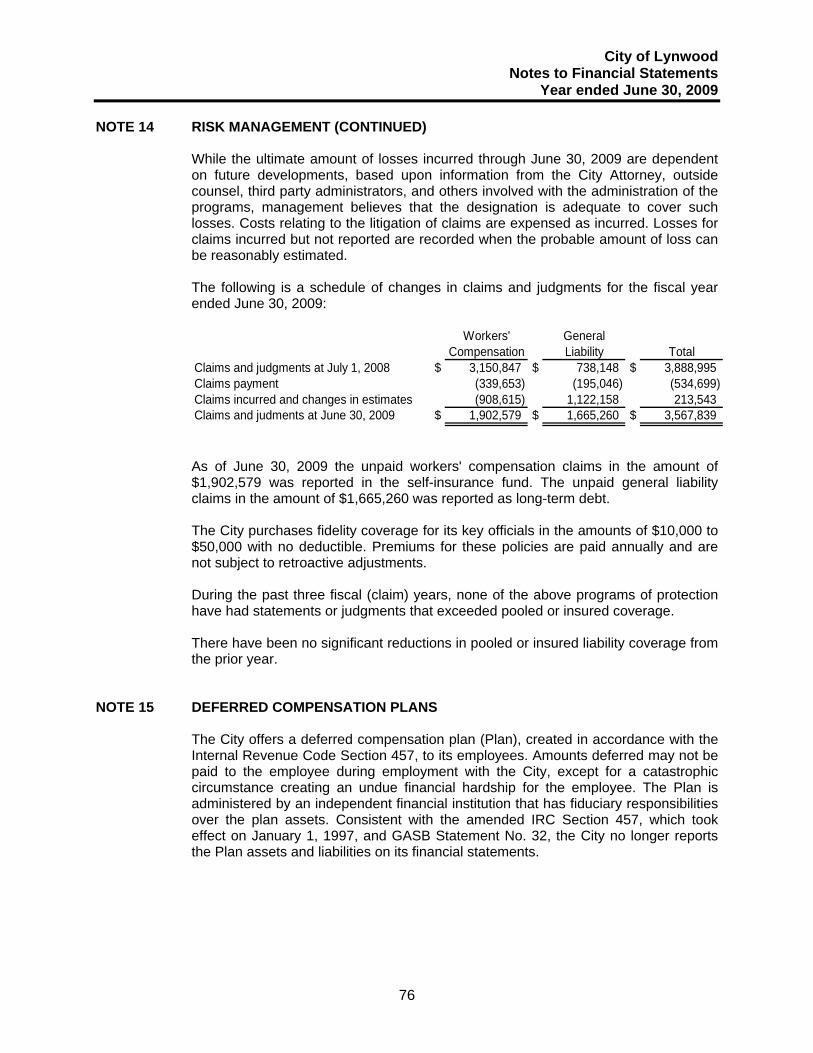
City of Lynwood Notes to Financial Statements
Year ended June 30, 2009
76
NOTE 14 RISK MANAGEMENT (CONTINUED)
While the ultimate amount of losses incurred through June 30, 2009 are dependent on future developments, based upon information from the City Attorney, outside counsel, third party administrators, and others involved with the administration of the programs, management believes that the designation is adequate to cover such losses. Costs relating to the litigation of claims are expensed as incurred. Losses for claims incurred but not reported are recorded when the probable amount of loss can be reasonably estimated. The following is a schedule of changes in claims and judgments for the fiscal year ended June 30, 2009:
Workers' GeneralCompensation Liability Total
Claims and judgments at July 1, 2008 $ 3,150,847 $ 738,148 $ 3,888,995 Claims payment (339,653) (195,046) (534,699) Claims incurred and changes in estimates (908,615) 1,122,158 213,543 Claims and judments at June 30, 2009 $ 1,902,579 $ 1,665,260 $ 3,567,839
As of June 30, 2009 the unpaid workers' compensation claims in the amount of $1,902,579 was reported in the self-insurance fund. The unpaid general liability claims in the amount of $1,665,260 was reported as long-term debt. The City purchases fidelity coverage for its key officials in the amounts of $10,000 to $50,000 with no deductible. Premiums for these policies are paid annually and are not subject to retroactive adjustments. During the past three fiscal (claim) years, none of the above programs of protection have had statements or judgments that exceeded pooled or insured coverage. There have been no significant reductions in pooled or insured liability coverage from the prior year.
NOTE 15 DEFERRED COMPENSATION PLANS
The City offers a deferred compensation plan (Plan), created in accordance with the Internal Revenue Code Section 457, to its employees. Amounts deferred may not be paid to the employee during employment with the City, except for a catastrophic circumstance creating an undue financial hardship for the employee. The Plan is administered by an independent financial institution that has fiduciary responsibilities over the plan assets. Consistent with the amended IRC Section 457, which took effect on January 1, 1997, and GASB Statement No. 32, the City no longer reports the Plan assets and liabilities on its financial statements.
City of Lynwood Notes to Financial Statements
Year ended June 30, 2009
77
NOTE 16 COMMITMENTS AND CONTINGENCIES
Contingencies The City is a defendant in eminent domain and other personal injury and employee/former employee lawsuits of a nature common to many similar jurisdictions. City management believes that the potential claims against the City, not covered by insurance, resulting from such litigation would not materially affect the financial statements of the City. The City has received state and federal funds for specific purposes that are subject to review and audit by the grantor agencies. Although such audits could result in expenditure disallowances under the terms of the grants, it is believed that any required reimbursements will not be material. The City is currently involved in various lawsuits with Developers. Commitments Single-Family Housing Project: Case Grande Development, LLC Pursuant to the Disposition and Development Agreement executed October 27, 2005 between Casa Grande Development (Developer) and Lynwood Redevelopment Agency (Agency), the following is a summary of the Agency’s obligation to the development: • Agency’s cost to purchase land on the Casa Grande site shall not exceed
$5,813,842. • Upon notice, the Agency will be responsible for a cost not to exceed
$1,000,000 for the remediation work, if the remediation work can be completed in 90 days and does not exceed the $1,000,000 amount. The cost may exceed $1,000,000 if it is mutually agreed upon by both the Agency and the Developer to extend the completion date or the Agency or the Developer or both agree to finance the balance of the remediation work.
• The Agency’s total obligation to this project is $6,813,842.
4267 Fernwood The City has entered into a Disposition and Development Agreement (DDA) with Habitat for Humanity to build three very low income housing units. The Agency has contributed the land associated with this DDA and has committed to contribute up to $221,000 for the development of the project. 11300 Atlantic Seniors The City has entered into a Disposition and Development Agreement (DDA) with Cedars Engineering Construction, Inc. for the rehabilitation of certain property with the Redevelopment Project Area A that is owned by the Agency and the rehabilitation thereon of an affordable residential housing project consisting of 14 senior rental units (the Project) and one (1) lower income manager unit. The Agency will provide financial assistance of $710,000 for the combined Insurance Payment Amount (see Note 3) and the Rehabilitation Loan made by the Agency to fund the costs of the Project. In addition, the Agency shall provide a Rental Subsidy amount for the very low and lower income units.

City of Lynwood Notes to Financial Statements
Year ended June 30, 2009
78
NOTE 16 COMMITMENTS AND CONTINGENCIES (CONTINUED)
3076 Redwood The Agency entered into a Loan Agreement with Habitat for Humanity of Greater Los Angeles to purchase foreclosed homes with Federal HOME funds and 20% Housing Set Aside funds; rehabilitate said home with 20% Housing Set Aside funds; and deed restrict and resell to a low income household. 3076 Redwood was purchased for $315,000. $61,906 of 20% Housing Set Aside funds were budgeted and utilized for rehabilitation of the unit. 5525 Clark The Agency entered into a Loan Agreement with Habitat for Humanity of Greater Los Angeles to purchase foreclosed homes with Federal HOME funds and 20% Housing Set Aside funds; rehabilitate said home with 20% Housing Set Aside funds; and deed restrict and resell to a low income household. 5525 Clark was purchased for $299,500. $48,970 of 20% Housing Set Aside funds were budgeted and utilized for rehabilitation of the unit. 3250 Magnolia The Agency entered into an Agreement with AOF Pacific Affordable Homes to rehabilitate, manage, and purchase 3250 Magnolia. The Agency paid $129,000 towards the rehabilitation of the project and acquired three low income rentals. 4237 Imperial The Agency entered into a Loan Agreement with Habitat for Humanity to build ten low income ownership homes. The Agency is obligated to pay $454,000 of Housing Set aside funds towards the building of the homes. 3254 Palm The Agency entered into a Loan Agreement with Habitat for Humanity to build a low income triplex for sale to low income households. Pursuant to the Loan Agreement the Agency shall contribute the land and $243,100 to build the affordable homes. A Brush With Kindness The Agency initiated a new Agreement to rehabilitate ten homes in the City. The Agency obligated $75,000 to implement the program.
Multi-Family Housing Project:
Park Place The Agency entered into an Exclusive Negotiation Agreement (ENA) with AMCAL Multi-Housing, Inc. (Developer) on June 16, 2009 to build 99 apartment units. Park Place will include a community center, computer lab, child care facility, several tot lots, landscaped gardens and a swimming pool and spa area. The project will be built using the latest environmental and sustainable building methods and will include energy efficiency features. The unit breakdown is as follows:
10 Extremely Low (30% AMI or less) units 59 Very Low (50% AMI or less) units 29 Low (60% AMI or less) units 1 non restricted manager unit

City of Lynwood Notes to Financial Statements
Year ended June 30, 2009
79
NOTE 16 COMMITMENTS AND CONTINGENCIES (CONTINUED)
The total project cost is estimated at $28,086,276 and the Developer is asking the Agency for a $4,950,000 loan in addition to approximately one acre of land owned by the Agency within the project site valued at $1,960,000. A Developer Disposition Agreement (DDA) will be negotiated in FY2009-10. Others There are certain claims against the Agency which have been denied and referred to the Agency insurance carrier. The Agency believes that none of these claims will exceed insurance coverage. Under the terms of federal, county, and state grants, periodic audits are required and certain costs may be questioned as not appropriate expenditures under the terms of the grants. Such audits could lead to reimbursements to the grantor agencies. If expenditures were disallowed, the Agency believes such disallowances, if any, would be immaterial.
NOTE 17 COMMITMENTS OF AGENCY TAX INCREMENT
On June 21, 1983, the Agency entered into an agreement with the City of Lynwood for the acquisition and construction of certain water main improvements in the Alameda Project Area. Accordingly, the Agency will be indebted to reimburse the City of Lynwood up to $185,900 relating to the improvements. The Agency has agreed to finance these water main improvements with tax increment money; however, no expenses have been incurred on this contract as of June 30, 2009.
NOTE 18 PRIOR PERIOD ADJUSTMENTS
The General Fund's Fund Balance has been adjusted for $957,379 for an understatement of expenditures in the prior fiscal year. Accordingly, HUD Home Program was adjusted for the same amount. The expenditures were initially recorded under HUD Home but was later determined that the said expenditures should be shouldered by the General Fund.

THIS PAGE LEFT INTENTIONALLY BLANK

REQUIRED SUPPLEMENTARY INFORMATION

City of Lynwood Schedule of Revenues, Expenditures, and Changes in Fund Balance –
Budget and Actual (Continued) General Fund
Year ended June 30, 2009
80
Variance withFinal Budget
PositiveOriginal Final Actual (Negative)
RevenuesTaxes and assessments $ 19,404,570 $ 19,404,570 $ 19,025,999 $ (378,571) Licenses and permits 948,200 903,200 782,452 (120,748) Fines, forfeitures and penalties 1,128,000 1,128,000 1,154,073 26,073 Use of money and property 397,904 397,904 349,104 (48,800) Intergovernmental 914,100 1,307,110 318,601 (988,509) Charges for services 3,369,963 3,021,953 3,319,380 297,427 Adminstrative support 1,118,246 1,118,246 1,208,409 90,163 Miscellaneous 542,433 543,943 754,841 210,898
27,823,416 27,824,926 26,912,859 (912,067)
ExpendituresCurrent:
General government 5,446,531 5,365,725 4,889,229 476,496 Public safety 15,691,701 15,724,025 15,068,602 655,423 Public works 4,651,177 4,654,158 4,372,216 281,942 Community development - 3,540 37,521 (33,981) Parks and recreation 4,021,743 4,070,625 3,535,156 535,469
29,811,152 29,818,073 27,902,724 1,915,349
(1,987,736) (1,993,147) (989,865) 1,003,282
Other financing sources (uses)Transfers in 2,093,341 1,987,692 1,954,712 (32,980) Transfers out (1,319,925) (2,845,702) (1,372,204) 1,473,498
773,416 (858,010) 582,508 1,440,518
(1,214,320) (2,851,157) (407,357) 2,443,800
as restated 10,119,762 10,119,762 10,119,762 - $ 8,905,442 $ 7,268,605 $ 9,712,405 $ 2,443,800
Budgeted Amounts
Total revenues
Total expenditures
Excess of revenues over (under) expenditures
Net other financing sources (uses)
Net change in fund balances
Fund balances - beginning of year,
Fund balances - end of year

City of Lynwood Schedule of Revenues, Expenditures, and Changes in Fund Balance –
Budget and Actual Redevelopment Low/Mod Income Housing Area “A” Special Revenue Fund
Year ended June 30, 2009
81
Variance withFinal Budget
PositiveOriginal Final Actual (Negative)
RevenuesUse of money and property $ 40,000 $ 40,000 $ 32,487 $ (7,513)
40,000 40,000 32,487 (7,513)
ExpendituresCurrent:
General government 192,978 290,628 159,109 131,519 Community development 1,682,000 1,584,350 1,828,407 (244,057) Principal payment 45,900 45,900 48,241 (2,341) Interest and fiscal charges 137,195 137,195 128,138 9,057
2,058,073 2,058,073 2,163,895 (105,822)
(2,018,073) (2,018,073) (2,131,408) (113,335)
Other financing sourcesTransfers in 950,000 1,427,632 1,427,632
(1,068,073) (2,018,073) (703,776) 1,314,297
6,221,473 6,221,473 6,221,473 -
$ 5,153,400 $ 4,203,400 $ 5,517,697 $ 1,314,297
Budgeted Amounts
Total revenues
Total expenditures
Excess of revenues over (under) expenditures
Net change in fund balances
Fund balances - beginning of year
Fund balances - end of year

City of Lynwood Schedule of Revenues, Expenditures, and Changes in Fund Balance –
Budget and Actual HUD Home Program Special Revenue Fund
Year ended June 30, 2009
82
Variance withFinal Budget
PositiveOriginal Final Actual (Negative)
RevenuesIntergovernmental $ 1,063,721 $ 1,063,721 $ 1,460,778 $ 397,057
1,063,721 1,063,721 1,460,778 397,057
ExpendituresCurrent:
Community development 1,063,721 1,158,508 858,075 300,433 Capital outlay - 1,447,984 1,397,582 50,402
1,063,721 2,606,492 2,255,657 350,835
- (1,542,771) (794,879) 747,892
1,632,697 1,632,697 1,632,697 -
$ 1,632,697 $ 89,926 $ 837,818 $ 747,892
Budgeted Amounts
Total revenues
Total expenditures
Excess of revenues over (under) expenditures
Fund balances - beginning of year
Fund balances - end of year

City of Lynwood California Public Retirement System
Schedules of Funding Progress June 30, 2009
83
The schedules of funding progress presented below, present multiyear trend information about whether the actuarial value of the plan assets is increasing or decreasing over time relative to the actuarial accrued liability for benefits. Miscellaneous Plan
Unfunded Actuarial Unfunded ActuarialEntry Age Accrued Liability Accrued LiabilityActuarial Actuarial (Excess Assets) as Percentage of
Actuarial Accrued Asset [(A)-(B)] Funded Ratio Covered Covered PayrollValuation Date Liability (AAL) Value (UAAL) [(B)/(A)] Payroll {[(A)-(B)]/(E)}
(A) (B) (C) (D) (E) (F)June 30, 2006 $ 48,349,357 $ 41,514,494 $ 6,834,863 85.9% $ 7,977,729 85.7%June 30, 2007 51,227,954 49,682,719 1,545,235 97.0% 8,447,984 18.3%June 30, 2008 55,638,251 47,228,203 8,410,048 84.9% 8,925,184 94.2%
Safety Plan
Unfunded Actuarial Unfunded ActuarialEntry Age Accrued Liability Accrued LiabilityActuarial Actuarial (Excess Assets) as Percentage of
Actuarial Accrued Asset [(A)-(B)] Funded Ratio Covered Covered PayrollValuation Date Liability (AAL) Value (UAAL) [(B)/(A)] Payroll {[(A)-(B)]/(E)}
(A) (B) (C) (D) (E) (F)June 30, 2006 $ 389,558,550 $ 371,203,956 $ 18,354,594 95.3% $ - 0.0%June 30, 2007 391,672,319 377,230,242 14,442,077 96.3% - 0.0%June 30, 2008 399,268,718 390,402,716 8,866,002 97.8% - 0.0%

City of Lynwood Notes to Required Supplementary Information
June 30, 2009
84
NOTE 1 BUDGETARY CONTROL AND ACCOUNTING
The City’s basis of budgeting for its major fund groups (General Fund, Special Revenue Funds, Enterprise Funds, Internal Service Funds, and Capital Projects Funds) is modified accrual, which is the same as accounting principles generally accepted in the United States of America. Revenues are budgeted according to when they are both measurable and available. Revenues are considered to be available when they are collected within the current period, or soon enough thereafter to pay liabilities of the current period. The City considers property taxes, franchise taxes, licenses, and interest associated with the current fiscal year period susceptible to accrual if they are collected within 60 days of the end of the current fiscal year. Only the portion of special assessments receivable due within the current fiscal period is considered to be susceptible to accrual as revenue of the current period. All other revenue items are considered to be measurable and available only when cash is received. Expenditures are budgeted according to when the liability is incurred, regardless of the timing of related cash flow. The exceptions are debt service, compensated absences, claims and judgments, which are budgeted as expenditures according to when the payments are due. The following procedures establish the budgetary date reflected in the financial statements: The City Council approves each fiscal year's budget submitted by the City Manager prior to the beginning of the new fiscal year. Public hearings are conducted prior to its adoption by the City Council. Supplemental appropriations, where required during the period, are also approved by the City Council. Budget transfers that affect the total appropriations for any fund require City Council approval. Budget transfers within a budget code with no change in appropriation are approved by the City Manager only and do not require approval by the City Council. A budget code could be a program or a division of a department or a department. In most cases, expenditures may not legally exceed appropriations at the budget code level for the General fund, and fund level for Special Revenue, Capital Projects, and Debt Service Funds. Legally adopted budgets for all governmental funds are established on a basis consistent with accounting principles generally accepted in the United States of America. At fiscal year-end, all operating budget appropriations lapse with the exception of encumbered and continuing appropriations. During the fiscal year, several supplementary appropriations were necessary. Budgets are adopted for all general, special revenue, capital projects, and debt service funds except for the State of California CEC Grant special revenue fund, State Homeland Security Grant special revenue fund, Prop 40 Grant special revenue fund, Lynwood Information, Inc. special revenue fund.

SUPPLEMENTARY INFORMATION

City of Lynwood Schedule of Revenues, Expenditures and Changes in Fund Balance -
Budget and Actual Redevelopment Project Area “A” Capital Projects Fund
Year ended June 30, 2009
85
Variance withFinal Budget
Final PositiveBudget Actual (Negative)
RevenuesUse of money and property $ - $ 4,969 $ 4,969 Miscellaneous 14,200 11,800 (2,400)
14,200 16,769 2,569
ExpendituresCurrent:
General government 809,233 644,848 164,385 Community development 1,886,339 1,468,480 417,859
Capital outlay 6,000 1,811 4,189 Debt service:
Principal payment 80,000 12,203 67,797 Interest and fiscal charges - 67,651 (67,651)
2,781,572 2,194,993 586,579
(2,767,372) (2,178,224) 589,148
Other financing sources (uses)Transfers in 2,696,223 2,182,581 (513,642)
(71,149) 4,357 75,506
2,035,023 2,035,023 -
$ 1,963,874 $ 2,039,380 $ 75,506
Net change in fund balances
Fund balances - beginning of year
Fund balances - end of year
Total revenues
Total expenditures
Excess of revenues over (under) expenditures

City of Lynwood Schedule of Revenues, Expenditures and Changes in Fund Balance -
Budget and Actual Capital Improvement Projects Capital Projects Fund
Year ended June 30, 2009
86
Variance withFinal Budget
Final PositiveBudget Actual (Negative)
RevenuesIntergovernmental $ - $ 34,485 $ 34,485
- 34,485 34,485
ExpendituresCapital outlay 25,810,229 4,744,444 21,065,785
25,810,229 4,744,444 21,065,785
(25,810,229) (4,709,959) 21,100,270
Other financing sources Transfers in 22,860,574 4,532,781 (18,327,793)
(2,949,655) (177,178) 2,772,477
1,908,035 1,908,035 -
$ (1,041,620) $ 1,730,857 $ 2,772,477
Net change in fund balances
Fund balances - beginning of year
Fund balances - end of year
Total revenues
Total expenditures
Excess of revenues over (under) expenditures

City of Lynwood Schedule of Revenues, Expenditures and Changes in Fund Balance -
Budget and Actual 2002 HUD Section 108 Loan Capital Projects Fund
Year ended June 30, 2009
87
Variance withFinal Budget
Final PositiveBudget Actual (Negative)
RevenuesUse of money and property $ 214,699 $ 41,001 $ (173,698)
214,699 41,001 (173,698)
ExpendituresCurrent:
General government - - - - - -
214,699 41,001 (173,698)
6,367,120 6,367,120 -
$ 6,581,819 $ 6,408,121 $ (173,698)
Net change in fund balances
Fund balances - beginning of year
Fund balances - end of year
Total revenues
Total expenditures

THIS PAGE LEFT INTENTIONALLY BLANK

City of Lynwood Description of Nonmajor Governmental Funds
June 30, 2009
88
SPECIAL REVENUE FUNDS Special revenue funds are used to account for specific revenue (other than those for major capital projects) that are restricted legally to expenditures for particular purposes. Retirement Fund - This fund accounts for revenue received from property tax levy to cover retirement costs. Traffic Safety Fund - This fund accounts for Gas Tax transfers and Street sweeping fees, which are used to cover cost of street and traffic signal maintenance. Gas Tax Fund - This fund accounts for Gas Tax revenue received from the State of California to cover costs of street maintenance and improvements. AB2928/Traffic Congestion Relief Fund - This fund accounts for revenue received from the State of California to be used for street and highway pavement maintenance, rehabilitation, and reconstruction of necessary associated facilities such as drainage and traffic control devices. STP Fund - This fund accounts for revenue received from the Federal Government and administered by the State of California to assist the City in the cost of major street reconstruction projects. SB 821 Fund - This fund accounts for revenue received from the State of California for the development of bicycle and pedestrian facilities. Prop "A" & Prop "C" Funds - These funds are used to record the City's portion of sales tax dedicated to transportation programs. These programs include the Dial-ATaxi service for senior citizens and the handicapped, the trolley system, MTA bus fare discounts, and transit route projects/programs. Air Quality Improvement Fund - This fund accounts for AB 2766 revenues collected by the State of California on motor vehicle license registration fees. Revenues are used solely for the purpose of reducing air pollution from mobile sources. State COPS Program Fund - This fund accounts for the California statewide sales and use tax allocated by the State for local public safety services. Sheriff Drug Seizure Fund - This fund accounts for revenue received from the Lynwood Sheriff Department's drug confiscations. These monies are used to fund various law enforcement and public safety programs. Lighting Maintenance Fund - This is a special assessment fund whereby revenue is received from the County of Los Angeles for which an assessment has been charged against property owners' front footage. Monies in this fund are used to pay the cost of maintenance and operations of the citywide streetlights. Landscape Maintenance Fund - This is a special assessment fund whereby revenue is received from the County of Los Angeles for which an assessment has been charged against property owners' front footage. Monies in this fund are used to provide services such as tree maintenance, park maintenance, and capital improvements.

City of Lynwood Description of Nonmajor Governmental Funds
June 30, 2009
89
Impact Fees Fund - This fund accounts for the fees collected from new developments, which will be used to construct public infrastructure. Public Art Fund - This fund accounts for the fees collected from new developments in-lieu of the developer placing an art piece. Funds will be used for the placement of public art. Litter Abatement Fund - This fund accounts for Environmental Service Fees and Street Sweeping Charges for the City. This revenue funds a portion of the cost for the Right of Way Division and Stormwater Division. HUD 108 Loan Fund - This fund accounts for loan monies received from HUD to assist in funding the construction of a new community center and street improvements. Housing and Urban Development (HUD) Fund - This fund accounts for revenue received from the Federal Government's Community Development Block Grant Program. The City utilizes this grant to provide community programs such as housing rehabilitation loans, code enforcement, and capital improvement projects. Business Improvement District Fund - This fund accounts for special tax assessments imposed on businesses in the District to promote various activities within the District. Beverage Container Recycling Grant Fund- This fund accounts for grants received from the State of California for the purpose of implementing a Beverage Container Recycling Program. LA. County Park Maintenance Grant Fund - This fund accounts for grant funds allocated by the County of Los Angeles for park landscape and maintenance. Brownfield Grant – This fund accounts for grant funds allocated by the Federal Environmental Protection Assistance that provides funding for cleanup of sites. Used Oil Recycling Grant Fund - This fund accounts for grants received by the City of Lynwood from the California Integrated Waste Management Board to cover costs associated with local or regional used oil collection programs. Per Capita Grant 2000 Fund - This grant from the State of California can be utilized for the acquisition, development, improvement, rehabilitation, restoration, enhancement, and interpretation of local parks and recreational lands and facilities. TEA/ISTEA Grant Fund- This fund accounts for amounts due to the City for monies advanced to assist in transportation improvement projects. Safe School Route Grant Fund - This fund accounts for federal funds which will be used in installing lighted crosswalks in the vicinity of various schools. State of California CEC Grant – This fund accounts for the California Energy Commission grant award from the State of California.

City of Lynwood Description of Nonmajor Governmental Funds
June 30, 2009
90
Dupont/Lead Safety Grant Fund - This fund accounts for funds received to assist in the elimination of lead based paint and materials. State Homeland Security Grant Fund - This fund accounts for grants received from the State and Federal governments to provide assistance to the City in recognizing and preventing terrorist acts. Prop 40 Grant – This fund accounts for amounts received from the State to be used for parks. Prop 1B Fund - This fund accounts for grants received from the State government to make safety improvements and repair to state highways, upgrade freeways to reduce congestion, repair local streets and roads, upgrade highways along major transportation corridors, improve seismic safety of local bridges, expand public transit, help complete the state's network of car pool lanes and reduce air pollution. Justice Assistance Fund - This fund accounts for the financial assistance received from the U.S. Department of Justice to be used for supporting a broad range of activities to prevent and control crime and to improve the criminal justice system. State Transportation Partnership Fund - This fund accounts for amounts due from the State for money advanced by the City for transportation costs. Roberti-Zberg Harris Fund – This fund represents a grant from the State of California that can be used for the acquisition and/or development of high priority projects that satisfy the most urgent park and recreation needs specifically in the most heavily populated and most economically disadvantaged areas in Lynwood. Lynwood Information, Inc. Fund - This fund accounts for transactions of the public service corporation for the public access cable television and other media services for the City. Redevelopment Low/Mod Housing Alameda Area Fund - This fund accounts for the housing bond proceeds and the 20% set-aside of tax increment revenues used for low and moderate-income housing projects. DEBT SERVICE FUNDS Debt Service Funds are used to account for the accumulation of resources for and the payment of the City's long-term debt, principal and interest. City of Lynwood Fund - This fund accounts for a debt service reserve held by a trustee as well as payments on all interest and principal on outstanding debt incurred by the City of Lynwood. Tax Increment Area "A" Fund, Special Funds Area "A" Fund, and Alameda Area Fund - These funds account for tax increment revenues collected by the County of Los Angeles and remitted to the Agency. Monies in these funds are used to repay principal and interest on debt service and redevelopment capital project and administrative expenses. Public Financing Authority Fund - This fund accounts for the proceeds of debt issued by the City and Agency, debt service payments, and administration for long-term debt.
City of Lynwood Description of Nonmajor Governmental Funds
June 30, 2009
91
CAPITAL PROJECTS FUND Capital Projects Funds are used to account for resources used for the acquisition and construction of capital facilities by the City, except those financed by Proprietary Funds. Park Replacement Capital Projects Fund - This fund accounts for grants received by various governmental agencies to replace and rehabilitate John D. Ham Park Youth Community Center and Park. Capital Project Loan Fund - Accounts for loan proceeds which are used to rehabilitate City Hall facilities (i.e. City Hall, Bateman Hall Building, etc.). 2003 Lease Refunding Bonds Fund - Accounts for proceeds which are used to fund certain projects within the City (corporate yard land purchase and improvements to the City owned property). Redevelopment Project Area "A" Taxable Bond Proceeds Capital Projects Funds - This fund accounts for redevelopment project capital outlays in each of their respective project areas. Redeveloped Project Alameda Area Fund - Accounts for loans and advances from the City of Lynwood, bond proceeds available for project improvements, interest income on invested funds, and certain miscellaneous income. The monies expended in this fund are primarily used for acquisition, administrative expenses, construction, and improvements to the project areas.

92
AB 2928Traffic
Traffic CongestionRetirement Safety Gas Tax Relief
Cash and investments $ 727,987 $ - $ 149,977 $ 335,627 Receivables:Intergovernmental 113,232 - 94,347 - Accounts - - - 147,460 Interest - - 315 847 Notes and loans - - - - Due from other funds - - - - Restricted assets:Cash and investments - - - - Cash and investments with fiscal agents - - - - Land held for resale - - - -
$ 841,219 $ - $ 244,639 $ 483,934
LiabilitiesAccounts payable and accrued liabilities $ 176 $ 58,887 $ - $ - Due to other funds - 1,079,420 - - Deferred revenue - - - - Deposits - - - - Advances from other funds - - - -
176 1,138,307 - -
Fund balances (deficits)Reserved
Reserved for land held for resale - - - - Reserved for projects - - - - Reserved for housing - - - - Reserved for retirement 841,043 - - - Reserved for debt service - - - - Reserved for encumbrances - - - -
Unreserved reported in:Undesignated - (1,138,307) 244,639 483,934
841,043 (1,138,307) 244,639 483,934
$ 841,219 $ - $ 244,639 $ 483,934
Special Revenue Funds
ASSETS
Total assets
LIABILITIES AND FUND BALANCES
Total liabilities
Total fund balances (deficits)
Total liabilities and fund balances

City of Lynwood Combining Balance Sheet
Nonmajor Governmental Funds June 30, 2009
93
Air State SheriffSTP SB Quality COPS DrugGrant 821 Prop A Prop C Improvement Program Seizure
$ - $ - $ 1,661,248 $ 3,751,989 $ 95,749 $ 11,572 $ 53,171
110,671 - 56,870 310,000 - - - - - - - - - - - - 4,945 9,826 248 69 157 - - - - - - - - - - - - - -
- - - - - - - - - - - - - - - - - - - - -
$ 110,671 $ - $ 1,723,063 $ 4,071,815 $ 95,997 $ 11,641 $ 53,328
$ - $ - $ - $ - $ - $ 11,641 $ 18,778 116,551 27,776 - - - - - 110,671 - - - - - -
- - - - - - - - - - - - - -
227,222 27,776 - - - 11,641 18,778
- - - - - - - - - - - - - - - - - - - - - - - - - - - - - - - - - - - - - - - - - -
(116,551) (27,776) 1,723,063 4,071,815 95,997 - 34,550 (116,551) (27,776) 1,723,063 4,071,815 95,997 - 34,550
$ 110,671 $ - $ 1,723,063 $ 4,071,815 $ 95,997 $ 11,641 $ 53,328
(Continued)
Special Revenue Funds

94
Lighting Landscape Impact Public Maintenance Maintenance Fees Art
Cash and investments $ - $ - $ 610,637 $ 294,802 Receivables:Intergovernmental 33,684 - - - Accounts - 35,648 - - Interest - - 1,480 727 Notes and loans - - - - Due from other funds - - - - Restricted assets:Cash and investments - - - - Cash and investments with fiscal agents - - - - Land held for resale - - - -
$ 33,684 $ 35,648 $ 612,117 $ 295,529
LiabilitiesAccounts payable and accrued liabilities $ 59,305 $ 12,296 $ - $ 15,400 Due to other funds 762,485 786,587 - - Deferred revenue - - - - Deposits - - - - Advances from other funds - - - -
821,790 798,883 - 15,400
Fund balances (deficits)Reserved
Reserved for land held for resale - - - - Reserved for projects - - - - Reserved for housing - - - - Reserved for retirement - - - - Reserved for debt service - - - - Reserved for encumbrances - - - -
Unreserved reported in:Undesignated (788,106) (763,235) 612,117 280,129
(788,106) (763,235) 612,117 280,129
$ 33,684 $ 35,648 $ 612,117 $ 295,529
Special Revenue Funds
ASSETS
Total assets
LIABILITIES AND FUND BALANCES
Total liabilities
Total fund balances (deficits)
Total liabilities and fund balances
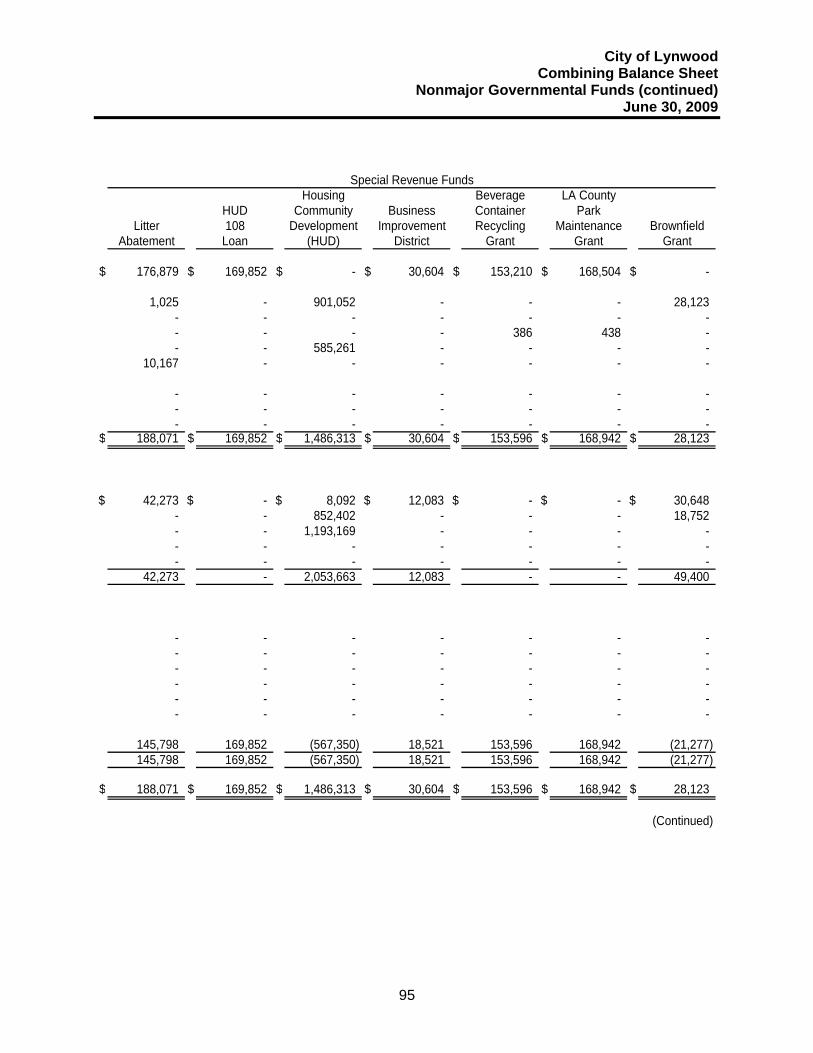
City of Lynwood Combining Balance Sheet
Nonmajor Governmental Funds (continued) June 30, 2009
95
Housing Beverage LA CountyHUD Community Business Container Park
Litter 108 Development Improvement Recycling Maintenance BrownfieldAbatement Loan (HUD) District Grant Grant Grant
$ 176,879 $ 169,852 $ - $ 30,604 $ 153,210 $ 168,504 $ -
1,025 - 901,052 - - - 28,123 - - - - - - - - - - - 386 438 - - - 585,261 - - - -
10,167 - - - - - -
- - - - - - - - - - - - - - - - - - - - -
$ 188,071 $ 169,852 $ 1,486,313 $ 30,604 $ 153,596 $ 168,942 $ 28,123
$ 42,273 $ - $ 8,092 $ 12,083 $ - $ - $ 30,648 - - 852,402 - - - 18,752 - - 1,193,169 - - - - - - - - - - - - - - - - - -
42,273 - 2,053,663 12,083 - - 49,400
- - - - - - - - - - - - - - - - - - - - - - - - - - - - - - - - - - - - - - - - - -
145,798 169,852 (567,350) 18,521 153,596 168,942 (21,277) 145,798 169,852 (567,350) 18,521 153,596 168,942 (21,277)
$ 188,071 $ 169,852 $ 1,486,313 $ 30,604 $ 153,596 $ 168,942 $ 28,123
(Continued)
Special Revenue Funds

96
Used Oil Per Capita TEA/ Safe Recycling Grant ISTEA School
Grant 2000 Grant Route
Cash and investments $ 27,046 $ - $ - $ - Receivables:Intergovernmental - - - 298,961 Accounts - - - - Interest 75 - - - Notes and loans - - - - Due from other funds - - - - Restricted assets:Cash and investments - - - - Cash and investments with fiscal agents - - - - Land held for resale - - - -
$ 27,121 $ - $ - $ 298,961
LiabilitiesAccounts payable and accrued liabilities $ 598 $ - $ - $ - Due to other funds - 61,554 280,392 298,961 Deferred revenue - - - 298,961 Deposits - - - - Advances from other funds - - - -
598 61,554 280,392 597,922
Fund balances (deficits)Reserved
Reserved for land held for resale - - - - Reserved for projects - - - - Reserved for housing - - - - Reserved for retirement - - - - Reserved for debt service - - - - Reserved for encumbrances - - - -
Unreserved reported in:Undesignated 26,523 (61,554) (280,392) (298,961)
26,523 (61,554) (280,392) (298,961)
$ 27,121 $ - $ - $ 298,961
Special Revenue Funds
ASSETS
Total assets
LIABILITIES AND FUND BALANCES
Total liabilities
Total fund balances (deficits)
Total liabilities and fund balances

City of Lynwood Combining Balance Sheet
Nonmajor Governmental Funds (continued) June 30, 2009
97
State of DuPont StateCalifornia Lead Homeland State
CEC Safety Security Prop 40 Justice TransportationGrant Grant Grant Grant Prop 1B Assistance Partnership
$ - $ 103,826 $ - $ - $ 947,315 $ - $ -
- - - - - 36,154 95,656 - - - - - - - - 261 - - 3,366 - - - - - - - - - - - - - - - -
- - - - - - - - - - - - - - - - - - - - -
$ - $ 104,087 $ - $ - $ 950,681 $ 36,154 $ 95,656
$ - $ - $ - $ - $ - $ 25,472 $ - 4,079 - - - - 66,680 95,656
- - - - - 36,154 95,656 - - - - - - - - - - - - - -
4,079 - - - - 128,306 191,312
- - - - - - - - - - - - - - - - - - - - - - - - - - - - - - - - - - - - - - - - - -
(4,079) 104,087 - - 950,681 (92,152) (95,656) (4,079) 104,087 - - 950,681 (92,152) (95,656)
$ - $ 104,087 $ - $ - $ 950,681 $ 36,154 $ 95,656
(Continued)
Special Revenue Funds

City of Lynwood Combining Balance Sheet
Nonmajor Governmental Funds (continued) June 30, 2009
98
RedevelopmentLynwood Low/Mod City
Roberti-Zberg Information, Income Housing ofHarris Inc. Alameda Area Lynwood
Cash and investments $ - $ - $ 1,436,614 $ - Receivables:
Intergovernmental - - - - Accounts - - - - Interest - - 686 - Notes and loans - - - -
Due from other funds - - 48,038 - Restricted assets:
Cash and investments - - - - Cash and investments with fiscal agents - - - 1,144,711
Land held for resale - - - - $ - $ - $ 1,485,338 $ 1,144,711
LiabilitiesAccounts payable and accrued liabilities $ - $ - $ 50,150 $ 87,369 Due to other funds - - - - Deferred revenue - - - - Deposits - - - - Advances from other funds - - - -
- - 50,150 87,369
Fund balances (deficits)Reserved
Reserved for land held for resale - - - - Reserved for projects - - - - Reserved for housing - - 1,435,188 - Reserved for retirement - - - - Reserved for debt service - - - 1,057,342 Reserved for encumbrances - - - -
Unreserved reported in:Undesignated - - - -
- - 1,435,188 1,057,342
$ - $ - $ 1,485,338 $ 1,144,711
ASSETS
Special Revenue Fund
Total assets
LIABILITIES AND FUND BALANCES
Total liabilities
Total fund balances (deficits)
Total liabilities and fund balances

City of Lynwood Combining Balance Sheet
Nonmajor Governmental Funds (continued) June 30, 2009
99
Tax Special TaxPublic Increment Funds Increment Capital 2003 Lease
Financing Area Area "A" Alameda Park Grant RevenueAuthority "A" Alameda Area Replacement Loan Refunding
$ - $ 2,381,668 $ - $ 362,908 $ - $ - $ -
- 196,786 - 240,188 - - - - - - 4,535 - - - - 3,336 - 792 - - - - - - 99,772 - - - - 217,954 - 14,876 - - -
- - - - - - - - - 1,139,158 - - 1,332,918 1,355,012 - - - - - - -
$ - $ 2,799,744 $ 1,139,158 $ 723,071 $ - $ 1,332,918 $ 1,355,012
$ - $ 248 $ - $ - $ - $ - $ - - 114,993 - 48,038 2,572,247 91,503 148,711 - - - 99,772 - - - - - - - - - - - 1,068,947 - 52,889 - - - - 1,184,188 - 200,699 2,572,247 91,503 148,711
- - - - - - - - - - - - 1,241,415 1,206,301 - - - - - - - - - - - - - - - 1,615,556 1,139,158 522,372 - - - - - - - - - -
- - - - (2,572,247) - - - 1,615,556 1,139,158 522,372 (2,572,247) 1,241,415 1,206,301
$ - $ 2,799,744 $ 1,139,158 $ 723,071 $ - $ 1,332,918 $ 1,355,012
(Continued)
Capital Projects Funds Debt Service Funds

City of Lynwood Combining Balance Sheet
Nonmajor Governmental Funds (continued) June 30, 2009
100
Redevleopment RedevelopmentProject Area "A" Project Total NonmajorTaxable Bond Alameda Governmental
Proceeds Area Funds
Cash and investments $ 44,130 $ 282,858 $ 13,978,173 Receivables:
Intergovernmental - - 2,516,749 Accounts - 103 187,746 Interest - - 27,954 Notes and loans - - 685,033
Due from other funds - - 291,035 Restricted assets:
Cash and investments - - - Cash and investments with fiscal agents - - 4,971,799
Land held for resale - - - $ 44,130 $ 282,961 $ 22,658,489
LiabilitiesAccounts payable and accrued liabilities $ - $ 281,745 $ 715,161 Due to other funds - - 7,426,787 Deferred revenue - - 1,834,383 Deposits - - - Advances from other funds - - 1,121,836
- 281,745 11,098,167
Fund balances (deficits)Reserved
Reserved for land held for resale - - - Reserved for projects - - 2,447,716 Reserved for housing - - 1,435,188 Reserved for retirement - - 841,043 Reserved for debt service - - 4,334,428 Reserved for encumbrances - - -
Unreserved reported in: - Undesignated 44,130 1,216 2,501,947
44,130 1,216 11,560,322
$ 44,130 $ 282,961 $ 22,658,489
Capital Projects Funds
ASSETS
Total assets
LIABILITIES AND FUND BALANCES
Total liabilities
Total fund balances (deficits)
Total liabilities and fund balances

THIS PAGE LEFT INTENTIONALLY BLANK
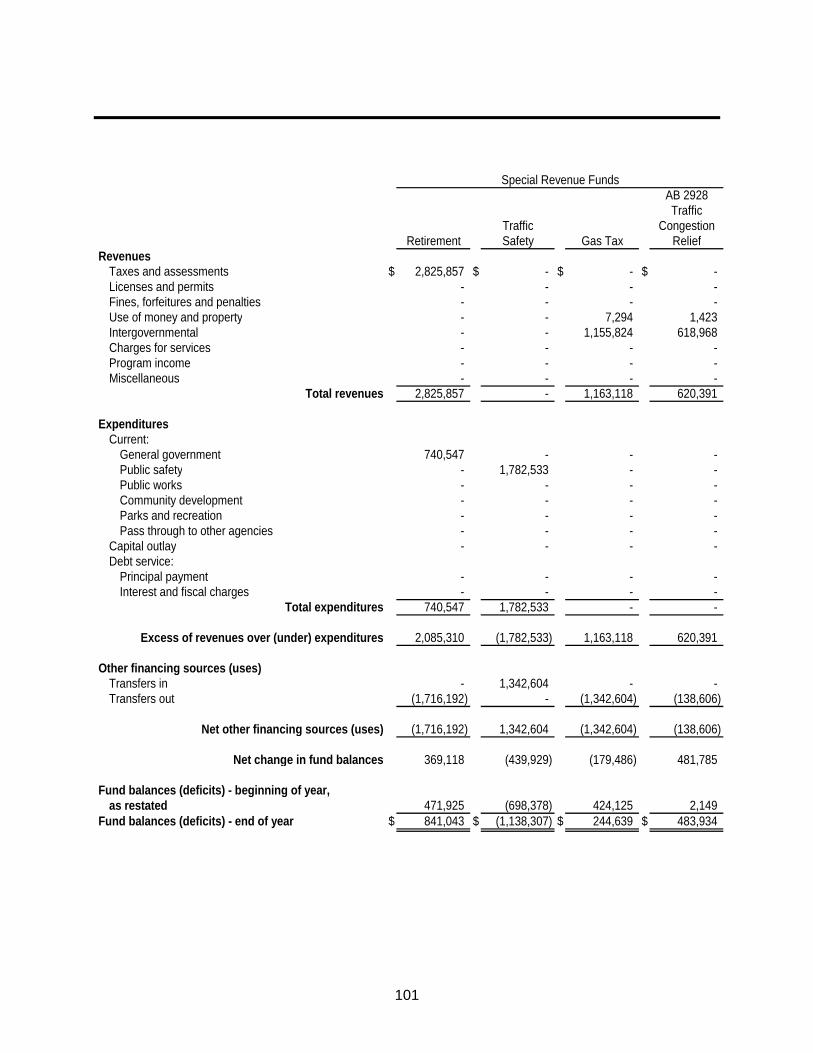
101
AB 2928Traffic
Traffic CongestionRetirement Safety Gas Tax Relief
RevenuesTaxes and assessments $ 2,825,857 $ - $ - $ - Licenses and permits - - - - Fines, forfeitures and penalties - - - - Use of money and property - - 7,294 1,423 Intergovernmental - - 1,155,824 618,968 Charges for services - - - - Program income - - - - Miscellaneous - - - -
2,825,857 - 1,163,118 620,391
ExpendituresCurrent:
General government 740,547 - - - Public safety - 1,782,533 - - Public works - - - - Community development - - - - Parks and recreation - - - - Pass through to other agencies - - - -
Capital outlay - - - - Debt service:
Principal payment - - - - Interest and fiscal charges - - - -
740,547 1,782,533 - -
2,085,310 (1,782,533) 1,163,118 620,391
Other financing sources (uses)Transfers in - 1,342,604 - - Transfers out (1,716,192) - (1,342,604) (138,606)
(1,716,192) 1,342,604 (1,342,604) (138,606)
369,118 (439,929) (179,486) 481,785
as restated 471,925 (698,378) 424,125 2,149 $ 841,043 $ (1,138,307) $ 244,639 $ 483,934
Total revenues
Special Revenue Funds
Total expenditures
Excess of revenues over (under) expenditures
Fund balances (deficits) - beginning of year,
Fund balances (deficits) - end of year
Net other financing sources (uses)
Net change in fund balances
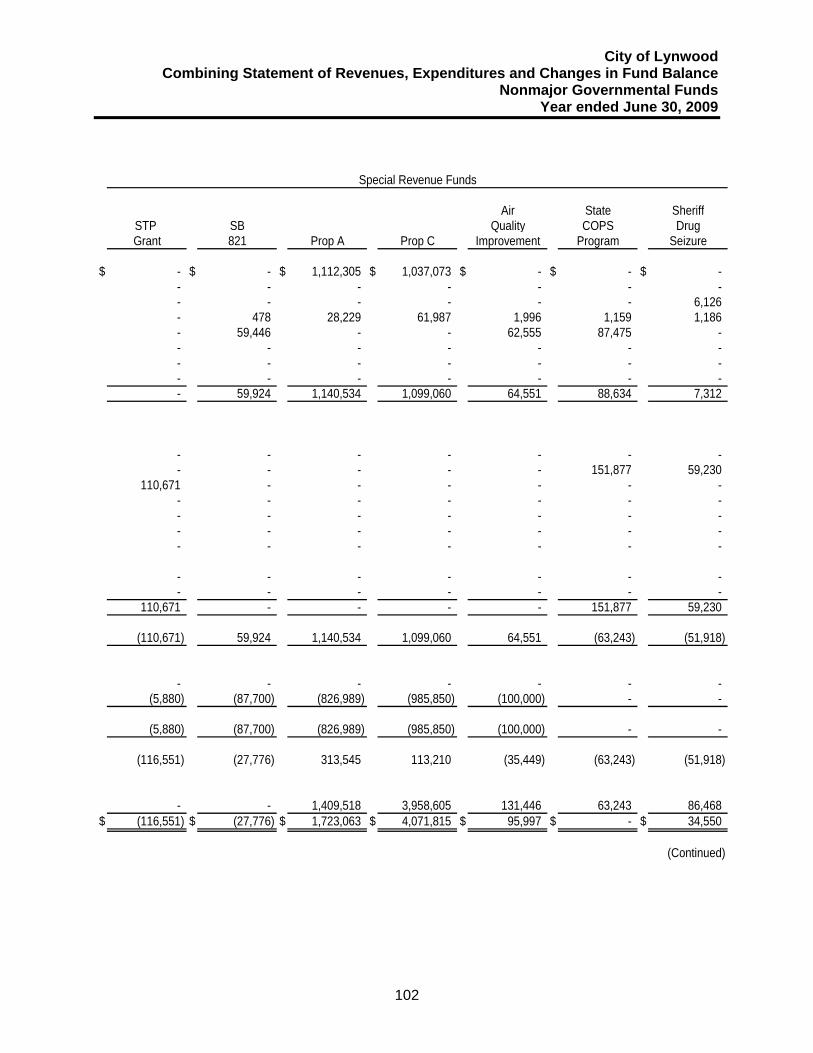
City of Lynwood Combining Statement of Revenues, Expenditures and Changes in Fund Balance
Nonmajor Governmental Funds Year ended June 30, 2009
102
Air State SheriffSTP SB Quality COPS DrugGrant 821 Prop A Prop C Improvement Program Seizure
$ - $ - $ 1,112,305 $ 1,037,073 $ - $ - $ - - - - - - - - - - - - - - 6,126 - 478 28,229 61,987 1,996 1,159 1,186 - 59,446 - - 62,555 87,475 - - - - - - - - - - - - - - - - - - - - - - - 59,924 1,140,534 1,099,060 64,551 88,634 7,312
- - - - - - - - - - - - 151,877 59,230
110,671 - - - - - - - - - - - - - - - - - - - - - - - - - - - - - - - - - -
- - - - - - - - - - - - - -
110,671 - - - - 151,877 59,230
(110,671) 59,924 1,140,534 1,099,060 64,551 (63,243) (51,918)
- - - - - - - (5,880) (87,700) (826,989) (985,850) (100,000) - -
(5,880) (87,700) (826,989) (985,850) (100,000) - -
(116,551) (27,776) 313,545 113,210 (35,449) (63,243) (51,918)
- - 1,409,518 3,958,605 131,446 63,243 86,468 $ (116,551) $ (27,776) $ 1,723,063 $ 4,071,815 $ 95,997 $ - $ 34,550
(Continued)
Special Revenue Funds

103
Lighting Landscape Impact PublicMaintenance Maintenance Fees Art
RevenuesTaxes and assessments $ 1,049,683 $ 1,085,669 $ 188,209 $ - Licenses and permits - - - - Fines, forfeitures and penalties - - - - Use of money and property - - 8,124 4,231 Intergovernmental - - - - Charges for services - - - 25,849 Program income - - - - Miscellaneous - - - -
1,049,683 1,085,669 196,333 30,080
ExpendituresCurrent:
General government - - - - Public safety - - - - Public works 976,840 1,108,681 - - Community development - - - - Parks and recreation - - - - Pass through to other agencies - - - -
Capital outlay - - - - Debt service:
Principal payment - - - - Interest and fiscal charges - - - -
976,840 1,108,681 - -
72,843 (23,012) 196,333 30,080
Other financing sources (uses)Transfers in - - - - Transfers out (221,127) (179,334) - -
(221,127) (179,334) - -
(148,284) (202,346) 196,333 30,080
as restated (639,822) (560,889) 415,784 250,049 $ (788,106) $ (763,235) $ 612,117 $ 280,129
Special Revenue Funds
Total revenues
Total expenditures
Excess of revenues over (under) expenditures
Net other financing sources (uses)
Net change in fund balances
Fund balances (deficits) - beginning of year,
Fund balances (deficits) - end of year

City of Lynwood Combining Statement of Revenues, Expenditures and Changes in Fund Balance
Nonmajor Governmental Funds (continued) Year ended June 30, 2009
104
Housing Beverage LA CountyHUD Community Business Container Park
Litter 108 Development Improvement Recycling Maintenance BrownfieldAbatement Loan (HUD) District Grant Grant Grant
$ - $ - $ - $ - $ - $ - $ - - - - 133,017 - - - - - - - - - - - 1,087 - - 2,331 3,256 - - - 1,371,540 - 19,195 - 39,402
366,777 - - - - - - - - - - - - - - - - - - - -
366,777 1,087 1,371,540 133,017 21,526 3,256 39,402
- - 337,142 - - - - - - - - - - -
227,139 - 366,896 - - - - - - 142,147 73,250 - - 60,679 - - - - - - - - - - - - - - - - - - - - -
- - 585,000 - - - - - - 481,006 - - - -
227,139 - 1,912,191 73,250 - - 60,679
139,638 1,087 (540,651) 59,767 21,526 3,256 (21,277)
- - - - - - - - - (26,699) - - (67,672) -
- - (26,699) - - (67,672) -
139,638 1,087 (567,350) 59,767 21,526 (64,416) (21,277)
6,160 168,765 - (41,246) 132,070 233,358 - $ 145,798 $ 169,852 $ (567,350) $ 18,521 $ 153,596 $ 168,942 $ (21,277)
(Continued)
Special Revenue Funds
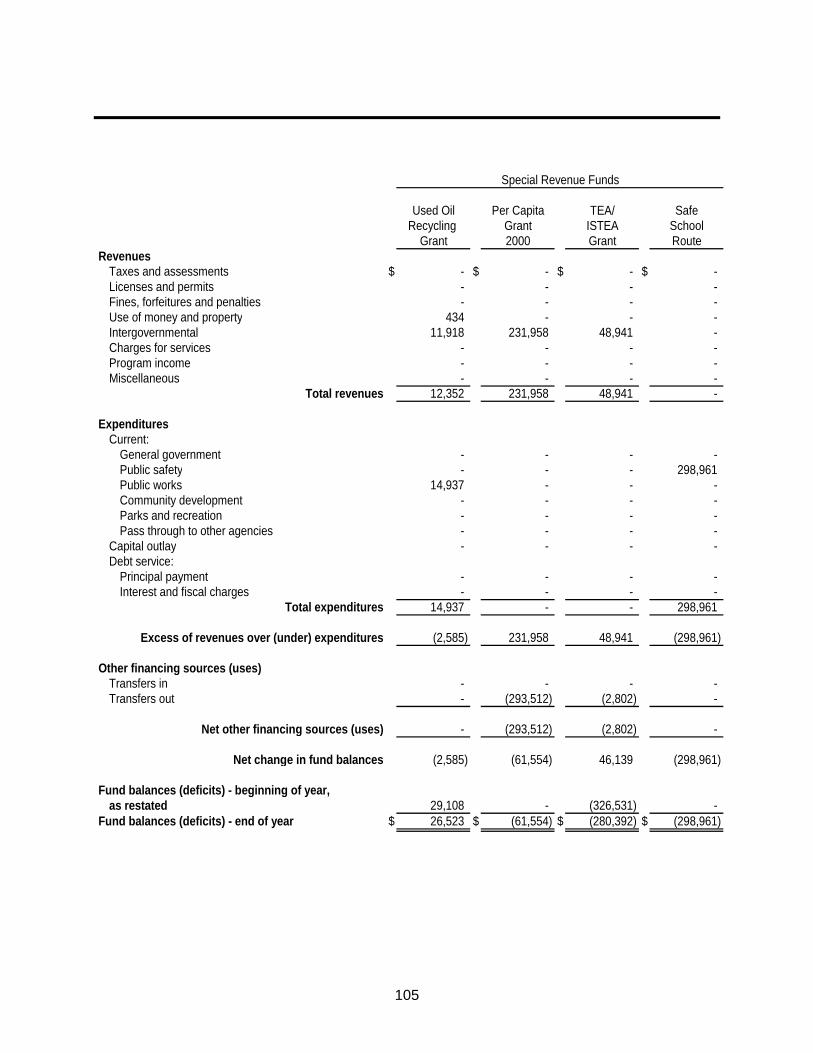
105
Used Oil Per Capita TEA/ SafeRecycling Grant ISTEA School
Grant 2000 Grant RouteRevenues
Taxes and assessments $ - $ - $ - $ - Licenses and permits - - - - Fines, forfeitures and penalties - - - - Use of money and property 434 - - - Intergovernmental 11,918 231,958 48,941 - Charges for services - - - - Program income - - - - Miscellaneous - - - -
12,352 231,958 48,941 -
ExpendituresCurrent:
General government - - - - Public safety - - - 298,961 Public works 14,937 - - - Community development - - - - Parks and recreation - - - - Pass through to other agencies - - - -
Capital outlay - - - - Debt service:
Principal payment - - - - Interest and fiscal charges - - - -
14,937 - - 298,961
(2,585) 231,958 48,941 (298,961)
Other financing sources (uses)Transfers in - - - - Transfers out - (293,512) (2,802) -
- (293,512) (2,802) -
(2,585) (61,554) 46,139 (298,961)
as restated 29,108 - (326,531) - $ 26,523 $ (61,554) $ (280,392) $ (298,961)
Special Revenue Funds
Total revenues
Total expenditures
Excess of revenues over (under) expenditures
Net other financing sources (uses)
Net change in fund balances
Fund balances (deficits) - beginning of year,
Fund balances (deficits) - end of year
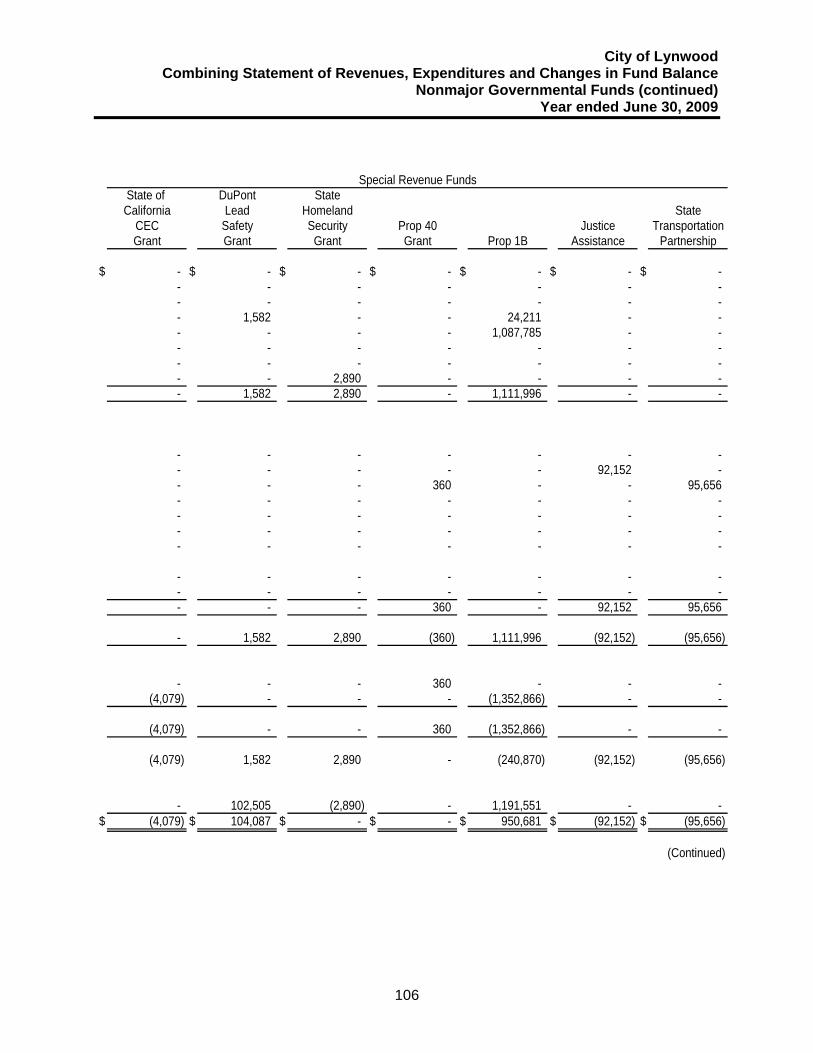
City of Lynwood Combining Statement of Revenues, Expenditures and Changes in Fund Balance
Nonmajor Governmental Funds (continued) Year ended June 30, 2009
106
State of DuPont StateCalifornia Lead Homeland State
CEC Safety Security Prop 40 Justice TransportationGrant Grant Grant Grant Prop 1B Assistance Partnership
$ - $ - $ - $ - $ - $ - $ - - - - - - - - - - - - - - - - 1,582 - - 24,211 - - - - - - 1,087,785 - - - - - - - - - - - - - - - - - - 2,890 - - - - - 1,582 2,890 - 1,111,996 - -
- - - - - - - - - - - - 92,152 - - - - 360 - - 95,656 - - - - - - - - - - - - - - - - - - - - - - - - - - - -
- - - - - - - - - - - - - - - - - 360 - 92,152 95,656
- 1,582 2,890 (360) 1,111,996 (92,152) (95,656)
- - - 360 - - - (4,079) - - - (1,352,866) - -
(4,079) - - 360 (1,352,866) - -
(4,079) 1,582 2,890 - (240,870) (92,152) (95,656)
- 102,505 (2,890) - 1,191,551 - - $ (4,079) $ 104,087 $ - $ - $ 950,681 $ (92,152) $ (95,656)
(Continued)
Special Revenue Funds
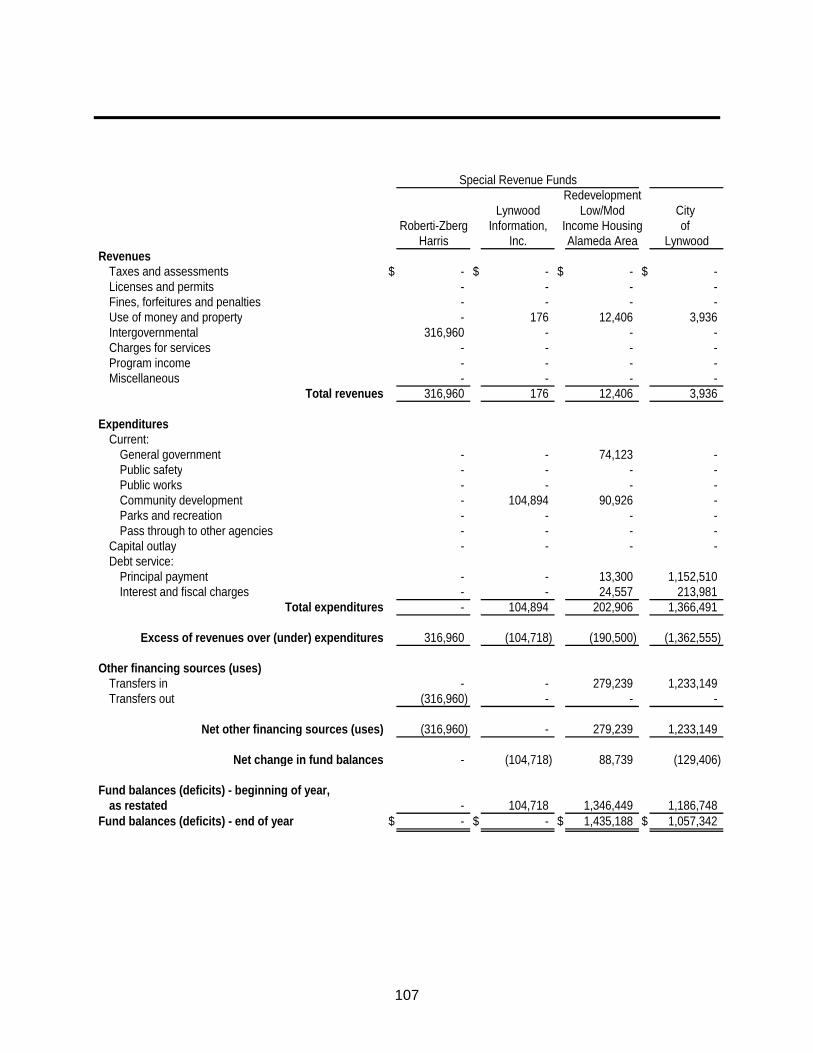
107
RedevelopmentLynwood Low/Mod City
Roberti-Zberg Information, Income Housing of Harris Inc. Alameda Area Lynwood
RevenuesTaxes and assessments $ - $ - $ - $ - Licenses and permits - - - - Fines, forfeitures and penalties - - - - Use of money and property - 176 12,406 3,936 Intergovernmental 316,960 - - - Charges for services - - - - Program income - - - - Miscellaneous - - - -
316,960 176 12,406 3,936
ExpendituresCurrent:
General government - - 74,123 - Public safety - - - - Public works - - - - Community development - 104,894 90,926 - Parks and recreation - - - - Pass through to other agencies - - - -
Capital outlay - - - - Debt service:
Principal payment - - 13,300 1,152,510 Interest and fiscal charges - - 24,557 213,981
- 104,894 202,906 1,366,491
316,960 (104,718) (190,500) (1,362,555)
Other financing sources (uses)Transfers in - - 279,239 1,233,149 Transfers out (316,960) - - -
(316,960) - 279,239 1,233,149
- (104,718) 88,739 (129,406)
as restated - 104,718 1,346,449 1,186,748 $ - $ - $ 1,435,188 $ 1,057,342
Total revenues
Net change in fund balances
Total expenditures
Excess of revenues over (under) expenditures
Special Revenue Funds
Fund balances (deficits) - beginning of year,
Fund balances (deficits) - end of year
Net other financing sources (uses)
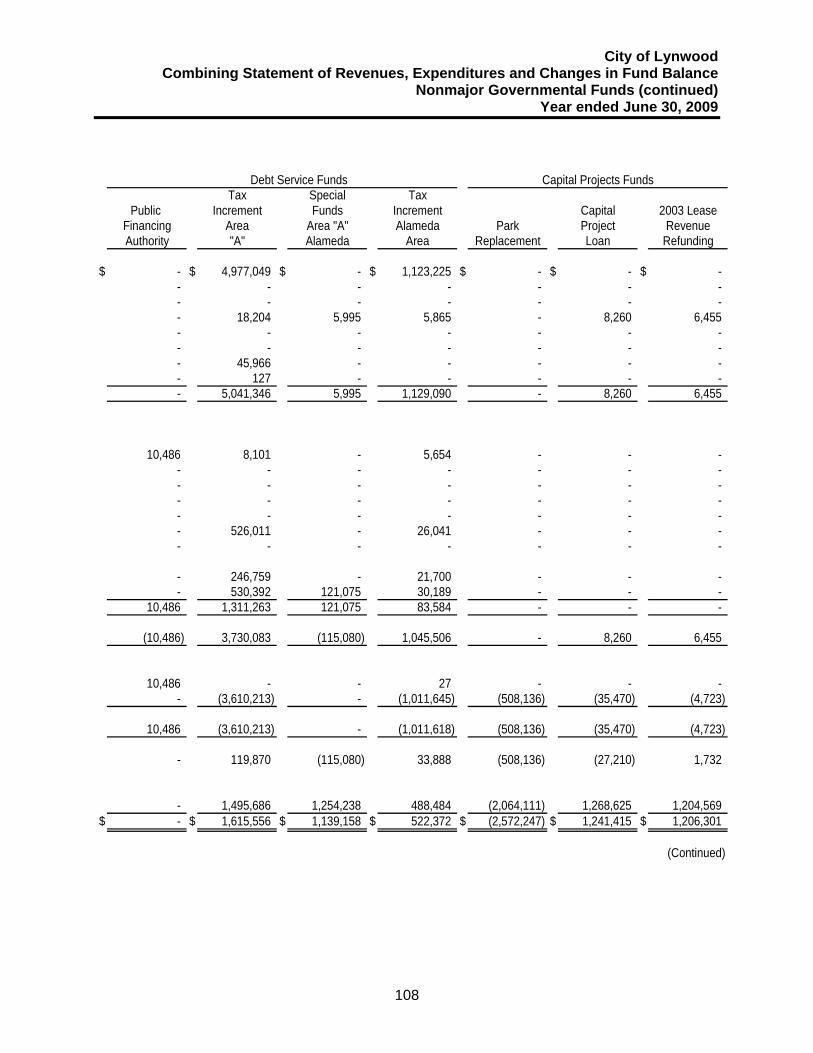
City of Lynwood Combining Statement of Revenues, Expenditures and Changes in Fund Balance
Nonmajor Governmental Funds (continued) Year ended June 30, 2009
108
Tax Special TaxPublic Increment Funds Increment Capital 2003 Lease
Financing Area Area "A" Alameda Park Project RevenueAuthority "A" Alameda Area Replacement Loan Refunding
$ - $ 4,977,049 $ - $ 1,123,225 $ - $ - $ - - - - - - - - - - - - - - - - 18,204 5,995 5,865 - 8,260 6,455 - - - - - - - - - - - - - - - 45,966 - - - - - - 127 - - - - - - 5,041,346 5,995 1,129,090 - 8,260 6,455
10,486 8,101 - 5,654 - - - - - - - - - - - - - - - - - - - - - - - - - - - - - - - - 526,011 - 26,041 - - - - - - - - - -
- 246,759 - 21,700 - - - - 530,392 121,075 30,189 - - -
10,486 1,311,263 121,075 83,584 - - -
(10,486) 3,730,083 (115,080) 1,045,506 - 8,260 6,455
10,486 - - 27 - - - - (3,610,213) - (1,011,645) (508,136) (35,470) (4,723)
10,486 (3,610,213) - (1,011,618) (508,136) (35,470) (4,723)
- 119,870 (115,080) 33,888 (508,136) (27,210) 1,732
- 1,495,686 1,254,238 488,484 (2,064,111) 1,268,625 1,204,569 $ - $ 1,615,556 $ 1,139,158 $ 522,372 $ (2,572,247) $ 1,241,415 $ 1,206,301
(Continued)
Debt Service Funds Capital Projects Funds
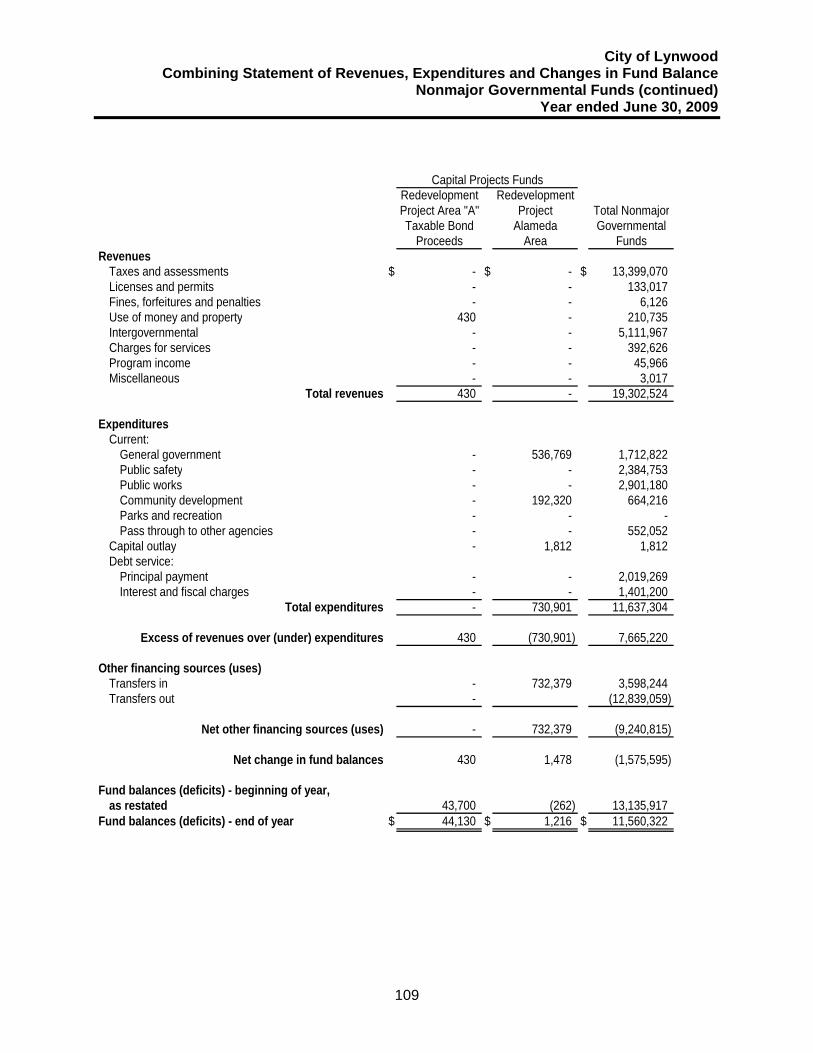
City of Lynwood Combining Statement of Revenues, Expenditures and Changes in Fund Balance
Nonmajor Governmental Funds (continued) Year ended June 30, 2009
109
Redevelopment RedevelopmentProject Area "A" Project Total NonmajorTaxable Bond Alameda Governmental
Proceeds Area FundsRevenues
Taxes and assessments $ - $ - $ 13,399,070 Licenses and permits - - 133,017 Fines, forfeitures and penalties - - 6,126 Use of money and property 430 - 210,735 Intergovernmental - - 5,111,967 Charges for services - - 392,626 Program income - - 45,966 Miscellaneous - - 3,017
430 - 19,302,524
ExpendituresCurrent:
General government - 536,769 1,712,822 Public safety - - 2,384,753 Public works - - 2,901,180 Community development - 192,320 664,216 Parks and recreation - - - Pass through to other agencies - - 552,052
Capital outlay - 1,812 1,812 Debt service:
Principal payment - - 2,019,269 Interest and fiscal charges - - 1,401,200
- 730,901 11,637,304
430 (730,901) 7,665,220
Other financing sources (uses)Transfers in - 732,379 3,598,244 Transfers out - (12,839,059)
- 732,379 (9,240,815)
430 1,478 (1,575,595)
as restated 43,700 (262) 13,135,917 $ 44,130 $ 1,216 $ 11,560,322
Total revenues
Capital Projects Funds
Total expenditures
Excess of revenues over (under) expenditures
Fund balances (deficits) - beginning of year,
Fund balances (deficits) - end of year
Net other financing sources (uses)
Net change in fund balances

THIS PAGE LEFT INTENTIONALLY BLANK

City of Lynwood Schedule of Revenues, Expenditures and Changes in Fund Balance –
Budget and Actual Retirement Special Revenue Fund
Year ended June 30, 2009
110
Variance
Final PositiveBudget Actual (Negative)
RevenuesTaxes and assessments $ 2,521,201 $ 2,825,857 $ 304,656
2,521,201 2,825,857 304,656
ExpendituresCurrent:
General government 740,547 740,547 - 740,547 740,547 -
1,780,654 2,085,310 304,656
Other financing usesTransfers out (1,716,192) (1,716,192) -
64,462 369,118 304,656
471,925 471,925 -
$ 536,387 $ 841,043 $ 304,656
Net change in fund balances
Fund balances - beginning of year
Fund balances - end of year
Total revenues
Total expenditures
Excess of revenues over expenditures
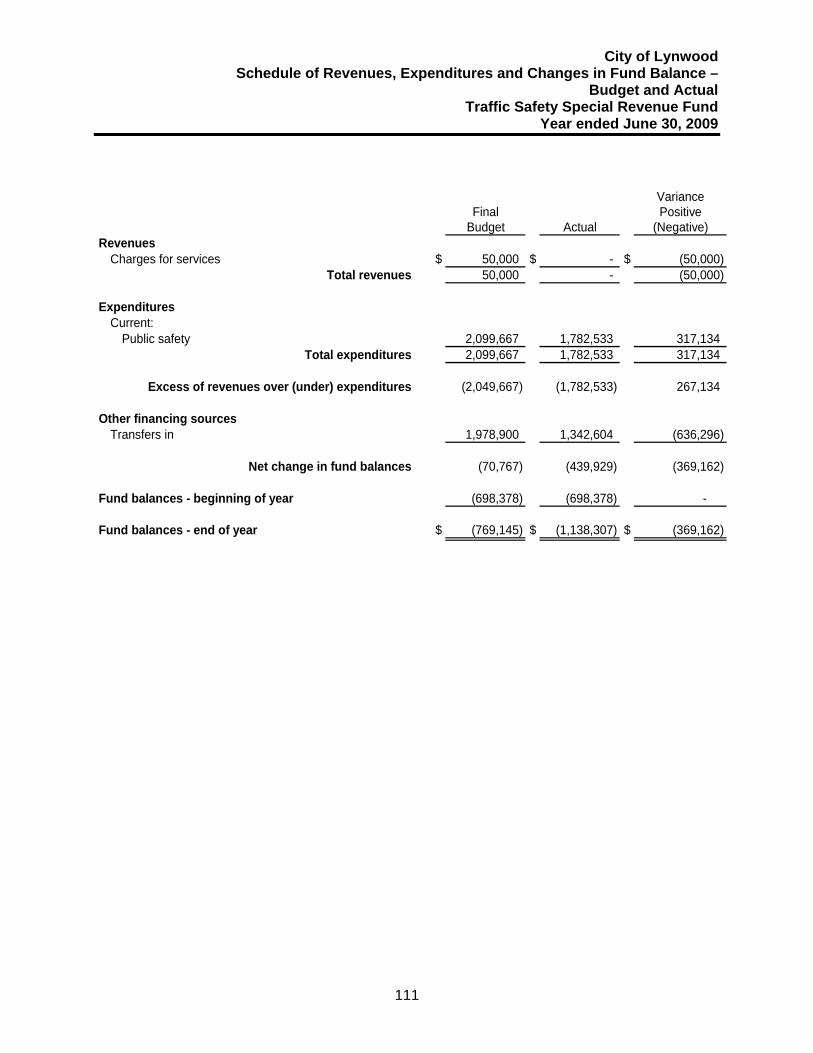
City of Lynwood Schedule of Revenues, Expenditures and Changes in Fund Balance –
Budget and Actual Traffic Safety Special Revenue Fund
Year ended June 30, 2009
111
Variance
Final PositiveBudget Actual (Negative)
RevenuesCharges for services $ 50,000 $ - $ (50,000)
50,000 - (50,000)
ExpendituresCurrent:
Public safety 2,099,667 1,782,533 317,134 2,099,667 1,782,533 317,134
(2,049,667) (1,782,533) 267,134
Other financing sourcesTransfers in 1,978,900 1,342,604 (636,296)
(70,767) (439,929) (369,162)
(698,378) (698,378) -
$ (769,145) $ (1,138,307) $ (369,162)
Net change in fund balances
Fund balances - beginning of year
Fund balances - end of year
Total revenues
Total expenditures
Excess of revenues over (under) expenditures

City of Lynwood Schedule of Revenues, Expenditures and Changes in Fund Balance –
Budget and Actual Gas Tax Special Revenue Fund
Year ended June 30, 2009
112
Variance
Final PositiveBudget Actual (Negative)
RevenuesUse of money and property $ 1,000 $ 7,294 $ 6,294 Intergovernmental 1,505,600 1,155,824 (349,776)
1,506,600 1,163,118 (343,482)
ExpendituresCurrent:
General government - - - - - -
1,506,600 1,163,118 (343,482)
Other financing usesTransfers out (1,506,600) (1,342,604) 163,996
- (179,486) (179,486)
424,125 424,125 -
$ 424,125 $ 244,639 $ (179,486)
Net change in fund balances
Fund balances - beginning of year
Fund balances - end of year
Total revenues
Total expenditures
Excess of revenues over (under) expenditures
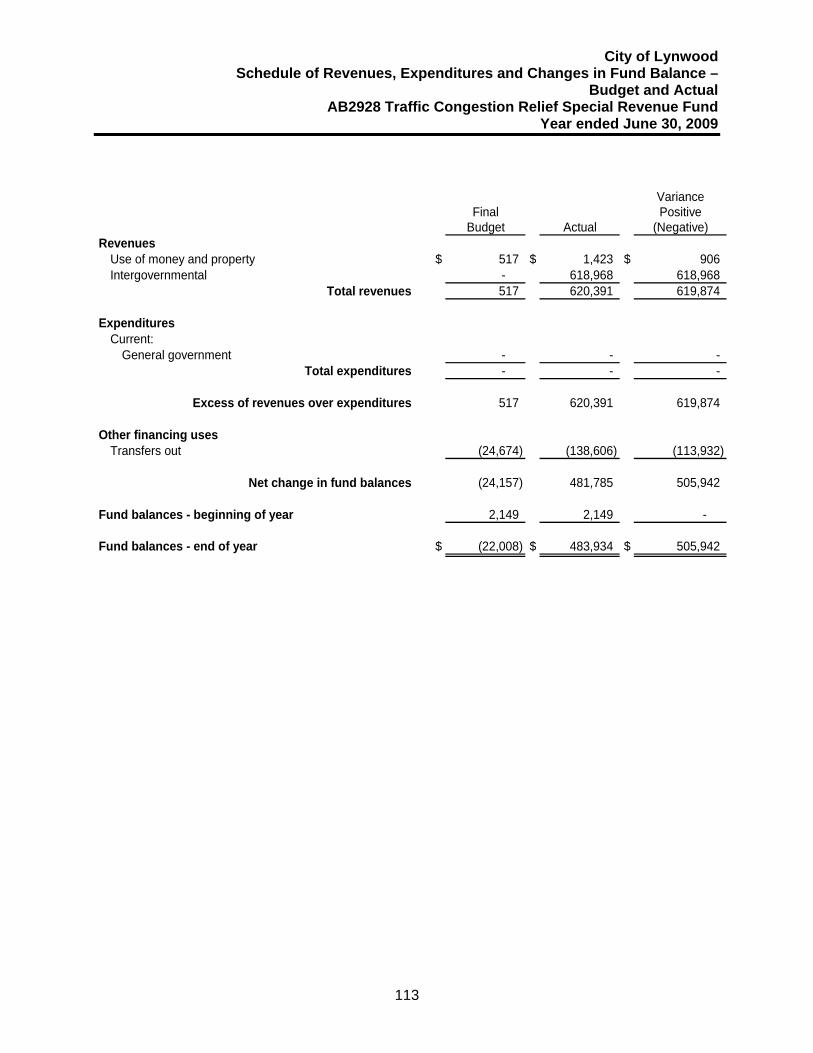
City of Lynwood Schedule of Revenues, Expenditures and Changes in Fund Balance –
Budget and Actual AB2928 Traffic Congestion Relief Special Revenue Fund
Year ended June 30, 2009
113
Variance
Final PositiveBudget Actual (Negative)
RevenuesUse of money and property $ 517 $ 1,423 $ 906 Intergovernmental - 618,968 618,968
517 620,391 619,874
ExpendituresCurrent:
General government - - - - - -
517 620,391 619,874
Other financing usesTransfers out (24,674) (138,606) (113,932)
(24,157) 481,785 505,942
2,149 2,149 -
$ (22,008) $ 483,934 $ 505,942
Net change in fund balances
Fund balances - beginning of year
Fund balances - end of year
Total revenues
Total expenditures
Excess of revenues over expenditures

City of Lynwood Schedule of Revenues, Expenditures and Changes in Fund Balance –
Budget and Actual STP Grant Special Revenue Fund
Year ended June 30, 2009
114
Variance
Final PositiveBudget Actual (Negative)
RevenuesIntergovernmental $ 6,779 $ - $ (6,779)
6,779 - (6,779)
ExpendituresCurrent:
Public works - 110,671 (110,671) - 110,671 (110,671)
6,779 (110,671) (117,450)
Other financing sources (uses)Transfers out (1,000,000) (5,880) 994,120
(993,221) (116,551) 876,670
- - -
$ (993,221) $ (116,551) $ 876,670
Net change in fund balances
Fund balances - beginning of year
Fund balances - end of year
Total revenues
Total expenditures
Excess of revenues over (under) expenditures

City of Lynwood Schedule of Revenues, Expenditures and Changes in Fund Balance –
Budget and Actual SB 821 Special Revenue Fund
Year ended June 30, 2009
115
Variance
Final PositiveBudget Actual (Negative)
RevenuesUse of money and property $ - $ 478 $ 478 Intergovernmental 30,000 59,446 29,446
30,000 59,924 29,924
ExpendituresCurrent:
General government - - - - - -
30,000 59,924 29,924
Other financing sources (uses)Transfers out (35,392) (87,700) (52,308)
(5,392) (27,776) (22,384)
- - -
$ (5,392) $ (27,776) $ (22,384)
Net change in fund balances
Fund balances - beginning of year
Fund balances - end of year
Total revenues
Total expenditures
Excess of revenues over (under) expenditures

City of Lynwood Schedule of Revenues, Expenditures and Changes in Fund Balance –
Budget and Actual Prop A Special Revenue Fund
Year ended June 30, 2009
116
Variance
Final PositiveBudget Actual (Negative)
RevenuesTaxes and assessments $ 1,034,045 $ 1,112,305 $ 78,260 Use of money and property 2,400 28,229 25,829
1,036,445 1,140,534 104,089
ExpendituresCurrent:
General government - - - - - -
1,036,445 1,140,534 104,089
Other financing sources (uses)Transfers out (1,239,739) (826,989) 412,750
(203,294) 313,545 516,839
1,409,518 1,409,518 -
$ 1,206,224 $ 1,723,063 $ 516,839
Net change in fund balances
Fund balances - beginning of year
Fund balances - end of year
Total revenues
Total expenditures
Excess of revenues over (under) expenditures

City of Lynwood Schedule of Revenues, Expenditures and Changes in Fund Balance –
Budget and Actual Prop C Special Revenue Fund
Year ended June 30, 2009
117
Variance
Final PositiveBudget Actual (Negative)
RevenuesTaxes and assessments $ 1,055,000 $ 1,037,073 $ (17,927) Use of money and property 10,000 61,987 51,987
1,065,000 1,099,060 34,060
ExpendituresCurrent:
General government - - - - - -
1,065,000 1,099,060 34,060
Other financing sources (uses)Transfers out (4,534,731) (985,850) 3,548,881
(3,469,731) 113,210 3,582,941
3,958,605 3,958,605 -
$ 488,874 $ 4,071,815 $ 3,582,941
Net change in fund balances
Fund balances - beginning of year
Fund balances - end of year
Total revenues
Total expenditures
Excess of revenues over (under) expenditures

City of Lynwood Schedule of Revenues, Expenditures and Changes in Fund Balance –
Budget and Actual Air Quality Improvement Special Revenue Fund
Year ended June 30, 2009
118
Variance
Final PositiveBudget Actual (Negative)
RevenuesUse of money and property $ 1,000 $ 1,996 $ 996 Intergovernmental 80,000 62,555 (17,445)
81,000 64,551 (16,449)
ExpendituresCurrent:
General government - - - - - -
81,000 64,551 (16,449)
Other financing sources (uses)Transfers out (100,000) (100,000) -
(19,000) (35,449) (16,449)
131,446 131,446 -
$ 112,446 $ 95,997 $ (16,449)
Net change in fund balances
Fund balances - beginning of year
Fund balances - end of year
Total revenues
Total expenditures
Excess of revenues over (under) expenditures

City of Lynwood Schedule of Revenues, Expenditures and Changes in Fund Balance –
Budget and Actual State COPS Program Special Revenue Fund
Year ended June 30, 2009
119
Variance
Final PositiveBudget Actual (Negative)
RevenuesUse of money and property $ - $ 1,159 $ 1,159 Intergovernmental 105,000 87,475 (17,525)
105,000 88,634 (16,366)
ExpendituresCurrent:
Public safety 183,618 151,877 31,741 183,618 151,877 31,741
(78,618) (63,243) 15,375
63,243 63,243 -
$ (15,375) $ - $ 15,375
Fund balances - beginning of year
Fund balances - end of year
Total revenues
Total expenditures
Excess of revenues over (under) expenditures

City of Lynwood Schedule of Revenues, Expenditures and Changes in Fund Balance –
Budget and Actual Sheriff Drug Seizure Special Revenue Fund
Year ended June 30, 2009
120
Variance
Final PositiveBudget Actual (Negative)
RevenuesFines, forfeitures and penalties $ 800 $ 6,126 $ 5,326 Use of money and property 10,000 1,186 (8,814)
10,800 7,312 (3,488)
ExpendituresCurrent:
Public safety 75,410 59,230 16,180 75,410 59,230 16,180
(64,610) (51,918) 12,692
Other financing sources (uses)Transfers out - - -
(64,610) (51,918) 12,692
86,468 86,468 -
$ 21,858 $ 34,550 $ 12,692
Net change in fund balances
Fund balances - beginning of year
Fund balances - end of year
Total revenues
Total expenditures
Excess of revenues over (under) expenditures
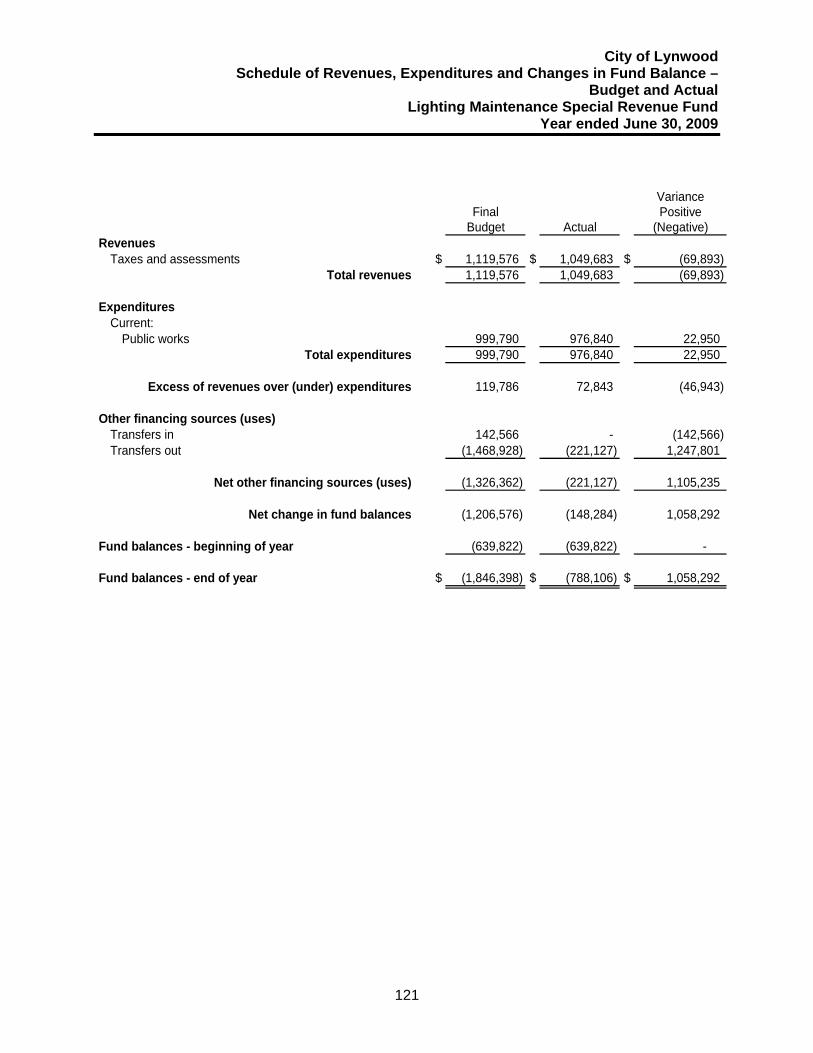
City of Lynwood Schedule of Revenues, Expenditures and Changes in Fund Balance –
Budget and Actual Lighting Maintenance Special Revenue Fund
Year ended June 30, 2009
121
Variance
Final PositiveBudget Actual (Negative)
RevenuesTaxes and assessments $ 1,119,576 $ 1,049,683 $ (69,893)
1,119,576 1,049,683 (69,893)
ExpendituresCurrent:
Public works 999,790 976,840 22,950 999,790 976,840 22,950
119,786 72,843 (46,943)
Other financing sources (uses)Transfers in 142,566 - (142,566) Transfers out (1,468,928) (221,127) 1,247,801
(1,326,362) (221,127) 1,105,235
(1,206,576) (148,284) 1,058,292
(639,822) (639,822) -
$ (1,846,398) $ (788,106) $ 1,058,292
Net change in fund balances
Fund balances - beginning of year
Fund balances - end of year
Total revenues
Total expenditures
Excess of revenues over (under) expenditures
Net other financing sources (uses)

City of Lynwood Schedule of Revenues, Expenditures and Changes in Fund Balance –
Budget and Actual Landscape Maintenance Special Revenue Fund
Year ended June 30, 2009
122
Variance
Final PositiveBudget Actual (Negative)
RevenuesTaxes and assessments $ 1,162,597 $ 1,085,669 $ (76,928)
1,162,597 1,085,669 (76,928)
ExpendituresCurrent:
Public works 1,448,772 1,108,681 340,091 1,448,772 1,108,681 340,091
(286,175) (23,012) 263,163
Other financing sources (uses)Transfers in 524,658 - (524,658) Transfers out (238,450) (179,334) 59,116
286,208 (179,334) (465,542)
33 (202,346) (202,379)
(560,889) (560,889) -
$ (560,856) $ (763,235) $ (202,379)
Net change in fund balances
Fund balances - beginning of year
Fund balances - end of year
Total revenues
Total expenditures
Excess of revenues over (under) expenditures
Net other financing sources (uses)

City of Lynwood Schedule of Revenues, Expenditures and Changes in Fund Balance –
Budget and Actual Impact Fees Special Revenue Fund
Year ended June 30, 2009
123
Variance
Final PositiveBudget Actual (Negative)
RevenuesTaxes and assessments $ 157,000 $ 188,209 $ 31,209 Use of money and property 232 8,124 7,892
157,232 196,333 39,101
ExpendituresCurrent:
General government - - - - - -
157,232 196,333 39,101
415,784 415,784 -
$ 573,016 $ 612,117 $ 39,101
Fund balances - beginning of year
Fund balances - end of year
Total revenues
Total expenditures
Excess of revenues over (under) expenditures

City of Lynwood Schedule of Revenues, Expenditures and Changes in Fund Balance –
Budget and Actual Public Art Special Revenue Fund
Year ended June 30, 2009
124
Variance
Final PositiveBudget Actual (Negative)
RevenuesUse of money and property $ - $ 4,231 $ 4,231 Charges for services 81,400 25,849 (55,551)
81,400 30,080 (51,320)
ExpendituresCurrent:
General government - - - - - -
81,400 30,080 (51,320)
250,049 250,049 -
$ 331,449 $ 280,129 $ (51,320)
Fund balances - beginning of year
Fund balances - end of year
Total revenues
Total expenditures
Excess of revenues over (under) expenditures

City of Lynwood Schedule of Revenues, Expenditures and Changes in Fund Balance –
Budget and Actual Litter Abatement Special Revenue Fund
Year ended June 30, 2009
125
Variance
Final PositiveBudget Actual (Negative)
RevenuesCharges for services $ 268,500 $ 366,777 $ 98,277
268,500 366,777 98,277
ExpendituresCurrent:
Public works 262,567 227,139 35,428 262,567 227,139 35,428
5,933 139,638 133,705
6,160 6,160 -
$ 12,093 $ 145,798 $ 133,705
Fund balances - beginning of year
Fund balances - end of year
Total revenues
Total expenditures
Excess of revenues over (under) expenditures
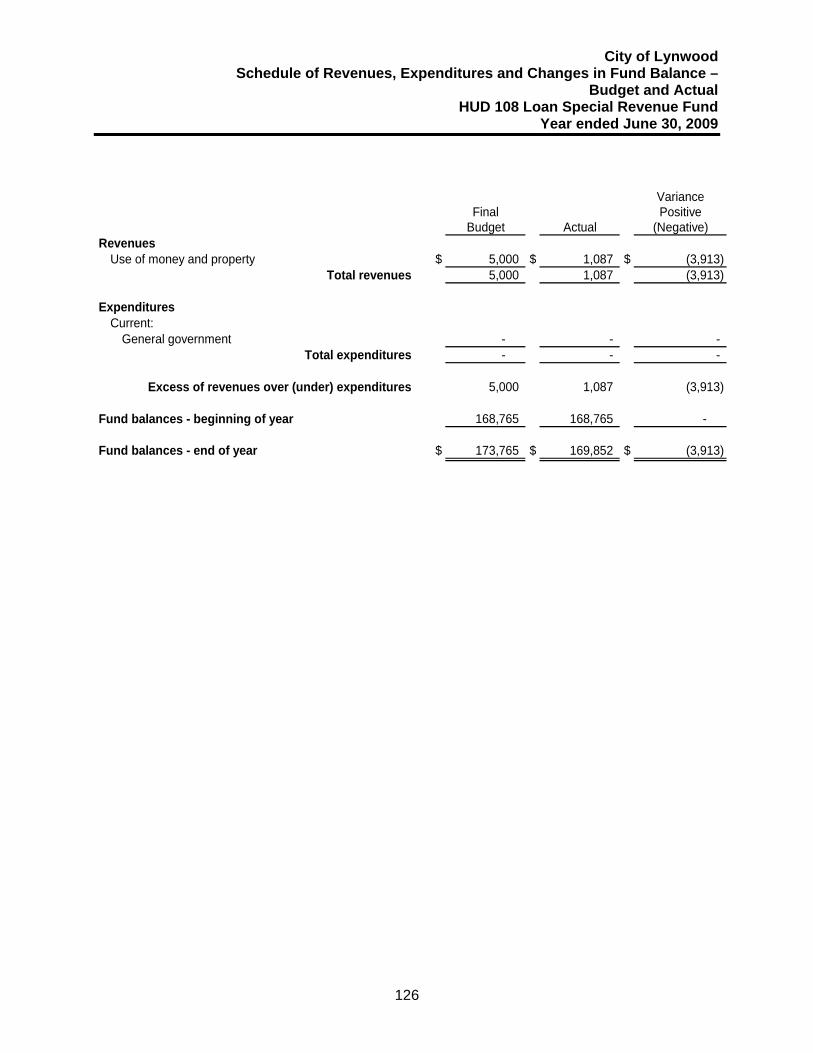
City of Lynwood Schedule of Revenues, Expenditures and Changes in Fund Balance –
Budget and Actual HUD 108 Loan Special Revenue Fund
Year ended June 30, 2009
126
Variance
Final PositiveBudget Actual (Negative)
RevenuesUse of money and property $ 5,000 $ 1,087 $ (3,913)
5,000 1,087 (3,913)
ExpendituresCurrent:
General government - - - - - -
5,000 1,087 (3,913)
168,765 168,765 -
$ 173,765 $ 169,852 $ (3,913)
Fund balances - beginning of year
Fund balances - end of year
Total revenues
Total expenditures
Excess of revenues over (under) expenditures

City of Lynwood Schedule of Revenues, Expenditures and Changes in Fund Balance –
Budget and Actual Housing Community Development (HUD) Special Revenue Fund
Year ended June 30, 2009
127
Variance
Final PositiveBudget Actual (Negative)
RevenuesIntergovernmental $ 2,428,640 $ 1,371,540 $ (1,057,100)
2,428,640 1,371,540 (1,057,100)
ExpendituresCurrent:
General government 408,968 337,142 71,826 Public works 520,000 366,896 153,104 Community development 142,300 142,147 153
Debt service: - Principal payment 285,000 585,000 (300,000) Interest and fiscal charges 322,646 481,006 (158,360)
1,678,914 1,912,191 (233,277)
749,726 (540,651) (1,290,377)
Other financing sources (uses)Transfers out (170,000) (26,699) 143,301
579,726 (567,350) (1,147,076)
- - -
$ 579,726 $ (567,350) $ (1,147,076)
Net change in fund balances
Fund balances - beginning of year
Fund balances - end of year
Total revenues
Total expenditures
Excess of revenues over (under) expenditures

City of Lynwood Schedule of Revenues, Expenditures and Changes in Fund Balance –
Budget and Actual Business Improvement District Special Revenue Fund
Year ended June 30, 2009
128
Variance
Final PositiveBudget Actual (Negative)
RevenuesLicenses and permits $ 125,000 $ 133,017 $ 8,017
125,000 133,017 8,017
ExpendituresCurrent:
Community development 125,000 73,250 51,750 125,000 73,250 51,750
- 59,767 59,767
(41,246) (41,246) -
$ (41,246) $ 18,521 $ 59,767
Fund balances - beginning of year
Fund balances - end of year
Total revenues
Total expenditures
Excess of revenues over (under) expenditures
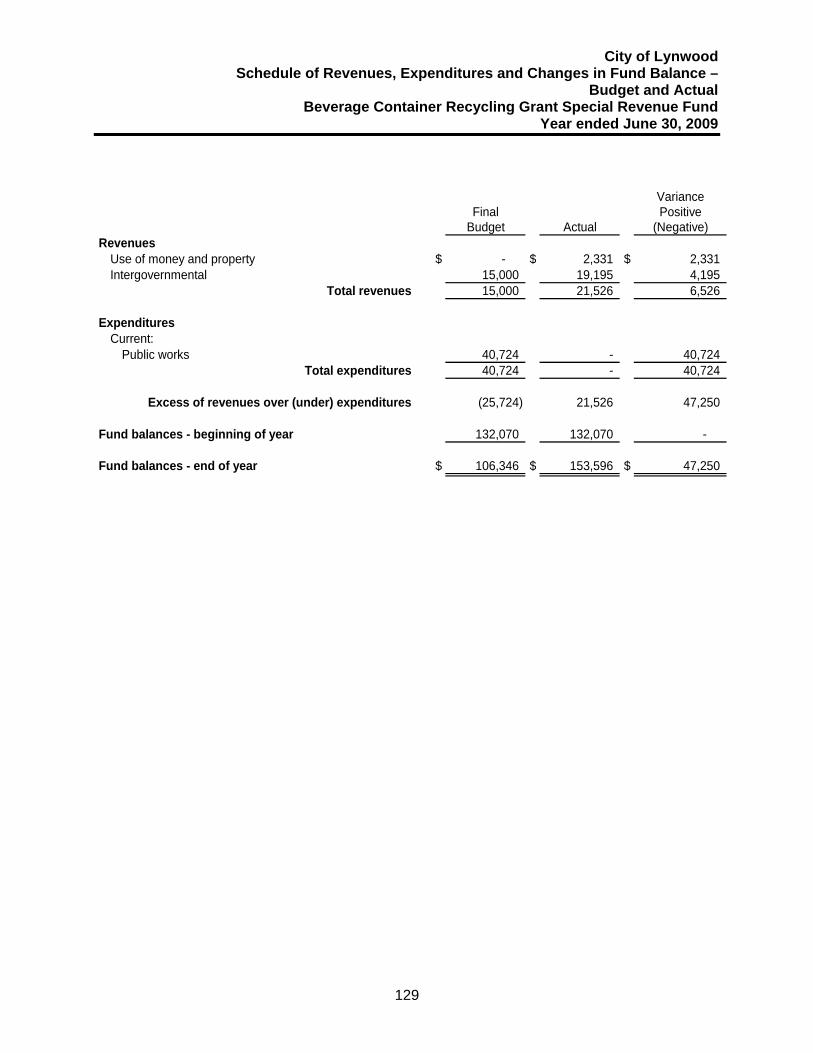
City of Lynwood Schedule of Revenues, Expenditures and Changes in Fund Balance –
Budget and Actual Beverage Container Recycling Grant Special Revenue Fund
Year ended June 30, 2009
129
Variance
Final PositiveBudget Actual (Negative)
RevenuesUse of money and property $ - $ 2,331 $ 2,331 Intergovernmental 15,000 19,195 4,195
15,000 21,526 6,526
ExpendituresCurrent:
Public works 40,724 - 40,724 40,724 - 40,724
(25,724) 21,526 47,250
132,070 132,070 -
$ 106,346 $ 153,596 $ 47,250
Fund balances - beginning of year
Fund balances - end of year
Total revenues
Total expenditures
Excess of revenues over (under) expenditures
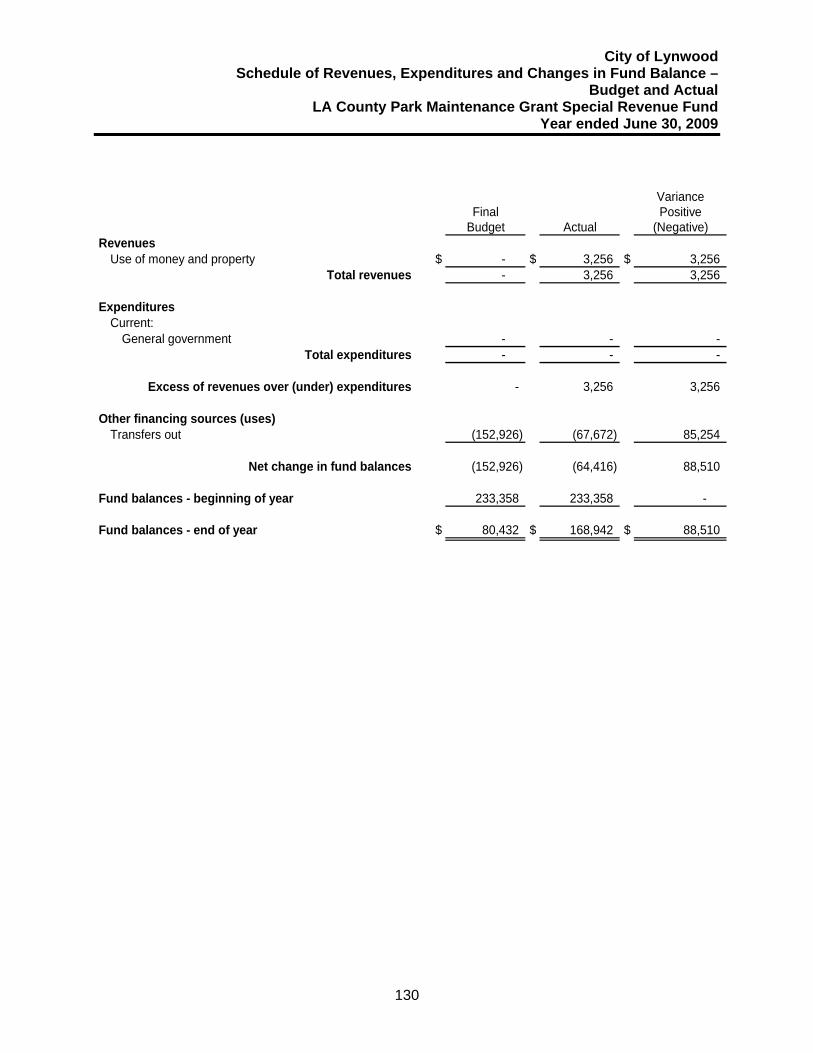
City of Lynwood Schedule of Revenues, Expenditures and Changes in Fund Balance –
Budget and Actual LA County Park Maintenance Grant Special Revenue Fund
Year ended June 30, 2009
130
Variance
Final PositiveBudget Actual (Negative)
RevenuesUse of money and property $ - $ 3,256 $ 3,256
- 3,256 3,256
ExpendituresCurrent:
General government - - - - - -
- 3,256 3,256
Other financing sources (uses)Transfers out (152,926) (67,672) 85,254
(152,926) (64,416) 88,510
233,358 233,358 -
$ 80,432 $ 168,942 $ 88,510
Net change in fund balances
Fund balances - beginning of year
Fund balances - end of year
Total revenues
Total expenditures
Excess of revenues over (under) expenditures

City of Lynwood Schedule of Revenues, Expenditures and Changes in Fund Balance –
Budget and Actual Brownfield Grant Special Revenue Fund
Year ended June 30, 2009
131
Variance
Final PositiveBudget Actual (Negative)
RevenuesIntergovernmental $ - $ 39,402 $ 39,402
- 39,402 39,402
ExpendituresCurrent:
Community development 400,000 60,679 339,321 400,000 60,679 339,321
(400,000) (21,277) 378,723
- - -
$ (400,000) $ (21,277) $ 378,723
Fund balances - beginning of year
Fund balances - end of year
Total revenues
Total expenditures
Excess of revenues over (under) expenditures

City of Lynwood Schedule of Revenues, Expenditures and Changes in Fund Balance –
Budget and Actual Used Oil Recycling Grant Special Revenue Fund
Year ended June 30, 2009
132
Variance
Final PositiveBudget Actual (Negative)
RevenuesUse of money and property $ - $ 434 $ 434 Intergovernmental 20,000 11,918 (8,082)
20,000 12,352 (7,648)
ExpendituresCurrent:
Public works 21,530 14,937 6,593 21,530 14,937 6,593
(1,530) (2,585) (1,055)
29,108 29,108 -
$ 27,578 $ 26,523 $ (1,055)
Fund balances - beginning of year
Fund balances - end of year
Total revenues
Total expenditures
Excess of revenues over (under) expenditures

City of Lynwood Schedule of Revenues, Expenditures and Changes in Fund Balance –
Budget and Actual Per Capita Grant 2000 Special Revenue Fund
Year ended June 30, 2009
133
Variance
Final PositiveBudget Actual (Negative)
RevenuesIntergovernmental $ 215,000 $ 231,958 $ 16,958
215,000 231,958 16,958
ExpendituresCurrent:
General government - - - - - -
215,000 231,958 16,958
Other financing sources (uses)Transfers out (649,774) (293,512) 356,262
(434,774) (61,554) 373,220
- - -
$ (434,774) $ (61,554) $ 373,220
Net change in fund balances
Fund balances - beginning of year
Fund balances - end of year
Total revenues
Total expenditures
Excess of revenues over (under) expenditures

City of Lynwood Schedule of Revenues, Expenditures and Changes in Fund Balance –
Budget and Actual TEA/ISTEA Grant Special Revenue Fund
Year ended June 30, 2009
134
Variance
Final PositiveBudget Actual (Negative)
RevenuesIntergovernmental $ 2,376,799 $ 48,941 $ (2,327,858)
2,376,799 48,941 (2,327,858)
ExpendituresCurrent:
General government - - - - - -
2,376,799 48,941 (2,327,858)
Other financing sources (uses)Transfers out (2,373,469) (2,802) 2,370,667
3,330 46,139 42,809
(326,531) (326,531) -
$ (323,201) $ (280,392) $ 42,809
Net change in fund balances
Fund balances - beginning of year
Fund balances - end of year
Total revenues
Total expenditures
Excess of revenues over (under) expenditures

City of Lynwood Schedule of Revenues, Expenditures and Changes in Fund Balance –
Budget and Actual Safe School Route Special Revenue Fund
Year ended June 30, 2009
135
Variance
Final PositiveBudget Actual (Negative)
RevenuesIntergovernmental $ - $ - $ -
- - -
ExpendituresCurrent:
Public safety - 298,961 (298,961) - 298,961 (298,961)
- (298,961) (298,961)
Other financing sources (uses)Transfers out 1,039 - (1,039)
1,039 (298,961) (300,000)
- - -
$ 1,039 $ (298,961) $ (300,000)
Net change in fund balances
Fund balances - beginning of year
Fund balances - end of year
Total revenues
Total expenditures
Excess of revenues over (under) expenditures

City of Lynwood Schedule of Revenues, Expenditures and Changes in Fund Balance –
Budget and Actual State of California CEC Grant Special Revenue Fund
Year ended June 30, 2009
136
Variance
Final PositiveBudget Actual (Negative)
RevenuesIntergovernmental $ - $ - $ -
- - -
ExpendituresCurrent:
General government - - - - - -
- - -
Other financing sources (uses)Transfers out - (4,079) (4,079)
- (4,079) (4,079)
- - -
$ - $ (4,079) $ (4,079)
Net change in fund balances
Fund balances - beginning of year
Fund balances - end of year
Total revenues
Total expenditures
Excess of revenues over (under) expenditures
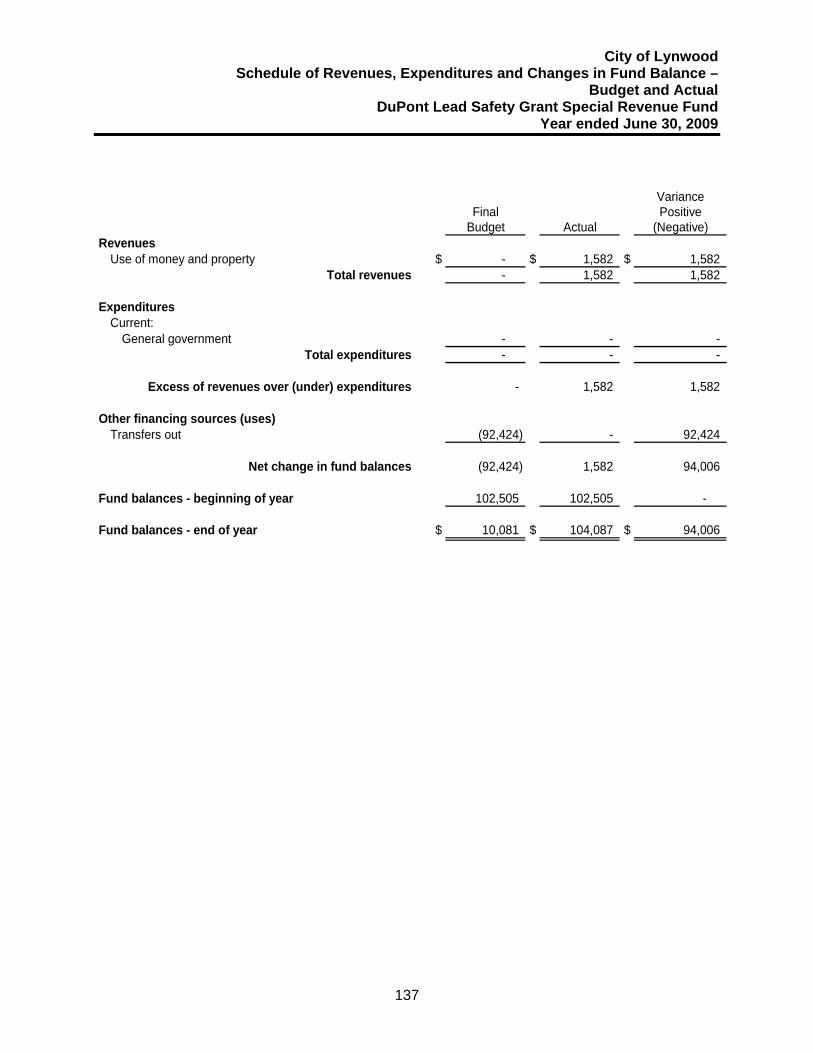
City of Lynwood Schedule of Revenues, Expenditures and Changes in Fund Balance –
Budget and Actual DuPont Lead Safety Grant Special Revenue Fund
Year ended June 30, 2009
137
Variance
Final PositiveBudget Actual (Negative)
RevenuesUse of money and property $ - $ 1,582 $ 1,582
- 1,582 1,582
ExpendituresCurrent:
General government - - - - - -
- 1,582 1,582
Other financing sources (uses)Transfers out (92,424) - 92,424
(92,424) 1,582 94,006
102,505 102,505 -
$ 10,081 $ 104,087 $ 94,006
Net change in fund balances
Fund balances - beginning of year
Fund balances - end of year
Total revenues
Total expenditures
Excess of revenues over (under) expenditures
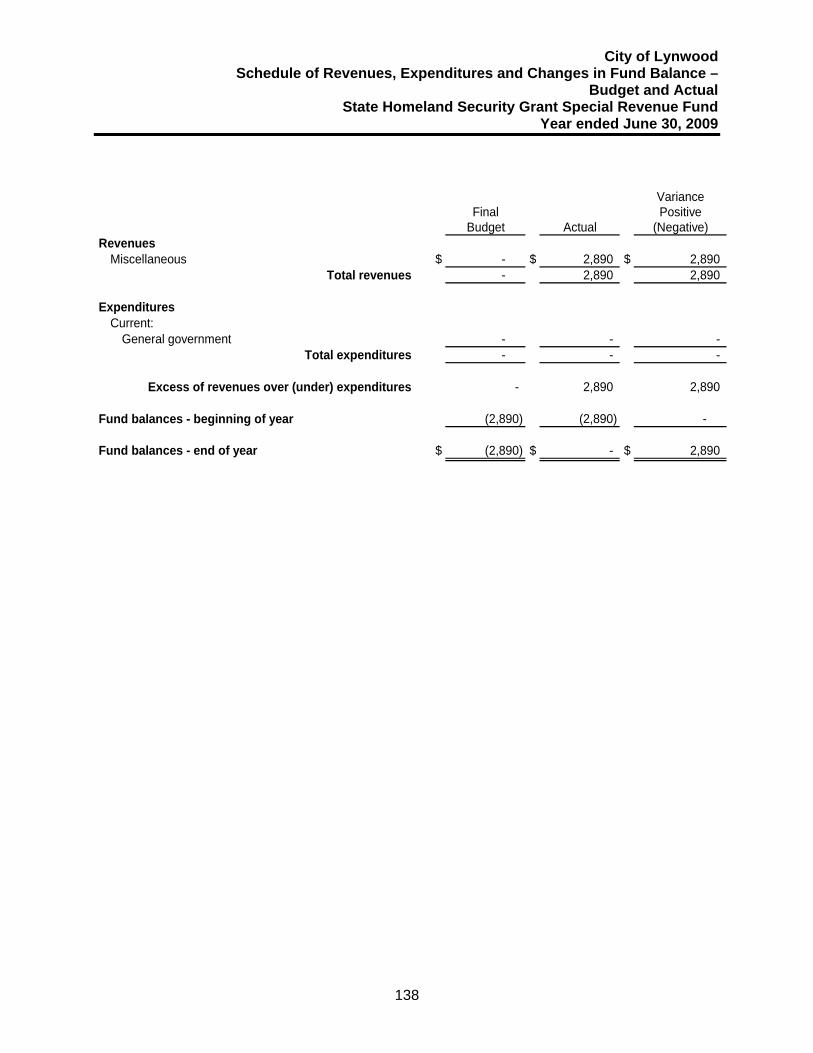
City of Lynwood Schedule of Revenues, Expenditures and Changes in Fund Balance –
Budget and Actual State Homeland Security Grant Special Revenue Fund
Year ended June 30, 2009
138
Variance
Final PositiveBudget Actual (Negative)
RevenuesMiscellaneous $ - $ 2,890 $ 2,890
- 2,890 2,890
ExpendituresCurrent:
General government - - - - - -
- 2,890 2,890
(2,890) (2,890) -
$ (2,890) $ - $ 2,890
Fund balances - beginning of year
Fund balances - end of year
Total revenues
Total expenditures
Excess of revenues over (under) expenditures

City of Lynwood Schedule of Revenues, Expenditures and Changes in Fund Balance –
Budget and Actual Prop 40 Grant Special Revenue Fund
Year ended June 30, 2009
139
Variance
Final PositiveBudget Actual (Negative)
RevenuesIntergovermental $ - $ - $ -
- - -
ExpendituresCurrent:
Public works - 360 (360) - 360 (360)
- (360) (360)
Other financing sources (uses)Transfers in - 360 360
- - -
- - -
$ - $ - $ -
Net change in fund balances
Fund balances - beginning of year
Fund balances - end of year
Total revenues
Total expenditures
Excess of revenues over (under) expenditures

City of Lynwood Schedule of Revenues, Expenditures and Changes in Fund Balance –
Budget and Actual Prop 1B Special Revenue Fund
Year ended June 30, 2009
140
Variance
Final PositiveBudget Actual (Negative)
RevenuesUse of money and property $ - $ 24,211 $ 24,211 Intergovernmental 1,176,905 1,087,785 (89,120)
1,176,905 1,111,996 (64,909)
ExpendituresCurrent:
Public works - - - - - -
1,176,905 1,111,996 (64,909)
Other financing sources (uses)Transfers out (1,176,905) (1,352,866) (175,961)
- (240,870) (240,870)
1,191,551 1,191,551 -
$ 1,191,551 $ 950,681 $ (240,870)
Net change in fund balances
Fund balances - beginning of year
Fund balances - end of year
Total revenues
Total expenditures
Excess of revenues over (under) expenditures

City of Lynwood Schedule of Revenues, Expenditures and Changes in Fund Balance –
Budget and Actual Justice Assistance Special Revenue Fund
Year ended June 30, 2009
141
Variance
Final PositiveBudget Actual (Negative)
RevenuesIntergovermental $ 60,000 $ - $ (60,000)
60,000 - (60,000)
ExpendituresCurrent:
Public safety 60,000 92,152 (32,152) 60,000 92,152 (32,152)
- (92,152) (92,152)
- - -
$ - $ (92,152) $ (92,152)
Fund balances - beginning of year
Fund balances - end of year
Total revenues
Total expenditures
Excess of revenues over (under) expenditures
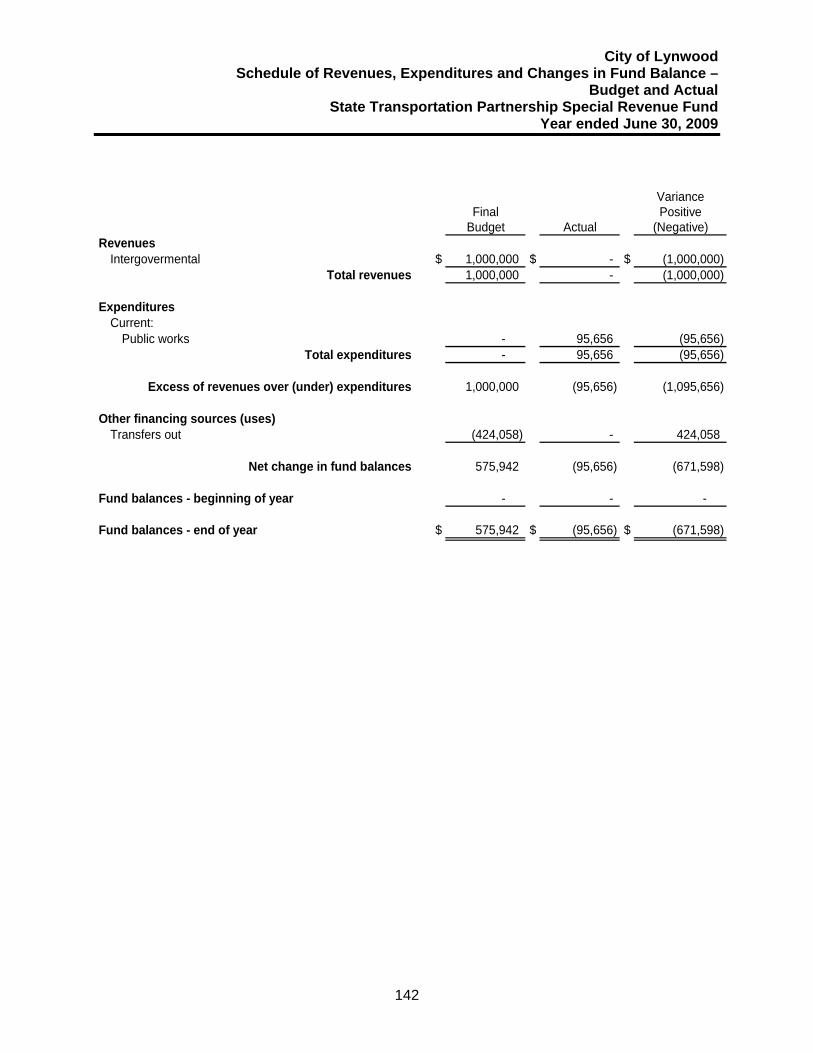
City of Lynwood Schedule of Revenues, Expenditures and Changes in Fund Balance –
Budget and Actual State Transportation Partnership Special Revenue Fund
Year ended June 30, 2009
142
Variance
Final PositiveBudget Actual (Negative)
RevenuesIntergovermental $ 1,000,000 $ - $ (1,000,000)
1,000,000 - (1,000,000)
ExpendituresCurrent:
Public works - 95,656 (95,656) - 95,656 (95,656)
1,000,000 (95,656) (1,095,656)
Other financing sources (uses)Transfers out (424,058) - 424,058
575,942 (95,656) (671,598)
- - -
$ 575,942 $ (95,656) $ (671,598)
Net change in fund balances
Fund balances - beginning of year
Fund balances - end of year
Total revenues
Total expenditures
Excess of revenues over (under) expenditures

City of Lynwood Schedule of Revenues, Expenditures and Changes in Fund Balance –
Budget and Actual Roberti-Zberg Harris Special Revenue Fund
Year ended June 30, 2009
143
Variance
Final PositiveBudget Actual (Negative)
RevenuesIntergovermental $ - $ 316,960 $ 316,960
- 316,960 316,960
ExpendituresCurrent:
Public works - - - - - -
- 316,960 316,960
Other financing sources (uses)Transfers out (396,201) (316,960) 79,241
(396,201) - 396,201
- - -
$ (396,201) $ - $ 396,201
Net change in fund balances
Fund balances - beginning of year
Fund balances - end of year
Total revenues
Total expenditures
Excess of revenues over (under) expenditures
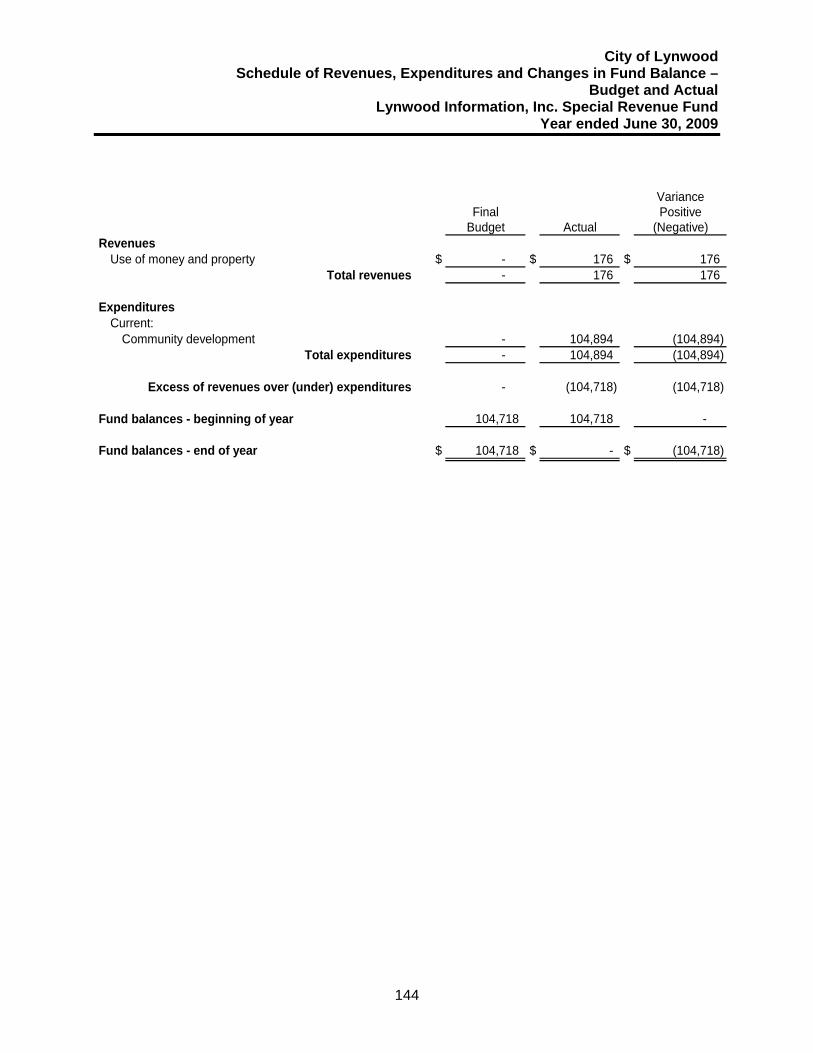
City of Lynwood Schedule of Revenues, Expenditures and Changes in Fund Balance –
Budget and Actual Lynwood Information, Inc. Special Revenue Fund
Year ended June 30, 2009
144
Variance
Final PositiveBudget Actual (Negative)
RevenuesUse of money and property $ - $ 176 $ 176
- 176 176
ExpendituresCurrent:
Community development - 104,894 (104,894) - 104,894 (104,894)
- (104,718) (104,718)
104,718 104,718 -
$ 104,718 $ - $ (104,718)
Fund balances - beginning of year
Fund balances - end of year
Total revenues
Total expenditures
Excess of revenues over (under) expenditures

City of Lynwood Schedule of Revenues, Expenditures and Changes in Fund Balance –
Budget and Actual Redevelopment Low/Mod Income Housing Alameda Area Special Revenue Fund
Year ended June 30, 2009
145
Variance
Final PositiveBudget Actual (Negative)
RevenuesUse of money and property $ 14,000 $ 12,406 $ (1,594)
14,000 12,406 (1,594)
ExpendituresCurrent:
General government 39,705 74,123 (34,418) Community development 491,826 90,926 400,900
Debt service: - Principal payment 13,487 13,300 187 Interest and fiscal charges - 24,557 (24,557)
545,018 202,906 342,112
(531,018) (190,500) 340,518
Other financing sources (uses)Transfers in 168,000 279,239 111,239
(363,018) 88,739 451,757
1,346,449 1,346,449 -
$ 983,431 $ 1,435,188 $ 451,757
Net change in fund balances
Fund balances - beginning of year
Fund balances - end of year
Total revenues
Total expenditures
Excess of revenues over (under) expenditures

City of Lynwood Schedule of Revenues, Expenditures and Changes in Fund Balance –
Budget and Actual City of Lynwood Debt Service Fund
Year ended June 30, 2009
146
Variance
Final PositiveBudget Actual (Negative)
RevenuesUse of money and property $ - $ 3,936 $ 3,936
- 3,936 3,936
ExpendituresDebt service: -
Principal payment 824,475 1,152,510 (328,035) Interest and fiscal charges 542,013 213,981 328,032
1,366,488 1,366,491 (3)
(1,366,488) (1,362,555) 3,933
Other financing sources (uses)Transfers in 1,366,488 1,233,149 (133,339)
- (129,406) (129,406)
1,186,748 1,186,748 -
$ 1,186,748 $ 1,057,342 $ (129,406)
Net change in fund balances
Fund balances - beginning of year
Fund balances - end of year
Total revenues
Total expenditures
Excess of revenues over (under) expenditures

City of Lynwood Schedule of Revenues, Expenditures and Changes in Fund Balance –
Budget and Actual Public Financing Authority Debt Service Fund
Year ended June 30, 2009
147
Variance
Final PositiveBudget Actual (Negative)
RevenuesUse of money and property $ - $ - $ -
- - -
ExpendituresCurrent:
General government 11,237 10,486 751 11,237 10,486 751
(11,237) (10,486) 751
Other financing sources (uses)Transfers in 11,237 10,486 (751)
- - -
- - -
$ - $ - $ -
Net change in fund balances
Fund balances - beginning of year
Fund balances - end of year
Total revenues
Total expenditures
Excess of revenues over (under) expenditures
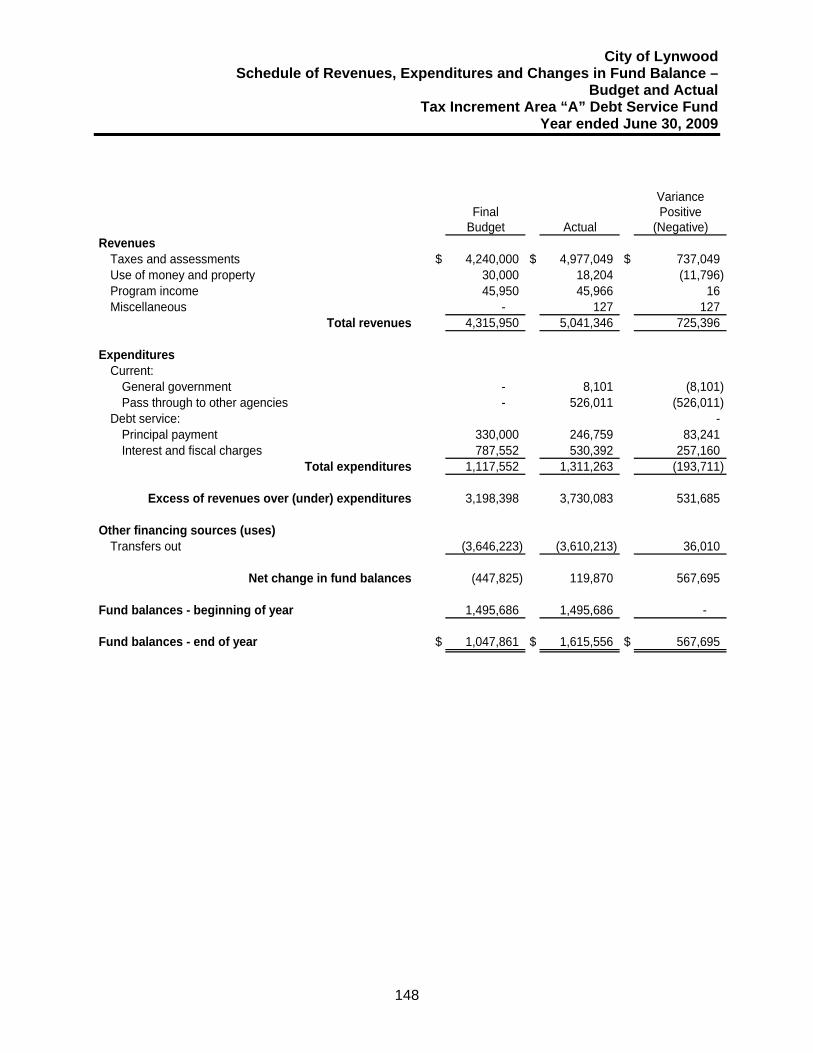
City of Lynwood Schedule of Revenues, Expenditures and Changes in Fund Balance –
Budget and Actual Tax Increment Area “A” Debt Service Fund
Year ended June 30, 2009
148
Variance
Final PositiveBudget Actual (Negative)
RevenuesTaxes and assessments $ 4,240,000 $ 4,977,049 $ 737,049 Use of money and property 30,000 18,204 (11,796) Program income 45,950 45,966 16 Miscellaneous - 127 127
4,315,950 5,041,346 725,396
ExpendituresCurrent:
General government - 8,101 (8,101) Pass through to other agencies - 526,011 (526,011)
Debt service: - Principal payment 330,000 246,759 83,241 Interest and fiscal charges 787,552 530,392 257,160
1,117,552 1,311,263 (193,711)
3,198,398 3,730,083 531,685
Other financing sources (uses)Transfers out (3,646,223) (3,610,213) 36,010
(447,825) 119,870 567,695
1,495,686 1,495,686 -
$ 1,047,861 $ 1,615,556 $ 567,695
Net change in fund balances
Fund balances - beginning of year
Fund balances - end of year
Total revenues
Total expenditures
Excess of revenues over (under) expenditures

City of Lynwood Schedule of Revenues, Expenditures and Changes in Fund Balance –
Budget and Actual Special Fund Area “A” Alameda Debt Service Fund
Year ended June 30, 2009
149
Variance
Final PositiveBudget Actual (Negative)
RevenuesUse of money and property $ 24,000 $ 5,995 $ (18,005)
24,000 5,995 (18,005)
ExpendituresDebt service: -
Interest and fiscal charges 24,000 121,075 (97,075) 24,000 121,075 (97,075)
- (115,080) (115,080)
1,254,238 1,254,238 -
$ 1,254,238 $ 1,139,158 $ (115,080)
Fund balances - beginning of year
Fund balances - end of year
Total revenues
Total expenditures
Excess of revenues over (under) expenditures
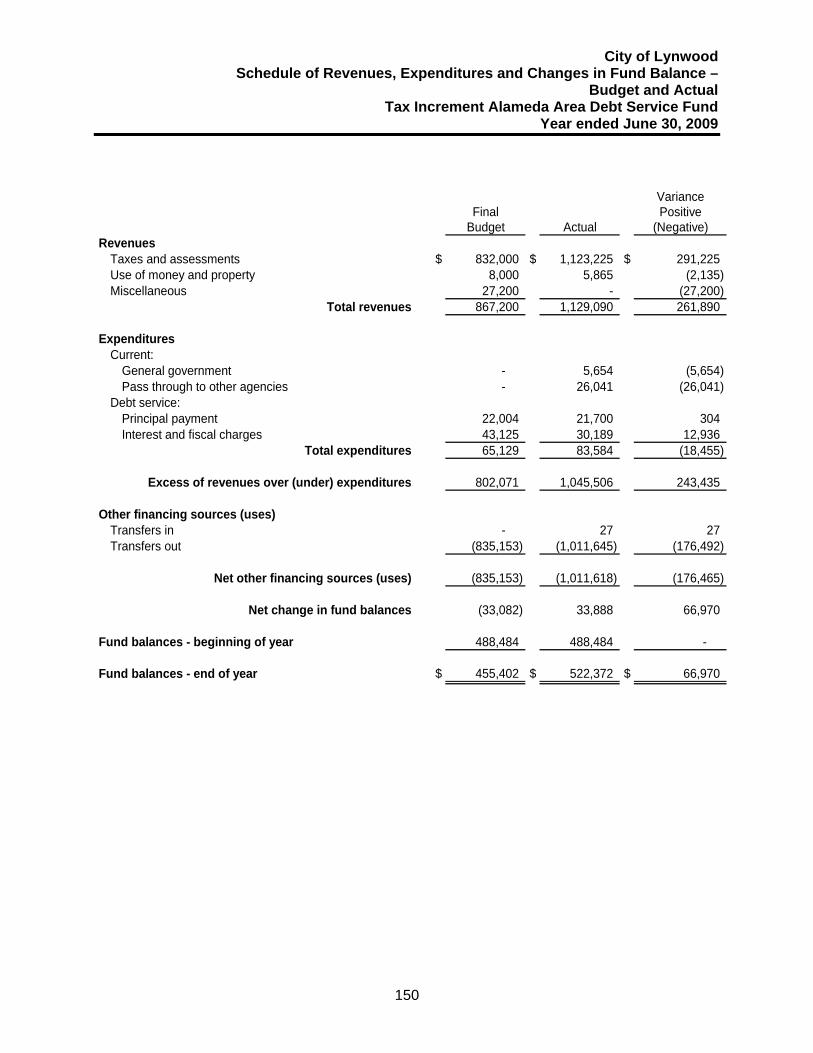
City of Lynwood Schedule of Revenues, Expenditures and Changes in Fund Balance –
Budget and Actual Tax Increment Alameda Area Debt Service Fund
Year ended June 30, 2009
150
Variance
Final PositiveBudget Actual (Negative)
RevenuesTaxes and assessments $ 832,000 $ 1,123,225 $ 291,225 Use of money and property 8,000 5,865 (2,135) Miscellaneous 27,200 - (27,200)
867,200 1,129,090 261,890
ExpendituresCurrent:
General government - 5,654 (5,654) Pass through to other agencies - 26,041 (26,041)
Debt service:Principal payment 22,004 21,700 304 Interest and fiscal charges 43,125 30,189 12,936
65,129 83,584 (18,455)
802,071 1,045,506 243,435
Other financing sources (uses)Transfers in - 27 27 Transfers out (835,153) (1,011,645) (176,492)
(835,153) (1,011,618) (176,465)
(33,082) 33,888 66,970
488,484 488,484 -
$ 455,402 $ 522,372 $ 66,970
Net change in fund balances
Fund balances - beginning of year
Fund balances - end of year
Total revenues
Total expenditures
Excess of revenues over (under) expenditures
Net other financing sources (uses)

City of Lynwood Schedule of Revenues, Expenditures and Changes in Fund Balance –
Budget and Actual Park Replacement Capital Projects Fund
Year ended June 30, 2009
151
Variance
Final PositiveBudget Actual (Negative)
RevenuesIntergovermental $ 4,040,000 $ - $ (4,040,000)
4,040,000 - (4,040,000)
ExpendituresCurrent:
Public works - - - - - -
4,040,000 - (4,040,000)
Other financing sources (uses)Transfers out (2,928,241) (508,136) 2,420,105
1,111,759 (508,136) (1,619,895)
(2,064,111) (2,064,111) -
$ (952,352) $ (2,572,247) $ (1,619,895)
Net change in fund balances
Fund balances - beginning of year
Fund balances - end of year
Total revenues
Total expenditures
Excess of revenues over (under) expenditures

City of Lynwood Schedule of Revenues, Expenditures and Changes in Fund Balance –
Budget and Actual Capital Grant Loan Capital Projects Fund
Year ended June 30, 2009
152
Variance
Final PositiveBudget Actual (Negative)
RevenuesUse of money and property $ - $ 8,260 $ 8,260
- 8,260 8,260
ExpendituresCurrent:
Public works - - - - - -
- 8,260 8,260
Other financing sources (uses)Transfers out (1,126,037) (35,470) 1,090,567
(1,126,037) (27,210) 1,098,827
1,268,625 1,268,625 -
$ 142,588 $ 1,241,415 $ 1,098,827
Net change in fund balances
Fund balances - beginning of year
Fund balances - end of year
Total revenues
Total expenditures
Excess of revenues over (under) expenditures

City of Lynwood Schedule of Revenues, Expenditures and Changes in Fund Balance –
Budget and Actual 2003 Lease Revenue Refunding Capital Projects Fund
Year ended June 30, 2009
153
Variance
Final PositiveBudget Actual (Negative)
RevenuesUse of money and property $ - $ 6,455 $ 6,455
- 6,455 6,455
ExpendituresCurrent:
Public works - - - - - -
- 6,455 6,455
Other financing sources (uses)Transfers out (692,177) (4,723) 687,454
(692,177) 1,732 693,909
1,204,569 1,204,569 -
$ 512,392 $ 1,206,301 $ 693,909
Net change in fund balances
Fund balances - beginning of year
Fund balances - end of year
Total revenues
Total expenditures
Excess of revenues over (under) expenditures

City of Lynwood Schedule of Revenues, Expenditures and Changes in Fund Balance –
Budget and Actual Redevelopment Project Area “A” Taxable Bond Proceeds Capital Projects Fund
Year ended June 30, 2009
154
Variance
Final PositiveBudget Actual (Negative)
RevenuesUse of money and property $ - $ 430 $ 430
- 430 430
ExpendituresCurrent:
Public works - - - - - -
- 430 430
Other financing sources (uses)Transfers out - - -
- 430 430
43,700 43,700 -
$ 43,700 $ 44,130 $ 430
Net change in fund balances
Fund balances - beginning of year
Fund balances - end of year
Total revenues
Total expenditures
Excess of revenues over (under) expenditures

City of Lynwood Schedule of Revenues, Expenditures and Changes in Fund Balance –
Budget and Actual Redevelopment Project Alameda Area Capital Projects Fund
Year ended June 30, 2009
155
Variance
Final PositiveBudget Actual (Negative)
RevenuesUse of money and property $ - $ - $ -
- - -
ExpendituresCurrent:
General government 670,580 536,769 133,811 Community development 211,250 192,320 18,930
Capital outlay 5,000 1,812 3,188 886,830 730,901 155,929
(886,830) (730,901) 155,929
Other financing sources (uses)Transfers in 667,153 732,379 65,226
(219,677) 1,478 221,155
(262) (262) -
$ (219,939) $ 1,216 $ 221,155
Net change in fund balances
Fund balances - beginning of year
Fund balances - end of year
Total revenues
Total expenditures
Excess of revenues over (under) expenditures
City of Lynwood Internal Service Funds
June 30, 2009
156
Internal service funds are used to account for transactions related to the City's garage department, information technology, and for its self-insurance programs. These services are provided to other departments on a cost reimbursement basis. Garage Fund - This fund accounts for reimbursements from City departments for the cost of upkeep on City vehicles. Self-Insurance Fund - This fund accounts for reimbursements from City departments for the cost of insurance premiums, claims and administration. Information Technology Fund - This fund accounts for all information technology costs to the City. Funding sources are 50% from the General Fund and 50% from the Water Fund.

City of Lynwood Combining Statement of Net Assets
Internal Service Funds June 30, 2009
157
InformationGarage Technology Self-Insurance Totals
Current assetsCash and investments $ 389,612 $ 80,102 $ - $ 469,714 Receivables:
Accounts - - 714 714 Total current assets 389,612 80,102 714 470,428
Noncurrent assetsRestricted assets:
Deposit in trust - - 80,000 80,000 Capital assets, depreciated, net 689,898 542,528 - 1,232,426
Total noncurrent assets 689,898 542,528 80,000 1,312,426
1,079,510 622,630 80,714 1,782,854
Current liabilitiesAccounts payable 32,975 - 142,610 175,585 Due to other funds - - 1,335,378 1,335,378
32,975 - 1,477,988 1,510,963
Noncurrent liabilitiesNoncurrent portion of long-term debt:
Claims payable - - 1,902,579 1,902,579 Total noncurrent liabilities - - 1,902,579 1,902,579
Invested in capital assets, net of related debt 689,898 542,528 - 1,232,426 Unrestricted 356,637 80,102 (3,299,853) (2,863,114)
$ 1,046,535 $ 622,630 $ (3,299,853) $ (1,630,688)
Internal Service Fund
ASSETS
Total assets
LIABILITIES
Total current liabilities
NET ASSETS
Total net assets
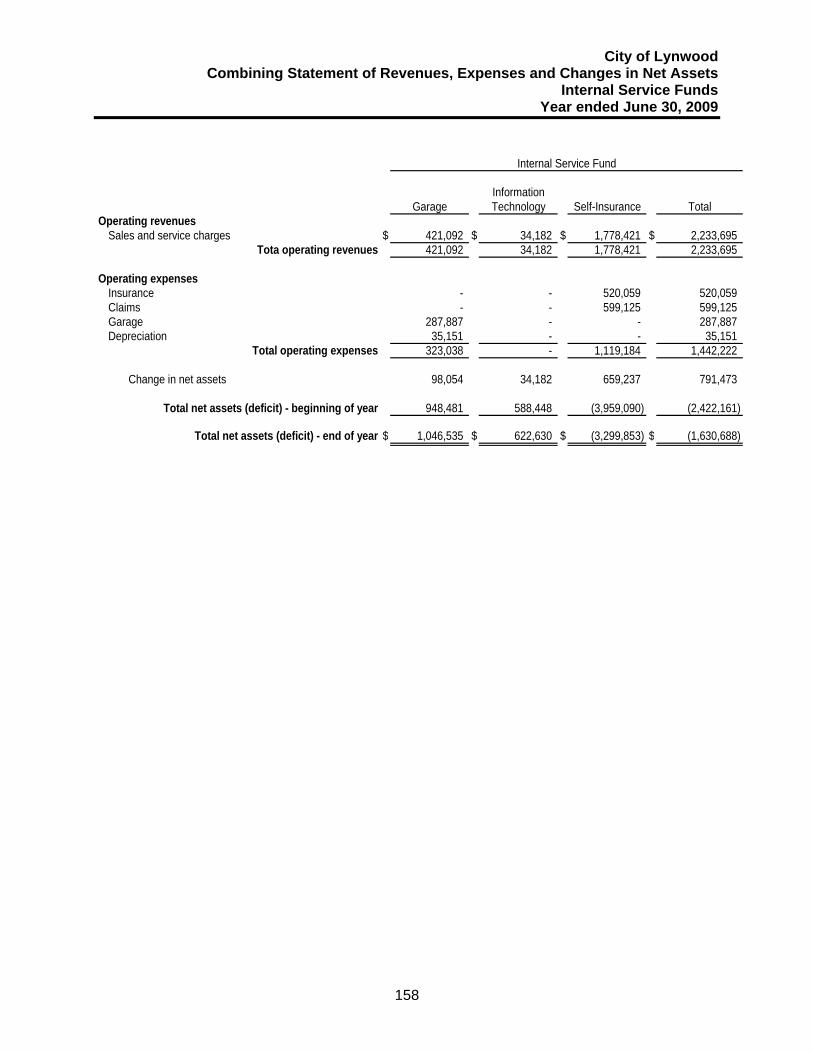
City of Lynwood Combining Statement of Revenues, Expenses and Changes in Net Assets
Internal Service Funds Year ended June 30, 2009
158
InformationGarage Technology Self-Insurance Total
Operating revenuesSales and service charges $ 421,092 $ 34,182 $ 1,778,421 $ 2,233,695
Tota operating revenues 421,092 34,182 1,778,421 2,233,695
Operating expensesInsurance - - 520,059 520,059 Claims - - 599,125 599,125 Garage 287,887 - - 287,887 Depreciation 35,151 - - 35,151
Total operating expenses 323,038 - 1,119,184 1,442,222
Change in net assets 98,054 34,182 659,237 791,473
Total net assets (deficit) - beginning of year 948,481 588,448 (3,959,090) (2,422,161)
Total net assets (deficit) - end of year $ 1,046,535 $ 622,630 $ (3,299,853) $ (1,630,688)
Internal Service Fund

City of Lynwood Combining Statement of Cash Flows
Internal Service Funds Year ended June 30, 2009
159
InformationGarage Technology Self-Insurance Total
Cash flows from operating activities:Receipts from customers and users $ 421,092 $ 34,182 $ 1,778,421 $ 2,233,695 Payments to suppliers (298,343) (68,793) (635,030) (1,002,166) Payments for claims - - (1,063,391) (1,063,391) Payments to employees (8,291) (34,182) - (42,473)
Net cash provided by (used in) operating activities 114,458 (68,793) 80,000 125,665
Cash flows from investing activitiesDeposit in trust - - (80,000) (80,000)
Net increase (decrease) in cash and investments 114,458 (68,793) - 45,665
Cash and investments - beginning of year 275,154 148,895 - 424,049 Cash and investments - end of year $ 389,612 $ 80,102 $ - $ 469,714
- Reconciliation of operating income (loss) to net cash -
provided by (used in) operating activities:Operating income $ 98,054 $ 34,182 $ 659,237 $ 791,473 Adjustments to reconcile operating income (loss) to
net cash provided by (used in) operating activities:Depreciation 35,151 - - 35,151 Changes in operating assets and liabilities: -
(Increase) decrease in accounts receivables - (714) (714) Increase (decrease) in accounts payable (18,747) (102,975) (114,971) (236,693) Increase (decrease) in claims payable - - (1,248,267) (1,248,267) Increase (decrease) in deposits - - - Increase (decrease) in due to other funds - - 784,715 784,715 Total adjustments 16,404 (102,975) (579,237) (665,808)
Net cash provided by (used in) operating activities $ 114,458 $ (68,793) $ 80,000 $ 125,665
Internal Service Fund

City of Lynwood Statement of Changes in Assets and Liabilities
Agency Fund Year ended June 30, 2009
160
State Deferred Payment Loan Program
Balance BalanceJuly 1, 2008 Additions Deletions June 30, 2009
Receivables:Notes and loans $ 54,506 $ - $ - $ 54,506
Total assets $ 54,506 $ - $ - $ 54,506
Deferred revenue $ 54,506 $ - $ - $ 54,506 Total liabilities $ 54,506 $ - $ - $ 54,506
ASSETS
LIABILITIES

STATISTICAL SECTION

THIS PAGE LEFT INTENTIONALLY BLANK

City of Lynwood Description of Statistical Section Contents
161
CONTENTS PAGE Financial Trends
These tables contain trend information that may assist the reader in the City’s current financial performance by placing it in historical perspective.
162-168
Revenue Capacity
These tables contain information that may help in assessing the viability of the City’s most significant revenue sources.
169--178
Debt Capacity
These tables present information that may assist the reader in analyzing the affordability of the City’s current levels of outstanding debt and the City’s ability to issue additional debt in the future.
179-186
Demographic and Economic Information These tables offer demographic and economic indicators to help the reader understand the environment within which the City’s financial activities take place.
187-188
Operating Information These tables contain service and infrastructure indicators that may inform one’s understanding on how the information in the City’s financial statements relate to the services that the City provides and the activities that it performs.
189-191

City of Lynwood Net Assets by Component
Last Seven Fiscal Years (accrual basis of accounting)
162
2003 2004 2005 2006 2007 2008 2009
Governmental activities Invested in capital assets, net of related debt $ 32,840,261 $ 36,637,087 $ 36,453,679 $ 71,070,677 $ 79,540,927 $ 85,074,079 $ 88,707,464 Restricted 23,958,817 57,487,760 57,339,342 34,546,018 33,396,865 34,777,084 19,520,953 Unrestricted 6,275,255 1,230,937 1,002,841 24,793 4,340,631 3,283,514 16,293,599
Total governmental activities net assets 63,074,333 95,355,784 94,795,862 105,641,488 117,278,423 123,134,677 124,522,016
Business-type activities Invested in capital assets, net of related debt 2,801,882 4,824,744 3,960,818 2,247,256 (2,167,357) (3,167,553) (7,686,833) Restricted 7,086,817 12,896,690 11,961,502 9,707,252 4,891,486 988,286 1,900,804 Unrestricted 1,246,735 (4,685,335) (5,719,044) (3,107,059) 1,610,454 9,258,275 14,791,755
Total business-type activities net assets 11,135,434 13,036,099 10,203,276 8,847,449 4,334,583 7,079,008 9,005,726
Primary government Invested in capital assets, net of related debt 35,642,143 41,461,831 40,414,497 73,317,933 77,373,570 81,906,526 81,020,631 Restricted 31,045,634 70,384,450 69,300,844 44,253,270 38,288,351 35,765,370 21,421,757 Unrestricted 7,521,990 (3,454,398) (4,716,203) (3,082,266) 5,951,085 12,541,789 31,085,354
Total primary government net assets $ 74,209,767 $ 108,391,883 $ 104,999,138 $ 114,488,937 $ 121,613,006 $ 130,213,685 $ 133,527,742
Fiscal Year
GASB 34 was implemented for the fiscal year ended June 30, 2003. Information prior to implementation of GASB 34 is not available. Source: City of Lynwood

City of Lynwood Changes in Net Assets – Expenses and Program Revenues
Last Seven Fiscal Years (accrual basis of accounting)
163
2003 2004 2005 2006 2007 2008 2009
ExpensesGovernmental activities: General government $ 5,620,554 $ 7,942,266 $ 6,936,325 $ 6,213,553 $ 8,117,721 $ 9,942,569 $ 12,089,347 Public safety 12,658,884 13,533,160 13,182,693 13,922,118 15,505,809 15,696,589 17,461,248 Public works 5,812,021 5,333,050 5,791,864 5,363,619 5,294,634 7,344,547 8,213,775 Redevelopment 4,201,124 3,048,594 7,550,558 4,694,655 6,390,638 5,406,955 3,028,869 Parks and recreation 2,298,800 2,671,467 2,761,444 2,840,996 3,312,944 3,160,255 3,620,892 Interest on long-term debt 2,345,787 2,329,344 2,235,271 2,377,448 1,984,742 1,941,003 1,728,377 Unallocated Depreciation 515,339 725,591 - - 1,025,821 1,048,750 - *
Total governmental activities expenses 33,452,509 35,583,472 38,458,155 35,412,389 41,632,309 44,540,668 46,142,508
Business-type activities: Water 5,781,285 6,111,741 6,517,910 6,168,104 6,544,735 6,485,599 7,717,008 Transit 1,195,792 1,352,061 1,320,016 1,227,619 1,144,485 1,040,822 1,081,676
Total business-type activities expenses 6,977,077 7,463,802 7,837,926 7,395,723 7,689,220 7,526,421 8,798,684
Total primary government expenses $ 40,429,586 $ 43,047,274 $ 46,296,081 $ 42,808,112 $ 49,321,529 $ 52,067,089 $ 54,941,192
Program Revenues (see Schedule 3)Governmental activities: Charges for services: General government $ - $ - $ 369,070 $ 693,390 $ 1,652,328 $ 352,691 $ 1,667,834 Public safety 969,066 796,674 829,237 1,024,589 514,552 1,682,637 1,587,339 Public works 4,926,535 6,186,410 7,202,653 4,607,579 3,853,232 3,281,415 2,436,899 Community development 18,338 31,892 5,564 284,119 3,161 - - Parks and recreation 223,745 272,792 283,326 317,006 364,681 500,951 434,508 Operating grants and contributions 3,777,768 7,269,731 7,714,006 7,368,051 5,178,618 10,674,374 5,612,899 Capital grants and contributions 4,183,094 32,559,483 575,179 1,648,244 1,703,546 186,401 1,432,067
Total governmental activities program revenues 14,098,546 47,116,982 16,979,035 15,942,978 13,270,118 16,678,469 13,171,546
Business-type activities: Charges for services: Water 6,599,015 6,614,089 6,503,052 5,833,964 7,861,420 9,759,112 10,014,463 Transit 4,571 4,617 23,956 11,663 20,073 5,427 13,208 Operating grants and contributions - - - - - - - Capital grants and contributions - - - 422,767 - - -
Total business-type activities program revenues 6,603,586 6,618,706 6,527,008 6,268,394 7,881,493 9,764,539 10,027,671
Total primary government program revenues $ 20,702,132 $ 53,735,688 $ 23,506,043 $ 22,211,372 $ 21,151,611 $ 26,443,008 $ 23,199,217
Net (Expenses)/RevenueGovernmental activities $ (19,353,963) $ 11,533,510 $ (21,479,120) $ (19,469,411) $ (28,362,191) $ (27,862,199) $ (32,970,962) Business-type activities (373,491) (845,096) (1,310,918) (1,127,329) 192,273 2,238,118 1,228,987
Total primary government net expense $ (19,727,454) $ 10,688,414 $ (22,790,038) $ (20,596,740) $ (28,169,918) $ (25,624,081) $ (31,741,975)
Fiscal Year
GASB 34 was implemented for the fiscal year ended June 30, 2003. Information prior to implementation of GASB 34 is not available. Source: City of Lynwood

City of Lynwood Changes in Net Assets – General Revenues
Last Seven Fiscal Years (accrual basis of accounting)
164
2003 2004 2005 2006 2007 2008 2009
General Revenues and Other Changes in Net AssetsGovernmental activities: Taxes Property taxes 9,658,238 7,696,553 10,205,679 13,831,194 18,209,991 17,801,044 19,303,986 Utility users tax 4,967,836 5,077,227 5,533,166 5,810,278 6,193,590 6,576,250 5,949,307 Franchise taxes 958,608 2,027,649 1,278,192 1,332,113 1,257,149 1,302,678 1,305,288 Sales taxes 4,384,013 3,075,281 3,198,615 3,247,091 3,688,238 5,401,170 4,391,476 Business license taxes 371,747 384,645 394,083 262,305 407,714 471,907 434,513 Other taxes 88,045 103,270 150,623 93,142 1,327,499 1,433,893 1,600,134 Unrestricted grants and contributions - - - - - - - Payments in lieu of taxes 4,170,468 3,315,792 474,591 1,738,552 540,103 361,087 - Investment earnings 943,852 671,926 1,354,489 1,897,716 2,176,869 1,402,738 638,296 Miscellaneous 1,585,936 591,230 219,998 488,886 1,118,246 239,172 1,250,614 Transfers (884,910) (718,944) 1,709,871 780,106 5,312,643 (346,792) (515,313) Gain/Loss of Capital Assets - - - - - - -
Total governmental activities 26,243,833 22,224,629 24,519,307 29,481,383 40,232,042 34,643,147 34,358,301
Business-type activities Investment earnings 196,708 112,551 313,212 551,608 607,504 159,515 182,418 Miscellaneous 4,061 3,566 3,363 - - - - Transfers 884,910 718,944 (1,709,871) (780,106) (5,312,643) 346,792 515,313
Total business-type activities 1,085,679 835,061 (1,393,296) (228,498) (4,705,139) 506,307 697,731
Total primary government $ 27,329,512 $ 23,059,690 $ 23,126,011 $ 29,252,885 $ 35,526,903 $ 35,149,454 $ 35,056,032
Change in Net AssetsGovernmental activities $ 6,894,870 $ 33,758,139 $ 3,040,187 $ 10,011,972 $ 12,703,331 $ 6,780,948 $ 2,443,121 Business-type activities 712,188 (10,035) (2,704,214) (1,355,827) (4,512,866) 2,744,425 1,269,827
Total primary government $ 7,607,058 $ 33,748,104 $ 335,973 $ 8,656,145 $ 8,190,465 $ 9,525,373 $ 3,712,948
Fiscal Year
GASB 34 was implemented for the fiscal year ended June 30, 2003. Information prior to implementation of GASB 34 is not available. Source: City of Lynwood

THIS PAGE LEFT INTENTIONALLY BLANK
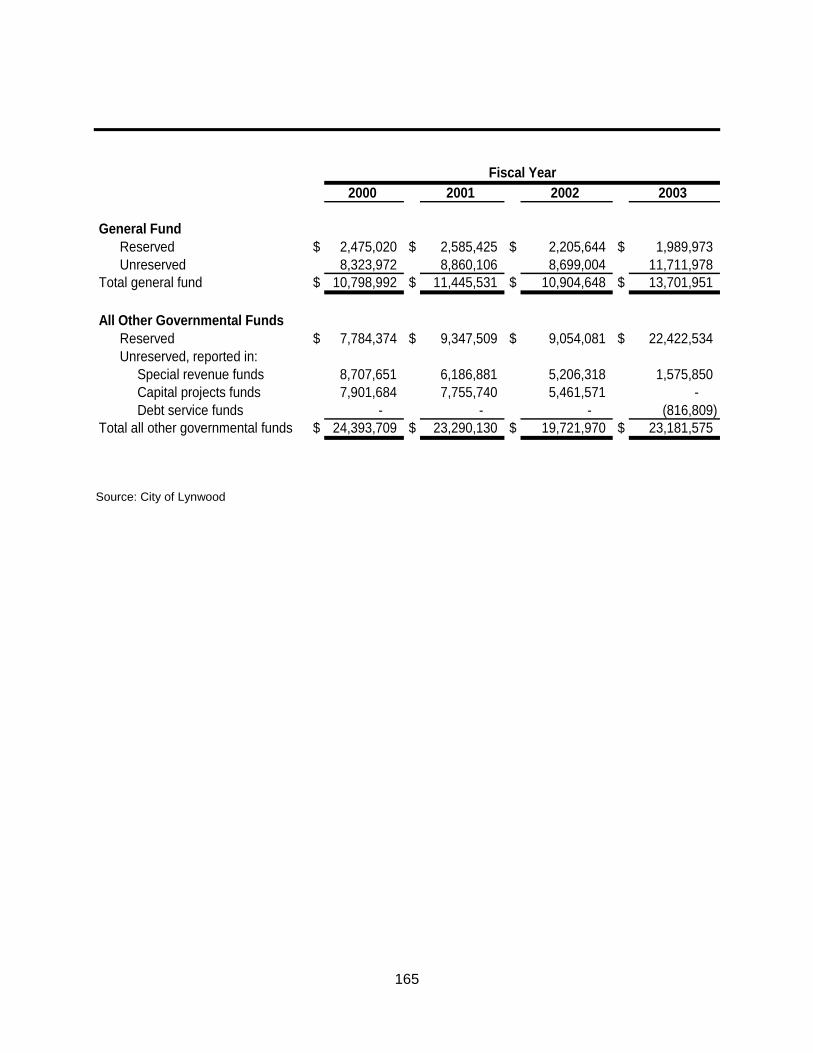
165
2000 2001 2002 2003
General Fund Reserved $ 2,475,020 $ 2,585,425 $ 2,205,644 $ 1,989,973 Unreserved 8,323,972 8,860,106 8,699,004 11,711,978Total general fund $ 10,798,992 $ 11,445,531 $ 10,904,648 $ 13,701,951
All Other Governmental Funds Reserved $ 7,784,374 $ 9,347,509 $ 9,054,081 $ 22,422,534 Unreserved, reported in: Special revenue funds 8,707,651 6,186,881 5,206,318 1,575,850 Capital projects funds 7,901,684 7,755,740 5,461,571 - Debt service funds - - - (816,809)Total all other governmental funds $ 24,393,709 $ 23,290,130 $ 19,721,970 $ 23,181,575
Fiscal Year
Source: City of Lynwood

City of Lynwood Fund Balances - Governmental Funds
Last Ten Fiscal Years (modified accrual basis of accounting)
166
2004 2005 2006 2007 2008 2009
$ 1,962,864 $ 1,628,825 $ 1,000,340 $ 1,412,294 $ 1,450,866 $ 164,45610,399,462 11,691,290 15,512,533 14,891,975 9,626,275 9,547,949
$ 12,362,326 $ 13,320,115 $ 16,512,873 $ 16,304,269 $ 11,077,141 $ 9,712,405
$ 54,423,105 $ 54,245,733 $ 26,536,539 $ 26,798,572 $ 17,632,454 $ 24,765,113
1,368,974 1,616,959 1,867,118 1,641,242 (388,455) 4,899,496(584,387) 225,465 1,005,908 (11,113) (37,030) (1,570,414)(195,031) - - - - -
$ 55,012,661 $ 56,088,157 $ 29,409,565 $ 28,428,701 $ 17,206,969 $ 28,094,195
Fiscal Year
Source: City of Lynwood
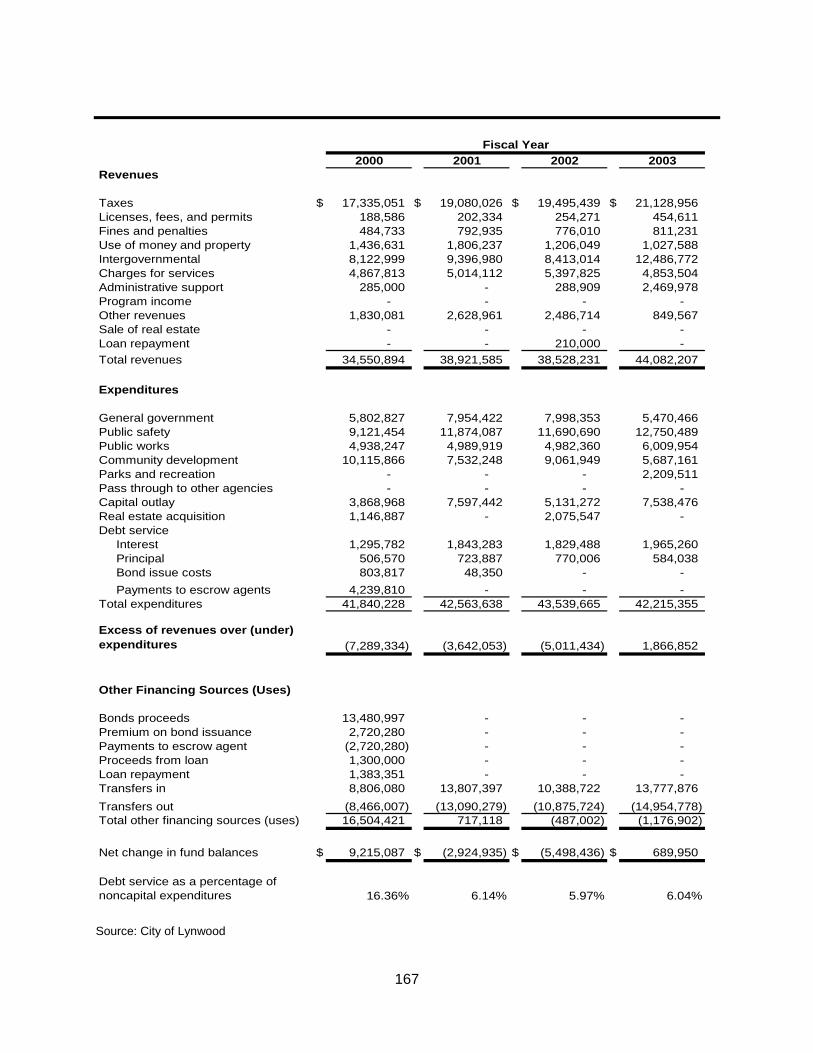
167
2000 2001 2002 2003Revenues
Taxes $ 17,335,051 $ 19,080,026 $ 19,495,439 $ 21,128,956 Licenses, fees, and permits 188,586 202,334 254,271 454,611 Fines and penalties 484,733 792,935 776,010 811,231 Use of money and property 1,436,631 1,806,237 1,206,049 1,027,588 Intergovernmental 8,122,999 9,396,980 8,413,014 12,486,772 Charges for services 4,867,813 5,014,112 5,397,825 4,853,504 Administrative support 285,000 - 288,909 2,469,978 Program income - - - - Other revenues 1,830,081 2,628,961 2,486,714 849,567 Sale of real estate - - - - Loan repayment - - 210,000 - Total revenues 34,550,894 38,921,585 38,528,231 44,082,207
Expenditures
General government 5,802,827 7,954,422 7,998,353 5,470,466 Public safety 9,121,454 11,874,087 11,690,690 12,750,489 Public works 4,938,247 4,989,919 4,982,360 6,009,954 Community development 10,115,866 7,532,248 9,061,949 5,687,161 Parks and recreation - - - 2,209,511 Pass through to other agencies - - - - Capital outlay 3,868,968 7,597,442 5,131,272 7,538,476 Real estate acquisition 1,146,887 - 2,075,547 - Debt service Interest 1,295,782 1,843,283 1,829,488 1,965,260 Principal 506,570 723,887 770,006 584,038 Bond issue costs 803,817 48,350 - - Payments to escrow agents 4,239,810 - - - Total expenditures 41,840,228 42,563,638 43,539,665 42,215,355
Excess of revenues over (under) expenditures (7,289,334) (3,642,053) (5,011,434) 1,866,852
Other Financing Sources (Uses)
Bonds proceeds 13,480,997 - - - Premium on bond issuance 2,720,280 - - - Payments to escrow agent (2,720,280) - - - Proceeds from loan 1,300,000 - - - Loan repayment 1,383,351 - - - Transfers in 8,806,080 13,807,397 10,388,722 13,777,876 Transfers out (8,466,007) (13,090,279) (10,875,724) (14,954,778) Total other financing sources (uses) 16,504,421 717,118 (487,002) (1,176,902)
Net change in fund balances $ 9,215,087 $ (2,924,935) $ (5,498,436) $ 689,950
Debt service as a percentage of noncapital expenditures 16.36% 6.14% 5.97% 6.04%
Fiscal Year
Source: City of Lynwood

City of Lynwood Changes in Fund Balances of Governmental Funds
Last Ten Fiscal Years (modified accrual basis of accounting)
168
2004 2005 2006 2007 2008 2009
$ 22,954,611 $ 26,978,169 $ 29,252,885 $ 31,084,181 $ 32,765,398 $ 32,425,069 502,598 607,075 639,142 646,340 354,853 915,469 796,674 893,895 1,007,352 1,175,169 1,187,753 1,160,199 639,696 3,347,760 2,137,438 2,176,869 1,481,300 638,296
40,526,204 6,322,206 7,299,319 6,247,098 9,401,941 6,925,831 3,732,973 3,106,996 3,338,468 4,285,276 3,840,333 3,712,006 2,416,859 1,476,834 3,228,043 3,060,251 1,310,366 1,208,409
- - - 267,585 49,273 45,966 278,324 451,571 135,177 1,456,338 660,694 769,658
- - - 833,480 - - - - - - - -
71,847,939 43,184,506 47,037,824 51,232,587 51,051,911 47,800,903
6,671,970 5,897,451 6,615,223 7,527,419 8,328,291 7,406,008 13,522,180 12,763,219 13,900,407 15,505,809 15,696,589 17,453,355 5,688,359 4,394,322 5,124,278 6,042,820 7,344,547 7,273,396 4,852,042 7,487,623 6,393,455 7,935,098 5,552,608 4,856,699 2,588,372 2,601,140 2,785,317 3,312,944 3,160,255 3,535,156
- - - - - 552,052 4,390,038 6,050,387 34,153,313 13,311,825 5,983,029 6,145,649
- - - - - -
1,934,549 2,017,357 2,207,102 1,174,979 1,335,594 1,596,989 440,438 1,122,553 975,682 1,826,207 1,768,237 2,079,713 351,369 - - - - -
- - - - - - 40,439,317 42,334,052 72,154,777 56,637,101 49,169,150 50,899,017
31,408,622 850,454 (25,116,953) (5,404,514) 1,882,761 (3,098,114)
8,630,000 - - - - - 74,214 - - - - -
(7,067,541) - - - - - - - - - - - - - - - - -
11,272,762 13,085,974 41,023,249 26,879,932 15,795,814 13,695,950 (13,173,740) (11,903,143) (40,493,902) (22,078,219) (20,565,918) (14,211,263)
(264,305) 1,182,831 529,347 4,801,713 (4,770,104) (515,313)
$ 31,144,317 $ 2,033,285 $ (24,587,606) $ (602,801) $ (2,887,343) $ (3,613,427)
6.74% 7.42% 4.41% 5.30% 6.31% 7.22%
Fiscal Year
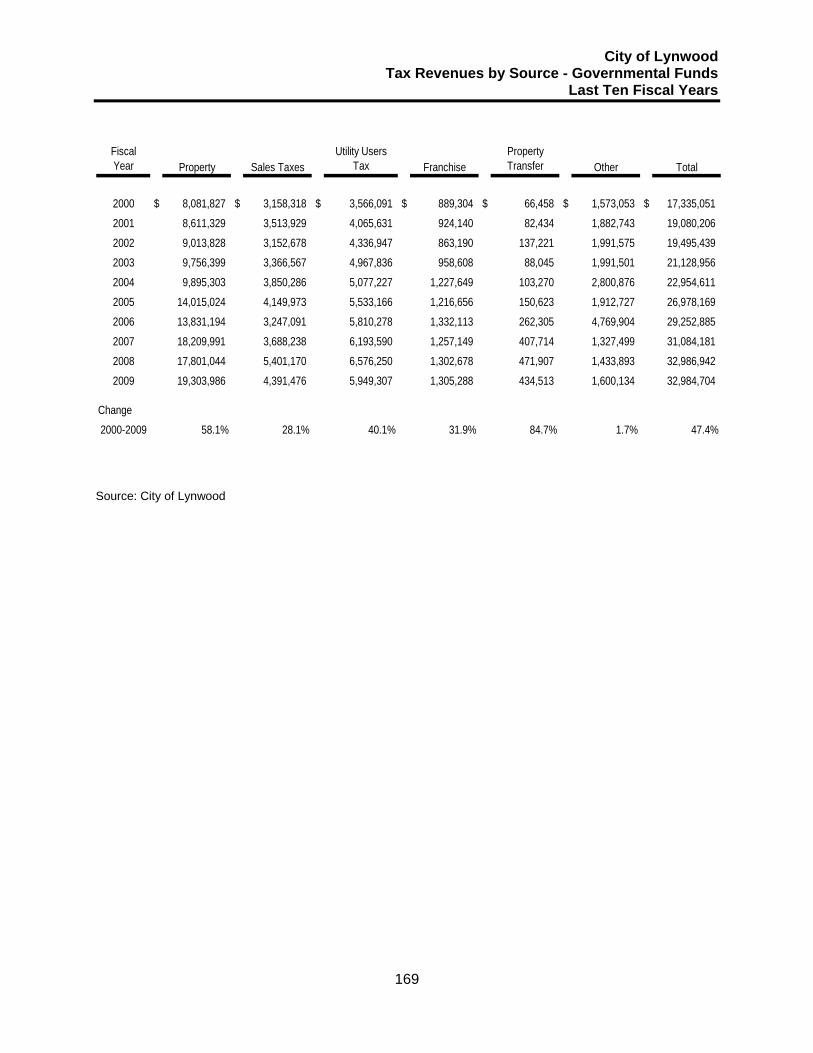
City of Lynwood Tax Revenues by Source - Governmental Funds
Last Ten Fiscal Years
169
Fiscal Year Property Sales Taxes
Utility UsersTax Franchise
PropertyTransfer Other Total
2000 $ 8,081,827 $ 3,158,318 $ 3,566,091 $ 889,304 $ 66,458 $ 1,573,053 $ 17,335,051
2001 8,611,329 3,513,929 4,065,631 924,140 82,434 1,882,743 19,080,206
2002 9,013,828 3,152,678 4,336,947 863,190 137,221 1,991,575 19,495,439
2003 9,756,399 3,366,567 4,967,836 958,608 88,045 1,991,501 21,128,956
2004 9,895,303 3,850,286 5,077,227 1,227,649 103,270 2,800,876 22,954,611
2005 14,015,024 4,149,973 5,533,166 1,216,656 150,623 1,912,727 26,978,169
2006 13,831,194 3,247,091 5,810,278 1,332,113 262,305 4,769,904 29,252,885
2007 18,209,991 3,688,238 6,193,590 1,257,149 407,714 1,327,499 31,084,181
2008 17,801,044 5,401,170 6,576,250 1,302,678 471,907 1,433,893 32,986,942
2009 19,303,986 4,391,476 5,949,307 1,305,288 434,513 1,600,134 32,984,704
Change
2000-2009 58.1% 28.1% 40.1% 31.9% 84.7% 1.7% 47.4%
Source: City of Lynwood

THIS PAGE LEFT INTENTIONALLY BLANK

170
2000 2001 2002 2003
Residential $ 1,082,038,556 $ 1,120,004,508 $ 1,175,340,933 $ 1,226,896,242
Commercial 152,406,985 154,492,760 158,893,529 167,814,148
Industrial 130,290,804 137,303,692 149,075,762 167,989,151
Government 219,730 30,000 33,600 38,822
Institutional 11,602,939 11,736,110 16,747,221 86,817,332
Miscellaneous 4,006,760 4,015,497 4,095,787 4,177,680
Recreational 303,747 309,818 316,011 448,517
Vacant Land 17,128,598 16,982,861 11,913,213 13,816,735
SBE Nonunitary 116,555 107,896 118,100 113,701
Possessory Int. 3,766,529 1,892,724 11,521,308 3,858,929
Unsecured 63,480,913 59,205,717 60,097,988 79,682,144
Less: Tax Exempt (14,814,132) (15,281,591) (14,610,159) (14,219,966)
Unknown - - - -
TOTALS 1,450,547,984 1,490,799,992 1,573,543,293 1,737,433,435
Total Direct Rate 0.63654% 0.39651% 0.38275% 0.42779%
Fiscal Year
Source: HDL, Coren Cole

City of Lynwood Assessed Value
Last Ten Fiscal Years
171
2004 2005 2006 2007 2008 2009
$ 1,310,009,169 $ 1,405,031,881 $ 1,548,641,607 $ 1,762,235,639 $ 1,963,305,319 $ 2,057,002,958
179,860,921 187,518,358 234,685,857 250,214,463 273,733,571 291,616,514
172,530,335 178,999,129 175,850,603 180,517,681 192,759,499 211,284,405
39,620 985,000 - - - -
17,108,202 17,251,962 14,856,434 14,503,805 21,072,234 21,610,145
280,487 32,194 32,835 1,440,488 1,469,295 1,498,674
202,485 206,264 210,388 284,668 290,360 296,166
15,349,735 26,096,792 20,682,997 23,696,736 25,022,230 26,945,416
907,822 902,410 906,787 831,966 729 717
3,937,652 3,893,265 4,199,252 4,601,816 4,262,361 4,376,567
76,819,836 76,884,821 78,080,903 79,689,348 82,205,276 83,586,372
(13,205,320) (18,979,457) (21,827,731) (27,645,498) (30,246,612) (29,585,217)
74,460 8,198,017 1,446,975 693,974 - 1,837,302
1,763,915,404 1,887,020,636 2,057,766,907 2,291,065,086 2,533,874,262 2,670,470,019
0.39575% 0.40396% 0.41059% 0.40357% 0.40563% 0.41042%
Fiscal Year

City of Lynwood Direct and Overlapping Property Tax Rates
Last Ten Fiscal Years (rate per $1,000 of assessed value)
172
City Direct Rate Overlapping Rates
FiscalYear
BasicRate
LynwoodSchoolDistrict
FloodControlDistrict
Los AngelesCounty
MetropolitanWater District
Compton Community
CollegeDistrict
2000 1.000000% 0.000000% 0.001765% 0.001422% 0.008900% 0.000000%2001 1.000000% 0.000089% 0.001552% 0.001314% 0.008800% 0.000000%2002 1.000000% 0.000104% 0.001073% 0.001128% 0.007700% 0.000000%2003 1.000000% 0.000000% 0.000881% 0.001033% 0.006700% 0.000000%2004 1.000000% 0.061331% 0.000462% 0.000992% 0.006100% 0.027143%2005 1.000000% 0.048275% 0.000049% 0.000795% 0.005200% 0.020514%2006 1.000000% 0.043175% 0.000052% 0.125000% 0.004700% 0.019747%2007 1.000000% 0.043175% 0.000052% 0.000663% 0.004700% 0.019747%2008 1.000000% 0.043700% 0.000000% 0.000000% 0.004500% 0.010410%2009 1.000000% 0.044979% 0.000000% 0.000000% 0.004300% 0.023940%
Source: Los Angeles County Auditor-Controller

City of Lynwood Principal Property Tax Payers
Current Year and Nine Years Ago
173
2000 2009
TaxpayerProperty Tax
Revenue RankAssessed Value of Taxable Property
Property Tax Revenue Rank
Assessed Value of Taxable Property
Placo Investment $ 260,797 1 $ 23,805,113 2700 East Imperial Highway Inc. 215,022 2 23,323,056 Lynwood Alameda Corporation $ 149,472 1 $ 16,208,938 162,289 3 21,222,970 Earl M. Jorgensen Company 90,733 6 8,367,201 161,461 4 16,682,248 St. Francis Medical Center Foundation 123,474 2 124,419,376 158,291 5 15,399,073 Albi Lynwood Investment LLC 154,000 6 15,911,355 OCB Restaurant Company LLC 149,180 7 19,508,700 Universal Molding Company 96,721 5 8,906,567 134,688 8 13,916,027 805 Propert LLC 108,616 9 11,222,274 Urban LLC 99,665 10 10,297,465 EMIF California Limited Partnership 113,495 3 8,665,994 McWhorter Inc. 112,836 4 12,236,078 Economic Resources Corporation 76,644 7 8,240,257 Rich Konto Inc. 62,051 8 5,714,000 Philadelphia Gear Corporation 59,163 9 5,448,076 Southern California Airgas 58,341 10 7,948,022
Top Ten Totals 942,930 206,154,509 1,604,009 171,288,281
City Totals 1,465,362,116 2,700,055,236
Source: HDL, Coren Cole

City of Lynwood Property Tax Levies and Collections
Last Ten Fiscal Years
174
FiscalYear Taxes Levied
Collected within theFiscal Year of the Levy Total Collections to Date
EndedJune 30
for theFiscal Year Amount
Percentageof Levy
Other Collections Amount
Percentageof Levy
2000 $ 1,305,930 $ 1,232,313 94.36% $ 252,934 $ 1,485,247 113.73%2001 1,320,000 1,264,308 95.78% 88,521 1,352,829 102.49%2002 1,381,070 1,312,567 95.04% 95,836 1,408,403 101.98%2003 1,435,563 1,478,210 102.97% 112,208 1,590,418 110.79%2004 1,529,632 1,446,731 94.58% 123,679 1,570,410 102.67%2005 1,628,787 1,121,313 68.84% 293,270 1,414,583 86.85%2006 1,785,744 1,335,441 74.78% 458,772 1,794,213 100.47%2007 2,016,965 1,874,289 92.93% 395,019 2,269,308 112.51%2008 2,234,886 2,113,315 94.56% 325,810 2,439,125 109.14%2009 2,340,660 2,113,570 90.30% 260,479 2,374,049 101.43%
NOTE: * Other Collections may include prior years delinquencies, interest and penalties, tax redemption, and supplemental taxes. Source: HDL Coren Cole City Finance Department

THIS PAGE LEFT INTENTIONALLY BLANK

175
2000 2001 2002 2003
Apparel Stores $ 4,676 $ 5,894 $ 8,136 $ 8,802
General Merchandise 1,827 1,804 1,718 1,790
Food Stores 33,439 32,998 29,854 29,592
Eating and Drinking Places 26,357 31,693 31,298 33,548
Building Materials 22,642 19,985 20,549 19,645
Auto Dealers and Supplies 15,473 18,602 18,854 22,152
Service Stations 27,974 36,636 39,619 38,684
Other Retail Stores 28,275 25,254 24,741 26,901
All Other Outlets 59,629 73,226 57,379 62,926
Total 220,292 246,092 232,148 244,040
Calendar Year
Source: HDL Coren Cole

City of Lynwood Taxable Sales by Category
Last Ten Calendar Years (in thousands of dollars)
176
2004 2005 2006 2007 2008 2009
$ 13,929 $ 14,044 $ 16,034 $ 16,388 $ 16,341 $ 14,828
2,721 3,563 3,473 3,489 3,398 3,412
29,227 30,347 30,061 31,200 30,747 31,433
41,165 48,432 51,306 56,074 57,267 55,839
22,480 28,314 31,626 32,968 32,302 25,362
25,043 27,342 30,389 28,974 22,668 15,206
45,527 50,409 55,558 61,236 62,998 66,665
30,818 34,018 42,677 47,940 49,939 48,446
56,384 71,441 76,733 75,022 88,214 89,604
267,294 307,910 337,857 353,291 363,874 350,795
Calendar Year

City of Lynwood Direct and Overlapping Sales Tax Rates
Last Ten Fiscal Years
177
Fiscal YearCity Direct
RateLos Angeles
County
2000 1% 1%
2001 1% 1%
2002 1% 1%
2003 1% 1%
2004 1% 1%
2005 1% 1%
2006 1% 1%
2007 1% 1%
2008 1% 1%
2009 1% 1%
Source: HDL Coren Cole

City of Lynwood Principal Sales Tax Remitters
Current Year and Nine Years Ago
178
2009 2000
Tax Remitter Business Category Tax Remitter Business CategoryAce Machine Shop Heavy Industrial Ahmed Union Services Service StationsAhmed Union Services Service Stations Airgas West Heavy IndustrialAirgas West Heavy Industrial Atlantic Chevron Service StationsArco Service Stations Auto Zone Automotive Supply StoresAuto Zone Automotive Supply Stores Earle M Jorgensen Heavy IndustrialChevron Service Stations Food 4 Less Grocery Stores LiquorChevron Service Stations G & M Oil Service Stations
CVS Pharmacy Drug StoresGoldenberg Plywood &Lumber Lumber/Building Materials
Del Steel Contractors Helen Grace Candies Candy/Nut Stores
Food 4 Less Grocery Stores LiquorImaging Supplies &Equip Business Services
J & S Union 76 Service Stations J & S Union 76 Service StationsJones Lumber Lumber/Building Materials Jones Lumber Lumber/Building MaterialsKing Taco Restaurants No Alcohol K Wantanabe Automotive Supply StoresLa Curacao Home Furnishings L B Foster Company Heavy IndustrialMcDonalds Restaurants No Alcohol McDonalds Restaurants No AlcoholRapid Gas Service Stations Oles Enterprises Used Automobile DealersRite Aid Drug Stores Pizza Hut Restaurants No AlcoholShell Service Stations Rapid Gas Service StationsSmart & Final Grocery Stores Liquor Rite Aid Drug StoresSuperior Super Warehouse Grocery Stores Liquor Shell Service StationsTJs Metal Contractors Staub Metals Light Industrial/Printers
Union 76 Service StationsSuperior SuperWarehouse Grocery Stores Liquor
Valu Plus Grocery Stores Liquor Taco Bell Restaurants No Alcohol
Verizon WirelessElectronics/ApplianceStores Union 76 Service Stations
Walgreens Drug Stores Valu Plus Grocery Stores Liquor
NOTE: California Law prohibits further detail. Source: HDL Coren Cole
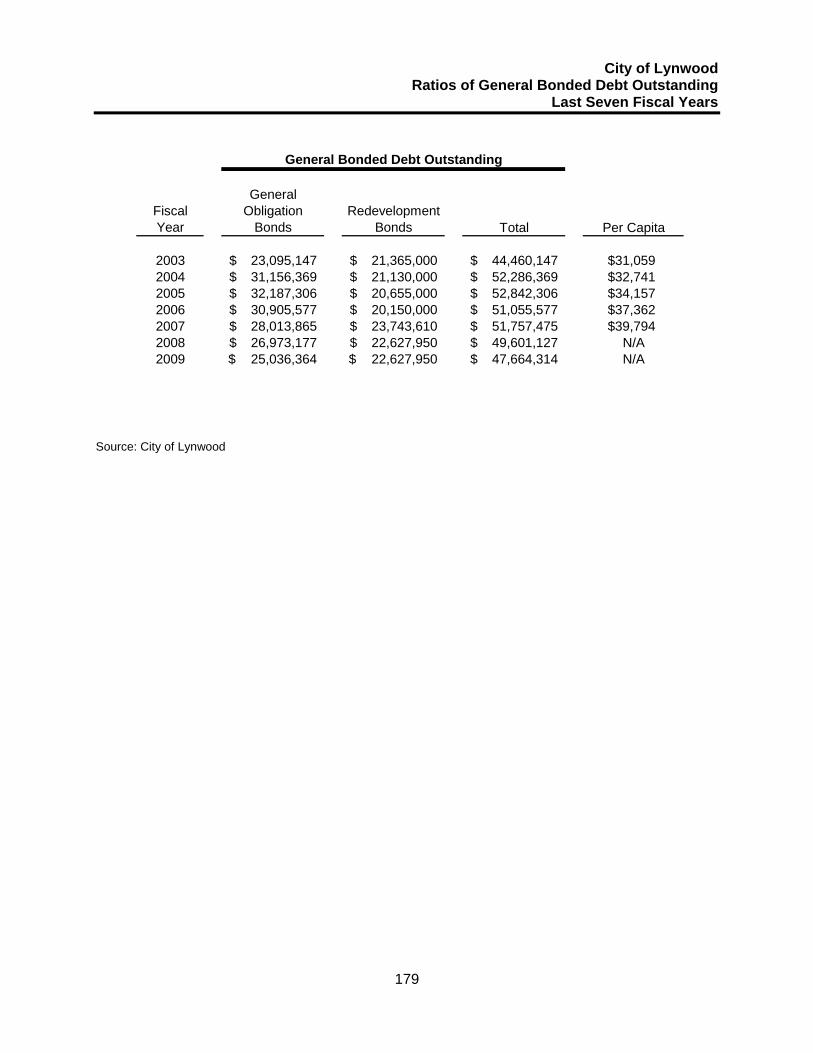
City of Lynwood Ratios of General Bonded Debt Outstanding
Last Seven Fiscal Years
179
General Bonded Debt Outstanding
FiscalYear
GeneralObligation
BondsRedevelopment
Bonds Total Per Capita
2003 23,095,147$ 21,365,000$ 44,460,147$ $31,0592004 31,156,369$ 21,130,000$ 52,286,369$ $32,7412005 32,187,306$ 20,655,000$ 52,842,306$ $34,1572006 30,905,577$ 20,150,000$ 51,055,577$ $37,3622007 28,013,865$ 23,743,610$ 51,757,475$ $39,7942008 26,973,177$ 22,627,950$ 49,601,127$ N/A2009 25,036,364$ 22,627,950$ 47,664,314$ N/A
Source: City of Lynwood

THIS PAGE LEFT INTENTIONALLY BLANK

180
Governmental Activities
FiscalYear
Tax Allocation
BondsHUD Loan Payable
Claims Payable
Revenue Bonds
Capital Leases Payable
Compensated Bonds
2000 $14,970,000 N/A $719,730 $11,235,000 $3,515,115 N/A
2001 $14,780,000 N/A $760,589 $7,621,000 $3,207,342 N/A
2002 $14,580,000 N/A $642,726 $10,760,000 $2,878,057 $875,562
2003 $14,365,000 $7,000,000 $668,914 $10,505,000 $2,566,301 $1,074,208
2004 $14,130,000 $7,000,000 $696,169 $12,390,000 $2,151,859 $1,438,271
2005 $13,880,000 $6,775,000 $2,876,572 $11,920,000 $1,753,372 $1,442,380
2006 $13,615,000 $6,535,000 $2,787,663 $11,445,000 $1,331,531 $1,149,901
2007 $13,325,000 $6,280,000 $3,503,418 10,965,000$ $946,716 $1,164,768
2008 $13,020,000 $6,010,000 $3,888,995 10,475,000$ $495,431 $1,550,429
2009 $12,690,000 $5,725,000 $3,567,839 $9,975,000 $170,956 $1,545,059
Source: City of Lynwood

City of Lynwood Ratios by Outstanding Debt by Type
Last Ten Fiscal Years
181
Business-type Activities
WaterRevenue
BondsCompensated
Absences
TotalPrimary
Government
Percentageof Personal
IncomeDebt PerCapita
$9,841,933 N/A $40,281,778 1.99% 0.17%
$9,629,666 N/A $35,998,597 1.69% 0.20%
$9,494,799 $84,271 $39,315,415 1.80% 0.18%
$9,354,932 $116,167 $45,650,522 2.02% 0.16%
$15,918,341 $155,473 $53,880,113 2.26% 0.14%
$15,637,362 $174,317 $54,459,003 2.19% 0.13%
$15,341,383 $202,830 $52,408,308 1.92% 0.14%
$15,035,404 $214,457 $51,434,763 1.77% 0.14%
$14,709,425 $245,152 $50,394,432 N/A 0.15%
$14,369,425 $289,845 $48,333,124 N/A 0.15%

City of Lynwood Direct and Overlapping Governmental Activities Debt
June 30, 2008
182
2008-09 Assessed Valuation: $2,700,055,236Redevelopment Incremental Valuation: 535,612,029Adjusted Assessed Valuation: $2,164,443,207
Overlapping Tax and Assessment Debt:Total Debt
6/30/09 % Applicable (1)City's Share of
Debt 6/30/09Los Angeles County Flood Control District $84,705,000 0.237% $200,751Metropolitan Water District $293,425,000 0.117% $343,307Compton Community College District $36,390,000 16.907% $6,152,457Los Angeles Community College District $2,408,605,000 0.001% $24,086Compton and Los Angles Unified School Districts $8,116,638,084 0.001% & 0.441% $391,006Lynwood Unified School District $18,784,801 97.552% $18,324,949Los Angeles County Regional Park and Open Space Assessment District $246,875,000 0.232% $572,750 TOTAL OVERLAPPING TAX AND ASSESSMENT DEBT $26,009,306
DIRECT AND OVERLAPPING GENERAL FUND DEBTLos Angeles County General Fund Obligations $928,941,195 0.232% $2,155,144Los Angeles County Pension Obligations $235,690,861 0.232% $546,803Los Angeles County Superintendent of Schools Certificates of Participation $15,904,264 0.232% $36,898Compton and Los Angeles Unified School District Certificates of Participation $491,096,710 0.001% & 0.441% $228,189Lynwood Unified School District Certificates of Participation $23,280,000 97.552% $22,710,106City of Lynwood General Fund Obligations $9,975,000 100% $9,975,000Los Angeles County Sanitation District No. 1 Authority $23,650,494 11.270% $2,665,411 TOTAL GROSS DIRECT AND OVERLAPPING GENERAL FUND DEBT $38,317,551 Less: Los Angeles Unified School District QZABs supported by investment fund $222 TOTAL NET DIRECT AND OVERLAPPING GENERAL FUND DEBT $38,317,329
GROSS COMBINED TOTAL DEBT $64,326,857 (2) NET COMBINED TOTAL DEBT $64,326,635
(1) Percentage of overlapping agency's assessed valuation located within boundaries of the city.(2) Excludes tax and revenue anticipation notes, enterprise revenue, mortgage revenue and tax allocation bonds and non-bonded capital lease obligations.
Ratios to 2008-09 Assessed Valuation:Total Overlapping Tax and Assessment Debt …………………0.96%
Ratios to Adjusted Assessed Valuation:Combined Direct Debt ($9,975,000)..…………………………0.46%Gross Combined Total Debt………………………….……….....2.97%Net Combined Total Debt…………………………………………2.97%
STATE SCHOOL BUILDING AID REPAYABLE AS OF 6/30/09: $0
Source: California Municipal Statistics
THIS PAGE LEFT INTENTIONALLY BLANK

183
2000 2001 2002 2003
Assessed Valuation 1,450,547,984$ 1,490,799,992$ 1,573,543,293$ 1,737,433,435$
Conversion percentage 25% 25% 25% 25%
Adjusted assessed valuation 362,636,996.00$ 372,699,998.00$ 393,385,823.25$ 434,358,358.75$
Debt limit percentage 15% 15% 15% 15%
Debt limit 54,395,549.40$ 55,904,999.70$ 59,007,873.49$ 65,153,753.81$
Total net debt applicable to the limit: General obligation bonds - - - -
Legal debt margin 54,395,549.40$ 55,904,999.70$ 59,007,873.49$ 65,153,753.81$
Fiscal Year
Source: County of Los Angeles Auditor-Controller

City of Lynwood Legal Debt Margin Information
Last Ten Fiscal Years
184
2004 2005 2006 2007 2008 2009
1,763,915,404$ 1,887,020,636$ 2,057,766,907$ 2,291,065,086$ 2,811,856,366$ 2,700,055,236$
25% 25% 25% 25% 25% 25%
440,978,851.00$ 471,755,159.00$ 514,441,726.75$ 572,766,271.50$ 702,964,091.50$ 675,013,809.00$
15% 15% 15% 15% 15% 15%
66,146,827.65$ 70,763,273.85$ 77,166,259.01$ 85,914,940.73$ 105,444,613.73$ 101,252,071.35$
- - - - - -
66,146,827.65$ 70,763,273.85$ 77,166,259.01$ 85,914,940.73$ 105,444,613.73$ 101,252,071.35$
Fiscal Year
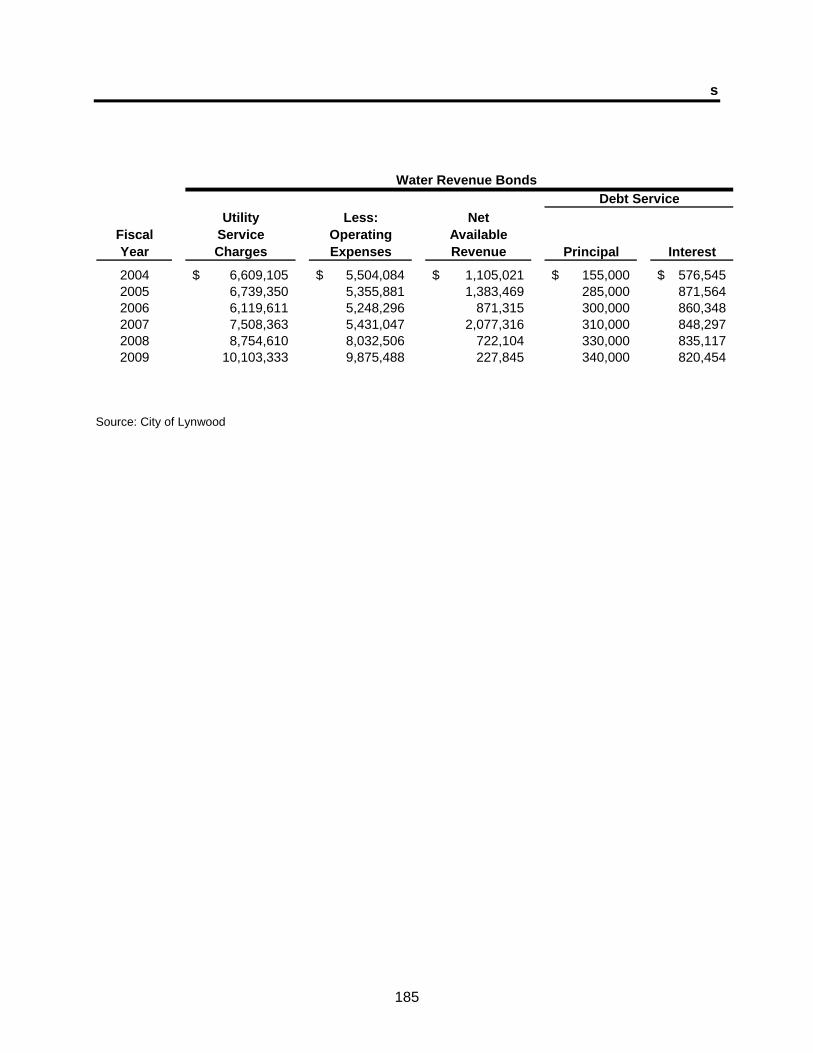
s
185
Water Revenue BondsDebt Service
FiscalYear
UtilityServiceCharges
Less:OperatingExpenses
Net AvailableRevenue Principal Interest
2004 6,609,105$ 5,504,084$ 1,105,021$ 155,000$ 576,545$ 2005 6,739,350 5,355,881 1,383,469 285,000 871,564 2006 6,119,611 5,248,296 871,315 300,000 860,348 2007 7,508,363 5,431,047 2,077,316 310,000 848,297 2008 8,754,610 8,032,506 722,104 330,000 835,117 2009 10,103,333 9,875,488 227,845 340,000 820,454
Source: City of Lynwood

City of Lynwood Pledged-Revenue Coverage
Last Five Fiscal Years
186
Public Finance Authority Revenue Bonds Tax Allocation Bonds Other DebtDebt Service Debt Service Debt Service
Principal Interest Principal Interest Principal Interest
270,000$ 615,538$ 235,000$ 886,870$ 414,442$ 497,754$ 470,000 565,678 250,000 869,997 623,487 473,144 475,000 556,195 265,000 852,012 661,841 444,608 480,000 545,490 290,000 832,242 702,821 410,967 490,000 533,775 305,000 810,664 721,285 378,481 500,000 519,910 330,000 787,552 621,678 412,400
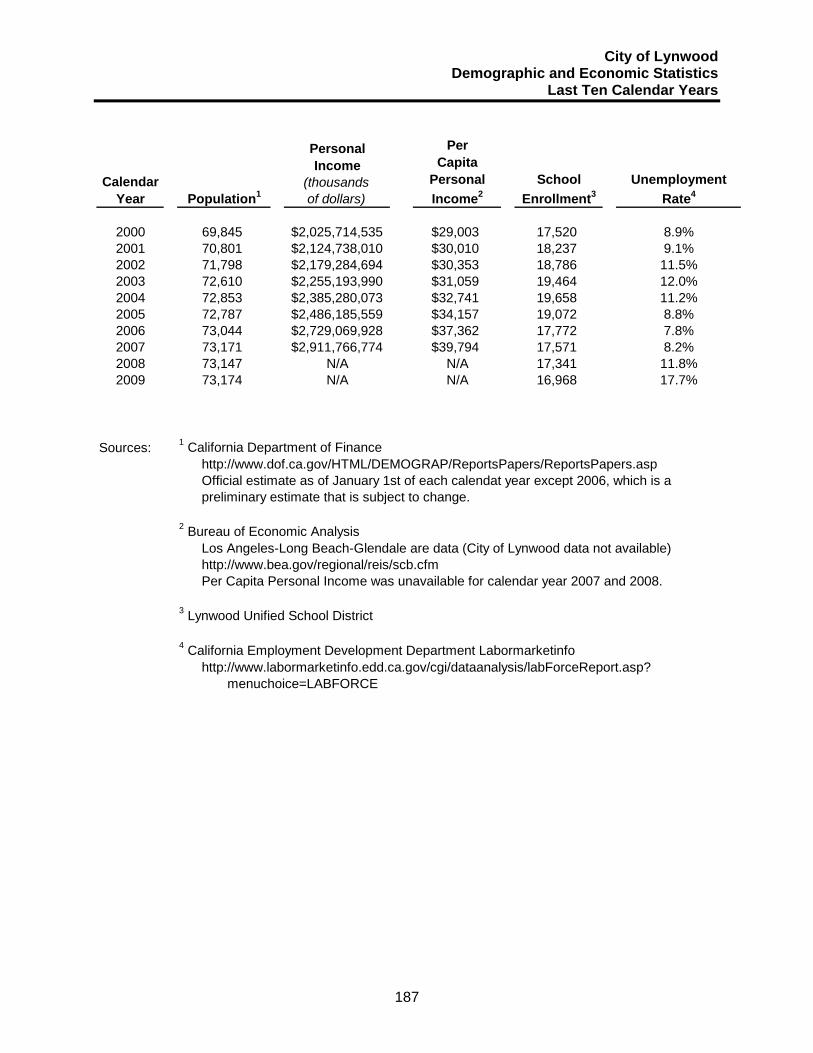
City of Lynwood Demographic and Economic Statistics
Last Ten Calendar Years
187
CalendarYear Population1
PersonalIncome
(thousandsof dollars)
PerCapita
PersonalIncome2
SchoolEnrollment3
UnemploymentRate4
2000 69,845 $2,025,714,535 $29,003 17,520 8.9%2001 70,801 $2,124,738,010 $30,010 18,237 9.1%2002 71,798 $2,179,284,694 $30,353 18,786 11.5%2003 72,610 $2,255,193,990 $31,059 19,464 12.0%2004 72,853 $2,385,280,073 $32,741 19,658 11.2%2005 72,787 $2,486,185,559 $34,157 19,072 8.8%2006 73,044 $2,729,069,928 $37,362 17,772 7.8%2007 73,171 $2,911,766,774 $39,794 17,571 8.2%2008 73,147 N/A N/A 17,341 11.8%2009 73,174 N/A N/A 16,968 17.7%
Sources: 1 California Department of Finance http://www.dof.ca.gov/HTML/DEMOGRAP/ReportsPapers/ReportsPapers.asp Official estimate as of January 1st of each calendat year except 2006, which is a preliminary estimate that is subject to change.
2 Bureau of Economic Analysis Los Angeles-Long Beach-Glendale are data (City of Lynwood data not available) http://www.bea.gov/regional/reis/scb.cfm Per Capita Personal Income was unavailable for calendar year 2007 and 2008.
3 Lynwood Unified School District
4 California Employment Development Department Labormarketinfo http://www.labormarketinfo.edd.ca.gov/cgi/dataanalysis/labForceReport.asp? menuchoice=LABFORCE

City of Lynwood Principal Employers
188
2007 2008 2009Employer Employees Rank Employees Rank Employees Rank
Superior Warehouse Grocers Inc. 196 1 190 1Jorgensen Earle M. Company 176 2Aaron Industries Inc. 140 2 150 3Country Villa Lynwood Health Care 85 9 120 4Marlinda Nursing Home 110 5Airgas West 89 8 96 3 96 6Universal Molding Co. Inc. 114 3 92 4 92 7Valu-Plus 87 5 87 8Marlinda West Nursing Homes 80 6 80 9Food 4 Less 76 7 76 10Jones Lumber 123 1McDonalds 83 10 102 2Perfect Fit Industries 65 8La Curacao 65 9West Tex Corporation 61 10DV Industries Inc. 109 4Elite Slides 103 5St. Francis Medical Center 100 6Midas Express (Los Angeles) Inc. 90 7
Source: Business License

City of Lynwood Full-time Equivalent City Government Employees by Function/Program
Last Ten Fiscal Years
189
2000 2001 2002 2003 2004 2005 2006 2007 2008 2009Function/Program
General Government City Council 5 5 5 5 5 12 12 12 7 2.5 City Manager 12 12 12 12 12 9 11 11 11 7 City Clerk 3 3 3 4 4 4 4 3 3 3.5 City Treasurer 1 1 2 2 2 2 2 2 1.5 1.5 Finance & Administration 22 22 24 41 41 25 26 24 23.5 23.5 Human Resources 6 6 6 6 6 18 19 20 13.5 11.5 Public Works 102 104 96 102 102 62 72 68 68 55.5 Redevelopment 19 19 15 12 12 7 7 11 11 9 Development Services 0 0 16 23 23 19 20 23 21 17.5 Neighborhood Services 0 0 0 0 0 40 40 40 39.5 38 Parks and Recreation 138 144 95 100 100 87 105 101 58 59.5
Full-time Equivalent Employees as of June 30
Source: City of Lynwood

City of Lynwood Operating Indicators by Function/Program
Last Four Fiscal Years
190
2006 2007 2008 2009
Function / Program
General government Building permits issued 2,100 3,600 2,182 1,570 Building inspections conducted 6,300 1,560 5,325 3,794Sheriff Physical arrests 2,251 2,397 3,782 4344Fire Emergency responses 4,716 3,062 3,654 3458 Fires extinguished 273 200 168 157 Inspections 830 1,579 1,135 1728Refuse collection Refuse collected (tons per day) 228 153 75 63 Recyclables collected (tons per day) 94 56 65 41Other public works Potholes repaired 73,000 12,000 15,800 5800Water Water main breaks 4 7 6 8 Average daily consumption (thousands of gallons) 5,660 5,500 5,640 5,600
Fiscal Year
Source: City of Lynwood

City of Lynwood Capital Asset Statistics by Function/Program
Last Five Fiscal Years
191
2005 2006 2007 2008 2009Function/Program
Sheriff Stations 1 1 1 1 1 Zone offices 0 0 0 0 0 Patrol units 0 0 17 23 24Fire Stations 2 2 2 2 2Other public works Streets (miles) 85 85 90 90 90 Streetlights 2,300 2,300 2,300 2,300 4175Parks and recreation Acreage 35 35 35 39* 39* Playgrounds 6 6 6 5 5 Baseball/softball diamonds 3 3 3 4 4 Soccer/football fields 2 2 2 3 3 Community Centers 2 2 3 3 3Water Water mains (miles) 85 85 90 90 90 Fire hydrants 1,100 1,100 1,100 1,100 1,100 Storage capacity (thousands of gallons) 3,000 3,000 3,000 3,000 3,000Wastewater Sanitary sewers (miles) 81 81 81 81 82 Storm sewers (miles) 2 2 2 2 2
* Note total park acreage does include the addition of Ham Park, Rose Park, and Lynwood Meadows Park.
Fiscal Year
Source: City of Lynwood