comprehensive annual financial report - …docs.southbendin.gov/weblink/0/edoc/113073/2016...
TRANSCRIPT

CITY OF SOUTH BEND
COMPREHENSIVE ANNUAL FINANCIAL REPORT
CITY OF SOUTH BEND, INDIANAPete Buttigieg, Mayor
John Murphy, City ControllerJennifer Hockenhull, Deputy City Controller
REPORT PREPARED BY THE CITY OF SOUTH BEND DEPARTMENT OF ADMINISTRATION AND FINANCE
FISCAL YEAR ENDING ON DECEMBER 31, 2016

City of South Bend, Indiana
Contents
Introductory Section
City Officials i
Controller's Letter of Transmittal ii-xi
Certificate of Achievement for Excellence in Financial Reporting xii
Organization Chart xiii
Financial Section
Report Letter 1-3
Management's Discussion and Analysis 4-28
Basic Financial Statements
Government-wide Financial Statements:Statement of Net Position 29-30Statement of Activities 31-32
Fund Financial Statements:Governmental Funds:
Balance Sheet 33-34Reconciliation of the Balance Sheet to the Statement of Net Position 35Statement of Revenue, Expenditures, and Changes in Fund Balances 36-37Reconciliation of the Statement of Revenue, Expenditures,
and Changes in Fund Balances of Governmental Fundsto the Statement of Activities 38
Proprietary Funds:Statement of Net Position 39-40Statement of Revenue, Expenses, and Changes in Net Position 41Statement of Cash Flows 42-43
Fiduciary Funds:Statement of Fiduciary Net Position 44Statement of Changes in Fiduciary Net Position 45
Notes to Financial Statements 46-103

City of South Bend, Indiana
Contents (Continued)
Required Supplemental Information 104
1925 Police Officers' Pension Plan:Schedule of Investment Returns 105Schedule of City Contributions 106Schedule of Changes in the City Net Pension Liability and Related Ratios 107
1937 Firefighters' Pension Plan:Schedule of Investment Returns 108Schedule of City Contributions 109Schedule of Changes in the City Net Pension Liability and Related Ratios 110
OPEB System Schedule 111
Public Employees' Retirement Fund:Schedule of City Contributions 112Schedule of the City's Proportionate Share of the Net Pension Liability 113
1977 Police Officers' Pension and Disability FundSchedule of City Contributions 114Schedule of the City's Proportionate Share of the Net Pension Liability 115
1977 Firefighters' Pension and Disability FundSchedule of City Contributions 116Schedule of the City's Proportionate Share of the Net Pension Liability 117
Budgetary Comparison Schedules - General Fund and Major Special RevenueFunds:
General Fund 118-120Park and Recreation Fund 121Public Safety LOIT Fund 122COIT Fund 123EDIT Fund 124Rainy Day Fund 125
Budget/GAAP Reconciliation 126
Notes to Required Supplemental Information 127-128

City of South Bend, Indiana
Contents (Continued)
Other Supplemental Information 129
Fund Descriptions 130-135Combining Balance Sheet 136-147Combining Statement of Revenue, Expenditures, and Changes in Fund Balances 148-159Schedules of Revenue, Expenditures, and Changes in Fund Balances - Budget
and Actual 160-218
Nonmajor Enterprise Funds:Fund Descriptions 219Combining Statement of Net Position 220Combining Statement of Revenue, Expenses, and Changes in Net Position 221Combining Statement of Cash Flows 222-223
Internal Service Funds:Fund Descriptions 224Combining Statement of Net Position 225Combining Statement of Revenue, Expenses, and Changes in Net Position 226Combining Statement of Cash Flows 227-228
Fiduciary Funds:Fund Descriptions 229Statement of Assets and Liabilities 230Combining Statement of Changes in Fiduciary Net Position 231Statement of Changes in Assets and Liabilities 232

City of South Bend, Indiana
Contents (Continued)
Statistical Section
Financial Trend Information:Net Position by Component 233Changes in Net Position 234-236Fund Balances - Governmental Funds 237Changes in Fund Balances - Governmental Funds 238
Revenue Capacity Information:Property Tax Levies and Collections 239Direct and Overlapping Property Tax Rates 240Detail of Net Assessed Valuation 241Assessed Value and Actual Value of Taxable Property 242Net Assessed Value of Taxable Property 243Assessed Value of Taxable Property 244Property Tax Collections - Cash Basis 2452016 Circut Breaker Property Tax Cap Credits 246Principal Property Taxpayers 247Local Option Income Tax Revenue (CEDIT) 248Local Option Income Tax Revenue (COIT) 249Local Option Income Tax Revenue (PS LOIT) 250Total County Income Tax Distributions by Taxing Unit 251Ten Largest Water Customers 252Ten Largest Sewage Works Customers 253Gasoline Tax Collections - Cash Basis 254Wheel and Excise Surtax Collections - Cash Basis 255Hotel/Motel Tax Revenue - Cash Basis - City Distributions 256Professional Sports Development (PSDA) Tax - Cash Basis 257Cable Television Franchise Fee Collections - Cash Basis 258
Debt Capacity Information:Computation of Legal Debt Margin 259Legal Debt Margin Information 260Ratios of Outstanding Debt by Type 261Computation of Direct and Overlapping Debt 262Ratio of Annual Debt Service Expenditures for General Obligation Bonded
Debt to Total General Government Expenditures 263Ratio of Net General Obligation Bonded Debt to Assessed Value and Net
Bonded Debt Per Capita 264St. Joseph County Hotel/Motel Tax Board Statement of Estimated Cash Flow
and Debt Service Coverage 265Schedule of Revenue Bond Coverage - Water Utility Bonds 266Schedule of Revenue Bond Coverage - Wastewater Utility Bonds 267Municipal Sewage Works Annual Wastewater Flow Data and Number of
Customers 268

City of South Bend, Indiana
Contents (Continued)
Statement of City-Owned Utility Debt 269Estimated Debt Service Coverage Calculation of Sewage Works 270Estimated Debt Service Coverage Calculation of Water Utility 271Projected City of South Bend COIT Revenue 272Projected City of South Bend CEDIT Revenue 273Projected City of South Bend LOIT Revenue 274Statement of Estimated Cash Flow and Debt Service Coverage (COIT) 275Statement of Estimated Cash Flow and Debt Service Coverage (CEDIT) 276Estimated Tax Increment Revenue - Erskine Village Project 277
Demographic and Economic Information:Demographic Statistics 278-279Employment by Type and Industry 280Comparison of Growth Rates in Personal Income for St. Joseph County, the
State of Indiana, and U.S. Personal Income 281Principal Employers 282
Operating Information:Operating Indicators by Function/Program 283Capital Asset and Infrastructure Statistics by Function/Program 284New Construction - Number of Permits and Property Values 285Full-Time City Government Employees by Department 286-287Salary Rate Comparison 288Insurance Coverage 289Financial Institutions 290Miscellaneous Statistics 291-292

CITY OFFICIALS
Office Official Term Mayor Pete Buttigieg 01-01-16 to 12-31-19 Controller John Murphy 01-01-16 to 12-31-16 City Clerk Kareemah Fowler 01-01-16 to 12-31-19 President of the Board of Public Works Gary A. Gilot 01-01-12 to 12-31-16 Common Council Members 1st District Tim Scott 01-01-16 to 12-31-19 2nd District Regina Williams-Preston 01-01-16 to 12-31-19 3rd District Randy Kelly 01-01-16 to 12-31-19 4th District Jo M. Borden 01-01-16 to 12-31-19
5th District David Varner 01-01-16 to 12-31-19 6th District Oliver Davis 01-01-16 to 12-31-19 At Large Karen L. White 01-01-16 to 12-31-19 At Large John Voorde 01-01-16 to 12-31-19 At Large Gavin Ferlic 01-01-16 to 12-31-19
i

1200N COUNTY-CITY BUILDING PHONE 574/ 235-7678 227 W. JEFFERSON BLVD. FAX 574/ 235-9928 SOUTH BEND, INDIANA 46601-1830
ii
CITY OF SOUTH BEND PETE BUTTIGIEG, MAYOR
DEPARTMENT OF ADMINISTRATION AND FINANCE June 30, 2017
The Honorable Pete Buttigieg, Mayor of the City of South Bend Members of the City of South Bend Common Council Residents of the City of South Bend: The comprehensive annual financial report of the City of South Bend, Indiana (the "City") for the year ended December 31, 2016 is hereby submitted. Responsibility for both the accuracy of the data and the completeness and fairness of the presentation, including all disclosures, rests with management. To the best of our knowledge and belief, the enclosed data is accurate in all material respects and is reported in a manner designed to present fairly the financial position and results of operations of the various funds of the City. All disclosures necessary to enable the reader to gain an understanding of the government’s financial activities are included. Generally Accepted Accounting Principles (GAAP) requires that management provide a narrative introduction, overview and analysis to accompany the basic financial statements in the form of the Management’s Discussion and Analysis (MD&A). This letter of transmittal is designed to complement the MD&A and should be read in conjunction with it. The City of South Bend’s MD&A can be found immediately following the independent auditors’ report. The Comprehensive Annual Financial Report is presented in four sections: introductory information, financial information, statistical information and federal compliance information. The introductory section includes this transmittal letter, the City’s organizational chart, a list of principal City officials and the Certificate of Achievement for Excellence in Financial Reporting awarded to the City of South Bend for the year ending December 31, 2015. The financial section begins with the independent auditors’ report on the City’s financial statements and schedules, the City managements’ discussion and analysis report, followed by the City’s basic financial statements and accompanying notes. The remaining portion of this section includes the combining and individual fund and other financial statements and schedules. The statistical section includes selected financial and demographic information generally presented on a multi-year basis, which has been provided to give the reader a broader understanding of the City. The federal awards compliance section, which includes the results of the supplemental audit of the City’s federal awards and the internal controls necessary for compliance, is included in a separate report. The City is required to undergo an annual single audit in conformity with the provisions of the U.S. Office of Management and Budget Circular A-133, Audits of States, Local Governments and Non-Profit Organizations, the provisions of Indiana Code section 5-11-1-9 and the requirements of the Indiana State Board of Accounts. Information related to the single audit, including the schedule of federal financial assistance, findings and recommendations, and the auditors’ reports on the internal control structure and compliance with applicable laws and regulations, is included in a separate report.

iii
The following pages of this transmittal letter begin with a general overview of South Bend and the surrounding area. Also summarized are the key financial, budgetary and property tax controls with which the City is required to comply. The remainder includes a discussion of the prior year’s financial challenges and accomplishments, the City’s goals and objectives for this year and beyond and other key issues the City is facing along with the impact they may have on current and future budgets.
GENERAL INFORMATION The City of South Bend is the county seat of St. Joseph County, Indiana, and is the fourth largest city in the state. The City of South Bend’s 2010 U.S. Bureau of the Census population was 101,168. Accordingly, South Bend is classified as a “City of the Second Class” under Indiana statutes (cities with a population of 35,000 to 250,000). Population estimates in 2016 suggest that the city experienced its largest one-year increase in nearly a quarter-century, pointing the way to further growth before the 2020 census. The City of South Bend operates with a mayor as chief executive and a nine-member City Common Council composed of six members elected from districts and three members elected at-large. The City of South Bend has a bond rating of AA with Standards & Poors, one of the highest bond ratings for any city in the State of Indiana. The City provides a full range of traditional general governmental services to its residents. These services include police and fire protection; sanitation services; the construction and maintenance of highways, streets and infrastructure; recreational activities and cultural events. In addition to general governmental activities, the City exercises oversight over the South Bend Water Works, the South Bend Wastewater Treatment Facility, the Century Center Convention Center, the Morris Performing Arts Center, the Studebaker National Museum, the City of South Bend Redevelopment Commission and Authority, and several downtown parking facilities. Location St. Joseph County lies within the heartland of the manufacturing belt and metropolitan regions of the Upper Midwest and Canada. The City of South Bend is located in the north central part of Indiana, ten miles south of the Michigan state line, and is commonly known to be within the South Bend/Elkhart region. The region is a vibrant and diverse area with a strong economy based on a mix of health care, agricultural, service, manufacturing, education and other commercial and tourism industries. This diverse economic mix creates varied employment opportunities for the area’s residents while providing insulation via diversification from future economic downturns. The city is approximately 90 miles east of Chicago and 140 miles north of Indianapolis. Accessibility to transportation, including Interstate 80/90, an international airport (which is the second busiest in the State of Indiana) and the South Shore Line has supported economic growth within the community. Proximity to Chicago, the largest rail and intermodal (rail/truck/ocean/inland waterway) transfer point in the country, is a significant advantage to the City of South Bend as is proximity to the University of Notre Dame with its scenic campus located adjacent to the city limits. In 2017, the City of South Bend announced plans to partner with the Federal, State and other local governments to reduce the South Shore Line travel time to downtown Chicago to 90 minutes or less by the year 2020. When completed, this project will be transformative to the local economy.

iv
St. Joseph County / South Bend - Economic Conditions and Outlook St. Joseph County, with its 2010 U.S. Bureau of the Census population of 266,931, boasts a strong history of manufacturing which continues today. The service industry and retail trade have also flourished, creating a balance that serves the community well. The County experienced a net growth in population of 28,317 (11.8% increase) between 1960 and 2010. After experiencing a reduction of 2.6% during 1969 to 1983, at which time the entire Midwest was at the depth of its economic restructuring and recess, the County’s population increased 4.0% between 1983 and 1990 and another 7.5% between 1990 and 2000. The population of St. Joseph County has remained fairly flat during the past decade increasing by only 1,372 residents from 2000 to 2010. The estimated labor force in St. Joseph County is 130,912 workers (2015, STATS Indiana, using data from the Indiana Department of Workforce Development). The workers are typical of the Midwest: well-trained with a strong work ethic. Approximately 88.4% of the area’s adult population are high school graduates or higher (as compared to the national average of 75%) with an estimated 27.2% with a Bachelor’s Degree or higher. There are ten colleges, universities and technical schools within South Bend and the surrounding area including the University of Notre Dame; Indiana University South Bend; Bethel College; Saint Mary’s College; Purdue University College of Technology at South Bend; Holy Cross College; Trine University South Bend; American National University; ITT Technical Institute; and Ivy Tech Community College. As of November 2016, St. Joseph County is experiencing an unemployment rate of 4.2%, which is slightly higher than the State of Indiana unemployment rate of 3.9%. The unemployment rate in St. Joseph County is somewhat similar than some of its surrounding counties—Elkhart (3.3%), LaPorte (5.1%), and Marshall (3.3%) in Indiana and Cass (4.3%) and Berrien (4.4%) in Michigan (as of November 2016). The employment profile for St. Joseph County provides a good overview of the economic make-up of this community. Employment estimates for the County’s major economic sectors are as follows (US Census Bureau 2011-2015 American Community Survey 5-Year Estimates Civilian Employed Population): Economic Sector Number Employed % of Total Educational Services, Healthcare, Social Assistance 34,474 28.0% Manufacturing 21,440 17.4% Retail Trade 13,845 11.2% Arts, Entertainment, Recreation, Accommodation, 11,135 9.0% Food Services Professional, Scientific, Management, Administrative, 10,216 8.3% Waste Management Services Finance and Insurance, Real Estate, Rentals, Leasing 6,412 5.2% Construction 5,732 4.7% Other Services, except Public Administration 5,533 4.5% Transportation and Warehousing, and Utilities 4,702 3.8% Public Administration 3,503 2.9% Wholesale Trade 3,444 2.8% Information 2,210 1.8% Agriculture, Forestry, Fishing, Hunting, Mining 524 0.4% Total 123,170 100.0%

v
St. Joseph County presently has an estimated 102,005 households with an average per capita personal income of $43,040, which compares to the State of Indiana average per capita personal income of $41,940 and the United States per capita personal income of $56,430. The per capita income in St. Joseph County compares favorably with most of its surrounding counties—Elkhart ($39,882), La Porte ($37,827), and Marshall ($36,958) in Indiana and Cass ($19,474) and Berrien ($24,304) in Michigan.
Health and education lead the employment statistics for St. Joseph County. The largest employers in St. Joseph County as of August 2015 were as follows: University of Notre Dame (5,802); Beacon Health Systems (4,683); South Bend Community School Corporation (3,615); St. Joseph Health Systems (2,626); Indiana University – South Bend (1,277); City of South Bend (1,139); St. Joseph County (1,068); AM General (800); Honeywell Aerospace (700); and Press Ganey (694).
The following provides a profile of the residents of St. Joseph County (US Census Bureau 2011-2015 American Community Survey 5-Year):
Gender %, male/female: 48.4% male; 51.6% female Age: 24.1% under 19
11.2% 19-24 years of age 24.8% 25-44 years of age 25.9% 45-64 years of age 14.0% 65 years of age and older
Race: 74.4% White 12.8% Black/African American 8.0% Hispanic/Latino 2.0% Asian 2.8% Other
Home Ownership: 68.5% own; 31.5% rent/other
The cost of living continues to be one of the greatest advantages of living in this community. The housing costs in South Bend are well below the national and regional averages. Per a report compiled by the National Association of Realtors in the third quarter of 2016, the median sales price for a single family home in the South Bend-Mishawaka Statistical Area was $128,500 as compared to a median sales price of $244,100 in Chicago and $164,100 in Indianapolis. The national median sales price is $240,900.
Between January 2015 and June 2016 the City of South Bend has seen approximately $192,148,376 in private investment and the announcement of roughly 939 jobs. By providing state of the art innovative infrastructure and, in some cases, offering targeted assistance the City can stimulate private investment, creating business opportunities and jobs. The City has had many significant economic development projects to include new downtown residential housing, mixed use developments, downtown hotels, and high tech industrial projects. A highlight of 2016 is the implementation of the Smart Streets project with downtown streets undergoing construction. City investments like these encourage new start-up businesses, strengthen existing business, attract new jobs, increase assessed value and emphasize direct investment in hard-to-develop areas. Efforts have been and will continue to focus on implementing the comprehensive plans for our neighborhood and downtown areas.

vi
The South Bend Community School Corporation serves the entire City and some of the surrounding area and has a current enrollment of approximately 18,680 students in grades pre-kindergarten through 12. An estimated 5,367 students attend private or parochial schools within the City. The ten institutions of higher education and technical training located within the South Bend area have a total enrollment of approximately 31,000. Over the years, the University of Notre Dame has provided a stabilizing influence on the economy with a very significant positive economic impact upon the community. South Bend History and Amenities In 1820, Pierre Navarre of the American Fur Trading Company was the first settler in the area to become later known as South Bend. South Bend has continued to progress in its growth since 1842 when Father Edward Sorin named his rustic log chapel “Notre Dame du Lac” and began to teach the local Indians. Today the chapel has grown into the University of Notre Dame. In 1852, H.C. Studebaker started the industry of making wagons and horse-drawn buggies that evolved into the manufacturing of the Studebaker automobile. It made the name Studebaker synonymous with the area of South Bend and its major employer until its closure in 1963. Another industrial firm that would later become the area’s largest began in 1923 when Vincent Bendix began manufacturing automotive brakes. In 1929, the company became the Bendix Aviation Corporation, and now, as Honeywell (formerly AlliedSignal Inc.), is a leading manufacturer of automotive and aerospace products. The Singer Sewing Company and the Oliver Chilled Plow Works were other important companies during the early history of South Bend. In the 1840s and 1850s, many South Bend residents were secretly involved in helping fugitive slaves escape from the South through the Underground Railroad. Many residents of South Bend and St. Joseph County offered their homes, barns and businesses up as “stations” or safe places in which runaways could eat and rest as they made their way North. Most notable among local Underground Railroad conductors was James Washington, a well-known and well-respected free Black in South Bend. Mr. Washington was a barber who, along with Mr. Sawyer, collected money from local citizens to fund the Underground Railroad. Special attractions within the South Bend area include the Olympic-class East Race Waterway and the East Bank area; the renovated Morris Performing Arts Center, which provides for the Broadway Theater League, the South Bend Symphony Orchestra with the Chamber and Pops Orchestras, and the Southold Dance Theater and Patchwork Dance Company; the award-winning South Bend Civic Theater; the Studebaker National Museum; the South Bend Museum of Art; the Snite Museum of Art at Notre Dame; the Northern Indiana Center for History; Copshaholm/The Oliver Mansion; Century Center; Potawatomi Zoo; the Morris Conservatory/Muessel-Ellison Tropical Gardens; Healthworks! Kids Museum; the Farmers’ Market; and the Byers Softball Complex. The Four Winds Field Baseball Stadium is a 5,600-seat facility which opened in 1987 and is rated among the best in minor league baseball. The stadium is home to the South Bend Cubs, a minor league team affiliated with the Chicago Cubs. Additional miscellaneous information about the City of South Bend can be found in the statistical section of this report.

vii
Financial, Budgetary and Property Tax Controls The City’s management team is responsible for establishing and maintaining an internal control structure designed to ensure that the assets of the government are protected from loss, theft or misuse and to ensure that adequate accounting data is compiled to allow for the preparation of financial statements in conformity with generally accepted accounting principles. The internal control structure is designed to provide reasonable, but not absolute, assurance that these objectives are met. The concept of reasonable assurance recognizes that: (1) the cost of a control should not exceed the benefits likely to be derived; and (2) the valuation of costs and benefits requires estimates and judgments by management. On November 28, 2016, the South Bend Common Council approved a new Internal Controls policy for the City. Single Audit. As a recipient of federal and state financial assistance, the City is also responsible for ensuring that an adequate internal control structure is in place to ensure compliance with applicable laws and regulations related to those programs. This internal control structure is subject to periodic evaluation by management of the City. As part of the City’s single audit described earlier, tests are performed to determine the adequacy of the internal control structure, including that portion related to federal financial assistance programs, as well as to determine that the City has complied with applicable laws and regulations. The results of the City’s single audit for the year ended December 31, 2016 are included in a separate report. Budgetary Controls. In accordance with Indiana statutes, the City maintains budgetary controls integrated within the accounting system. The objective of these budgetary controls is to ensure compliance with legal provisions embodied in the annual appropriated budget (prepared on a cash basis) which is adopted by the Common Council or Redevelopment Commission (depending on the fund) and then reviewed and approved by the State of Indiana Department of Local Government and Finance (DLGF). Activities of the general fund, special revenue funds, capital project funds, enterprise funds, internal service funds, pension trust funds and debt service funds are included in the annual budget. The level of budgetary control (that is, the level at which expenditures cannot legally exceed the appropriated amount) is established by major budget classification within funds. The Mayor and Common Council may transfer appropriations from one major budget classification to another within a department by ordinance as long as the total appropriations for that fund are not exceeded. Additional appropriations in excess of the original budget must be approved by the Mayor and Common Council and are also submitted to the DLGF for either approval or acknowledgement (depending on the fund). Additional appropriations for funds approved by the Redevelopment Commission do not require DLGF approval. The deadline for adoption of the annual budget is November 1. The city’s fiscal year begins on January 1. The City maintains an encumbrance accounting system as one technique of accomplishing budgetary control. Encumbered amounts do not lapse at year end and are carried over to the following year as a part of the subsequent year’s budget. Property Tax Controls. In addition to budgetary and other controls established by Indiana statute, the City must operate within specific and rigid controls governing the amount of property tax it may levy. The property tax control program, which began in 1973, limits the amount of property tax that may be levied by each unit of government in its legally budgeted funds. The total amount of property tax levied by the unit may increase by the six year average annual growth in Indiana personal non-farm income, as calculated by the U.S. Bureau of Economic Analysis, with a 6% maximum.

viii
During March 2008, the State of Indiana General Assembly enacted property tax reform legislation which made significant changes in the property tax system by capping the amount of property taxes at 1% of grossed assessed value for residential homesteads, 2% for agricultural/rental properties and 3% for all other real and personal property. This legislation was phased in over a two year period beginning in 2009. The loss of revenue to the City due to this legislation was significant (estimated to be over $31 million dollars) but this revenue loss has been offset by cost savings and the adoption of local option income taxes in order to continue providing essential City services, including police and fire protection. A historical view of the City’s tax rate and its net assessed valuation has been included in the statistical section of this document. Mayoral Leadership
Mayor Pete Buttigieg, a Harvard University graduate and Rhodes Scholar, assumed office on January 1, 2012, bringing with him a group of leaders with new ideas and energy to implement transformational reform to city government. When elected at age 29, Mayor Buttigieg was the youngest chief executive of a municipality exceeding 100,000 residents in the United States. During 2012, Mayor Buttigieg launched eight new initiatives to improve city government: 1. New Economic Partnerships – to lay out a new economic vision for our community as well as
to agree on a smarter division of labor among various groups involved in economic development.
2. High Ethical Standards – on his first day in office, the Mayor issued an executive order introducing a new ethics code for City employees.
3. Customer Service Mentality – design ways that City employees can track and resolve residents’ issues efficiently by using more advanced technology. This effort led to the creation of a “311 Call Center” for non-emergency municipal telephone calls during 2012. As of December 31, 2016, the 311 Call Center has taken an excess of 633,000 calls since inception.
4. Strong Partnership with Schools – the Mayor has improved dialogue with the South Bend Community School Corporation and other stakeholders to ensure a strong educational system in the City. The Mayor has begun programs to double the number of public school mentors and curb youth and gun violence.
5. Transparency and Accessibility – choosing not to serve from behind his desk, Mayor Buttigieg continues to conduct a series of monthly “Mayor’s Night Out” and “Mayor’s Night In” events around town to allow residents to speak to him and his department heads directly about concerns and ideas. Also, efforts to implement a first-class performance management system has been initiated and departmental performance measures are being monitored on a monthly basis. The City website has been re-designed and additional financial and operational reports are being made available online.
6. Vacant and Abandoned Buildings – as with many large cities, the City of South Bend has an issue with vacant and abandoned buildings. The city has taken on this issue with the appointment of a blue-ribbon task force that developed a strategy and initiated an aggressive three-year program – 1,000 buildings in 1,000 days – to reduce the number of vacant and abandoned buildings. In October 2015, the 1,000th building was addressed. The City is now working on phase II of the program – dealing with the now vacant lots created by the demolition of the buildings.

ix
7. Smart Streets – an effort to improve the role of streets within South Bend. Projects within this initiative utilizes the “Complete Streets” philosophy which advocates for the design of streets to enable safe access for all users, including pedestrians, bicyclists, motorists and transit riders of all ages and abilities. In 2015, a $25 million bond was issued to aide in the completion of this project in a timely fashion. A majority of this work has been completed as of November 30, 2016.
8. South Bend Group Violence Intervention (SBGVI) – unites community leaders around a common goal: to stop violence and keep South Bend’s highest risk residents alive and out of prison. SBGVI is a partnership among 30 community leaders from law enforcement, government, education, civil services, health-care and faith-based agencies.
City Values The administration of Mayor Buttigieg has a single, overarching mission - we deliver services that empower everyone to thrive. In support of this vision, the Mayor has established three main pillars of administration policy: 1. Make the basics easy – Provide residents high quality services at the greatest value to the
taxpayer, maintaining widespread confidence that the fundamentals are managed well. 2. Deliver Good government – Put residents first always, leading by example, gathering input,
and transparently communicating our intentions, decisions, and actions. 3. Invest in people and places – Support residents with design, policy, and programming for a
strong and inclusive economy, vibrant culture, and great public spaces. Values In the administration In the community EXCELLENCE For each major area of service
delivery, establish South Bend as the best in the state, and/or in the top 25% nationally, measuring and reporting progress.
Establish a path for major indicators of resident well-being to reach the status of best-in-state or top-25% nationally, including the means to measure progress.
ACCOUNTABILITY Put residents first always, offering services at the greatest value to the taxpayer, with clear and transparent indications of how the government is using public resources.
Promote a culture of civic engagement in which we hold one another to a high standard of respect, stewardship, and support for our shared community.
INNOVATION Deliver better services more efficiently by introducing creative approaches to government operations, questioning habit and using evidence to continually improve.
Foster a culture of innovation in South Bend’s social and private sectors, seeking and developing the best ideas and practices from within and beyond our city limits.

x
INCLUSION Ensure the city administration, as an employer and as a purchaser, reflects the community it serves and includes diverse voices in our decision-making and actions.
Develop a community in which everyone has an equal opportunity to thrive by expanding access and participation to all, incorporating diverse voices throughout the city.
EMPOWERMENT Establish a work environment that enables employees to contribute richly to the administration and the community, taking pride and ownership in our work.
Support the ability of all residents to live a safe, healthy, meaningful life in South Bend, contributing as they are able and benefiting from all that our community offers.
Community and Governance Results During 2016, the City administration has initiated a Priority Based Budgeting program and has developed the following Community and Governance desired outcomes:
Community Results 1. Safe Community for Everyone
2. Strong, Inclusive Economy
3. Thriving Public Spaces and Culture
4. Vibrant, Welcoming Neighborhoods
5. Robust and Well-Planned Infrastructure
6. Empower All Residents with Education, Mobility and Technology
Governance Results 1. Great Employer with Great Employees
2. Enduring Financial Strength
3. Excellent Services and Efficient Processes
4. Modeling our Values (Excellence, Accountability, Innovation, Inclusion and Empowerment)
5. Robust Physical and Technological Capital Assets
6. Reliable Compliance with Regulations and Well-Managed Risk
7. Effective, Responsive Leadership and Communication

xi
Awards
The Government Finance Officers Association of the United States and Canada (GFOA) awarded a Certificate of Achievement for Excellence in Financial Reporting to the City of South Bend for its comprehensive annual financial report for the fiscal year ended December 31, 2015. This was the 26th consecutive year that the City has achieved this prestigious award. In order to be awarded a Certificate of Achievement for Excellence in Financial Reporting, a government unit must publish an easily readable and efficiently organized Comprehensive Annual Financial Report. This report must satisfy both generally accepted accounting principles and applicable legal requirements.
A Certificate of Achievement is valid for a period of one year only. We believe that our current comprehensive annual financial report continues to meet the Certificate of Achievement Program’s requirements, and we are submitting it to the GFOA to determine its eligibility for another certificate.
Acknowledgments
The preparation of the Comprehensive Annual Financial Report (CAFR) was made possible by the dedicated service of the City’s departmental fiscal officers and the staff of the Department of Administration and Finance. Each fiscal officer and member of the Administration and Finance Department has our sincere appreciation for the contributions made in the preparation of this report. We would especially like to acknowledge the efforts of the core CAFR preparation team of Rahman Johnson, Amy Shirk, Consultant Bruce Snyder and Plante & Moran, PLLC. In addition, we would like to thank the Field Examiners of the Indiana State Board of Accounts (led by Martha Harper and Alex Flores) for their hard work and dedication in this effort.
In closing, without the leadership and support of Mayor Pete Buttigieg, City Department Heads, City Fiscal Officers and members of the City of South Bend Common Council, preparation of this report would not have been possible.
Sincerely,
John H. Murphy, MPA Jennifer Hockenhull, CPA Chief Financial Officer City Controller

xii

Residents of South Bend
City Council Mayor
Police Department(Chief)
Board of Public Safety (1)
Operations
Patrol
Support
Fire Department(Chief)
Board of Public Safety (1)
Operations
Services
Training
EMS
Venues, Parks, & Arts(Director)
Board of Parks & Recreation (1)
Facilities & Grounds
Recreation
Venue Operations
SBX (Experience)
Public Works(Director)
Board of Public Works (1)
Engineering
Streets & Sewers
Water Works & Wastewater Utility
Central Services
Solid Waste
Sustainability
Community Investment(Director)
Redevelopment Authority/
Redevelopment Commission (2)
Business Development
Neighborhood Engagement
Economic Resources
Planning
General Administration
Administration & Finance
(City Controller)
Budget & Accounting
Treasury
Safety & Risk
Purchasing
Human Capital & Inclusion
Innovation & Technology
(Chief Innovation Officer)
Services
Infrastructure
Applications
Business Analytics
311
Legal Department(City Attorney)
Board & Department Support
Ordinances
Litigation
Code Enforcement(Director)
Administration
Code Inspections
Neighborhood Enhancement Action
Team (NEAT)
Animal Care & Control
Consolidated Building Department
(Commissioner)
Building Permitting
Design Review & Zoning Assistance
Inspections
City Clerk
(1) Board Members include Mayoral Appointments (2) Board Members include Mayoral and Council Appointments for Redevelopment Commission, Mayoral Appointment for Redevelopment Authority
Effective January 1, 2017 xiii

STATE OF INDIANA
AN EQUAL OPPORTUNITY EMPLOYER STATE BOARD OF ACCOUNTS 302 WEST WASHINGTON STREET ROOM E418 INDIANAPOLIS, INDIANA 46204-2769
Telephone: (317) 232-2513
Fax: (317) 232-4711 Web Site: www.in.gov/sboa
INDEPENDENT AUDITOR'S REPORT
TO: THE OFFICIALS OF THE CITY OF SOUTH BEND, ST. JOSEPH COUNTY, INDIANA Report on the Financial Statements We have audited the accompanying financial statements of the governmental activities, the business-type activities, each major fund, and the aggregate remaining fund information of the City of South Bend (City), as of and for the year ended December 31, 2016, and the related notes to the financial statements, which collectively comprise the City's basic financial statements as listed in the Table of Contents. Management's Responsibility for the Financial Statements Management is responsible for the preparation and fair presentation of these financial statements in accordance with accounting principles generally accepted in the United States of America; this includes the design, implementation, and maintenance of internal control relevant to the preparation and fair presentation of financial statements that are free from material misstatement, whether due to fraud or error. Auditor's Responsibility Our responsibility is to express opinions on these financial statements based on our audit. We conducted our audit in accordance with auditing standards generally accepted in the United States of America and the standards applicable to financial audits contained in Government Auditing Standards, issued by the Comptroller General of the United States. Those standards require that we plan and perform the audit to obtain reasonable assurance about whether the financial statements are free from material misstatement. An audit involves performing procedures to obtain audit evidence about the amounts and disclosures in the financial statements. The procedures selected depend on the auditor's judgment, including the assessment of the risks of material misstatement of the financial statements, whether due to fraud or error. In making those risk assessments, the auditor considers internal control relevant to the City's preparation and fair presentation of the financial statements in order to design audit procedures that are appropriate in the circumstances, but not for the purpose of expressing an opinion on the effectiveness of the City's internal control. Accordingly, we express no such opinion. An audit also includes evaluating the appropriateness of accounting policies used and the reasonableness of significant accounting estimates made by management, as well as evaluating the overall presentation of the financial statements. We believe that the audit evidence we have obtained is sufficient and appropriate to provide a basis for our audit opinions.
1

INDEPENDENT AUDITOR'S REPORT (Continued)
Opinions In our opinion, the financial statements referred to above present fairly, in all material respects, the respective financial position of the governmental activities, the business-type activities, each major fund, and the aggregate remaining fund information of the City, as of December 31, 2016, and the respective changes in financial position and, where applicable, cash flows thereof and for the year then ended in accordance with accounting principles generally accepted in the United States of America. Other Matters Required Supplementary Information Accounting principles generally accepted in the United States of America require that the Management's Discussion and Analysis, Schedules of Investment Returns, Schedules of Proportionate Share of the Net Pension Liability, Schedules of Contributions, Schedules of Changes in City Net Pension Liability and Related Ratios, Schedules of Funding Progress, Budgetary Comparison Schedules, and Budget/GAAP Reconciliation, as listed in the Table of Contents, be presented to supplement the basic financial statements. Such information, although not a part of the basic financial statements, is required by the Governmental Accounting Standards Board who considers it to be an essential part of financial reporting for placing the basic financial statements in an appropriate operational, economic, or historical context. We have applied certain limited procedures to the required supplementary information in accordance with auditing standards generally accepted in the United States of America, which consisted of inquiries of management about the methods of preparing the information and comparing the information for consistency with management's responses to our inquiries, the basic financial statements, and other knowledge we obtained during our audit of the basic financial statements. We do not express an opinion or provide any assurance on the information because the limited procedures do not provide us with sufficient evidence to express an opinion or provide any assurance. Other Information Our audit was conducted for the purpose of forming opinions on the financial statements that collectively comprise the City's basic financial statements. The accompanying Combining Balance Sheet, Combining Statement of Revenue, Expenditures and Changes in Fund Balances, Schedule of Revenue, Expenditures, and Changes in Fund Balances - Budget and Actual, Combining Statements of Net Position, Combining Statements of Revenue, Expenses, and Changes in Net Position, Combining Statements of Cash Flows, Statement of Assets and Liabilities, Combining Statement of Changes in Fiduciary Net Position, and Statement of Changes in Assets and Liabilities, and the Introductory and Statistical Sections are presented for purposes of additional analysis and are not a required part of the basic financial statements. The Combining Balance Sheet, Combining Statement of Revenue, Expenditures and Changes in Fund Balances, Schedule of Revenue, Expenditures, and Changes in Fund Balances - Budget and Actual, Combining Statements of Net Position, Combining Statements of Revenue, Expenses, and Changes in Net Position, Combining Statements of Cash Flows, Statement of Assets and Liabilities, Combining Statement of Changes in Fiduciary Net Position, and Statement of Changes in Assets and Liabilities are the responsibility of management and were derived from and relates directly to the underlying accounting and other records used to prepare the basic financial statements. Such information has been subjected to the auditing procedures applied in the audit of the basic financial statements and certain additional procedures, including comparing and reconciling such information directly to the underlying accounting and other records used to prepare the basic financial statements or to the basic financial statements themselves, and other additional procedures in accordance with auditing standards generally accepted in the United States of America. In our opinion, the combining and individual fund financial statements, and other budgetary comparison schedules are fairly stated, in all material respects, in relation to the basic financial statements as a whole.
2

INDEPENDENT AUDITOR'S REPORT (Continued)
The Introductory and Statistical Sections have not been subjected to the auditing procedures applied in the audit of the basic financial statements and, accordingly, we do not express an opinion or provide any assurance on it. Other Reporting Required by Government Auditing Standards In accordance with Government Auditing Standards, we have also issued our report dated June 5, 2017, on our consideration of the City's internal control over financial reporting and on our tests of its compliance with certain provisions of laws, regulations, contracts, and grant agreements and other matters. The purpose of that report is to describe the scope of our testing of internal control over financial reporting and compliance and the results of that testing, and not to provide an opinion on internal control over financial reporting or on compliance. That report is an integral part of an audit performed in accordance with Government Auditing Standards in considering the City's internal control over financial reporting and compliance.
Paul D. Joyce, CPA State Examiner June 5, 2017
3

City of South Bend, Indiana
Management’s Discussion and Analysis
4
The management of the City of South Bend, Indiana (the “City”) provides herewith this Management’s Discussion and Analysis (MD&A) of the financial activities and condition of the City of South Bend, Indiana for the fiscal year ended December 31, 2016.
Readers of the information contained within this Management’s Discussion and Analysis, and any opinion derived therein, should be considered as a part of the greater whole of the financial statements, notes to the financial statements, supplemental information and letter of transmittal, as contained within this Comprehensive Annual Financial Report (CAFR).
The City of South Bend is the county seat of St. Joseph County, Indiana, and is the fourth largest city in the state of Indiana. St. Joseph County is located within the heartland of the manufacturing and metropolitan regions of the Upper Midwest. The City of South Bend is located in the north central region of the state of Indiana, five (5) miles south of the Indiana / Michigan state boundary line. The City is approximately ninety (90) miles east of the city of Chicago and one hundred forty (140) miles north of the city of Indianapolis.
The 2010 U.S. Bureau of the Census population for the City of South Bend was reported as 101,168 and the 2010 Census population for St. Joseph County was reported as 266,931. Accordingly, South Bend is classified as a “Second Class City” under State of Indiana statutes, defined as cities with a population between 35,000 and 600,000 residents.
The City of South Bend and St. Joseph County is a vibrant and diverse area with a strong local economy based on a mix of agricultural, manufacturing and service, higher education, health care and other commercial and tourism based industries. The diverse economic mix creates varied employment opportunities for residents while providing insulation from economic downturns through diversification. South Bend is home to the University of Notre Dame.
The City of South Bend provides a full range of general governmental services to its residents. Services include general government, public safety, street construction and maintenance, infrastructure construction and maintenance, parks and recreation services, arts and culture, and sanitation services. In addition, the City provides Water Utility, Wastewater Utility and Solid Waste services to commercial and residential properties within the city. City operations also include the Century Center convention venue, Morris Performing Arts Center, Palais Royale Ballroom, Studebaker National Museum, South Bend Redevelopment Authority and Public Parking Garages within the city footprint.
The City of South Bend governmental structure includes elected officials as follows with defined management and legislative authority in compliance with Indiana statute.
Mayor Chief Executive Officer 4-year term Common Council 9 member legislative body
6 from defined districts within the City 3 at-large members
4-year term
City Clerk Secretary of the Common Council 4-year term
City of South Bend, Indiana
Management’s Discussion and Analysis (Continued)
5
The current terms of office for Common Council members, Mayor and City Clerk expire on December 31, 2019.
The City of South Bend was incorporated in 1865, is compliant with Indiana statutes, and remains as such through the period covered by this Management’s Discussion and Analysis report.
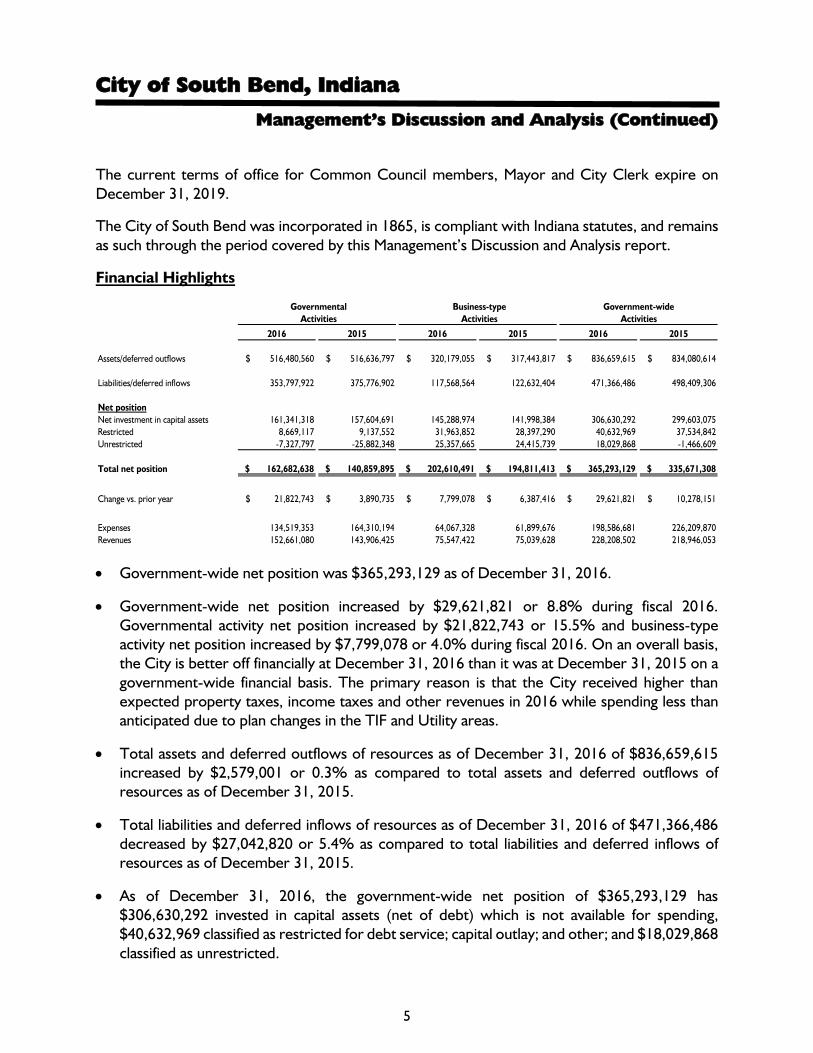
Financial Highlights
Governmental Business-type Government-wideActivities Activities Activities
2016 2015 2016 2015 2016 2015
Assets/deferred outflows $ 516,480,560 $ 516,636,797 $ 320,179,055 $ 317,443,817 $ 836,659,615 $ 834,080,614
Liabilities/deferred inflows 353,797,922 375,776,902 117,568,564 122,632,404 471,366,486 498,409,306
Net positionNet investment in capital assets 161,341,318 157,604,691 145,288,974 141,998,384 306,630,292 299,603,075Restricted 8,669,117 9,137,552 31,963,852 28,397,290 40,632,969 37,534,842Unrestricted -7,327,797 -25,882,348 25,357,665 24,415,739 18,029,868 -1,466,609
Total net position $ 162,682,638 $ 140,859,895 $ 202,610,491 $ 194,811,413 $ 365,293,129 $ 335,671,308
Change vs. prior year $ 21,822,743 $ 3,890,735 $ 7,799,078 $ 6,387,416 $ 29,621,821 $ 10,278,151
Expenses 134,519,353 164,310,194 64,067,328 61,899,676 198,586,681 226,209,870Revenues 152,661,080 143,906,425 75,547,422 75,039,628 228,208,502 218,946,053
• Government-wide net position was $365,293,129 as of December 31, 2016.
• Government-wide net position increased by $29,621,821 or 8.8% during fiscal 2016. Governmental activity net position increased by $21,822,743 or 15.5% and business-type activity net position increased by $7,799,078 or 4.0% during fiscal 2016. On an overall basis, the City is better off financially at December 31, 2016 than it was at December 31, 2015 on a government-wide financial basis. The primary reason is that the City received higher than expected property taxes, income taxes and other revenues in 2016 while spending less than anticipated due to plan changes in the TIF and Utility areas.
• Total assets and deferred outflows of resources as of December 31, 2016 of $836,659,615 increased by $2,579,001 or 0.3% as compared to total assets and deferred outflows of resources as of December 31, 2015.
• Total liabilities and deferred inflows of resources as of December 31, 2016 of $471,366,486 decreased by $27,042,820 or 5.4% as compared to total liabilities and deferred inflows of resources as of December 31, 2015.
• As of December 31, 2016, the government-wide net position of $365,293,129 has $306,630,292 invested in capital assets (net of debt) which is not available for spending, $40,632,969 classified as restricted for debt service; capital outlay; and other; and $18,029,868 classified as unrestricted.

City of South Bend, Indiana
Management’s Discussion and Analysis (Continued)
6
• Government-wide revenue received in fiscal 2016 totaled $228,208,502, an increase of $9,262,449 or 4.2% versus government-wide revenue received in fiscal 2015. Governmental activity revenue increased by $8,754,655 or 6.1%, and business-type activity revenue increased by $507,794 or 0.7%.
• Government-wide expenses in 2016 totaled $198,586,681, a decrease of $27,623,189 or 12.2% compared to expenses of $226,209,870 in 2015. Government activity expenses decreased by $29,790,841 or 18.1% and business-type activity expenses increased by $2,167,652 or 3.5% compared to fiscal 2015.
• Explanatory commentary concerning the changes in assets, liabilities, revenue and expenditures can be found in later sections of this MD&A.
Overview of the Financial Statements
The City of South Bend’s financial statements are comprised of three components: (1) government-wide financial statements, (2) fund financial statements, and (3) notes to the financial statements. This report also includes other supplementary information in addition to the basic financial statements themselves.
Government-wide Financial Statements
The government-wide financial statements are designed to provide readers with a broad overview of the City of South Bend’s finances using “accrual-based accounting,” a method of accounting used by private sector businesses.
• Statement of Net Position
This statement reports all assets, deferred outflows of resources, liabilities, and deferred inflows of resources of the City of South Bend as of December 31, 2016. The difference between total assets and deferred outflows of resources less total liabilities and deferred inflows of resources is reported as “net position,” and can generally be thought of as the net worth of the City. Increases in net position generally indicate an improvement in financial position while decreases in net position may indicate a deterioration of financial position.
• Statement of Activities
This statement serves the purpose of the traditional income statement. It provides consolidated reporting of the results of all activities of the City of South Bend for the year ended December 31, 2016. Changes in net position are recorded in the period in which the underlying event takes place, which may differ from the period in which cash is received or disbursed. The statement of activities displays the expense of the City’s various programs net of the related revenues, as well as a separate presentation of revenue available for general purposes including property and county option income taxes, fees for services and other revenue sources.

City of South Bend, Indiana
Management’s Discussion and Analysis (Continued)
7
The government-wide financial statements distinguish between functions of the City that are principally supported by taxes and intergovernmental revenue (governmental activities) and other functions that are intended to recover all or a significant portion of their costs through user fees and charges (business-type activities). The major governmental activities of the City of South Bend include general government, public safety, street construction and maintenance, infrastructure construction and maintenance, parks and recreation services, and arts and culture. The major business-type activities of the City include the water utility, wastewater utility, solid waste sanitation services, Century Center convention center, building department, emergency medical services and the downtown parking garages.
Fund Financial Statements
A fund is a group of related accounts that is used to maintain control over resources that have been segregated for specific activities or objectives. The City, like other state and local governments, uses fund accounting to ensure and demonstrate compliance with finance-related legal requirements. All of the funds of the City of South Bend can be divided into three categories: governmental funds, proprietary funds and fiduciary funds. Each fund has its own cash balance which must be maintained according to the City’s cash reserve policy.
Governmental Funds
Governmental funds are used to account for the same functions reported as governmental activities in the government-wide financial statements. However, unlike government-wide financial statements, governmental fund financial statements focus on short-term inflows and outflows of spendable resources, as well as on balances of spendable resources available at the end of the fiscal year. Such information may be useful in evaluating a government's short-term financing requirements. Governmental funds use the modified accrual accounting method. The City maintains seven (7) major governmental funds (General, Parks and Recreation, Public Safety Local Option Income Tax (LOIT), County Option Income Tax (COIT), Economic Development Income Tax (EDIT), Rainy Day, and River West TIF) and sixty-eight (68) non major governmental funds.

City of South Bend, Indiana
Management’s Discussion and Analysis (Continued)
8
Proprietary Funds
The City of South Bend maintains two types of proprietary funds: enterprise and internal service.
• Enterprise funds are used to report the same functions presented as business-type activities in the government-wide financial statements. The City maintains seven (7) enterprise funds. Information is presented separately in the proprietary statement of net position and the proprietary statement of revenues, expenses and changes in fund net position for the Water utility, Wastewater utility and Century Center, which are considered major enterprise funds. Data from the other four (4) nonmajor enterprise funds (Consolidated Building Department, Parking Garage, Solid Waste, and Emergency Medical Services) are combined into a single, aggregated presentation. Individual fund data for each of these nonmajor enterprise funds is provided in the form of combining statements elsewhere in this report.
• Internal service funds are used to accumulate and allocate costs internally among the City's various functions and funds. The City maintains six (6) internal service funds. The City of South Bend uses internal service funds to account for its self-funded liability insurance program, self-funded employee health benefits program, unemployment compensation claims, police take-home vehicle program, 311 call center, and central services unit (a department that accounts for expenses related to fuel, vehicle repairs, printing and other services provided to City departments on a cost-reimbursement basis). Because these services predominantly benefit governmental rather than business-type functions, they have been included within governmental activities in the government-wide financial statements but are combined into a single, aggregated presentation in the proprietary fund financial statements. Individual fund data for the internal service funds is provided in the form of combining statements elsewhere in the report.
Fiduciary Funds
Fiduciary funds are used to account for resources held for the benefit of parties outside the City government. Fiduciary funds are not reflected in the government-wide financial statements because the resources of those funds are not available to support City programs. The City maintains six (6) fiduciary funds, which consist of two (2) pension trust funds (1925 Police Pension and 1937 Firefighters’ Pension), three (3) agency funds (Payroll, Police Distributions Payable and Morris/Palais Royale Box Office), and one (1) private-purpose trust fund (City Cemetery).

City of South Bend, Indiana
Management’s Discussion and Analysis (Continued)
9
Pension Trust Fund Operations
City employees are covered by the Public Employees Retirement Fund (PERF) and the 1977 Police Officers' and Firefighters' Pension Fund, both of which are administered by the State of Indiana. However, certain police officers and firefighters hired before May 1, 1977 (who did not opt into the 1977 fund) continue to be members of the 1925 Police Officers’ Pension Fund or the 1937 Firefighters' Pension Fund. These two funds are administered by the City. The number of police officers and firefighters in the City-managed pension trust funds will continue to decline in the future as current participants pass away. The State makes certain contributions toward the funding of the 1925 Police Officers’ and 1937 Firefighters’ pension plans.
Notes to the Financial Statements
The notes to the financial statements provide additional information that is essential in order to have a full understanding of the data provided in the government-wide and fund financial statements.
Other Information
In addition to the basic financial statements and accompanying notes and disclosures, this CAFR presents supplementary information (“Required Supplementary Information” or “RSI”) immediately following the basic financial statements. Other supplementary information is found in the Statistical Section. The combining statements referred to earlier in connection with non-major governmental, non-major enterprise, internal service and fiduciary funds are presented immediately after the Required Supplementary Information within the financial statement section of the CAFR.
Government-wide Financial Statements
The following financial analysis will focus on the statement of net position and statement of changes in net position of the City’s governmental and business-type activities.

City of South Bend, Indiana
Management’s Discussion and Analysis (Continued)
10
Statement of Net Position
Governmental Business-type Government-wideActivities Activities Activities
2016 2015 2016 2015 2016 2015
AssetsCurrent and other $ 214,523,060 $ 226,795,797 $ 68,688,703 $ 74,526,365 $ 283,211,763 $ 301,322,162 Capital assets (net) 273,380,335 265,386,820 249,215,298 240,503,593 522,595,633 505,890,413
Total Assets 487,903,395 492,182,617 317,904,001 315,029,958 805,807,396 807,212,575
Deferred Outflows 28,577,165 24,454,180 2,275,054 2,413,859 30,852,219 26,868,039
LiabilitiesCurrent 8,052,118 30,617,734 17,885,075 15,584,204 25,937,193 46,201,938 Long term 329,439,412 324,909,155 99,440,549 106,707,120 428,879,961 431,616,275
Total Liabilities 337,491,530 355,526,889 117,325,624 122,291,324 454,817,154 477,818,213
Deferred Inflows 16,306,392 20,250,013 242,940 341,080 16,549,332 20,591,093
Net PositionNet investment in capital assets 161,341,318 157,604,691 145,288,974 141,998,384 306,630,292 299,603,075 Restricted 8,669,117 9,137,552 31,963,852 28,397,290 40,632,969 37,534,842 Unrestricted (7,327,797) (25,882,348) 25,357,665 24,415,739 18,029,868 (1,466,609)
Total Net Position $ 162,682,638 $ 140,859,895 $ 202,610,491 $ 194,811,413 $ 365,293,129 $ 335,671,308
• As of December 31, 2016, total assets and deferred outflows exceeded liabilities and deferred
inflows by $365,293,129, an increase of $29,621,821, or 8.8%, from the net position level as of December 31, 2015.
• Governmental activities net position of $162,682,638 increased by $21,822,743, or 15.4%, from December 31, 2015.
• Business-type net position of $202,610,491 increased by $7,799,078, or 4.0%, from December 31, 2015. The increase in business-type net position was due primarily to a 5% increase in sewer rates which will be used to support long-term capital projects of the Wastewater and a 9.1% increase in the Solid Waste fees used to support operations and capital expenditures.
• Government-wide assets and deferred outflows increased by $2,579,001, or 0.3%, as compared to amounts as of December 31, 2015 primarily due to increased tax revenue received during 2016.
• Government-wide liabilities and deferred inflows decreased by $27,042,820, or 5.4%, as compared to amounts as of December 31, 2015. The decrease is due primarily to the pay down of outstanding debt from operations without offsetting new debt and the reduction of the calculated net pension liability.

City of South Bend, Indiana
Management’s Discussion and Analysis (Continued)
11
Statement of Changes in Net Position
Governmental Business-type Government-wideActivities Activities Activities
2016 2015 2016 2015 2016 2015Revenue
Program revenue:Charge for services $ 8,171,317 $ 6,529,359 $ 75,470,222 $ 69,997,286 $ 83,641,539 $ 76,526,645 Operating grants 2,644,272 2,813,481 - - 2,644,272 2,813,481 Capital grants - - 649,609 4,683,424 649,609 4,683,424
General revenue:Taxes
Property tax 76,331,581 72,032,049 - - 76,331,581 72,032,049 Other tax 31,463,184 24,507,308 - - 31,463,184 24,507,308 Unrestricted grants 25,846,397 25,487,112 - - 25,846,397 25,487,112 Investment earnings 1,458,787 1,322,674 570,982 358,918 2,029,769 1,681,592 Other revenue 6,745,542 11,214,442 (1,143,391) - 5,602,151 11,214,442
Total Revenue 152,661,080 143,906,425 75,547,422 75,039,628 228,208,502 218,946,053
ExpensesGeneral government 15,618,817 21,572,776 - - 15,618,817 21,572,776 Public safety 55,029,909 56,528,448 - - 55,029,909 56,528,448 Highways and streets 13,550,535 20,045,444 - - 13,550,535 20,045,444 Culture and recreation 17,156,094 20,300,768 - - 17,156,094 20,300,768 Economic development 28,436,368 40,727,612 - - 28,436,368 40,727,612 Bond issuance costs - 372,432 - - - 372,432 Interest on long-term debt 4,727,630 4,762,714 - - 4,727,630 4,762,714 Water utility - - 14,900,039 13,609,378 14,900,039 13,609,378 Wastewater utility - - 26,420,526 25,737,867 26,420,526 25,737,867 Civic center - - 5,364,472 4,854,747 5,364,472 4,854,747 Building department - - 3,240,172 3,552,347 3,240,172 3,552,347 Parking - - 909,857 2,139,182 909,857 2,139,182 Solid waste - - 5,794,913 5,243,972 5,794,913 5,243,972 Golf course - - - 165,977 - 165,977 Emergency medical services - - 7,437,349 6,596,206 7,437,349 6,596,206
Total Expenses 134,519,353 164,310,194 64,067,328 61,899,676 198,586,681 226,209,870
Change in net positionBefore transfers 18,141,727 (20,403,769) 11,480,094 13,139,952 29,621,821 (7,263,817)Special items - Disposal of operations - - - (1,180,964) - (1,180,964)Transfers 3,681,016 2,846,415 (3,681,016) (2,846,415) - -
Change in net position 21,822,743 (17,557,354) 7,799,078 9,112,573 29,621,821 (8,444,781)
Beginning net position 140,859,895 158,417,249 194,811,413 185,698,840 335,671,308 344,116,089
Ending net position $ 162,682,638 $ 140,859,895 $ 202,610,491 $ 194,811,413 $ 365,293,129 $ 335,671,308

City of South Bend, Indiana
Management’s Discussion and Analysis (Continued)
12
Governmental Activities
Net position for governmental activities increased by $21,822,743 during fiscal 2016, an increase of 15.5% from the balance of Net Position at December 31, 2015. Revenue of $152,661,080 increased by $8,754,655, or 6.1%. Expenses were $134,519,353 during 2016, a decrease of $29,790,841, or 18.1% as compared to fiscal 2015.
The governmental activities revenue increases were due primarily to higher property tax and income tax revenue during 2016 resulting from an increase in assessed property values and an improving local economy. Governmental activities expenses decreased significantly in 2016 due to higher than usual spending in 2015 on large capital projects and business incentives paid to companies for economic development. Many major projects (2-way street conversions and major economic development projects) were funded in 2015.
Business-type Activities
Net position from business-type activities increased by $7,799,078 during fiscal 2016, an increase of 4.0% from the balance of Net Position at December 31, 2015. During 2016, business-type activities revenue of $75,547,422 increased by $507,794, or 0.7%, over fiscal 2015. During 2016, business-type activities expenses of $64,067,328 increased by $2,167,652, or 3.5%, when compared to fiscal 2015.
Revenue increased primarily in the Wastewater utility as a result of a 5% rate increase and in Solid Waste due to a 9.1% rate increase. Both rate increases were approved by the South Bend Common Council.
Financial Analysis of Government Funds
The City of South Bend uses fund accounting to ensure and demonstrate compliance with finance related legal requirements. Funds of the City are divided into three categories: governmental funds, proprietary funds and fiduciary funds.

City of South Bend, Indiana
Management’s Discussion and Analysis (Continued)
13
Condensed Balance Sheet, Statement of Revenue, Expenditures, and Changes in Fund Balance
As of December 31, 2016
General Park & Rec PS LOIT COIT EDIT Rainy Day River West TIF Other Total
Total assets $ 35,178,825 $ 4,527,367 $ 940,539 $ 10,479,820 $ 11,575,880 $ 10,185,414 $ 42,335,432 $ 90,137,661 $ 205,360,938
Total liabilities 1,226,203 181,597 114,082 465,853 375,991 - 1,420,433 9,835,559 13,619,718
Fund Balances:Nonspendable 494,730 27,113 - 1,526,597 270,001 - 9,583,608 12,158,948 24,060,997 Restricted - 4,318,657 826,457 - - - 31,331,391 65,350,135 101,826,640 Committed - - - - - - - 2,698,694 2,698,694 Assigned 1,380,036 - - 8,487,370 10,929,888 10,185,414 - 2,396,118 33,378,826 Unassigned 32,077,856 - - - - - - (2,301,793) 29,776,063
Total fund balance $ 33,952,622 $ 4,345,770 $ 826,457 $ 10,013,967 $ 11,199,889 $ 10,185,414 $ 40,914,999 $ 80,302,102 $ 191,741,220
Liabilities and fund balance $ 35,178,825 $ 4,527,367 $ 940,539 $ 10,479,820 $ 11,575,880 $ 10,185,414 $ 42,335,432 $ 90,137,661 $ 205,360,938
Revenues 62,470,763 10,413,258 6,798,193 10,189,226 10,195,560 1,492,715 18,673,223 32,436,480 152,669,418 Expenditures 63,575,739 10,835,631 6,525,003 10,644,722 2,515,324 - 17,358,817 59,520,848 170,976,084
Net surplus (deficit) (1,104,976) (422,373) 273,190 (455,496) 7,680,236 1,492,715 1,314,406 (27,084,368) (18,306,666) Other sources (uses) 4,435,542 947,661 - (2,590,147) (6,709,570) - (2,142,555) 15,280,219 9,221,150
Net change in fund balances 3,330,566 525,288 273,190 (3,045,643) 970,666 1,492,715 (828,149) (11,804,149) (9,085,516)
Beginning fund balances 30,622,056 3,820,482 553,267 13,059,610 10,229,223 8,692,699 41,743,148 92,106,251 200,826,736
Ending fund balances 33,952,622$ 4,345,770$ 826,457$ 10,013,967$ 11,199,889$ 10,185,414$ 40,914,999$ 80,302,102$ 191,741,220$
As of December 31, 2016, the City governmental funds reported a combined ending fund balance of $191,741,220.
The nonspendable fund balance of $24,060,997 is sequestered for property held for resale, inventory, and long-term receivables and is, therefore, not available for new spending. The restricted fund balance of $101,826,640 consists of monies in debt service funds or other funds such as road and tax increment financing funds that are limited by external parties as to their use. The committed fund balance of $2,698,694 is designated by the South Bend Common Council or South Bend Redevelopment Commission to be used for certain purposes such as for economic development projects. The assigned fund balance of $33,378,826 includes balances in local option income tax funds that have not been committed to certain projects and are available for spending by the City. The remaining unassigned fund balance of $29,776,063 consists of money primarily in the General Fund that has not been obligated in any manner by the City less deficits in certain nonmajor governmental funds due primarily to interfund advance transactions to finance economic development projects that will be paid back over time.
The General Fund is the primary operating fund for City operations including general government, public safety, certain culture and recreation expenses, and certain debt service obligations.
As of December 31, 2016, the General Fund balance of $33,952,622 represents an increase of $3,330,566, or 10.9% from the balance as of December 31, 2015. The increase was due primarily to higher property tax revenue during 2016 than expected and lower spending for public safety and administration than anticipated.

City of South Bend, Indiana
Management’s Discussion and Analysis (Continued)
14
As of December 31, 2016, the General Fund had an unassigned fund balance of $32,077,856 which is equal to 50.5% of 2016 General Fund expenditures.
The General Fund unassigned fund balance has traditionally been used by the City to fund certain capital projects and emergency contingencies. In addition, the City used the unassigned fund balance in 2016 as a cash flow bridge to the receipt of property tax revenues from the County collection authority which distributes property tax revenue twice per year (June and December). The General Fund unassigned balance provided sufficient cash to cover City operating obligations without incurring tax anticipation notes and resultant borrowing costs during fiscal 2016.
As discussed in Governmental Accounting, Auditing, and Financial Reporting (GAAFR), a General Fund unassigned fund balance should be either 1) no less than 5 to 15 percent of regular General Fund operating revenues, or 2) no less than one to two months of regular General Fund operating expenditures. An unassigned fund balance may be higher if circumstances dictate, such as a delay in collection of a major revenue source. The City has a policy to maintain fund reserves equal to at least 35% of annual expenditures and exceeded this target at December 31, 2016.
The Parks and Recreation Fund balance increased $525,288 during fiscal 2016, due primarily to a combination of higher property tax revenue and transfers in and lower expenditures. As of December 31, 2016, the fund balance in the Parks and Recreation Fund was $4,345,770, or 40.1% of 2016 expenditures. The City has a policy to maintain fund reserves equal to at least 25% of annual expenditures and exceeded this target at December 31, 2016.
The Public Safety Local Option Income Tax Fund (Public Safety LOIT) was created in October 2009, with the local legislative passage of an increase in local option income taxes of 0.95%, a part of which (0.25%) tax increase was established to fund public safety expenditures. The City has established the Public Safety LOIT Fund as a major governmental fund, due solely to its purpose of creating a funding source to sustain public safety staffing levels, which were compromised by state implementation of property tax reform that has reduced property tax revenues, which historically are the source of public safety funding. Public Safety LOIT funds are used to cover the personnel costs of police officers and firefighters. Receipts of Public Safety LOIT tax revenue commenced in January 2010. Revenue in fiscal 2016 of $6,798,193 increased by $326,626 or 5.0% compared to 2015. The increase in fund balance in the amount of $273,190 during 2016 was due to lower spending from this fund for police and fire personnel. The ending fund balance was $826,457, or 12.7% of annual expenditures, and meets the City’s cash reserve policy goal of 8%.
The County Option Income Tax Fund (COIT) and Economic Development Income Tax Fund (EDIT) funds are used to fund major capital and construction projects, economic development initiatives, certain subsidies and support to organizations and units that benefit city economic development and cultural venues, certain city-wide expenditures such as telephone and information technology costs, and certain debt service payments.

City of South Bend, Indiana
Management’s Discussion and Analysis (Continued)
15
The COIT fund balance decreased by $3,045,643 during 2016, due to higher expenditures for the curb and sidewalk program and information technology. The City has operationally sequestered COIT funds for use in major capital and construction funding initiatives, certain subsidies and support to organizations and units that benefit city economic development and cultural venues, information technology costs, city-wide expenditures like telephone and electricity for street lights, and certain debt service payments.
As of December 31, 2016, the COIT Fund balance was $10,013,967, or 75.6% of 2016 expenditures and transfers out. This level of fund reserves is significantly higher than the City policy target of 50%.
The EDIT Fund balance increased by $970,666 during 2016 due to lower than anticipated expenses related to initiatives of Community Investment. The City has operationally sequestered EDIT funds for use in major economic development initiatives, certain subsidies and support to organizations and units that benefit city economic development and cultural venues, operational costs of the street, code enforcement and community investment departments and certain debt service payments.
As of December 31, 2016, the EDIT fund balance was $11,199,889, or 121.4% of 2016 expenditures and transfers out. The City policy target is 50%.
The Rainy Day Fund is a new major fund for 2016. The fund is used to account for unused and unencumbered funds that are transferred from a fund that has a tax levy. Revenues in this fund also include special distributions of county option income tax and county economic development income tax. The Rainy Day Fund received a special state distribution $1,405,850 in local income tax revenue during 2016. The ending fund balance was $10,185,414, or 5.1% of government-wide expenses during 2016, and meets the City’s cash reserve policy goal of 3%.
The fund balance in the River West TIF Fund decreased by $828,149 during 2016. This change was the result of debt payments made during the year for public building debt and other economic development projects.
As of December 31, 2016, the River West TIF Fund balance of $40,914,999 including $9,583,608 in nonspendable fund balances (primarily property held for resale) and $31,331,391 in restricted fund balances. This fund continues to be a major success for the City of South Bend and has generated in excess of $645 million in private investment since its inception.
During 2016, the fund balances in Nonmajor Governmental funds decreased by $11,804,149 due primarily to the spending of prior year bond proceeds on capital projects like the “Smart Streets” one-way to two-way street improvement project in the downtown.

City of South Bend, Indiana
Management’s Discussion and Analysis (Continued)
16
The total balance in Nonmajor Governmental Funds was $80,302,102 at December 31, 2016. These fund balances provide the necessary resources that the City requires to meet future capital construction needs, ongoing debt service obligations, and economic development project initiatives in order to fuel community growth within the City.
Individual fund data for each of the nonmajor governmental funds is provided in the form of the combining statements immediately following the Required Supplemental Information within the Financial Section of the CAFR.
Governmental Fund Revenue
The following schedule presents a summary of governmental fund revenue for the year ended December 31, 2016 with comparison to the prior year:
2016 % of 2015 % ofActual Total Actual Total
Tax BasedGeneral property $ 75,724,582 49.6% $ 71,525,988 50.1%County option income 21,868,582 14.3% 15,326,102 10.7%County economic development 9,594,602 6.3% 9,181,206 6.4%Professional sports development 673,787 0.5% 626,192 0.5%
Total Tax 107,861,553 70.7% 96,659,488 67.7%
Non-Tax BasedLicenses and permits 224,677 0.1% 151,923 0.1%Intergovernmental 27,959,813 18.3% 30,216,059 21.2%Charge for services 7,062,108 4.6% 5,794,168 4.1%Fines and forfeitures 756,781 0.5% 454,327 0.3%Interest income 1,624,527 1.1% 1,253,242 0.9%Other 7,179,959 4.7% 8,190,619 5.7%
Total Non-Tax Based 44,807,865 29.3% 46,060,338 32.3%
Total Revenue $ 152,669,418 100.0% $ 142,719,826 100.0%

City of South Bend, Indiana
Management’s Discussion and Analysis (Continued)
17
Tax revenue continues to represent the most significant source of revenue required to support services provided by the City. Property tax revenue is the primary source of funding for governmental expenditures. Property tax revenue is based on a relationship between two variables. The first variable is the net assessed property valuation of industrial, commercial and residential parcels for both real and personal property. The second variable is the application of a tax rate to arrive at the total tax levy. Taxable property is assessed at 100% of the true tax value. The amount of property tax levied (billed to property owners) is further restricted by State of Indiana-enacted property tax legislative reform, the so-called “circuit breaker” property tax caps in 2009, to no more than 1.0% (homestead), 2.0% (other residential/rental) or 3.0% (commercial/industrial) of gross assessed valuation. Property tax revenue includes taxes collected on behalf of the following funds: General Fund, Parks and Recreation Fund, Cumulative Capital Development Fund, Redevelopment Commission Tax Incremental Financing (TIF) Funds, Excess Levy Fund, and a special levy to cover debt service at the former College Football Hall of Fame building.
The City recognizes the need to further diversify the revenue stream and to reduce its dependency on general property taxes to ensure that a broad base of users of city services, including nonresidents who work in the City, share in the funding of basic City services. As a result of the need to diversify the revenue stream, the City of South Bend Common Council and Saint Joseph County Council adopted an additional local option income tax of 0.95% during 2009, increasing the tax rate from 0.8% to 1.75%. The local option income tax increase consisted of three components: 0.2% increase in the economic development income tax, a 0.25% public safety local option income tax and a 0.5% property tax relief local option income tax. The property tax relief local option income tax does not result in any direct revenue to the City but helps to reduce circuit breaker property tax losses.
The City continues to seek diversified sources of revenue that will reduce its reliance on property and income taxes. The City has supported efforts of the Accelerating Indiana Municipalities (AIM – formerly IACT) “Hometown Matters” to lobby the state legislature to enable alternative revenue sources that best fit the needs of the community. One viable source of revenue is from user fees and/or charges for services currently being performed. City-performed services are priced at levels representing the full cost of service, taking into consideration fees charged by providers of similar services. The City performs ongoing reviews of user fee costs incurred and revises service fee prices as required.
Total tax revenue was $107,861,553 during 2016 and increased by $11,202,065, or 11.6%, from 2015. This increase was due primarily to an improving local economic and housing market that has increased local income taxes and general property taxes. Total non-tax based revenue was $44,807,865 and decreased $1,252,473, or 2.7%, from 2015.

City of South Bend, Indiana
Management’s Discussion and Analysis (Continued)
18
Governmental Fund Expenditures
The City accounts for government fund expenditures in eight functional categories as follows: (1) general government, (2) public safety, (3) highways and streets, (4) community and economic development, (5) culture and recreation, (6) bond issuance costs (7) debt service, and (8) capital outlay.
The following schedule presents a summary of governmental fund expenditures for the year ended December 31, 2016 with comparison to fiscal year 2015.
2016 % of 2015 % ofActual Total Actual Total
General government $ 16,311,633 9.6% $ 8,420,278 4.9%Public safety 64,350,281 37.7% 61,889,405 35.9%Highways and streets 11,294,768 6.6% 12,787,641 7.4%Community and economic development 20,894,153 12.2% 11,068,013 6.4%Culture and recreation 13,070,606 7.6% 12,855,704 7.4%Bond issuance costs 0 0.0% 372,432 0.2%Debt service 17,998,348 10.5% 18,711,690 10.8%Capital outlay 27,056,295 15.8% 46,553,570 27.0%
Total Expenditures $ 170,976,084 100.0% $ 172,658,733 100.0%
Government fund expenditures in fiscal 2016 of $170,976,084 decreased by $1,682,649, or 1.0%, in comparison to government fund expenditures in fiscal 2015.
Capital outlay expenditures decreased by $19,497,275, or 41.9%, during 2016 due primarily to overall increased spending in tax increment financing funds, the County Option Income Tax Fund, the Major Moves Fund, and other capital projects funds during 2015, which did not occur in 2016.
Public Safety expenditures continue to be the primary use of government fund resources with 37.7% of expenditures used for this purpose in fiscal 2016. Public safety spending is followed by capital outlay expenditures (15.8%), community and economic development (12.2%), debt service (10.5%), general government (9.6%), culture and recreation (7.6%), and highways and streets (6.6%). General government spending is comprised of the executive offices of the Mayor, Common Council, City Clerk, City Attorney, Controller, Engineering and other administrative functions. Governmental expenditures increased during 2016 due to the allocation of expenditures that were formerly classified as capital costs in 2015.

City of South Bend, Indiana
Management’s Discussion and Analysis (Continued)
19
Proprietary funds
Condensed Statement of Net Position Revenue, Expenses, and Changes in Fund Net Position
As of December 31, 2016
Total assets $ 70,843,131 $ 195,580,693 $ 21,483,621 $ 30,106,608 $ 318,014,053 $ 16,548,865 Total deferred outflows 113,328 2,161,726 - - 2,275,054 -
Total liabilities 20,868,465 86,008,309 426,280 10,132,622 117,435,676 3,332,705 Total deferred inflows - - 239,584 3,356 242,940 -
Net position:Net investment in capital assets 39,644,547 79,882,890 18,846,844 6,914,693 145,288,974 1,348,906 Restricted for:
Debt service fund 50,069 814,230 - - 864,299 - Customer repair and deposit fund 1,541,424 1,752,931 - - 3,294,355 - Cash with fiscal agent 147,437 248,464 - 897,564 1,293,465 - Bond reserve fund 1,392,739 4,111,633 - - 5,504,372 - Operating reserve fund 2,457,950 4,627,379 7,085,329 - Capital outlay fund 2,582,972 10,137,217 865,986 335,857 13,922,032 -
Unrestricted 2,270,856 10,159,366 1,104,927 11,822,516 25,357,665 11,867,254
Total net position $ 50,087,994 $ 111,734,110 $ 20,817,757 $ 19,970,630 $ 202,610,491 $ 13,216,160
Operating revenues $ 15,091,372 $ 39,061,562 $ 3,483,226 $ 16,219,646 $ 73,855,806 $ 28,609,186 Operating expenses 14,184,457 23,752,666 5,364,472 17,148,792 60,450,387 25,978,738 Operating income (loss) 906,915 15,308,896 (1,881,246) (929,146) 13,405,419 2,630,448
Nonoperating rev (exp) (684,605) (2,920,355) 1,027,397 2,629 (2,574,934) 107,672
Income (loss) before contributions and transfers
222,310 12,388,541 (853,849) (926,517) 10,830,485 2,738,120
Capital contributions - - 619,001 30,608 649,609 - Transfers in - - - 2,110,468 2,110,468 - Transfers out (2,039,748) (3,672,060) (79,676) - (5,791,484) -
Change in net position (1,817,438) 8,716,481 (314,524) 1,214,559 7,799,078 2,738,120
Total net position – beginning 51,905,432 103,017,629 21,132,281 18,756,071 194,811,413 10,478,040
Total net position – ending $ 50,087,994 $ 111,734,110 $ 20,817,757 $ 19,970,630 $ 202,610,491 $ 13,216,160
Internal ServiceWater UtilityWastewater
Utility Century Center Other Total Enterprise
The City of South Bend maintains two types of proprietary funds: enterprise and internal service.
The City maintains seven (7) enterprise funds. Information is presented separately in the Proprietary Statement of Net Position, the Proprietary Statement of Revenues and Expenditures, and Changes in Fund Net Position for the Water Utility, Wastewater Utility and Century Center, which are considered major enterprise funds. Data from the other four (4) non-major enterprise funds (Consolidated Building Department, Parking Garage, Solid Waste, and Emergency Medical Services) are combined into a single, aggregated presentation.

City of South Bend, Indiana
Management’s Discussion and Analysis (Continued)
20
The City maintains six (6) internal service funds. The City of South Bend uses internal service funds to account for its business insurance and self-funded liability insurance program, self-funded employee health benefits program, police take-home vehicle program, unemployment compensation claims, 311 call center and central services unit (a department that accounts for expenses related to fuel, vehicle repairs, printing and other services provided to City departments on a cost-reimbursement basis). The internal service funds have been combined into a single, aggregated presentation.
As of December 31, 2016, City enterprise funds reported a net position of $202,610,491, an increase of $7,799,078, or 4.0%, from the net position at December 31, 2015.
At December 31, 2016, net position includes net investment in capital assets of $145,288,974, restricted net position of $31,963,852 and unrestricted net position of $25,357,665.
During 2016, the Water utility experienced a decrease in net position of $1,817,438 and the Wastewater utility experienced an increase in net position of $8,716,481. The Water utility experienced increase operating revenues of $887,087 while the Wastewater utility experienced an increase in operating revenue of $2,426,061. The Wastewater utility had the benefit of a 5% rate increase during 2016 but the Water utility had no rate increase. Through a series of sewer rate increases approved by the South Bend Common Council, the Wastewater utility continues to build its fund balances in order to pay for the mandated Long Term Control Plan, a multi-year program being built by the City to control wastewater overflow events. On March 27, 2017, the Common Council passed an ordinance which will allow the City to increase water rates in 2018 by 22% and in 2019 by 22% provided the rates are also approved by the Indiana Utility Regulatory Commission.
During 2016, Century Center experienced a decrease in net position of $314,524, primarily as the result of expenses outpacing revenue in 2016.
Nonmajor Enterprise Funds experienced an increase in net position of $1,214,559 during 2016. The Parking Garage Fund reported an increase in net position of $93,169 primarily as the result of deferred capital improvements. The Consolidated Building Fund reported an increase in net position of $684,927 during 2016 as the result of underspending budgeted monies. The Solid Waste Fund reported a decrease in net position of $53,611 and continues to accumulate capital lease debt to finance new trash trucks. A solid waste fee increase of 9.1% was approved for 2016 to help shore up the finances of the fund.

City of South Bend, Indiana
Management’s Discussion and Analysis (Continued)
21
Internal Services Funds reported net position of $13,216,160 at December 31, 2016, an increase of $2,738,120, or 26.1%, compared to net position at December 31, 2015. The Liability Insurance Fund increased its net position by $210,902 in 2016 as the result of public safety and parks fund paying into the fund which was not done in 2015 due to budget constraints. The Central Services Fund increased its net position by $7,744. The Self-Funded Employee Benefits Fund had an increase in its net position of $2,393,888 due to a 10% employer rate increase and more modest growth in medical insurance claims. In January 2016, the City opened the Activate Health and Wellness Center for the benefit of employees and their families and to control future health care cost increases. The 311 Call Center is a fully allocated fund which supports most city departments. Therefore, this fund has no fund balance as of December 31, 2016.
Fiduciary Funds
Fiduciary funds are used to account for resources held for the benefit of parties outside the government. The City maintains six fiduciary funds, which consist of two pension trust funds (1925 Police Pension and 1937 Firefighters’ Pension), one private-purpose trust fund (Cemetery) and three agency funds (Payroll, Police Distributions Payable and Morris/Palais Royale Box Office).
Pension Trust Private Purpose Trust Agency
Total assets $ 961,577 $ 427,872 $ 2,930,775 Total liabilities 525 - 2,930,775
Total net position $ 961,052 $ 427,872 $ -
Total additions 10,889,614 399,329 - Total deductions 11,558,030 - -
Changes in net position $ (668,416) $ 399,329 $ -
Effective in fiscal 2009, with the passage of State legislation, the State of Indiana began making contributions to the 1925 Police and 1937 Firefighters’ Pension Funds. These funds no longer receive property tax revenue distributions beyond fiscal 2009. The administration of the pension plans is the responsibility of the City.
The decline in the net asset position of the pension trust is the result of timing differences in the payment of pension benefits and the contributions received from the State of Indiana (the State reimburses in June and September for expenses paid in the previous calendar year), as well as the cost of healthcare benefits to pension members which are not covered by State contributions. In 2016, the regular Fire Department budget paid retiree health care costs while this change will occur in 2017 for the Police Department. In other words, the 1925 Police and 1937 Firefighters’ pension funds will no longer pay retiree health insurance costs. Rather, these costs will be paid from the regular police and fire operating budgets.

City of South Bend, Indiana
Management’s Discussion and Analysis (Continued)
22
The increase in the private purpose trust fund is due to the City taking in cash from a trust fund for the Bowman Cemetery which was previously held in the name of an outside association. These funds will be used for necessary cemetery improvements.
General Fund Budgetary Highlights
The City prepares an annual budget for General Fund expenditures, which is subject to City of South Bend Common Council approval for adoption, before November 1 of the year preceding the budget period, according to state statute concerning the annual budget of second class cities and towns. The Common Council adopted the 2016 budget at its meeting held in October 2015.
The General Fund budget applicable for fiscal 2016 is reported as follows:
Actual BudgetaryOriginal Final Basis Variance
Revenue $ 53,852,368 $ 56,484,084 $ 56,474,525 $ (9,559)Expenditures 53,852,368 55,117,963 53,862,310 1,255,653
Surplus (deficit) $ - $ 1,366,121 $ 2,612,215 $ 1,246,094
General Fund revenue/transfers in was originally budgeted at $53,852,368 for fiscal 2016. During the year, the General Fund revenue/transfers in budget was increased by $2,631,716 to $56,484,084. The budget may be increased or decreased at any time based on updated revenue projections. By closely aligning the budget with actual results, more meaningful analysis is made possible. The revenue/transfers in budget was increased primarily due to an increase in the property tax estimate because of higher collections than anticipated.
During 2016, the General Fund collected $56,474,525 in revenue/transfers in on a budgetary basis, which was $2,622,157 higher than the original budget. The primary reason for the revenue pickup was a change in property tax collections that were higher than budgeted due to higher assessed property values and collection rates.
General Fund expenditures/transfers out were originally budgeted at $53,852,368 for fiscal 2016. During the year, the General Fund expenditure/transfers out budget were increased by $1,265,595 to $55,117,963. Additional appropriations were passed for Fire Department overtime and other purposes. Carry forward of unspent encumbrances from 2015 also increased the 2016 amended budget.

City of South Bend, Indiana
Management’s Discussion and Analysis (Continued)
23
General Fund spending is reviewed on a monthly basis under the direction of the City Controller to ensure spending remains within budgetary constraints. Monthly reviews are conducted as required with General Fund department management to review spending projections to ensure that annual expenditures remain within the budgetary levels. Budget amendments for cost-neutral redistribution between expense categories (i.e., personnel, supplies, services, capital) were submitted to Common Council four times during 2016, as required to adjust the budget to prevent any budget overruns in any expenditure category.
Additional appropriations for projects, initiatives, or unbudgeted spending requirements within the General Fund are presented to the Common Council for adoption as deemed necessary by the Mayor.
General Fund expenditures/transfers out incurred on a budgetary basis, including cash expended and outstanding encumbrances as of year-end December 31, 2016, amounted to $53,862,310. The expenditures/transfers out and commitments as of year-end December 31, 2016 are less than the 2016 amended General Fund budget by $1,255,653 or 2.2%. The largest savings were in the police and administration/finance department budgets as personnel and other costs spent were less than budgeted due to position vacancies and other factors.
Capital Assets and Debt Administration
Statement of Capital Assets
Governmental Business type Government-wideActivities Activities Activities
2016 2015 2016 2015 2016 2015
Assets not depreciatedLand $ 14,707,088 $ 15,106,806 $ 2,614,014 $ 2,614,016 $ 17,321,102 $ 17,720,822 Construction in progress 23,595,717 5,339,423 19,259,541 16,644,050 42,855,258 21,983,473
Total 38,302,805 20,446,229 21,873,555 19,258,066 60,176,360 39,704,295
Assets depreciatedBuildings 125,966,988 128,082,279 84,190,901 85,178,794 210,157,889 213,261,073 Non-building improvements 21,377,908 16,616,553 28,186,217 28,186,217 49,564,125 44,802,770 Machinery and equipment 47,301,986 45,543,924 41,959,457 40,171,610 89,261,443 85,715,534 Roads and Infrastructure 437,067,498 434,344,887 210,940,599 199,721,525 648,008,097 634,066,412
Total Cost 631,714,380 624,587,643 365,277,174 353,258,146 996,991,554 977,845,789
Accumulated depreciationBuildings 49,668,561 47,274,258 35,418,271 34,631,698 85,086,832 81,905,956 Non-building improvements 9,936,113 9,242,882 7,441,963 6,193,452 17,378,076 15,436,334 Machinery and equipment 33,115,197 30,808,402 22,720,699 22,524,631 55,835,896 53,333,033 Roads 303,916,980 292,321,510 72,354,498 68,662,837 376,271,478 360,984,347
Total 396,636,851 379,647,052 137,935,431 132,012,618 534,572,282 511,659,670
Net Depreciated Assets 235,077,529 244,940,591 227,341,743 221,245,528 462,419,272 466,186,119
$ 505,890,414 Net Capital Assets $ 273,380,334 $ 265,386,820 $ 249,215,298 $ 240,503,594 $ 522,595,632

City of South Bend, Indiana
Management’s Discussion and Analysis (Continued)
24
The investment in capital assets includes land and land improvements, buildings and building improvements, vehicles, information technology equipment, machinery and equipment, and construction in progress. A detailed explanation of these capital assets can be found in the Notes to the Basic Financial Statements.
Under the category of roads and infrastructure, the current cost amount of $648,008,097 includes estimated costs derived primarily from the City’s 2006 implementation of GASB Statement No. 34, which required the retroactive reporting of infrastructure capital assets. All other assets are recorded at historical cost.
Major Capital Asset Project Spending in 2016
Included in capital asset additions for 2016 were the following projects:
• Wastewater - $7.40 million - Digester #2 Upgrades
• Wastewater - $5.8 million - Primary Clarifier Rehabilitation
• Infrastructure - $2.1 million - Bartlett Street/Memorial Hospital Parking Lot
• Infrastructure - $1.0 million - Ignition Park Improvements
• Infrastructure - $1.8 million - Western Avenue Streetscape
• Wastewater - $13.2 million - Secondary Clarifier Improvements (construction in progress)
• Infrastructure - $13.7 million - Main, Michigan, St. Joseph Streetscape (smart streets – construction in progress)
Capital Assets Analysis
As of December 31, 2016, government-wide capital assets were valued at $522,595,632, net of accumulated depreciation, an increase of $16,705,218, or 3.3%, since December 31, 2015. Construction in Progress increased by $20,871,785, and capitalized assets in land, buildings, improvements, machinery and equipment, and roads decreased by $3,766,847, net of depreciation, since December 31, 2015. On January 1, 2013, the City instituted a new capitalization policy that included significantly higher thresholds for expenditures to qualify as capital assets. Consequently, many purchases formerly considered as capital assets no longer qualify as such. The asset decrease is the result of fewer assets being added to the register as those assets that remain continue to depreciate.
At December 31, 2016, the cost of Roads & Infrastructure ($648,008,097) was the major asset class followed by Buildings ($210,157,889) and Machinery & Equipment ($89,261,443).
Total depreciation expense was $31,308,797 for 2016, as compared to $30,426,526 for 2015. Depreciation expense was $19,840,701 for governmental activities and $11,468,096 for business-type activities for 2016.
Additional information on capital assets can be found in the notes to the financial statements in Note 6.

City of South Bend, Indiana
Management’s Discussion and Analysis (Continued)
25
Debt Administration
Outstanding debt principal as of December 31, 2016 was $236,909,378, a decrease of $14,728,071, or 5.9%, from 2015. City outstanding debt includes revenue bonds, mortgage bonds, notes and loans payable and capital leases.
Type Beginning Additions Retirements Ending
Revenue bonds 210,687,811$ 3,300,000$ (19,470,632)$ 194,517,179$ Mortgage bonds 19,756,538 - (2,108,123) 17,648,415 Notes and loans 8,290,651 - (1,061,065) 7,229,586 Capital leases 12,902,449 8,898,799 (4,287,050) 17,514,198
Total Debt 251,637,449$ 12,198,799$ (26,926,870)$ 236,909,378$
During 2016, the City entered into capital lease agreements in the amount of $8.90 million to purchase certain vehicles, copiers, and equipment. The lease terms are typically for five years with semi-annual debt service paid from the operating budgets of the user departments. Capital lease financing is used to acquire police vehicles, public works vehicles, computer replacements, copiers and other vehicles and equipment. The City solicits competitive financing proposals for lease financing from local and national companies and the interest rate achieved during 2016 was on average less than 2% for these leases.
During 2016, the City refunded Waterworks bond in the amount of $3,300,000 to take advantage of lower interest rates. The net present value of the interest savings is $160,657 over the remaining term of the bonds.
Under the Indiana Constitution and State statute, the City's general obligation bonded debt and certain other debt is subject to a legal limitation based upon 2% of total assessed value of real and personal property. The City had no general obligation bonded debt outstanding at December 31, 2016 and none of the above debt issuance amounts are subject to this debt limitation. A calculation of the City’s legal debt limitation can be found in the statistical debt capacity section of this document.
Additional information on debt can be found in the Notes to Financial Statements in Note 8 - Leases and Note 9 - Long-term Debt.
Significant Subsequent Events
On January 18, 2017, the City paid off the 2005 Southside Tax Incremental Financing (TIF) revenue bonds’ $3,800,000 outstanding balance. This early debt payoff was paid from the TIF No. 3 - Southside Development fund, a nonmajor capital project fund. These bonds had a February 1, 2027 original maturity.
On January 23, 2017, the Common Council approved the Eddy Street Commons Phase 2 revenue bonds in an amount not to exceed $25 million. These bonds are financing infrastructure public improvements.

City of South Bend, Indiana
Management’s Discussion and Analysis (Continued)
26
On March 27, 2017, the Common Council approved a water rate increase of 22 percent in 2018 and a second increase of 22 percent in 2019 to fund the operating and capital needs of the Water Utility. These rate increases will be effective if approved by the Indiana Utility Regulatory Commission.
Economic Factors and 2017 Budget
Economic Factors
Property tax revenue, historically and at present, is the principal source of revenue for funding of governmental activities within the City of South Bend.
The State of Indiana General Assembly enacted property tax reform legislation in March 2008. Known as the “Circuit Breaker”, House Enrolled Act 1001 (HEA 1001) limits property taxes paid to 1% of gross assessed value for residential homesteads, 2% for agricultural/rental properties, and 3% for all other real and personal property.
Under current legislation, all Indiana localities assess properties based on market values. Each year properties are “trended”, which involves comparing property values to sales activity in the neighborhood and adjusting the current assessed values up or down according to the trended data.
The Circuit Breaker legislation was phased in commencing in fiscal 2009 and has led to significant reductions in property tax revenues available to fund city governmental operations since then. In 2016, the primary funds supported by property taxes (General Fund, Parks and Recreation Fund, and Cumulative Capital Development Fund) lost approximately $30.9 million in taxable property tax levy due to the circuit breaker caps (Indiana Legislative Services Agency, Circuit Breaker Report, December 2016).
As a consequence of the state enacted legislation in 2008, the City enacted a 0.95% local option income tax increase to partially offset the property tax revenue loss. The local option tax increase became effective in October 2009, and has resulted in an increase in local income taxes available to the City to fund ongoing governmental operations of public safety, parks and recreation, highways and streets and general government.
Management of the City of South Bend will continue to oversee the financial affairs from a posture of fiscal conservatism similar to the management practices engaged in during fiscal 2016. Special attention will be given to maintaining adequate fund reserves in the General Fund and the income tax funds as they are very important to the continued financial strength of the City.
City Management believes that the national economic recovery will continue according to the predictions of governmental economists, with low to zero inflation over the next fiscal period. In addition, job creation is the primary engine to drive economic recovery, as the Congressional Budget Office (CBO) predicts a growth in Gross Domestic Product (GDP) of 2.1% for 2017. Unemployment rates in the South Bend-Mishawaka Metropolitan Area continue to improve and were 4.8% in January 2017 as compared to a high of 13.0% in January 2010 (Bureau of Labor Statistics).

City of South Bend, Indiana
Management’s Discussion and Analysis (Continued)
27
2017 Budget and Beyond
The City will engage to ensure effective delivery of required services to taxpayers and residents within the constraints of available financial resources. The City will continue to provide required services within the constraints of a balanced General Fund budget. For 2017 and 2018, the City has enacted a “zero growth” budget expenditure target goal for all funds supported by property and income tax revenue. In addition, the City has engaged in a process of program budgeting with the Center for Priority Based Budgeting for the 2017 and 2018 budgets. This program budgeting is in addition to the state-required fund and account budgeting through the Indiana Department of Local Government Finance.
Preliminary projections of circuit breaker property tax losses indicate a potential decline of property tax revenue of $2.54 million dollar in the General Fund, $510 thousand dollars in the Parks & Recreation Fund and $3.8 million dollars in the Tax Increment Financing funds in fiscal year 2020 due to the expiration of some special credits to local governments in Saint Joseph County and Lake County. City Management is aware of this fiscal situation and is developing strategies to address this matter. One strategy is to maintain a well-financed Rainy Day Fund. This fund received a special distribution of county option income tax funds of $1.4 million dollars in May 2016 and had cash reserves of $10.2 million dollars at February 28, 2017. No spending is currently planned for this fund.
Through its Office of Innovation, the City continues to pursue reengineering programs targeted to create efficiency and cost improvements within City operations. These include purchasing process reengineering, back-office process improvements for human resources, performance management and other customer service operations. These initiatives, upon successful deployment completion, will achieve the desired results to create efficiency gains in the delivery of services to taxpayers.
The City is committed to creating a budget for fiscal 2018 that will remain fiscally responsible to the effective delivery of required services to city residents and stakeholders within the existing revenue constraints. Specific concerns for the 2018 budget include the continuing impact of circuit breaker property tax reform on City revenue, high health and pension costs and other stagnant or declining revenue sources such as gasoline, wheel and auto excise taxes.

City of South Bend, Indiana
Management’s Discussion and Analysis (Continued)
28
Requests for Information
This Management’s Discussion and Analysis, as contained within the City of South Bend Comprehensive Annual Financial Report, is intended to provide readers with a general overview of the financial condition of the City of South Bend as of December 31, 2016. Questions concerning any of the information provided in this report, or requests for additional information, should be addressed to: John H. Murphy, CFO City of South Bend Department of Administration and Finance 227 W. Jefferson Boulevard, 12th Floor South Bend, Indiana 46601 Telephone 574-235-7678 Email [email protected]
Jennifer C. Hockenhull, Controller City of South Bend Department of Administration and Finance 227 W. Jefferson Boulevard, 12th Floor South Bend, Indiana 46601 Telephone 574-235-9822 Email [email protected]
City of South Bend June 30, 2017

City of South Bend, Indiana
Statement of Net PositionDecember 31, 2016
Primary GovernmentGovernmental
ActivitiesBusiness-type
Activities TotalAssets
Cash and cash equivalents $ 58,142,559 $ 7,234,289 $ 65,376,848Investments 133,745,451 20,397,926 154,143,377Receivables:
Taxes 153,965 - 153,965Accounts 544,503 8,492,882 9,037,385Interest 318,143 96,829 414,972Intergovernmental 960,421 - 960,421Loans 5,336,870 - 5,336,870Allowance for doubtful accounts - (130,000) (130,000)
Internal balances 80,588 (80,588) -Inventory 906,849 672,513 1,579,362Prepaid expenses 614,061 41,001 655,062Restricted assets 1,100 31,963,851 31,964,951Property held for resale 13,718,551 - 13,718,551Capital assets:
Assets not subject to depreciation 38,302,805 21,873,555 60,176,360Assets subject to depreciation 235,077,529 227,341,743 462,419,272
Total assets 487,903,395 317,904,001 805,807,396
Deferred Outflows of Resources Unamortized loss on refunding 2,291,565 2,275,054 4,566,619Deferred outflows related to pensions 26,285,600 - 26,285,600
Total deferred outflows of resources 28,577,165 2,275,054 30,852,219
LiabilitiesAccounts payable 6,609,556 3,733,489 10,343,045Due to other governmental units - 101,142 101,142Performance deposits payable 86,452 5,000 91,452Accrued liabilities and other:
Accrued payroll payable 1,304,006 473,573 1,777,579Accrued interest payable 46,131 294,143 340,274Taxes payable 2,314 - 2,314
Customer deposits payable - 1,698,134 1,698,134Other current payables 3,659 68,664 72,323Noncurrent liabilities:
Due within one year: Accrued interest payable from restricted assets 1,657,778 - 1,657,778Compensated absences 4,756,341 750,238 5,506,579Notes and loans payable 210,266 183,384 393,650Mortgage bonds payable 1,744,275 295,725 2,040,000Claims payable 2,317,615 - 2,317,615Capital leases 2,858,050 2,071,583 4,929,633Revenue bonds payable 11,962,653 8,210,000 20,172,653
The Notes to Financial Statements are anIntegral Part of this Statement. 29

City of South Bend, Indiana
Statement of Net Position (Continued)December 31, 2016
Primary GovernmentGovernmental
ActivitiesBusiness-type
Activities TotalLiabilities (Continued)
Noncurrent liabilities (Continued): Due in more than one year:
Notes and loans payable $ 4,437,115 $ 2,398,821 $ 6,835,936Mortgage bonds payable 10,347,275 5,261,141 15,608,416Capital leases 8,071,025 4,513,540 12,584,565Net OPEB obligation 13,285,244 - 13,285,244Net pension liability 180,714,296 - 180,714,296Revenue bonds payable 87,077,479 87,267,047 174,344,526
Total liabilities 337,491,530 117,325,624 454,817,154
Deferred Inflows of Resources Unamortized service agreement - 239,584 239,584Unamortized gain on sale/leaseback - 3,356 3,356Deferred inflows related to pensions 16,306,392 - 16,306,392
Total deferred inflows of resources 16,306,392 242,940 16,549,332
Net PositionNet investment in capital assets 161,341,318 145,288,974 306,630,292Restricted for:
Debt service fund 5,382,083 864,299 6,246,382Customer repair and deposit fund - 3,294,355 3,294,355Cash with fiscal agent - 1,293,465 1,293,465Bond reserve fund 3,287,034 5,504,372 8,791,406Operating reserve fund - 7,085,329 7,085,329Capital outlay fund - 13,922,032 13,922,032
Unrestricted (7,327,797) 25,357,665 18,029,868
Total net position $ 162,682,638 $ 202,610,491 $ 365,293,129
The Notes to Financial Statements are anIntegral Part of this Statement. 30

City of South Bend, Indiana
Program Revenues
ExpensesCharges for
ServicesOperating Grantsand Contributions
Capital Grants andContributions
Functions/ProgramsPrimary government:
Governmental activities: General government $ 15,618,817 $ 1,622,788 $ 732,782 $ -Public safety 55,029,909 975,712 325 -Highways and streets 13,550,535 707,547 179,720 -Community and economic development 28,436,368 481,293 1,057,658 -Culture and recreation 17,156,094 4,383,977 673,787 -Interest on long-term debt 4,727,630 - - -
Total governmental activities 134,519,353 8,171,317 2,644,272 -
Business-type activities:Water Utility 14,900,039 15,091,372 - -Wastewater Utility 26,420,526 39,061,562 - -Century Center 5,364,472 4,796,676 - 619,001Consolidated Building 3,240,172 1,764,100 - 30,608Parking Garage 909,857 996,197 - -Solid Waste 5,794,913 5,839,143 - -Emergency Medical Services 7,437,349 7,921,172 - -
Total business-type activities 64,067,328 75,470,222 - 649,609
Total primary government $ 198,586,681 $ 83,641,539 $ 2,644,272 $ 649,609
General revenues:Property taxes Income taxes Grants and contributions not restricted to specific programs Investment income Other miscellaneous income Gain (loss) on sale of fixed assets
Total general revenues
Transfers
Change in Net Position
Net Position - Beginning of year
Net Position - End of year
The Notes to Financial Statements are anIntegral Part of this Statement. 31

Statement of ActivitiesYear Ended December 31, 2016
Net (Expense) Revenue and Changes in Net PositionPrimary Government
GovernmentalActivities
Business-typeActivities Total
$ (13,263,247) $ - $ (13,263,247)(54,053,872) - (54,053,872)(12,663,268) - (12,663,268)(26,897,417) - (26,897,417)(12,098,330) - (12,098,330)(4,727,630) - (4,727,630)
(123,703,764) - (123,703,764)
- 191,333 191,333- 12,641,036 12,641,036- 51,205 51,205- (1,445,464) (1,445,464)- 86,340 86,340- 44,230 44,230- 483,823 483,823
- 12,052,503 12,052,503
(123,703,764) 12,052,503 (111,651,261)
76,331,581 - 76,331,58131,463,184 - 31,463,18425,846,397 - 25,846,3971,458,787 570,982 2,029,7696,745,542 - 6,745,542
- (1,143,391) (1,143,391)
141,845,491 (572,409) 141,273,082
3,681,016 (3,681,016) -
21,822,743 7,799,078 29,621,821
140,859,895 194,811,413 335,671,308
$ 162,682,638 $ 202,610,491 $ 365,293,129
32

City of South Bend, Indiana
General FundParks andRecreation
Public SafetyLOIT COIT EDIT
AssetsCash and cash equivalents $ 3,710,448 $ 1,001,514 $ 209,382 $ 1,992,931 $ 2,483,512Investments 30,638,155 3,488,926 729,415 6,942,676 8,651,688Receivables:
Taxes - - - - -Accounts 152,799 1,670 - 920 150,000Interest 71,819 8,144 1,742 16,696 20,679Intergovernmental 63,498 - - - -Loans - - - - -
Due from other funds 47,376 - - - -Advances to other funds 494,730 - - 1,351,598 -Inventory - 27,113 - - -Property held for resale - - - 174,999 270,001
Total assets $ 35,178,825 $ 4,527,367 $ 940,539 $ 10,479,820 $ 11,575,880
LiabilitiesAccounts payable $ 272,439 $ 49,534 $ - $ 442,554 $ 375,991Due to other funds 19,935 6,066 - - -Advances from other funds - - - - -Performance deposits payable 73,106 2,618 - - -Accrued liabilities and other:
Accrued payroll payable 858,870 122,918 114,082 23,299 -Taxes payable 1,853 461 - - -
Other current payables - - - - -
Total liabilities 1,226,203 181,597 114,082 465,853 375,991
Fund BalancesNonspendable 494,730 27,113 - 1,526,597 270,001Restricted - 4,318,657 826,457 - -Committed - - - - -Assigned 1,380,036 - - 8,487,370 10,929,888Unassigned 32,077,856 - - - -
Total fund balances 33,952,622 4,345,770 826,457 10,013,967 11,199,889
Total liabilities and fundbalances $ 35,178,825 $ 4,527,367 $ 940,539 $ 10,479,820 $ 11,575,880
The Notes to Financial Statements are anIntegral Part of this Statement. 33

Governmental FundsBalance Sheet
December 31, 2016
Rainy Day River West TIF Nonmajor Funds Total
$ 2,267,458 $ 7,238,085 $ 36,120,468 $ 55,023,7987,899,033 25,214,956 39,412,161 122,977,010
- 8,475 145,490 153,965- - 173,625 479,014
18,923 60,086 94,238 292,327- 28,848 868,075 960,421- 201,374 5,135,496 5,336,870- - 30,048 77,424- - 4,468,117 6,314,445- - - 27,113- 9,583,608 3,689,943 13,718,551
$ 10,185,414 $ 42,335,432 $ 90,137,661 $ 205,360,938
$ - $ 998,726 $ 3,763,296 $ 5,902,540- 18,475 58,007 102,483- 400,000 5,883,254 6,283,254- 3,232 7,496 86,452
- - 119,847 1,239,016- - - 2,314- - 3,659 3,659
- 1,420,433 9,835,559 13,619,718
- 9,583,608 12,158,948 24,060,997- 31,331,391 65,350,135 101,826,640- - 2,698,694 2,698,694
10,185,414 - 2,396,118 33,378,826- - (2,301,793) 29,776,063
10,185,414 40,914,999 80,302,102 191,741,220
$ 10,185,414 $ 42,335,432 $ 90,137,661 $ 205,360,938
34

City of South Bend, Indiana
Governmental FundsReconciliation of the Balance Sheet to the
Statement of Net PositionDecember 31, 2016
Fund Balance Reported in Governmental Funds $ 191,741,220
Capital assets used in governmental activities are not financial resourcesand are not reported in the funds 271,972,273
Prepaid expenses are not available to pay for current periodexpenditures, and therefore are deferred in the funds 411,345
Deferred outflows of resources related to pensions are not available topay for current period expenditures, and therefore are reported in thefunds 26,285,600
Deferred inflows on refunding are not due and payable in the currentperiod and are not reported in the funds 2,291,565
Notes and loans payable, mortgage bonds payable, revenue bondspayable, and capital leases are not due and payable in the currentperiod and are not reported in the funds (126,648,983)
Accrued interest is not due and payable in the current period and is notreported in the funds (1,703,826)
Employee compensated absences are payable over a long period of yearsand do not represent a claim on current financial resources; therefore,they are not reported as fund liabilities (4,576,784)
Deferred inflows of resources related to pensions do not present a claimon current financial resources and are not reported as fund liabilities (16,306,392)
Net OPEB obligations do not present a claim on current financialresources and are not reported as fund liabilities (13,285,244)
Net pension liabilities do not present a claim on current financialresources and are not reported as fund liabilities (180,714,296)
Amounts reported for governmental activities in the statement of net positionare different because - Internal service funds are included as part ofgovernmental activities 13,216,160
Net Position of Governmental Activities $ 162,682,638
The Notes to Financial Statements are anIntegral Part of this Statement. 35

City of South Bend, Indiana
General FundParks andRecreation
Public SafetyLOIT COIT EDIT
RevenueProperty taxes $ 39,362,139 $ 7,902,995 $ - $ - $ -Income taxes - - 6,791,160 9,454,023 9,594,602Licenses and permits 224,677 - - - -Professional sports development taxes - - - - -Intergovernmental 15,437,682 667,306 - - -Charges for services 1,973,484 1,679,829 - 560,276 150,000Fines and forfeitures 10,716 - - - 354,660Investment income 228,292 23,834 7,033 97,746 93,264Rental income - 3,474 - - -Other revenue 5,233,773 135,820 - 77,181 3,034
Total revenue 62,470,763 10,413,258 6,798,193 10,189,226 10,195,560
ExpendituresCurrent:
General government 4,932,618 - - 9,284,181 1,631,294Public safety 56,211,109 - 6,525,003 - -Highways and streets 989,907 - - - -Community and economic
development - - - - -Culture and recreation 1,415,100 10,640,291 - - -
Capital outlay - - - - -Debt service:
Principal 23,687 189,555 - 1,214,597 835,000Interest on long-term debt 3,318 5,785 - 145,944 49,030
Total expenditures 63,575,739 10,835,631 6,525,003 10,644,722 2,515,324
Excess of Revenue (Under) OverExpenditures (1,104,976) (422,373) 273,190 (455,496) 7,680,236
Other Financing Sources (Uses) Issuance of debt 10,924 21,393 - 15,855 -Proceeds from sale of capital assets - - - - -Transfers in 4,627,122 926,268 - 3,039 -Transfers out (202,504) - - (2,609,041) (6,709,570)
Total other financingsources (uses) 4,435,542 947,661 - (2,590,147) (6,709,570)
Net Change in Fund Balances 3,330,566 525,288 273,190 (3,045,643) 970,666
Fund Balances - Beginning of year 30,622,056 3,820,482 553,267 13,059,610 10,229,223
Fund Balances - End of year $ 33,952,622 $ 4,345,770 $ 826,457 $ 10,013,967 $ 11,199,889
The Notes to Financial Statements are anIntegral Part of this Statement. 36

Governmental FundsStatement of Revenue, Expenditures, and Changes in Fund Balances
Year Ended December 31, 2016
Rainy Day River West TIF Nonmajor Funds Total
$ - $ 17,513,853 $ 10,945,595 $ 75,724,5821,405,850 - 4,217,549 31,463,184
- - - 224,677- - 673,787 673,787- 396,000 11,458,825 27,959,813- - 2,698,519 7,062,108- - 391,405 756,781
86,865 279,969 807,524 1,624,527- 88,616 137,699 229,789- 394,785 1,105,577 6,950,170
1,492,715 18,673,223 32,436,480 152,669,418
- - 463,540 16,311,633- - 1,614,169 64,350,281- - 10,304,861 11,294,768
- 13,765,421 7,128,732 20,894,153- - 1,015,215 13,070,606- - 27,056,295 27,056,295
- 2,485,000 8,307,488 13,055,327- 1,108,396 3,630,548 4,943,021
- 17,358,817 59,520,848 170,976,084
1,492,715 1,314,406 (27,084,368) (18,306,666)
- - 4,950,881 4,999,053- 458,746 82,335 541,081- 22,199 13,962,422 19,541,050- (2,623,500) (3,715,419) (15,860,034)
- (2,142,555) 15,280,219 9,221,150
1,492,715 (828,149) (11,804,149) (9,085,516)
8,692,699 41,743,148 92,106,251 200,826,736
$ 10,185,414 $ 40,914,999 $ 80,302,102 $ 191,741,220
37

City of South Bend, Indiana
Governmental FundsReconciliation of the Statement of Revenue, Expenditures,
and Changes in Fund Balances of Governmental Fundsto the Statement of Activities
Year Ended December 31, 2016
Net Change in Fund Balances - Total governmental funds $ (9,085,516)
Amounts reported for governmental activities in the statementof activities are different because:
Governmental funds report capital outlays as expenditures; however, in thestatement of activities, these costs are allocated over their estimated usefullives as depreciation:
Capital outlay 29,689,464Depreciation expense (19,691,675)Net book value of assets disposed of and transferred (2,092,111)
Prepaid expenses recorded in the statement of net position do not require theuse of current financial resources, and therefore are not reported in the fundstatements 208,465
Debt proceeds (from notes and loans payable, mortgage bonds payable, revenuebonds payable, and capital leases) provide financial resources to governmentalfunds, but issuing debt increases long-term liabilities in the statement of netposition (4,999,053)
Repayment of debt principal is an expenditure in the governmental funds, but notin the statement of activities (where it reduces long-term debt) 13,055,327
Other adjustments related to debt premiums, discounts, deferred inflows, anddeferred outflows 84,284
Changes in accrued interest payable and other 134,556
Changes in compensated absences reported in the statement of activities do notrequire the use of current resources, and therefore are not reported in thefund statements until they come due for payment (95,240)
Changes in the net OPEB obligation reported in the statement of activities donot require the use of current resources, and therefore are not reported inthe fund statements until they come due for payment (1,624,309)
Changes in the net pension asset, net pension liabilities, and related deferredinflows and outflows reported in the statement of activities do not requirethe use of current resources, and therefore are not reported in the fundstatements until they come due for payment 13,500,431
Internal service funds are included as part of governmental activities - Net changein position 2,738,120
Change in Net Position of Governmental Activities $ 21,822,743
The Notes to Financial Statements are anIntegral Part of this Statement. 38

City of South Bend, Indiana
Proprietary FundsStatement of Net Position
December 31, 2016
Enterprise Funds
Governmental
Activities
Water Utility
Wastewater
Utility Century Center
Nonmajor
Enterprise Total
Proprietary
Internal Service
Fund
AssetsCurrent assets:
Cash and cash equivalents $ 848,168 $ 2,964,074 $ 1,380,151 $ 2,041,896 $ 7,234,289 $ 3,118,761Investments 2,953,621 10,325,798 - 7,118,507 20,397,926 10,768,441Receivables:
Accounts 698,698 2,888,911 355,233 4,550,040 8,492,882 65,489Interest 22,128 57,009 - 17,692 96,829 25,816Allowance for doubtful accounts (50,000) (80,000) - - (130,000) -
Due from other funds 25,223 3,041 - 1,200 29,464 78,744Inventory 469,161 171,415 31,937 - 672,513 879,736Prepaid expenses 9,167 28,364 3,470 - 41,001 202,716
Total current assets 4,976,166 16,358,612 1,770,791 13,729,335 36,834,904 15,139,703
Noncurrent assets:Restricted assets 8,172,590 21,691,854 865,986 1,233,421 31,963,851 1,100Capital assets:
Assets not subject to depreciation 376,951 19,623,750 713,434 1,159,420 21,873,555 -Assets subject to depreciation 57,317,424 137,906,477 18,133,410 13,984,432 227,341,743 1,408,062
Total noncurrent assets 65,866,965 179,222,081 19,712,830 16,377,273 281,179,149 1,409,162
Total assets 70,843,131 195,580,693 21,483,621 30,106,608 318,014,053 16,548,865
Deferred Outflows of Resources -Unamortized loss on refunding 113,328 2,161,726 - - 2,275,054 -
LiabilitiesCurrent liabilities:
Accounts payable 562,715 2,432,600 264,090 474,084 3,733,489 707,016Due to other governmental units - - - 101,142 101,142 -Due to other funds 72,095 4,330 - 2,436 78,861 4,288Performance deposits payable - - - 5,000 5,000 -Accrued liabilities and other:
Accrued payroll payable 98,886 198,967 - 175,720 473,573 64,990Accrued interest payable 6,630 193,294 - 94,219 294,143 83
Customer deposits payable 1,561,223 - 136,911 - 1,698,134 -Other current payables 43,385 - 25,279 - 68,664 -Compensated absences 245,114 266,190 - 238,934 750,238 179,557Notes and loans payable 20,912 162,472 - - 183,384 -Mortgage bonds payable - 70,725 - 225,000 295,725 -Claims payable - - - - - 2,317,615Capital leases 210,934 595,824 - 1,264,825 2,071,583 13,577Revenue bonds payable 1,375,000 6,835,000 - - 8,210,000 -
Total current liabilities 4,196,894 10,759,402 426,280 2,581,360 17,963,936 3,287,126
Noncurrent liabilities:Advances from other funds - - - 31,191 31,191 -Notes and loans payable 311,650 2,087,171 - - 2,398,821 -Mortgage bonds payable - 270,739 - 4,990,402 5,261,141 -Capital leases 728,876 1,254,995 - 2,529,669 4,513,540 45,579Revenue bonds payable 15,631,045 71,636,002 - - 87,267,047 -
Total noncurrent liabilities 16,671,571 75,248,907 - 7,551,262 99,471,740 45,579
Total liabilities 20,868,465 86,008,309 426,280 10,132,622 117,435,676 3,332,705
Deferred Inflows of ResourcesUnamortized service agreement - - 239,584 - 239,584 -Unamortized gain on sale/leaseback - - - 3,356 3,356 -
Total deferred inflows ofresources - - 239,584 3,356 242,940 -
The Notes to Financial Statements are anIntegral Part of this Statement. 39

City of South Bend, Indiana
Proprietary FundsStatement of Net Position (Continued)
December 31, 2016
Enterprise Funds
Governmental
Activities
Water Utility
Wastewater
Utility Century Center
Nonmajor
Enterprise Total
Proprietary
Internal Service
Fund
Net PositionNet investment in capital assets: $ 39,644,547 $ 79,882,890 $ 18,846,844 $ 6,914,693 $ 145,288,974 $ 1,348,906
Debt service fund 50,069 814,230 - - 864,299 -Customer repair and deposit fund 1,541,424 1,752,931 - - 3,294,355 -Cash with fiscal agent 147,437 248,464 - 897,564 1,293,465 -Bond reserve fund 1,392,739 4,111,633 - - 5,504,372 -Operating reserve fund 2,457,950 4,627,379 - - 7,085,329 -Capital outlay fund 2,582,972 10,137,217 865,986 335,857 13,922,032 -
Unrestricted 2,270,856 10,159,366 1,104,927 11,822,516 25,357,665 11,867,254
Total net position $ 50,087,994 $ 111,734,110 $ 20,817,757 $ 19,970,630 $ 202,610,491 $ 13,216,160
The Notes to Financial Statements are anIntegral Part of this Statement. 40

City of South Bend, Indiana
Proprietary FundsStatement of Revenue, Expenses, and Changes in Net Position
Year Ended December 31, 2016
Enterprise Funds
Governmental
Activities
Water Utility
Wastewater
Utility Century Center
Nonmajor
Enterprise Total
Proprietary
Internal Service
Fund
Operating RevenueMetered revenue $ 10,149,170 $ 38,219,093 $ - $ - $ 48,368,263 $ -Convention fees - - 3,362,396 - 3,362,396 -Fire protection revenue 2,000,428 - - - 2,000,428 -Licenses and permits - - - 1,752,497 1,752,497 -Interest and penalty charges 76,957 667,656 - - 744,613 -Parking fees - - 110,792 993,845 1,104,637 -Solid waste fees - - - 5,511,281 5,511,281 -Employee/Employer contributions - - - - - 21,121,497Charges for sales and services - - - 7,822,894 7,822,894 7,371,837Water leak insurance revenue 974,068 - - - 974,068 -Charges to other funds 1,414,956 - - - 1,414,956 -Other 475,793 174,813 10,038 139,129 799,773 115,852
Total operating revenue 15,091,372 39,061,562 3,483,226 16,219,646 73,855,806 28,609,186
Operating ExpensesCost of water 6,531,883 - - - 6,531,883 -Cost of sewage treatment - 14,414,508 - - 14,414,508 -Other operation and maintenance - - - 14,535,669 14,535,669 9,071,629General and administration 2,359,837 2,505,862 4,302,253 1,142,300 10,310,252 1,172,912Insurance claims and premiums - - - - - 15,585,171Plumbing contractors 1,045,518 - - - 1,045,518 -Customer service 2,144,461 - - - 2,144,461 -Depreciation 2,102,758 6,832,296 1,062,219 1,470,823 11,468,096 149,026
Total operating expenses 14,184,457 23,752,666 5,364,472 17,148,792 60,450,387 25,978,738
Operating Income (Loss) 906,915 15,308,896 (1,881,246) (929,146) 13,405,419 2,630,448
Nonoperating Revenue (Expenses)Investment income 115,235 374,035 932 80,780 570,982 112,274Hotel/Motel tax revenue - - 1,313,450 - 1,313,450 -Interest expense (715,582) (2,667,860) - (233,499) (3,616,941) -(Loss) gain on sale of assets (84,258) (626,530) (286,985) (145,618) (1,143,391) (4,330)Debt service charge - - - - - (272)Other nonoperating general revenue - - - 300,966 300,966 -
Total nonoperating(expenses) revenue (684,605) (2,920,355) 1,027,397 2,629 (2,574,934) 107,672
Income (Loss) - Before contributions 222,310 12,388,541 (853,849) (926,517) 10,830,485 2,738,120
Capital Contributions - Other capitalcontributions - - 619,001 30,608 649,609 -
Transfers In - - - 2,110,468 2,110,468 -
Transfers Out (2,039,748) (3,672,060) (79,676) - (5,791,484) -
Change in Net Position (1,817,438) 8,716,481 (314,524) 1,214,559 7,799,078 2,738,120
Net Position - Beginning of year 51,905,432 103,017,629 21,132,281 18,756,071 194,811,413 10,478,040
Net Position - End of year $ 50,087,994 $ 111,734,110 $ 20,817,757 $ 19,970,630 $ 202,610,491 $ 13,216,160
The Notes to Financial Statements are anIntegral Part of this Statement. 41

City of South Bend, Indiana
Proprietary FundsStatement of Cash Flows
Year Ended December 31, 2016
Enterprise Funds
Governmental
Activities
Water Utility
Wastewater
Utility Century Center
Nonmajor
Enterprise Total
Proprietary
Internal Service
Fund
Cash Flows from Operating ActivitiesReceipts from customers and users $ 13,284,386 $ 38,658,757 $ 3,187,792 $ 16,391,948 $ 71,522,883 $ 5,253,324Receipts from interfund services and reimbursements 1,996,165 23,990 10,059 1,170 2,031,384 23,260,163Payments to suppliers (6,086,376) (6,321,402) (4,172,257) (5,325,142) (21,905,177) (22,332,513)Payments to employees (5,221,969) (7,008,726) - (8,889,487) (21,120,182) (3,274,707)Internal activity - Payments to other funds (572,755) (2,846,998) - (935,789) (4,355,542) (179,059)
Net cash provided by (used in)operating activities 3,399,451 22,505,621 (974,406) 1,242,700 26,173,366 2,727,208
Cash Flows from Noncapital Financing ActivitiesTransfers from other funds - - - 2,110,468 2,110,468 -Loans received from other funds - - - 31,191 31,191 -Hotel/Motel tax - - 1,313,450 - 1,313,450 -Transfers to other funds (2,039,748) (3,672,060) (79,676) - (5,791,484) -Other nonoperating revenue - - - 300,966 300,966 -
Net cash (used in) provided bynoncapital financing activities (2,039,748) (3,672,060) 1,233,774 2,442,625 (2,035,409) -
Cash Flows from Capital and Related FinancingActivities
Proceeds from capital debt refunding 3,300,000 - - - 3,300,000 -Proceeds from capital debt issued for future
capital purchase 976,915 878,127 - 1,700,882 3,555,924 -Proceeds from sales of capital assets 9,521 - - 22,816 32,337 -Purchase of capital assets (360,274) (17,575,639) (113,127) (2,656,877) (20,705,917) (241,192)Principal paid on capital debt (4,866,156) (7,465,416) - (1,255,730) (13,587,302) (10,487)Interest paid on capital debt (703,383) (2,488,229) - (234,627) (3,426,239) (313)
Net cash (used in) provided bycapital and related financingactivities (1,643,377) (26,651,157) (113,127) (2,423,536) (30,831,197) (251,992)
Cash Flows from Investing ActivitiesInterest received on investments 112,485 377,841 932 75,257 566,515 104,446Proceeds from sale and maturities of investment
securities 319,801 6,517,695 - (1,037,258) 5,800,238 (1,775,543)
Net cash provided by (used in)investing activities 432,286 6,895,536 932 (962,001) 6,366,753 (1,671,097)
Net (Decrease) Increase in Cash and CashEquivalents 148,612 (922,060) 147,173 299,788 (326,487) 804,119
Cash and Cash Equivalents - Beginning of year 2,489,427 12,111,777 2,098,964 2,975,529 19,675,697 2,315,742
Cash and Cash Equivalents - End of year $ 2,638,039 $ 11,189,717 $ 2,246,137 $ 3,275,317 $ 19,349,210 $ 3,119,861
The Notes to Financial Statements are anIntegral Part of this Statement. 42

City of South Bend, Indiana
Proprietary FundsStatement of Cash Flows (Continued)
Year Ended December 31, 2016
Enterprise Funds
Governmental
Activities
Water Utility
Wastewater
Utility Century Center
Nonmajor
Enterprise Total
Proprietary
Internal Service
Fund
Statement of Net Position Classification of Cashand Cash Equivalents
Cash and investments $ 3,801,789 $ 13,289,872 $ 1,380,151 $ 9,160,403 $ 27,632,215 $ 13,887,202Restricted cash and investments 8,172,590 21,691,854 865,986 1,233,421 31,963,851 1,100Less amounts classified as investments (9,336,340) (23,792,009) - (7,118,507) (40,246,856) (10,768,441)
Total cash and cash equivalents $ 2,638,039 $ 11,189,717 $ 2,246,137 $ 3,275,317 $ 19,349,210 $ 3,119,861
Reconciliation of Operating Income (Loss) to NetCash from Operating Activities
Operating income (loss) $ 906,915 $ 15,308,896 $ (1,881,246) $ (929,146) $ 13,405,419 $ 2,630,448Adjustments to reconcile operating income (loss)
to net cash from operating activities:Depreciation and amortization 2,102,758 6,832,296 1,062,219 1,470,823 11,468,096 149,026Lease proceeds used for noncapital expenses - - - 299,885 299,885 43,938Changes in assets and liabilities:
Receivables 146,302 (379,560) (215,221) 173,501 (274,978) (21,127)Due from other funds (4,264) 745 10,059 (30) 6,510 (74,572)Inventory (190,715) 45,309 5,489 - (139,917) (28,250)Prepaid expenses and other assets 14,920 6,116 6,997 - 28,033 6,937Accounts payable 253,219 545,563 150,092 165,426 1,114,300 189,769Due to other governments - - - (58,956) (58,956) -Performance deposit - - - (32,437) (32,437) -Due to other funds 68,309 2,253 - (8,307) 62,255 (585)Accrued liabilities and other (16,927) - (128,415) - (145,342) -Accrued payroll payable 36,576 113,749 - 72,279 222,604 31,732Compensated absences payable 35,220 30,254 - 89,662 155,136 56,321Customer deposits 47,138 - 15,620 - 62,758 -Estimate of unfiled claims - - - - - (256,429)
Net cash provided by (used in)operating activities $ 3,399,451 $ 22,505,621 $ (974,406) $ 1,242,700 $ 26,173,366 $ 2,727,208
Noncash Investing, Capital, and Financing ActivitiesCapital assets disposed (at cost) $ 554,395 $ 2,547,395 $ 1,835,418 $ 1,819,908 $ 6,757,116 $ 45,303Capital asset contribution - - 619,001 30,608 649,609 -Work in progress completed transferred to capital
assets - 13,241,010 - - 13,241,010 -Accumulated depreciation on disposals of capital
assets (460,616) (1,927,374) (1,548,433) (1,651,474) (5,587,897) (40,973)
The Notes to Financial Statements are anIntegral Part of this Statement. 43

City of South Bend, Indiana
Fiduciary FundsStatement of Fiduciary Net Position
December 31, 2016
Pension TrustFunds
Private-Purpose Trust
Fund Agency FundsAssets
Cash and cash equivalents $ 213,763 $ 6,413 $ 2,930,775Investments 744,677 22,340 -Receivables - Interest 1,870 54 -Receivables - Accounts 1,267 399,065 -
Total assets $ 961,577 $ 427,872 $ 2,930,775
LiabilitiesAccounts payable $ 170 $ - $ -Accrued liabilities and other 355 - 420,885Customer deposits payable - - 1,692,774Police distribution payable - - 817,116
Total liabilities 525 - $ 2,930,775
Net Position $ 961,052 $ 427,872
The Notes to Financial Statements are anIntegral Part of this Statement. 44

City of South Bend, Indiana
Fiduciary FundsStatement of Changes in Fiduciary Net Position
Year Ended December 31, 2016
Pension TrustFunds
Private-PurposeTrust Fund
AdditionsInvestment income - Interest and dividends $ 9,565 $ 262Contributions:
On behalf 10,858,021 -Other 22,028 399,067
Total contributions 10,880,049 399,067
Total additions 10,889,614 399,329
DeductionsBenefit payments 11,529,995 -Administrative expenses 28,035 -
Total deductions 11,558,030 -
Net (Decrease) Increase in Net Position (668,416) 399,329
Net Position - Beginning of year 1,629,468 28,543
Net Position - End of year $ 961,052 $ 427,872
The Notes to Financial Statements are anIntegral Part of this Statement. 45

City of South Bend, Indiana
Notes to Financial StatementsDecember 31, 2016
Note 1 - Summary of Significant Accounting Policies
The following is a summary of the significant accounting policies used by the City ofSouth Bend:
Reporting Entity
The City of South Bend (the "City") was established under the laws of the State ofIndiana and operates under a Council-Mayor form of government. The accompanyingfinancial statements present the City and its component units, entities for which the Cityis considered to be financially accountable. Although blended component units are legalseparate entities, in substance, they are part of the City's operations.
Blended Component Units
The South Bend Redevelopment Authority is a significant blended component unit of theCity. Although it is legally separate from the City, the Redevelopment Authority isreported as if it were part of the City because its sole purpose is to finance andconstruct land, building, and other improvements for use by the City. Financialstatements for the Redevelopment Authority are available at the City Controller'sOffice, City of South Bend, 227 West Jefferson, 12th Floor County-City Building, SouthBend, Indiana 46601.
The South Bend Building Corporation, Inc. is also a legally separate nonprofitcorporation and a significant blended component unit of the City. The BuildingCorporation is reported as if it were part of the City because its main purpose is tofinance construction and remodeling of City buildings. Debt of the Building Corporationis repaid through lease payments from the City. Financial statements for the BuildingCorporation are available at the City Controller's Office, City of South Bend, 227 WestJefferson, 12th Floor County-City Building, South Bend, Indiana 46601.
Related Organizations
The City's officials are also responsible for appointing the members of the boards ofother organizations, but the City's accountability for these organizations does not extendbeyond making the appointments. The mayor and the Common Council appoint theboard members of the South Bend Housing Authority, South Bend PublicTransportation Corporation (TRANSPO), Urban Enterprise Association, St. JosephCounty Housing Consortium, and the Saint Joseph County Board of Managers for Hotel-Motel Tax.
Accounting and Reporting Principles
The City follows accounting principles generally accepted in the United States ofAmerica (GAAP) as applicable to governmental units. Accounting and financial reportingpronouncements are promulgated by the Governmental Accounting Standards Board.
46

City of South Bend, Indiana
Notes to Financial StatementsDecember 31, 2016
Note 1 - Summary of Significant Accounting Policies (Continued)
Report Presentation
Governmental accounting principles require that financial reports include two differentperspectives - the government-wide perspective and the fund-based perspective. Thegovernment-wide financial statements (i.e., the statement of net position and thestatement of activities) report information on all of the nonfiduciary activities of theprimary government and its component units. The government-wide financialstatements are presented on the economic resources measurement focus and the fullaccrual basis of accounting. Property taxes are recognized as revenues in the year forwhich they are levied. Grants and similar items are recognized as revenue as soon as alleligibility requirements imposed by the provider have been met. The statements alsopresent a schedule reconciling these amounts to the modified accrual-basedpresentation found in the fund-based statements.
The statement of activities demonstrates the degree to which the direct expenses of agiven function or segment are offset by program revenues. Direct expenses are thosethat are clearly identifiable with a specific function or segment. Program revenuesinclude: (1) charges to customers or applicants for goods, services, or privilegesprovided; (2) operating grants and contributions; and (3) capital grants and contributions,including special assessments. Taxes and other items not properly included amongprogram revenues are reported instead as general revenue.
For the most part, the effect of interfund activity has been removed from thesestatements. Exceptions to this general rule are charges between the City's enterprisefunds and various other functions of the City. Eliminations of these charges would distortthe direct costs and program revenues reported for the various functions concerned.
Separate financial statements are provided for governmental funds, proprietary funds,and fiduciary funds, even though the latter are excluded from the government-widefinancial statements. Major individual governmental funds and major individual enterprisefunds are reported as separate columns in the fund financial statements.
Fund Accounting
The City accounts for its various activities in several different funds in order todemonstrate accountability for how we have spent certain resources - separate fundsallow us to show the particular expenditures that specific revenues were used for. Thevarious funds are aggregated into three broad fund types:
47

City of South Bend, Indiana
Notes to Financial StatementsDecember 31, 2016
Note 1 - Summary of Significant Accounting Policies (Continued)
Governmental Funds include all activities that provide general governmental servicesthat are not business-type activities. This includes the General Fund, special revenuefunds, debt service funds, and capital project funds. The City reports the following fundsas “major” governmental funds:
The General Fund, which is the primary operating fund, accounts for all financialresources used to provide general government services, other than those specificallyassigned to another fund.
The Park and Recreation Fund is used to account for the operation of the City parksystem. Financing is provided by a specific annual property tax levy to the extent thatuser fees and miscellaneous revenues are insufficient to provide such financing.
The Public Safety Local Option Income Tax (LOIT) Fund is used to account for theCity's share of the public safety local option income tax. Expenditures are restrictedto public safety.
The County Option Income Tax (COIT) Fund is used to account for the City's shareof the county option income tax. Expenditures include any lawful purpose of theCity.
The Economic Development Income Tax (EDIT) Fund is to account for the City'sshare of the County Economic Development Tax. Expenditures include any lawfulpurpose of the City.
The Rainy Day fund is for unused and unencumbered funds that are transferred froma fund that has a tax levy. Revenues in this fund also include special distributions ofcounty option income tax (COIT) and county economic development income tax(CEDIT).
The River West TIF (Tax Incremental Financing) Fund is used to account for publicimprovement projects in the river west economic development area. Financing isprovided by property tax proceeds in excess of those attributable to the assessedvalue of property in the district before redevelopment.
48

City of South Bend, Indiana
Notes to Financial StatementsDecember 31, 2016
Note 1 - Summary of Significant Accounting Policies (Continued)
Proprietary Funds include enterprise funds (which provide goods or services to usersin exchange for charges or fees) and internal service funds (which provide goods orservices to other funds of the City). The City reports the following funds as “major”enterprise funds:
The Water Utility Fund accounts for the operation of the City's water distributionsystem.
The Wastewater Utility Fund accounts for the operation of the City's wastewatertreatment plant, pumping stations, and collection systems.
The Century Center Fund accounts for the operation and maintenance of the City'sconvention center. Financing is received from various user fees for conventions,meetings, and other events held at the civic center and a subsidy from the St. JosephCounty's Special Funds Board of Managers.
The City’s internal service funds are used to account for various City liability coverage,employee medical coverage, police officers' take home vehicle, 311 call center,unemployment claims, and central services such as fuel, vehicle repairs, and varioussupplies provided to other departments on a cost-reimbursement basis. The activitiesare accounted for on a full accrual basis, so that the full costs are recognized andallocated to the various funds in the year that the costs are incurred.
Fiduciary Funds include amounts held in a fiduciary capacity for others. These amountswill not be used to operate our government's programs. Activities that are reported asfiduciary include:
The pension trust funds account for the activities of the 1925 Police and 1937 FirePension Funds which accumulate resources for pension benefit payments.
The Private-Purpose Trust Fund reports a trust arrangement under which principaland income benefit cemetery maintenance.
The agency funds account for assets held by the City as an agent for employeepayroll, pension, and payroll deductions, held for an entertainment center’s eventdeposits, and collected by the South Bend Police Department from asset seizures.
49

City of South Bend, Indiana
Notes to Financial StatementsDecember 31, 2016
Note 1 - Summary of Significant Accounting Policies (Continued)
Interfund Activity: During the course of operations, the City has activity between fundsfor various purposes. Any residual balances outstanding at year end are reported as duefrom/to other funds and advances to/from other funds. While these balances arereported in fund financial statements, certain eliminations are made in the preparation ofthe government-wide financial statements. Balances between the funds included ingovernmental activities (i.e., the governmental and internal service funds) are eliminatedso that only the net amount is included as internal balances in the governmental activitiescolumn. Similarly, balances between the funds included in business-type activities (i.e.,the enterprise funds) are eliminated so that only the net amount is included as internalbalances in the business-type activities column.
Further, certain activity occurs during the year involving transfers of resources betweenfunds. In fund financial statements, these amounts are reported at gross amounts astransfers in/out. While reported in fund financial statements, certain eliminations aremade in the preparation of the government-wide financial statements. Transfersbetween the funds included in governmental activities are eliminated so that only the netamount is included as transfers in the governmental activities column. Similarly, balancesbetween the funds included in business-type activities are eliminated so that only the netamount is included as transfers in the business-type activities column.
Basis of Accounting
The governmental funds use the current financial resources measurement focus and themodified accrual basis of accounting. This basis of accounting is intended to betterdemonstrate accountability for how the City has spent its resources.
Expenditures are reported when the goods are received or the services are rendered.Capital outlays are reported as expenditures (rather than as capital assets) because theyreduce the ability to spend resources in the future; conversely, employee benefit coststhat will be funded in the future (such as pension and retiree healthcare related costs, orsick and vacation pay) are not counted until they come due for payment. In addition,debt service expenditures, claims, and judgments are recorded only when payment isdue.
Revenues are not recognized until they are collected, or collected soon enough after theend of the year that they are available to pay for obligations outstanding at the end of theyear. For this purpose, the City considers amounts collected within 60 days of year endto be available for recognition. The following major revenue sources meet theavailability criterion: property taxes, franchise taxes, licenses, and interest associatedwith the current fiscal period.
Proprietary funds and fiduciary funds use the economic resources measurement focusand the full accrual basis of accounting. Revenue is recorded when earned and expensesare recorded when a liability is incurred, regardless of the timing of related cash flows.
50

City of South Bend, Indiana
Notes to Financial StatementsDecember 31, 2016
Note 1 - Summary of Significant Accounting Policies (Continued)
Specific Balances and Transactions
Cash and Cash Equivalents - Cash and cash equivalents include cash on hand, demanddeposits, and short-term investments with a maturity of three months or less whenacquired.
Investments - State statute (IC 5-13-9) authorizes the City to invest in securities,including but not limited to, federal government securities, repurchase agreements, andcertain money market mutual funds. Certain other statutory restrictions apply to allinvestments made by local governmental units.
Nonparticipating certificates of deposit, demand deposits, and similar nonparticipatingnegotiable instruments that are not reported as cash and cash equivalents are reportedas investments at cost. A “nonparticipating” instrument is one that does not recognizemarket fluctuations in its valuation.
Debt securities are reported at fair value. Debt securities are defined as securitiesbacked by the full faith and credit of the United States Treasury or fully insured orguaranteed by the United States or any United States government agency.
Open-end mutual funds are reported at fair value.
Money market investments are reported fair value.
Investment income, including changes in the fair value of investments, is reported asrevenue in the operating statement.
Inventories and Prepaid Items - Inventories are valued at cost, on a first-in, first-outbasis. Inventories of governmental funds are recorded as expenditures when consumedrather than when purchased. Certain payments to vendors reflect costs applicable tofuture fiscal years and are recorded as prepaid items in both government-wide and fundfinancial statements.
Restricted Assets - Certain proceeds of the enterprise fund revenue bonds, as well ascertain resources set aside for their repayment, are classified as restricted assets on thestatement of net position because their use is limited by applicable bond covenants.Restricted assets also include customer deposits, operating reserves, capital outlayaccounts, and debt service reserve funds.
Capital Assets - Capital assets, which include property, plant, equipment, intangibleassets, and infrastructure assets (e.g., roads, bridges, sidewalks, and similar items), arereported in the applicable governmental or business-type activities column in thegovernment-wide financial statements. Capital assets are recorded at historical cost orestimated historical cost if purchased or constructed. Donated capital assets arerecorded at estimated fair market value at the date of donation.
51

City of South Bend, Indiana
Notes to Financial StatementsDecember 31, 2016
Note 1 - Summary of Significant Accounting Policies (Continued)
Capitalization thresholds (the dollar values above which asset acquisitions are added tothe capital asset accounts), depreciation methods, and estimated useful lives of capitalassets reported in the government-wide statements and proprietary funds are noted inthe table below.
The City has implemented retroactive reporting of its infrastructure as of December 31,2006.
For depreciated assets, the cost of normal maintenance and repairs that do not add tothe value of the asset or materially extend asset lives are not capitalized.
All land purchases are capitalized regardless of acquisition price. Land is neverdepreciated.
Major outlays for capital assets and improvements are capitalized when projects havecompleted the construction phase. Interest incurred during the construction phase ofcapital assets of business-type activities is included as part of the capitalized value of theassets constructed.
Infrastructure, intangibles, buildings, equipment, roads, and vehicles are depreciatedusing the straight-line method over the following useful lives:
Capital Asset ClassCapitalization
Threshold Lives (in years)
Buildings and improvements $ 100,000 20-30Large office equipment 10,000 5-10Vehicles and other equipment 10,000 5-20Roads - Collectors and residential 250,000 40-50Utilities infrastructure (large) 250,000 30-99
Long-term Obligations - In the government-wide financial statements and theproprietary fund types in the fund financial statements, long-term debt and other long-term obligations are reported as liabilities in the applicable governmental activities,business-type activities, or proprietary fund-type statement of net position. Bondpremiums and discounts are deferred and amortized over the life of the bonds using thestraight-line method; bonds payable are reported net of the applicable bond premium ordiscount. Bond issuance costs are expensed at the time they are incurred. In the fundfinancial statements, governmental fund types recognize bond issuances as an “otherfinancing source,” as well as bond premiums and discounts. Net position restricted fordebt service and for capital outlay shown in the business-type activities and in theenterprise funds are restricted pursuant to state statute and/or local ordinance.
52

City of South Bend, Indiana
Notes to Financial StatementsDecember 31, 2016
Note 1 - Summary of Significant Accounting Policies (Continued)
Deferred Outflows/Inflows of Resources
In addition to assets, the statement of net position and/or balance sheet will sometimesreport a separate section for deferred outflows of resources. This separate financialstatement element represents a consumption of net position that applies to a futureperiod and so will not be recognized as an outflow of resources (expense/expenditure)until then. The City has two items that qualify for reporting in this category. Thedeferred charge on refunding and deferred charges on pensions that are reported in thegovernmental activities statement of net position. A deferred charge on refunding resultsfrom the difference in the carrying value of refunded debt and its reacquisition price.This amount is deferred and amortized over the shorter of the life of the refunded orrefunding debt. Deferred outflows of resources are recorded with respect to pensionsper GASB Statement No. 68.
In addition to liabilities, the statement of net position and/or balance sheet willsometimes report a separate section for deferred inflows of resources. This separatefinancial statement element represents an acquisition of net position that applies to afuture period and so will not be recognized as an inflow of resources (revenue) until thattime. The City has three items that qualify for reporting in this category: an unamortizedamount related to a service agreement, an unamortized gain related to a sale/leasebacktransaction, and deferred inflows related to pensions per GASB Statement No. 68.
Net Position Flow Assumption
Sometimes the City will fund outlays for a particular purpose from both restricted (e.g.,restricted bond or grant proceeds) and unrestricted resources. In order to calculate theamounts to report as restricted net position and unrestricted net position in thegovernment-wide and proprietary fund financial statements, a flow assumption must bemade about the order in which the resources are considered to be applied. It is theCity’s policy to consider restricted net position to have been depleted beforeunrestricted net position is applied.
Fund Balance Flow Assumption
Sometimes the City will fund outlays for a particular purpose from both restricted andunrestricted resources (the total of committed, assigned, and unassigned fund balance).In order to calculate the amounts to report as restricted, committed, assigned, andunassigned fund balance in the governmental fund financial statements, a flowassumption must be made about the order in which the resources are considered to beapplied. It is the City’s policy to consider restricted fund balance to have been depletedbefore using any of the components of unrestricted fund balance. Further, when thecomponents of unrestricted fund balance can be used for the same purpose, committedfund balance is depleted first, followed by assigned fund balance. Unassigned fundbalance is applied last.
53

City of South Bend, Indiana
Notes to Financial StatementsDecember 31, 2016
Note 1 - Summary of Significant Accounting Policies (Continued)
Fund Balance Policies
Fund balance of governmental funds is reported in various categories based on thenature of any limitations requiring the use of resources for specific purposes. Thegovernment itself can establish limitations on the use of resources through either acommitment (committed fund balance) or an assignment (assigned fund balance).
Nonspendable fund balances include items that cannot be spent. This includes activitythat is not in a spendable form (long-term portions of loans, property held for resale)and activity that is legally or contractually required to remain intact, such as principalbalances in a permanent fund.
Restricted fund balances have constraints placed upon the use of the resources either byan external party such as a grantor or creditor or imposed by law through constitutionalprovisions or enabling legislation.
Committed fund balances can be used only for specific purposes pursuant to constraintsimposed by a formal action by the South Bend Common Council, for all non-TIF Funds,or by the South Bend Redevelopment Commission for TIF Funds. This formal action isthe passage of an ordinance by the Council or resolution by the Commission specifyingthe purposes for which the funds can be used. The same type of formal action isnecessary to remove or change the specified use. The South Bend Common Council isthe highest level of decision-making authority for the non-TIF Funds. The South BendRedevelopment Commission is the highest level of decision-making authority for the TIFFunds.
Assigned fund balances include amounts that are constrained by the City's intent to beused for a specific purpose, but are neither restricted nor committed. For thegovernmental fund types other than the General Fund, this is the residual amount withinthe fund that is not restricted or committed. Currently, state statute does not requirethe City’s Common Council to undertake any resolution regarding the assignment offund balances. Assignments of fund balance are imposed by informal action of the CityController. Formal action by a governing body is not required to assign fund balances.
The unassigned fund balance is the residual amount of the General Fund not included inthe four categories above. Only the General Fund may report a positive unassigned fundbalance whereas other governmental funds may need to report a negative unassignedfund balance if expenditures incurred for specific purposes exceeded the amountsrestricted, committed, or assigned to those purposes.
54

City of South Bend, Indiana
Notes to Financial StatementsDecember 31, 2016
Note 1 - Summary of Significant Accounting Policies (Continued)
When both restricted and unrestricted amounts are available for use, generally it is theCity's policy to use restricted amounts first, with unrestricted resources utilized asneeded. In the case of unrestricted resources, it is generally the City's policy to usecommitted amounts first, followed by assigned amounts, then unassigned amounts asneeded.
The fund balance policy includes reserve ranges for funds as follows:
General: 35 percent of annual expenditures
COIT: 50 percent of annual expenditures
EDIT: 50 percent of annual expenditures
Water operating: 5 percent of annual expenditures
Wastewater operating: 5 percent of annual expenditures
Other: generally 25 percent of annual expenditures
The detail of the fund balance classifications of the governmental funds for the yearended December 31, 2016 can be found in Note 16.
Property Tax Revenue
Property taxes levied are collected by the County Treasurer and are usually distributedto the City in June and in December. State statute (IC 6-1.1-17-16) requires the IndianaDepartment of Local Government Finance to establish property tax rates and levies byFebruary 15. These rates were based upon the preceding year's March 1 (lien date)assessed valuations, adjusted for various tax credits. Taxable property is assessed at 100percent of the true tax value (determined in accordance with rules and regulationsadopted by the Indiana Department of Local Government Finance). Taxes may be paidin two equal installments that become delinquent if not paid by May 10 andNovember 10, respectively.
Pension and Other Postemployment Benefit Costs - The City offers both pensionand retiree healthcare benefits to retirees. The City receives an actuarial valuation tocompute the annual required contribution (ARC) necessary to fund the obligation overthe remaining amortization period. In the governmental funds, pension and OPEB costsare recognized as contributions are made. For the government-wide statements andproprietary funds, the City reports the full accrual cost equal to the current yearrequired contribution, adjusted for interest and “adjustment to the ARC” on thebeginning of year underpaid amount, if any.
55

City of South Bend, Indiana
Notes to Financial StatementsDecember 31, 2016
Note 1 - Summary of Significant Accounting Policies (Continued)
Compensated Absences (Vacation and Sick Leave)
a. Sick Leave - City employees earn sick leave at the rate of four to eight days per year,depending upon employee classification and length of service. Police officers,teamsters, 40-hour-per-week firefighters, and all other employees earn eight sickdays per year, regardless of tenure of service. Firefighters working 24-hourworkdays with tenure greater than five years earn five days of sick leave per year,and firefighters working 24-hour workdays with tenure less than five years, earn fourdays of sick leave per year. Sick leave may accumulate to a maximum 90 days forpolice officers, 100 days for 40-hour-per-week firefighters, 38 days for 24-per-dayfirefighter, 75 days for teamsters, and 65 days for all other employees. Accumulatedsick leave is paid to firefighters and police officers upon termination of employmentdepending upon the number of sick leave hours transacted, at a rate of 50 percent to100 percent of the base hourly rate of pay for firefighters and at a rate of one-halfthe first class patrolman rank rate of pay for police officers. Accumulated sick leave ispaid to teamster employees, upon retirement, at a rate of $40 for each accumulatedsick leave day transacted. Sick leave buy-back during employment is paid tofirefighters and police officers annually upon request. Upon request, firefighters arepaid unused sick days earned in the previous year in excess of 252 hours in the sickday bank at the base hourly rate of pay. Upon request, police officers are paid up toa maximum eight unused sick days at the first class patrolman rate of pay.
b. Vacation Leave - Primary government employees earn vacation leave at rates fromzero days to 28 days based upon hire date, years of service, and employeeclassification. Vacation leave does not accumulate from year to year for policeofficers, firefighters, and teamster employees, except in instances where specialcases are approved. Nonbargaining employees carry over to the following yearunused vacation time up to a maximum of 160 hours. Employees earn vacation leaveduring the year for use in the succeeding year. Unused vacation leave is paid toemployees upon termination of employment. Firefighters may sell back vacationleave, up to a maximum three days per year, during selected times of the year, at theemployee’s normal hourly rate of pay.
56

City of South Bend, Indiana
Notes to Financial StatementsDecember 31, 2016
Note 1 - Summary of Significant Accounting Policies (Continued)
c. Personal Leave - City police officers earn personal leave at the rate of seven days peryear, and have the opportunity to earn an additional three days leave withparticipation in regularly scheduled police practice shooting exercises. Police officerspersonal leave does not accumulate from year to year. Police officers unusedpersonal leave may be rolled into sick leave. City employees under the teamstercontract can use up to four days of their sick leave for personal leave. Personal leaveof absence may be available for certain personal, family, and medical reasons whenother forms of leave have been exhausted or otherwise not available. Leaves ofabsences are unpaid although employees may use accrued vacation, sick, and comptime. A leave of absence may not exceed 30 calendar days, however an employeefacing exceptional circumstances may seek an additional 30 calendar day leave ofabsence subject to approval by the department and HR department. Employees whoare enrolled in the City's insurance plans will be covered during the initial leave ofabsence, but benefit time, such as vacation and sick time, will not accrue during thisperiod. While every effort will be made to retain employment opportunities for anindividual during this time, there is no guarantee of employment at the completion ofpersonal leave of absence.
d. Compensatory Leave - City firefighters can elect to receive compensation forovertime hours worked either through wage payment or compensatory time offwork up to a maximum of 240 hours. All other nonexempt employees workingovertime hours earn compensatory time off up to a maximum balance of 32 hours,after which they are paid overtime wage. All other exempt employees workingovertime hours earn compensatory time up to a maximum balance of 160 hours.
Unused vacation leave for all City employees, and unused sick leave and compensatoryleave of firefighters, police officers, and teamsters, is accrued when incurred andreported as a liability in the statement of net position. Amounts due and payable at yearend are included in the proprietary fund statements. A liability for these amounts isreported in governmental funds only for employee terminations as of year-end.
Proprietary Funds Operating Classification - Proprietary funds distinguish operatingrevenues and expenses from nonoperating items. Operating revenues and expensesgenerally result from providing services and producing and delivering goods inconnection with a proprietary fund’s principal ongoing operations. The principaloperating revenues of the water and wastewater utility funds, Century Center fund, andinternal service funds are charges to customers for sales and services. Operatingexpenses for enterprise funds and internal service funds include the cost of sales andservices, administrative expenses, and depreciation on capital assets. All revenues andexpenses not meeting this definition are reported as nonoperating revenues andexpenses.
57

City of South Bend, Indiana
Notes to Financial StatementsDecember 31, 2016
Note 1 - Summary of Significant Accounting Policies (Continued)
Use of Estimates - The preparation of financial statements in conformity withaccounting principles generally accepted in the United States of America requiresmanagement to make estimates and assumptions that affect the reported amounts ofassets and liabilities and disclosure of contingent assets and liabilities at the date of thefinancial statements and the reported amounts of revenue and expenses during theperiod. Actual results could differ from those estimates.
Note 2 - Stewardship, Compliance, and Accountability
Budgetary Information - Annual budgets are adopted on the cash basis which is notconsistent with accounting principles generally accepted in the United States of America.All annual appropriations lapse at fiscal year-end. Annual budgets are adopted for thefollowing governmental funds:
Major governmental funds:
General Fund
Special Revenue Funds - Park and Recreation, Public Safety Local Option IncomeTax (LOIT), County Option Income Tax (COIT), Economic Development IncomeTax (EDIT), Rainy Day
Capital Projects Fund - River West TIF
Nonmajor governmental funds:
Special Revenue Funds - Motor Vehicle Highway, Recreation Nonreverting,Studebaker Oliver Revitalization Grants, Economic Development State Grants, DCIOperating, Community Investment Grants, Police State Seizure, Juvenile PositiveAssistance, Unsafe Building, Law Enforcement Continuing Education, LandlordRegistration, Loss Recovery, Emergency Telephone System, Local Road and Street,Excess Welfare Distribution, LOIT 2016 Special Distribution, Human Rights-FederalGrant, East Race Waterway, Morris and Palais Marketing, Police Block Grants,Economic Development Commission, Hazmat, Indiana River Rescue, COPS BlockGrant II, Regional Police Academy, COPS MORE Grant, Federal Drug Enforcement,Gift, Urban Development Action Grant, Leaf Collection and Removal, Police K-9Unit, Excess Levy
Debt Service Fund - College Football Hall of Fame Debt Service, RedevelopmentBond - Airport Taxable, Coveleski Bond Debt Service Reserve, RedevelopmentBond - Palais Royale, Century Center Energy Conservation Debt Service
58

City of South Bend, Indiana
Notes to Financial StatementsDecember 31, 2016
Note 2 - Stewardship, Compliance, and Accountability (Continued)
Capital Projects Funds - Professional Sports Development, Coveleski StadiumCapital, Zoo Endowment, Park Nonreverting Capital, Cumulative CapitalDevelopment, Cumulative Capital Improvement, Morris Performing Arts CenterCapital, TIF Leighton Plaza, TIF - West Washington, Redevelopment General,Community Revitalization Enhancement District, TIF No. 1 - SouthsideDevelopment, TIF No. 3 - Southside Development, Football Hall of Fame Capital,Major Moves, TIF - River East Development, TIF Douglas Road, TIF River EastResidential, Certified Technology Park, Palais Royale Historic Preservation, AirportUrban Enterprise Zone
On or before August 31, the City Controller submits to the Common Council aproposed operating budget for the year commencing the following January 1. Prior toadoption, the budget is advertised and public hearings are conducted by the CommonCouncil to obtain taxpayer comments. Prior to November 1 of each year, the CommonCouncil, through the passage of an ordinance, approves the budget for the next year.Copies of the budget ordinance and the advertisement for funds for which propertytaxes are levied or highway use taxes are received are sent to the Indiana Department ofLocal Government Finance. The budget becomes legally enacted after the CityController receives approval of the Indiana Department of Local Government Finance.
The City's management cannot transfer budgeted appropriations between objectclassifications, namely, Personnel, Supplies, Services, or Capital of a fund budget withoutapproval of the Common Council. The Department of Local Government Finance mustapprove any revisions to the appropriations for any fund or any department of theGeneral Fund. The legal level of budgetary control is by object and department withinthe fund for the General Fund and by object within the fund for all other budgetedfunds.
Expenditures did not exceed appropriations for any funds or any departments within theGeneral fund, the Parks and Recreation Fund, the Public Safety LOIT Fund, the COITFund, the EDIT Fund, the Rainy Day Fund, or any other major or nonmajorgovernmental fund which required legally approved budgets. Other financing uses fortransfers out in the General fund exceeded the approved budget $400 due totransferring code enforcement department petty cash to the Consolidated Building fund.
Fund Deficits - At December 31, 2016, the following funds reported deficits in fundequity, which are violations of State statute: Urban Development Action Grant($215,151), TIF - Douglas Road ($166,263), and TIF - River East Residential($1,317,569).
Fund equity deficits arose primarily from expenditures or expenses exceeding revenuesdue to the underestimate of current requirements. It is anticipated that these deficitswill be repaid from future revenues.
59

City of South Bend, Indiana
Notes to Financial StatementsDecember 31, 2016
Note 3 - Deposits and Investments
Authorization for investment activity is stated in Indiana Code 5-13. Indiana Code 5-13-9has authorized investment in securities backed by the full faith and credit of the UnitedStates Treasury or fully guaranteed by the United States of America and issued by theUnited States Treasury, a federal agency, a federal instrumentality, or a federalgovernment-sponsored enterprise. These investments are required by statute to have astated final maturity of not more than five years.
Indiana Code also provides for investment in money market mutual funds that are in theform of securities of, or interest in, an open-end, no-load, management-type investmentcompany or investment trust registered under the provision of the federal InvestmentCompany Act of 1940, as amended. Investments in money market mutual funds may notexceed 50 percent of the funds held by the City and available for investment. Theportfolio of an investment company or investment trust used must be limited to directobligations of the United States of America, obligations issued by the federal agency, afederal instrumentality, or a federal government-sponsored enterprise; or repurchaseagreements fully collateralized by direct obligations of the United States of America orobligations issued by a federal agency, a federal instrumentality, or a federalgovernment-sponsored enterprise. The form of securities of, or interest in, aninvestment company or investment trust must be rated as AAA, or its equivalent byStandard & Poor's Corporation or its successor or Aaa, or its equivalent, by Moody'sInvestors Service, Inc., or its successor. The form of securities in an investment companyor investment trust should have a stated final maturity of one day.
Additionally, the City may enter into repurchase agreements with depositoriesdesignated by the State Board of Finance as depositories for state deposits involving theunit's purchase and guaranteed resale of any interest-bearing obligations issued or fullyinsured or guaranteed by the United States of America, a United States of Americagovernment agency, an instrumentality of the United States of America, or a federalgovernment-sponsored enterprise. The repurchase agreement is considered to have astated final maturity of one day. This agreement must be fully collateralized by interest-bearing obligations as determined by their current market value.
60

City of South Bend, Indiana
Notes to Financial StatementsDecember 31, 2016
Note 3 - Deposits and Investments (Continued)
The City's cash and investments are subject to several types of risk, which are examinedin more detail below:
Custodial Credit Risk of Bank Deposits - Custodial credit risk is the risk that in theevent of a bank failure, the City's deposits may not be returned to it. Indiana Code 5-13-8-1 allows a political subdivision of the State of Indiana to deposit public funds in afinancial institution only if that institution is a depository eligible to receive state fundsand has a principal office or branch that qualifies to receive public funds of the politicalsubdivision. At December 31, 2016 the bank balances held at the following institutionswere collateralized with securities held by the pledging financial institution’s trustdepartment or agent in the depositor-City’s name:
Wells Fargo Bank, NA $ 1,911,935US Bank NA 16,831,622Bank of New York Mellon 4,143,8081st Source Bank 3,850,799
The remaining bank balances were insured by the Federal Deposit InsuranceCorporation or the Public Deposit Insurance Fund, which covers all public funds held inapproved depositories. The City has not formally adopted a deposit policy for custodialcredit risk.
Custodial Credit Risk of Investments - Custodial credit risk is the risk that, in theevent of the failure of the counterparty, the City will not be able to recover the value ofits investments or collateral securities that are in the possession of an outside party. TheCity does not have a formal policy for custodial credit risk. At year end, $80,175,943 ofinvestment securities were uninsured and unregistered, with securities held by thecounterparty or by its trust department or agent but not in the City's name.
Interest Rate Risk - Interest rate risk is the risk that the value of investments willdecrease as a result of a rise in interest rates. The City must follow state statute andlimit the stated final maturities of the investments to no more than five years. The Citydoes not have a formal investment policy for interest rate risk.
At year end, the City had the following investments and maturities:
Primary Government Fair ValueLess than One
YearOne to Two
YearsMore thanTwo Years
U.S. Government Agency Securities $ 76,167,420 $ 8,580,211 $ 53,967,984 $ 13,619,225U.S. Treasuries 4,008,523 4,008,523 - -
Total $ 80,175,943 $ 12,588,734 $ 53,967,984 $ 13,619,225
61

City of South Bend, Indiana
Notes to Financial StatementsDecember 31, 2016
Note 3 - Deposits and Investments (Continued)
Credit Risk - Credit risk is the risk that an issuer or other counterparty to aninvestment will not fulfill its obligations. U.S. government agency securities are implicitlyguaranteed by the full faith and credit of the U.S. government and are recognized as oneof the safest investments available. The City does not have a formal investment policyfor credit risk.
Concentration of Credit Risk - Concentration of credit risk is the risk of lossattributed to the magnitude of a government's investment in a single issuer. It is theCity’s practice to limit concentration of investments to no more than 10 percent of anyinstitution’s asset base. United States of America government and United States ofAmerica governmental agency securities are exempt from this policy requirement.
Fair Value Measurement
The City categorizes its fair value measurements within the fair value hierarchyestablished by generally accepted accounting principles. The hierarchy is based on thevaluation inputs used to measure the fair value of the asset. Level 1 inputs are quotedprices in active markets for identical assets; Level 2 inputs are significant otherobservable inputs; Level 3 inputs are significant unobservable inputs. Investments thatare measured at fair value using the net asset value per share (or its equivalent) as apractical expedient are not classified in the fair value hierarchy below.
In instances where inputs used to measure fair value fall into different levels in the abovefair value hierarchy, fair value measurements in their entirety are categorized based onthe lowest level input that is significant to the valuation. The City’s assessment of thesignificance of particular inputs to these fair value measurements requires judgment andconsiders factors specific to each asset or liability. The City has the following recurringfair value measurements as of December 31, 2016:
U.S. Government Agency and Treasury securities of $80,175,943 are valued usingsignificant other observable inputs (Level 2 inputs).
62

City of South Bend, Indiana
Notes to Financial StatementsDecember 31, 2016
Note 4 - Receivables
The following receivable accounts have timing and credit characteristics different fromtypical accounts receivable. As of December 31, 2016 City funds recognized thefollowing loan receivable balances. The schedule shows the total receivable and theportion that is not due within one year. These loans were for economic developmentprojects:
Receivable Noncurrent
TIF River West $ 201,374 $ -
Nonmajor governmental funds:Economic development state grants 302,069 238,409Community investment grants 230,341 179,666Urban development action grant 543,909 416,655Industrial revolving 4,059,177 3,166,158
Total nonmajor governmental funds $ 5,135,496 $ 4,000,888
Note 5 - Net Investment in Capital Assets
The net investment in capital assets is calculated as follows:
GovernmentalActivities
Business-typeActivities Total
Capital assets not subject to depreciation $ 38,302,805 $ 21,873,555 $ 60,176,360Capital assets subject to depreciation - Net 235,077,529 227,341,743 462,419,272Deferred outflows (capital related) 2,291,565 2,275,054 4,566,619Revenue bonds payable - Current (11,962,653) (8,210,000) (20,172,653)Mortgage bonds payable - Current (1,744,275) (295,725) (2,040,000)Notes and loans payable - Current (210,266) (183,384) (393,650)Capital leases payable - Current (2,858,050) (2,071,583) (4,929,633)Revenue bonds payable - Noncurrent (87,077,479) (87,267,047) (174,344,526)Mortgage bonds payable - Noncurrent (10,347,275) (5,261,141) (15,608,416)Notes and loans payable - Noncurrent (4,437,115) (2,398,821) (6,835,936)Capital leases payable - Noncurrent (8,071,025) (4,513,540) (12,584,565)Unspent debt proceeds 12,377,557 3,999,863 16,377,420
Net investment in capital assets $ 161,341,318 $ 145,288,974 $ 306,630,292
The business-type activities' unspent bond debt proceeds includes $2,932,875 unspentdebt proceeds (Note 10) and $1,066,988 unspent capital lease proceeds with the latterbeing reported as cash with fiscal agent.
63

City of South Bend, Indiana
Notes to Financial StatementsDecember 31, 2016
Note 6 - Capital Assets
Capital asset activity of the City's governmental and business-type activities was asfollows:
Governmental ActivitiesBalance
January 1, 2016 Additions DisposalsBalance
December 31, 2016
Capital assets not being depreciated:Land $ 15,106,806 $ - $ 399,718 $ 14,707,088Construction in progress 5,339,423 23,595,717 5,339,423 23,595,717
Subtotal 20,446,229 23,595,717 5,739,141 38,302,805
Capital assets being depreciated:Buildings 128,082,279 511,018 2,626,309 125,966,988Improvements other than buildings 16,616,553 4,761,355 - 21,377,908Machinery and equipment 45,543,924 3,735,447 1,977,385 47,301,986Roads and other infrastructure 434,344,887 2,722,611 - 437,067,498
Subtotal 624,587,643 11,730,431 4,603,694 631,714,380
Accumulated depreciation:Buildings 47,274,258 3,520,373 1,126,070 49,668,561Improvements other than buildings 9,242,881 693,232 - 9,936,113Machinery and equipment 30,808,402 4,087,694 1,780,899 33,115,197Roads and other infrastructure 292,321,510 11,595,470 - 303,916,980
Subtotal 379,647,051 19,896,769 2,906,969 396,636,851
Net capital assets being depreciated 244,940,592 (8,166,338) 1,696,725 235,077,529
Net capital assets $ 265,386,821 $ 15,429,379 $ 7,435,866 $ 273,380,334
Business-type ActivitiesBalance
January 1, 2016 Additions DisposalsBalance
December 31, 2016
Capital assets not being depreciated:Land $ 2,614,016 $ - $ 2 $ 2,614,014Construction in progress 16,644,050 15,632,896 13,017,405 19,259,541
Subtotal 19,258,066 15,632,896 13,017,407 21,873,555
Capital assets being depreciated:Buildings 85,178,794 619,002 1,606,895 84,190,901Improvements other than buildings 28,186,217 117,509 117,509 28,186,217Machinery and equipment 40,171,610 5,602,338 3,814,491 41,959,457Roads and other infrastructure 199,721,525 16,185,102 4,966,028 210,940,599
Subtotal 353,258,146 22,523,951 10,504,923 365,277,174
Accumulated depreciation:Buildings 34,631,698 2,096,225 1,309,652 35,418,271Improvements other than buildings 6,193,452 1,277,888 29,377 7,441,963Machinery and equipment 22,524,631 3,639,507 3,443,439 22,720,699Roads and other infrastructure 68,662,837 5,644,809 1,953,148 72,354,498
Subtotal 132,012,618 12,658,429 6,735,616 137,935,431
Net capital assets being depreciated 221,245,528 9,865,522 3,769,307 227,341,743
Net capital assets $ 240,503,594 $ 25,498,418 $ 16,786,714 $ 249,215,298
64

City of South Bend, Indiana
Notes to Financial StatementsDecember 31, 2016
Note 6 - Capital Assets (Continued)
Accumulated depreciation additions shown in the two schedules above includedepreciation expense and also include accumulated depreciation on assets transferredfrom other funds.
Depreciation expense was charged to programs of the primary government as follows:
Governmental activities:General government $ 406,945Public safety 3,123,010Highways and streets, and other general infrastructure 12,424,217Culture and recreation 3,061,541Economic development 675,962Internal service funds (depreciation is charged to the various
functions based on their usage of the assets) 149,026
Total governmental activities depreciation expense $ 19,840,701
Business-type activities:Emergency medical service $ 504,835Water 2,102,758Wastewater 6,832,296Century Center 1,062,219Consolidated building department 152,174Parking garage 216,069Solid waste 597,745
Total business-type activities depreciation expense $ 11,468,096
65

City of South Bend, Indiana
Notes to Financial StatementsDecember 31, 2016
Note 6 - Capital Assets (Continued)
Construction Commitments - The City has active construction projects at year end.As of December 31, 2016, the City's commitments with contractors are as follows:
Project Spent to DateRemaining
Commitment
Governmental activities:Ignition Park Infrastructure Phase 1C - Division A $ 4,035,341 $ 213,471Martin Luther King Jr., HVAC Revisions 106,267 273,4412016 Curb & Sidewalk - Division A 289,134 115,165Chet Waggoner Court 594,564 42,872Fire Department Station 5 106,848 77,331One Way to Two Way Conversion:
Chippewa Avenue & Roundabout - Division A 4,024,696 1,362,286Marion Roundabout - Division B 742,592 12,258Main, Michigan, & St Joseph - Division B 13,696,275 5,324,200
Total governmental activities 23,595,717 7,421,024
Business-type activities - Wastewater Utility:Secondary Clarifier Rehab/Secondary Treatment
Impr. 15,426,772 1,275,433Calvert St. Lift Station Replacement 52,220 978,370Prairie Avenue Sewer Sep & Flow Monitoring 628,724 225,000Grit Removal & Influent Screening Improvements 1,453,663 70,216East Bank Sewer Separation Phase 5 1,698,162 1,070,160
Total business-type activities 19,259,541 3,619,179
Total $ 42,855,258 $ 11,040,203
66

City of South Bend, Indiana
Notes to Financial StatementsDecember 31, 2016
Note 7 - Interfund Receivables, Payables, and Transfers
Interfund balances resulted from the time lag between the dates that (1) interfund loansare repaid, (2) interfund goods and services are provided or reimbursable expendituresoccur, (3) transactions are recorded in the accounting system, and (4) paymentsbetween funds are made. The composition of interfund balances at December 31, 2016is as follows:
Receivable Fund Payable Fund Amount
Due to/from Other FundsGeneral Fund River West TIF $ 18,475
Nonmajor governmental 28,680Water Utility 221
Total General Fund 47,376
Nonmajor governmental funds Nonmajor govermental 27,965Internal service 2,083
Total Nonmajorgovernmental funds 30,048
Water Utility General 10,024Parks & Rec 6,066Nonmajor govermental 1,362Wastewater Utility 4,330Nonmajor enterprise 2,436Internal service 1,005
Total Water Utility 25,223
Wastewater Utility Water Utility 3,041
Nonmajor enterprise funds Internal service 1,200
Internal service General 9,911Water 68,833
Total Internal service 78,744
Total $ 185,632
67

City of South Bend, Indiana
Notes to Financial StatementsDecember 31, 2016
Note 7 - Interfund Receivables, Payables, and Transfers (Continued)
Receivable Fund Payable Fund Amount
Advances from/to Other FundsGeneral Fund Nonmajor governmental funds $ 494,730
COIT Nonmajor governmental funds 1,351,598
Nonmajor governmental River West TIF 400,000Nonmajor governmental funds 4,036,926Nonmajor enterprise funds 31,191
Total Nonmajorgovernmental 4,468,117
Total $ 6,314,445
Specific purposes of the advances are as follows: the General Fund advanced funds tothe Football Hall of Fame to cover operating expenses. The COIT Fund advanced fundsto the Urban Development Action Grant Fund for community development projects.Major Moves advanced funds to the Douglas Road and River East Residential TIFs forproject costs incurred to construct roads and a parking garage.
68

City of South Bend, Indiana
Notes to Financial StatementsDecember 31, 2016
Note 7 - Interfund Receivables, Payables, and Transfers (Continued)
Interfund transfers reported in the fund financial statements are comprised of thefollowing:
Receiving Fund Paying Fund Amount
General Fund Nonmajor governmental $ 6,738Water Utility 1,649,989Wastewater Utility 2,970,395
Total General Fund 4,627,122
Parks and Recreation Water Utility 330,780Wastewater Utility 595,488
Total Parks andRecreation 926,268
COIT Nonmajor governmental funds 3,039
River West TIF Nonmajor governmental 22,199
Nonmajor governmental funds General Fund 202,504COIT 2,609,041EDIT 4,599,102River West TIF 2,623,500Nonmajor governmental funds 3,683,443Water Utility 58,979Wastewater Utility 106,177Century Center 79,676
Total nonmajorgovernmental funds 13,962,422
Nonmajor enterprise EDIT 2,110,468
Total $ 21,651,518
69

City of South Bend, Indiana
Notes to Financial StatementsDecember 31, 2016
Note 7 - Interfund Receivables, Payables, and Transfers (Continued)
The City typically uses transfers to fund ongoing operating subsidies. Specific purposesof the transfers are as follows: The Water and Wastewater Utility Funds transferredPILOT funds to the General, Parks and Recreation, Redevelopment Bond Debt Service-Airport Taxable, and Cumulative Capital Development Funds for general use. TheCOIT, EDIT, River West TIF, Cumulative Capital Improvement, and TIF River EastResidential Funds transferred funds to the Redevelopment Authority and South BendBuilding Corporation Debt Services Funds for debt service payments. The COIT andEDIT Funds transferred funds to the Motor Vehicle Highway Fund for generaloperations as well as for the curb and sidewalk improvements. The EDIT Fundtransferred funds to the DCI Operating Fund for salaries and wages relating tocommunity investment initiatives and to the Consolidated Building Fund for generaloperations of Code Enforcement and Animal Care & Control. The Leaf Collection andRemoval Fund transferred funds collected from customers for leaf collection to theMotor Vehicle Highway Fund to cover supervisory personnel in charge of the LeafCollection and Removal program.
Note 8 - Leases
Operating Leases - The City has entered into various operating leases having initial orremaining noncancelable terms exceeding one year for golf cart global positioningsystems, office machines, and office space. Rental expenditures for these leases were$232,883. The following is a schedule by years of future minimum rental payments as ofDecember 31, 2016:
Years Ending December 31 Amount
2017 $ 165,0892018 90,8602019 64,1602020 63,6602021 63,660
Total $ 447,429
70

City of South Bend, Indiana
Notes to Financial StatementsDecember 31, 2016
Note 8 - Leases (Continued)
Capital Leases - The City has entered into various capital leases for various types ofequipment and two parking garages. The parking garage capital leases are being repaidfrom governmental funds. Future minimum lease payments and present values of the netminimum lease payments under these capital leases as of December 31, 2016 are asfollows:
Years Ending December 31
GovernmentalActivities
Business-typeActivities
2017 $ 3,076,836 $ 2,166,9112018 2,649,829 1,560,7182019 2,162,992 1,331,2592020 1,775,559 1,272,5782021 1,181,636 482,074
2022-2026 800,000 -
Total minimum lease payments 11,646,852 6,813,540
Less amount representinginterest 717,777 228,417
Present value $ 10,929,075 $ 6,585,123
Assets acquired through capital leases still in effect are as follows:
GovernmentalActivities
Business-typeActivities
Buildings $ - $ 1,324,615Improvements other than buildings 1,458,939 -Machinery and equipment 12,301,675 7,904,821
Total 13,760,614 9,229,436
Accumulated depreciation (6,618,151) (3,669,137)
Net $ 7,142,463 $ 5,560,299
71

City of South Bend, Indiana
Notes to Financial StatementsDecember 31, 2016
Note 9 - Long-term Debt
The City issues bonds to provide for the acquisition and construction of major capitalfacilities. Revenue bonds involve a pledge of specific income derived from the acquiredor constructed assets to pay debt service. Debt activity is as follows:
Description AmountGovernmental ActivitiesMortgage Bonds:
2010 Public Works Service Center RefundingInterest rates: 3.0% to 5.0%Original issue: $6,075,000, 87.7% Governmental ($5,327,775)Principal installments: $525,000 to $615,000 plus interestMaturity: February 1, 2021 $ 2,416,135
2012 New Fire Station/Police Renovations RefundingInterest rates: 2.1% to 5.0%Original issue: $13,595,000Principal installments: $545,000 to $770,000Maturity: February 1, 2023 8,885,000
Subtotal 11,301,135
Revenue Bonds:2014 St. Joseph County PSAP (EDIT) Revenue Bonds
City's portion of $9,155,000 bond (29.03%)Interest rates: 2.0% to 3.625%Original issue: $2,657,697Installments of $12,799 to $16,611 plus interestMaturity: December 31, 2034 2,386,508
2014 TJX Special Taxing District Refunding BondsInterest rates: 2.0% - 3.0%Original issue: $3,440,000Installments of $395,000 to $470,000 plus interestMaturity: January 1, 2022 2,210,000
2003 Amended River West TIF RefundingInterest rates: 4.0% to 5.2%Original issue: $14,420,000Installments of $254,036 to $530,000 plus interestMaturity: February 1, 2025 7,125,000
2011 Downtown TIF RefundingInterest rates: 4.0% to 5.2%Original issue: $19,795,000Installments of $260,000 to $935,000 plus interestMaturity: February 1, 2025 12,500,000
72

City of South Bend, Indiana
Notes to Financial StatementsDecember 31, 2016
Note 9 - Long-term Debt (Continued)
Description Amount
Governmental Activities (Continued)Revenue Bonds (continued):
2005 Southside TIF/Erksine VillageInterest rates: 6.1% to 6.75%Original issue: $5,485,000Installments of $165,000 to $465,000 plus interestMaturity: February 1, 2027 $ 3,800,000
2015 Eddy Street Common RefundingInterest rates: 4.0% to 6.0%Original issue: $36,000,000Installments of $145,000 to $1,420,000 plus interestMaturity: February 15, 2033 30,075,000
2013 Century Center ImprovementsInterest rates: 4.0% to 5.63%Original issue: $4,655,000Installments: $155,000 to $375,000 plus interest *Maturity: May 1, 2028 3,175,000
2009 Morris Performing Arts Center RefundingInterest rates 3.0% to 4.0%Original issue: $7,210,000Installments of $400,000 to $515,000 plus interestMaturity: February 1, 2017 515,000
2011 Hall of Fame RefinancingInterest rates: .8% to 3.65%Original issue: $7,580,000Installments of $550,000 to $615,000 plus interestMaturity: February 1, 2018 1,830,000
2011 Century Center RefinancingInterest rates: 2.0% to 3.0%Original issue: $2,980,000Installments of $215,000 to $260,000 plus interestMaturity: February 1, 2018 720,000
2006 CEDIT Refinancing BondsInterest rates: 3.75% to 4.0%Original issue: $7,440,000Installments of $310,000 to $430,000 plus interestMaturity: February 1, 2017 430,000
2015 Redevelopment Authority Smart Streets Bonds (Bank of America/Merrill)Interest rates: 3.0 - 4.0%Original issue: $25,000,000Installments of $460,000 to $840,000 plus interestMaturity: February 1, 2037 25,000,000
2015 EDIT/Parks Bonds (Bank of America)Interest rates: 3.00 - 3.75%Original issue: $5,605,000Installments of $16,667 to $65,000 plus interestMaturity: August 1, 2035 5,405,000
73

City of South Bend, Indiana
Notes to Financial StatementsDecember 31, 2016
Note 9 - Long-term Debt (Continued)
Description Amount
Governmental Activities (Continued)Revenue Bonds (continued):
2010 Stadium Recovery Zone - TaxableInterest rates: 1.75% to 5.2%Original issue: $4,980,000Installments of $580,000 to $670,000 plus interestMaturity: January 5, 2019 $ 1,665,000
Subtotal 96,836,508
Notes and Loans Payable:Indiana Development Finance Authority (Bosch Project)
Interest rate: 3.034%Original issue: $1,040,000Installments of $18,003 per quarter, includes interestMaturity: March 22, 2021 302,069
2014 Coveleski Stadium Synagogue Installment Purchase AgreementInterest rate: noneOriginal issue: $500,000Installments of $100,000 per yearMaturity: January 31, 2018 200,000
2015 Century Center Energy Conservation BondInterest rates: 3.5%Original issue: $4,167,897Installments of $22,585 to $176,508 plus interestMaturity: May 1, 2031 4,145,312
Subtotal 4,647,381
Total governmental activity debt $ 112,785,024
* St. Joseph County has irrevocably pledged hotel-motel tax revenues to finance debt payments
Business-type ActivitiesMortgage Bonds:
2010 Public Works Service Center RefundingInterest rates: 3.0% to 5.0%Original issue: $6,075,000, 12.3% Business-Type ($747,225)Installments of $525,000 to $615,000 plus interestMaturity: February 1, 2021 $ 338,865
2013 Building Corp EMS Fire Station/Tower BondsInterest rates: 3.0% to 4.2%Original issue: $5,580,000Installments $215,000 to $235,000 plus interestMaturity: February 1, 2033 5,145,000
Subtotal $ 5,483,865
74

City of South Bend, Indiana
Notes to Financial StatementsDecember 31, 2016
Note 9 - Long-term Debt (Continued)
Description Amount
Business-type Activities (Continued)Revenue Bonds:
2016 Waterworks Refunding Bonds (City Securities)Interest rates: 3.0%Original issue: $3,300,000Installments of $260,000 to $440,000 plus interestMaturity: January 1, 2027 $ 3,300,000
2009 Water Works ImprovementInterest rates: 3.80% to 5.89%Original issue: $5,380,000Installments of $195,000 to $455,000 plus interestMaturity: January 1, 2030 4,325,000
2012 Water Works ImprovementInterest rate: 2.0%Original issue: $5,975,000Installments of $335,000 to $425,000 plus interestMaturity: January 1, 2023 2,380,000
2012B Water Works ImprovementInterest rates: 2.0% to 3.7%Original issue: $8,300,000Installments of $340,000 to $540,000 plus interestMaturity: January 1, 2033 6,925,000
2015 Sewage Works Refunding Bonds (Huntington Public Capital)Interest rates: 2.0%Original issue: $27,440,000Installments of $2,475,000 to $3,025,000 plus interestMaturity: December 1, 2025 $ 24,965,000
2010 Sewage Works RevenueInterest rates: 2.0% to 4.5%Original issue: $9,345,000Installments of $365,000 to $665,000 plus interestMaturity: December 1, 2030 7,145,000
2011 Sewage Works RevenueInterest rates: 3.0% to 4.0%Original issue: $21,500,000Installments of $365,000 to $665,000 plus interestMaturity: December 1, 2031 17,295,000
2012 Sewage Works RevenueInterest rates: 2.0% to 2.75%Original issue: $25,000,000Installments of $1,105,000 to $1,650,000 plus interestMaturity: December 1, 2032 20,890,000
2013A Sewage Works RevenueInterest rate: 1.94%Original issue: $14,765,000Installments of $1,065,000 to $715,000 plus interestMaturity: December 11, 2024 8,050,000
Subtotal 95,275,00075

City of South Bend, Indiana
Notes to Financial StatementsDecember 31, 2016
Note 9 - Long-term Debt (Continued)
Description Amount
Business-type Activities (Continued)Notes and Loans Payable:
2009 Water Works State Revolving LoanInterest rate: 3.37%Original issue: $427,332Installments of $17,719 to $29,459 plus interestMaturity: January 1, 2030 332,562
2009 Sewage Works State Revolving LoanInterest rate: 2.81%Original issue: $3,297,000Installments of $130,201 to $220,378 plus interestMaturity: December 1, 2028 2,249,643
Subtotal 2,582,205
Total business-type activity debt $ 103,341,070
Excluded from the governmental activities amounts outstanding are total unamortizedpremiums of $790,415 and $2,203,624 related to the mortgage bonds and revenuebonds, respectively.
Excluded from the business-type activities amounts outstanding are total unamortizedpremiums of $73,000 and $202,047 related to the mortgage bonds and revenue bonds,respectively.
Beginning Balance Additions Reductions Ending BalanceDue WithinOne Year
Governmental Activities
Mortgage bonds $ 13,904,973 $ - $ 1,813,423 $ 12,091,550 $ 1,744,275Revenue bond 107,815,890 - 8,775,758 99,040,132 11,962,653
Total bonds payable 121,720,863 - 10,589,181 111,131,682 13,706,928
Notes and loans payable 4,831,752 - 184,371 4,647,381 210,266Capital leases 8,491,407 5,042,991 2,605,323 10,929,075 2,858,050
Subtotal 135,044,022 5,042,991 13,378,875 126,708,138 16,775,244
Accumulated compensated absences 4,604,779 4,756,341 4,604,779 4,756,341 4,756,341Net pension liability 191,240,248 - 10,525,952 180,714,296 -Net OPEB obligation 11,660,935 1,624,309 - 13,285,244 -
Total governmentalactivities $ 342,549,984 $ 11,423,641 $ 28,509,606 $ 325,464,019 $ 21,531,585
76

City of South Bend, Indiana
Notes to Financial StatementsDecember 31, 2016
Note 9 - Long-term Debt (Continued)
Compensated absences for governmental activities typically have been liquidated fromthe General Fund and special revenue funds. All of the December 31, 2016 business-type activities' compensated absences are due within one year. The net 1925 Police and1937 Firefighters' pension liability will be liquidated from the pension trust funds. ThePublic Employees' Retirement Fund (PERF) liability will not be liquidated from thepension trust funds. The net OPEB obligation will be liquidated from the General Fund.
Beginning Balance Additions Reductions Ending BalanceDue WithinOne Year
Business-type Activities
Mortgage bonds $ 5,851,565 $ - $ 294,700 $ 5,556,865 $ 295,725Revenue bonds 102,871,921 3,300,000 10,694,874 95,477,047 8,210,000
Total bonds payable 108,723,486 3,300,000 10,989,574 101,033,912 8,505,725
Capital leases payable 4,411,042 3,855,808 1,681,727 6,585,123 2,071,583Notes and loans payable 3,458,899 - 876,694 2,582,205 183,384
Total business-typeactivities $ 116,593,427 $ 7,155,808 $ 13,547,995 $ 110,201,240 $ 10,760,692
Total interest expense for the year was $8,353,046. Annual debt service requirementsto maturity for the above bonds and note obligations are as follows:
Governmental Activities Business-type Activities
Year Ending
December 31 Principal Interest Total Principal Interest Total
2017 $ 13,917,194 $ 3,761,808 $ 17,679,002 $ 8,689,109 $ 2,845,600 $ 11,534,7092018 9,205,743 3,649,345 12,855,088 8,876,840 3,531,265 12,408,1052019 8,310,564 3,316,579 11,627,143 7,729,722 2,538,876 10,268,5982020 8,262,967 3,002,940 11,265,907 7,733,376 2,346,547 10,079,9232021 8,245,632 2,692,179 10,937,811 7,910,986 2,149,442 10,060,428
2022-2026 29,929,281 8,761,533 38,690,814 36,564,041 7,646,853 44,210,8942027-2031 20,846,096 4,376,374 25,222,470 22,816,996 2,858,582 25,675,5782032-2036 13,227,547 1,226,755 14,454,302 3,020,000 100,534 3,120,5342037-2041 840,000 16,800 856,800 - - -
Total $ 112,785,024 $ 30,804,313 $ 143,589,337 $ 103,341,070 $ 24,017,699 $ 127,358,769
Current Refundings - On December 27, 2016, the City of South Bend issued$3,300,000 in Water Works Refunding revenue bonds with an average interest rate of3.00 percent to currently refund the remainder of its 2006 Water Works RevenueBonds and its 2000 Water Works State Revolving Loan to take advantage of favorableinterest rates and lower future debt service payments. The net proceeds of $3,245,142(after payment of $124,096 in issuance costs) were used to redeem $3,788,431 in bondsand loans. In so doing, the City saved $171,657 in debt service costs over the remaininglife of the bonds.
77

City of South Bend, Indiana
Notes to Financial StatementsDecember 31, 2016
Note 9 - Long-term Debt (Continued)
Revenue Bond - The City has pledged future revenues, net of operating expenses, torepay water and wastewater utilities' bonds. Bond ordinances require monthly depositsof a portion of user fee revenues sufficient to meet requirements of the next principal,interest, and bank fiscal charge payment. Water and wastewater bond ordinances alsorequire monthly deposits of user fee revenues over 60 months to produce a bondreserve equal to approximately the maximum annual debt service.
During 2016, the Water Utility paid $1,781,109 in debt payments or approximately 16.8percent of operating revenues. The Wastewater Utility paid $9,953,645 in debtpayments or approximately 25.4 percent of operating revenues.
The City has pledged tax incremental financing revenues to meet tax incrementalfinancing and Redevelopment Authority debt requirements. The City has pledgedeconomic development income taxes (EDIT) to meet the EDIT revenue bond debtrequirements with payments of debt service of $884,030 during 2016. The City has alsopledged taxes in the Professional Sports and Convention Development (PSCD) Area tomeet the PSCD revenue bonds with payments of debt service of $838,050 during 2016.
Note 10 - Restricted Assets
The balances of restricted assets in the enterprise funds are composed of the following:
Cash, cash equivalents, and investments:Debt service fund $ 864,299Customer repair and deposit fund 3,294,355Cash with fiscal agent 1,293,464Bond reserve fund 5,504,372Operating reserve fund 7,085,329Capital outlay accounts 10,989,157Unspent bond proceeds 2,932,875
Total restricted assets $ 31,963,851
Cash with fiscal agent includes $1,066,988 for capital asset purchases and $226,476 fordebt purchases.
Note 11 - Property Held for Resale
The City's Redevelopment Commission has purchased properties in blighted areas forredevelopment and subsequent resale. At December 31, 2016, the market value ofthese properties was not known. These properties are recognized as assets in the fundsthat purchased the property.
78

City of South Bend, Indiana
Notes to Financial StatementsDecember 31, 2016
Note 12 - Service Concession Agreement
On July 1, 2013, the City entered into a Service Concession Agreement (SCA) withSMG, a civic center management company, with the purpose of obtaining high-qualityprofessional management of the Century Center. The initial term of the contractextends through June 30, 2016, has been extended through December 31, 2019, and isrenewable for an additional three-year period. SMG’s compensation is a flat fee of$135,000 for the first year and is then adjusted by the CPI for each successive year.There are also additional financial incentives based on various operational goals. SMG isresponsible for all operations and financial reporting.
Additionally, SMG contributed a one-time capital infusion of $575,000, to be used forcapital improvement that will be amortized over seventy-two (72) months.
Both parties retain certain rights regarding operations and contract cessation.
Note 13 - Risk Management
The City is exposed to various risks of loss related to torts; theft of, damage to, anddestruction of assets; errors and omissions; job-related illnesses or injuries toemployees; medical benefits to employees, retirees, and dependents; and naturaldisasters.
The risks of torts; theft of, damage to, and destruction of assets; errors and omissions;and natural disasters are covered by commercial insurance from independent thirdparties. Settled claims from these risks have not exceeded commercial insurancecoverage for the past three years. There were no significant reductions in insurance bymajor category of risk.
Liability Insurance - The City has chosen to establish a risk financing fund for risksassociated with job-related illnesses or injuries to employees, automobile liability, andcomprehensive liability. The risk financing fund is accounted for in the Liability InsurancePremium Reserve Fund, an internal service fund, whereby assets are set aside for claimsettlements. Excess policies through commercial insurance covers individual claims inexcess of $300,000 per claim for job-related illnesses or injuries to employees (workers’compensation) and $100,000 per claim for damage to and destruction of assets(property damage). In recent years, claims resulting from property damage exceededthe property insurance self-retention amount. The first claim occurred during 2012 andthe gross claim was $424,021. In 2013, a second claim was incurred at a loss of$248,094. No such claims occurred in 2014, 2015, or 2016. A premium is charged toeach fund based on a study of paid claims and based on the number of employees andpercent of the total budget. Provisions are also made for unexpected and unusual claims.
79

City of South Bend, Indiana
Notes to Financial StatementsDecember 31, 2016
Note 13 - Risk Management (Continued)
Claim expenditures and liabilities of the fund are reported when it is probable that a losshas occurred and the amount of the loss can be reasonably estimated. These lossesinclude an estimate of claims that have been incurred but not reported (IBNRs). Claimliabilities are calculated considering the effects of inflation, recent claim settlementtrends including frequency and amounts of payouts, and other economic and socialfactors. The entire insurance liability balance is reported as a current liability as the Cityhas the intent to pay within one year.
Group Health Insurance - The City has chosen to establish a risk financing fund forrisks associated with medical benefits of employees and their covered dependents. Therisk financing fund is accounted for in the Self-Funded Employee Benefits Fund, aninternal service fund, whereby assets are set aside for benefit costs. An excess policythrough commercial insurance covers individual claims in excess of $300,000 per year.Claims resulting from this risk exceeded the self-retention amount during 2014, 2015,and 2016 by $724,350, $398,000, and $1,585,602, respectively. A premium is chargedto each fund based on the number of employees and estimated costs exceeding theemployees' contributions. Provisions are also made for unexpected and unusual claims.
Claim expenditures and liabilities of the fund are reported when it is probable that a losshas occurred and the amount of the loss can be reasonably estimated. These lossesinclude an estimate of claims that have been incurred but not reported (IBNRs). Claimliabilities are calculated considering the effects of inflation, recent claim settlementtrends including frequency and amounts of payouts, and other economic and socialfactors.
Changes in the estimated liability for the past two fiscal years were as follows:Liability Insurance Group Health
2016 2015 2016 2015
Unpaid claims - Beginning of year $ 1,476,268 $ 1,671,438 $ 1,097,776 $ 1,085,259
Incurred claims, including claims incurred but not reported 653,732 1,354,057 12,074,811 13,321,524Claim payments (826,599) (1,549,227) (12,158,373) (13,309,007)
Unpaid claims - End of year $ 1,303,401 $ 1,476,268 $ 1,014,214 $ 1,097,776
Note 14 - Subsequent Events
In April 2016, the City of South Bend has entered into Intergovernmental Agreementswith the Pokagon Band of Potawatomi Indians for the development of the PokagonBand’s 166-acre site on the City’s southwest side that is expected to be the home of aTribal Village and a Four Winds Casino, pending approval from the Bureau of IndianAffairs. The City may receive certain revenue from this agreement, but the amount hasyet to be determined.
80

City of South Bend, Indiana
Notes to Financial StatementsDecember 31, 2016
Note 14 - Subsequent Events (Continued)
On January 18 2017, the City paid off the 2005 Southside Tax Incremental Financing(TIF) revenue bonds’ $3,800,000 outstanding balance. This early debt payoff was paidfrom the TIF No. 3 - Southside Development fund, a nonmajor capital project fund.These bonds had a February 1, 2027 original maturity.
On January 23, 2017, the Common Council approved the Eddy Street Commons Phase2 revenue bonds in an amount not to exceed $25 million. These bonds are financinginfrastructure public improvements.
On March 27, 2017, the Common Council approved a water rate increase of 22 percentin 2018 and a second increase of 22 percent in 2019 to fund the operating and capitalneeds of the Water Utility. These rate increases will be effective if approved by theIndiana Utility Regulatory Commission.
Note 15 - Conduit Debt Obligation
From time to time, the City has issued industrial revenue bonds to provide financialassistance to private sector entities for the acquisition and construction of industrial andcommercial facilities deemed to be in the public interest. The bonds are secured by theproperty financed and are payable solely from payments received on the underlyingmortgage loans. Upon repayment of the bonds, ownership of the acquired facilitiestransfers to the private sector entity served by the bond issuance. Neither the City, theState, nor any political subdivision thereof is obligated in any manner for the repaymentof the bonds. Accordingly, the bonds are not reported as liabilities in the accompanyingfinancial statements.
As of December 31, 2016 there were several series of industrial revenue bondsoutstanding. The City has been unable to obtain the total outstanding principal amountfor the outstanding bonds. During 2016 the City approved no new industrial revenuebonds.
81

City of South Bend, Indiana
Notes to Financial StatementsDecember 31, 2016
Note 16 - Fund Balance Constraints
The detail of the various components of fund balance is as follows:
General Fund
Parks and
Recreation
Public
Safety LOIT COIT EDIT Rainy Day River West TIF
Nonmajor
Funds Total
Fund BalancesNonspendable:
Inventory $ - $ 27,113 $ - $ - $ - $ - $ - $ - $ 27,113Advances to other funds 494,730 - - 1,351,598 - - - 4,468,117 6,314,445Property held for resale - - - 174,999 270,001 - 9,583,608 3,689,943 13,718,551Noncurrent loans
receivable - - - - - - - 4,000,888 4,000,888
Total 494,730 27,113 - 1,526,597 270,001 - 9,583,608 12,158,948 24,060,997
Restricted: Debt service - - - - - - - 8,669,119 8,669,119General administration - - - - - - - 3,562,215 3,562,215Police and fire salaries - - 826,457 - - - - - 826,457Police and fire programs - - - - - - - 1,560,159 1,560,159Street maintenance - - - - - - - 13,126,072 13,126,072Economic development
projects - - - - - - 31,331,391 25,361,244 56,692,635Parks maintenance - 4,318,657 - - - - - 1,649,092 5,967,749Cultural capital projects - - - - - - - 4,814,810 4,814,810Street capital projects - - - - - - - 6,607,424 6,607,424
Total - 4,318,657 826,457 - - - 31,331,391 65,350,135 101,826,640
Committed: General administration - - - - - - - 1,304,190 1,304,190Police and fire programs - - - - - - - 115,261 115,261Economic development
projects - - - - - - - 410,750 410,750Cultural capital - - - - - - - 868,493 868,493
Total - - - - - - - 2,698,694 2,698,694
Assigned: Cultural projects - - - - - - - 140,759 140,759General administration 1,380,036 - - 8,487,370 10,929,888 10,185,414 - - 30,982,708Police and fire programs - - - - - - - 2,858 2,858Street maintenance - - - - - - - 910,414 910,414Economic devlopment
administration - - - - - - - 1,342,087 1,342,087
Total 1,380,036 - - 8,487,370 10,929,888 10,185,414 - 2,396,118 33,378,826
Unassigned 32,077,856 - - - - - - (2,301,793) 29,776,063
Total fund balance $ 33,952,622 $ 4,345,770 $ 826,457 $ 10,013,967 $ 11,199,889 $ 10,185,414 $ 40,914,999 $ 80,302,102 $ 191,741,220
Public Safety LOIT funds are primarily restricted for payment of police and firepersonnel. Parks and Recreation funds are restricted primarily for parks and recreationoperating costs, including personnel. COIT and EDIT funds are assigned to generalgovernment primarily for debt service payments and operating expenses. River WestTIF and Redevelopment Authority Debt Service are restricted for economicdevelopment projects and debt service.
The government-wide statement of net position reports restricted net position for debtservice and capital outlay, which is restricted by enabling legislation.
82

City of South Bend, Indiana
Notes to Financial StatementsDecember 31, 2016
Note 17 - Other Postemployment Benefits
Plan Description - The City of South Bend Retiree Healthcare Plan is a single-employer defined benefit healthcare plan administered by the City of South Bend,Department of Administration and Finance, through the City's self-insurance fund. Theplan provides for medical insurance benefits to eligible retirees and their spouses.Indiana Code 5-10-8 gives the unit the authority to establish and amend the plan.
The City issues a publicly available financial report that includes financial statements andrequired supplementary information for the plan. The report is available by contactingthe City Controller's office: 227 West Jefferson Blvd. Rm. 1200N, South Bend, IN46601, Ph. (574) 235-9216.
Funding Policy - The contribution requirements of plan members for the City of SouthBend Retiree Healthcare Plan are established and can be amended by the City'sCommon Council. The required contribution is based on projected pay-as-you-gofinancing requirements. For the year ended December 31, 2016, the City contributed$750,543 to the plan for current premiums. Police and fire members receiving benefitscontributed approximately 30 percent of the total premiums through their requiredcontribution of $200 per month for retiree-only coverage and $600 for retiree andspouse coverage. General employee members receiving benefits contributedapproximately 100 percent of the total premiums through their required contribution of$496 per month for retiree-only coverage and $1,308 for retiree and spouse coverage.
Funding Progress - For the year ended December 31, 2016, the City has estimatedthe cost of providing retiree healthcare benefits through an actuarial valuation as ofJanuary 1, 2015. The valuation computes an annual required contribution thatrepresents a level of funding that, if paid on an ongoing basis, is projected to covernormal costs each year and amortize any unfunded actuarial liabilities over a period notto exceed 30 years. This valuation's computed contribution and actual funding aresummarized as follows:
Annual required contribution (recommended) $ 2,501,114Interest on the prior year's net OPEB obligation 275,198Less adjustment to the annual required contribution (401,460)
Annual OPEB cost 2,374,852
Amounts contributed:Payments of current premiums (750,543)Advance funding -
Increase in net OPEB obligation 1,624,309
OPEB obligation - Beginning of year 11,660,935
OPEB obligation - End of year $ 13,285,244
83

City of South Bend, Indiana
Notes to Financial StatementsDecember 31, 2016
Note 17 - Other Postemployment Benefits (Continued)
The annual OPEB costs, the percentage contributed to the plan, and the net OPEBobligation for the current and two preceding years were as follows:
Fiscal Year EndedAnnual OPEB
CostPercentageContributed
Net OPEBObligation
12/31/13 $ 2,463,473 %28.5 $ 8,300,67712/31/14 2,542,733 31.5 10,043,30512/31/15 2,336,489 30.8 11,660,935
The funding progress of the plan as of the three most recent valuation dates is asfollows:
Actuarial Valuation Date
ActuarialValue ofAssets
(a)
ActuarialAccrued
Liability (AAL)(b)
UnfundedAAL (UAAL)
(b-a)
Funded Ratio(Percent)
(a/b)
1/1/15 $ - $ 21,512,260 $ 21,512,260 %-1/1/14 - 21,493,998 21,493,998 -1/1/13 - 21,493,998 21,493,998 -
Actuarial Methods and Assumptions - Actuarial valuations of an ongoing plan involveestimates of the value of reported amounts and assumptions about the probability ofoccurrence of events far into the future. Examples include assumptions about futureemployment, mortality, and the healthcare cost trend. Amounts determined regardingthe funded status of the plan and the annual required contributions of the employer aresubject to continual revision as actual results are compared with past expectations andnew estimates are made about the future. The schedule of funding progress, presentedabove, presents multiyear trend information about whether the actuarial value of planassets is increasing or decreasing over time relative to the actuarial accrued liabilities forbenefits.
Projections of benefits for financial reporting purposes are based on the substantive plan(the plan as understood by the employer and the plan members) and include the typesof benefits provided at the time of each valuation and the historical pattern of sharing ofbenefit costs between the employer and plan members to that point. The actuarialmethods and assumptions used include techniques that are designed to reduce theeffects of short-term volatility in actuarial accrued liabilities and the actuarial value ofassets, consistent with the long-term perspective of the calculations.
As of January 1, 2015, the most recent actuarial valuation date, the plan was 0 percentfunded. The actuarial accrued liability for benefits was $21,512,260 and the actuarialvalue of assets was $0, resulting in an unfunded actuarial accrued liability (UAAL) of$21,512,260. The covered payroll was $51,521,030, which as a percentage of theactuarial accrued liability was 239 percent.
84

City of South Bend, Indiana
Notes to Financial StatementsDecember 31, 2016
Note 17 - Other Postemployment Benefits (Continued)
In the January 1, 2015 actuarial valuation, the entry age actuarial cost method was used.The actuarial assumptions included a 4.5 percent investment rate of return (net ofadministrative expenses), which is a blended rate of the expected long-term investmentreturns on plan assets and on the employer's own investments calculated based on thefunded level of the plan at the valuation date, and an annual healthcare cost trend rate of9 percent initially, reduced by decrements to an ultimate rate of 5 percent after 10years. Both rates included a 3 percent inflation assumption. The UAAL is beingamortized as a level percentage of projected payroll on an open basis. The remainingamortization period at December 31, 2016 was 29 years.
Note 18 - Cost-Sharing Multiple-Employer Defined Benefit Pension Plan -Public Employees' Retirement Fund
Plan Description - The Public Employees’ Retirement Fund (PERF) provides pensionsfor all full-time employees other than police officers and firefighters, who are coveredunder the 1977 Police Officers' and Firefighters' Pension and Disability Fund. The plan isa cost sharing multiple employer defined benefit pension plan administered by theIndiana Public Retirement System (INPRS). The pension system issues a publicly availablefinancial report that can be obtained at http://www.inprs.in.gov.
Benefits Provided - The plan provides retirement, disability and survivor benefits. TheIndiana Code, Title 5, Articles 10.2 and 10.3, as amended only by the Indiana GeneralAssembly, identifies the benefit provisions and establishes the authority under whichmembers and employers are obligated to contribute to the plan.
Retirement benefits for employees are calculated as years of credible service times theaverage highest 20 quarters of salary times 1.1% plus the employee’s Annuity SavingsAccount. Normal retirement age is 60 with early retirement at 50-59 with 15 years ofservice. Vesting period is 10 years. An employees who leaves service may withdraw hisor her Annuity Savings Account contributions, plus any accumulated interest.
Benefit terms provide for annual cost of living adjustments to each employee’sretirement allowance subsequent to the employee’s retirement date. The annualadjustments are granted by the Indiana General Assembly on an ad hoc basis.
Contributions - Per Indiana Code, Title 5, Articles 10.2 and 10.3, contributionrequirements of the active employees and the participating employers are establishedand may be amended by the INPRS Board based on recommendations by the INPRSactuary. Employees are required to contribute 3 percent of their annual pay. The City’scontractually required contribution rate for the year ended December 31, 2016 was11.2 percent of annual payroll. Contributions to the plan from the City were $3,037,666for the year ended December 31, 2016.
85

City of South Bend, Indiana
Notes to Financial StatementsDecember 31, 2016
Note 18 - Cost-Sharing Multiple-Employer Defined Benefit Pension Plan -Public Employees' Retirement Fund (Continued)
Net Pension Liability, Deferrals, and Pension Expense
At December 31, 2016, the City reported a liability of $24,845,715 for its proportionateshare of the net pension liability. The net pension liability was measured as of June 30,2016 and the total pension liability used to calculate the net pension liability wasdetermined by an actuarial valuation as of that date. The City's proportion of the netpension liability was based on the City's actuarially required contribution for the yearended December 31, 2016, relative to all other contributing employers. At June 30,2016, the City's proportion was 0.54745 percent, which was a decrease of 0.00959from its proportion measured as of December 31, 2015.
For the year ended December 31, 2016, the City recognized pension expense of$4,526,527. At December 31, 2016, the City reported deferred outflows of resourcesand deferred inflows of resources related to pensions from the following sources:
DeferredOutflows ofResources
DeferredInflows ofResources
Difference between expected and actual experience $ 556,637 $ 45,864Changes in assumptions 5,464,713 1,397,973Net difference between projected and actual earnings
on pension plan investments 1,096,213 -City contributions made subsequent to the
measurement date 1,645,758 -Changes in proportion and differences between
employer contributions and proportionate share ofcontributions 191,708 591,483
Total $ 8,955,029 $ 2,035,320
Amounts reported as deferred outflows of resources and deferred inflows of resourcesrelated to pensions will be recognized in pension expense as follows. These amounts areexclusive of employer contributions to the plan made subsequent to the measurementdate ($1,645,758), which will impact the net pension liability in fiscal year 2017, ratherthan pension expense. (No amounts available for 2021 and thereafter).
Years EndingJune 30 Amount
2017 $ 1,895,3612018 1,152,7202019 1,564,6112020 661,259
86

City of South Bend, Indiana
Notes to Financial StatementsDecember 31, 2016
Note 18 - Cost-Sharing Multiple-Employer Defined Benefit Pension Plan -Public Employees' Retirement Fund (Continued)
Actuarial Assumptions - The total pension liability in the June 30, 2016 actuarialvaluation was determined using the following actuarial assumptions, applied to allperiods included in the measurement:
Inflation 2.25%Salary increases 2.5%
4.25% Average, including inflationInvestment rate of return 6.75% Net of pension plan investment
expense, including inflation
Mortality rates were based on the RP 2014 (with MP-2014 improvement removed)Total Data Set mortality table projected on a fully generational basis using the futuremortality improvement scale inherent in the mortality projection included in the SocialSecurity Administration's 2014 Trustee report.
The actuarial assumptions used in the June 30, 2016 valuation were based on the resultsof an actuarial experience study for the four years ended June 30, 2014. The study wasperformed in April 2015. As a result of the study, inflation decreased from 3.00 percentto 2.25 percent, future salary rates decreased from a table range of 3.25 percent to 4.50percent to a table ranging from 2.50 percent to 4.25 percent. The mortality rateschanged from the 2013 IRS Static Mortality projected five years with Scale AA to theprocess referenced above. Each of these assumption changes were made to moreclosely reflect actual experience.
Discount Rate - The discount rate used to measure the total pension liability was 6.75percent. The projection of cash flows used to determine the discount rate assumed thatemployee contributions will be made at the current contribution rate and that employercontributions will be made at rates equal to the difference between actuariallydetermined contribution rates and the employee rate.
Projected Cash Flows
Based on those assumptions, the pension plan’s fiduciary net position was projected tobe available to make all projected future benefit payments of current active and inactiveemployees. Therefore, the long-term expected rate of return on pension planinvestments was applied to all periods of projected benefit payments to determine thetotal pension liability.
87

City of South Bend, Indiana
Notes to Financial StatementsDecember 31, 2016
Note 18 - Cost-Sharing Multiple-Employer Defined Benefit Pension Plan -Public Employees' Retirement Fund (Continued)
The long-term expected rate of return on pension plan investments was determinedusing a building-block method in which best-estimate ranges of expected future realrates of return (expected returns, net of pension plan investment expense, and inflation)are developed for each major asset class. These ranges are combined to produce thelong-term expected rate of return by weighting the expected future real rates of returnby the target asset allocation percentage and by adding expected inflation. The targetallocation and best estimates of arithmetic real rates of return as of June 30, 2016 foreach major asset class are summarized in the following table.
Asset ClassTarget
Allocation (%)
Long-termExpected RealRate of Return
Public equity %22 %5.70Private equity 10 6.20Fixed income - Ex inflation - Linked 24 2.70Fixed income - Inflation - Linked 7 0.70Commodities 8 2.00Real estate 7 2.70Absolute return 10 4.00Risk parity 12 5.00
Sensitivity of the Net Pension Liability to Changes in the Discount Rate - Thefollowing presents the net pension liability of the City, calculated using the discount rateof 6.75 percent, as well as what the City's net pension liability would be if it werecalculated using a discount rate that is 1 percentage point lower (5.75 percent) or 1percentage point higher (7.75 percent) than the current rate:
1 PercentDecrease(5.75%)
CurrentDiscount Rate
(6.75%)
1 PercentIncrease(7.75%)
Net pension liability $ 35,684,329 $ 24,845,715 $ 15,837,187
Pension Plan Fiduciary Net Position - Detailed information about the plan’s fiduciarynet position is available in a separately issued financial report available athttp://www.inprs.in.gov. The plan’s fiduciary net position has been determined on thesame basis used by the plan. The plan uses the economic resources measurement focusand the full accrual basis of accounting. Investments are stated at fair value. Contributionrevenue is recorded as contributions are due, pursuant to legal requirements. Benefitpayments and refunds of employee contributions are recognized as expense when dueand payable in accordance with the benefit terms.
88

City of South Bend, Indiana
Notes to Financial StatementsDecember 31, 2016
Note 19 - Cost-Sharing Multiple-Employer Defined Benefit Pension Plan -1977 Police Officers' and Firefighters' Pension and DisabilityFund
Plan Description - The 1977 Police Officers' and Firefighters' Pension and DisabilityFund provides pensions for all police officers and firefighters hired after April 30, 1977.The plan is a cost sharing multiple employer defined benefit pension plan administeredby the Indiana Public Employees' Retirement Plan (INPRS). The pension system issues apublicly available financial report that can be obtained at http://www.inprs.in.gov.
Benefits Provided - The plan provides retirement, disability, and death benefits.Benefit terms are established and amended by State legislative action.
Annual retirement benefits for employees are calculated as 50 percent of first-classsalary for 20 years of service. Normal retirement age is 52 with early retirement at 50.Employees are eligible for non duty disability benefits after five years of service and forduty related disability benefits upon hire. Disability retirement benefits are determinedin the same manner as retirement benefits but are payable immediately without anactuarial reduction. Death benefits equal the benefit which would have been payable toa beneficiary if the member had retired at age 50 or at death, whichever is later, underan effective election of the joint and survivor option available for retirement benefits. Anemployee who leaves service may withdraw his or her contributions, plus anyaccumulated interest.
Benefit terms provide for annual cost-of-living adjustments to each employee’sretirement allowance subsequent to the employee’s retirement date. The annualadjustments are determined by statue equal to the change in the Consumer Price Indexbut not in excess of a 3 percent increase.
Contributions - Per Indiana State statute (IC 36 8 8 and IC 36 8 8.5), contributionrequirements of the active employees and the participating employers are establishedand may be amended by the INPRS Board based on recommendations by the INPRSactuary. Employees are required to contribute 6 percent of their annual pay. The City’scontractually required contribution rate for the year ended December 31, 2016 was19.7 percent of annual payroll. Contributions to the plan from the City were $5,235,217for the year ended December 31, 2016.
89

City of South Bend, Indiana
Notes to Financial StatementsDecember 31, 2016
Note 19 - Cost-Sharing Multiple-Employer Defined Benefit Pension Plan -1977 Police Officers' and Firefighters' Pension and DisabilityFund (Continued)
Net Pension Liability, Deferrals, and Pension Expense
At December 31, 2016, the City reported a pension liability of $3,121,765 for itsproportionate share of the net pension liability. The net pension liability was measuredas of December 31, 2016 and the total pension liability used to calculate the net pensionasset was determined by an actuarial valuation as of that date. The City's proportion ofthe net pension asset was based on the City's actuarially required contribution for theyear ended December 31, 2016, relative to all other contributing employers. AtDecember 31, 2016, the City's proportion was 3.5140 percent, which was a decrease of0.08806 from its proportion measured as of December 31, 2015.
For the year ended December 31, 2016, the City recognized pension expense of$4,083,744. At June 30, 2016, the City reported deferred outflows of resources anddeferred inflows of resources related to pensions from the following sources:
DeferredOutflows ofResources
DeferredInflows ofResources
Difference between expected and actual experience $ 1,303,992 $ 1,980,412Changes in assumptions - 8,547,860Net difference between projected and actual earnings
on pension plan investments 15,121,609 3,601,053City contributions made subsequent to the
measurement date 797,296 -Changes in proportion and differences between
employer contributions and proportionate share ofcontributions 107,674 141,747
Total $ 17,330,571 $ 14,271,072
90

City of South Bend, Indiana
Notes to Financial StatementsDecember 31, 2016
Note 19 - Cost-Sharing Multiple-Employer Defined Benefit Pension Plan -1977 Police Officers' and Firefighters' Pension and DisabilityFund (Continued)
Amounts reported as deferred outflows of resources and deferred inflows of resourcesrelated to pensions will be recognized in pension expense as follows. These amounts areexclusive of employer contributions to the plan made subsequent to the measurementdate ($797,296), which will impact the net pension liability in fiscal year 2016, ratherthan pension expense.
Years EndingJune 30 Amount
2017 $ 1,324,2582018 1,324,2582019 3,124,7832020 591,9182021 (1,288,835)
Thereafter (2,814,179)
Actuarial Assumptions - The total pension liability in the June 30, 2016 actuarialvaluation was determined using the following actuarial assumptions, applied to allperiods included in the measurement:
Inflation 2.25 %Salary increases 2.50 % Average, including inflationInvestment rate of return 6.75 % Net of pension plan investment
expense, including inflation
Mortality rates were based on the RP 2014 (with MP-2014 improvement removed) BlueCollar mortality table projected on a fully generational basis using the future mortalityimprovement scale inherent in the mortality projection included in the Social SecurityAdministration's 2014 Trustee report.
Discount Rate - The discount rate used to measure the total pension liability was 6.75percent. The projection of cash flows used to determine the discount rate assumed thatemployee contributions will be made at the current contribution rate and that employercontributions will be made at rates equal to the difference between actuariallydetermined contribution rates and the employee rate.
91

City of South Bend, Indiana
Notes to Financial StatementsDecember 31, 2016
Note 19 - Cost-Sharing Multiple-Employer Defined Benefit Pension Plan -1977 Police Officers' and Firefighters' Pension and DisabilityFund (Continued)
Projected Cash Flows
Based on those assumptions, the pension plan’s fiduciary net position was projected tobe available to make all projected future benefit payments of current active and inactiveemployees. Therefore, the long-term expected rate of return on pension planinvestments was applied to all periods of projected benefit payments to determine thetotal pension liability.
The long-term expected rate of return on pension plan investments was determinedusing a building-block method in which best-estimate ranges of expected future realrates of return (expected returns, net of pension plan investment expense, and inflation)are developed for each major asset class. These ranges are combined to produce thelong-term expected rate of return by weighting the expected future real rates of returnby the target asset allocation percentage and by adding expected inflation. The targetallocation and best estimates of arithmetic real rates of return as of June 30, 2016 foreach major asset class are summarized in the following table.
Asset ClassTarget
Allocation (%)
Long-termExpected RealRate of Return
Public equity %22 %5.70Private equity 10 6.20Fixed income - Ex inflation - Linked 24 2.70Fixed income - Inflation - Linked 7 0.70Commodities 8 2.00Real estate 7 2.70Absolute return 10 4.00Risk parity 12 5.00
Sensitivity of the Net Pension Liability to Changes in the Discount Rate - Thefollowing presents the net pension asset of the City, calculated using the discount rate of6.75 percent, as well as what the City's net pension asset would be if it were calculatedusing a discount rate that is 1 percentage point lower (5.75 percent) or 1 percentagepoint higher (7.75 percent) than the current rate:
1 PercentDecrease(5.75%)
CurrentDiscount Rate
(6.75%)
1 PercentIncrease(7.75%)
Net pension liability (asset) $ 31,878,746 $ 3,121,765 $ (20,081,893)
92

City of South Bend, Indiana
Notes to Financial StatementsDecember 31, 2016
Note 19 - Cost-Sharing Multiple-Employer Defined Benefit Pension Plan -1977 Police Officers' and Firefighters' Pension and DisabilityFund (Continued)
Pension Plan Fiduciary Net Position - Detailed information about the plan’s fiduciarynet position is available in a separately issued financial report available atwww.in.gov/inprs/files/2016INPRSCAFRBook.pdf. The plan’s fiduciary net position hasbeen determined on the same basis used by the plan. The plan uses the economicresources measurement focus and the full accrual basis of accounting. Investments arestated at fair value. Contribution revenue is recorded as contributions are due, pursuantto legal requirements. Benefit payments and refunds of employee contributions arerecognized as expense when due and payable in accordance with the benefit terms.
Note 20 - Defined Benefit Pension Plan - 1925 Police Officers' PensionPlan
Pension Plan Description
Plan Description - The City contributes to the 1925 Police Officers' Pension Plan,which is a single employer defined benefit pension plan. The plan is administered by thelocal pension board as authorized by state statute (IC 36 8 6).
The financial statements of the plan are included in these financial statements as apension and other employee benefit trust fund (a fiduciary fund).
Management of the plan is vested in the pension board, which consists of ninemembers - the Mayor, City Controller, and Chief of Police plus six elected by planmember.
Plan Membership - At the December 31, 2016, pension plan membership consisted ofthe following:
Inactive plan members or beneficiaries currently receiving benefits 210Active plan members 5
Total employees covered by the plan 215
The pension plan is closed to new entrants.
Benefits Provided - The plan provides retirement, disability, and death benefits to planmembers and beneficiaries. The plan was established by the plan administrator, asprovided by state statute. The plan administrator does not issue a publicly availablefinancial report that includes financial statements and required supplementaryinformation of the plan.
93

City of South Bend, Indiana
Notes to Financial StatementsDecember 31, 2016
Note 20 - Defined Benefit Pension Plan - 1925 Police Officers' PensionPlan (Continued)
Contributions - Plan members are required by state statute (IC 36 8 6 4) to contributean amount equal to six percent (6 percent) of the salary of a first class patrolman. Thecontribution requirements of plan members are established by state statute. The City'sannual pension cost and related information, as provided by the actuary, is presented inthis note. The net pension liability (NPL) is considered an obligation of the City and isreflected in the statement of net position. The State of Indiana is required by statute toreimburse the City for benefits paid and has contributed $5,991,750 during 2016 onbehalf of the City. The City has recognized these on behalf payments asintergovernmental revenue and public safety expenditures in the General Fund.
Pension Plan Investments - Policy and Rate of Return
Investment Policy - The pension plan’s policy in regard to the allocation of investedassets is established and may be amended by the pension board by a majority vote of itsmembers. It is the policy of the pension board to pursue an investment strategy thatmanages risk through the prudent diversification of the portfolio across a broad selectionof distinct asset classes. The pension plan’s investment policy discourages the use of cashequivalents, except for liquidity purposes, and aims to refrain from dramatically shiftingasset class allocations over short time spans. The following was the pension board’sadopted asset allocation policy as of December 31, 2016:
Asset ClassTarget
Allocation
Cash or cash equivalents %24Fixed income investments 76
Rate of Return - For the year ended December 31, 2016, the annual money-weightedrate of return on pension plan investments, net of pension plan investment expense, was0.97 percent. The money-weighted rate of return expresses investment performance,net of investment expense, adjusted for the changing amounts actually invested.
Net Pension Liability of the City
City reports pension expense based on funding requirements, as directed by GASBStatement No. 68. The net pension liability of the City has been measured as ofDecember 31, 2016 and is composed of the following:
Total pension liability $ 84,083,604Plan fiduciary net position (793,858)
City's net pension liability $ 83,289,746
Plan fiduciary net position as a percentage of the total pension liability %0.9
94

City of South Bend, Indiana
Notes to Financial StatementsDecember 31, 2016
Note 20 - Defined Benefit Pension Plan - 1925 Police Officers' PensionPlan (Continued)
Changes in the net pension liability during the measurement year were as follows:
Increase (Decrease)
Changes in Net Pension LiabilityTotal Pension
LiabilityPlan NetPosition
Net PensionLiability
Balance at December 31, 2015 $ 92,772,809 $ 1,157,433 $ 91,615,376
Service cost 164,481 - 164,481Interest 2,344,653 - 2,344,653Differences between expected and
actual experience 396,259 - 396,259Changes in assumptions (5,617,308) - (5,617,308)Non-employer contributing entity
contributions 5,991,750 (5,991,750)Net investment income - 6,713 (6,713)Other revenue - 15,749 (15,749)Benefit payments, including refunds (5,977,290) (6,364,236) 386,946Administrative expenses - (13,551) 13,551
Net changes (8,689,205) (363,575) (8,325,630)
Balance at December 31, 2016 $ 84,083,604 $ 793,858 $ 83,289,746
Pension Expense and Deferred Outflows of Resources and Deferred Inflows ofResources Related to Pensions
For the year ended December 31, 2016, the City recognized pension expense of$6,377,787. At December 31, 2016, the City reported no deferred outflows ofresources or deferred inflows of resources related to pensions.
Actuarial Assumptions - The total pension liability in the December 31, 2016 actuarialvaluation was determined using the following actuarial assumptions, applied to allperiods included in the measurement:
Inflation 2.25 %Salary increases 2.50 % Average, including inflationInvestment rate of return 3.23 % Net of pension plan investment
expense, including inflation
Mortality rates were based on the RP 2014 Blue Collar Set Mortality Table withmortality improvement since 2006 using scale MP 2014 removed and projected on afully generational basis using the future mortality improvement scale inherent in themortality projection included in the Social Security Administration's 2014 Trusteereport.
95

City of South Bend, Indiana
Notes to Financial StatementsDecember 31, 2016
Note 20 - Defined Benefit Pension Plan - 1925 Police Officers' PensionPlan (Continued)
Discount Rate - The discount rate used to measure the total pension liability was 3.23percent. The discount rate increased from the 2.59 percent used for the December 31,2016 calculation of the net pension liability. The projection of cash flows used todetermine the discount rate considered the fact that on behalf contributions made bythe State of Indiana are made as benefit payments become due for payment.
Projected Cash Flows
Based on those assumptions, the pension plan's fiduciary net position was not projectedto be available to make all projected future benefit payments of current active andinactive employees. Therefore, the discount rate incorporates a municipal bond ratewhich was 3.23 percent. The source of that bond rate was the Barclay's 20-yearMunicipal Bond Index as of December 31, 2016. The municipal bond rate was applied tothe remaining periods.
The long term expected rate of return on pension plan investments was determinedusing a building block method in which best estimate ranges of expected future realrates of return (expected returns, net of pension plan investment expense and inflation)are developed for each major asset class. These ranges are combined to produce thelong term expected rate of return by weighting the expected future real rates of returnby the target asset allocation percentage and by adding expected inflation. Bestestimates of arithmetic real rates of return as of December 31, 2016 for each majorasset class included in the pension plan's target asset allocation, as disclosed in theinvestment footnote, are summarized in the following table.
Asset Class
Long-termExpected RealRate of Return
Cash or cash equivalents %1.00Fixed income investments 1.00
Sensitivity of the Net Pension Liability to Changes in the Discount Rate - Thefollowing presents the net pension liability of the City, calculated using the discount rateof 3.23 percent, as well as what the City's net pension liability would be if it werecalculated using a discount rate that is 1 percentage point lower (2.23 percent) or 1percentage point higher (4.23 percent) than the current rate:
1 PercentDecrease(2.23%)
CurrentDiscount Rate
(3.23%)
1 PercentIncrease(4.23%)
Net pension liability of the City $ 92,264,997 $ 83,289,746 $ 75,705,132
96

City of South Bend, Indiana
Notes to Financial StatementsDecember 31, 2016
Note 20 - Defined Benefit Pension Plan - 1925 Police Officers' PensionPlan (Continued)
Pension Plan Fiduciary Net Position - Detailed information about the plan’s fiduciarynet position is not available in the separately issued financial report. For the purpose ofmeasuring the net pension liability, deferred outflows of resources, and deferred inflowsor resources related to pension and pension expense, information about the plan’sfiduciary net position and addition to/deduction from fiduciary net position have beendetermined on the same basis as they are report by the plan. The plan uses theeconomic resources measurement focus and the full accrual basis of accounting.Investments are stated at fair value. Contribution revenue is recorded as contributionsare due, pursuant to legal requirements. Benefit payments and refunds of employeecontributions are recognized as expense when due and payable in accordance with thebenefit terms.
Note 21 - Defined Benefit Pension Plan - 1937 Firefighters' Pension Plan
Pension Plan Description
Plan Description - The City contributes to the 1937 Firefighters' Pension Plan, which isa single employer defined benefit pension plan. The plan is administered by the localpension board as authorized by state statute (IC 36 8 7).
The financial statements of the plan are included in these financial statements as apension and other employee benefit trust fund.
Management of the plan is vested in the pension board.
Plan Membership - At the December 31, 2016, pension plan membership consisted ofthe following:
Inactive plan members or beneficiaries currently receiving benefits 172Active plan members 6
Total employees covered by the plan 178
The pension plan is closed to new entrants.
Benefits Provided - The plan provides retirement, disability, and death benefits to planmembers and beneficiaries. The plan was established by the plan administrator, asprovided by state statute. The plan administrator does not issue a publicly availablefinancial report that includes financial statements and required supplementaryinformation of the plan.
97

City of South Bend, Indiana
Notes to Financial StatementsDecember 31, 2016
Note 21 - Defined Benefit Pension Plan - 1937 Firefighters' Pension Plan(Continued)
Contributions - Plan members are required by state statute (IC 36 8 7 8) to contributean amount equal to 6 percent of the salary of a first class firefighter. The contributionrequirements of plan members are established by state statute. The City's annualpension cost and related information, as provided by the actuary, is presented in thisnote. The net pension liability (NPL) is considered an obligation of the City and isreflected in the statement of net position. The State of Indiana is required by statute toreimburse the City for benefits paid and has contributed $4,866,271 during 2016 onbehalf of the City. The City has recognized these on behalf payments asintergovernmental revenue and public safety expenditures in the General Fund.
Pension Plan Investments - Policy and Rate of Return
Investment Policy - The pension plan’s policy in regard to the allocation of investedassets is established and may be amended by the pension board by a majority vote of itsmembers. It is the policy of the pension board to pursue an investment strategy thatmanages risk through the prudent diversification of the portfolio across a broad selectionof distinct asset classes. The pension plan’s investment policy discourages the use of cashequivalents, except for liquidity purposes, and aims to refrain from dramatically shiftingasset class allocations over short time spans. The following was the pension board’sadopted asset allocation policy as of December 31, 2016:
Asset ClassTarget
Allocation
Cash or cash equivalents %24.0Government agency securities 76.0
Rate of Return - For the year ended December 31, 2016, the annual money-weightedrate of return on pension plan investments, net of pension plan investment expense, was0.97 percent. The money-weighted rate of return expresses investment performance,net of investment expense, adjusted for the changing amounts actually invested.
98

City of South Bend, Indiana
Notes to Financial StatementsDecember 31, 2016
Note 21 - Defined Benefit Pension Plan - 1937 Firefighters' Pension Plan(Continued)
Net Pension Liability of the City
The City reports pension expense based on funding requirements, as directed by GASB68. The net pension liability of the City has been measured as of December 31, 2016and is composed of the following:
Total pension liability $ 69,624,264Plan fiduciary net position (167,194)
City's net pension liability $ 69,457,070
Plan fiduciary net position as a percentage of the total pension liability %0.2
Changes in the net pension liability during the measurement year were as follows:
Increase (Decrease)
Changes in Net Pension LiabilityTotal Pension
LiabilityPlan NetPosition
Net PensionLiability
Balance at December 31, 2015 $ 77,409,213 $ 472,035 $ 76,937,178
Service cost 163,162 - 163,162Interest 1,940,826 - 1,940,826Differences between expected and
actual experience (262,337) - (262,337)Changes in assumptions (4,645,609) - (4,645,609)Non-employer contributing entity
contributions 4,866,271 (4,866,271)Net investment income - 2,852 (2,852)Other revenue - 6,279 (6,279)Benefit payments, including refunds (4,980,991) (5,165,758) 184,767Administrative expenses - (14,485) 14,485
Net changes (7,784,949) (304,841) (7,480,108)
Balance at December 31, 2016 $ 69,624,264 $ 167,194 $ 69,457,070
Pension Expense and Deferred Outflows of Resources and Deferred Inflows ofResources Related to Pensions
For the year ended December 31, 2016, the City recognized pension expense of$5,180,243. At December 31, 2016, the City reported no deferred outflows ofresources or deferred inflows of resources related to pensions.
99

City of South Bend, Indiana
Notes to Financial StatementsDecember 31, 2016
Note 21 - Defined Benefit Pension Plan - 1937 Firefighters' Pension Plan(Continued)
Actuarial Assumptions - The total pension liability in the December 31, 2016 actuarialvaluation was determined using the following actuarial assumptions, applied to allperiods included in the measurement:
Inflation 2.25 %Salary increases 2.50 % Average, including inflationInvestment rate of return 3.23 % Net of pension plan investment
expense, including inflation
Mortality rates were based on the RP 2014 Blue Collar Set Mortality Table withmortality improvement since 2006 using scale MP 2014 removed and projected on afully generational basis using the future mortality improvement scale inherent in themortality projection included in the Social Security Administration's 2014 Trusteereport.
Discount Rate - The discount rate used to measure the total pension liability was 3.23percent. The discount rate increased from the 2.59 percent used for the December 31,2016 calculation of the net pension liability. The projection of cash flows used todetermine the discount rate considered the fact that on behalf contributions made bythe State of Indiana are made as benefit payments become due for payment.
Projected Cash Flows
Based on those assumptions, the pension plan's fiduciary net position was not projectedto be available to make all projected future benefit payments of current active andinactive employees. Therefore, the discount rate incorporates a municipal bond ratewhich was 3.23 percent. The source of that bond rate was the Barclay's 20 yearMunicipal Bond Index as of December 31, 2016. The municipal bond rate was applied toall remaining periods.
100

City of South Bend, Indiana
Notes to Financial StatementsDecember 31, 2016
Note 21 - Defined Benefit Pension Plan - 1937 Firefighters' Pension Plan(Continued)
The long-term expected rate of return on pension plan investments was determinedusing a building-block method in which best-estimate ranges of expected future realrates of return (expected returns, net of pension plan investment expense, and inflation)are developed for each major asset class. These ranges are combined to produce thelong-term expected rate of return by weighting the expected future real rates of returnby the target asset allocation percentage and by adding expected inflation. Bestestimates of arithmetic real rates of return as of December 31, 2016 for each majorasset class included in the pension plan's target asset allocation, as disclosed in theinvestment footnote, are summarized in the following table.
Asset Class
Long-termExpected RealRate of Return
Cash or cash equivalents %1.00Government agency securities %1.00
Sensitivity of the Net Pension Liability to Changes in the Discount Rate - Thefollowing presents the net pension liability of the City, calculated using the discount rateof 3.23 percent, as well as what the City's net pension liability would be if it werecalculated using a discount rate that is 1 percentage point lower (2.23 percent) or 1percentage point higher (4.23 percent) than the current rate:
1 PercentDecrease(2.23%)
CurrentDiscount Rate
(3.23%)
1 PercentIncrease(4.23%)
Net pension liability of the City $ 76,932,710 $ 69,457,070 $ 63,140,181
Pension Plan Fiduciary Net Position - Detailed information about the plan’s fiduciarynet position is not available in the separately issued financial report. For the purpose ofmeasuring the net pension liability, deferred outflows of resources, and deferred inflowsor resources related to pension and pension expense, information about the plan’sfiduciary net position and addition to/deduction from fiduciary net position have beendetermined on the same basis as they are report by the plan. The plan uses theeconomic resources measurement focus and the full accrual basis of accounting.Investments are stated at fair value. Contribution revenue is recorded as contributionsare due, pursuant to legal requirements. Benefit payments and refunds of employeecontributions are recognized as expense when due and payable in accordance with thebenefit terms.
101

City of South Bend, Indiana
Notes to Financial StatementsDecember 31, 2016
Note 22 - Pension Trust Funds
The following are condensed financial statements for the individual pension plans:
1925 PolicePension
1937 Firefighters'Pension
Statement of Net Position
Cash and investments $ 791,162 $ 167,278Other assets 2,788 349Liabilities (92) (433)
Net position $ 793,858 $ 167,194
Statement of Changes in Net Position
Investment income $ 6,713 $ 2,852Contributions 6,007,499 4,872,550Benefit payments (6,364,236) (5,165,758)Other deductions (13,551) (14,485)
Net change in net position $ (363,575) $ (304,841)
Note 23 - Closure and Postclosure Care Cost
As of January 1, 2008, the City of South Bend's Biosolids Lagoon #4 site has beenclosed. The City is required to maintain the one-acre site by monitoring methane andgroundwater and maintain the site (mowing, cover inspection, gas collection systeminspection, cover repair, ditch maintenance, etc.). The closure and postclosure carecosts are reported as operating expenses, as incurred. For the year ending December31, 2016, the total expenses incurred were $22,064. The remaining expected liabilityrelating to postclosure costs is estimated at less than $250,000 and due to the minimalnature of these expenditures, is not included in the financial statements.
Note 24 - Tax Abatements
The City enters into property tax abatement agreements with local businesses and alsofor qualifying residential construction under the City’s Municipal Code Chapter 2, Article6, Tax Abatements, created by Ordinance 7267-83. Under this Article, the City maygrant property tax abatements to a business located within or promising to relocate tothe City for the purpose of attracting or retaining the business and also for the purposeof encouraging residential construction within economic development target areas.
For the fiscal year ended December 31, 2016, the City abated property taxes totaling$677,479 under this program. Two industrial properties had property taxes abated thatexceeded 10 percent of the total amount. For these two properties the taxes abatedwere $106,405 and $93,375.
102

City of South Bend, Indiana
Notes to Financial StatementsDecember 31, 2016
Note 25 - Upcoming Accounting Pronouncements
In June 2015, the GASB issued Statement No. 75, Accounting and Financial Reporting forPostemployment Benefits Other Than Pensions, which addresses reporting bygovernments that provide postemployment benefits other than pensions (OPEB) totheir employees and for governments that finance OPEB for employees of othergovernments. This OPEB standard will require the City to recognize on the face of thefinancial statements its net OPEB liability related to the City of South Bend RetireeHealthcare Plan. The statement also enhances accountability and transparency throughrevised note disclosures and required supplemental information (RSI). The City iscurrently evaluating the impact this standard will have on the financial statements whenadopted. The provisions of this statement are effective for the City’s financial statementsfor the year ending December 31, 2018.
103

Required Supplemental Information
104

City of South Bend, Indiana
Required Supplemental Information1925 Police Officers' Pension Plan
Schedule of Investment Returns Last Three Fiscal Years
2016 2015 2014
Annual money-weighted rate of return, net ofinvestment expense %1.0 %0.8 %0.6
105

City of South Bend, Indiana
Required Supplemental Information1925 Police Officers' Pension Plan
Schedule of City Contributions Last Ten Fiscal Years
2016 2015 2014 2013 2012 2011 2010 2009 2008 2007
Actuarially determined contribution $ 6,133,389 $ 6,073,049 $ 6,432,800 $ 6,633,200 $ 6,986,200 $ 7,317,800 $ 6,673,100 $ 5,995,700 $ 6,421,500 $ 6,722,800Contributions in relation to the actuarially
determined contribution 6,364,236 6,323,645 6,116,195 5,837,216 6,776,614 6,512,842 5,805,597 6,355,442 5,072,985 4,773,188
Contribution (Excess) Deficiency $ (230,847) $ (250,596) $ 316,605 $ 795,984 $ 209,586 $ 804,958 $ 867,503 $ (359,742) $ 1,348,515 $ 1,949,612
Covered Employee Payroll $ - $ 441,200 $ 441,200 $ 430,000 $ 421,800 $ 542,900 $ 569,500 $ 611,000 $ 652,000 $ 350,667
Contributions as a Percentage ofCovered Employee Payroll n/a %1,433.3 %1,386.3 %1,357.5 %1,606.6 %1,199.6 %1,019.4 %1,040.2 %778.1 %1,361.2
Notes to Schedule of City Contributions
Actuarial valuation information relative to the determination of contributions:
Valuation date December 31, 2016
Methods and assumptions used to determine contribution rates:
Actuarial cost method Entry age normal
Amortization method Level percent of payroll
Remaining amortization period 30 years
Asset valuation method Not applicable. Benefits are funded on a pay-as-you-go basis
Inflation 2.25% per year
Salary increases 2.50% per year
Investment rate of return 3.23% per year
Retirement age Non-converted - any age with 20 or more years of creditable serviceConverted - age 52 with 20 or more years of creditable service and no longer active
Mortality RP-2014 Total Data Set Mortality Tables with mortality improvement since 2006 using scale MP-2014 removedand projected on a fully generational basis using the future mortality improvement scale inherent in the mortalityprojection included in the Social Security Administration's 2014 Trustee Report
Other information Cost of living increases of 2.50% per year in retirement for non-converted and 2.00% per year in retirement forconverted
106

City of South Bend, Indiana
Required Supplemental InformationSchedule of Changes in the City Net Pension Liability
and Related Ratios Last Three Fiscal Years
2016 2015 2014
Total Pension LiabilityService cost $ 164,481 $ 184,104 $ 157,965Interest 2,344,653 2,415,583 3,721,864Changes in benefit terms - - -Differences between expected and actualexperience 396,259 (2,973,249) -Changes in assumptions (5,617,308) (294,402) 12,487,771Projected benefit payments (5,977,290) (6,061,589) (6,122,870)
Net Change in Total Pension Liability (8,689,205) (6,729,553) 10,244,730
Total Pension Liability - Beginning of year 92,772,809 99,502,362 89,257,632
Total Pension Liability - End of year $ 84,083,604 $ 92,772,809 $ 99,502,362
Plan Fiduciary Net PositionContributions - Other $ 15,749 $ 62 $ 4,329Contributions - Non-employer Entity 5,991,750 6,378,359 6,111,865Net investment income 6,713 4,376 3,759Administrative expenses (13,551) (12,462) (10,957)Benefit payments, including refunds (6,364,236) (6,323,646) (6,705,815)Other - - -
Net Change in Plan Fiduciary Net Position (363,575) 46,689 (596,819)
Plan Fiduciary Net Position - Beginning of year 1,157,433 1,110,743 1,707,562
Plan Fiduciary Net Position - End of year $ 793,858 $ 1,157,432 $ 1,110,743
City's Net Pension Liability - Ending $ 83,289,746 $ 91,615,377 $ 98,391,619
Plan Fiduciary Net Position as a Percentageof Total Pension Liability %0.94 %1.25 %1.12
Covered Employee Payroll $ - $ 441,200 $ 441,200
City's Net Pension Liability as a Percentageof Covered Employee Payroll n/a %20,765.0 %22,300.9
107

City of South Bend, Indiana
Required Supplemental Information1937 Firefighters' Pension Plan
Schedule of Investment Returns Last Three Fiscal Years
2016 2015 2014
Annual money-weighted rate of return, net ofinvestment expense %1.0 %0.8 %0.6
108

City of South Bend, Indiana
Required Supplemental Information1937 Firefighters' Pension PlanSchedule of City Contributions
Last Ten Fiscal Years
2016 2015 2014 2013 2012 2011 2010 2009 2008 2007
Actuarially determined contribution $ 5,152,192 $ 4,977,042 $ 5,436,400 $ 5,550,900 $ 5,787,300 $ 6,399,700 $ 5,811,400 $ 5,258,600 $ 4,436,200 $ 5,104,800Contributions in relation to the actuarially
determined contribution 5,165,758 5,197,158 5,130,581 5,051,319 5,208,570 5,503,742 5,172,146 5,416,358 4,702,372 6,738,336
Contribution (Excess) Deficiency $ (13,566) $ (220,116) $ 305,819 $ 499,581 $ 578,730 $ 895,958 $ 639,254 $ (157,758) $ (266,172) $(1,633,536)
Covered Employee Payroll $ - $ 328,600 $ 328,600 $ 319,300 $ 365,500 $ 397,100 $ 429,500 $ 474,450 $ 519,400 $ 1,338,200
Contributions as a Percentage ofCovered Employee Payroll n/a %1,581.6 %1,561.3 %1,582.0 %1,425.1 %1,386.0 %1,204.2 %1,141.6 %905.3 %503.5
Notes to Schedule of City Contributions
Actuarial valuation information relative to the determination of contributions:
Valuation date December 31, 2016
Methods and assumptions used to determine contribution rates:
Actuarial cost method Entry age normal
Amortization method Level percent of payroll
Remaining amortization period 30 years
Asset valuation method Not applicable. Benefits are funded on a pay-as-you-go basis
Inflation 2.25% per year
Salary increases 2.50% per year
Investment rate of return 3.23% per year
Retirement age Non-converted - any age with 20 or more years of creditable serviceConverted - age 52 with 20 or more years of creditable service and no longer active
Mortality RP-2014 Total Data Set Mortality Tables with mortality improvement since 2006 using scale MP-2014 removedand projected on a fully generational basis using the future mortality improvement scale inherent in the mortalityprojection included in the Social Security Administration's 2014 Trustee Report
Other information Cost of living increases of 2.50% per year in retirement for non-converted and 2.00% per year in retirement forconverted
109

City of South Bend, Indiana
Required Supplemental InformationSchedule of Changes in the City Net Pension Liability
and Related Ratios Last Three Fiscal Years
2016 2015 2014
Total Pension LiabilityService cost $ 163,162 $ 155,487 $ 114,297Interest 1,940,826 2,020,796 3,155,669Changes in benefit terms - - -Differences between expected and actualexperience (262,337) (2,816,692) -Changes in assumptions (4,645,609) (245,887) 9,620,657Projected benefit payments (4,980,991) (5,094,762) (5,206,870)
Net Change in Total Pension Liability (7,784,949) (5,981,058) 7,683,753
Total Pension Liability - Beginning of year 77,409,213 83,390,271 75,706,518
Total Pension Liability - End of year $ 69,624,264 $ 77,409,213 $ 83,390,271
Plan Fiduciary Net PositionContributions - Other $ 6,279 $ 2,667 $ 1,484Contributions - Non-employer Entity 4,866,271 5,039,025 5,129,098Net investment income 2,852 2,675 1,963Administrative expenses (14,485) (14,255) (10,920)Benefit payments, including refunds (5,165,757) (5,197,159) (5,407,429)Other - - -
Net Change in Plan Fiduciary Net Position (304,840) (167,047) (285,804)
Plan Fiduciary Net Position - Beginning of year 472,034 639,081 924,885
Plan Fiduciary Net Position - End of year $ 167,194 $ 472,034 $ 639,081
City's Net Pension Liability - Ending $ 69,457,070 $ 76,937,179 $ 82,751,190
Plan Fiduciary Net Position as a Percentageof Total Pension Liability %0.24 %0.61 %0.77
Covered Employee Payroll $ - $ 328,600 $ 328,600
City's Net Pension Liability as a Percentageof Covered Employee Payroll n/a %23,413.6 %25,183.0
110

City of South Bend, Indiana
Required Supplemental InformationOPEB System Schedule
Year Ended December 31, 2016
The schedule of funding progress is as follows:
ActuarialValuation Date
ActuarialValue ofAssets
(a)
ActuarialAccrued
Liability (AAL)(b)
UnfundedAAL (UAAL)
(b-a)
Funded Ratio(Percent)
(a/b)
CoveredPayroll
(c)
UAAL as aPercentage of
CoveredPayroll
1/1/11 $ - $ 17,641,023 $ 17,641,023 %- $ - %-1/1/12 - 17,641,023 17,641,023 - - -1/1/13 - 21,493,998 21,493,998 - - -1/1/14 - 21,493,998 21,493,998 - - -1/1/15 - 21,512,620 21,512,620 - 51,521,030 41.81/1/16 - 21,512,620 21,512,620 - 51,521,030 41.8
Information on covered payroll is not available prior to January 1, 2015.
111

City of South Bend, Indiana
Required Supplemental InformationPublic Employees' Retirement Fund
Schedule of City Contributions Last Two Fiscal Years
2016 2015
Actuarially determined contribution $ 4,526,527 $ 3,650,212Contributions in relation to the actuarially determined contribution 2,933,996 2,982,234
Contribution Deficiency $ 1,592,531 $ 667,978
Covered Employee Payroll $ 26,237,016 $ 26,681,229
Contributions as a Percentage of Covered Employee Payroll %11.2 %11.2
Notes to Schedule of City ContributionsActuarial valuation information relative to the determination of contributions:
Valuation date June 30, 2016
Methods and assumptions used to determine contribution rates:
Actuarial cost method Entry age normal
Amortization method Level percent of payroll
Remaining amortization period 30 years
Asset valuation method Not applicable. Benefits are funded on a pay-as-you-go basis
Inflation 2.25% per year
Salary increases 2.50% to 4.25% per year
Investment rate of return 6.75% per year
Retirement age Normal retirement is age 62 with 10 years of service; early retirement is age 50 with 15 years of service (reducedbenefit)
Mortality RP-2014 Total Data Set Mortality Tables with mortality improvement since 2006 using scale MP-2014 removedand projected on a fully generational basis using the future mortality improvement scale inherent in the mortalityprojection included in the Social Security Administration's 2014 Trustee Report
Other information Cost of living increases of 2.00% per year in retirement
112

City of South Bend, Indiana
Required Supplemental InformationPublic Employees' Retirement Fund
Schedule of the City's Proportionate Share of the Net Pension Liability Last Three Fiscal Years
2016 2015 2014
City's proportion of the net pension liability (asset) %0.54700 %0.55700 %0.56300
City's proportionate share of the net pension liability (asset) $ 24,845,715 $ 22,687,694 $ 14,807,363
City's covered employee payroll $ 26,237,016 $ 26,681,229 $ 27,509,916
City's Proportionate Share of the Net Pension Liability (Asset) as a Percentage of itsCovered Employee Payroll %94.7 %85.0 %53.8
Plan Fiduciary Net Position as a Percentage of Total Pension Liability %75.3 %77.3 %84.3
113

City of South Bend, Indiana
Required Supplemental Information1977 Police Officers' Pension and Disability Fund
Schedule of City Contributions Last Two Fiscal Years
2016 2015
Actuarially determined contribution $ 2,029,937 $ 709,017Contributions in relation to the actuarially determined contribution 2,673,614 2,625,418
Contribution Deficiency (Excess) $ (643,677) $ (1,916,401)
Covered Employee Payroll $ 13,571,531 $ 13,327,077
Contributions as a Percentage of Covered Employee Payroll %19.7 %19.7
Notes to Schedule of City ContributionsActuarial valuation information relative to the determination of contributions:
Valuation date June 30, 2016
Methods and assumptions used to determine contribution rates
Actuarial cost method Entry age normal
Amortization method Level percent of payroll
Remaining amortization period 30 years
Asset valuation method Not applicable. Benefits are funded on a pay-as-you-go basis
Inflation 2.25% per year
Salary increases 2.50% per year
Investment rate of return 6.75% per year
Retirement age Normal retirement is age 52 with 20 years of service; early retirement is age 50 with 20 years of service (reducedbenefit)
Mortality RP-2014 Total Data Set Mortality Tables with mortality improvement since 2006 using scale MP-2014 removedand projected on a fully generational basis using the future mortality improvement scale inherent in the mortalityprojection included in the Social Security Administration's 2014 Trustee Report
Other information Cost of living increases of 2.0% per year
114

City of South Bend, Indiana
Required Supplemental Information1977 Police Officers' Pension and Disability Fund
Schedule of the City's Proportionate Share of the Net Pension Liability Last Three Fiscal Years
2016 2015 2014
City's proportion of the net pension liability (asset) %1.75600 %1.78700 %1.82900
City's proportionate share of the net pension liability (asset) $ 1,559,932 $ (2,640,039) $ (932,236)
City's covered employee payroll $ 13,571,531 $ 13,327,077 $ 12,981,067
City's Proportionate Share of the Net Pension Liability (Asset) as a Percentage of its CoveredEmployee Payroll %11.5 %(19.8) %(7.2)
Plan Fiduciary Net Position as a Percentage of Total Pension Liability %98.2 %103.2 %101.1
115
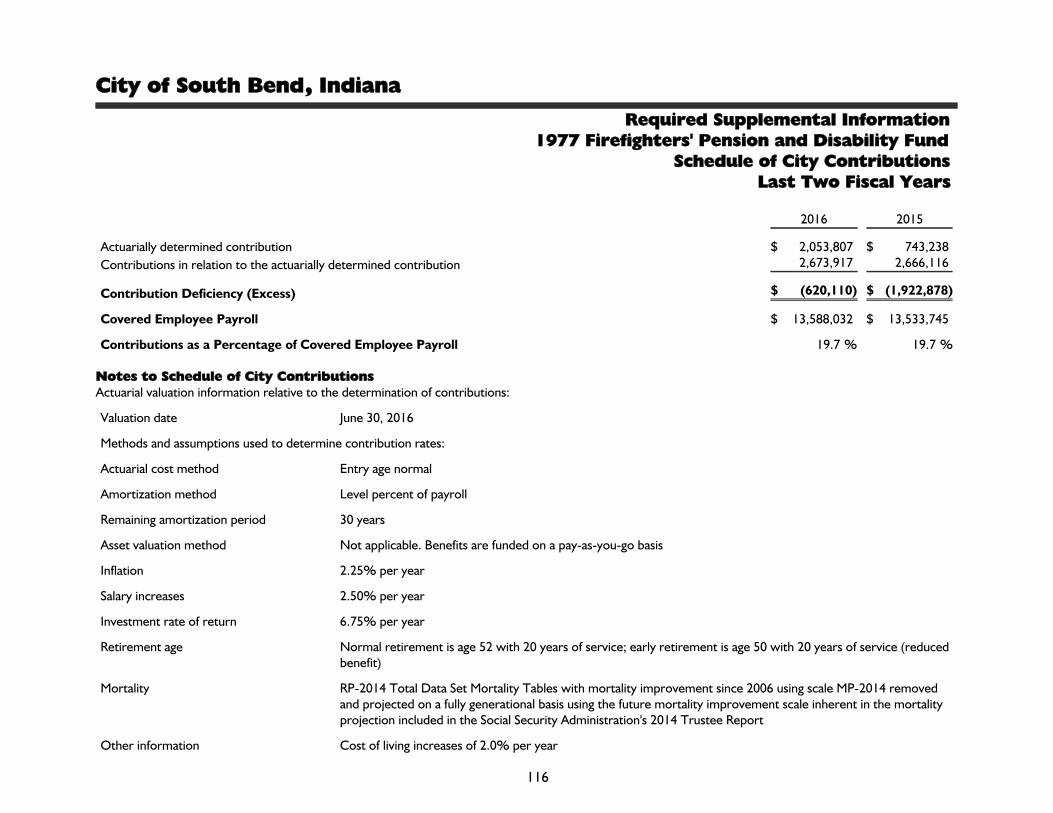
City of South Bend, Indiana
Required Supplemental Information1977 Firefighters' Pension and Disability Fund
Schedule of City Contributions Last Two Fiscal Years
2016 2015
Actuarially determined contribution $ 2,053,807 $ 743,238Contributions in relation to the actuarially determined contribution 2,673,917 2,666,116
Contribution Deficiency (Excess) $ (620,110) $ (1,922,878)
Covered Employee Payroll $ 13,588,032 $ 13,533,745
Contributions as a Percentage of Covered Employee Payroll %19.7 %19.7
Notes to Schedule of City ContributionsActuarial valuation information relative to the determination of contributions:
Valuation date June 30, 2016
Methods and assumptions used to determine contribution rates:
Actuarial cost method Entry age normal
Amortization method Level percent of payroll
Remaining amortization period 30 years
Asset valuation method Not applicable. Benefits are funded on a pay-as-you-go basis
Inflation 2.25% per year
Salary increases 2.50% per year
Investment rate of return 6.75% per year
Retirement age Normal retirement is age 52 with 20 years of service; early retirement is age 50 with 20 years of service (reducedbenefit)
Mortality RP-2014 Total Data Set Mortality Tables with mortality improvement since 2006 using scale MP-2014 removedand projected on a fully generational basis using the future mortality improvement scale inherent in the mortalityprojection included in the Social Security Administration's 2014 Trustee Report
Other information Cost of living increases of 2.0% per year
116

City of South Bend, Indiana
Required Supplemental Information1977 Firefighters' Pension and Disability Fund
Schedule of the City's Proportionate Share of the Net Pension Liability Last Three Fiscal Years
2016 2015 2014
City's proportion of the net pension liability (asset) %1.75800 %1.81500 %1.79500
City's proportionate share of the net pension liability (asset) $ 1,561,833 $ (2,680,987) $ (915,265)
City's covered employee payroll $ 13,588,032 $ 13,533,745 $ 12,744,754
City's Proportionate Share of the Net Pension Liability (Asset) as a Percentage of its CoveredEmployee Payroll %11.5 %(19.8) %(7.2)
Plan Fiduciary Net Position as a Percentage of Total Pension Liability %98.2 %103.2 %101.1
117

118
City of South Bend, Indiana
Required Supplemental Information Budgetary Comparison Schedules
General Fund and Major Special Revenue Funds Year Ended December 31, 2016
VarianceActual With Final
Budgetary BudgetBasis Positive
Original Final Amounts (Negative)
Revenues:Taxes - Property 37,294,758$ 39,362,140$ 39,362,139$ (1)$ Licenses and permits 330,990 196,745 192,840 (3,905) Intergovernmental 9,082,389 9,086,821 9,239,036 152,215 Charges for services 13,105 13,445 145 (13,300) Fines and forfeits 25,920 26,060 14,712 (11,348) Other 3,276,961 3,970,628 3,837,390 (133,238)
Total revenues 50,024,123 52,655,839 52,646,262 (9,577)
Expenditures:Current:
General government:Mayor:
Personnel services 685,492 685,492 627,628 57,864 Supplies 3,000 3,662 1,164 2,498 Other services and charges 52,775 60,729 50,752 9,977
Mayor - 311 Call Center:Personnel services - - - - Supplies - 2,350 1,629 721 Other services and charges - 3,583 2,181 1,402 Capital outlay -
City Clerk:Personnel services 332,855 332,855 298,243 34,612 Supplies 6,800 7,582 6,702 880 Other services and charges 91,918 103,038 100,096 2,942 Capital outlay - - - -
Common Council:Personnel services 278,253 287,971 287,882 89 Supplies 4,500 8,936 6,759 2,177 Other services and charges 206,297 234,128 228,921 5,207 WNIT Contract: Other services and charges 43,000 43,000 43,000 -
Administration/Finance:Personnel services 1,978,924 1,938,924 1,785,784 153,140 Supplies 41,207 42,034 23,853 18,181 Other services and charges 132,956 246,530 238,969 7,561
General Fund
Budgeted Amounts

119
City of South Bend, Indiana
Required Supplemental Information Budgetary Comparison Schedules
General Fund and Major Special Revenue Funds (Continued) Year Ended December 31, 2016
Expenditures (Continued):
Current (Continued):General government (Continued):
City Attorney:Personnel services 984,630$ 948,130$ 937,856$ 10,274$ Supplies 3,450 3,712 3,711 1 Other services and charges 48,430 84,930 81,457 3,473
Human Rights:Personnel services 298,643 298,643 283,311 15,332 Supplies 1,546 1,546 1,200 346 Other services and charges 71,037 71,037 64,646 6,391 Capital outlay - - - -
Neighborhood Code Enforcement: Supplies - - - - Other services and charges - - - -
Total General Government 5,265,713 5,408,812 5,075,744 333,068
Public Safety:Police Department:
Personnel services 23,573,968 22,663,968 22,356,815 307,153 Supplies 273,227 1,256,456 1,196,917 59,539 Other services and charges 2,456,207 2,479,050 2,311,147 167,903
Communication Center: Personnel services - - - - Other services and charges 1,479,012 1,479,012 1,479,012 -
Fire Department: Personnel services 16,306,864 16,684,938 16,680,397 4,541 Supplies 325,150 512,643 421,426 91,217 Other services and charges 1,469,347 1,577,508 1,574,281 3,227
Total Public Safety 45,883,775 46,653,575 46,019,995 633,580
Highways and Streets - Engineering:Personnel services 776,239 767,939 664,132 103,807 Supplies 40,500 66,447 56,121 10,326 Other services and charges 303,595 390,751 370,484 20,267
Total highways and streets 1,120,334 1,225,137 1,090,737 134,400
VarianceActual With Final
Budgetary BudgetBasis Positive
Original Final Amounts (Negative)
General Fund
Budgeted Amounts

120
City of South Bend, Indiana
Required Supplemental Information Budgetary Comparison Schedules
General Fund and Major Special Revenue Funds (Continued) Year Ended December 31, 2016
Expenditures (Continued):
Current (Continued):Culture and recreation:
Palais Royale Ballroom:Personnel services 244,557$ 255,007$ 241,501$ 13,506$ Supplies 28,350 22,855 14,369 8,486 Other services and charges 199,389 220,576 195,581 24,995 Capital outlay - - - -
Morris Performing Arts Center:Personnel services 823,612 797,212 720,763 76,449 Supplies 22,201 22,698 17,965 4,733 Other services and charges 264,437 309,987 283,151 26,836
Total culture and recreation 1,582,546 1,628,335 1,473,330 155,005
Total expenditures 53,852,368 54,915,859 53,659,806 1,256,053
Other financing sources - Transfers In 3,828,245 3,828,245 3,828,263 18
Other financing sources - Transfers Out - (202,104) (202,504) (400)
Net change in fund balances - 1,366,121 2,612,215 1,246,094
Fund balances - Beginning 30,486,009 30,486,009 30,486,009 -
Fund balances - Ending 30,486,009$ 31,852,130$ 33,098,224$ 1,246,094$
VarianceActual With Final
Budgetary BudgetBasis Positive
Original Final Amounts (Negative)
General Fund
Budgeted Amounts

121
City of South Bend, Indiana
Required Supplemental Information Budgetary Comparison Schedules
General Fund and Major Special Revenue Funds (Continued) Year Ended December 31, 2016
VarianceActual With Final
Budgetary BudgetBasis Positive
Original Final Amounts (Negative)
Revenues:Taxes - Property 7,487,000$ 7,902,995$ 7,902,995$ -$ Intergovernmental 1,581,265 1,581,265 1,593,574 12,309 Charges for services 1,903,640 1,928,040 1,653,404 (274,636) Fines and forfeits 500 500 - (500) Other 207,394 228,225 200,305 (27,920)
Total revenues 11,179,799 11,641,025 11,350,278 (290,747)
Expenditures:Current:
Culture and recreation:Personnel services 7,222,560 7,276,810 7,120,794 156,016 Supplies 1,096,831 1,094,754 949,139 145,615 Other services and charges 2,723,049 2,907,694 2,763,044 144,650 Capital outlay 50,000 27,312 22,760 4,552 Other Uses - - - -
Total expenditures 11,092,440 11,306,570 10,855,737 450,833
Other financing sources - Transfers out (85,500) (56,889) - 56,889
Net change in fund balances 1,859 277,566 494,541 216,975
Fund balances - Beginning 3,924,992 3,924,992 3,924,992 -
Fund balances - Ending 3,926,851$ 4,202,558$ 4,419,533$ 216,975$
Parks and Recreation Fund
Budgeted Amounts

122
City of South Bend, Indiana
Required Supplemental Information Budgetary Comparison Schedules
General Fund and Major Special Revenue Funds (Continued) Year Ended December 31, 2016
VarianceActual With Final
Budgetary BudgetBasis Positive
Original Final Amounts (Negative)
Revenues:Taxes - County option income tax 6,791,160$ 6,791,160$ 6,791,160$ -$ Other 6,000 6,000 6,989 989
Total revenues 6,797,160 6,797,160 6,798,149 989
Expenditures - Personnel services 6,600,626 6,600,626 6,499,636 100,990
Net change in fund balances 196,534 196,534 298,513 101,979
Fund balances - Beginning 642,770 642,770 642,770 -
Fund balances - Ending 839,304$ 839,304$ 941,283$ 101,979$
Budgeted Amounts
Public Safety LOIT Fund

123
City of South Bend, Indiana
Required Supplemental Information Budgetary Comparison Schedules
General Fund and Major Special Revenue Funds (Continued) Year Ended December 31, 2016
VarianceActual With Final
Budgetary BudgetBasis Positive
Original Final Amounts (Negative)
Revenues:Taxes - County option income 9,454,023$ 9,454,023$ 9,454,023$ -$ Other 878,961 916,987 976,977 59,990
Total revenues 10,332,984 10,371,010 10,431,000 59,990
Expenditures:Current:
General Government:Personnel Services 419,439 419,439 403,691 15,748 Supplies 1,465,932 1,251,271 938,762 312,509 Other services and charges 9,257,308 12,091,368 11,675,640 415,728 Capital outlay 314,000 579,370 326,603 252,767
Total expenditures 11,456,679 14,341,448 13,344,697 996,751
Other financing uses - Transfers out (1,500,000) (1,500,000) (1,500,000) -
Net change in fund balances (2,623,695) (5,470,438) (4,413,697) 1,056,741
Fund balances - Beginning 12,100,667 12,100,667 12,100,667 -
Fund balances - Ending 9,476,972$ 6,630,229$ 7,686,970$ 1,056,741$
COIT Fund
Budgeted Amounts

124
City of South Bend, Indiana
Required Supplemental Information Budgetary Comparison Schedules
General Fund and Major Special Revenue Funds (Continued) Year Ended December 31, 2016
VarianceActual With Final
Budgetary BudgetBasis Positive
Original Final Amounts (Negative)
Revenues:Taxes - County economic development income tax 9,594,602$ 9,594,602$ 9,594,602$ -$ Other 564,660 602,494 600,514 (1,980)
Total revenues 10,159,262 10,197,096 10,195,116 (1,980)
Expenditures:General Government: Personnel services - - - - Supplies - 2,250 1,801 449
Other services and charges 3,768,902 3,966,649 3,092,256 874,393 Capital outlay 197,500 267,500 - 267,500
Total expenditures 3,966,402 4,236,399 3,094,056 1,142,343
Other financing uses - Transfers out (6,483,782) (6,323,782) (6,323,782) -
Net change in fund balances (290,922) (363,085) 777,278 1,140,363
Fund balances - Beginning 9,886,898 9,886,898 9,886,898 -
Fund balances - Ending 9,595,976$ 9,523,813$ 10,664,176$ 1,140,363$
Budgeted Amounts
EDIT Fund

125
City of South Bend, Indiana
Required Supplemental Information Budgetary Comparison Schedules
General Fund and Major Special Revenue Funds (Continued) Year Ended December 31, 2016
VarianceActual With Final
Budgetary BudgetBasis Positive
Original Final Amounts (Negative)
Revenues - Other 40,000$ 1,475,850$ 1,492,266$ 16,416$
Fund balances - Beginning 8,703,422 8,703,422 8,703,422 -
Fund balances - Ending 8,743,422$ 10,179,272$ 10,195,688$ 16,416$
Budgeted Amounts
Rainy Day Fund

126
City of South Bend, Indiana
Required Supplemental Information Budget/GAAP Reconciliation
General Fund and Major Special Revenue Funds Year Ended December 31, 2016
The major differences between budgetary (Non-GAAP) basis and GAAP basis are as follows:
a. Revenues are recorded when received in cash (budgetary) as opposed to susceptible to accrual (GAAP).
b. Expenditures are recorded when paid in cash (budgetary) as opposed to when the liability is incurred (GAAP).
c. Encumbrances are recorded as expenditures for budgetary purposes when purchase orders are issued.
Adjustments necessary to convert the results of operations at the end of the year on a budgetary basis to a GAAP basis are as follows:
Parks and Public SafetyGeneral Recreation LOIT COIT EDIT Rainy Day
Net change in fund balances (budgetary basis) 2,612,215$ 494,541$ 298,513$ (4,413,697)$ 777,278$ 1,492,266$
Adjustments:To adjust revenues for accruals 10,634,279 10,639 44 (114,917) 444 449 To adjust expenditures for accruals (11,295,964) (56,750) (25,367) 241,785 (310,518) - To adjust expenditures for encumbrances 1,380,036 76,858 - 1,241,186 503,462 -
Net change in fund balances (GAAP basis) 3,330,566$ 525,288$ 273,190$ (3,045,643)$ 970,666$ 1,492,715$

127
City of South Bend, Indiana
Notes to Required Supplemental Information Note 1 - Budgets and Budgetary Accounting
The City follows these procedures in establishing the budgetary data reflected in the budgetary comparison schedules:
A. After conferring with the Common Council President and several department heads, the City Controller submits to the Common Council a proposed operating budget for the fiscal year commencing the following January 1. The operating budget includes proposed expenditures and the means of financing them.
B. Prior to adoption, the City advertises the budget and the Common Council holds public hearings to obtain taxpayer comments. The Common Council may reduce, but not increase, the budget from the advertised amounts.
C. No later than November 1 of each year, the budget for the next year is approved by the Common Council through the passage of an ordinance.
D. Copies of the budget ordinance and advertisements for funds for which property taxes are levied or highway use taxes are received are sent to the Indiana Department of Local Government Finance for their review and approval. The budget becomes legally enacted after the City Controller receives approval from the Indiana Department of Local Government Finance. This approval is required by Indiana statute and ad valorem property tax rates are to be set by February 15 of the year budgeted. The budget ordinance as approved by the Indiana Department of Local Government Finance becomes the City's expenditures budget. The City's maximum tax levy is restricted by Indiana law, with certain adjustments and exceptions. If the advertised budget, for funds for which property taxes are levied or for which highway use taxes are received, exceeds the spending and tax limits of the state control laws, an excess levy can be granted by the Indiana Department of Local Government Finance, upon appeal by the City.
E. The legal level of budgetary control (the level at which expenditures may not exceed appropriations without the governing body’s approval) is by object classification for all funds except for the General Fund, which is by object classification within each department. The City’s management cannot transfer budgeted appropriations between object classifications of a budget without approval of the Common Council. Any revisions that alter the total appropriations for any fund or any department of the General Fund must be approved by the Common Council and, in some instances, by the Indiana Department of Local Government Finance. Formal budgetary integration is required by state statute and is employed as a management control method.
F. Formal budgetary integration is required by State statute and is employed as a management control device. An annual budget was legally adopted for the following funds:
Major funds:
• General Fund
• Special revenue funds - parks and recreation, public safety local option income tax (LOIT), county option income tax (COIT), economic development income tax (EDIT), rainy day
• Capital projects fund - River West TIF

128
City of South Bend, Indiana
Notes to Required Supplemental Information (Continued)
Nonmajor governmental funds:
• Special revenue funds - motor vehicle highway, recreation non-reverting, Studebaker Oliver revitalization grants, economic development State grants, DCI operating, community investment grants, police state seizure, juvenile positive assistance, unsafe building, law enforcement continuing education, landlord registration, loss recovery, emergency telephone system, local road and street, excess welfare distribution, LOIT 2016 special distribution, human rights-federal, East Race waterway, Morris and Palais marketing, police block grants, economic development commission, hazmat, Indiana river rescue, COPS block grant II, regional police academy, COPS MORE grant, federal drug enforcement, gift, urban development action grant, leaf collection and removal, police K-9 unit, excess levy
• Debt service fund - College Football Hall of Fame debt service, redevelopment bond - airport taxable, Coveleski bond debt service reserve, redevelopment bond - Palais Royale, Century Center Energy Conservation Debt Service
• Capital projects funds - professional sports development, Coveleski stadium capital, zoo endowment, park non-reverting capital, cumulative capital development, cumulative capital improvement, Morris Performing Arts Center capital, TIF Leighton Plaza, TIF - West Washington, redevelopment general, community revitalization enhancement district, TIF No. 1 - Southside development, TIF No. 3 - Southside development, Football Hall of Fame capital, Major Moves, TIF – river east development, TIF Douglas road, TIF river east residential, certified technology park, Palais Royale historic preservation, airport urban enterprise zone
G The City's budgetary process is based upon cash outflows, which is a non-GAAP basis. Appropriations lapse with the expiration of the budgetary period unless encumbered by a purchase order or contract. Encumbered appropriations are carried over and added to the subsequent year's budget.
H. Budgeted amounts are as originally adopted, or as amended by the Common Council and approved by the Indiana Department of Local Government Finance in the regular legal manner. The net effect of individual amendments to the budget increased the original appropriations by $20,013,977 in 2016 for the funds listed above.
I. Expenditures did not exceed appropriations for any funds or any departments within the General Fund which required legally approved budgets.

Other Supplemental Information
129

City of South Bend, Indiana
Other Supplemental InformationNonmajor Governmental Funds
Fund Descriptions
Special Revenue Funds
Motor Vehicle Highway - To account for street construction and the operations of the streetmaintenance department. Financing is provided by state motor vehicle highway distributions.
Recreation Non-Reverting - To account for fees and related expenses from park departmentactivities.
Studebaker/Oliver Revitalization Grants - To account for expenditures related to theStudebaker and Oliver revitalization projects. Financing is provided by federal and state grantsand loans from other organizations.
Economic Development State Grants - To account for expenditures related to projectspromoting economic development. Financing is provided by state grants and loan payments.Expenditures include grants and related expenses.
DCI Operating - To account for the operating expenditures related to the South BendDepartment of Community Investment. Financing will be provided by revenues received fromcharges for services, other revenue sources, and from fund transfers.
Community Investment Grants - To account for revenues received from the U.S.Department of Housing and Urban Development related to community improvement projects.
Police State Seizure - To account for law enforcement expenditures financed by theauthorized state or local agencies' sale of confiscated property.
Juvenile Positive Assistance - To account for monies received from penalties paid for curfewviolations. Expenditures include Drug Abuse Resistance Education and Juvenile Aid Bureau.
Unsafe Building - To account for expenditures related to board ups and other services relatedto unsafe buildings. Financing will be provided by fines and fees related to the Unsafe Buildinglaw.
Law Enforcement Continuing Education - To account for police fees collected to financepolice officers' continuing education, training, and supplies and equipment.
Landlord Registration - To account for costs related to the South Bend Landlord Registrationprogram. Financing is provided by a registration fee paid by landlords.
Loss Recovery Fund - To account for compensatory or exemplary damage payments fromthird parties arising from loss or damage to City tangible or intangible property.
Emergency Telephone System - To account for 9-1-1 revenues from the county as well asstate grants.
Local Road and Street - To account for operation and maintenance of local and arterial roadand street systems. Financing is provided by state gasoline tax distributions.
130

City of South Bend, Indiana
Other Supplemental InformationNonmajor Governmental FundsFund Descriptions (Continued)
Excess Welfare Distribution - To account for a special distribution from the County that canonly be spent on public safety expenditures.
LOIT 2016 Special Distribution - To account for a special distribution from the State that canonly be spent on road projects.
Human Rights Federal - To account for expenditures to prevent discrimination and topromote human rights. Financing is provided by federal grants.
East Race Waterway - To account for donations for the promotion and development of theEast Race Waterway.
Morris and Palais Marketing - To account for marketing and promotion expendituresfinanced by sponsorship solicitations and donations.
Police Block Grants - To account for federal grants which provide financing for policeactivities.
Economic Development Commission - To account for administrative expenditures of theEconomic Development Commission. Financing is provided by fees from businesses applying forEconomic Development Revenue Bonds.
Hazmat - To account for monies generated by the South Bend Fire Department's response tohazardous materials incidents. Funds are used to purchase, repair, or replace hazmat equipment,or for training and supplies.
Indiana River Rescue - To account for expenditures related to river rescue training. Financingis provided by registration fees.
COPS Block Grant II - To account for federal grants which provide financing for policeactivities.
Regional Police Academy - To account for revenues (tuition) and expenditures (seminars,travel, lectures, and career days) related to the advancement of present and future policeofficers.
COPS MORE Grant - To account for a COPS MORE grant which provides financing for policeactivities.
Federal Drug Enforcement - To account for expenditures for drug enforcement. Financing isprovided by distributions from the authorized federal agencies' confiscated property sale.
Gift - To account for donations, gifts, or bequeaths for purposes designated by the donor.
Urban Development Action Grant - To account for economic development expenditureswhich are financed by federal grants and loan repayments.
131

City of South Bend, Indiana
Other Supplemental InformationNonmajor Governmental FundsFund Descriptions (Continued)
Leaf Collection and Removal - To account for the expenditures of a program to removeleaves from the City each fall. Financing is provided by a monthly service fee charged to all Cityresidents.
Police K-9 Unit - To account for donations for development and maintenance of the K-9 unit.
Excess Levy - To account for monies collected from property taxes that exceed the City'smaximum property tax levy as determined by the Indiana Department of Local GovernmentFinance (DLGF). Proceeds in this statutory fund are used to offset future property tax levyamounts as determined by the DLGF during the budget approval process.
Industrial Revolving - To account for the revenue and expenditures of providing special loansto qualifying local firms. Financing was originally provided by a $5,000,000 Economic AdjustmentAssistance Grant from the U.S. Department of Commerce.
Debt Service Funds
College Football Hall of Fame Debt Service - To accumulate monies for the payment ofRedevelopment Authority bonds issued to refinance bonds issued for construction of the CollegeFootball Hall of Fame. Financing is to be provided by an annual property tax levy.
Redevelopment Bond - Airport Taxable - To accumulate monies as a reserve for thepayment of Redevelopment Authority bonds for the airport taxable project.
Coveleski Bond Debt Service Reserve - To accumulate monies as a reserve for the paymentof the Coveleski Stadium recovery zone economic development bonds. Financing for debtpayments is to be provided by professional sports and convention development area taxes(PSCDA) and county option income tax revenues if PSCDA revenues are insufficient.
Redevelopment Bond - Palais Royale - To accumulate monies as a reserve for the paymentof Redevelopment Authority bonds for the Palais Royale project.
South Bend Building Corporation Debt Service - To account for debt retirement of theBuilding Corporation's Mortgage Bonds. Funding is provided by transfers from other City funds.
TIF Erskine Village Debt Service - To account for Erskine Village project debt retirement ofthe south side tax incremental financing (TIF) district. Financing is provided by transfers from theTIF South Side Development Fund.
Smart Streets Debt Service - To account for debt retirement of 2015 RedevelopmentAuthority bonds for smart streets/"two-way streets" conversion. Funding is provided by transfersfrom other City funds.
Parks Bonds Debt Service Fund - To account for debt retirement of the 2015 BuildingCorporation/EDIT bond for park improvements. Funding is provided by transfers from otherCity funds.
132

City of South Bend, Indiana
Other Supplemental InformationNonmajor Governmental FundsFund Descriptions (Continued)
Century Center Energy Conservation Debt Service - To account for debt retirement of a2015 qualified energy conservation bond for improvements at Century Center. Funding isprovided by hotel/motel tax revenue, interest rebates, and transfers from other City funds.
Redevelopment Authority Debt Service - To accumulate monies for the payment ofRedevelopment Authority bonds issued to refinance bonds issued for construction of a parkinggarage facility, bonds issued for central development area land acquisition and construction ofpublic improvements, bonds issued to purchase the Palais Royale, bonds issued to refinancebonds issued for construction of Century Center improvements, and bonds issued to refinancebonds issued for renovations to the Morris Performing Art Center.
Capital Projects Funds
Professional Sports Development - To account for Professional Sports Development Taxrevenues dedicated towards debt service and improvements at Four Winds Field baseballstadium (formerly known as Coveleski Stadium).
Coveleski Stadium Capital - To account for expenditures related to the maintenance andimprovement of the baseball stadium. Financing is provided by a rental paid by the semi-probaseball team.
Zoo Endowment - To account for construction projects at the City's zoo. Financing is providedby gifts and donations.
Park Non-Reverting Capital - To account for specific revenues used to finance capitalimprovements at the City parks.
Cumulative Capital Development - To account for expenditures relating to the purchase orlease of capital improvements in the City. Financing is provided by a specific property tax levy.
Cumulative Capital Improvement - To account for state cigarette tax distributions used forimprovement projects.
Morris Performing Art Center Capital - To accumulate monies for major repairs and capitalimprovements to the Morris Civic Auditorium. Financing is provided by a surcharge on ticketsales for events held at the auditorium.
Tax Incremental Financing (TIF) - Leighton Plaza - To account for expenditures for publicimprovement projects in the Leighton Plaza tax incremental district. Financing is provided byproperty tax proceeds in excess of those attributable to the assessed value of the property in thedistrict before redevelopment.
Tax Incremental Financing (TIF) - West Washington - To account for expenditures forpublic improvement projects in the West Washington Economic Development Area. Financing isprovided by property tax proceeds in excess of those attributable to the assessed value of theproperty in the district before redevelopment.
133

City of South Bend, Indiana
Other Supplemental InformationNonmajor Governmental FundsFund Descriptions (Continued)
Redevelopment General - To account for eligible redevelopment activities in the StudebakerCorridor financed by proceeds from land sales or leases.
Community Revitalization Enhancement District - To account for public improvements inthe Studebaker/Oliver Community Revitalization Enhancement District. Financing is provided byincome tax and gross retail tax increments in the district.
Tax Incremental Financing (TIF) No. 1 - Southside Development - To account forexpenditures for improvements in the Southside Development Tax incremental district No. 1.Financing is provided by property tax proceeds in excess of those attributable to the assessedvaluation of the property in the district before redevelopment.
Tax Incremental Financing (TIF) No. 3 - Southside Development - To account forexpenditures for improvements in the Southside Development tax incremental district No. 3.Financing is provided by property tax proceeds in excess of those attributable to the assessedvaluation of the property in the district before redevelopment.
Football Hall of Fame Capital - To account for capital expenditures for the College FootballHall of Fame. Financing was provided by a transfer from the City's Professional SportsDevelopment Fund. This fund also accounts for the advance from the General Fund which maybe repaid from future operating surpluses.
Major Moves - To account for state distributions used for road construction and other usesauthorized by Indiana statute.
Tax Incremental Financing (TIF) - River East Development - To account for expendituresfor improvements in the northeast development tax incremental district. Financing is providedby property tax proceeds in excess of those attributable to the assessed valuation of theproperty in the district before redevelopment. During TIF consolidation in 2015, this fund wasrenamed. It was formerly known as the TIF Northeast Development Fund.
Tax Incremental Financing (TIF) - Douglas Road - To account for expenditures forimprovements in the Douglas Road development tax incremental district. Financing is providedby property tax proceeds in excess of those attributable to the assessed valuation of theproperty in the district before redevelopment.
Tax Incremental Financing (TIF) - River East Residential - To account for expenditures forimprovements in the Northeast Neighborhood Residential development tax incremental district.Financing is provided by property tax proceeds in excess of those attributable to the assessedvaluation of the property in the district before redevelopment. During TIF consolidation in 2015,this fund was renamed. It was formerly known as the TIF Northeast Residential Fund.
134

City of South Bend, Indiana
Other Supplemental InformationNonmajor Governmental FundsFund Descriptions (Continued)
Certified Technology Park - To account for expenditures related to acquisition,improvements, construction and maintenance of public facilities, debt service, and otherpermitted uses under Indiana Code 36-7-32-23 in connection with a certified technology park.Financing is provided by property tax proceeds, state gross retail and uses taxes, and otherrevenues.
Palais Royale Historic Preservation - To account for expenditures financed by a 2 percentfee charged for all Palais Royale services.
Airport Urban Enterprise Zone - To account for expenditures for improvements in the Zonearea, financed by property taxes on qualifying properties in the Zone.
Equipment Leasing - To account for proceeds from capital lease-purchase agreements used tofinance major equipment needs of the City.
Century Center Energy Conservation Bond - To account for capital expenditures atCentury Center funded by a qualified energy conservation bond (QECB) and other sources.
Smart Streets Bond Capital Projects Fund - To account for capital expenditures inconnection with the conversion of one-way streets to two-way streets in the downtown area.Funding is provided by a Redevelopment Authority bond.
Parks Bond Capital Projects Fund - To account for capital expenditures in the City parkswith funding provided by a Building Corporation bond.
135

City of South Bend, Indiana
Special Revenue Funds
Motor VehicleHighway
RecreationNonreverting
StudebakerOliver
RevitalizationGrants
EconomicDevelopmentState Grants DCI Operating
Assets
Cash and cash equivalents $ 1,365,518 $ 180,363 $ 190,377 $ 78,146 $ 303,359Investments 4,756,989 628,327 663,207 272,233 1,056,798Receivables:
Taxes - - - - -Accounts 45,096 8,909 - - 6,044Interest 11,448 1,505 1,588 648 2,542Intergovernmental 609,803 - - - -Loans - - - 302,069 -
Due from other funds - 30,048 - - -Advances to other funds - - 400,000 - -Property held for resale - - 1 - -
Total assets $ 6,788,854 $ 849,152 $ 1,255,173 $ 653,096 $ 1,368,743
LiabilitiesAccounts payable $ 317,141 $ 11,049 $ 37,304 $ - $ 4,059Due to other funds 601 - - - -Advances from other funds - - - - -Performance deposits payable - - - - -Accrued liabilities and other -
Accrued payroll payable 72,656 6,879 - - 31,051Other current payables - - - - -
Total liabilities 390,398 17,928 37,304 - 35,110
Fund BalancesNonspendable - - 400,001 238,409 -Restricted 6,398,456 831,224 817,868 414,687 -Committed - - - - -Assigned - - - - 1,333,633Unassigned - - - - -
Total fund balances 6,398,456 831,224 1,217,869 653,096 1,333,633
Total liabilities and fund balances $ 6,788,854 $ 849,152 $ 1,255,173 $ 653,096 $ 1,368,743
136

Other Supplemental InformationCombining Balance Sheet
Nonmajor Governmental FundsDecember 31, 2016
Special Revenue Funds
CommunityInvestment
GrantsPolice State
Seizure
JuvenilePositive
Assistance Unsafe Building
LawEnforcementContinuingEducation
LandlordRegistration
Loss RecoveryFund
EmergencyTelephone
System
$ 241,313 $ 48,448 $ 2,797 $ 371,735 $ 186,486 $ 1,225 $ 216,088 $ 33,671- 168,776 9,744 - 649,651 - 752,774 -
- - - - - - - -- 10,113 - 10,286 26,651 1,605 - -- 404 23 - 1,556 - 1,804 -- - - - - - - -
230,341 - - - - - - -- - - - - - - -- - - - - - - -
3,155,452 - - - - - - -
$ 3,627,106 $ 227,741 $ 12,564 $ 382,021 $ 864,344 $ 2,830 $ 970,666 $ 33,671
$ 445,804 $ - $ - $ 14,139 $ 60,221 $ - $ 1,867 $ -28,680 - - 27,965 - - - -
- - - - - - - -- - - 2,500 - - - -
- - - 4,856 - - - -3,659 - - - - - - -
478,143 - - 49,460 60,221 - 1,867 -
3,335,118 - - - - - - -- 227,741 - - 804,123 - - 33,671- - 12,564 332,561 - 2,830 968,799 -- - - - - - - -
(186,155) - - - - - - -
3,148,963 227,741 12,564 332,561 804,123 2,830 968,799 33,671
$ 3,627,106 $ 227,741 $ 12,564 $ 382,021 $ 864,344 $ 2,830 $ 970,666 $ 33,671
137

City of South Bend, Indiana
Special Revenue Funds
Local Road andStreet
Excess WelfareDistribution
LOIT 2016Special
DistributionHuman Rights
FederalEast RaceWaterway
Assets
Cash and cash equivalents $ 630,081 $ 8 $ 4,025,066 $ 98,716 $ 300Investments 2,194,983 - - 380,643 1,045Receivables:
Taxes - - - - -Accounts 274 - - - -Interest 5,265 - - 745 3Intergovernmental 104,668 - - 91,200 -Loans - - - - -
Due from other funds - - - - -Advances to other funds - - - - -Property held for resale - - - - -
Total assets $ 2,935,271 $ 8 $ 4,025,066 $ 571,304 $ 1,348
LiabilitiesAccounts payable $ 209,999 $ - $ 22,722 $ 7,184 $ -Due to other funds - - - - -Advances from other funds - - - - -Performance deposits payable - - - - -Accrued liabilities and other -
Accrued payroll payable - - - 4,339 -Other current payables - - - - -
Total liabilities 209,999 - 22,722 11,523 -
Fund BalancesNonspendable - - - - -Restricted 2,725,272 8 4,002,344 559,781 -Committed - - - - 1,348Assigned - - - - -Unassigned - - - - -
Total fund balances 2,725,272 8 4,002,344 559,781 1,348
Total liabilities and fund balances $ 2,935,271 $ 8 $ 4,025,066 $ 571,304 $ 1,348
138

Other Supplemental InformationCombining Balance Sheet (Continued)
Nonmajor Governmental FundsDecember 31, 2016
Special Revenue Funds
Morris andPalais
MarketingPolice Block
Grants
EconomicDevelopmentCommission Hazmat
Indiana RiverRescue
COPS BlockGrant II
Regional PoliceAcademy
COPS MOREGrant
$ 10,484 $ 865 $ 6,148 $ 5,961 $ 31,620 $ 76,628 $ 16,937 $ 52,86036,521 3,014 21,416 20,766 110,152 - 59,004 184,147
- - - - - - - -- - - - - - - 20087 7 51 50 265 - 141 439- - - - - - - -- - - - - - - -- - - - - - - -- - - - - - - -- - - - - - - -
$ 47,092 $ 3,886 $ 27,615 $ 26,777 $ 142,037 $ 76,628 $ 76,082 $ 237,646
$ 2,798 $ - $ - $ - $ 1,212 $ 2,796 $ 162 $ 13,276- - - - - - - -- - - - - - - -- - - - - - - -
- - - - 66 - - -- - - - - - - -
2,798 - - - 1,278 2,796 162 13,276
- - - - - - - -- 3,886 - - - 73,832 - 224,370
44,294 - 27,615 26,777 - - 75,920 -- - - - 140,759 - - -- - - - - - - -
44,294 3,886 27,615 26,777 140,759 73,832 75,920 224,370
$ 47,092 $ 3,886 $ 27,615 $ 26,777 $ 142,037 $ 76,628 $ 76,082 $ 237,646
139

City of South Bend, Indiana
Special Revenue Funds
Federal DrugEnforcement Gift
UrbanDevelopmentAction Grant
LeafCollection
andRemoval
Police K-9Unit
Assets
Cash and cash equivalents $ 226,058 $ 25,999 $ 131,910 $ 194,389 $ 636Investments - 90,570 459,527 677,184 2,217Receivables:
Taxes - - - - -Accounts - 25,035 - 37,220 -Interest 149 216 1,101 1,621 5Intergovernmental - - - - -Loans - - 543,909 - -
Due from other funds - - - - -Advances to other funds - - - - -Property held for resale - - - - -
Total assets $ 226,207 $ 141,820 $ 1,136,447 $ 910,414 $ 2,858
LiabilitiesAccounts payable $ - $ 72,900 $ - $ - $ -Due to other funds - - - - -Advances from other funds - - 1,351,598 - -Performance deposits payable - - - - -Accrued liabilities and other -
Accrued payroll payable - - - - -Other current payables - - - - -
Total liabilities - 72,900 1,351,598 - -
Fund BalancesNonspendable - - 416,655 - -Restricted 226,207 68,920 - - -Committed - - - - -Assigned - - - 910,414 2,858Unassigned - - (631,806) - -
Total fund balances 226,207 68,920 (215,151) 910,414 2,858
Total liabilities and fund balances $ 226,207 $ 141,820 $ 1,136,447 $ 910,414 $ 2,858
140

Other Supplemental InformationCombining Balance Sheet (Continued)
Nonmajor Governmental FundsDecember 31, 2016
Special Revenue Funds Debt Service Funds
Excess Levy
IndustrialRevolving
Fund Total
CollegeFootball Hall of
Fame DebtService
RedevelopmentBond - Airport
Taxable
Coveleski BondDebt Service
Reserve
RedevelopmentBond - Palais
Royale
South BendBuilding
CorporationDebt Service
$ - $ 2,405,340 $ 11,159,532 $ 80,272 $ 231,260 $ 114,096 $ 386,398 $ 567,788- 233,866 13,433,554 212,042 805,629 397,471 1,346,075 -
- - - - - - - -- - 171,433 - - - - -- - 31,663 480 1,930 952 3,225 -- - 805,671 - - - - -- 4,059,177 5,135,496 - - - - -- - 30,048 - - - - -- - 400,000 - - - - -- 97,800 3,253,253 - - - - -
$ - $ 6,796,183 $ 34,420,650 $ 292,794 $ 1,038,819 $ 512,519 $ 1,735,698 $ 567,788
$ - $ - $ 1,224,633 $ - $ - $ - $ - $ -- - 57,246 - - - - -- - 1,351,598 - - - - -- - 2,500 - - - - -
- - 119,847 - - - - -- - 3,659 - - - - -
- - 2,759,483 - - - - -
- 3,263,958 7,654,141 - - - - -- 3,532,225 20,944,615 292,794 1,038,819 512,519 1,735,698 567,788- - 1,492,708 - - - - -- - 2,387,664 - - - - -- - (817,961) - - - - -
- 6,796,183 31,661,167 292,794 1,038,819 512,519 1,735,698 567,788
$ - $ 6,796,183 $ 34,420,650 $ 292,794 $ 1,038,819 $ 512,519 $ 1,735,698 $ 567,788
141

City of South Bend, Indiana
Debt Service Funds
TIF ErskineVillage Debt
ServiceSmart StreetsDebt Service
Parks BondDebt Service
Fund
CenturyCenter EnergyConservationDebt Service
RedevelopmentAuthority Debt
ServiceAssets
Cash and cash equivalents $ 561,117 $ 2,108,440 $ 561,943 $ 51,659 $ 1,232,769Investments - - - 5,493 -Receivables:
Taxes - - - - -Accounts - - - - -Interest - 179 - 12 -Intergovernmental - - - - -Loans - - - - -
Due from other funds - - - - -Advances to other funds - - - - -Property held for resale - - - - -
Total assets $ 561,117 $ 2,108,619 $ 561,943 $ 57,164 $ 1,232,769
LiabilitiesAccounts payable $ - $ - $ - $ 111 $ -Due to other funds - - - - -Advances from other funds - - - - -Performance deposits payable - - - - -Accrued liabilities and other -
Accrued payroll payable - - - - -Other current payables - - - - -
Total liabilities - - - 111 -
Fund BalancesNonspendable - - - - -Restricted 561,117 2,108,619 561,943 57,053 1,232,769Committed - - - - -Assigned - - - - -Unassigned - - - - -
Total fund balances 561,117 2,108,619 561,943 57,053 1,232,769
Total liabilities and fund balances $ 561,117 $ 2,108,619 $ 561,943 $ 57,164 $ 1,232,769
142

Other Supplemental InformationCombining Balance Sheet (Continued)
Nonmajor Governmental FundsDecember 31, 2016
Debt ServiceFunds Capital Projects Funds
Total
ProfessionalSports
Development
CoveleskiStadiumCapital
ZooEndowment
ParkNonreverting
Capital
CumulativeCapital
Development
CumulativeCapital
Improvement
MorrisPerformingArts Center
Capital
$ 5,895,742 $ 88,450 $ 20,157 $ 11,109 $ 69,177 $ 129,202 $ 84,213 $ 131,3212,766,710 308,130 70,219 38,701 240,987 450,094 293,368 457,476
- - - - - - - -- - - - - - - -
6,778 735 168 93 573 1,064 700 1,095- 62,404 - - - - - -- - - - - - - -- - - - - - - -- - - - - - - -- - - - - - - -
$ 8,669,230 $ 459,719 $ 90,544 $ 49,903 $ 310,737 $ 580,360 $ 378,281 $ 589,892
$ 111 $ - $ - $ - $ 18,674 $ - $ - $ 408- - - - - - - -- - - - - - - -- - - - - - - -
- - - - - - - -- - - - - - - -
111 - - - 18,674 - - 408
- - - - - - - -8,669,119 459,719 - - 292,063 580,360 378,281 -
- - 90,544 49,903 - - - 589,484- - - - - - - -- - - - - - - -
8,669,119 459,719 90,544 49,903 292,063 580,360 378,281 589,484
$ 8,669,230 $ 459,719 $ 90,544 $ 49,903 $ 310,737 $ 580,360 $ 378,281 $ 589,892
143
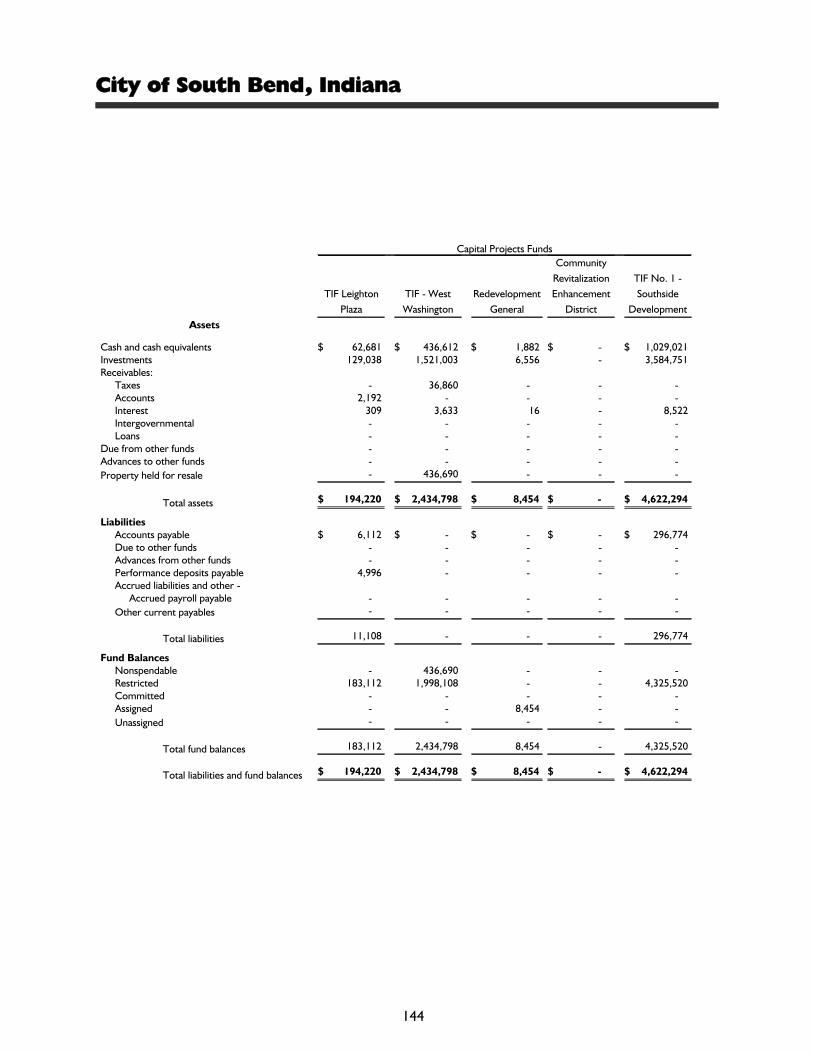
City of South Bend, Indiana
Capital Projects Funds
TIF LeightonPlaza
TIF - WestWashington
RedevelopmentGeneral
CommunityRevitalizationEnhancement
District
TIF No. 1 -Southside
DevelopmentAssets
Cash and cash equivalents $ 62,681 $ 436,612 $ 1,882 $ - $ 1,029,021Investments 129,038 1,521,003 6,556 - 3,584,751Receivables:
Taxes - 36,860 - - -Accounts 2,192 - - - -Interest 309 3,633 16 - 8,522Intergovernmental - - - - -Loans - - - - -
Due from other funds - - - - -Advances to other funds - - - - -Property held for resale - 436,690 - - -
Total assets $ 194,220 $ 2,434,798 $ 8,454 $ - $ 4,622,294
LiabilitiesAccounts payable $ 6,112 $ - $ - $ - $ 296,774Due to other funds - - - - -Advances from other funds - - - - -Performance deposits payable 4,996 - - - -Accrued liabilities and other -
Accrued payroll payable - - - - -Other current payables - - - - -
Total liabilities 11,108 - - - 296,774
Fund BalancesNonspendable - 436,690 - - -Restricted 183,112 1,998,108 - - 4,325,520Committed - - - - -Assigned - - 8,454 - -Unassigned - - - - -
Total fund balances 183,112 2,434,798 8,454 - 4,325,520
Total liabilities and fund balances $ 194,220 $ 2,434,798 $ 8,454 $ - $ 4,622,294
144

Other Supplemental InformationCombining Balance Sheet (Continued)
Nonmajor Governmental FundsDecember 31, 2016
Capital Projects Funds
TIF No. 3 -Southside
DevelopmentFootball Hall ofFame Capital Major Moves
TIF River EastDevelopment
TIF DouglasRoad
TIF - River EastResidential
CertifiedTechnology
Park
Palais RoyaleHistoric
Preservation
$ 1,081,649 $ 110,305 $ 526,344 $ 1,753,442 $ 34,895 $ 533,526 $ 478,772 $ 20,6863,768,085 384,265 1,833,596 6,108,380 121,563 1,858,619 1,667,875 72,061
- - - 108,630 - - - -- - - - - - - -
9,028 921 4,392 14,573 284 4,207 3,995 173- - - - - - - -- - - - - - - -- - - - - - - -- - 4,068,117 - - - - -- - - - - - - -
$ 4,858,762 $ 495,491 $ 6,432,449 $ 7,985,025 $ 156,742 $ 2,396,352 $ 2,150,642 $ 92,920
$ - $ - $ 543 $ 86,837 $ - $ - $ - $ -- 761 - - - - - -- 494,730 - - 323,005 3,713,921 - -- - - - - - - -
- - - - - - - -- - - - - - - -
- 495,491 543 86,837 323,005 3,713,921 - -
- - 4,068,117 - - - - -4,858,762 - 2,363,789 7,898,188 - - 2,150,642 -
- - - - - - - 92,920- - - - - - - -- - - - (166,263) (1,317,569) - -
4,858,762 - 6,431,906 7,898,188 (166,263) (1,317,569) 2,150,642 92,920
$ 4,858,762 $ 495,491 $ 6,432,449 $ 7,985,025 $ 156,742 $ 2,396,352 $ 2,150,642 $ 92,920
145

City of South Bend, Indiana
Capital Projects Funds
Airport UrbanEnterprise
ZoneEquipment
Leasing
CenturyCenter EnergyConservation
Bond
Smart StreetsBond CapitalProjects Fund
Parks BondCapital
Projects FundAssets
Cash and cash equivalents $ 85,293 $ 2,109,805 $ - $ 5,929,453 $ 4,337,199Investments 297,130 - - - -Receivables:
Taxes - - - - -Accounts - - - - -Interest 712 - - 604 -Intergovernmental - - - - -Loans - - - - -
Due from other funds - - - - -Advances to other funds - - - - -Property held for resale - - - - -
Total assets $ 383,135 $ 2,109,805 $ - $ 5,930,057 $ 4,337,199
LiabilitiesAccounts payable $ - $ 168,611 $ - $ 1,686,422 $ 274,171Due to other funds - - - - -Advances from other funds - - - - -Performance deposits payable - - - - -Accrued liabilities and other -
Accrued payroll payable - - - - -Other current payables - - - - -
Total liabilities - 168,611 - 1,686,422 274,171
Fund BalancesNonspendable - - - - -Restricted - 1,941,194 - 4,243,635 4,063,028Committed 383,135 - - - -Assigned - - - - -Unassigned - - - - -
Total fund balances 383,135 1,941,194 - 4,243,635 4,063,028
Total liabilities and fund balances $ 383,135 $ 2,109,805 $ - $ 5,930,057 $ 4,337,199
146

Other Supplemental InformationCombining Balance Sheet (Continued)
Nonmajor Governmental FundsDecember 31, 2016
Capital ProjectsFunds
Total
Total NonmajorGovernmental
Funds
$ 19,065,194 $ 36,120,46823,211,897 39,412,161
145,490 145,4902,192 173,625
55,797 94,23862,404 868,075
- 5,135,496- 30,048
4,068,117 4,468,117436,690 3,689,943
$ 47,047,781 $ 90,137,661
$ 2,538,552 $ 3,763,296761 58,007
4,531,656 5,883,2544,996 7,496
- 119,847- 3,659
7,075,965 9,835,559
4,504,807 12,158,94835,736,401 65,350,1351,205,986 2,698,694
8,454 2,396,118(1,483,832) (2,301,793)
39,971,816 80,302,102
$ 47,047,781 $ 90,137,661
147

City of South Bend, Indiana
Special Revenue Funds
Motor VehicleHighway
RecreationNonreverting
StudebakerOliver
RevitalizationGrants
EconomicDevelopmentState Grants DCI Operating
RevenueProperty taxes $ - $ - $ - $ - $ -Income taxes - - - - -Professional sports development taxes - - - - -Intergovernmental 5,428,206 - 172,817 167,546 497,592Charges for services 255,318 968,579 - - 279,536Fines and forfeitures - - - - -Investment income 55,308 8,119 10,096 14,105 12,307Rental income - - - - -Other revenue 20,553 2,045 - 3,378 2,769
Total revenue 5,759,385 978,743 182,913 185,029 792,204
ExpendituresCurrent:
General government - - - - -Public safety - - - - -Highways and streets 8,321,148 - - - -Community and economic development - - 549,090 170,744 2,389,051Culture and recreation - 957,938 - - -
Capital outlay - - - - -Debt service:
Principal 484,535 - - 61,786 -Interest on long-term debt 24,017 - - 10,225 -
Total expenditures 8,829,700 957,938 549,090 242,755 2,389,051
Excess of Revenue Over (Under)Expenditures (3,070,315) 20,805 (366,177) (57,726) (1,596,847)
Other Financing Sources (Uses) Issuance of debt - - - - -Proceeds from sale of capital assets 19,090 - - - -Transfers in 3,703,000 - - - 1,808,139Transfers out - - - - -
Total other financing sources(uses) 3,722,090 - - - 1,808,139
Net Change in Fund Balances 651,775 20,805 (366,177) (57,726) 211,292
Fund Balances - Beginning of year 5,746,681 810,419 1,584,046 710,822 1,122,341
Fund Balances - End of year $ 6,398,456 $ 831,224 $ 1,217,869 $ 653,096 $ 1,333,633
148

Other Supplemental InformationCombining Statement of Revenue, Expenditures, and Changes in
Fund BalancesNonmajor Governmental FundsYear Ended December 31, 2016
Special Revenue Funds
CommunityInvestment
GrantsPolice State
SeizureJuvenile Positive
Assistance Unsafe Building
LawEnforcementContinuingEducation
LandlordRegistration
Loss RecoveryFund
$ - $ - $ - $ - $ - $ - $ -- - - - - - -- - - - - - -
3,117,168 - - - - - -- - - 94,978 154,776 2,830 -- - 213 300,100 91,092 - -
1,424 1,992 113 - 8,007 - 8,9837,387 - - - - - -
310 27,024 - 1 18,924 - -
3,126,289 29,016 326 395,079 272,799 2,830 8,983
- - - - - - 23,827- 16,110 - 817,698 382,372 - 6,467- - - - - - -
3,601,871 - - - - - -- - - - - - -- - - - - - -
- - - - - - -- - - - - - -
3,601,871 16,110 - 817,698 382,372 - 30,294
(475,582) 12,906 326 (422,619) (109,573) 2,830 (21,311)
- - - - - - -- - - - - - -- - - 755,180 - - -
(500) - - - - - -
(500) - - 755,180 - - -
(476,082) 12,906 326 332,561 (109,573) 2,830 (21,311)
3,625,045 214,835 12,238 - 913,696 - 990,110
$ 3,148,963 $ 227,741 $ 12,564 $ 332,561 $ 804,123 $ 2,830 $ 968,799
149

City of South Bend, Indiana
Special Revenue Funds
EmergencyTelephone
SystemLocal Road and
StreetExcess Welfare
Distribution
LOIT 2016Special
DistributionHuman Rights
FederalRevenue
Property taxes $ - $ - $ - $ - $ -Income taxes - - - 4,217,549 -Professional sports development taxes - - - - -Intergovernmental - 1,228,257 - - 164,550Charges for services - - - - -Fines and forfeitures - - - - -Investment income - 27,450 - - 4,091Rental income - - - - -Other revenue - 164,473 - 130,394 91,933
Total revenue - 1,420,180 - 4,347,943 260,574
ExpendituresCurrent:
General government - - - - 194,837Public safety - - - - -Highways and streets - 1,638,114 - 345,599 -Community and economic development - - - - -Culture and recreation - - - - -
Capital outlay - - - - -Debt service:
Principal - - - - -Interest on long-term debt - - - - -
Total expenditures - 1,638,114 - 345,599 194,837
Excess of Revenue Over (Under)Expenditures - (217,934) - 4,002,344 65,737
Other Financing Sources (Uses) Issuance of debt - - - - -Proceeds from sale of capital assets - - - - -Transfers in - - - - -Transfers out - - - - -
Total other financing sources(uses) - - - - -
Net Change in Fund Balances - (217,934) - 4,002,344 65,737
Fund Balances - Beginning of year 33,671 2,943,206 8 - 494,044
Fund Balances - End of year $ 33,671 $ 2,725,272 $ 8 $ 4,002,344 $ 559,781
150

Other Supplemental InformationCombining Statement of Revenue, Expenditures, and Changes in
Fund Balances (Continued)Nonmajor Governmental FundsYear Ended December 31, 2016
Special Revenue Funds
East RaceWaterway
Morris andPalais Marketing
Police BlockGrants
EconomicDevelopmentCommission Hazmat
Indiana RiverRescue
COPS BlockGrant II
$ - $ - $ - $ - $ - $ - $ -- - - - - - -- - - - - - -- - - - - - -- - - - 3,410 110,700 -- - - - - - -13 326 36 252 264 1,232 -- - - - - - -- 20,424 - - - - -
13 20,750 36 252 3,674 111,932 -
- - - - - - -- - - - 8,961 64,777 40,651- - - - - - -- - - - - - -- 7,010 - - - - -- - - - - - -
- - - - - - -- - - - - - -
- 7,010 - - 8,961 64,777 40,651
13 13,740 36 252 (5,287) 47,155 (40,651)
- - - - - - -- - - - - - -- - - - - - -- - - - - - -
- - - - - - -
13 13,740 36 252 (5,287) 47,155 (40,651)
1,335 30,554 3,850 27,363 32,064 93,604 114,483
$ 1,348 $ 44,294 $ 3,886 $ 27,615 $ 26,777 $ 140,759 $ 73,832
151

City of South Bend, Indiana
Special Revenue Funds
Regional PoliceAcademy
COPS MOREGrant
Federal DrugEnforcement Gift
UrbanDevelopmentAction Grant
RevenueProperty taxes $ - $ - $ - $ - $ -Income taxes - - - - -Professional sports development taxes - - - - -Intergovernmental - 167,187 - - -Charges for services 19,700 - - - -Fines and forfeitures - - - - -Investment income 745 1,182 1,453 710 4,759Rental income - - - - -Other revenue - 133,481 10,786 173,232 -
Total revenue 20,445 301,850 12,239 173,942 4,759
ExpendituresCurrent:
General government - - - 169,900 -Public safety 16,448 206,227 53,414 - -Highways and streets - - - - -Community and economic development - - - - -Culture and recreation - - - - -
Capital outlay - - - - -Debt service:
Principal - - - - -Interest on long-term debt - - - - -
Total expenditures 16,448 206,227 53,414 169,900 -
Excess of Revenue Over (Under)Expenditures 3,997 95,623 (41,175) 4,042 4,759
Other Financing Sources (Uses) Issuance of debt - - - - -Proceeds from sale of capital assets - - 14,536 - -Transfers in - - - - -Transfers out - - - - -
Total other financing sources(uses) - - 14,536 - -
Net Change in Fund Balances 3,997 95,623 (26,639) 4,042 4,759
Fund Balances - Beginning of year 71,923 128,747 252,846 64,878 (219,910)
Fund Balances - End of year $ 75,920 $ 224,370 $ 226,207 $ 68,920 $ (215,151)
152

Other Supplemental InformationCombining Statement of Revenue, Expenditures, and Changes in
Fund Balances (Continued)Nonmajor Governmental FundsYear Ended December 31, 2016
Special Revenue Funds Debt Service Funds
Leaf Collectionand Removal Police K-9 Unit Excess Levy
IndustrialRevolving Fund Total
College FootballHall of FameDebt Service
RedevelopmentBond - Airport
Taxable
$ - $ - $ - $ - $ - $ 1,361,512 $ -- - - - 4,217,549 - -- - - - - - -- - - - 10,943,323 70,548 -
440,649 - - 27,360 2,357,836 - -- - - - 391,405 - -
7,843 33 8 160,912 331,763 65 9,507- - - - 7,387 - -- - - 4,614 804,341 - -
448,492 33 8 192,886 19,053,604 1,432,125 9,507
74,976 - - - 463,540 - -- 1,044 - - 1,614,169 - -- - - - 10,304,861 - -- - - 417,865 7,128,621 - -- - - - 964,948 - -- - - - - - -
69,615 - - - 615,936 1,180,000 -2,603 - - - 36,845 88,029 -
147,194 1,044 - 417,865 21,128,920 1,268,029 -
301,298 (1,011) 8 (224,979) (2,075,316) 164,096 9,507
- - - - - - -- - - - 33,626 - -- - - - 6,266,319 112,116 -
(350,000) - (3,673) - (354,173) - (8,311)
(350,000) - (3,673) - 5,945,772 112,116 (8,311)
(48,702) (1,011) (3,665) (224,979) 3,870,456 276,212 1,196
959,116 3,869 3,665 7,021,162 27,790,711 16,582 1,037,623
$ 910,414 $ 2,858 $ - $ 6,796,183 $ 31,661,167 $ 292,794 $ 1,038,819
153

City of South Bend, Indiana
Debt Service Funds
Coveleski BondDebt Service
Reserve
RedevelopmentBond - Palais
Royale
South BendBuilding
CorporationDebt Service
TIF ErskineVillage Debt
ServiceSmart StreetsDebt Service
RevenueProperty taxes $ - $ - $ - $ - $ -Income taxes - - - - -Professional sports development taxes - - - - -Intergovernmental - - - - -Charges for services - - - - -Fines and forfeitures - - - - -Investment income 4,666 15,882 279 2 2,352Rental income - - - - -Other revenue - - - - -
Total revenue 4,666 15,882 279 2 2,352
ExpendituresCurrent:
General government - - - - -Public safety - - - - -Highways and streets - - - - -Community and economic development - - - - -Culture and recreation - - - - -
Capital outlay - - - - -Debt service:
Principal - - 1,691,120 235,000 -Interest on long-term debt - - 468,372 254,503 790,759
Total expenditures - - 2,159,492 489,503 790,759
Excess of Revenue Over (Under)Expenditures 4,666 15,882 (2,159,213) (489,501) (788,407)
Other Financing Sources (Uses) Issuance of debt - - - - -Proceeds from sale of capital assets - - - - -Transfers in - - 2,165,291 489,503 1,190Transfers out - (13,886) - - -
Total other financing sources(uses) - (13,886) 2,165,291 489,503 1,190
Net Change in Fund Balances 4,666 1,996 6,078 2 (787,217)
Fund Balances - Beginning of year 507,853 1,733,702 561,710 561,115 2,895,836
Fund Balances - End of year $ 512,519 $ 1,735,698 $ 567,788 $ 561,117 $ 2,108,619
154

Other Supplemental InformationCombining Statement of Revenue, Expenditures, and Changes in
Fund Balances (Continued)Nonmajor Governmental FundsYear Ended December 31, 2016
Debt Service Funds Capital Projects Funds
Parks BondDebt Service
Fund
Century CenterEnergy
ConservationDebt Service
RedevelopmentAuthority Debt
Service Total
ProfessionalSports
DevelopmentCoveleski
Stadium CapitalZoo
Endowment
$ - $ - $ - $ 1,361,512 $ - $ - $ -- - - - - - -- - - - 673,787 - -- - - 70,548 - - -- - - - - - -- - - - - - -
574 163,588 1,625 198,540 2,592 670 454- - - - - - -- - - - 44,980 40,789 -
574 163,588 1,625 1,630,600 721,359 41,459 454
- - - - - - -- - - - - - -- - - - - - -- 111 - 111 - - -- - - - - - -- - - - - 11,474 -
200,000 22,585 3,120,000 6,448,705 730,000 - -180,105 213,547 1,275,768 3,271,083 108,050 - -
380,105 236,243 4,395,768 9,719,899 838,050 11,474 -
(379,531) (72,655) (4,394,143) (8,089,299) (116,691) 29,985 454
- - - - - - -- - - - - - -
385,787 79,676 4,409,500 7,643,063 - - -- - - (22,197) - - -
385,787 79,676 4,409,500 7,620,866 - - -
6,256 7,021 15,357 (468,433) (116,691) 29,985 454
555,687 50,032 1,217,412 9,137,552 576,410 60,559 49,449
$ 561,943 $ 57,053 $ 1,232,769 $ 8,669,119 $ 459,719 $ 90,544 $ 49,903
155

City of South Bend, Indiana
Capital Projects Funds
ParkNonreverting
Capital
CumulativeCapital
Development
CumulativeCapital
Improvement
MorrisPerforming ArtsCenter Capital
TIF LeightonPlaza
RevenueProperty taxes $ - $ 440,887 $ - $ - $ -Income taxes - - - - -Professional sports development taxes - - - - -Intergovernmental - 37,227 407,727 - -Charges for services 5,167 - - 101,781 21,336Fines and forfeitures - - - - -Investment income 3,347 3,950 2,554 4,880 1,517Rental income - - 25,000 - 105,312Other revenue - - - - 6,503
Total revenue 8,514 482,064 435,281 106,661 134,668
ExpendituresCurrent:
General government - - - - -Public safety - - - - -Highways and streets - - - - -Community and economic development - - - - -Culture and recreation - - - - -
Capital outlay 186,202 - - 23,992 158,134Debt service:
Principal - 512,847 - - -Interest on long-term debt - 13,890 - - -
Total expenditures 186,202 526,737 - 23,992 158,134
Excess of Revenue Over (Under)Expenditures (177,688) (44,673) 435,281 82,669 (23,466)
Other Financing Sources (Uses) Issuance of debt - - - - -Proceeds from sale of capital assets - - - - -Transfers in - 53,040 - - -Transfers out - - (368,250) - -
Total other financing sources(uses) - 53,040 (368,250) - -
Net Change in Fund Balances (177,688) 8,367 67,031 82,669 (23,466)
Fund Balances - Beginning of year 469,751 571,993 311,250 506,815 206,578
Fund Balances - End of year $ 292,063 $ 580,360 $ 378,281 $ 589,484 $ 183,112
156

Other Supplemental InformationCombining Statement of Revenue, Expenditures, and Changes in
Fund Balances (Continued)Nonmajor Governmental FundsYear Ended December 31, 2016
Capital Projects Funds
TIF - WestWashington
RedevelopmentGeneral
CommunityRevitalizationEnhancement
District
TIF No. 1 -Southside
Development
TIF No. 3 -Southside
DevelopmentFootball Hall ofFame Capital Major Moves
$ 406,002 $ - $ - $ 2,227,804 $ - $ - $ -- - - - - - -- - - - - - -- - - - - - -- - - - - - -- - - - - - -
14,904 80 590 50,178 45,511 4,623 21,618- - - - - - -- - - - - - 121,009
420,906 80 590 2,277,982 45,511 4,623 142,627
- - - - - - -- - - - - - -- - - - - - -- - - - - - -- - - - - 50,267 -
10,717 329 - 4,068,202 - - 809,666
- - - - - - -- - - - - - -
10,717 329 - 4,068,202 - 50,267 809,666
410,189 (249) 590 (1,790,220) 45,511 (45,644) (667,039)
- - - - - - -- - - - - 48,709 -- - - - - - -- - (3,039) - (489,505) (3,065) -
- - (3,039) - (489,505) 45,644 -
410,189 (249) (2,449) (1,790,220) (443,994) - (667,039)
2,024,609 8,703 2,449 6,115,740 5,302,756 - 7,098,945
$ 2,434,798 $ 8,454 $ - $ 4,325,520 $ 4,858,762 $ - $ 6,431,906
157

City of South Bend, Indiana
Capital Projects Funds
TIF River EastDevelopment
TIF DouglasRoad
TIF - River EastResidential
CertifiedTechnology
Park
Palais RoyaleHistoric
PreservationRevenue
Property taxes $ 2,271,917 $ 304,526 $ 3,932,947 $ - $ -Income taxes - - - - -Professional sports development taxes - - - - -Intergovernmental - - - - -Charges for services 1,400 - 210,999 - -Fines and forfeitures - - - - -Investment income 69,674 1,096 1,666 20,088 748Rental income - - - - -Other revenue 68,401 - - - 15,754
Total revenue 2,411,392 305,622 4,145,612 20,088 16,502
ExpendituresCurrent:
General government - - - - -Public safety - - - - -Highways and streets - - - - -Community and economic development - - - - -Culture and recreation - - - - -
Capital outlay 2,174,610 - 1,100 142,913 -Debt service:
Principal - - - - -Interest on long-term debt - 28,774 171,906 - -
Total expenditures 2,174,610 28,774 173,006 142,913 -
Excess of Revenue Over (Under)Expenditures 236,782 276,848 3,972,606 (122,825) 16,502
Other Financing Sources (Uses) Issuance of debt - - - - -Proceeds from sale of capital assets - - - - -Transfers in - - - - -Transfers out - - (2,474,000) - -
Total other financing sources(uses) - - (2,474,000) - -
Net Change in Fund Balances 236,782 276,848 1,498,606 (122,825) 16,502
Fund Balances - Beginning of year 7,661,406 (443,111) (2,816,175) 2,273,467 76,418
Fund Balances - End of year $ 7,898,188 $ (166,263) $ (1,317,569) $ 2,150,642 $ 92,920
158

Other Supplemental InformationCombining Statement of Revenue, Expenditures, and Changes in
Fund Balances (Continued)Nonmajor Governmental FundsYear Ended December 31, 2016
Capital Projects Funds
Airport UrbanEnterprise Zone
EquipmentLeasing
Century CenterEnergy
ConservationBond
Smart StreetsBond CapitalProjects Fund
Parks BondCapital Projects
Fund Total
Total NonmajorGovernmental
Funds
$ - $ - $ - $ - $ - $ 9,584,083 $ 10,945,595- - - - - - 4,217,549- - - - - 673,787 673,787- - - - - 444,954 11,458,825- - - - - 340,683 2,698,519- - - - - - 391,405
3,488 3,492 - 15,016 4,485 277,221 807,524- - - - - 130,312 137,699- 3,800 - - - 301,236 1,105,577
3,488 7,292 - 15,016 4,485 11,752,276 32,436,480
- - - - - - 463,540- - - - - - 1,614,169- - - - - - 10,304,861- - - - - - 7,128,732- - - - - 50,267 1,015,215- 3,439,812 343,478 14,793,978 891,688 27,056,295 27,056,295
- - - - - 1,242,847 8,307,488- - - - - 322,620 3,630,548
- 3,439,812 343,478 14,793,978 891,688 28,672,029 59,520,848
3,488 (3,432,520) (343,478) (14,778,962) (887,203) (16,919,753) (27,084,368)
- 4,950,881 - - - 4,950,881 4,950,881- - - - - 48,709 82,335- - - - - 53,040 13,962,422- - - (1,190) - (3,339,049) (3,715,419)
- 4,950,881 - (1,190) - 1,713,581 15,280,219
3,488 1,518,361 (343,478) (14,780,152) (887,203) (15,206,172) (11,804,149)
379,647 422,833 343,478 19,023,787 4,950,231 55,177,988 92,106,251
$ 383,135 $ 1,941,194 $ - $ 4,243,635 $ 4,063,028 $ 39,971,816 $ 80,302,102
159

160
City of South Bend, Indiana
Schedules of Revenue, Expenditures, and Changes in Fund Balances Budget and Actual - Major Governmental Funds
Capital Projects Funds - River West TIF Year Ended December 31, 2016
VarianceActual With Final
Budgetary BudgetBasis Positive
Original Final Amounts (Negative)
Revenues:Property taxes 16,723,300$ 18,159,311$ 18,159,311$ -$ Other 2,151,014 2,022,911 1,790,675 (232,236)
Total revenues 18,874,314 20,182,222 19,949,986 (232,236)
Expenditures:Current:
Economic Development:Other services and charges 6,112,101 13,180,948 9,703,874 3,477,074 Capital outlay 13,587,899 31,321,129 18,105,471 13,215,658
Total expenditures 19,700,000 44,502,077 27,809,345 16,692,732
Other financing sources - Transfers in 11,000 43,000 22,199 (20,801)
Net change in fund balances (814,686) (24,276,855) (7,837,160) 16,439,695
Fund balances - Beginning 32,771,001 32,771,001 32,771,001 -
Fund balances - Ending 31,956,315$ 8,494,146$ 24,933,841$ 16,439,695$
Budget/GAAP ReconciliationNet change in fund balance, budget basis (7,837,160)$ To adjust revenues for accruals (818,017) To adjust expenditures for accruals 208,144 To adjust expenditures for encumbrances 7,618,884
Net change in fund balance, GAAP basis (828,149)$
Budgeted Amounts

161
City of South Bend, Indiana
Schedules of Revenues, Expenditures, and Changes in Fund Balances Budget and Actual - Nonmajor Governmental Funds
Special Revenue Funds - Motor Vehicle Highway Year Ended December 31, 2016
VarianceActual With Final
Budgetary BudgetBasis Positive
Original Final Amounts (Negative)
Revenues:Intergovernmental 5,100,000$ 5,690,562$ 5,647,108$ (43,454)$ Charges for services 281,433 281,433 216,632 (64,801) Other 97,450 166,007 96,839 (69,168)
Total revenues 5,478,883 6,138,002 5,960,579 (177,423)
Expenditures:Current:
Highways and streets:Personnel services 4,411,058 4,411,058 3,859,792 551,266 Supplies 2,258,181 2,628,660 2,043,415 585,245 Other services and charges 3,624,651 3,848,233 3,549,933 298,300 Capital outlay 50,000 89,458 39,458 50,000
Total expenditures 10,343,890 10,977,409 9,492,598 1,484,811
Other financing sources - Transfers in 4,550,000 3,703,000 3,703,000 -
Net change in fund balances (315,007) (1,136,407) 170,981 1,307,388
Fund balances - Beginning 5,225,686 5,225,686 5,225,686 -
Fund balances - Ending 4,910,679$ 4,089,279$ 5,396,667$ 1,307,388$
Budget/GAAP ReconciliationNet change in fund balance, budget basis 170,981$ To adjust revenues for accruals (182,105) To adjust expenditures for accruals (158,499) To adjust expenditures for encumbrances 821,398
Net change in fund balance, GAAP basis 651,775$
Budgeted Amounts

162
City of South Bend, Indiana
Schedules of Revenues, Expenditures, and Changes in Fund Balances Budget and Actual - Nonmajor Governmental Funds
Special Revenue Funds - Recreation Nonreverting Year Ended December 31, 2016
VarianceActual With Final
Budgetary BudgetBasis Positive
Original Final Amounts (Negative)
Revenues:Charges for services 1,432,565$ 1,432,565$ 935,249$ (497,316)$ Other 16,000 16,000 8,153 (7,847)
Total revenues 1,448,565 1,448,565 943,402 (505,163)
Expenditures:Current:
Culture and recreation:Personnel services 655,619 565,619 383,854 181,765 Supplies 305,332 284,568 169,345 115,223 Other services and charges 487,253 567,267 373,577 193,690 Capital outlay - 42,300 41,299 1,001
Total expenditures 1,448,204 1,459,754 968,075 491,679
Other financing sources (uses) - Transfers out - - - -
Net change in fund balances 361 (11,189) (24,673) (13,484)
Fund balances - Beginning 823,964 823,964 823,964 -
Fund balances - Ending 824,325$ 812,775$ 799,291$ (13,484)$
Budget/GAAP ReconciliationNet change in fund balance, budget basis (24,673)$ To adjust revenues for accruals 35,341 To adjust expenditures for accruals (2,943) To adjust expenditures for encumbrances 13,080
Net change in fund balance, GAAP basis 20,805$
Budgeted Amounts

163
City of South Bend, Indiana
Schedules of Revenues, Expenditures, and Changes in Fund Balances Budget and Actual - Nonmajor Governmental Funds
Special Revenue Funds - Studebaker Oliver Revitalization Grants Year Ended December 31, 2016
VarianceActual With Final
Budgetary BudgetBasis Positive
Original Final Amounts (Negative)
Revenues - Other 104,000$ 593,500$ 282,902$ (310,598)$
Expenditures:Current:
Economic DevelopmentOther Services and Charges 1,200,000 1,683,250 974,411 708,839 Capital Outlay - - - -
Total expenditures 1,200,000 1,683,250 974,411 708,839
Net change in fund balances (1,096,000) (1,089,750) (691,509) 398,241
Fund balances - Beginning 1,108,642 1,108,642 1,108,642 -
Fund balances - Ending 12,642$ 18,892$ 417,133$ 398,241$
Budget/GAAP ReconciliationNet change in fund balance, budget basis (691,509)$ To adjust revenues for accruals (99,989) To adjust expenditures for accruals (14,072) To adjust expenditures for encumbrances 439,393
Net change in fund balance, GAAP basis (366,177)$
Budgeted Amounts

164
City of South Bend, Indiana
Schedules of Revenues, Expenditures, and Changes in Fund Balances Budget and Actual - Nonmajor Governmental Funds
Special Revenue Funds - Economic Development State Grants Year Ended December 31, 2016
VarianceActual With Final
Budgetary BudgetBasis Positive
Original Final Amounts (Negative)
Revenues - Other 73,511$ 2,719,053$ 1,895,885$ (823,168)$
Expenditures:Current:
Economic DevelopmentOther services and charges 72,011 1,322,519 942,991 379,528 Capital Outlay - 1,200,000 1,200,000 -
Total expenditures 72,011 2,522,519 2,142,991 379,528
Net change in fund balances 1,500 196,534 (247,106) (443,640)
Fund balances - Beginning 160,361 160,361 160,361 -
Fund balances - Ending 161,861$ 356,895$ (86,745)$ (443,640)$
Budget/GAAP ReconciliationNet change in fund balance, budget basis (247,106)$ To adjust revenues for accruals (1,710,857) To adjust expenditures for accruals 1,462,492 To adjust expenditures for encumbrances 437,745
Net change in fund balance, GAAP basis (57,726)$
Budgeted Amounts

165
City of South Bend, Indiana
Schedules of Revenues, Expenditures, and Changes in Fund Balances Budget and Actual - Nonmajor Governmental Funds
Special Revenue Funds - DCI Operating Year Ended December 31, 2016
VarianceActual With Final
Budgetary BudgetBasis Positive
Original Final Amounts (Negative)
Revenues:Intergovernmental 419,287$ 499,287$ 497,592$ (1,695)$ Other 261,000 327,500 318,147 (9,353)
Total revenues 680,287 826,787 815,739 (11,048)
Expenditures:Current:
Economic Development:Personnel services 2,161,561 2,113,461 1,902,605 210,856 Supplies 24,627 25,318 15,245 10,073 Other services and charges 424,512 511,534 485,059 26,475 Capital Outlay 37,000 37,000 35,157 1,843 Other uses - - - -
Total expenditures 2,647,700 2,687,313 2,438,066 249,247
Other financing sources - Transfers in 1,967,638 1,808,138 1,808,138 -
Net change in fund balances 225 (52,388) 185,811 238,199
Fund balances - Beginning 1,123,753 1,123,753 1,123,753 -
Fund balances - Ending 1,123,978$ 1,071,365$ 1,309,564$ 238,199$
Budget/GAAP ReconciliationNet change in fund balance, budget basis 185,811$ To adjust revenues for accruals (23,535) To adjust expenditures for accruals (5,426) To adjust expenditures for encumbrances 54,442
Net change in fund balance, GAAP basis 211,292$
Budgeted Amounts

166
City of South Bend, Indiana
Schedules of Revenues, Expenditures, and Changes in Fund Balances Budget and Actual - Nonmajor Governmental Funds
Special Revenue Funds - Community Investment Grants Year Ended December 31, 2016
VarianceActual With Final
Budgetary BudgetBasis Positive
Original Final Amounts (Negative)
Revenues:Intergovernmental 3,028,252$ 6,528,252$ 3,117,168$ (3,411,084)$ Other 771,748 919,148 25,887 (893,261)
Total revenues 3,800,000 7,447,400 3,143,055 (4,304,345)
Expenditures:Current:
Economic development -Other services and charges 3,800,000 7,356,963 5,656,026 1,700,937
Total expenditures 3,800,000 7,356,963 5,656,026 1,700,937
Other financing sources (uses) - Transfers out - (500) (500) -
Net change in fund balances - 89,937 (2,513,471) (2,603,408)
Fund balances - Beginning 553,875 553,875 553,875 -
Fund balances - Ending 553,875$ 643,812$ (1,959,596)$ (2,603,408)$
Budget/GAAP ReconciliationNet change in fund balance, budget basis (2,513,471)$ To adjust revenues for accruals (16,766) To adjust expenditures for accruals (147,684) To adjust expenditures for encumbrances 2,201,839
Net change in fund balance, GAAP basis (476,082)$
Budgeted Amounts

167
City of South Bend, Indiana
Schedules of Revenues, Expenditures, and Changes in Fund Balances Budget and Actual - Nonmajor Governmental Funds
Special Revenue Funds - Police State Seizure Year Ended December 31, 2016
VarianceActual With Final
Budgetary BudgetBasis Positive
Original Final Amounts (Negative)
Revenues - Other 36,000$ 36,636$ 33,978$ (2,658)$
Expenditures:Current:
Public Safety:Other services and charges 36,000 36,000 16,110 19,890
Net change in fund balances - 636 17,868 17,232
Fund balances - Beginning 199,998 199,998 199,998 -
Fund balances - Ending 199,998$ 200,634$ 217,866$ 17,232$
Budget/GAAP ReconciliationNet change in fund balance, budget basis 17,868$ To adjust revenues for accruals (4,962)
Net change in fund balance, GAAP basis 12,906$
Budgeted Amounts

168
City of South Bend, Indiana
Schedules of Revenues, Expenditures, and Changes in Fund Balances Budget and Actual - Nonmajor Governmental Funds Special Revenue Funds - Juvenile Positive Assistance
Year Ended December 31, 2016
VarianceActual With Final
Budgetary BudgetBasis Positive
Original Final Amounts (Negative)
Revenues:Fines and fees 900$ 900$ 213$ (687)$ Other 100 100 113 13
Total revenues 1,000 1,000 326 (674)
Expenditures:Current - Public safety - Other services and charges 1,000 1,000 - 1,000
Net change in fund balances - - 326 326
Fund balances - Beginning 12,254 12,254 12,254 -
Fund balances - Ending 12,254$ 12,254$ 12,580$ 326$
Budget/GAAP ReconciliationNet change in fund balance, budget basis 326$ To adjust revenues for accruals -
Net change in fund balance, GAAP basis 326$
Budgeted Amounts

169
City of South Bend, Indiana
Schedules of Revenues, Expenditures, and Changes in Fund Balances Budget and Actual - Nonmajor Governmental Funds
Special Revenue Funds - Unsafe Building Year Ended December 31, 2016
VarianceActual With Final
Budgetary BudgetBasis Positive
Original Final Amounts (Negative)Revenues:
Charges for services -$ 247,100$ 237,962$ (9,138)$ Fines and forfeits - 228,800 146,830 (81,970)
Total revenues - 475,900 384,792 (91,108)
Expenditures:Current:
Culture and recreation:Personnel services - 260,769 258,263 2,506 Supplies - 41,149 16,547 24,602 Other services and charges - 649,579 503,917 145,662
Total expenditures - 951,497 778,727 172,770
Other financing sources - Transfers In - 755,240 755,180 (60)
Net change in fund balances - 279,643 361,245 81,602
Fund balances - Beginning - - - -
Fund balances - Ending -$ 279,643$ 361,245$ 81,602$
Budget/GAAP ReconciliationNet change in fund balance, budget basis 361,245$ To adjust revenues for accruals 10,288 To adjust expenditures for accruals (46,961) To adjust expenditures for encumbrances 7,989
Net change in fund balance, GAAP basis 332,561$
Budgeted Amounts

170
City of South Bend, Indiana
Schedules of Revenues, Expenditures, and Changes in Fund Balances Budget and Actual - Nonmajor Governmental Funds
Special Revenue Funds – Law Enforcement Continuing Education Year Ended December 31, 2016
VarianceActual With Final
Budgetary BudgetBasis Positive
Original Final Amounts (Negative)
Revenues:Intergovernmental -$ -$ -$ -$ Charges for services 115,000 115,000 139,265 24,265 Fines and fees 85,000 86,225 93,069 6,844 Other 18,000 35,600 41,599 5,999
Total revenues 218,000 236,825 273,933 37,108
Expenditures:Current:
Public safety:Supplies 275,500 285,508 231,493 54,015 Other services and charges 458,000 458,000 195,314 262,686 Capital outlay - - - -
Total expenditures 733,500 743,508 426,807 316,701
Net change in fund balances (515,500) (506,683) (152,874) 353,809
Fund balances - Beginning 912,111 912,111 912,111 -
Fund balances - Ending 396,611$ 405,428$ 759,237$ 353,809$
Budget/GAAP ReconciliationNet change in fund balance, budget basis (152,874)$ To adjust revenues for accruals (1,135) To adjust expenditures for accruals (10,486) To adjust expenditures for encumbrances 54,922
Net change in fund balance, GAAP basis (109,573)$
Budgeted Amounts

171
City of South Bend, Indiana
Schedules of Revenues, Expenditures, and Changes in Fund Balances Budget and Actual - Nonmajor Governmental Funds
Special Revenue Funds – Landlord Registration Year Ended December 31, 2016
VarianceActual With Final
Budgetary BudgetBasis Positive
Original Final Amounts (Negative)Revenues:
Charges for services -$ -$ -$ -$ Fines and forfeits - 500 1,225 725
Total revenues - 500 1,225 725
Expenditures:Current:
Culture and recreation:Personnel services - - - - Supplies - - - - Other services and charges - - - -
Total expenditures - - - -
Other financing sources - Transfers In - - - -
Net change in fund balances - 500 1,225 725
Fund balances - Beginning - - - -
Fund balances - Ending -$ 500$ 1,225$ 725$
Budget/GAAP ReconciliationNet change in fund balance, budget basis 1,225$ To adjust revenues for accruals 1,605 To adjust expenditures for accruals - To adjust expenditures for encumbrances -
Net change in fund balance, GAAP basis 2,830$
Budgeted Amounts

172
City of South Bend, Indiana
Schedules of Revenues, Expenditures, and Changes in Fund Balances Budget and Actual - Nonmajor Governmental Funds
Special Revenue Funds - Loss Recovery Fund Year Ended December 31, 2016
VarianceActual With Final
Budgetary BudgetBasis Positive
Original Final Amounts (Negative)
Revenues - Other 1,410$ 7,660$ 8,952$ 1,292$
Expenditures:Current:
General government:Supplies - - - - Other services and charges 350,000 422,302 72,302 350,000 Capital outlay - 58,009 58,009 -
Total expenditures 350,000 480,311 130,311 350,000
Net change in fund balances (348,590) (472,651) (121,359) 351,292
Fund balances - Beginning 994,542 994,542 994,542 -
Fund balances - Ending 645,952$ 521,891$ 873,183$ 351,292$
Budget/GAAP ReconciliationNet change in fund balance, budget basis (121,359)$ To adjust revenues for accruals 31 To adjust expenditures for accruals 1,342 To adjust expenditures for encumbrances 98,675
Net change in fund balance, GAAP basis (21,311)$
Budgeted Amounts

173
City of South Bend, Indiana
Schedules of Revenues, Expenditures, and Changes in Fund Balances Budget and Actual - Nonmajor Governmental Funds
Special Revenue Funds - Emergency Telephone System Year Ended December 31, 2016
VarianceActual With Final
Budgetary BudgetBasis Positive
Original Final Amounts (Negative)
Revenues - Intergovernmental -$ -$ -$ -$
Other - - - -
Total revenues - - - -
Net change in fund balances - - - -
Fund balances - Beginning 33,671 33,671 33,671 -
Fund balances - Ending 33,671$ 33,671$ 33,671$ -$
Budget/GAAP ReconciliationNet change in fund balance, budget basis -$ To adjust revenues for accruals -
Net change in fund balance, GAAP basis -$
Budgeted Amounts

174
City of South Bend, Indiana
Schedules of Revenues, Expenditures, and Changes in Fund Balances Budget and Actual - Nonmajor Governmental Funds
Special Revenue Funds - Local Road and Street Year Ended December 31, 2016
VarianceActual With Final
Budgetary BudgetBasis Positive
Original Final Amounts (Negative)
Revenues:Intergovernmental 1,068,000$ 1,313,600$ 1,209,101$ (104,499)$ Other 201,000 616,500 433,047 (183,453)
Total revenues 1,269,000 1,930,100 1,642,148 (287,952)
Expenditures:Current:
Highways and streets: Supplies 450,000 469,668 469,500 168
Other services and charges 193,000 437,369 397,645 39,724 Capital outlay 588,000 1,360,907 1,268,886 92,021
Total expenditures 1,231,000 2,267,944 2,136,031 131,913
Net change in fund balances 38,000 (337,844) (493,883) (156,039)
Fund balances - Beginning 2,730,925 2,730,925 2,730,925 -
Fund balances - Ending 2,768,925$ 2,393,081$ 2,237,042$ (156,039)$
Budget/GAAP ReconciliationNet change in fund balance, budget basis (493,883)$ To adjust revenues for accruals (221,968) To adjust expenditures for accruals (98,627) To adjust expenditures for encumbrances 596,544
Net change in fund balance, GAAP basis (217,934)$
Budgeted Amounts

175
City of South Bend, Indiana
Schedules of Revenues, Expenditures, and Changes in Fund Balances Budget and Actual - Nonmajor Governmental Funds Special Revenue Funds - Excess Welfare Distribution
Year Ended December 31, 2016
VarianceActual With Final
Budgetary BudgetBasis Positive
Original Final Amounts (Negative)
Revenues - Other -$ -$ -$ -$
Expenditures:Current - Public safety - Supplies - - - -
Net change in fund balances - - - -
Fund balances - Beginning 8 8 8 -
Fund balances - Ending 8$ 8$ 8$ -$
Budget/GAAP ReconciliationNet change in fund balance, budget basis -$ To adjust revenues for accruals -
Net change in fund balance, GAAP basis -$
Budgeted Amounts

176
City of South Bend, Indiana
Schedules of Revenues, Expenditures, and Changes in Fund Balances Budget and Actual - Nonmajor Governmental Funds
Special Revenue Funds - LOIT 2016 Special Distribution Year Ended December 31, 2016
VarianceActual With Final
Budgetary BudgetBasis Positive
Original Final Amounts (Negative)Revenues:
Intergovernmental -$ 4,867,549$ 4,217,549$ (650,000)$ Other - 131,000 130,394 (606)
Total revenues - 4,998,549 4,347,943 (650,606)
Expenditures:Current:
Culture and recreation:Other services and charges - 150,000 138,100 11,900 Capital outlay - 850,000 812,233 37,767 Other Uses - - - -
Total expenditures - 1,000,000 950,333 49,667
Other financing sources - Transfers In - - - -
Net change in fund balances - 3,998,549 3,397,610 (600,939)
Fund balances - Beginning - - - -
Fund balances - Ending -$ 3,998,549$ 3,397,610$ (600,939)$
Budget/GAAP ReconciliationNet change in fund balance, budget basis 3,397,610$ To adjust revenues for accruals (1) To adjust expenditures for accruals (22,722) To adjust expenditures for encumbrances 627,457
Net change in fund balance, GAAP basis 4,002,344$
Budgeted Amounts

177
City of South Bend, Indiana
Schedules of Revenues, Expenditures, and Changes in Fund Balances Budget and Actual - Nonmajor Governmental Funds
Special Revenue Funds - Human Rights Federal Year Ended December 31, 2016
VarianceActual With Final
Budgetary BudgetBasis Positive
Original Final Amounts (Negative)
Revenues:Intergovernmental 145,000$ 196,000$ 209,350$ 13,350$ Other 20,040 22,105 31,008 8,903
Total revenues 165,040 218,105 240,358 22,253
Expenditures:Current:
General governmentPersonnel services 122,817 122,817 120,507 2,310 Supplies 2,300 7,500 6,894 606 Other services and charges 96,721 91,521 64,665 26,856
Total expenditures 221,838 221,838 192,066 29,772
Net change in fund balances (56,798) (3,733) 48,292 52,025
Fund balances - Beginning 425,850 425,850 425,850 -
Fund balances - Ending 369,052$ 422,117$ 474,142$ 52,025$
Budget/GAAP ReconciliationNet change in fund balance, budget basis 48,292$ To adjust revenues for accruals 20,215 To adjust expenditures for accruals (9,147) To adjust expenditures for encumbrances 6,377
Net change in fund balance, GAAP basis 65,737$
Budgeted Amounts

178
City of South Bend, Indiana
Schedules of Revenues, Expenditures, and Changes in Fund Balances Budget and Actual - Nonmajor Governmental Funds
Special Revenue Funds - East Race Waterway Year Ended December 31, 2016
VarianceActual With Final
Budgetary BudgetBasis Positive
Original Final Amounts (Negative)
Revenues - Other 30$ 30$ 12$ (18)$
Expenditures:Current - Culture and recreation - Supplies - - - -
Total expenditures - - - -
Net change in fund balances 30 30 12 (18)
Fund balances - Beginning 1,337 1,337 1,337 -
Fund balances - Ending 1,367$ 1,367$ 1,349$ (18)$
Budget/GAAP ReconciliationNet change in fund balance, budget basis 12$ To adjust revenues for accruals 1
Net change in fund balance, GAAP basis 13$
Budgeted Amounts

179
City of South Bend, Indiana
Schedules of Revenues, Expenditures, and Changes in Fund Balances Budget and Actual - Nonmajor Governmental Funds
Special Revenue Funds - Morris and Palais Marketing Year Ended December 31, 2016
VarianceActual With Final
Budgetary BudgetBasis Positive
Original Final Amounts (Negative)
Revenues - Other 18,150$ 20,956$ 20,947$ (9)$
Expenditures:Current - Culture and recreation -
Other services and charges 18,000 18,878 7,887 10,991
Net change in fund balances 150 2,078 13,060 10,982
Fund balances - Beginning 30,391 30,391 30,391 -
Fund balances - Ending 30,541$ 32,469$ 43,451$ 10,982$
Budget/GAAP ReconciliationNet change in fund balance, budget basis 13,060$ To adjust revenue for accruals (198) To adjust expenditures for accruals (2,797) To adjust expenditures for encumbrances 3,675
Net change in fund balance, GAAP basis 13,740$
Budgeted Amounts

180
City of South Bend, Indiana
Schedules of Revenues, Expenditures, and Changes in Fund Balances Budget and Actual - Nonmajor Governmental Funds
Special Revenue Funds - Police Block Grants Year Ended December 31, 2016
VarianceActual With Final
Budgetary BudgetBasis Positive
Original Final Amounts (Negative)
Revenues - Other -$ 20$ 35$ 15$
Net change in fund balances - 20 35 15
Fund balances - Beginning 3,855 3,855 3,855 -
Fund balances - Ending 3,855$ 3,875$ 3,890$ 15$
Budget/GAAP ReconciliationNet change in fund balance, budget basis 35$ To adjust revenues for accruals 1
Net change in fund balance, GAAP basis 36$
Budgeted Amounts

181
City of South Bend, Indiana
Schedules of Revenues, Expenditures, and Changes in Fund Balances Budget and Actual - Nonmajor Governmental Funds
Special Revenue Funds - Economic Development Commission Year Ended December 31, 2016
VarianceActual With Final
Budgetary BudgetBasis Positive
Original Final Amounts (Negative)
Revenues - Other 150$ 150$ 250$ 100$
Fund balances - Beginning 27,398 27,398 27,398 -
Fund balances - Ending 27,548$ 27,548$ 27,648$ 100$
Budget/GAAP ReconciliationNet change in fund balance, budget basis 250$ To adjust revenues for accruals 2
Net change in fund balance, GAAP basis 252$
Budgeted Amounts

182
City of South Bend, Indiana
Schedules of Revenues, Expenditures, and Changes in Fund Balances Budget and Actual - Nonmajor Governmental Funds
Special Revenue Funds - Hazmat Year Ended December 31, 2016
VarianceActual With Final
Budgetary BudgetBasis Positive
Original Final Amounts (Negative)
Revenues:Charges for services 10,000$ 10,000$ 3,410$ (6,590)$ Other - 320 264 (56)
Total revenues 10,000 10,320 3,674 (6,646)
Expenditures:Current:
Public safety - Supplies 10,000 10,000 9,393 607
Net change in fund balances - 320 (5,719) (6,039)
Fund balances - Beginning 32,104 32,104 32,104 -
Fund balances - Ending 32,104$ 32,424$ 26,385$ (6,039)$
Budget/GAAP ReconciliationNet change in fund balance, budget basis (5,719)$ To adjust revenues for accruals - To adjust expenditures for accruals 1 To adjust expenditures for encumbrances 431
Net change in fund balance, GAAP basis (5,287)$
Budgeted Amounts

183
City of South Bend, Indiana
Schedules of Revenues, Expenditures, and Changes in Fund Balances Budget and Actual - Nonmajor Governmental Funds
Special Revenue Funds - Indiana River Rescue Year Ended December 31, 2016
VarianceActual With Final
Budgetary BudgetBasis Positive
Original Final Amounts (Negative)
Revenues:Charges for services 45,000$ 110,700$ 110,700$ -$ Intergovernmental - - - - Other 200 1,278 1,222 (56)
Total revenues 45,200 111,978 111,922 (56)
Expenditures:Current:
Public safety:Personnel services 15,500 25,500 23,000 2,500 Supplies 10,800 10,800 7,231 3,569 Other services and charges 69,000 69,000 36,164 32,836 Capital outlay - - - -
Total expenditures 95,300 105,300 66,395 38,905
Net change in fund balances (50,100) 6,678 45,527 38,849
Fund balances - Beginning 95,569 95,569 95,569 -
Fund balances - Ending 45,469$ 102,247$ 141,096$ 38,849$
Budget/GAAP ReconciliationNet change in fund balance, budget basis 45,527$ To adjust revenues for accruals 10 To adjust expenditures for accruals 569 To adjust expenditures for encumbrances 1,049
Net change in fund balance, GAAP basis 47,155$
Budgeted Amounts

184
City of South Bend, Indiana
Schedules of Revenues, Expenditures, and Changes in Fund Balances Budget and Actual - Nonmajor Governmental Funds
Special Revenue Funds - COPS Block Grant II Year Ended December 31, 2016
VarianceActual With Final
Budgetary BudgetBasis Positive
Original Final Amounts (Negative)
Revenues - Intergovernmental -$ -$ -$ -$
Expenditures:Current:
Public safety:Supplies - - - - Other services and charges - 55,373 55,373 - Capital outlay - - - -
Total expenditures - 55,373 55,373 -
Net change in fund balances - (55,373) (55,373) -
Fund balances - Beginning 121,196 121,196 121,196 -
Fund balances - Ending 121,196$ 65,823$ 65,823$ -$
Budget/GAAP ReconciliationNet change in fund balance, budget basis (55,373)$ To adjust expenditures for accruals 3,917 To adjust expenditures for encumbrances 10,805
Net change in fund balance, GAAP basis (40,651)$
Budgeted Amounts

185
City of South Bend, Indiana
Schedules of Revenues, Expenditures, and Changes in Fund Balances Budget and Actual - Nonmajor Governmental Funds
Special Revenue Funds - Regional Police Academy Year Ended December 31, 2016
VarianceActual With Final
Budgetary BudgetBasis Positive
Original Final Amounts (Negative)
Revenues:Charges for services 20,000$ 20,000$ 21,650$ 1,650$ Other 2,500 2,500 743 (1,757)
Total revenues 22,500 22,500 22,393 (107)
Expenditures:Current:
Public safety:Supplies 1,500 1,500 - 1,500 Other services and charges 21,000 21,000 16,535 4,465
Total expenditures 22,500 22,500 16,535 5,965
Net change in fund balances - - 5,858 5,858
Fund balances - Beginning 70,310 70,310 70,310 -
Fund balances - Ending 70,310$ 70,310$ 76,168$ 5,858$
Budget/GAAP ReconciliationNet change in fund balance, budget basis 5,858$ To adjust revenues for accruals (1,948) To adjust expenditures for accruals 87
Net change in fund balance, GAAP basis 3,997$
Budgeted Amounts

186
City of South Bend, Indiana
Schedules of Revenues, Expenditures, and Changes in Fund Balances Budget and Actual - Nonmajor Governmental Funds
Special Revenue Funds - COPS MORE Grant Year Ended December 31, 2016
VarianceActual With Final
Budgetary BudgetBasis Positive
Original Final Amounts (Negative)
Revenues:
Intergovernmental 53,750$ 61,069$ 174,506$ 113,437$ Other 38,250 40,475 134,719 94,244
Total Revenues 92,000 101,544 309,225 207,681
Expenditures:Current:
Public safety:Supplies 47,000 269,787 216,996 52,791 Other services and charges 45,000 45,000 39,829 5,171 Capital outlay - - - -
Total expenditures 92,000 314,787 256,825 57,962
Other Financing (uses)
Transfers IN - - - -$
Net change in fund balances - (213,243) 52,400 265,643
Fund balances - Beginning 121,715 121,715 121,715 -
Fund balances - Ending 121,715$ (91,528)$ 174,115$ 265,643$
Budget/GAAP ReconciliationNet change in fund balance, budget basis 52,400$ To adjust revenues for accruals (7,375) To adjust expenditures for accruals (12,869) To adjust expenditures for encumbrances 63,467
Net change in fund balance, GAAP basis 95,623$
Budgeted Amounts

187
City of South Bend, Indiana
Schedules of Revenues, Expenditures, and Changes in Fund Balances Budget and Actual - Nonmajor Governmental Funds Special Revenue Funds - Federal Drug Enforcement
Year Ended December 31, 2016
VarianceActual With Final
Budgetary BudgetBasis Positive
Original Final Amounts (Negative)
Revenues:Intergovernmental 160,000$ 160,000$ 10,786$ (149,214)$ Other 2,000 2,000 15,933 13,933
Total revenues 162,000 162,000 26,719 (135,281)
Expenditures:Current:
Public safety:Supplies 55,000 61,965 55,673 6,292 Other services and charges 62,000 62,000 1,290 60,710 Capital outlay 45,000 45,000 30,787 14,213
Total expenditures 162,000 168,965 87,750 81,215
Net change in fund balances - (6,965) (61,031) (54,066)
Fund balances - Beginning 252,752 252,752 252,752 -
Fund balances - Ending 252,752$ 245,787$ 191,721$ (54,066)$
Budget/GAAP ReconciliationNet change in fund balance, budget basis (61,031)$ To adjust revenues for accruals 55 To adjust expenditures for accruals - To adjust expenditures for encumbrances 34,337
Net change in fund balance, GAAP basis (26,639)$
Budgeted Amounts

188
City of South Bend, Indiana
Schedules of Revenues, Expenditures, and Changes in Fund Balances Budget and Actual - Nonmajor Governmental Funds
Special Revenue Funds - Gift Year Ended December 31, 2016
VarianceActual With Final
Budgetary BudgetBasis Positive
Original Final Amounts (Negative)
Revenues - Other 185,800$ 360,800$ 148,900$ (211,900)$
Expenditures:
Supplies 12,500 12,500 - 12,500 Other services and charges 350,000 350,000 97,000 253,000 Capital Outlay - - - -
Total expenditures 362,500 362,500 97,000 265,500
Net change in fund balances (176,700) (1,700) 51,900 53,600
Fund balances - Beginning 64,958 64,958 64,958 -
Fund balances - Ending (111,742)$ 63,258$ 116,858$ 53,600$
Budget/GAAP ReconciliationNet change in fund balance, budget basis 51,900$ To adjust revenues for accruals 25,042 To adjust expenditures for accruals (72,900)
Net change in fund balance, GAAP basis 4,042$
Budgeted Amounts

189
City of South Bend, Indiana
Schedules of Revenues, Expenditures, and Changes in Fund Balances Budget and Actual - Nonmajor Governmental Funds
Special Revenue Funds - Urban Development Action Grant Year Ended December 31, 2016
VarianceActual With Final
Budgetary BudgetBasis Positive
Original Final Amounts (Negative)
Revenues - Other 169,827$ 201,627$ 200,250$ (1,377)$
Expenditures:Current:
Economic DevelopmentOther services and charges 238,173 238,173 238,173 -
Net change in fund balances (68,346) (36,546) (37,923) (1,377)
Fund balances - Beginning 631,221 631,221 631,221 -
Fund balances - Ending 562,875$ 594,675$ 593,298$ (1,377)$
Budget/GAAP ReconciliationNet change in fund balance, budget basis (37,923)$ To adjust revenues for accruals (195,491) To adjust expenditures for accruals 238,173
Net change in fund balance, GAAP basis 4,759$
Budgeted Amounts

190
City of South Bend, Indiana
Schedules of Revenues, Expenditures, and Changes in Fund Balances Budget and Actual - Nonmajor Governmental Funds
Special Revenue Funds - Leaf Collection and Removal Year Ended December 31, 2016
VarianceActual With Final
Budgetary BudgetBasis Positive
Original Final Amounts (Negative)
Revenues:Charges for services 433,290$ 440,650$ 440,649$ (1)$ Other 4,000 7,978 7,817 (161)
Total revenues 437,290 448,628 448,466 (162)
Expenditures:Current:
General government:Personnel services 56,649 56,649 27,792 28,857 Supplies 3,145 3,145 1,754 1,391 Other services and charges 112,564 112,564 112,192 372 Other uses 6,000 6,000 5,456 544
Total expenditures 178,358 178,358 147,194 31,164
Other financing uses -
Transfers out (350,000) (350,000) (350,000) -
Net change in fund balances (91,068) (79,730) (48,728) 31,002
Fund balances - Beginning 923,440 923,440 923,440 -
Fund balances - Ending 832,372$ 843,710$ 874,712$ 31,002$
Budget/GAAP ReconciliationNet change in fund balance, budget basis (48,728)$ To adjust revenues for accruals 26 To adjust expenditures for accruals -
Net change in fund balance, GAAP basis (48,702)$
Budgeted Amounts

191
City of South Bend, Indiana
Schedules of Revenues, Expenditures, and Changes in Fund Balances Budget and Actual - Nonmajor Governmental Funds
Special Revenue Funds - Police K-9 Unit Year Ended December 31, 2016
VarianceActual With Final
Budgetary BudgetBasis Positive
Original Final Amounts (Negative)
Revenues - Other 2,020$ 2,020$ 33$ (1,987)$
Expenditures:Current - Public safety -
Other services and charges 2,020 2,020 1,044 976
Net change in fund balances - - (1,011) (1,011)
Fund balances - Beginning 3,874 3,874 3,874 -
Fund balances - Ending 3,874$ 3,874$ 2,863$ (1,011)$
Budget/GAAP ReconciliationNet change in fund balance, budget basis (1,011)$ To adjust expenditures for accruals -
Net change in fund balance, GAAP basis (1,011)$
Budgeted Amounts

192
City of South Bend, Indiana
Schedules of Revenues, Expenditures, and Changes in Fund Balances Budget and Actual - Nonmajor Governmental Funds
Special Revenue Funds - Excess Levy Year Ended December 31, 2016
VarianceActual With Final
Budgetary BudgetBasis Positive
Original Final Amounts (Negative)
Revenues - Other 20$ 20$ 7$ (13)$
Other financing uses - Transfers out (3,688) (3,688) (3,673) 15
Net change in fund balances (3,668) (3,668) (3,666) 2
Fund balances - Beginning 3,670 3,670 3,670 -
Fund balances - Ending 2$ 2$ 4$ 2$
Budget/GAAP ReconciliationNet change in fund balance, budget basis (3,666)$ To adjust revenues for accruals 1
Net change in fund balance, GAAP basis (3,665)$
Budgeted Amounts

193
City of South Bend, Indiana
Schedules of Revenues, Expenditures, and Changes in Fund Balances Budget and Actual - Nonmajor Governmental Funds
Debt Service Funds - College Football Hall of Fame Debt Service Year Ended December 31, 2016
VarianceActual With Final
Budgetary BudgetBasis Positive
Original Final Amounts (Negative)
Revenues:Taxes:
Property 1,200,000$ 1,361,512$ 1,361,512$ -$ Intergovernmental 183,112 183,112 70,548 (112,564)
Other 100 100 112,066 111,966
Total revenues 1,383,212 1,544,724 1,544,126 (598)
Expenditures:Debt service:
Principal 1,180,000 1,180,000 1,180,000 - Interest and fiscal agent fees 88,015 91,000 91,000 -
Total expenditures 1,268,015 1,271,000 1,271,000 -
Net change in fund balances 115,197 273,724 273,126 (598)
Fund balances - Beginning 11,396 11,396 11,396 -
Fund balances - Ending 126,593$ 285,120$ 284,522$ (598)$
Budget/GAAP ReconciliationNet change in fund balance, budget basis 273,126$ To adjust revenues for accruals 114 To adjust expenditures for accruals 2,972
Net change in fund balance, GAAP basis 276,212$
Budgeted Amounts

194
City of South Bend, Indiana
Schedules of Revenues, Expenditures, and Changes in Fund Balances Budget and Actual - Nonmajor Governmental Funds
Debt Service Funds - Redevelopment Bond - Airport Taxable Year Ended December 31, 2016
VarianceActual With Final
Budgetary BudgetBasis Positive
Original Final Amounts (Negative)
Revenues - Other 5,000$ 14,000$ 9,471$ (4,529)$
Other financing uses - Transfers out (5,000) (14,000) (8,312) 5,688
Net change in fund balances - - 1,159 1,159
Fund balances - Beginning 1,038,904 1,038,904 1,038,904 -
Fund balances - Ending 1,038,904$ 1,038,904$ 1,040,063$ 1,159$
Budget/GAAP ReconciliationNet change in fund balance, budget basis 1,159$ To adjust revenues for accruals 36 To adjust expenditures for accruals 1
Net change in fund balance, GAAP basis 1,196$
Budgeted Amounts

195
City of South Bend, Indiana
Schedules of Revenues, Expenditures, and Changes in Fund Balances Budget and Actual - Nonmajor Governmental Funds
Debt Service Funds - Coveleski Bond Debt Service Reserve Year Ended December 31, 2016
VarianceActual With Final
Budgetary BudgetBasis Positive
Original Final Amounts (Negative)
Revenues - Other 1,800$ 5,300$ 4,647$ (653)$
Net change in fund balances 1,800 5,300 4,647 (653)
Fund balances - Beginning 508,480 508,480 508,480 -
Fund balances - Ending 510,280$ 513,780$ 513,127$ (653)$
Budget/GAAP ReconciliationNet change in fund balance, budget basis 4,647$ To adjust revenues for accruals 19
Net change in fund balance, GAAP basis 4,666$
Budgeted Amounts

196
City of South Bend, Indiana
Schedules of Revenues, Expenditures, and Changes in Fund Balances Budget and Actual - Nonmajor Governmental Funds
Debt Service Funds - Redevelopment Bond - Palais Royale Year Ended December 31, 2016
VarianceActual With Final
Budgetary BudgetBasis Positive
Original Final Amounts (Negative)
Revenues - Other 6,000$ 15,000$ 15,824$ 824$
Other financing uses - Transfers out (6,000) (15,000) (13,888) 1,112
Net change in fund balances - - 1,936 1,936
Fund balances - Beginning 1,735,840 1,735,840 1,735,840 -
Fund balances - Ending 1,735,840$ 1,735,840$ 1,737,776$ 1,936$
Budget/GAAP ReconciliationNet change in fund balance, budget basis 1,936$ To adjust revenues for accruals 59 To adjust expenditures for accruals 1
Net change in fund balance, GAAP basis 1,996$
Budgeted Amounts

197
City of South Bend, Indiana
Schedules of Revenues, Expenditures, and Changes in Fund Balances Budget and Actual - Nonmajor Governmental Funds
Debt Service Funds - Century Center Energy Conservation Debt Service
Year Ended December 31, 2016
VarianceActual With Final
Budgetary BudgetBasis Positive
Original Final Amounts (Negative)
Revenues - Other 157,742$ 157,742$ 163,588$ 5,846$
Expenditures:Other services and charges 237,132 237,132 236,243 889
Other financing sources - Transfers in 79,390 79,676 79,676 -
Net change in fund balances - 286 7,021 6,735
Fund balances - Beginning 50,032 50,032 50,032 -
Fund balances - Ending 50,032$ 50,318$ 57,053$ 6,735$
Budget/GAAP ReconciliationNet change in fund balance, budget basis 7,021$ To adjust expenditures for accruals -
Net change in fund balance, GAAP basis 7,021$
Budgeted Amounts

198
City of South Bend, Indiana
Schedules of Revenues, Expenditures, and Changes in Fund Balances Budget and Actual - Nonmajor Governmental Funds
Capital Projects Funds - Professional Sports Development Year Ended December 31, 2016
VarianceActual With Final
Budgetary BudgetBasis Positive
Original Final Amounts (Negative)
Revenues:Intergovernmental 660,000$ 760,390$ 760,390$ -$ Other 49,718 51,518 47,565 (3,953)
Total revenues 709,718 811,908 807,955 (3,953)
Expenditures:Culture and recreation:
Other services and charges 838,052 838,052 838,051 1 Other uses - - - -
Total expenditures 838,052 838,052 838,051 1
Net change in fund balances (128,334) (26,144) (30,096) (3,952)
Fund balances - Beginning 427,931 427,931 427,931 -
Fund balances - Ending 299,597$ 401,787$ 397,835$ (3,952)$
Budget/GAAP ReconciliationNet change in fund balance, budget basis (30,096)$ To adjust revenues for accruals (86,595)
Net change in fund balance, GAAP basis (116,691)$
Budgeted Amounts

199
City of South Bend, Indiana
Schedules of Revenues, Expenditures, and Changes in Fund Balances Budget and Actual - Nonmajor Governmental Funds
Capital Projects Funds - Coveleski Stadium Capital Year Ended December 31, 2016
VarianceActual With Final
Budgetary BudgetBasis Positive
Original Final Amounts (Negative)
Revenues - Other 15,200$ 15,500$ 41,455$ 25,955$
Expenditures:Culture and recreation:
Supplies - - - - Other services and charges - 36,000 33,475 2,525
Capital outlay - - - -
Total expenditures - 36,000 33,475 2,525
Net change in fund balances 15,200 (20,500) 7,980 28,480
Fund balances - Beginning 82,661 82,661 82,661 -
Fund balances - Ending 97,861$ 62,161$ 90,641$ 28,480$
Budget/GAAP ReconciliationNet change in fund balance, budget basis 7,980$ To adjust revenues for accruals 5 To adjust expenditures for accruals 22,000
Net change in fund balance, GAAP basis 29,985$
Budgeted Amounts

200
City of South Bend, Indiana
Schedules of Revenues, Expenditures, and Changes in Fund Balances Budget and Actual - Nonmajor Governmental Funds
Capital Projects Funds - Zoo Endowment Year Ended December 31, 2016
VarianceActual With Final
Budgetary BudgetBasis Positive
Original Final Amounts (Negative)
Revenues - Other 200$ 359$ 453$ 94$
Expenditures:
Capital - - - -
Net change in fund balances 200 359 453 94 -
Fund balances - Beginning 49,510 49,510 49,510 -
Fund balances - Ending 49,710$ 49,869$ 49,963$ 94$
Budget/GAAP ReconciliationNet change in fund balance, budget basis 453$ To adjust revenues for accruals 1
Net change in fund balance, GAAP basis 454$
Budgeted Amounts

201
City of South Bend, Indiana
Schedules of Revenues, Expenditures, and Changes in Fund Balances Budget and Actual - Nonmajor Governmental Funds Capital Projects Funds - Park Nonreverting Capital
Year Ended December 31, 2016
VarianceActual With Final
Budgetary BudgetBasis Positive
Original Final Amounts (Negative)
Revenues:Charges for services 34,000$ 34,000$ 5,167$ (28,833)$ Other 28,000 28,000 3,347 (24,653)
Total revenues 62,000 62,000 8,514 (53,486)
Expenditures:Culture and recreation:
Supplies 58,000 96,546 79,292 17,254 Other services and charges - 162,487 90,671 71,816 Capital outlay 131,000 224,062 80,591 143,471
Total expenditures 189,000 483,095 250,554 232,541
Other financing sources - Transfers in - - - -
Net change in fund balances (127,000) (421,095) (242,040) 179,055
Fund balances - Beginning 470,335 470,335 470,335 -
Fund balances - Ending 343,335$ 49,240$ 228,295$ 179,055$
Budget/GAAP ReconciliationNet change in fund balance, budget basis (242,040)$ To adjust revenues for accruals 1 To adjust expenditures for encumbrances (18,673) To adjust expenditures for encumbrances 83,024
Net change in fund balance, GAAP basis (177,688)$
Budgeted Amounts

202
City of South Bend, Indiana
Schedules of Revenues, Expenditures, and Changes in Fund Balances Budget and Actual - Nonmajor Governmental Funds
Capital Projects Funds - Cumulative Capital Development Year Ended December 31, 2016
VarianceActual With Final
Budgetary BudgetBasis Positive
Original Final Amounts (Negative)
Revenues:Taxes - Property 433,000$ 440,887$ 440,887$ -$ Intergovernmental 90,737 90,737 90,267 (470) Other 3,000 3,000 3,937 937
Total revenues 526,737 534,624 535,091 467
Expenditures:General government -
Other services and charges 526,737 526,737 526,737 -
Net change in fund balances - 7,887 8,354 467
Fund balances - Beginning 572,704 572,704 572,704 -
Fund balances - Ending 572,704$ 580,591$ 581,058$ 467$
Budget/GAAP ReconciliationNet change in fund balance, budget basis 8,354$ To adjust revenues for accruals 13
Net change in fund balance, GAAP basis 8,367$
Budgeted Amounts

203
City of South Bend, Indiana
Schedules of Revenues, Expenditures, and Changes in Fund Balances Budget and Actual - Nonmajor Governmental Funds
Capital Projects Funds - Cumulative Capital Improvement Year Ended December 31, 2016
VarianceActual With Final
Budgetary BudgetBasis Positive
Original Final Amounts (Negative)
Revenues:Intergovernmental 410,000$ 410,000$ 407,727$ (2,273)$ Other 25,700 27,352 27,537 185
Total revenues 435,700 437,352 435,264 (2,088)
Expenditures - General government - Other services and charges 365,907 368,250 368,250 -
Net change in fund balances 69,793 69,102 67,014 (2,088)
Fund balances - Beginning 311,637 311,637 311,637 -
Fund balances - Ending 381,430$ 380,739$ 378,651$ (2,088)$
Budget/GAAP ReconciliationNet change in fund balance, budget basis 67,014$ To adjust revenues for accruals 17
Net change in fund balance, GAAP basis 67,031$
Budgeted Amounts

204
City of South Bend, Indiana
Schedules of Revenues, Expenditures, and Changes in Fund Balances Budget and Actual - Nonmajor Governmental Funds
Capital Projects Funds - Morris Performing Arts Center Capital Year Ended December 31, 2016
VarianceActual With Final
Budgetary BudgetBasis Positive
Original Final Amounts (Negative)
Revenues:Charges for services 100,000$ 101,781$ 101,781$ -$ Other 2,000 4,965 4,856 (109)
Total revenues 102,000 106,746 106,637 (109)
Expenditures:Culture and recreation:
Supplies 25,000 30,000 10,492 19,508 Other services and charges 39,000 48,923 31,682 17,241
Total expenditures 64,000 78,923 42,174 36,749
Net change in fund balances 38,000 27,823 64,463 36,640
Fund balances - Beginning 517,398 517,398 517,398 -
Fund balances - Ending 555,398$ 545,221$ 581,861$ 36,640$
Budget/GAAP ReconciliationNet change in fund balance, budget basis 64,463$ To adjust revenues for accruals 24 To adjust expenditures for accruals 9,538 To adjust expenditures for encumbrances 8,644
Net change in fund balance, GAAP basis 82,669$
Budgeted Amounts

205
City of South Bend, Indiana
Schedules of Revenues, Expenditures, and Changes in Fund Balances Budget and Actual - Nonmajor Governmental Funds
Capital Projects Funds - TIF Leighton Plaza Year Ended December 31, 2016
VarianceActual With Final
Budgetary BudgetBasis Positive
Original Final Amounts (Negative)
Revenues - Other 172,003$ 172,703$ 135,468$ (37,235)$
Expenditures:Economic Development:
Supplies 8,742 7,692 4,035 3,657 Other services and charges 151,664 118,862 112,588 6,274 Capital outlay - 43,852 40,850 3,002
Total expenditures 160,406 170,406 157,473 12,933
Net change in fund balances 11,597 2,297 (22,005) (24,302)
Fund balances - Beginning 209,031 209,031 209,031 -
Fund balances - Ending 220,628$ 211,328$ 187,026$ (24,302)$
Budget/GAAP ReconciliationNet change in fund balance, budget basis (22,005)$ To adjust revenues for accruals (802) To adjust expenditures for accruals (659)
Net change in fund balance, GAAP basis (23,466)$
Budgeted Amounts

206
City of South Bend, Indiana
Schedules of Revenues, Expenditures, and Changes in Fund Balances Budget and Actual - Nonmajor Governmental Funds
Capital Projects Funds - TIF - West Washington Year Ended December 31, 2016
VarianceActual With Final
Budgetary BudgetBasis Positive
Original Final Amounts (Negative)
Revenues:Taxes 420,000$ 453,503$ 453,503$ -$ Other 4,000 15,500 14,814 (686)
Total revenues 424,000 469,003 468,317 (686)
Expenditures:Economic Development:
Other services and charges 26,000 43,166 17,374 25,792 Capital outlay 1,074,000 1,360,200 300,000 1,060,200
Total expenditures 1,100,000 1,403,366 317,374 1,085,992
Net change in fund balances (676,000) (934,363) 150,943 1,085,306
Fund balances - Beginning 1,508,786 1,508,786 1,508,786 -
Fund balances - Ending 832,786$ 574,423$ 1,659,729$ 1,085,306$
Budget/GAAP ReconciliationNet change in fund balance, budget basis 150,943$ To adjust revenues for accruals (47,412) To adjust expenditures for accruals 3,366 To adjust expenditures for encumbrances 303,292
Net change in fund balance, GAAP basis 410,189$
Budgeted Amounts

207
City of South Bend, Indiana
Schedules of Revenues, Expenditures, and Changes in Fund Balances Budget and Actual - Nonmajor Governmental Funds
Capital Projects Funds - Redevelopment General Year Ended December 31, 2016
VarianceActual With Final
Budgetary BudgetBasis Positive
Original Final Amounts (Negative)
Revenues - Other 152$ 152$ 80$ (72)$
Expenditures:Economic Development -
Other services and charges 4,500 4,500 329 4,171
Net change in fund balances (4,348) (4,348) (249) 4,099
Fund balances - Beginning 8,713 8,713 8,713 -
Fund balances - Ending 4,365$ 4,365$ 8,464$ 4,099$
Budget/GAAP ReconciliationNet change in fund balance, budget basis (249)$ To adjust expenditures for accruals -
Net change in fund balance, GAAP basis (249)$
Budgeted Amounts

208
City of South Bend, Indiana
Schedules of Revenues, Expenditures, and Changes in Fund Balances Budget and Actual - Nonmajor Governmental Funds
Capital Projects Funds - Community Revitalization Enhancement District
Year Ended December 31, 2016
VarianceActual With Final
Budgetary BudgetBasis Positive
Original Final Amounts (Negative)
Revenues:Intergovernmental -$ -$ -$ -$ Other - 690 635 (55)
Total revenues - 690 635 (55)
Expenditures:Economic Development -
Other services and charges - 3,200 3,039 161
Net change in fund balances - (2,510) (2,404) 106
Fund balances - Beginning 2,404 2,404 2,404 -
Fund balances - Ending 2,404$ (106)$ -$ 106$
Budget/GAAP ReconciliationNet change in fund balance, budget basis (2,404)$ To adjust revenues for accruals (45) To adjust expenditures for accruals -
Net change in fund balance, GAAP basis (2,449)$
Budgeted Amounts

209
City of South Bend, Indiana
Schedules of Revenues, Expenditures, and Changes in Fund Balances Budget and Actual - Nonmajor Governmental Funds
Capital Projects Funds - TIF No. 1 - Southside Development Year Ended December 31, 2016
VarianceActual With Final
Budgetary BudgetBasis Positive
Original Final Amounts (Negative)
Revenues:Taxes 2,400,000$ 2,401,252$ 2,401,252$ -$ Other 10,000 52,000 50,157 (1,843)
Total revenues 2,410,000 2,453,252 2,451,409 (1,843)
Expenditures:Economic Development:
Other services and charges 240,000 563,905 325,134 238,771 Capital outlay 5,860,000 6,847,910 4,517,189 2,330,721
Total expenditures 6,100,000 7,411,815 4,842,323 2,569,492
Other financing sources - Transfers in - - - -
Net change in fund balances (3,690,000) (4,958,563) (2,390,914) 2,567,649
Fund balances - Beginning 6,103,313 6,103,313 6,103,313 -
Fund balances - Ending 2,413,313$ 1,144,750$ 3,712,399$ 2,567,649$
Budget/GAAP ReconciliationNet change in fund balance, budget basis (2,390,914)$ To adjust revenues for accruals (173,426) To adjust expenditures for accruals (143,304) To adjust expenditures for encumbrances 917,424
Net change in fund balance, GAAP basis (1,790,220)$
Budgeted Amounts

210
City of South Bend, Indiana
Schedules of Revenues, Expenditures, and Changes in Fund Balances Budget and Actual - Nonmajor Governmental Funds
Capital Projects Funds - TIF No. 3 - Southside Development Year Ended December 31, 2016
VarianceActual With Final
Budgetary BudgetBasis Positive
Original Final Amounts (Negative)
Revenues: Taxes -$ -$ -$ -$ Other 25,000 52,700 45,372 (7,328)
Total revenues 25,000 52,700 45,372 (7,328)
Expenditures:Economic Development -
Other services and charges 490,503 490,503 489,503 1,000
Net change in fund balances (465,503) (437,803) (444,131) (6,328)
Fund balances - Beginning 5,309,298 5,309,298 5,309,298 -
Fund balances - Ending 4,843,795$ 4,871,495$ 4,865,167$ (6,328)$
Budget/GAAP ReconciliationNet change in fund balance, budget basis (444,131)$ To adjust revenues for accruals 137
Net change in fund balance, GAAP basis (443,994)$
Budgeted Amounts

211
City of South Bend, Indiana
Schedules of Revenues, Expenditures, and Changes in Fund Balances Budget and Actual - Nonmajor Governmental Funds
Capital Projects Funds - Football Hall of Fame Capital Year Ended December 31, 2016
VarianceActual With Final
Budgetary BudgetBasis Positive
Original Final Amounts (Negative)
Revenues - Other 2,000$ 53,809$ 53,316$ (493)$
Expenditures:Culture and Recreation:
Supplies 1,000 1,000 - 1,000 Other services and charges 83,801 83,801 61,842 21,959
Total expenditures 84,801 84,801 61,842 22,959
Other financing sources - Transfers in - - - -
Net change in fund balances (82,801) (30,992) (8,526) 22,466
Fund balances - Beginning 503,531 503,531 503,531 -
Fund balances - Ending 420,730$ 472,539$ 495,005$ 22,466$
Budget/GAAP ReconciliationNet change in fund balance, budget basis (8,526)$ To adjust revenues for accruals 16 To adjust expenditures for accruals 7,420 To adjust expenditures for encumbrances 1,090
Net change in fund balance, GAAP basis -$
Budgeted Amounts

212
City of South Bend, Indiana
Schedules of Revenues, Expenditures, and Changes in Fund Balances Budget and Actual - Nonmajor Governmental Funds
Capital Projects Funds - Major Moves Year Ended December 31, 2016
VarianceActual With Final
Budgetary BudgetBasis Positive
Original Final Amounts (Negative)
Revenues - Other 1,509,366$ 1,491,633$ 1,376,899$ (114,734)$
Expenditures: Major Moves Construction: Other Services and Charges 750,000 750,000 749,999 1
Capital 840,000 1,698,588 1,390,506 308,082
Total Expenditures 1,590,000 2,448,588 2,140,505 308,083
Net change in fund balances (80,634) (956,955) (763,606) 193,349
Fund balances - Beginning 2,159,797 2,159,797 2,159,797 -
Fund balances - Ending 2,079,163$ 1,202,842$ 1,396,191$ 193,349$
Budget/GAAP ReconciliationNet change in fund balance, budget basis (763,606)$ To adjust revenues for accruals (1,234,272) To adjust expenditures for accruals 360,132 To adjust expenditures for encumbrances 970,707
Net change in fund balance, GAAP basis (667,039)$
Budgeted Amounts

213
City of South Bend, Indiana
Schedules of Revenues, Expenditures, and Changes in Fund Balances Budget and Actual - Nonmajor Governmental Funds
Capital Projects Funds - TIF - River East Development Year Ended December 31, 2016
VarianceActual With Final
Budgetary BudgetBasis Positive
Original Final Amounts (Negative)
Revenues:Taxes 2,750,000$ 2,750,000$ 2,348,608$ (401,392)$ Other 7,000 162,500 139,242 (23,258)
Total revenues 2,757,000 2,912,500 2,487,850 (424,650)
Expenditures:Economic Development:
Other services and charges 570,000 439,431 419,730 19,701 Capital outlay 3,230,000 7,895,728 4,556,299 3,339,429
Total expenditures 3,800,000 8,335,159 4,976,029 3,359,130
Other Financing Sources (uses);
Transfers In - - - -
Net change in fund balances (1,043,000) (5,422,659) (2,488,179) 2,934,480
Fund balances - Beginning 7,570,974 7,570,974 7,570,974 -
Fund balances - Ending 6,527,974$ 2,148,315$ 5,082,795$ 2,934,480$
Budget/GAAP ReconciliationNet change in fund balance, budget basis (2,488,179)$ To adjust revenues for accruals (76,457) To adjust expenditures for accruals (1,277) To adjust expenditures for encumbrances 2,802,695
Net change in fund balance, GAAP basis 236,782$
Budgeted Amounts

214
City of South Bend, Indiana
Schedules of Revenues, Expenditures, and Changes in Fund Balances Budget and Actual - Nonmajor Governmental Funds
Capital Projects Funds - TIF - Douglas Road Year Ended December 31, 2016
VarianceActual With Final
Budgetary BudgetBasis Positive
Original Final Amounts (Negative)
Revenues:Taxes 320,000$ 345,262$ 345,262$ -$ Other 750 1,350 1,094 (256)
Total revenues 320,750 346,612 346,356 (256)
Expenditures:Economic Development:
Other services and charges 350,000 354,200 345,504 8,696
Net change in fund balances (29,250) (7,588) 852 8,440
Fund balances - Beginning 151,863 151,863 151,863 -
Fund balances - Ending 122,613$ 144,275$ 152,715$ 8,440$
Budget/GAAP ReconciliationNet change in fund balance, budget basis 852$ To adjust revenues for accruals (40,735) To adjust expenditures for accruals 312,515 To adjust expenditures for encumbrances 4,216
Net change in fund balance, GAAP basis 276,848$
Budgeted Amounts

215
City of South Bend, Indiana
Schedules of Revenues, Expenditures, and Changes in Fund Balances Budget and Actual - Nonmajor Governmental Funds Capital Projects Funds - TIF - River East Residential
Year Ended December 31, 2016
VarianceActual With Final
Budgetary BudgetBasis Positive
Original Final Amounts (Negative)
Revenues:Taxes 2,948,923$ 3,932,948$ 3,932,947$ (1)$ Other 213,499 213,500 212,665 (835)
Total revenues 3,162,422 4,146,448 4,145,612 (836)
Expenditures:Economic Development:
Other services and charges 3,430,000 3,430,000 3,369,509 60,491
Net change in fund balances (267,578) 716,448 776,103 59,655
Fund balances - Beginning 1,622,127 1,622,127 1,622,127 -
Fund balances - Ending 1,354,549$ 2,338,575$ 2,398,230$ 59,655$
Budget/GAAP ReconciliationNet change in fund balance, budget basis 776,103$ To adjust revenues for accruals - To adjust expenditures for accruals 722,272 To adjust expenditures for encumbrances 231
Net change in fund balance, GAAP basis 1,498,606$
Budgeted Amounts

216
City of South Bend, Indiana
Schedules of Revenues, Expenditures, and Changes in Fund Balances Budget and Actual - Nonmajor Governmental Funds
Capital Projects Funds - Certified Technology Park Year Ended December 31, 2016
VarianceActual With Final
Budgetary BudgetBasis Positive
Original Final Amounts (Negative)
Revenues - Other 14,637$ 23,037$ 20,029$ (3,008)$
Expenditures -Economic Development - Capital outlay 2,550,000 2,692,913 142,913 2,550,000
Net change in fund balances (2,535,363) (2,669,876) (122,884) 2,546,992
Fund balances - Beginning 2,276,266 2,276,266 2,276,266 -
Fund balances - Ending (259,097)$ (393,610)$ 2,153,382$ 2,546,992$
Budget/GAAP ReconciliationNet change in fund balance, budget basis (122,884)$ To adjust revenues for accruals 59 To adjust expenditures for encumbrances -
Net change in fund balance, GAAP basis (122,825)$
Budgeted Amounts

217
City of South Bend, Indiana
Schedules of Revenues, Expenditures, and Changes in Fund Balances Budget and Actual - Nonmajor Governmental Funds
Capital Projects Funds - Palais Royale Historic Preservation Year Ended December 31, 2016
VarianceActual With Final
Budgetary BudgetBasis Positive
Original Final Amounts (Negative)
Revenues - Other 17,300$ 17,761$ 16,496$ (1,265)$
Expenditures -Culture and Recreation - Other services and charges - - - -
Net change in fund balances 17,300 17,761 16,496 (1,265)
Fund balances - Beginning 76,513 76,513 76,513 -
Fund balances - Ending 93,813$ 94,274$ 93,009$ (1,265)$
Budget/GAAP ReconciliationNet change in fund balance, budget basis 16,496$ To adjust revenues for accruals 6
Net change in fund balance, GAAP basis 16,502$
Budgeted Amounts

218
City of South Bend, Indiana
Schedules of Revenues, Expenditures, and Changes in Fund Balances Budget and Actual - Nonmajor Governmental Funds
Capital Projects Funds - Airport Urban Enterprise Zone Year Ended December 31, 2016
VarianceActual With Final
Budgetary BudgetBasis Positive
Original Final Amounts (Negative)
Revenues - Other 1,500$ 3,900$ 3,474$ (426)$
Expenditures:Economic Development
Other services and charges 50,000 50,000 - 50,000
Net change in fund balances (48,500) (46,100) 3,474 49,574
Fund balances - Beginning 380,115 380,115 380,115 -
Fund balances - Ending 331,615$ 334,015$ 383,589$ 49,574$
Budget/GAAP ReconciliationNet change in fund balance, budget basis 3,474$ To adjust revenues for accruals 14
Net change in fund balance, GAAP basis 3,488$
Budgeted Amounts

City of South Bend, Indiana
Other Supplementary InformationNonmajor Enterprise Funds
Fund Descriptions
Consolidated Building - The consolidated building fund accounts for the operation of theconsolidated St. Joseph County/South Bend Building Department and the South Bend CodeEnforcement and Animal Care and Control Department.
Parking Garage - The parking garage fund accounts for the operation and maintenance of theCity's parking garages.
Solid Waste - The solid waste fund accounts for the provision of solid waste services toresidents and businesses.
Emergency Medical Services - To account for the operations and purchases of necessaryequipment for the Fire Department and Emergency Medical Services Department. Financing isprovided by ambulance fees.
219

City of South Bend, Indiana
Other Supplementary InformationCombining Statement of Net Position
Nonmajor Enterprise FundsDecember 31, 2016
ConsolidatedBuilding Parking Garage Solid Waste
EmergencyMedicalServices Total
AssetsCurrent assets:
Cash and cash equivalents $ 583,210 $ 216,013 $ 43,046 $ 1,199,627 $ 2,041,896Investments 2,030,579 752,515 149,958 4,185,455 7,118,507Receivables:
Accounts 9,750 453 451,144 4,088,693 4,550,040Interest 4,867 1,797 985 10,043 17,692
Due from other funds 1,200 - - - 1,200
Total current assets 2,629,606 970,778 645,133 9,483,818 13,729,335
Noncurrent assets:Restricted assets 71,066 - 680,849 481,506 1,233,421Capital assets:
Assets not subject to depreciation 27,400 1,132,020 - - 1,159,420Assets subject to depreciation 1,813,858 3,309,922 3,527,752 5,332,900 13,984,432
Total noncurrent assets 1,912,324 4,441,942 4,208,601 5,814,406 16,377,273
Total assets 4,541,930 5,412,720 4,853,734 15,298,224 30,106,608
LiabilitiesCurrent liabilities:
Accounts payable 21,040 97,318 266,170 89,556 474,084Due to other governmental units - - - 101,142 101,142Due to other funds 1,065 - - 1,371 2,436Performance deposits payable 5,000 - - - 5,000Accrued liabilities and other:
Accrued payroll payable 43,214 - 51,002 81,504 175,720Accrued interest payable 1,495 - 16,727 75,997 94,219
Compensated absences 103,199 - 36,952 98,783 238,934Mortgage bonds payable - - - 225,000 225,000Capital leases 54,621 - 1,033,475 176,729 1,264,825
Total current liabilities 229,634 97,318 1,404,326 850,082 2,581,360
Noncurrent liabilities:Advances from other funds - 31,191 - - 31,191Mortgage bonds payable - - - 4,990,402 4,990,402Capital leases 172,747 - 1,917,957 438,965 2,529,669
Total noncurrent liabilities 172,747 31,191 1,917,957 5,429,367 7,551,262
Total liabilities 402,381 128,509 3,322,283 6,279,449 10,132,622
Deferred Inflows of Resources -Unamortized gain on sale/leaseback - 3,356 - - 3,356
Net PositionNet investment in capital assets 1,684,956 4,441,942 921,312 (133,517) 6,914,693
Cash with fiscal agent 71,066 - 344,992 481,506 897,564Capital outlay fund - - 335,857 - 335,857
Unrestricted 2,383,527 838,913 (70,710) 8,670,786 11,822,516
Total net position $ 4,139,549 $ 5,280,855 $ 1,531,451 $ 9,018,775 $ 19,970,630
220

City of South Bend, Indiana
Other Supplementary InformationCombining Statement of Revenue, Expenses, and Changes in
Net PositionNonmajor Enterprise Funds
Year Ended December 31, 2016
ConsolidatedBuilding Parking Garage Solid Waste
EmergencyMedicalServices Total
Operating RevenueLicenses and permits $ 1,752,497 $ - $ - $ - $ 1,752,497Parking fees - 993,845 - - 993,845Solid waste fees - - 5,511,281 - 5,511,281Charges for sales and services - - - 7,822,894 7,822,894Other 10,637 2,352 27,862 98,278 139,129
Total operating revenue 1,763,134 996,197 5,539,143 7,921,172 16,219,646
Operating ExpensesOther operation and maintenance 2,950,039 - 4,839,592 6,746,038 14,535,669Billing and administrative costs 135,024 693,788 313,488 - 1,142,300Depreciation 152,174 216,069 597,745 504,835 1,470,823
Total operating expenses 3,237,237 909,857 5,750,825 7,250,873 17,148,792
Operating (Loss) Gain (1,474,103) 86,340 (211,682) 670,299 (929,146)
Nonoperating Revenue (Expenses)Investment income 19,923 6,829 4,300 49,728 80,780Interest expense (2,935) - (44,088) (186,476) (233,499)Gain (loss) on sale of assets - - (102,141) (43,477) (145,618)Other nonoperating general revenue 966 - 300,000 - 300,966
Total nonoperating revenue (expense) 17,954 6,829 158,071 (180,225) 2,629
Loss - Before contributions (1,456,149) 93,169 (53,611) 490,074 (926,517)
Capital ContributionsOther capital contributions 30,608 - - - 30,608
Transfers In 2,110,468 - - - 2,110,468
Change in Net Position 684,927 93,169 (53,611) 490,074 1,214,559
Net Position - Beginning of year 3,454,622 5,187,686 1,585,062 8,528,701 18,756,071
Net Position - End of year $ 4,139,549 $ 5,280,855 $ 1,531,451 $ 9,018,775 $ 19,970,630
221

City of South Bend, Indiana
Other Supplementary InformationCombining Statement of Cash Flows
Nonmajor Enterprise FundsYear Ended December 31, 2016
ConsolidatedBuilding Parking Garage Solid Waste
EmergencyMedicalServices Total
Cash Flows from Operating ActivitiesReceipts from customers $ 1,812,877 $ 993,819 $ 5,497,744 $ 8,087,508 $ 16,391,948Receipts from interfund services and reimbursements 1,170 - - - 1,170Payments to suppliers (551,256) (635,257) (2,504,816) (1,633,813) (5,325,142)Payments to employees (2,367,194) - (1,539,899) (4,982,394) (8,889,487)Internal activity - Payments to other funds (231,520) (66,924) (629,733) (7,612) (935,789)
Net cash (used in) provided byoperating activities (1,335,923) 291,638 823,296 1,463,689 1,242,700
Cash Flows from Noncapital Financing ActivitiesTransfers from other funds 2,110,468 - - - 2,110,468Loans received from other funds - 31,191 - - 31,191Other nonoperating revenue 966 - 300,000 - 300,966
Net cash provided by (used in)noncapital financing activities 2,111,434 31,191 300,000 - 2,442,625
Cash Flows from Capital and Related FinancingActivities
Proceeds from capital debt issued for future capitalpurchase 139,941 - 1,453,477 107,464 1,700,882
Proceeds from sales of capital assets - - 22,816 - 22,816Purchase of capital assets (146,039) - (1,855,452) (655,386) (2,656,877)Principal paid on capital debt (31,421) - (850,494) (373,815) (1,255,730)Interest paid on capital debt (2,020) - (38,586) (194,021) (234,627)
Net cash (used in) provided by capitaland related financing activities (39,539) - (1,268,239) (1,115,758) (2,423,536)
Cash Flows from Investing ActivitiesInterest received on investments 18,074 6,057 3,826 47,300 75,257Proceeds from sale and maturities of investment
securities (523,388) (242,629) 104,612 (375,853) (1,037,258)
Net cash (used in) provided by investingactivities (505,314) (236,572) 108,438 (328,553) (962,001)
Net Increase (Decrease) in Cash and CashEquivalents $ 230,658 $ 86,257 $ (36,505) $ 19,378 $ 299,788
Cash and Cash Equivalents - Beginning of year 423,618 129,756 760,400 1,661,755 2,975,529
Cash and Cash Equivalents - End of year $ 654,276 $ 216,013 $ 723,895 $ 1,681,133 $ 3,275,317
Balance Sheet Classification of Cash and CashEquivalents
Cash and investments $ 2,613,789 $ 968,528 $ 193,004 $ 5,385,082 $ 9,160,403Restricted cash and investments 71,066 - 680,849 481,506 1,233,421Less amounts classified as investments (2,030,579) (752,515) (149,958) (4,185,455) (7,118,507)
Total cash and cash equivalents $ 654,276 $ 216,013 $ 723,895 $ 1,681,133 $ 3,275,317
222

City of South Bend, Indiana
Other Supplementary InformationCombining Statement of Cash Flows (Continued)
Nonmajor Enterprise FundsYear Ended December 31, 2016
ConsolidatedBuilding Parking Garage Solid Waste
EmergencyMedicalServices Total
Reconciliation of Operating Loss to Net Cash fromOperating Activities
Operating income (loss) $ (1,474,103) $ 86,340 $ (211,682) $ 670,299 $ (929,146)Adjustments to reconcile operating income (loss) to
net cash from operating activities:Depreciation and amortization 152,174 216,069 597,745 504,835 1,470,823Lease proceeds used for noncapital expenses - - 299,885 - 299,885Changes in assets and liabilities:
Receivables 50,943 (2,377) (41,401) 166,336 173,501Due from others (30) - - - (30)Accounts payable (30,609) (8,394) 151,498 52,931 165,426Due to other governments - - - (58,956) (58,956)Performance deposit (32,437) - - - (32,437)Due to other funds (9,020) - - 713 (8,307)Accrued payroll payable 14,868 - 28,663 28,748 72,279Compensated absences payable (7,709) - (1,412) 98,783 89,662
Net cash (used in) provided byoperating activities $ (1,335,923) $ 291,638 $ 823,296 $ 1,463,689 $ 1,242,700
Noncash Investing, Capital, and Financing ActivitiesCapital assets disposed (at cost) $ - $ - $ 1,726,743 $ 93,165 $ 1,819,908Capital assets contributed 30,608 - - - 30,608Accumulated depreciation on disposals of capital assets - - (1,601,786) (49,688) (1,651,474)
223

City of South Bend, Indiana
Other Supplementary InformationInternal Service Funds
Fund Descriptions
Liability Insurance Premium Reserve - The Liability Insurance Premium Reserve fundaccounts for expenses related to maintaining the City's self-funded liability insurance includingadministrative costs, claims, and premiums. Funding is provided by assessments to certain otherCity funds.
Self-Funded Employee Benefits - To account for employer and employees' contributions for amedical insurance plan.
Central Services - To account for expenses related to fuel, vehicle repairs, and various suppliesprovided to City departments on a cost-reimbursement basis.
Police Take Home Vehicle - To account for expenses associated with claims arising from useof program vehicles occurring while officers are not on duty. Funding is provided by officersparticipating in the program.
311 Call Center - To account for expenses of the City’s innovation and technologydepartment. Funding is provided by allocations and fees from various City departments.
Unemployment Compensation Insurance - To account for payment of unemploymentclaims to the Indiana Department of Workforce Development. Financing is provided byallocating costs to user departments to cover the estimated costs of claims.
224

City of South Bend, Indiana
Other Supplementary InformationCombining Statement of Net Position
Internal Service FundsDecember 31, 2016
Liability
Insurance
Premium
Reserve
Self-Funded
Employee
Benefits
Central
Services
Police Take
Home Vehicle
311 Call
Center
Unemployment
Compensation
Insurance Total
AssetsCurrent assets:
Cash and cash equivalents $ 1,025,772 $ 1,520,029 $ 341,546 $ 167,616 $ - $ 63,798 $ 3,118,761Investments 3,573,433 5,199,017 1,189,826 583,914 - 222,251 10,768,441Receivables:
Accounts 1,988 3,616 59,885 - - - 65,489Interest 8,570 12,520 2,795 1,398 - 533 25,816
Due from other funds - - 9,911 - 68,833 - 78,744Inventory - - 879,736 - - - 879,736Prepaid expenses 195,538 - 7,178 - - - 202,716
Total current assets 4,805,301 6,735,182 2,490,877 752,928 68,833 286,582 15,139,703
Noncurrent assets: Restricted assets - - 1,100 - - - 1,100
Capital assets - Assets subject todepreciation 6,357 - 1,401,705 - - - 1,408,062
Total noncurrentassets 6,357 - 1,402,805 - - - 1,409,162
Total assets 4,811,658 6,735,182 3,893,682 752,928 68,833 286,582 16,548,865
LiabilitiesCurrent liabilities:
Accounts payable 47,544 54,716 593,477 - 18 11,261 707,016Due to other funds - 2,083 1,005 - 1,200 - 4,288Accrued liabilities and other:
Accrued payroll payable 4,067 - 52,368 - 8,555 - 64,990Accrued interest payable - - 83 - - - 83
Compensated absences 8,987 - 111,510 - 59,060 - 179,557Claims payable 1,303,401 1,014,214 - - - - 2,317,615Capital leases - - 13,577 - - - 13,577
Total current liabilities 1,363,999 1,071,013 772,020 - 68,833 11,261 3,287,126
Noncurrent liabilities - Capital leases - - 45,579 - - - 45,579
Total liabilities 1,363,999 1,071,013 817,599 - 68,833 11,261 3,332,705
Deferred Inflows of Resources - - - - - - -
Net PositionNet investment in capital assets 6,357 - 1,342,549 - - - 1,348,906Unrestricted 3,441,302 5,664,169 1,733,534 752,928 - 275,321 11,867,254
Total net position $ 3,447,659 $ 5,664,169 $ 3,076,083 $ 752,928 $ - $ 275,321 $ 13,216,160
225

City of South Bend, Indiana
Other Supplementary InformationCombining Statement of Revenue, Expenses, and Changes in
Net PositionInternal Service Funds
Year Ended December 31, 2016
Liability
Insurance
Premium
Reserve
Self-Funded
Employee
Benefits
Central
Services
Police Take
Home
Vehicle
311 Call
Center
Unemployment
Compensation
Insurance Total
Operating RevenueEmployee/employer contributions $ 2,223,480 $ 18,139,945 $ - $ 112,200 $ 556,730 $ 89,142 $ 21,121,497Charges for sales and services - - 7,371,837 - - - 7,371,837Other 14,187 3,159 98,506 - - - 115,852
Total operating revenue 2,237,667 18,143,104 7,470,343 112,200 556,730 89,142 28,609,186
Operating ExpensesOther operation and maintenance - 1,241,978 7,195,576 7,033 556,730 70,312 9,071,629Administration 820,000 212,044 133,584 - - 7,284 1,172,912Insurance claims and premiums 1,239,909 14,345,262 - - - - 15,585,171Depreciation 4,845 - 144,181 - - - 149,026
Total operating expenses 2,064,754 15,799,284 7,473,341 7,033 556,730 77,596 25,978,738
Operating (Loss) Income 172,913 2,343,820 (2,998) 105,167 - 11,546 2,630,448
Nonoperating Revenue (Expenses)Investment income 42,319 50,068 11,014 6,298 - 2,575 112,274Loss on sale of assets (4,330) - - - - - (4,330)Debt service charge - - (272) - - - (272)
Total nonoperatingrevenue (expenses) 37,989 50,068 10,742 6,298 - 2,575 107,672
Change in Net Position 210,902 2,393,888 7,744 111,465 - 14,121 2,738,120
Net Position - Beginning of year 3,236,757 3,270,281 3,068,339 641,463 - 261,200 10,478,040
Net Position - End of year $ 3,447,659 $ 5,664,169 $ 3,076,083 $ 752,928 $ - $ 275,321 $13,216,160
226

City of South Bend, Indiana
Other Supplementary InformationCombining Statement of Cash Flows
Internal Service FundsYear Ended December 31, 2016
Liability
Insurance
Premium
Reserve
Self-Funded
Employee
Benefits
Central
Services
Police Take
Home Vehicle
311 Call
Center
Unemployment
Compensation
Insurance Total
Cash Flow from Operating ActivitiesReceipts from customers and users $ 14,188 $ 5,071,383 $ 55,553 $ 112,200 $ - $ - $ 5,253,324Receipts from interfund services and
reimbursements 2,221,491 13,071,164 7,390,469 - 487,897 89,142 23,260,163Payments to suppliers (1,945,898) (15,830,459) (4,452,060) (7,086) (29,858) (67,152) (22,332,513)Payments to employees (212,766) - (2,604,598) - (457,343) - (3,274,707)Internal activity - Payments to other
funds (38,040) - (133,039) - (696) (7,284) (179,059)
Net cash (used in)provided byoperating activities 38,975 2,312,088 256,325 105,114 - 14,706 2,727,208
Cash Flows from Capital and RelatedFinancing Activities
Purchase of capital assets - - (241,192) - - - (241,192)Principal paid on capital debt - - (10,487) - - - (10,487)Interest paid on capital debt - - (313) - - - (313)
Net cash used incapital and relatedfinancing activities - - (251,992) - - - (251,992)
Cash Flows from Investment ActivitiesInterest received on investments 40,948 44,498 10,611 5,919 - 2,470 104,446Proceeds from sale and maturities of
investment securities 29,078 (1,742,336) 18,983 (73,347) - (7,921) (1,775,543)
Net cash provided by(used in) investingactivities 70,026 (1,697,838) 29,594 (67,428) - (5,451) (1,671,097)
Net (Decrease) Increase in Cash andCash Equivalents 109,001 614,250 33,927 37,686 - 9,255 804,119
Cash and Cash Equivalents - Beginning ofyear 916,771 905,779 308,719 129,930 - 54,543 2,315,742
Cash and Cash Equivalents -End of year $ 1,025,772 $ 1,520,029 $ 342,646 $ 167,616 $ - $ 63,798 $ 3,119,861
Balance Sheet Classification of Cashand Cash Equivalents
Cash and investments $ 4,599,205 $ 6,719,046 $ 1,531,372 $ 751,530 $ - $ 286,049 $ 13,887,202Restricted cash - - 1,100 - - - 1,100Less amounts classified as
investments (3,573,433) (5,199,017) (1,189,826) (583,914) - (222,251) (10,768,441)
Total cash andcashequivalents $ 1,025,772 $ 1,520,029 $ 342,646 $ 167,616 $ - $ 63,798 $ 3,119,861
227

City of South Bend, Indiana
Other Supplementary InformationCombining Statement of Cash Flows (Continued)
Internal Service FundsYear Ended December 31, 2016
Liability
Insurance
Premium
Reserve
Self-Funded
Employee
Benefits
Central
Services
Police Take
Home Vehicle
311 Call
Center
Unemployment
Compensation
Insurance Total
Reconciliation of Operating (Loss)Income to Net Cash from OperatingActivities
Operating (loss) income $ 172,913 $ 2,343,820 $ (2,998) $ 105,167 $ - $ 11,546 $ 2,630,448Adjustments to reconcile operating
(loss) income to net cash fromoperating activities:
Depreciation andamortization 4,845 - 144,181 - - - 149,026
Lease proceeds used fornoncapital expenses - - 43,938 - - - 43,938
Changes in assets andliabilities:
Receivables (1,989) (556) (18,582) - - - (21,127)Due from other
funds - - (5,739) - (68,833) - (74,572)Inventory - - (28,250) - - - (28,250)Prepaid expenses and
other assets 7,949 - (1,012) - - - 6,937Accounts payable 27,485 54,716 104,443 (53) 18 3,160 189,769Due to other funds - (2,330) 545 - 1,200 - (585)Accrued payroll
payable 1,641 - 21,535 - 8,556 - 31,732Compensated
absences payavle (1,002) - (1,736) - 59,059 - 56,321Estimate of unfilled
claims (172,867) (83,562) - - - - (256,429)
Net cash (used in)provided byoperatingactivities $ 38,975 $ 2,312,088 $ 256,325 $ 105,114 $ - $ 14,706 $ 2,727,208
Noncash Investing, Capital, andFinancing Activities
Capital assets disposed (at cost) $ 21,650 $ - $ 23,653 $ - $ - $ - $ 45,303Accumulated depreciation on
disposal of capital assets (17,320) - (23,653) - - - (40,973)
228

City of South Bend, Indiana
Other Supplementary InformationFiduciary Funds
Fund Descriptions
Pension Trust Funds
1925 Police Pension - To account for the provision of retirement and disability benefits topolice officers hired prior to May 1, 1977. Financing is provided by mandatory contributions byactive members and state pension relief distributions.
1937 Firefighters' Pension - To account for the provision of retirement and disability benefitsto firefighters hired prior to May 1, 1977. Financing is provided by mandatory contributions byactive members and state pension relief distributions.
Agency Funds
Payroll - To account for the payroll of City employees and pension benefits of the Police andFirefighters' Pension Funds. Gross payroll and pension benefits are treated as expenditures inother City funds and transferred into this fund, which serves as a clearing account.
Morris Palais Royale Box Office - To account for Morris Performing Arts Center and PalaisRoyale event advance deposits and related expenses.
Police Distributions Payable - To account for monies collected by the South Bend PoliceDepartment from asset seizures and other sources. Proceeds may be used to pay othergovernmental agencies for monies collected on their behalf or for related expenses.
229

City of South Bend, Indiana
Other Supplementary InformationStatement of Assets and Liabilities
Fiduciary FundsDecember 31, 2016
Pension Trust Funds Agency Funds
1925 PolicePension
1937Firefighters'
PensionTotal PensionTrust Funds Payroll
Morris PalaisRoyale Box
Office
PoliceDistribution
PayableTotal Agency
FundsAssets
Cash and cash equivalents $ 176,455 $ 37,308 $ 213,763 $ 420,885 $ 1,692,774 $ 817,116 $ 2,930,775Investments 614,707 129,970 744,677 - - - -Receivables - Interest 1,521 349 1,870 - - - -Other receivables 1,267 - 1,267 - - - -
Total assets $ 793,950 $ 167,627 $ 961,577 $ 420,885 $ 1,692,774 $ 817,116 $ 2,930,775
LiabilitiesAccounts payable $ 92 $ 78 $ 170 $ - $ - $ - $ -Accrued liabilities and other - 355 355 420,885 - - 420,885Customer deposits payable - - - - 1,692,774 - 1,692,774Police distribution payable - - - - - 817,116 817,116
Total liabilities $ 92 $ 433 $ 525 $ 420,885 $ 1,692,774 $ 817,116 $ 2,930,775
Net Position $ 793,858 $ 167,194 $ 961,052
230

City of South Bend, Indiana
Other Supplementary InformationCombining Statement of Changes in Fiduciary Net Position
Pension Trust FundsYear Ended December 31, 2016
1925 PolicePension
1937Firefighters'
Pension TotalAdditions
Investment income - Interest and dividends $ 6,713 $ 2,852 $ 9,565Contributions:
On behalf 5,991,750 4,866,271 10,858,021Other 15,749 6,279 22,028
Net contributions 6,007,499 4,872,550 10,880,049
Total additions 6,014,212 4,875,402 10,889,614
DeductionsBenefit payments 6,364,237 5,165,758 11,529,995Administrative expenses 13,550 14,485 28,035
Total deductions 6,377,787 5,180,243 11,558,030
Net Increase (Decrease) in Net Position Held in Trust(363,575) (304,841) (668,416)
Net Position - Beginning of year 1,157,433 472,035 1,629,468
Net Position - End of year $ 793,858 $ 167,194 $ 961,052
231

City of South Bend, Indiana
Other Supplementary InformationStatement of Changes in Assets and Liabilities
Agency FundsYear Ended December 31, 2016
Balance atJanuary 1, 2016 Additions Reductions
Balance atDecember 31,
2016Payroll
Assets - Cash and investments $ 412,690 $104,634,503 $(104,626,308) $ 420,885
Liabilities - Accrued liabilities and other $ 412,690 $104,634,503 $(104,626,308) $ 420,885
Balance atJanuary 1, 2016 Additions Reductions
Balance atDecember 31,
2016Morris Palais Royale Box Office
Assets - Cash and cash equivalents $ 1,504,458 $ 3,305,191 $ (3,116,875) $ 1,692,774
Liabilities - Customer deposits payable $ 1,504,458 $ 3,305,191 $ (3,116,875) $ 1,692,774
Balance atJanuary 1, 2016 Additions Reductions
Balance atDecember 31,
2016Police Distribution Payable
Assets - Cash and cash equivalents $ 835,108 $ 23,924 $ (41,916) $ 817,116
Liabilities - Police distribution payable $ 835,108 $ 23,924 $ (41,916) $ 817,116
232

Statistical Section
This part of the Comprehensive Annual Financial Report presents detailed information as a context for understanding what the information in the financial statements, note disclosures, and required supplemental information says about the overall financial health.
The statistical section is organized into the following main categories:
Financial trends - These schedules contain trend information to help the reader understandhow the financial performance and well-being have changed over time.
Revenue capacity - These schedules contain information to help the reader assess the most significant local revenue source, property taxes .
Debt capacity - These schedules contain information to help the reader assess theaffordability of the ’s current levels of outstanding debt and the ’s ability to issueadditional debt in the future.
Demographic and economic information - These schedules offer demographic economicindicators to help the reader understand the environment within which the 'sfinancial activities take place.
Operating information - These schedules contain service and infrastructure data to help thereader understand how the information in the 's financial report relates to theservices the provides and the activities it performs.

Financial Trends
These schedules contain trend information to help the reader understand how the 's financial performance and well-being have changed over time.

City of South Bend, Indiana
233
Statistical Section Net Position by Component
Last Ten Fiscal Years
2007 2008 2009 2010 2011 2012 2013 2014 (1) 2015 (1) 2016Governmental activities
Invested in capital assets, net of related debt 200,634,954$ 178,178,047$ 178,483,535$ 186,771,216$ 196,265,413$ 202,779,954$ 192,190,446$ 168,275,521$ 157,604,691$ 161,341,318$ Restricted 5,370,627 11,077,687 12,825,227 8,840,610 9,354,772 8,050,418 7,990,172 8,723,878 9,137,552 8,669,117 Unrestricted 47,150,229 56,786,214 82,877,695 96,539,932 82,271,482 71,992,457 86,413,227 (18,581,970) (25,882,348) (7,327,797)
Total governmental activities net position 253,155,810$ 246,041,948$ 274,186,457$ 292,151,758$ 287,891,667$ 282,822,829$ 286,593,845$ 158,417,429$ 140,859,895$ 162,682,638$
Business-type activitiesInvested in capital assets, net of related debt 112,194,451$ 124,705,327$ 119,607,643$ 122,108,095$ 103,463,004$ 113,193,929$ 114,506,252$ 136,685,811$ 141,998,384$ 145,288,974$ Restricted 8,273,257 8,630,542 14,075,339 13,320,967 12,937,988 29,259,933 48,267,664 26,587,012 28,397,290 31,963,852 Unrestricted 15,793,782 9,209,917 12,597,138 19,262,192 45,733,630 26,957,505 7,906,258 22,426,017 24,415,739 25,357,665
Total business-type activities net position 136,261,490$ 142,545,786$ 146,280,120$ 154,691,254$ 162,134,622$ 169,411,367$ 170,680,174$ 185,698,840$ 194,811,413$ 202,610,491$
Primary governmentInvested in capital assets, net of related debt 312,829,405$ 302,883,374$ 298,091,178$ 308,879,311$ 299,728,417$ 315,973,883$ 306,696,698$ 304,961,332$ 299,603,075$ 306,630,292$ Restricted 13,643,884 19,708,229 26,900,566 22,161,577 22,292,760 37,310,351 56,257,836 35,310,890 37,534,842 40,632,969 Unrestricted 62,944,011 65,996,131 95,474,833 115,802,124 128,005,112 98,949,962 94,319,485 3,844,047 (1,466,609) 18,029,868
Total primary government net position 389,417,300$ 388,587,734$ 420,466,577$ 446,843,012$ 450,026,289$ 452,234,196$ 457,274,019$ 344,116,269$ 335,671,308$ 365,293,129$
(1) The City implemented the reporting of net pension liability through GASB 68 during 2015. 2014 was restated.
Net position is defined as the difference between total assets and deferred outflows of resources less total liabilities and deferred inflows of resources and can generally be thought of as the net worth of the City of South Bend.
Source - City of South Bend Comprehensive Annual Financial Reports (includes prior period adjustments)

City of South Bend, Indiana
234
Statistical Section Changes in Net Position
Last Ten Fiscal Years
2007 2008 2009 2010 2011 2012 2013 2014 2015 2016ExpensesGovernmental activities:
General Government (13,680,203)$ (10,253,389)$ (7,903,378)$ (8,261,861)$ (16,783,351)$ (13,788,310)$ (13,200,898)$ (19,013,453)$ (21,572,776)$ (15,618,817)$ Public Safety (52,751,974) (49,728,256) (50,800,573) (62,106,991) (73,530,442) (69,977,237) (76,023,819) (68,783,155) (56,528,448) (55,029,909) Highways and Streets (17,904,129) (22,292,012) (15,042,344) (9,526,537) (7,574,003) (14,639,158) (20,915,815) (13,031,500) (20,045,444) (13,550,535) Health and Welfare (75,000) (75,000) - - - - - - - - Community and Economic Development (18,206,948) (27,299,233) (4,335,618) (30,744,012) (34,648,975) (20,217,987) (10,069,690) (19,780,791) (40,727,612) (28,436,368) Culture and Recreation (16,454,667) (18,311,807) (17,981,839) (16,036,194) (15,566,794) (21,724,589) (26,846,471) (16,802,311) (20,300,768) (17,156,094) Bond Issuance Costs - - - - - - - - (372,432) - Interest on Long-Term Debt (5,859,102) (7,080,166) (8,049,610) (7,339,548) (6,798,531) (6,134,406) (5,961,124) (2,497,849) (4,762,714) (4,727,630)
Total governmental activities expenses (124,932,023)$ (135,039,863)$ (104,113,362)$ (134,015,143)$ (154,902,096)$ (146,481,687)$ (153,017,817)$ (139,909,059)$ (164,310,194)$ (134,519,353)$
Business-type activities:Water (13,061,750)$ (13,492,744)$ (12,584,679)$ (12,525,246)$ (11,972,840)$ (12,228,014)$ (15,221,865)$ (13,020,610)$ (13,609,378)$ (14,900,039)$ Wastewater (18,295,813) (23,020,991) (27,047,143) (21,403,663) (22,260,005) (23,809,975) (26,390,790) (25,521,753) (25,737,867) (26,420,526) Century Center (3,490,103) (3,562,285) (3,488,266) (2,989,586) (3,100,484) (2,929,268) (4,330,656) (4,747,838) (4,854,747) (5,364,472) Consolidated Building Department (1) (1,090,327) (1,108,940) (1,113,867) (930,120) (871,299) (909,376) (1,131,815) (3,242,320) (3,552,347) (3,240,172) Parking Garage (1,444,146) (1,466,200) (1,471,960) (1,438,288) (1,467,646) (1,721,655) (1,285,056) (1,660,596) (2,139,182) (909,857) Solid Waste (4,072,910) (4,299,846) (4,036,001) (4,204,056) (4,962,157) (5,118,806) (5,091,588) (5,811,526) (5,243,972) (5,794,913) Blackthorn Golf Course (1,811,801) (1,829,122) (1,881,982) (1,995,556) (1,689,042) (1,841,998) (1,497,513) (1,874,962) (165,977) - Emergency Medical Services (2) - - - - - - - - (6,596,206) (7,437,349)
Total business-type activities net expenses (43,266,850) (48,780,128) (51,623,898) (45,486,515) (46,323,473) (48,559,092) (54,949,283) (55,879,605) (61,899,676) (64,067,328)
Total primary government net position (168,198,873)$ (183,819,991)$ (155,737,260)$ (179,501,658)$ (201,225,569)$ (195,040,779)$ (207,967,100)$ (195,788,664)$ (226,209,870)$ (198,586,681)$

City of South Bend, Indiana
235
Statistical Section Changes in Net Position (Continued)
Last Ten Fiscal Years
2007 2008 2009 2010 2011 2012 2013 2014 2015 2016Governmental activities:
Charges for services: General Government 6,553,121$ 6,647,223$ 6,855,830$ 6,964,269$ 1,165,018$ 2,100,103$ 1,939,865$ 1,451,438$ 1,188,531$ 1,622,788$ Public Safety 4,228,405 5,035,433 5,051,827 4,916,958 4,096,566 5,079,182 5,210,272 4,992,228 529,386 975,712 Highways and Streets - - 5,152 28,110 227,000 291,840 451,363 728,343 676,429 707,547 Community and Economic Develop. 604,873 636,722 332,454 283,420 683,503 271,366 444,839 485,938 408,654 481,293 Culture and Recreation 5,057,076 5,300,818 5,063,896 4,995,049 4,681,536 5,224,543 5,112,019 3,815,920 3,726,359 4,383,977
Operating Grants and Contributions 15,628,287 11,356,682 12,199,444 29,467,573 32,091,246 24,937,596 21,466,622 3,203,805 2,813,481 2,644,272 Capital Grants and Contributions 960,502 1,176,783 780,137 1,472,233 2,328,468 2,468,120 1,867,213 - - -
Total governmental activities program revenues 33,032,264$ 30,153,661$ 30,288,740$ 48,127,612$ 45,273,337$ 40,372,750$ 36,492,193$ 14,677,672$ 9,342,840$ 10,815,589$
Business-type activities:Charges for services:
Water 15,336,891$ 14,926,833$ 14,151,289$ 14,194,442$ 14,080,592$ 15,409,171$ 15,102,462$ 14,373,176$ 14,204,285$ 15,091,372$ Wastewater 21,349,401 23,567,973 25,012,163 26,001,156 29,407,263 30,657,698 32,474,743 34,009,117 36,638,804 39,061,562 Century Center 3,371,553 3,370,802 2,873,966 2,869,010 2,894,913 2,680,076 3,463,813 2,227,171 4,202,564 4,796,676 Consolidated Building Department 1,078,258 1,169,788 977,050 875,481 899,397 1,000,381 967,667 1,387,571 2,037,950 1,764,100 Parking Garage 861,307 1,003,889 1,070,519 1,047,784 1,071,078 921,044 968,868 1,017,218 968,417 996,197 Solid Waste 4,187,821 4,343,120 4,759,530 4,745,547 4,830,342 5,081,991 5,399,044 5,295,712 5,364,871 5,839,143 Blackthorn Golf Course 1,512,150 1,493,519 1,557,951 1,479,415 1,392,999 1,669,372 1,530,402 1,548,341 109,949 - Emergency Medical Services - - - - - - - - 6,470,446 7,921,172
Operating Grants and Contributions - - - - - - - - - - Capital Grants and Contributions 1,253,332 1,209,380 4,038,412 1,889,165 4,291,731 2,010,253 697,916 95,834 4,683,424 649,609
Total business-type activities program revenues 48,950,713 51,085,304 54,440,880 53,102,000 58,868,315 59,429,986 60,604,915 59,954,140 74,680,710 76,119,831
Total primary government program revenues 81,982,977$ 81,238,965$ 84,729,620$ 101,229,612$ 104,141,652$ 99,802,736$ 97,097,108$ 74,631,812$ 84,023,550$ 86,935,420$
2007 2008 2009 2010 2011 2012 2013 2014 2015 2016Net (Expense)/RevenueGovernmental activities (102,007,599)$ (73,959,701)$ (103,726,403)$ (106,774,484)$ 45,273,337$ (106,108,937)$ (116,525,624)$ (125,231,387)$ (154,967,354)$ (123,703,764)$ Business-type activities 170,585 (538,594) 8,954,365 6,778,527 58,868,315 10,870,894 5,655,632 4,074,535 12,781,034 12,052,503
Total primary government net expense (101,837,014)$ (74,498,295)$ (94,772,038)$ (99,995,957)$ 104,141,652$ (95,238,043)$ (110,869,992)$ (121,156,852)$ (142,186,320)$ (111,651,261)$

City of South Bend, Indiana
236
Statistical Section Changes in Net Position (Continued)
Last Ten Fiscal Years
2007 2008 2009 2010 2011 2012 2013 2014 2015 2016General Revenues and Other Changes in Net PositionGovernmental activities:
Taxes:Property taxes 77,120,683$ 76,109,499$ 73,882,128$ 77,315,641$ 76,445,349$ 71,775,415$ 72,018,650$ 69,221,468$ 72,032,049$ 76,331,581$ County Option Income Tax 8,072,623 5,813,846 10,270,179 11,502,052 13,219,723 13,748,824 13,739,325 15,025,840 14,847,338 21,194,795 Economic Develop. Income Tax 4,681,134 3,788,754 4,536,245 7,335,113 8,044,773 8,324,878 8,177,352 8,796,821 9,031,709 9,594,602 Professional Sports Develop. Tax 435,791 453,268 522,788 597,406 558,268 633,904 649,996 588,054 628,261 673,787 Community Revitalization District Tax 1,000,000 955,315 605,623 416,149 733,100 653,185 244,623 - - -
Unrestricted Grants and Contributions 4,032,300 5,664,011 7,597,883 4,883,081 3,964,336 3,891,810 5,893,924 28,473,888 25,487,112 25,846,397 Unrestricted Investment earnings 6,247,113 4,961,410 859,135 868,023 1,050,768 1,317,443 762,270 951,901 1,322,674 1,458,787 Other 5,016,902 2,007,821 2,781,368 2,627,341 3,483,054 6,623,313 14,285,314 6,747,199 11,214,442 6,745,542 Loss on Sale of Redevelopment Properties - - - - - - - Net Pension Obligation - - - - - - - Transfers 3,735 34,970 (645,992) (648,823) 3,041,176 3,879,721 4,525,187 (683,049) 2,846,415 3,681,016
Total governmental activities 106,610,281$ 99,788,894$ 100,409,357$ 104,895,983$ 110,540,547$ 110,848,493$ 120,296,641$ 129,122,122$ 137,410,000$ 145,526,507$
Business-type activities:Unrestricted Investment earnings 1,301,348$ 1,514,287$ 271,360$ 146,826$ 206,409$ 285,572$ 138,362$ 128,168$ 358,918$ 570,982$ Other - - - - - - - 1,501,664 - - Transfers (3,735) (34,970) 645,992 648,823 (3,041,176) (3,879,721) (4,525,187) 683,049 (2,846,415) (3,681,016)
Total business-type activities 1,297,613 1,479,317 917,352 795,649 (2,834,767) (3,594,149) (4,386,825) 2,312,881 (2,487,497) (3,110,034)
Total primary government 107,907,894$ 101,268,211$ 101,326,709$ 105,691,632$ 107,705,780$ 107,254,344$ 115,909,816$ 131,435,003$ 134,922,503$ 142,416,473$
Special Item (Governmental activities):Well field contamination settlement -$ 4,462,214$ -$ -$ -$ -$ -$ -$ -$ -$ Disposal of operations - - - - - - - - (1,180,964) -
Change in Net PositionGovernmental activities 32,650,580 524,705 (6,365,127) 150,169,320 911,788 4,739,556 3,771,016 3,890,735 (17,557,354) 21,822,743 Business-type activities 759,019 10,433,682 7,695,879 59,663,964 9,710,075 7,276,745 1,268,807 6,387,416 9,112,573 7,799,078
Total primary government 33,409,599$ 10,958,387$ 1,330,752$ 209,833,284$ 10,621,863$ 12,016,301$ 5,039,823$ 10,278,151$ (8,444,781)$ 29,621,821$
Excludes prior period adjustments
Changes in net assets is defined as the incremental difference between total assets and total liabilities as a result of operations during the fiscal year.
(1) In 2014, Code Enforcement and Animal Care & Control were consolidated with the Building Department to build efficiencies. Prior to 2014, these expenses were included in the general government activities.
(2) In 2015, Emergency Medical Services was reclassified to an enterprise fund.
Source : City of South Bend Comprehensive Annual Financial Reports

City of South Bend, Indiana
237
Statistical Section Fund Balances - Governmental Funds
Last Ten Fiscal Years
2007 2008 2009 2010 2011 (1) 2012 2013 2014 2015 2016General fund
Reserved 2,213,970$ 3,245,271$ 1,516,159$ 1,824,454$ -$ -$ -$ -$ -$ -$ Unreserved 21,546,783 24,171,313 23,102,296 26,912,688 - - - - - - Nonspendable - - - - 1,115,025 958,341 656,848 558,304 491,665 494,730 Restricted - - - - 327,267 - - - - - Committed - - - - - - - - - - Assigned - - - - 255,287 165,389 516,506 - 466,088 1,380,036 Unassigned - - - - 26,233,637 27,671,353 26,495,559 27,029,101 29,664,303 32,077,856
Total - General Fund 23,760,753$ 27,416,584$ 24,618,455$ 28,737,142$ 27,931,216$ 28,795,083$ 27,668,913$ 27,587,405$ 30,622,056$ 33,952,622$
Other Governmental FundsReserved 36,374,517$ 60,213,915$ 56,819,802$ 62,230,229$ -$ -$ -$ -$ -$ -$ Unreserved, reported in:
Special revenue funds 25,703,180 32,054,329 36,398,024 31,996,398 - - - - - - Capital projects funds 66,593,906 87,571,056 78,214,132 85,237,947 - - - - - - Debt service funds - - - - - - - - - -
Nonspendable - - - - 37,036,839 37,706,861 22,828,476 20,537,450 27,042,236 23,566,267 Restricted - - - - 44,754,037 78,326,567 95,387,879 100,501,274 113,004,506 101,826,640 Committed - - - - 11,829,074 11,142,045 20,697,026 12,962,745 2,238,475 2,698,694 Assigned - - - - 77,460,284 35,180,652 35,455,190 35,147,874 32,138,059 31,998,790 Unassigned - - - - (2,777,374) (4,219,066) (4,852,169) (5,700,829) (4,218,596) (2,301,793)
Total - Other Governmental Funds 128,671,603 179,839,300 171,431,958 179,464,574 168,302,860 158,137,059 169,516,402 163,448,514 170,204,680 157,788,598
Grand Total - Governmental Funds 152,432,356$ 207,255,884$ 196,050,413$ 208,201,716$ 196,234,076$ 186,932,142$ 197,185,315$ 191,035,919$ 200,826,736$ 191,741,220$
(1) - The City of South Bend adopted Statement No. 54 of the Governmental Accounting Standards Board requiring new classifications for Fund Balance reporting for fiscal year 2011.
Source: City of South Bend Comprehensive Annual Financial Reports

City of South Bend, Indiana
238
Statistical Section Changes in Fund Balances - Governmental Funds
Last Ten Fiscal Years
2007 2008 2009 2010 2011 2012 2013 2014 2015 2016Revenues
Taxes 88,695,023$ 96,930,953$ 89,139,585$ 101,785,765$ 99,001,213$ 95,136,206$ 94,829,947$ 93,632,183$ 96,033,296$ 107,861,553$ Licenses, fees and permits 173,604 177,329 206,594 192,397 190,943 189,714 177,019 141,565 151,923 224,677 Fines and forfeits 437,732 412,707 423,981 409,775 636,749 334,767 660,841 563,999 454,327 756,781 Charges for services 15,832,139 17,030,160 16,678,584 16,585,634 13,990,267 12,442,553 12,320,498 10,628,976 5,794,168 7,062,108 Intergovernmental 21,400,166 18,196,118 20,577,464 35,822,886 34,419,714 31,297,526 29,227,759 30,663,505 30,216,059 27,959,813 Investment earnings 6,248,605 4,962,768 859,135 868,023 1,050,768 1,317,443 762,270 955,376 1,253,242 1,624,527 Other revenues 5,039,373 2,007,821 3,046,791 2,677,796 3,587,518 6,660,875 13,174,140 7,904,187 8,816,811 7,179,959
Total revenues 137,826,642 139,717,856 130,932,134 158,342,276 152,877,172 147,379,084 151,152,474 144,489,791 142,719,826 152,669,418
ExpendituresGeneral government 9,611,354 6,902,426 5,969,141 5,214,424 6,680,855 6,390,585 7,154,965 8,022,688 8,420,278 16,311,633 Public Safety 53,203,005 50,413,055 48,790,068 62,586,177 69,612,754 67,138,414 64,041,549 66,927,250 61,889,405 64,350,281 Highways and Streets 13,257,781 13,369,611 11,716,810 10,702,555 5,079,041 9,288,682 9,769,942 10,441,957 12,787,641 11,294,768 Health and Welfare 75,000 75,000 - - - - - - - - Community and Economic Development 7,710,242 9,726,718 8,938,134 17,408,376 9,698,611 3,543,180 8,068,458 7,309,130 11,068,013 20,894,153 Culture and Recreation 13,469,798 14,542,481 12,733,094 12,841,596 13,816,699 18,557,986 13,956,025 13,948,089 12,855,704 13,070,606 Capital Outlay 17,293,302 26,695,208 37,485,105 21,952,522 46,691,030 39,984,127 30,748,663 29,407,934 46,553,570 27,056,295 Bond Issuance Costs - - - - - - - - 372,432 - Debt Service
Interest and Fiscal Charges 5,718,572 7,258,201 8,053,995 7,499,683 7,186,494 6,734,305 6,113,043 5,360,219 5,392,298 4,943,021 Principal 7,870,166 9,040,095 9,276,363 12,552,681 13,632,195 10,822,721 13,008,105 12,882,830 13,319,392 13,055,327
Total expenditures 128,209,220 138,022,795 142,962,710 150,758,014 172,397,679 162,460,000 152,860,750 154,300,097 172,658,733 170,976,084
Excess of revenues over (under) expenditures 9,617,422 1,695,061 (12,030,576) 7,584,262 (19,520,507) (15,080,916) (1,708,276) (9,810,306) (29,938,907) (18,306,666)
Other Financing Sources (Uses)
Proceeds from debt issuance 2,920,287 45,622,808 1,771,318 5,280,314 3,478,239 5,660,897 7,801,455 8,436,905 69,426,593 4,999,053 Premium (discount) on debt issuance - 1,626,186 80,950 146,030 26,877 1,236,364 21,576 171,851 1,919,787 - Proceeds from refunding - - 7,210,000 5,327,775 38,307,431 13,595,000 3,990,000 - - - Payments to refunded bond escrow agent - - (7,591,171) (5,538,255) (37,300,856) (14,613,147) (4,376,769) (3,482,205) (35,698,815) - Financing By Capital Lease - - - - - - - Transfers in 7,872,575 10,574,625 8,687,172 16,314,577 22,483,564 25,368,413 26,365,239 18,478,925 31,498,681 19,541,050 Transfers out (7,868,840) (10,539,655) (9,333,164) (16,963,400) (19,442,388) (21,488,692) (21,840,052) (16,522,289) (28,652,266) (15,860,034) Other - - - - - - - 28,476 1,235,744 541,081
Total other financing sources (uses) 2,924,022 47,283,964 825,105 4,567,041 7,552,867 9,758,835 11,961,449 7,111,663 39,729,724 9,221,150
Special Item:Well field contamination settlement - - 4,462,214 - - - - - - -
Net change in fund balances 12,541,444$ 48,979,025$ (6,743,257)$ 12,151,303$ (11,967,640)$ (5,322,081)$ 10,253,173$ (2,698,643)$ 9,790,817$ (9,085,516)$
Debt service as a percentage ofnoncapital expenditures (1) 11.4% 12.1% 17.6% 15.4% 13.8% 12.9% 13.4% 13.5% 11.6% 12.7%
Excludes prior period adjustments
(1) Formula = Debt service payments (principal and interest) / (Total Governmental Fund expenditures - Governmental Fund capital outlay per reconciliation)
Source: City of South Bend Comprehensive Annual Financial Reports

Revenue Capacity
These schedules contain information to help the reader assess the 's most significant local revenue source, the property tax .

City of South Bend, Indiana
239
Statistical Section Property Taxes Levies and Collections
Last Ten Fiscal Years
Estimated Adjusted Current Tax Total Tax (1) OutstandingPer DLGF Circuit Breaker Current Tax Collections Delinquent Collections as Outstanding Delinquent Taxes
Tax Year/ Current Levy Levy Current Tax as a Percent of Tax Total Tax a Percent of Delinquent as a Percent ofCollection Year Tax Levy Reduction (County Abstract) Collections Adjusted Tax Levy Collections Collections Adjusted Tax Levy Taxes Adjusted Tax Levy
2006/2007 62,723,113$ -$ 62,723,113$ 57,979,187$ 92.44% 2,289,138$ 60,268,325$ 96.09% 7,411,505$ 11.82%2007/2008 65,534,282 - 65,534,282 59,589,537 90.93% 4,113,095 63,702,632 97.21% 2,831,650 4.32%2008/2009 64,546,050 7,863,846 56,682,204 47,497,697 83.80% 3,355,161 50,852,858 89.72% 5,810,503 10.25%2009/2010 66,929,179 14,346,110 52,583,069 41,813,442 79.52% 6,380,600 48,194,042 91.65% 10,026,236 19.07%2010/2011 68,662,101 17,692,787 50,969,314 40,876,844 80.20% 5,791,920 46,668,764 91.56% 8,165,775 16.02%2011/2012 70,756,844 23,965,911 46,790,933 42,598,817 91.04% 5,111,380 47,710,197 101.96% 9,550,891 20.41%2012/2013 72,696,497 27,863,156 44,833,341 38,721,788 86.37% 5,200,000 43,921,788 97.97% 11,146,473 24.86%2013/2014 73,981,565 27,051,751 46,929,814 41,370,637 88.15% 3,134,526 44,505,163 94.83% 8,745,941 18.64%2014/2015 76,533,090 29,728,412 46,804,678 42,097,072 89.94% 3,168,597 45,265,669 96.71% 8,200,000 17.52%2015/2016 78,503,658 29,601,193 48,902,465 43,806,020 89.58% 3,900,000 47,706,020 97.55% 7,468,597 15.27%
Data provided for General Fund, Parks & Recreation, Cumulative Capital Development, Fire Pension and Police Pension Funds. Excludes College Football Hall of Fame and Tax Increment Financing Funds.
Delinquent tax collections are not broken out by individual taxing unit. A calculation of South Bend's share of delinquent taxes has been made based on proportionate tax rates.
Total collections may exceed 100% of adjusted tax levy as prior year collections are not broken out separately by the St. Joseph County Auditor.
(1) Outstanding Delinquent Taxes are reported in the aggregate as of the end of each year and are not cumulative. Estimated for 2014/2015 and 2015/2016
Source - St. Joseph County Auditor's Settlement Worksheets and Abstract. City of South Bend budget forms approved by the Department of Local Government Finance (DLGF).

City of South Bend, Indiana
240
Statistical Section Direct and Overlapping Property Tax Rates
Last Ten Fiscal Years (Rate per $100 of Net Assessed Value)
CumulativeTax Year/ General Parks/ Firefighters' Police Capital Total St. Joseph Schools Total Grand
Collection Year Fund Recreation Pension Pension Development Direct County Districts Township Library Other (1) Overlapping Total
2006/2007 1.6838 0.2858 0.0531 0.0477 0.0342 2.1046 0.8711 1.5419 0.0285 0.1957 0.1737 2.8109 4.91552007/2008 1.7924 0.2979 0.0579 0.0572 0.0342 2.2396 0.7576 1.5417 0.0482 0.2216 0.1944 2.7635 5.00312008/2009 1.9777 0.3656 0.0117 0.0189 0.0342 2.4081 0.5693 1.0297 0.0537 0.2257 0.1733 2.0517 4.45982009/2010 (2) 2.2536 0.4401 - - 0.0342 2.7279 0.5866 1.0728 0.0406 0.2657 0.1835 2.1492 4.87712010/2011 2.4381 0.4818 - - 0.0342 2.9541 0.5424 1.2211 0.0438 0.3027 0.1958 2.3058 5.25992011/2012 2.4954 0.4957 - - 0.0328 3.0239 0.6212 1.1931 0.0464 0.2941 0.1817 2.3365 5.36042012/2013 2.5678 0.5102 - - 0.0328 3.1108 0.6731 1.3493 0.0453 0.3227 0.1971 2.5875 5.69832013/2014 2.7977 0.5608 - - 0.0328 3.3913 0.7058 1.3577 0.0505 0.3309 0.1849 2.6298 6.02112014/2015 2.8313 0.5676 - - 0.0325 3.4314 0.6866 1.2940 0.0500 0.3207 0.2125 2.5638 5.99522015/2016 2.8703 0.5754 - - 0.0321 3.4778 0.6974 1.2682 0.0512 0.3549 0.2224 2.5941 6.0719
(1) Includes State of Indiana, Redevelopment Commission (Hall of Fame), South Bend Transportation and South Bend Regional Airport.
(2) Firefighters' Pension and Police Pension are no longer a tax burden for the City of South Bend as the State of Indiana has assumed responsibility for funding these programs.
(3) Information provided for Portage Township in the City of South Bend. Property tax rates applied to net assessed valuation. Property tax billings are also subject to "circuit breaker" property tax caps on grossed assessed valuation of 1% (homestead residential property), 2% (other residential/rental property), and 3% (nonresidential real and personal property). Therefore, an increase in stated property tax rates will not result in higher property taxes paid for many taxpayers who have reached their cap.
Source: St. Joseph County Auditor's Office - Certified Tax Rate Schedules - Rates presented for Portage Township in South Bend
City Direct Rates Overlapping Rates (3)

City of South Bend, Indiana
241
Statistical Section Detail of Net Assessed Valuation
(Assessment for the Year 2015 Payable in 2016)
South Bend South Bend South Bend South Bend South Bend South BendCentre Twp Clay Twp German Twp Penn Twp Warren Twp Portage Twp Totals Percent
Value of land 113,044,900$ 25,694,900$ 68,785,300$ 17,284,300$ 2,104,100$ 384,981,200$ 611,894,700$ Value of improvements 463,743,700 119,282,800 405,976,800 84,929,200 21,312,100 2,492,146,100 3,587,390,700
Total value of real estate 576,788,600 144,977,700 474,762,100 102,213,500 23,416,200 2,877,127,300 4,199,285,400
Less: Mortgage, veterans, blind, age 65 & other exemptions (229,648,816) (33,997,865) (83,846,231) (27,546,982) - (906,401,724) (1,281,441,618)
Tax-exempt property (45,968,895) (8,261,007) (27,071,020) (9,208,300) - (338,693,528) (429,202,750) Investment Deduction - - - - - (2,019,600) (2,019,600) Tax increment financing (55,724,019) (8,522,563) (245,396,348) - (22,919,380) (385,503,839) (718,066,149) Tax abatements (1,357,410) - (13,249,252) (1,308,285) (496,820) (15,106,900) (31,518,667)
Net value of real estate 244,089,460 94,196,265 105,199,249 64,149,933 - 1,229,401,709 1,737,036,616 76.28%
Gross personal property assessments 29,923,790 9,152,410 177,012,280 2,685,960 6,624,140 378,471,460 603,870,040 Less: Tax abatements: (1,479,750) - (19,974,281) - - (11,257,467) (32,711,498)
Tax-exempt property (1,973,538) (157,540) (4,351,951) (1,249,150) - (84,620,194) (92,352,373) Investment deduction - - - - - (22,459,972) (22,459,972) Tax increment financing - - - - - - -
Net value of personal property 26,470,502 8,994,870 152,686,048 1,436,810 6,624,140 260,133,827 456,346,197 20.04%
Net value of utilities 9,055,170 3,638,650 6,557,830 1,068,960 305,530 63,160,790 83,786,930 3.68%
Total net assessed valuation 279,615,132$ 106,829,785$ 264,443,127$ 66,655,703$ 6,929,670$ 1,552,696,326$ 2,277,169,743$ 100.00%
Percentage of Total 12.28% 4.69% 11.61% 2.93% 0.30% 68.19% 100.00%
Summary Real Personal Property/
Property Utilities Total Percent
Total value 4,199,285,400$ 687,656,970$ 4,886,942,370$ 100.00%Deductions & exemptions (1,283,461,218) (22,459,972) (1,305,921,190) -26.72%Tax exempt property (429,202,750) (92,352,373) (521,555,123) -10.67%Tax increment financing (718,066,149) - (718,066,149) -14.69%Tax abatements (31,518,667) (32,711,498) (64,230,165) -1.31%
0Total net assessed valuation 1,737,036,616$ 540,133,127$ 2,277,169,743$ 46.60%
Percent 76.28% 23.72% 100.00%
Source: St. Joseph County Auditor's Office - Information from the County Abstract prepared by the Indiana Department of Local Government Finance

City of South Bend, Indiana
242
Statistical Section Assessed Value and Actual Value of Taxable Property
Last Ten Fiscal Years
(2) Gross Assessed Values Less: Total Net City
Tax Year/ Real Personal Utilities Total Non-Taxed Taxable Tax %Collection Year Property Property Property Value Property (1) Value Rate Taxable
2006/2007 4,374,431,415$ 544,460,152$ 90,443,780$ 5,009,335,347$ 1,986,978,200$ 3,022,357,147$ 2.1046 60.33%2007/2008 4,420,513,240 527,383,785 92,736,090 5,040,633,115 2,064,552,317 2,976,080,798 2.2396 59.04%2008/2009 4,698,989,240 592,538,950 95,891,770 5,387,419,960 2,718,532,541 2,668,887,419 2.4081 49.54%2009/2010 4,368,497,000 604,951,450 98,433,750 5,071,882,200 2,618,376,627 2,453,505,573 2.7279 48.37%2010/2011 4,339,037,300 551,819,290 101,009,760 4,991,866,350 2,667,414,488 2,324,451,862 2.9541 46.56%2011/2012 4,255,238,900 560,331,660 95,165,650 4,910,736,210 2,529,861,602 2,380,874,608 3.0239 48.48%2012/2013 4,452,887,970 537,500,490 100,832,450 5,091,220,910 2,720,133,213 2,371,087,697 3.1108 46.57%2013/2014 4,199,757,500 552,872,520 90,252,180 4,842,882,200 2,633,155,528 2,209,726,672 3.3913 45.63%2014/2015 4,192,804,920 557,759,982 86,924,710 4,837,489,612 2,577,220,294 2,260,269,318 3.4314 46.72%2015/2016 4,199,285,400 603,870,040 83,786,930 4,886,942,370 2,609,772,627 2,277,169,743 3.4778 46.60%
(1) Non-taxed property includes tax exempt property, tax increment financing property, tax abatements, and adjustments for deductions and exemptions.
(2) City tax rate excludes Redevelopment Commission (Hall of Fame) tax rate.
Source: St. Joseph County Auditor's Office

City of South Bend, Indiana
243
Statistical Section Net Assessed Value of Taxable Property
Last Ten Fiscal Years
Real Estate Personal Utilities TotalTax Year/ Net Assessed Net Assessed Net Assessed Net Assessed Percent
Collection Year Value Value Value Value Change
2006/2007 2,520,098,365$ 411,815,002$ 90,443,780$ 3,022,357,147$ 6.60%2007/2008 2,493,481,003 389,863,705 92,736,090 2,976,080,798 -1.53%2008/2009 2,137,129,242 435,866,407 95,891,770 2,668,887,419 -10.32%2009/2010 1,911,818,036 443,253,787 98,433,750 2,453,505,573 -8.07%2010/2011 1,809,523,734 413,918,368 101,009,760 2,324,451,862 -5.26%2011/2012 1,858,836,588 426,872,370 95,165,650 2,380,874,608 2.43%2012/2013 1,858,213,181 412,042,066 100,832,450 2,371,087,697 -0.41%2013/2014 1,687,672,152 431,802,340 90,252,180 2,209,726,672 -6.81%2014/2015 1,753,122,893 420,221,715 86,924,710 2,260,269,318 2.29%2015/2016 1,737,036,616 456,346,197 83,786,930 2,277,169,743 0.75%
Source: St. Joseph County Auditor's office

City of South Bend, Indiana
244
Statistical Section Assessed Value of Taxable Property
Last Ten Years
Tax Year/ Total Tax Exempt Tax Increment Tax AssessedCollection Year Gross Valuation Deductions (1) Property Financing Abatements Valuation
2006/2007 5,009,335,347$ (1,014,750,501)$ (494,545,149)$ (382,668,480)$ (95,014,070)$ 3,022,357,147$ 2007/2008 5,040,633,115 (996,413,450) (494,748,890) (471,656,927) (101,733,050) 2,976,080,7982008/2009 5,387,419,960 (1,557,329,781) (436,861,027) (625,910,065) (98,431,668) 2,668,887,4192009/2010 5,071,882,200 (1,344,563,829) (449,848,037) (707,096,696) (116,868,065) 2,453,505,5732010/2011 4,991,866,350 (1,353,769,271) (439,343,852) (777,038,302) (97,263,063) 2,324,451,8622011/2012 4,910,736,210 (1,331,068,608) (417,907,225) (702,724,247) (78,161,522) 2,380,874,6082012/2013 5,091,220,910 (1,397,134,910) (488,961,977) (761,349,489) (72,686,837) 2,371,087,6972013/2014 4,842,882,200 (1,344,702,776) (512,692,590) (713,448,152) (62,312,010) 2,209,726,6722014/2015 4,837,489,612 (1,292,923,103) (510,555,188) (707,010,507) (66,731,496) 2,260,269,3182015/2016 4,886,942,370 (1,305,921,190) (521,555,123) (718,066,149) (64,230,165) 2,277,169,743
(1) Includes homestead standard deduction, supplemental standard deduction, mortgage deduction, blind/disabled deduction, investment deduction, veteran's deduction, over 65 years old deduction, and geothermal deduction. In 2009, a new 35% supplemental standard deduction was provided as a part of "circuit breaker" property tax reform legislation.
2016 Deductions 2013/2014 2014/2015 2015/2016Homestead Standard Deduction 865,700,222$ 814,820,960$ 820,420,116$ Supplemental Standard Deduction 370,952,895 368,795,377 375,610,821Mortgage Deduction 46,396,568 44,358,618 42,985,922Veteran's Deduction 10,105,601 11,027,128 11,784,608Age 65 and Over Deduction 27,283,686 25,146,428 24,608,600Energy Systems Deduction 403,600 403,400 388,200Blind & Disabled Deduction 6,245,808 5,714,123 5,643,351Investment Deduction 17,614,396 22,657,069 24,479,572
Total 1,344,702,776$ 1,292,923,103$ 1,305,921,190$
Source: St. Joseph County Auditor's Office Abstract

City of South Bend, Indiana
245
Statistical Section Property Tax Collections - Cash Basis
Last Ten Years
Fund 2007 2008 2009 2010 2011 2012 2013 2014 2015 2016Fund Name Number Actual Actual (2) Actual (3) Actual Actual Actual Actual Actual Actual Actual
General Fund 101 48,720,726$ 14,574,480$ 79,162,937$ 38,780,847$ 38,514,550$ 39,368,431$ 36,251,397$ 36,708,989$ 37,349,387$ 39,362,139$ Excess Levy 103 - - - - - - - 3,648 - - Parks & Recreation 201 8,271,741 2,461,101 13,919,096 7,591,932 7,613,760 7,824,056 7,207,060 7,365,388 7,487,554 7,902,995 Redevelopment Bonds Studebaker Corridor 310 11,590 - - - - - - - - - College Football Hall of Fame Debt Service 313 1,127,140 360,682 2,362,057 1,488,453 1,549,954 1,133,205 1,268,179 497,768 906,263 1,361,512 River West TIF District (1) 324 8,851,077 33,400 10,808,912 21,508,430 11,187,768 11,631,287 13,340,354 14,284,734 16,293,240 18,159,311 Cumulative Capital Development 406 989,824 291,600 1,420,833 587,063 540,454 517,710 463,331 430,786 428,727 440,887 Sample-Ewing TIF District (1) 414 778,093 - - - - - - - - - South Bend Central Development Area TIF (1) 420 3,276,169 12,696 3,870,188 7,336,117 3,633,473 3,671,478 2,590,808 4,309,727 - - West Washington Street TIF District 422 287,095 1,785 358,844 860,049 431,085 422,715 493,608 580,987 402,911 453,503 Central Medical Service Area TIF District (1) 426 928,113 2,793 919,174 3,524,962 1,704,238 1,606,915 1,221,676 851,211 - - River East (Northeast) TIF District 429 13,468 - 22,191 195,400 715,063 1,351,048 841,627 1,568,240 2,421,308 2,348,608 Southside Development Area TIF District 430 457,985 1,756 355,596 4,094,135 1,808,952 2,466,203 2,404,416 2,379,212 2,205,822 2,401,252 Erskine Commons TIF District (5) 431 2,891 10 1,240,184 5,978,592 784,373 - - - - - Erskine Village TIF District 432 775,622 2,713 1,531,403 3,759,287 1,603,182 - 1,311,129 9,175 19,183 - Douglas Road TIF District 435 13,941 - 125,294 460,760 306,053 285,713 323,939 321,895 270,758 345,262 River East (Northeast) Residential TIF 436 - - - 1,815,829 2,446,103 2,514,048 2,262,765 2,725,909 3,129,681 3,932,947 Airport Urban Enterprise 454 - - - 301,430 123,165 111,721 - - - - Fire Department Employees Pension (4) 701 1,536,839 462,375 1,437,539 (5,867) - - - - - - Police Department Employees Pension (4) 702 1,380,555 425,760 1,609,905 (9,479) - - - - - -
Total 77,422,869$ 18,631,151$ 119,144,153$ 98,267,940$ 72,962,173$ 72,904,530$ 69,980,289$ 72,037,669$ 70,914,834$ 76,708,415$
(1) Fund 414 closed out during 2008 into Fund 324. Name changed in 2015 from TIF Airport to River West TIF due to consolidation of Central Development Area and Central Medical TIFs.
(2) Delays in sending out property tax bills until December 19, 2008 (with an on-time due date of February 20, 2009) resulted in interfund borrowing in the General Fund (101), Parks and Recreation Fund (201) and the College Football Hall of Fame Debt Service Fund (313) at year end. The remainder of property tax revenue was received during the first half of 2009 with final settlement with the St. Joseph County Auditor in July, 2009
(3) Includes collections of 2008 taxes as noted above. Tax Increment Financing (TIF) 2009 property tax collections were received from the County Auditor on January 21, 2010.
(4) Property tax levy for Police and Fire pension plans eliminated. Funding provided by the State of Indiana.
(5) Erskine Commons TIF District funds were released and outstanding bonds were paid off.
Source - City of South Bend Accounting Records

City of South Bend, Indiana
246
Statistical Section 2016 Circuit Breaker Property Tax Cap Credits
(2%) (3%) Taxing (1%) Other Residential All Other Total
Unit Name Homsesteads and Farmland Real/Personal Elderly Credits
City of South Bend (101,168 population) South Bend Civil City 6,885,004$ 13,440,283$ 10,511,372$ 27,447$ 30,864,106$ Hall of Fame Bond - - - 517 517 TIF - SB So. #1 Centre 466 40,808 1,006,493 - 1,047,767 TIF - SB So. #3 Centre - - - - TIF - Douglas Road EDA - 2,805 150,459 - 153,264 TIF - River East Clay - - 7,888 - 7,888 TIF - River West German 943 26,821 4,365,966 - 4,393,730 TIF - SB West Washington 7,335 19,588 207,924 33 234,880 TIF - SB So. #1 Portage 488 51,153 49,876 - 101,517 TIF - River West Portage 7,972 141,500 3,360,009 14 3,509,495 TIF - River West Warren - - 418,199 - 418,199 TIF - River East Portage 52,760 3,381,637 1,220,798 - 4,655,195
Total Credits 6,954,968$ 17,104,595$ 21,298,984$ 28,011$ 45,386,558$
Per Capita Credits 68.75 169.07 210.53 0.28 448.63 Percent of Total 15.32% 37.69% 46.93% 0.06% 100.00%
Selected Benchmark Local Governments
Total 2010 Per CapitaLocal Unit Credits Population Credits
South Bend Civil City 30,864,106$ 101,168 305.08$ Anderson Civil City 10,793,958 56,120 192.34 East Chicago Civil City 5,522,802 29,698 185.97 Elkhart Civil City 8,622,616 50,949 169.24 Evansville Civil City 10,336,843 117,429 88.03 Fort Wayne Civil City 18,991,799 253,691 74.86Gary Civil City 31,073,139 80,294 386.99Goshen Civil City 3,910,981 31,719 123.30Hammond Civil City 5,955,835 80,830 73.68Jeffersonville Civil City 4,483,131 44,953 99.73Kokomo Civil City 9,387,327 45,468 206.46Lafayette Civil City 1,505,375 61,140 24.62Laporte Civil City 2,608,666 22,053 118.29Mishawka Civil City 4,934,350 48,252 102.26 Muncie Civil City 14,743,105 70,085 210.36 Noblesville Civil City 3,559,290 51,969 68.49 Saint Joseph County 7,711,191 266,931 28.89 South Bend School Corporation 6,749,172 101,168 66.71 Terre Haute Civil City 11,033,916 60,785 181.52
Sources - Circuit Breaker Report. Prepared by the Legislative Services Agency, December 20, 2016 (www.iga.in.gov). County Property Tax Studies, Saint Joseph County, Property Tax Changes in Saint Joseph County between 2015 and 2016. Prepared by the Legislative Services Agency, October 2016. (www.iga.in.gov). U.S. Census Bureau, 2010 Census information (http://factfinder.census.gov/). 2016 information not available.
Notes: Circuit breaker tax cap credits are tax savings for taxpayers and revenue losses for local governmental units. Circuit breaker credits are highest in tax districts with thehighest tax rates. These are usually districts that include cities or towns because the municipal tax rate is included in the district tax rate. This means that most circuit breakercredits are in cities and towns and in units that overlap cities and towns.

City of South Bend, Indiana
247
Statistical Section Principal Property Taxpayers - Current and Nine Years Ago
December 31, 2016
2016 2007Net Assessed Net Assessed
Taxpayer Type of Business Value (1) Rank Value (2) Rank
University of Notre Dame Higher Education 67,721,886$ 1 2.97 % -$ Indiana Michigan Power Company - AEP Utility 43,036,800 2 1.89 - Indiana Bell - AT&T Inc. Telecommunications 38,932,800 3 1.71 - Edward Rose of Indiana Apartments and Real Estate 35,765,900 4 1.57 40,395,200 1 1.34 %Honeywell International, Inc. Airplane and Auto Parts 35,556,856 5 1.56 10,667,762 10 0.35Noble Americas South Bend Ethanol Ethanol Plant 29,356,330 6 1.29 - NIPSCO Utility 23,637,610 7 1.04 - The Tire Rack Automotive Parts 21,331,282 8 0.94 - Federal-Mogul Powertrain Systems Automotive Parts 21,140,459 9 0.93 - MRES Castle Point Holdings LLC Commercial Real Estate 20,254,800 10 0.89 - Beacon Health Systems (Memorial Hospital) Healthcare - 23,015,350 2 0.76Park Jefferson Realty Apartments and Real Estate - 22,682,900 3 0.75Maple Lane Apartments Apartments and Real Estate - 15,850,600 4 0.52Mariott Hotel Hotel - 15,565,600 5 0.52Crest Net Lease, Inc. Apartments and Real Estate - 13,967,830 6 0.461st Source Bank Financial Institution - 13,763,900 7 0.46Dwellco II Limited Partnership Apartments and Real Estate - 11,953,000 8 0.40Amico Turtle Creek Apartments and Real Estate - 11,817,600 9 0.39
Total Net Assessed Value - Ten Largest Taxpayers 336,734,723$ 14.79 % 179,679,742$ 5.95 %
Total Net Assessed Value (3) 2,277,169,743$ 100.00 % 3,022,357,147$ 100.00 %
Source: (1) Crowe Horwath LLP(2) 2007 Comprehensive Annual Financial Report(3) St. Joseph County Auditor
Percentof Totalof Total
Percent

City of South Bend, Indiana
248
Statistical Section Local Option Income Tax Revenue
Last Ten Years
COUNTY ECONOMIC DEVELOPMENT INCOME TAX (CEDIT) REVENUE
Total Est South Bend South Bend Actual CityDistribution EDIT (1) County EDIT Rate of EDIT Rate of as a Percent Collections
Year Tax Rate Collections Growth Distribution Growth of Total During Year
2007 0.20% 10,558,004$ -0.49% 3,702,467$ -7.75% 35.07% 3,702,467$ 2008 0.20% 11,136,493 5.48% 3,997,997 7.98% 35.90% 3,997,997 2009 0.20% 11,938,605 7.20% 4,612,694 15.38% 38.64% 3,843,912 2010 (2) 0.40% 22,789,919 90.89% 8,321,633 80.41% 36.51% 9,090,415 2011 (3) 0.40% 18,826,685 -17.39% 7,300,866 -12.27% 38.78% 7,300,866 2012 (4) 0.40% 17,649,256 -6.25% 8,324,626 14.02% 47.17% 9,068,785 2013 0.40% 20,611,415 16.78% 8,177,352 -1.77% 39.67% 8,177,352 2014 0.40% 22,063,091 7.04% 8,796,821 7.58% 39.87% 8,796,821 2015 0.40% 23,081,049 4.61% 9,181,206 4.37% 39.78% 9,181,206 2016 0.40% 23,733,626 2.83% 9,594,602 4.50% 40.43% 9,594,602
Total $182,388,143 $72,010,264 39.48% $72,754,423
(1) This tax was first enacted as of July 1, 1995 at the rate of 0.1% of City residents' adjusted gross income. The rate was increased to 0.2% effective July 1, 1997.
(2) The CEDIT tax rate for 2010 and subsequent years was increased by City of South Bend Common Council and the Saint Joseph County Common Council.
(3) In 2011, the State of Indiana underpaid due to an accounting error.
(4) The City's 2012 CEDIT distribution included $744,159, the amount the State of Indiana underpaid the City in 2011.
Source - State of Department of Local Government Finance CEDIT Distribution Reports City of South Bend Accounting Records

City of South Bend, Indiana
249
Statistical Section Local Option Income Tax Revenue
Last Ten Years
Total South Bend South Bend Actual CityDistribution COIT County COIT Rate of COIT Rate of as a Percent Collections
Year Tax Rate (1) Distributions Growth Distribution Growth of Total During Year
2007 0.60% 16,993,346$ -20.13% 5,160,903$ -25.75% 30.37% 5,816,766$ 2008 0.60% 20,689,958 21.75% 6,382,478 23.67% 30.85% 6,192,452 2009 0.60% 26,973,887 30.37% 8,952,424 40.27% 33.19% 8,302,694 2010 0.60% 25,147,806 -6.77% 7,855,776 -12.25% 31.24% 7,648,824 2011 (2) 0.60% 19,907,430 -20.84% 6,458,586 -17.79% 32.44% 7,097,462 2012 (3) 0.60% 22,536,457 13.21% 7,691,991 19.10% 34.13% 8,610,742 2013 0.60% 22,923,958 1.72% 7,846,939 2.01% 34.23% 7,846,939 2014 0.60% 25,275,541 10.26% 8,645,811 10.18% 34.21% 8,645,811 2015 0.60% 26,435,155 4.59% 8,859,912 2.48% 33.52% 8,859,912 2016 0.60% 27,898,910 5.54% 9,454,023 6.71% 33.89% 9,454,023
Total $234,782,448 $77,308,843 32.93% $78,475,625
(1) This tax was first enacted as of July 1, 1997 at the rate of 0.2% of City residents' adjusted gross income. The COIT rate increased 0.1% each year until it reached 0.6% as of July 1, 2001. The above collections/distribution amounts are net of the additional homestead credits that accompanied the passage of this income tax.
(2) In 2011, the State of Indiana underpaid due to an accounting error.
(3) The City's 2012 COIT distribution included $918,751, the amount the State of Indiana underpaid the City in 2011.
Source - State of Indiana Department of Local Government Finance COIT Distribution Reports City of South Bend Accounting Records
COUNTY OPTION INCOME TAX (COIT) REVENUE

City of South Bend, Indiana
250
Statistical Section Local Option Income Tax Revenue
Last Ten Years
PUBLIC SAFETY LOCAL OPTION INCOME TAX REVENUE
Total South Bend South Bend Actual CityDistribution PS LOIT County LOIT Rate of LOIT Rate of as a Percent Collections
Year Tax Rate Distributions Growth Distribution Growth of Total During Year
2010 (1) 0.25% 13,846,267$ 100.00% 6,078,454$ 100.00% 43.90% 6,078,454$ 2011 (2) 0.25% 11,371,882 -17.87% 5,293,619 -12.91% 46.55% 5,293,619 2012 (3) 0.25% 10,644,975 -6.39% 6,056,334 14.41% 56.89% 6,605,601 2013 0.25% 12,457,864 17.03% 5,892,356 -2.71% 47.30% 5,892,386 2014 0.25% 13,476,753 8.18% 6,380,029 8.28% 47.34% 6,380,029 2015 0.25% 13,734,382 1.91% 6,466,190 1.35% 47.08% 6,466,190 2016 0.25% 14,237,777 3.67% 6,791,160 5.03% 47.70% 6,791,160
Total $89,769,900 $42,958,142 47.85% $43,507,439
(1) This tax was effective in October 2009 at the rate of 0.25% of City residents' adjusted gross income. The measure is being used to support the Public Safety operations consisting of the Police Department and the Fire Department, to keep the staffing levels at their full complement.
(2) In 2011, the State of Indiana underpaid due to an accounting error.
(3) The City's 2012 PS LOIT distribution included $549,267, the amount the State of Indiana underpaid the City in 2011.
Source - State of Indiana Department of Local Government Finance LOIT Public Safety Distribution Reports City of South Bend Accounting Records

City of South Bend, Indiana
251
Statistical Section Total County Income Tax Distributions by Taxing Unit
Last Ten Years
Unit of Government 2007 2008 2009 2010 2011 2012 2013 2014 2015 2016
Total County Certified Distribution 30,859,812$ 32,574,042$ 34,801,729$ 33,231,041$ 27,292,516$ 29,898,874$ 29,898,874$ 32,344,207$ 32,962,518$ 34,170,664$ Less: Homestead Credit (1) (13,866,466) (11,884,084) (7,827,842) (8,083,235) (7,385,086) (7,362,417) (6,974,918) (7,068,666) (6,527,363) (6,271,754)
Total Distributive Shares 16,993,346$ 20,689,958$ 26,973,887$ 25,147,806$ 19,907,430$ 22,536,457$ 22,923,956$ 25,275,541$ 26,435,155$ 27,898,910$
Distributive Shares/Total County Distribution 55.07% 63.52% 77.51% 75.68% 72.94% 75.38% 76.67% 78.15% 80.20% 81.65%
AmountSt. Joseph County 7,376,623$ 8,825,206$ 10,358,300$ 9,819,576$ 7,383,180$ 7,986,750$ 8,460,192$ 9,314,201$ 9,611,416$ 9,983,016$ Townships 648,364 820,241 1,180,913 1,168,352 1,054,827 1,244,481 954,332 1,069,408 1,541,211 1,695,662 City of South Bend - Civil City 5,077,450 6,266,381 8,748,506 7,677,730 6,304,224 7,511,976 7,711,609 8,483,839 8,754,940 9,275,956 City of South Bend - Redevelopment 83,453 116,097 203,918 178,046 154,363 184,790 135,330 161,972 104,972 178,067 Other Cities & Towns 1,982,192 2,367,929 3,592,330 3,462,786 2,667,400 3,077,335 3,137,086 3,378,481 3,508,422 3,683,131 Libraries 1,285,029 1,646,819 2,007,809 2,042,942 1,762,365 1,879,376 1,849,933 2,126,185 2,144,046 2,279,241 Special Districts 540,235 647,285 882,111 798,374 581,071 651,749 675,474 741,455 770,148 803,837
Total 16,993,346$ 20,689,958$ 26,973,887$ 25,147,806$ 19,907,430$ 22,536,457$ 22,923,956$ 25,275,541$ 26,435,155$ 27,898,910$
Percentage of DistributionSt. Joseph County 43.41% 42.65% 38.40% 39.05% 37.09% 35.44% 36.91% 36.85% 36.36% 35.78%Townships 3.82% 3.96% 4.38% 4.65% 5.30% 5.52% 4.16% 4.23% 5.83% 6.08%City of South Bend - Civil City 29.88% 30.29% 32.43% 30.53% 31.67% 33.33% 33.64% 33.57% 33.12% 33.25%City of South Bend - Redevelopment 0.49% 0.56% 0.76% 0.71% 0.78% 0.82% 0.59% 0.64% 0.40% 0.64%Other Cities & Towns 11.66% 11.44% 13.32% 13.77% 13.40% 13.65% 13.68% 13.37% 13.27% 13.20%Libraries 7.56% 7.96% 7.44% 8.12% 8.85% 8.34% 8.07% 8.41% 8.11% 8.17%Special Districts 3.18% 3.14% 3.27% 3.17% 2.91% 2.90% 2.95% 2.93% 2.91% 2.88%
Total 100.00% 100.00% 100.00% 100.00% 100.00% 100.00% 100.00% 100.00% 100.00% 100.00%
(1) A portion of the county option income tax is used for property tax relief through homestead credits for residential property owners.
Source - State of Indiana Department of Local Government Finance COIT Distribution Reports

City of South Bend, Indiana
252
Statistical Section Ten Largest Water Customers
December 31, 2016
Percentage ofTotal Water
2016 Operating UsageName Revenue Revenue CCF*
South Bend Community School Corporation 99,699$ 0.66% 85,855Memorial Hospital of South Bend 95,161 0.63% 105,981Irish Hills Apartments 68,865 0.46% 58,931Honeywell Aerospace Co 62,865 0.42% 66,790Indiana University South Bend 41,930 0.28% 47,923Indian Springs Apartments and Townhouses 40,994 0.27% 42,986Castle Point Apartments 39,765 0.26% 37,780Aramark Uniform Services 39,186 0.26% 50,154Laurnenz Place LLC 37,550 0.25% 47,820Holy Cross Care Services Inc 37,395 0.25% 35,512
Total of Ten Largest Water Customers 563,410$ 3.73%
Total for Operating Revenue for Water Works 15,091,372$ 100.00%
*Hundreds of Cubic Feet
Source: City of South Bend Water Utility

City of South Bend, Indiana
253
Statistical Section Ten Largest Sewage Works Customers
December 31, 2016
Percentage ofHeavy Total Water
Metered Demand Total Sewer UsageName Revenue Surcharge Revenue Revenue CCF*
I/NTEK Plant 2,281,926$ -$ 2,281,926$ 5.84% 799,248University of Notre Dame 1,760,269 - 1,760,269 4.51% 711,576Noble Americas Ethanol 782,598 - 782,598 2.00% 251,551Memorial Hospital 359,863 - 359,863 0.92% 97,734Honeywell Aerospace Co 291,165 - 291,165 0.75% 63,455Laurenz Place LLC 184,609 - 184,609 0.47% 47,760South Bend Community School Corp 171,507 - 171,507 0.44% 37,780Castle Point Apartments 170,864 - 170,864 0.44% 42,810Aramark Uniform Services 169,295 - 169,295 0.43% 50,154St. Joseph County Maintenance Department 168,015 - 168,015 0.43% 45,152
Total of Ten Largest Sewer Customers 6,340,111$ -$ 6,340,111$ 16.23%
Total Operating Revenue for Wastewater 39,061,562$
*Hundreds of Cubic Feet
Source: City of South Bend Sewage Works Utility

City of South Bend, Indiana
254
Statistical Section Gasoline Tax Collections - Cash Basis
Last Ten Fiscal Years
LR&S MVH Total Gas %Year Fund Fund Tax Change
2007 1,171,732$ 3,243,818$ 4,415,550$ -2.50%2008 1,104,260 3,016,198 4,120,458 -6.68%2009 1,045,477 2,954,086 3,999,563 -2.93%2010 1,064,149 2,922,165 3,986,314 -0.33%2011 1,030,958 2,951,072 3,982,030 -0.11%2012 1,022,508 2,786,592 3,809,100 -4.34%2013 1,001,871 3,006,122 4,007,993 5.22%2014 1,017,383 3,682,329 4,699,712 17.26%2015 1,045,516 3,679,371 4,724,887 0.54%2016 1,046,446 3,640,561 4,687,007 -0.80%
Source: City Accounting Records
Distributions of gas tax revenue are made monthly by the Indiana Department of Revenue to the LocalRoad and Street (LR&S) and Motor Vehicle Highway (MVH) funds for use in construction and maintenance of streets and highways. Distributions are based on a complex formula developed by the State of Indiana.The formula takes into account population, road and street mileage and other factors. Gas tax revenuewas declining in prior years due to the economy and more fuel efficient vehicles, however, due to animprovement in the economy and temporary increase in state funding for two years, total gas taxincreased in 2014. Gas tax remained consistent in 2016. Legislation passed by the Indiana GeneralAssembly in 2017 will increase gas tax collections in the LR&S and MVH funds by 49% and 40%respectively.
$0$500,000
$1,000,000$1,500,000$2,000,000$2,500,000$3,000,000$3,500,000$4,000,000$4,500,000$5,000,000
Gasoline Tax
LR&SFundMVH Fund
Total GasTax

City of South Bend, Indiana
255
Statistical Section Wheel and Excise Surtax Collections - Cash Basis
Last Ten Years
LR&S MVH Total Wheel %Year Fund Fund Tax Change
2007 1,966,003$ -$ 1,966,003$ 6.27%2008 - 2,040,751 2,040,751 3.80%2009 - 1,893,982 1,893,982 -7.19%2010 - 1,975,397 1,975,397 4.30%2011 - 1,863,283 1,863,283 -5.68%2012 - 1,795,538 1,795,538 -3.64%2013 - 2,045,213 2,045,213 13.91%2014 - 1,637,707 1,637,707 -19.92%2015 - 2,135,441 2,135,441 30.39%2016 - 2,006,547 2,006,547 -6.04%
Source: City of South Bend Accounting Records
Effective January 1, 2004, St. Joseph County enacted a wheel tax and annual license excisesurtax as allowed by Indiana State law to provide additional funding for road maintenanceand repair. Indiana State law allows an annual wheel tax of $5-40 per vehicle and an annuallicense excise surtax of 2-10%. St. Joseph County has enacted a $25 County Excisesurtax. The tax applies to all passenger cars, trucks less than 11,000 pounds, buses,tractors and motorcycles registered in the County. (Other rates apply to recreationalvehicles, semitrailers and trucks exceeding 11,000 pounds.) The tax is collected by theIndiana Bureau of Motor Vehicles, remitted to the County and distributed monthly to thelocal units based on population and road miles.
Increase in the 2015 wheel tax due to 13 months of taxes being collected during the year(September 2014 - September 2015). Prior year tax collections were several monthsbehind.
During 2004-2007, the City of South Bend deposited the wheel tax and excise surtax in itsLocal Road and Street (LR&S) fund. During 2008 and thereafter, the City will deposit thetaxes in its Motor Vehicle Highway (MVH) fund, as required by the Indiana State Board ofAccounts.

City of South Bend, Indiana
256
Statistical Section Hotel/Motel Tax Revenue - Cash Basis - City Distributions
Last Ten Fiscal Years
------------------------------------Paid to City of South Bend----------------------------------- -------------------------Direct Payments----------------------- Century Professional Cumulative 2008 Subtotal: 1992 Century 2008 Other
Center Sports Develop. Capital Impr. Century Center Paid to City Center Century Center Century Center Total Hotel/ %Year Fund Fund Fund Bonds of South Bend Bonds Bonds Projects Motel Tax Change
2007 1,361,263$ 507,585$ 150,000$ -$ 2,018,848$ 354,916$ -$ 136,330$ 2,510,094$ -3.18%2008 1,497,390 589,620 150,000 - 2,237,010 356,918 - 694,135 3,288,063 30.99%2009 1,347,651 530,137 150,000 - 2,027,788 - 198,500 265,258 2,491,546 -24.22%2010 1,313,152 521,800 150,000 399,000 2,383,952 - - 97,000 2,480,952 -0.43%2011 1,313,436 494,325 150,000 400,000 2,357,761 - - - 2,357,761 -4.97%2012 1,313,436 489,152 150,000 398,000 2,350,588 - - - 2,350,588 -0.30%2013 1,313,436 - 150,000 398,500 1,861,936 - - - 1,861,936 -20.79%2014 1,313,450 - 150,000 400,000 1,863,450 - - 457,739 2,321,189 24.67%2015 1,313,450 - 150,000 492,000 1,955,450 - - 976,855 2,932,305 26.33%2016 1,313,450 - 150,000 396,000 1,859,450 - - 713,601 2,573,051 -12.25%
Source: City of South Bend Accounting Records and Saint Joseph County Auditor's Office
The hotel/motel tax fund also supports other activities not included in the City of South Bend's financial statements such as the South Bend/Mishawaka Convention and Visitors Bureau. The total distribution ofhotel/motel tax during 2016 to all organizations was $4,189,152. The cash balance in the County Hotel/Motel Tax Fund was $4,630,812 at December 31, 2016.
The hotel/motel tax was enacted in 1973 and the current tax rate is 6%. The tax is accounted for in a fund of the Saint Joseph County government and is administered by the 11 member Saint Joseph County Boardof Managers for Hotel-Motel Tax. Appointments to the Board of Managers are made by the Mayors of South Bend and Mishawaka and the Saint Joseph County Commissioners.
Proceeds from the hotel/motel tax fund are budgeted and distributed annually to important economic development and tourism projects in the County. South Bend receives distributions for the operations,maintenance and debt service of Century Center (convention center), the Cumulative Capital Development Fund (used for repayment of 1994 Century Center Bonds), repayment of a 2008 Century Center Bondand other capital projects. Hotel/Motel tax will also be used to pay the 2015 Energy Conservation Bond which was issued by the City for the energy improvements made at the Century Center in 2015.

City of South Bend, Indiana
257
Statistical Section Professional Sports Development (PSDA) Tax - Cash Basis
Last Ten Fiscal Years
Total PSDA %Year Tax Change
2007 387,813$ 4.66%2008 396,873 2.34%2009 617,304 55.54%2010 640,760 3.80%2011 409,020 -36.17%2012 721,763 76.46%2013 597,111 -17.27%2014 551,252 -7.68%2015 628,261 13.97%2016 760,390 21.03%
Source: City of South Bend Accounting Records
PSDA tax revenue increased in 2009 primarily due to the increase in the State of Indiana sales tax rate from 6% to 7% and the increase in local option income taxesfrom .8% to 1.75% as a consequence of property tax reform. PSDA tax revenue decreased in 2011 due to delays in payments in amounts owed by the State until2012. The decrease PSDA tax revenues in 2014 were due to a delay in payments from the state whereas the increase in 2015 is due to 12 months of receipts beingdeposited.
In prior years, PSDA tax revenue has been used to fund the College Football Hall of Fame Capital Fund. PSDA tax revenue is pledged to pay debt service on 2010Coveleski Stadium Taxable Revenue bonds in the amount of $4,980,000 issued on December 23, 2010. The bond proceeds were used to make certain capitalimprovements to the City-owned facility. The operations of the minor league baseball team (South Bend Cubs) in the stadium accounts for the majority of PSDA taxrevenue earned each year.
The Professional Sports Development Area (PSDA) tax is a combination of Indiana state income tax withholding, local income tax withholding and sales tax withholdingfrom businesses and employees in South Bend's designated PSDA area, which includes the College Football Hall of Fame, Century Center, Coveleski Stadium, MorrisPerforming Arts Center, Palais Royale Ballroom and Studebaker National Museum. South Bend's PSDA area was formed on November 3, 1997 and expires onDecember 31, 2027. PSDA capture of state sales and income taxes ends in 2018.
The PSDA taxes are collected by the Indiana Department of Revenue and are remitted on a monthly basis to Saint Joseph County which issues a check to the City ofSouth Bend. There are currently four professional sports development areas in the State--South Bend, Indianapolis/Marion County, Evansville and Ft. Wayne.
$-
$100,000
$200,000
$300,000
$400,000
$500,000
$600,000
$700,000
$800,000
2007 2008 2009 2010 2011 2012 2013 2014 2015 2016
Dol
lars
Year
PSDA Tax Collections - Ten Year Trend

City of South Bend, Indiana
258
Statistical Section Cable Television Franchise Fee Collections - Cash Basis
Last Ten Fiscal Years
Total %Year Comcast AT&T Franchise Fees Change
2007 692,548$ -$ 692,548$ -12.35%2008 694,387 - 694,387 0.27%2009 702,048 41,043 743,091 7.01%2010 817,023 131,263 948,286 27.61%2011 677,949 176,586 854,535 -9.89%2012 691,586 192,621 884,207 3.47%2013 736,071 191,529 927,600 4.91%2014 717,156 238,309 955,465 3.00%2015 723,676 281,873 1,005,549 5.24%2016 749,565 256,611 1,006,176 0.06%
Source: City of South Bend Accounting Records
Pursuant to Indiana State law, the City of South Bend receives video franchise fees in theamount of 5% of gross revenue for cable operations in the City. The payments are made tothe City on a quarterly basis. The franchise agreement with Comcast was effective October19, 1998 and the franchise agreement with AT&T was effective January 1, 2009.
The video franchise fee revenue is deposited in the General Fund and is used for generaloperating costs. A portion of the proceeds ($43,000) are spent on support of the local publicaccess channel.
Under Indiana State law, the City is required to submit an Annual Franchise Fee Report (StateForm 55122) summarizing franchise fee revenue received during the year and the purposefor which the revenue was expended. The report must be file with the Indiana UtilityRegulatory Commission by March 1st of the following year.

Debt Capacity
These schedules contain information to help the reader assess the affordability of the 's current levels of outstanding debt and the 's ability to issue additional debt in the future.

City of South Bend, Indiana
259
Statistical Section Computation of Legal Debt Margin
December 31, 2016
Civil City
Net Assessed Valuation (2015 pay 2016) of Taxable Property in South Bend 2,277,169,743$
Debt limit: 2% of one third thereof 15,181,132
Less Bonds subject to limitation:County Economic Development Income Tax Refunding Revenue Bonds, Series 2006 A (225,000)County Economic Development Income Tax Refunding Revenue Bonds, Series 2006 B (205,000)Economic Development Income Tax Bonds of 2015(Parks Bond) (5,405,000)
Issuance Margin 9,346,132$
Percentage of Debt to Debt Limit 38.44%
Redevelopment District
Net Assessed Valuation (2015 pay 2016) of Taxable Property in South Bend 2,277,169,743$
Debt limit: 2% of one third thereof 15,181,132
Less Bonds subject to limitation:Special Taxing District Bonds of 2014 (2,210,000)
Issuance Margin 12,971,132$
Percentage of Debt to Debt Limit 14.56%
A 2% debt limit is established by the Constitution of the State of Indiana. This limit is established forgeneral obligation bonds, Economic Development Income Tax revenue bonds, tax revenue notes and othertypes of indebtedness. This limitation does not include revenue bonds payable from governmental funds(excluding EDIT bonds) shown in the general long term debt account group. Indiana law allows thecreation of separate municipal corporations to provide vital governmental functions. Each of thesemunicipal corporations (including the Redevelopment Authority and Redevelopment Commission) has itsown 2% debt limit, even if they have the same or similar boundaries.

City of South Bend, Indiana
260
Statistical Section Legal Debt Margin Information
Last Ten Fiscal Years
2007 2008 2009 2010 2011 2012 2013 2014 2015 2016Civil City
Debt Limit (1) $20,149,048 $19,840,538 $17,792,583 $16,356,704 $15,495,323 $15,599,467 $15,579,379 $14,731,511 $15,068,462 $15,181,132
Total Net Debt Applicable To Limit 6,685,000 6,105,000 5,500,000 9,850,000 8,910,000 7,650,000 6,335,000 4,970,000 7,270,000 5,835,000
Debt Margin 13,464,048 13,735,538 12,292,583 6,506,704 6,585,323 7,949,467 9,244,379 9,761,511 7,798,462 9,346,132
Percentage of Debt Limit 33.18% 30.77% 30.91% 60.22% 57.50% 49.04% 40.66% 33.74% 48.25% 38.44%
Redevelopment District
Debt Limit (1) $20,149,048 $19,840,538 $17,792,583 $16,356,704 $15,495,323 $15,599,467 $15,579,379 $14,731,511 $15,068,462 $15,181,132
Total Net Debt Applicable To Limit 5,580,000 5,300,000 5,010,000 4,715,000 4,085,000 4,085,001 3,405,000 3,010,000 2,615,000 2,210,000
Debt Margin 14,569,048 14,540,538 12,782,583 11,641,704 11,410,323 11,514,466 12,174,379 11,721,511 12,453,462 12,971,132
Percentage of Debt Limit 27.69% 26.71% 28.16% 28.83% 26.36% 26.19% 21.86% 20.43% 17.35% 14.56%
(1) A 2% of net assessed value debt limit has been established by the Constitution of the State of Indiana for certain type of debt including general obligation bonds, Economic Development Income Tax bonds and tax revenue notes. This limitation does not apply to revenue bonds payable from governmental or proprietary funds.

City of South Bend, Indiana
261
Statistical Section Ratios of Outstanding Debt by Type
Last Ten Fiscal Years
South Bend South BendGeneral Total Debt Estimated Debt
Fiscal Obligation Revenue Mortgage Notes/Loans Capital Revenue Mortgage Notes/Loans Capital Primary Estimated Per Personal Percent ofYear Bonds Bonds Bonds Payable Leases Bonds Bonds Payable Leases Government Population (1) Capita Income (2) Income
2007 -$ 78,570,000$ 25,957,839$ 7,900,658$ 7,695,487$ 73,145,000$ 926,805$ 18,380,491$ 1,127,394$ 213,703,674$ 104,069 2,053$ 3,511,183,991$ 6.09%2008 - 115,240,000 24,534,464 9,543,790 7,388,443 67,535,000 878,835 17,031,649 628,427 242,780,608 104,905 2,314 3,709,126,085 6.55%2009 - 113,975,000 23,061,148 8,470,308 6,214,206 68,225,000 829,020 16,145,358 893,233 237,813,273 106,192 2,239 3,679,658,992 6.46%2010 - 111,510,000 21,117,295 6,323,199 5,299,341 72,655,000 717,705 16,755,369 799,402 235,177,311 101,168 2,325 3,505,572,368 6.71%2011 - 101,472,431 19,724,490 4,431,871 7,510,749 88,655,000 660,510 15,542,372 1,077,642 239,075,065 101,168 2,363 3,371,120,096 7.09%2012 - 96,410,000 17,883,530 4,953,639 8,336,120 117,650,000 601,470 13,848,901 3,641,362 263,325,022 101,168 2,603 3,371,120,096 7.81%2013 - 90,172,826 23,079,781 3,030,554 8,777,238 118,121,963 546,973 4,121,010 3,831,933 251,682,278 101,168 2,488 3,371,120,096 7.47%2014 - 84,862,512 21,331,548 1,617,491 8,481,375 111,209,874 480,604 3,794,664 3,307,802 235,085,870 101,168 2,324 3,371,120,096 6.97%2015 - 107,815,890 13,904,973 4,831,752 8,491,407 102,871,921 5,851,565 3,458,899 4,411,042 251,637,449 101,168 2,487 3,371,120,096 7.46%2016 - 99,040,132 12,091,550 4,647,381 10,929,075 95,477,047 5,556,865 2,582,205 6,585,123 236,909,378 101,168 2,342 3,492,622,864 6.78%
Percent of Total Debt 0% 41.81% 5.10% 1.96% 4.61% 40.30% 2.35% 1.09% 2.78% 100.00%
Sources: City of South Bend Comprehensive Annual Financial Reports(1) U.S. Census Bureau, 2010 Census information (http://factfinder.census.gov/). 2016 information not available.(2) City of South Bend estimated personal income is computed as estimated City population x City of South Bend Median Household Income from U.S. Census Bureau, 2011-2015 American Community Survey 5-Year Estimates (http://factfinder.census.gov/)
Governmental Activities Business-Type Activities

City of South Bend, Indiana
262
Statistical Section Computation of Direct and Overlapping Debt
December 31, 2016
AmountGross Applicable to Debt PerDebt South Bend Capita
Direct Debt:
City of South Bend General Obligation Bonds Revenue Bonds - Governmental Activities 99,040,132$ 100.00 % 99,040,132$ Mortgage Bonds - Governmental Activities 12,091,550 100.00 12,091,550 Notes Payable - Governmental Activities 4,647,381 100.00 4,647,381 Capital Leases - Governmental Activities 10,929,075 100.00 10,929,075
Total Direct Debt and Lease Obligation Debt 126,708,138$ 1,252$ 5.56 % 3.63 %
Overlapping Debt (1)
South Bend Community School Corporation 114,089,291$ 52.85 % 60,296,190$ St. Joseph County Public Library 4,015,000 49.51 1,987,827 St. Joseph County Airport Authority 12,080,000 28.17 3,402,936 St. Joseph County 30,465,000 28.17 8,581,991 Penn-Harris-Madison School Corporation 36,675,073 2.68 982,892 Mishawaka-Penn-Harris Public Library 2,475,000 2.19 54,203
Total Overlapping and Underlying Direct Debt and Lease Obligations 75,306,038$ 744$ 3.31 % 2.16 %
Total Direct Debt and Lease Obligation Debt and Overlapping and 202,014,176$ 1,997$ 8.87 % 5.78 % Underlying Direct Debt and Lease Obligations
Ratio Factors
Net Assessed Valuation (2015 payable 2016) 2,277,169,743Population - 2010 Census 101,168South Bend Median Household Income 2015 34,523Estimated South Bend Total Personal Income (2 x 3) 3,492,622,864
(1) Overlapping debt percentages are based on the net assessed value of South Bend properties in proportion to the total net assessed value.(2) U.S. Census Bureau, 2010 Census information (http://factfinder.census.gov/). 2016 information not available.(3) U.S. Census Bureau, 2011-2015 American Community Survey 5-Year Estimates (http://factfinder.census.gov/)
(3)(2)
South BendApplicable toPercentage
IncomePersonal
Ratio of Debt/
ValueNet AssessedRatio of Debt/

City of South Bend, Indiana
263
Statistical Section Ratio of Annual Debt Service Expenditures for General Obligation Bonded Debt
to Total Governmental Fund Expenditures Last Ten Years
Total Ratio of Debt ServiceFiscal Total Debt Governmental Fund To Governmental FundYear Principal Interest Service Expenditures Expenditures
2007 -$ -$ -$ 128,209,220$ 0.00%2008 - - - 138,022,795 0.00%2009 - - - 142,962,710 0.00%2010 - - - 150,758,014 0.00%2011 - - - 172,397,679 0.00%2012 - - - 162,460,000 0.00%2013 - - - 152,889,475 0.00%2014 - - - 154,300,097 0.00%2015 - - - 172,658,733 0.00%2016 - - - 170,976,084 0.00%
The City of South Bend has no General Obligation bonded debt.
Source - City of South Bend Comprehensive Annual Financial Reports

City of South Bend, Indiana
264
Statistical Section Ratio of Net General Bonded Debt to Net Assessed Valuation and Net Bonded Debt Per Capita
Last Ten Years
Percent of NetGross Debt Service Net GO Bonded Debt Net GO
Tax Year/ Net Assessed General Obligation Monies General Obligation To Net Assessed Bonded DebtCollection Year Population (1) Value Bonded Debt Available Bonded Debt Value Per Capita
2006/2007 104,069 3,022,157,147$ -$ -$ -$ 0.00% -$ 2007/2008 104,905 2,976,080,798 - - - 0.00% - 2008/2009 106,192 2,668,887,419 - - - 0.00% - 2009/2010 101,168 2,453,505,573 - - - 0.00% - 2010/2011 101,168 2,324,451,862 - - - 0.00% - 2011/2012 101,168 2,380,874,608 - - - 0.00% - 2012/2013 101,168 2,371,087,697 - - - 0.00% - 2013/2014 101,168 2,209,726,672 - - - 0.00% - 2014/2015 101,168 2,260,269,318 - - - 0.00% - 2015/2016 101,168 2,277,169,743 - - - 0.00% -
The City of South Bend has no General Obligation bonded debt.
(1) U.S. Census Bureau, 2010 Census information (http://factfinder.census.gov/). 2016 information not available.

City of South Bend, Indiana
265
Statistical Section St. Joseph County Hotel/Motel Tax Board
Statement of Estimated Cash Flow and Debt Service Coverage
Projected 2011 B 2013 2015 Hotel/Motel Century Center Century Center Century Center Estimated
Tax Refunding Refunding Energy Conservation Total Annual Excess EstimatedYear Revenues Bonds (1) Bonds Bonds Debt Service Funds Coverage
2017 4,797,500$ 150,000$ 394,000$ 46,606$ 590,606$ 4,206,894$ 812%2018 4,845,475 - 395,000 162,702 557,702 4,287,773 869%2019 4,893,930 - 396,500 280,090 676,590 4,217,340 723%2020 4,942,869 - 397,000 285,614 682,614 4,260,255 724%2021 4,992,298 - 396,500 291,274 687,774 4,304,524 726%2022 5,042,221 - 395,000 297,175 692,175 4,350,046 728%2023 5,092,643 - 394,500 303,221 697,721 4,394,922 730%2024 5,143,569 - 396,000 309,315 705,315 4,438,254 729%2025 5,195,005 - 283,500 315,561 599,061 4,595,944 867%2026 5,246,955 - 84,500 321,964 406,464 4,840,491 1291%2027 5,299,425 - - 328,529 328,529 4,970,896 1613%2028 5,352,419 - - 335,259 335,259 5,017,160 1597%2029 5,405,943 - - 342,159 342,159 5,063,784 1580%2030 5,460,003 - - 349,334 349,334 5,110,669 1563%2031 5,514,603 - - 176,508 176,508 5,338,095 3124%2032 5,569,749 - - - - 5,569,749 -
Total 82,794,605$ 150,000$ 3,532,500$ 4,145,311$ 7,827,811$ 74,966,794$
Source: Saint Joseph County Hotel/Motel Tax Board financial reports City of South Bend Debt Schedules
(1) $150,000 paid from hotel/motel tax revenue. The balance paid from City of South Bend revenue sources.

City of South Bend, Indiana
266
Statistical Section Schedule of Revenue Bond Coverage
Water Utility Bonds Last Ten Years
Gross Net Revenue Debt Service RequirementsOperating Operating Available for Debt
Year Revenue Expenses (1) Debt Service Principal Interest Total Coverage
2007 13,748,213$ 8,296,075$ 5,452,138$ 2,764,265$ 1,015,524$ 3,779,789$ 144%2008 13,343,210 8,528,933 4,814,277 2,908,014 888,199 3,796,213 127%2009 13,471,890 8,838,405 4,633,485 2,481,871 754,108 3,235,979 143%2010 13,513,995 8,560,390 4,953,605 2,605,840 937,293 3,543,133 140%2011 14,032,074 9,301,552 4,730,522 2,729,925 823,265 3,553,190 133%2012 14,190,243 9,021,274 5,168,969 821,847 823,944 1,645,791 314%2013 13,783,701 10,665,913 3,117,788 1,241,768 809,673 2,051,441 152%2014 14,373,176 10,105,709 4,267,467 1,251,588 769,025 2,020,613 211%2015 14,204,285 10,651,321 3,552,964 1,319,285 732,394 2,051,679 173%2016 15,091,372 12,081,699 3,009,673 977,113 623,226 1,600,339 188%
(1) Operating expenses exclude depreciation.
Operating revenue used to make debt service payments is obtained primarily through monthly user charges to water customers.
Source - City of South Bend Comprehensive Annual Financial Report.

City of South Bend, Indiana
267
Statistical Section Schedule of Revenue Bond Coverage
Wastewater Utility Bonds Last Ten Years
Gross Net Revenue Debt Service RequirementsOperating Operating Available for Debt
Year Revenue Expenses (1) Debt Service Principal Interest Total Coverage
2007 20,685,490$ 10,389,691$ 10,295,799$ 2,863,218$ 1,364,272$ 4,227,490$ 244%2008 (2) 22,941,734 14,079,734 8,862,000 3,701,524 2,647,324 6,348,848 140%2009 24,313,147 17,504,825 6,808,322 3,130,000 2,557,940 5,687,940 120%2010 25,444,404 12,193,363 13,251,041 3,385,205 2,314,275 5,699,480 232%2011 29,023,547 14,869,660 14,153,887 3,867,584 2,737,027 6,604,611 214%2012 30,963,483 13,777,728 17,185,755 4,736,450 3,489,057 8,225,507 209%2013 31,926,078 11,526,554 20,399,524 5,080,425 3,354,156 8,434,581 242%2014 34,009,117 14,313,967 19,695,150 6,320,626 3,376,045 9,696,671 203%2015 (3) 36,635,501 13,557,598 23,077,903 4,691,336 3,419,351 8,110,687 285%2016 39,061,562 16,920,370 22,141,192 7,522,453 2,342,132 9,864,586 224%
(1) Operating expenses exclude depreciation.(2) Two large Sewage Works revenue bonds were issued during 2007 with principal and interests payments beginning in 2008. These bonds are part of the City of South Bend's long term combined sewer overflow (CSO) control plan.(3) Sewer bonds were refunded in 2015 and the principal repayments are not included in the 2015 principal total.
Operating revenue used to make debt service payments is obtained primarily through monthly user charges to sewer customers.
Source - City of South Bend Comprehensive Annual Financial Report

City of South Bend, Indiana
268
Statistical Section Municipal Sewage Works
2007 2008 2009 2010 2011 2012 2013 2014 2015 2016
Capacity (MGD) 48 48 48 48 48 48 48 48 48 48 Average Daily Flow 32.45 37.80 38.42 30.86 35.80 31.77 30.69 32.00 30.20 43.87 Peak Flow 60.30 75.00 68.80 62.00 72.50 63.70 62.50 68.50 57.70 67.80 Annual Flow (MG) 11,845 13,835 14,024 11,264 13,068 11,596 11,203 11,677 11,023 16,014
Number of Customers - South Bend Municipal Sewage WorksTotal Number
Year of Customers2007 37,018 2008 38,282 2009 36,664 2010 38,455 2011 39,027 2012 39,068 2013 39,322 2014 39,461 2015 39,763 2016 40,073
Source: City of South Bend Environmental Services Department
Annual Wastewater Flow Data

City of South Bend, Indiana
269
Statistical Section Statement of City-Owned Utility Debt
December 31, 2016
Statement of City-Owned Utility Debt
South Bend Municipal Sewage WorksSewage Works State Revolving Fund (SRF) Loan of 2009 2,249,643$ Sewage Works Revenue Bonds of 2010 7,145,000 Sewage Works Revenue Bonds of 2011 17,295,000 Sewage Works Revenue Bonds of 2012 20,890,000 Sewage Works Revenue Bonds of 2013 A 8,050,000 Sewage Works Refunding Revenue Bonds of 2015 24,965,000
Total Sewage Utility Debt 80,594,643$
South Bend Municipal WaterworksWaterworks Revenue Bonds of 2009, Series A
State Revolving Fund (SRF) Loan 332,562$ Waterworks Revenue Bonds of 2009, Series B
Indiana Bond Bank 4,325,000 Waterworks Revenue Bonds of 2012 2,380,000 Waterworks Revenue Refunding Bonds of 2012, Series B 6,925,000 Waterworks Refuding Bonds of 2016 3,300,000
Total Water Utility Debt 17,262,562$
Total Utility Debt 97,857,205$
Source: City of South Bend Finance Department

City of South Bend, Indiana
270
Statistical Section Estimates Debt Service Coverage Calculation
of Sewage Works December 31, 2016
Operating Revenues 39,061,562$ Less: Operation and Maintenance Expenses (Net of Depreciation) (16,920,370)
Net Revenues Available for Debt Service 22,141,192
Estimated Combined Annual Debt Service 9,864,586
Coverage - $ 12,276,606$
Coverage - % 224%

City of South Bend, Indiana
271
Statistical Section Estimate Debt Service Coverage Calculation
of Water Utility December 31, 2016
Operating Revenues 15,091,372$ Less: Operation and Maintenance Expenses (Net of Depreciation) (12,081,699)
Net Revenues Available for Debt Service 3,009,673
Estimated Combined Maximum Annual Debt Service 1,600,339
Coverage - $ 1,409,334$
Coverage - % 188%

City of South Bend, Indiana
272
Statistical Section Projected City of South Bend COIT Revenue
.6% COIT Tax Rate Levy is used to Distribute COIT
ProjectedSt. Joseph County Projected COIT Amount
Year of Projected COIT Available ForCollection Distribution Debt Service
2017 31,321,416$ 33.39% 10,459,265$ 2018 31,947,844 33.39% 10,668,4502019 32,586,801 33.39% 10,881,8192020 33,238,537 33.39% 11,099,4562021 33,903,308 33.39% 11,321,4452022 34,581,374 33.39% 11,547,8742023 35,273,002 33.39% 11,778,8312024 35,978,462 33.39% 12,014,4082025 36,698,031 33.39% 12,254,6962026 37,431,992 33.39% 12,499,790
Total 114,526,034$
Source: Department of Local Government Finance (DLGF)
Estimated 2% increase to COIT distributions due to improving economic conditions. Starting in 2017, COIT is part of the new Local Income Tax (LIT) category.

City of South Bend, Indiana
273
Statistical Section Projected City of South Bend CEDIT Revenue
.4% CEDIT Tax Rate Levy is used to Distribute CEDIT
ProjectedSt. Joseph County CEDIT Amount
Year of Projected Projected Available ForCollection Distribution CEDIT Debt Service
2017 26,149,949$ 40.54% 10,600,122$ 2018 26,672,948 40.54% 10,812,1242019 27,206,407 40.54% 11,028,3672020 27,750,535 40.54% 11,248,9342021 28,305,546 40.54% 11,473,9132022 28,871,657 40.54% 11,703,3912023 29,449,090 40.54% 11,937,4592024 30,038,072 40.54% 12,176,2082025 30,638,833 40.54% 12,419,7322026 31,251,610 40.54% 12,668,127
Total 116,068,378$
Source: Department of Local Government Finance (DLGF)
Estimated 2% increase to CEDIT distributions due to improving economic conditions. Starting in 2017, CEDIT is part of the new Local Income Tax (LIT) category.

City of South Bend, Indiana
274
Statistical Section Projected City of South Bend LOIT Revenue
.25% LOIT Tax Rate
ProjectedSt. Joseph County PS LOIT Amount
Year of Projected Projected Available ForCollection Distribution CEDIT Debt Service
2017 15,673,247$ 43.33% 6,791,160$ 2018 15,986,712 43.33% 6,926,9832019 16,306,446 43.33% 7,065,5232020 16,632,575 43.33% 7,206,8332021 16,965,227 43.33% 7,350,9702022 17,304,531 43.33% 7,497,9892023 17,650,622 43.33% 7,647,9492024 18,003,634 43.33% 7,800,9082025 18,363,707 43.33% 7,956,9262026 18,730,981 43.33% 8,116,065
Total 74,361,307$
Source: Department of Local Government Finance (DLGF)
Estimated 2% increase to PS LOIT distributions due to improving economic conditions. Starting in 2017, PS LOIT is part of the new Local Income Tax (LIT) category.

City of South Bend, Indiana
275
Statistical Section Statement of Estimated Cash Flow and Debt Service Coverage (COIT)
Projected Redevelopment COIT First Mortgage First MortgageCity of South Bend District Lease Rental Revenue Revenue Refunding Revenue Bonds Estimated
COIT Taxable Revenue Refunding Bonds of 2010 Bonds, Series 2012 Series 2013 Total Lease Excess EstimatedYear Revenues Bonds, Series 2010 Lease Payments Lease Payments Lease Payments Payments Funds Coverage
2017 10,459,265$ 727,155$ 670,994$ 1,565,740$ 402,480$ 3,366,369$ 7,092,896$ 311%2018 10,668,450 714,070 671,775 1,564,520 395,730 3,346,095 7,322,355 319%2019 10,881,819 353,970 671,144 1,557,920 398,830 2,981,864 7,899,955 365%2020 11,099,456 - 672,500 1,555,880 396,705 2,625,085 8,474,371 423%2021 11,321,445 - 336,600 1,566,750 399,355 2,302,705 9,018,740 492%2022 11,547,874 - - 1,555,000 396,780 1,951,780 9,596,094 592%2023 11,778,831 - - 779,625 398,980 1,178,605 10,600,226 999%2024 12,014,408 - - - 406,543 406,543 11,607,865 2955%2025 12,254,696 - - - 411,493 411,493 11,843,203 2978%2026 12,499,790 - - - 410,643 410,643 12,089,147 3044%2027 12,749,786 - - - 414,149 414,149 12,335,637 3079%2028 13,004,781 - - - 421,605 421,605 12,583,176 3085%2029 13,264,877 - - - 422,742 422,742 12,842,135 3138%2030 13,530,175 - - - 422,742 422,742 13,107,433 3201%2031 13,800,778 - - - 427,550 427,550 13,373,228 3228%2032 14,076,794 - - - 431,254 431,254 13,645,540 3264%2033 14,358,329 - - - 433,925 433,925 13,924,404 3309%2033 14,645,496 - - - 433,925 433,925 14,211,571 3375%
Total 223,957,049$ 1,795,195$ 3,023,013$ 10,145,435$ 7,425,431$ 22,389,074$ 201,567,975$ 1000%
Note: These payments include principal and interest.
Source: City of South Bend Finance Department

City of South Bend, Indiana
276
Statistical Section Statement of Estimated Cash Flow and Debt Service Coverage (CEDIT)
Projected 2014City of South Bend 2006 St. Joseph County 2015 Estimated
CEDIT CEDIT Refunding PSAP Revenue Parks/CEDIT Total Lease Excess EstimatedYear Revenues Bonds Bond Bond Payments Funds Coverage
2017 10,600,122$ 439,933$ 166,761$ 390,482$ 997,175$ 9,602,947$ 1063%2018 10,812,124 - 198,966 379,107 578,073 10,234,051 1870%2019 11,028,367 - 199,242 382,732 581,974 10,446,393 1895%2020 11,248,934 - 199,460 381,132 580,592 10,668,343 1937%2021 11,473,913 - 199,271 374,382 573,653 10,900,260 2000%2022 11,703,391 - 199,423 372,557 571,980 11,131,411 2046%2023 11,937,459 - 199,423 375,582 575,005 11,362,454 2076%2024 12,176,208 - 199,314 368,382 567,696 11,608,512 2145%2025 12,419,732 - 154,405 381,032 535,437 11,884,295 2320%2026 12,668,127 - 155,363 373,232 528,595 12,139,532 2397%2027 12,921,490 - 154,724 375,357 530,081 12,391,409 2438%2028 13,179,919 - 155,298 377,182 532,480 12,647,440 2475%2029 13,443,518 - 154,128 383,616 537,744 12,905,773 2500%2030 13,712,388 - 154,172 384,038 538,210 13,174,178 2548%2031 13,986,636 - 154,051 388,463 542,514 13,444,122 2578%2032 14,266,369 - 153,630 387,176 540,806 13,725,562 2638%2033 14,551,696 - 153,038 389,813 542,851 14,008,845 2681%2034 14,842,730 - 153,582 391,781 545,363 14,297,367 2722%2035 15,139,584 - - 593,094 593,094 14,546,490 2553%
Total 242,112,708$ 439,933$ 3,104,253$ 7,449,140$ 10,993,326$ 231,119,382$ 2202%
Note: These payments include principal and interest.
Source: City of South Bend Finance Department

City of South Bend, Indiana
277
Statistical Section Estimated Tax Increment Revenue
Erskine Village Project
Estimated 12/13 EstimatedTax Year / Tax Net Tax Tax Increment
Collection Year Increment (1) Rate (2) Revenue
2012/2013 1,311,129$ 3.6197$ 1,311,129$ 2013/2014 9,175$ -$ 9,175$ 2014/2015 19,183$ -$ 19,183$ 2015/2016 -$ -$ -$
(1) The City passed back incremental assessed value for payable year 2013. The City will make a yearly decision on the passback of incremental assessed value. The Redevelopment Commission released TIF for 2013 pay 2014 and 2015 pay 2016.
Source: City of South Bend Finance Department

Demographic and Economic Information
These schedules offer demographic and economic indicators to help the reader understand the environment within which the 's financial activities take place.

City of South Bend, Indiana
278
Statistical Section Demographic Statistics
Last Ten Years
South Bend South BendMetropolitan Metro Area South Bend City of
City of Percent Area Percent Total Personal Percent Metro Area Percent City of South Bend PercentSouth Bend Increase/ Median Family Increase/ Income (3) Increase/ Per Capita Increase/ South Bend Public School Increase/
Year Population (1) (Decrease) Income (2) (Decrease) (Millions) (Decrease) Income (3) (Decrease) Median Age (4) Enrollment (5) (Decrease)
2007 104,069 -0.4% 44,400$ 13.7% 10,959$ 4.0% 34,391$ 3.7% 34.6 21,715 -1.0%2008 104,905 0.8% 40,684 -8.4% 11,343 3.5% 35,450 3.1% 34.6 20,800 -4.2%2009 106,192 1.2% 43,403 6.7% 10,581 -6.7% 33,151 -6.5% 32.3 20,451 -1.7%2010 101,168 -4.7% 40,789 -6.0% 10,788 2.0% 33,819 2.0% 33.4 20,066 -1.9%2011 101,168 0.0% 40,873 0.2% 11,447 6.1% 35,867 6.1% 33.3 19,467 -3.0%2012 101,168 0.0% 40,873 0.0% 11,948 4.4% 37,505 4.6% 33.3 18,982 -2.5%2013 101,168 0.0% 40,873 0.0% 12,196 2.1% 38,265 2.0% 33.3 19,680 3.7%2014 101,168 0.0% 34,656 -15.2% 12,887 5.7% 40,342 5.4% 33.9 19,308 -1.9%2015 101,168 0.0% 34,656 0.0% 13,560 5.2% 42,362 5.0% 34.0 18,680 -3.3%2016 101,168 0.0% 34,523 -0.4% 13,560 0.0% 42,362 0.0% 32.7 18,110 -3.1%
Sources:(1) U.S. Census Bureau, 2010 Census information (http://factfinder.census.gov/). 2016 information not available.(2) U.S. Census Bureau, 2011-2015 American Community Survey 5-Year Estimates (http://factfinder.census.gov/)(3) Bureau of Local Economic Analysis, South Bend-Mishawaka, IN_MI Metropolitan Area Profile (https://www.bea.gov/). 2016 information not available.
(4) U.S. Census Bureau, Profile of General Demographic Characteristics (http://factfinder.census.gov/)(5) Indiana Department of Education, South Bend School Corporation Total Enrollment (http://compass.doe.in.gov/)
Personal income includes net earnings by place of residence; dividends, interest, and rent; and personal current transfer receipts received by the residents of South Bend-Mishawaka.
Metropolitan statistical area (MSA)- An area consisting of a core county or counties in which lies an urban area having a population of at least 50,000, plus adjacent counties having a high degree of social and economic integration with the core counties as measured through commuting ties.

City of South Bend, Indiana
279
Statistical Section Demographic Statistics (Continued)
Last Ten Years
December December DecemberSouth Bend South Bend South Bend
Metropolitan Percent Metropolitan Percent Metropolitan Area Labor Increase/ Area Increase/ Unemployment
Year Force (1) (Decrease) Unemployment (1) (Decrease) Rate (1)
2007 159,981 -1.4% 8,046 -5.4% 5.0%2008 159,417 -0.4% 10,494 30.4% 6.6%2009 154,409 -3.1% 17,713 68.8% 11.5%2010 155,045 0.4% 17,869 0.9% 11.5%2011 155,025 0.0% 15,582 -12.8% 10.1%2012 151,520 -2.3% 14,085 -9.6% 9.3%2013 150,796 -0.5% 13,021 -7.6% 8.6%2014 152,583 1.2% 10,040 -22.9% 6.6%2015 154,598 1.3% 7,768 -22.6% 5.0%2016 158,279 2.4% 7,176 -7.6% 4.5%
Source:(1) Bureau of Labor Statistics, Local Area Unemployment Statistics: South Bend-Mishwaka IN-MI Metropolitan Statistical Area (https://www.bls.gov/data/)
Metropolitan statistical area (MSA)- An area consisting of a core county or counties in which lies an urban area having a population of at least 50,000, plus adjacent counties having a high degree of social and economic integration with the core counties as measured through commuting ties.

City of South Bend, Indiana
280
Statistical Section Employment by Type and Industry
Last Ten Years
Description 2006 2007 2008 2009 2010 2011 2012 2013 2014 2015 Total employment 175,360 176,686 174,085 165,304 164,086 167,018 165,870 165,639 168,250 172,229
By Type Wage and salary employment 147,207 147,123 144,931 135,840 134,779 137,009 136,455 136,112 138,520 141,609 Proprietors employment 28,153 29,563 29,154 29,464 29,307 30,009 29,415 29,527 29,730 30,620 Farm proprietors employment 1,332 1,350 1,331 1,329 1,340 1,342 1,300 1,310 1,298 1,291 Nonfarm proprietors employment 26,821 28,213 27,823 28,135 27,967 28,667 28,115 28,217 28,432 29,329
By Industry Farm employment 1,961 1,966 1,791 1,765 1,758 1,770 1,680 1,692 1,681 1,686 Nonfarm employment 173,399 174,720 172,294 163,539 162,328 165,248 164,190 163,947 166,569 170,543 Private nonfarm employment 155,226 156,625 154,068 145,200 144,045 147,071 146,899 147,190 149,978 153,884 Forestry, fishing, and related activities (D) 222 (D) (D) 245 271 301 287 (D) (D) Mining 62 75 105 96 117 105 154 178 (D) (D) Utilities (D) (D) (D) (D) (D) (D) (D) (D) (D) (D) Construction 9,393 9,300 9,257 7,988 6,927 6,951 6,639 6,823 6,839 7,536 Manufacturing 21,097 20,479 19,324 16,516 16,286 17,624 17,657 17,139 17,523 18,109 Wholesale trade 8,350 8,217 7,962 7,057 7,170 7,256 7,100 6,871 7,161 7,449 Retail trade 20,022 20,082 19,141 18,105 17,728 17,834 17,670 17,623 17,759 17,992 Transportation and warehousing (D) (D) (D) (D) 4,349 E (D) (D) (D) (D) (D) Information 2,669 2,658 2,556 (D) 2,227 2,081 2,113 2,265 2,265 2,215 Finance and insurance 6,861 6,972 7,028 6,988 6,817 7,021 6,797 6,213 6,057 6,028 Real estate and rental and leasing 6,460 6,614 6,423 6,128 5,933 6,107 5,987 6,069 6,285 6,358 Professional, scientific, and technical services 7,533 E 7,666 E 7,642 E 7,273 E 7,169 E 7,180 E 6,986 E 7,416 7,422 7,687 Management of companies and enterprises 931 E 1,133 E 1,218 E 1,246 E 1,307 E 1,411 E 1,515 E 2,195 2,330 2,428 Administrative and waste management services 9,021 9,636 9,111 8,108 8,529 8,363 7,912 7,787 8,149 8,415 Educational services 12,652 12,848 13,254 13,067 13,200 E 13,755 14,120 (D) (D) (D) Health care and social assistance 19,736 20,161 20,339 20,882 20,341 E 21,268 21,875 (D) (D) (D) Arts, entertainment, and recreation 2,822 2,864 2,839 2,655 2,626 2,813 2,768 2,811 2,726 2,786 Accommodation and food services 11,357 11,350 11,647 10,945 11,032 11,590 11,823 12,195 12,358 12,810 Other services, except public administration 10,210 10,425 10,196 (D) 9,763 10,071 10,070 9,956 10,344 10,431 Government and government enterprises 18,173 18,095 18,226 18,339 18,283 18,177 17,291 16,757 16,591 16,659 Federal, civilian 1,243 1,236 1,223 1,241 1,265 1,091 1,071 1,010 962 944 Military 1,019 995 1,003 1,013 1,003 1,043 1,006 991 1,002 1,023 State and local 15,911 15,864 16,000 16,085 16,015 16,043 15,214 14,756 14,627 14,692 State government 3,108 3,069 3,188 3,350 3,434 3,535 3,458 3,237 3,062 3,035 Local government 12,803 12,795 12,812 12,735 12,581 12,508 11,756 11,519 11,565 11,657
Source: Bureau of Local Economic Analysis (https://www.bea.gov/)* 2016 information not available
2/ Excludes limited partners.E The estimate shown here constitutes the major portion of the true estimate.(D) Not shown to avoid disclosure of confidential information, but the estimates for this item are included in the totals. Last updated: November 17, 2016 -- new estimates for 2015; revised estimates for 2001-2014.
1/ The estimates of employment for 2001-2006 are based on the 2002 North American Industry Classification System (NAICS), a comprehensive, industrial classification system--developed and used by the United States, Canada, and Mexico--that groups establishments according to the similarity of their production processes. The estimates for 2007-2010 are based on the 2007 NAICS. The estimates for 2011 forward are based on the 2012 NAICS.
Metropolitan statistical area (MSA)- An area consisting of a core county or counties in which lies an urban area having a population of at least 50,000, plus adjacent counties having a high degree of social and economic integration with the core counties as measured through commuting ties.

City of South Bend, Indiana
281
Statistical Section Comparison Growth Rates in Personal Income for St. Joseph County
The State of Indiana and U.S. Personal Income Last Ten Years
Amount in Amount inMillions Billions Annual Percentage Increase
St. Joseph Co. Indiana U.S. St. Joseph Co. Indiana U.S.Calendar Personal Personal Personal Personal Personal Personal
Year Income Income Income Income Income Income
2006 9,018$ 207,377$ 11,381$ 7.16% 6.28% 7.27%2007 9,381 215,099 11,995 4.02% 3.72% 5.40%2008 9,708 225,760 12,493 3.49% 4.96% 4.15%2009 9,042 220,157 12,079 -6.86% -2.48% -3.31%2010 9,144 227,692 12,460 1.14% 3.42% 3.15%2011 9,668 242,798 13,233 5.72% 6.63% 6.21%2012 10,152 253,771 13,904 5.01% 4.52% 5.07%2013 10,349 257,170 14,069 1.94% 1.34% 1.18%2014 10,961 266,953 14,802 5.91% 3.80% 5.21%2015 11,554 277,629 15,464 5.40% 4.00% 4.47%
4.80% 4.06% 4.43%3.29% 3.62% 3.88%
Source: Bureau of Local Economic Analysis (https://www.bea.gov/)Note-- All dollar estimates are in current dollars (not adjusted for inflation).Last updated: March 28, 2017-- new estimates for 2016; revised estimates for 2010-2015.* 2016 information not available.
Average Annual Growth - Most Recent 5 YearsAverage Annual Growth - Most Recent 10 Years

City of South Bend, Indiana
282
Statistical Section Principal Employers - Current and Nine Years Ago
December 31, 2016
2016 2007Number of Number of
Employer Type of Business Employees Rank Employees Rank
University of Notre Dame Higher Education 5,802 3.67 % 1 4,459 3.36 % 1Beacon Health System (Memorial) Health Care 4,683 2.96 2 3,008 2.27 3South Bend Community School Corp Public Schools 3,615 2.28 3 3,295 2.48 2Saint Joseph Health System Health Care 2,626 1.66 4 2,291 1.73 5Indiana University South Bend Higher Education 1,277 0.81 5 1,400 1.06 8St. Joseph County Government 1,240 0.78 6 2,025 1.53 6City of South Bend Government 1,139 0.72 7 1,230 0.93 9AM General Corporation Manufacturing/Assembly 800 0.51 8 2,400 1.81 4Honeywell Aerospace Aerospace Manufacturing 700 0.44 9Press Ganey Health Care Management 694 0.44 10The Diocese of Fort Wayne/South Bend Parochial Schools 1,750 1.32 7Wal-Mart Retail Store 1,111 0.84 10
Total Number of Employees 22,576 14.26 % 22,969 17.31 %
Total Employees - South Bend Metropolitan Area Labor Force (1) 158,279 100.00 % 132,693 100.00 %
Source: Crowe Horwath CPAs and conversations with employers
(1) Bureau of Labor Statistics, Local Area Unemployment Statistics: South Bend-Mishwaka IN-MI Metropolitan Statistical Area (https://www.bls.gov/data/)
of TotalPercent
of TotalPercent

Operating Information
These schedules contain service and infrastructure data to help the reader understand how the information in the 's financial report relates to the services the provides and the activities it performs.

City of South Bend, Indiana
283
Statistical Section Operating Indicators by Function/Program
Last Ten Fiscal Years
2007 2008 2009 2010 2011 2012 2013 2014 2015 2016Function/programPolice
Physical arrests 4,589 4,091 3,785 3,077 3,626 3,174 2,959 2,608 2,483 2,342Parking violations 1,820 1,672 1,479 979 904 1,051 1,019 299 691 480Traffic violations 1,626 5,901 11,746 14,163 4,236 7,561 2,180 1,487 4,327 6,437
FireEmergency responses 14,822 15,123 14,341 15,578 15,408 15,720 15,865 15,902 15,340 15,886Fires extinguished 279 264 264 225 251 214 220 227 213 236Inspections 4,302 4,467 4,205 4,233 3,553 3,325 2,273 3,133 3,778 2,148
Refuse collectionRefuse collected (tons per day) (1) 267 137 70 120 123 128 122 128 149 139
Other public worksStreet resurfacing (miles) 16.50 14.70 14.50 20.30 18.10 16.90 21.00 22.00 17.10 20.19Potholes repaired (tonnage) 923.00 898.00 629.22 380.00 332.32 117.21 691.00 826.25 526.05 462.10
Parks and recreationAthletic field permits issued 1,000 738 700 381 227 133 93 120 113 427Fitness Center Admissions 63,088 70,193 74,438 60,118 67,408 61,002 63,671 67,428 64,547 67,294
WaterNew billable housing starts 321 299 194 179 144 160 242 141 108 189Water mains breaks 105 72 87 76 60 66 80 134 99 53Average daily consumption 19,042 18,280 16,100 15,955 15,600 16,600 15,300 11,000 14,500 14,640
(thousands of gallons)Wastewater
Average daily sewage treatment 35,970 37,800 41,200 30,861 35,800 31,770 30,690 31,991 30,200 43,874(thousands of gallons)
Sources: Various city departments
(1) 2007 and prior years were in cubic yards
Fiscal Year

City of South Bend, Indiana
284
Statistical Section Capital Asset and Infrastructure Statistics by Function/Program
Last Ten Fiscal Years
2007 2008 2009 2010 2011 2012 2013 2014 2015 2016Function/programPolice
Stations 1 1 1 1 1 1 1 1 1 1Patrol units 25 25 25 25 19 19 19 19 19 19
FireStations 11 11 11 11 11 11 11 11 11 11Training Center 0 0 0 0 0 0 0 1 1 1Rescue units 32 32 33 33 33 33 33 33 33 33
Refuse collectionCollection trucks 22 22 21 23 23 19 19 19 19 19
Other public worksStreets (miles) 500 500 532 532 499 525 525 525 525 525Streetlights 1,170 1,242 2,500 2,500 2,500 2,700 2,700 3,000 3,015 3,015Traffic signals 160 160 162 162 164 165 167 162 158 164
Parks and recreationAcreage 1,292 1,292 1,292 1,292 1,292 1,292 1,292 1,292 1,292 1,292Playgrounds 47 47 47 47 47 47 47 47 47 48Baseball/softball diamonds 27 27 27 27 27 27 27 27 27 27Soccer/football fields 17 17 17 17 17 19 19 19 19 19Swimming pools 2 2 2 2 2 2 2 2 2 2Splash Pads 4 4 5 5 5 5 6 6 6 7Community center 5 5 5 5 5 5 5 3 3 3
WaterWater mains (miles) 558 560 560 580 582 583 584 583 583 583Fire hydrants 4,000 5,081 5,317 5,345 5,377 5,401 5,436 5,448 5,439 5,459Storage capacity (thousands of gallons) 17,300 17,300 17,300 17,300 17,300 17,300 17,300 17,300 17,300 17,300
WastewaterSanitary sewers (miles) 540 540 534 534 534 528 526 527 527 527Storm sewers (miles) 200 200 200 127 127 133 133 133 133 155Treatment capacity (thousands of gallons) 48,000 48,000 48,000 48,000 48,000 48,000 48,000 48,000 48,000 48,000
Sources: Various city departments
Fiscal Year

City of South Bend, Indiana
285
Statistical Section New Construction - Number of Permits and Property Values
Last Ten Fiscal Years (Dollar Amounts in 000’s)
PublicResidential Residential Commercial Commercial Public Utility Manufacturing Manufacturing Total ValueNumber of Value Number of Value Utility Number Value Number of Value Total Value Increase/
Year Permits (in 000's) Permits (in 000's) of Permits (in 000's) Permits (in 000's) (in 000's) (Decrease)
2007 103 18,314$ 28 27,082$ 1,907 28,720$ 5 6,612$ 80,728$ -16.6%2008 55 10,032 15 44,678 1,662 29,685 1 2,416 86,811 7.5%2009 48 8,467 10 29,451 1,627 28,785 - - 66,703 -23.2%2010 35 7,450 5 28,283 1,221 25,998 - - 61,731 -7.5%2011 33 6,300 14 10,737 880 20,265 1 2,023 39,325 -36.3%2012 45 9,827 11 21,247 - - 2 2,291 33,365 -15.2%2013 50 15,136 8 4,954 - - 1 160 20,250 -39.3%2014 51 13,101 12 10,392 - - - - 23,493 16.0%2015 (1) 77 18,615 70 415,219 - - 6 28,460 462,294 1867.8%2016 61 15,215 22 53,622 - - - - 68,837 -85.1%
Source - Consolidated City/County Building Department
(1) - Increase in commercial construction due to major construction taking place at the University of Notre Dame.

City of South Bend, Indiana
286
Statistical Section Full-Time City Government Employees by Department
Last Ten Fiscal Years
Department 2007 2008 2009 2010 2011 2012 2013 2014 2015 2016
General Government Mayor's Office 10.00 9.00 8.00 7.00 7.00 6.00 6.00 7.00 7.00 6.00 City Clerk's Office 5.00 5.00 5.00 5.00 5.00 5.00 5.00 5.00 5.00 5.00 Common Council (elected officials, part-time) 9.00 9.00 9.00 9.00 9.00 9.00 9.00 9.00 9.00 9.00 Administration and Finance/Information Tech 31.00 29.00 26.00 26.00 27.00 22.00 20.00 21.00 18.00 26.00 Legal Department 15.00 15.00 9.00 9.00 9.00 9.00 10.00 10.00 12.00 11.00 Engineering 18.50 18.50 16.00 19.00 17.00 15.00 13.00 14.00 16.00 18.00 311 Call Center - - - - - - 5.00 7.00 7.00 7.00 Safety and Risk - - - - - 3.00 3.00 3.00 2.00 2.00 Human Rights - - - - - 6.00 6.00 6.00 6.00 6.00
Public Safety Police Department 320.00 317.00 279.00 293.00 293.00 291.00 291.00 295.00 300.00 287.00 Communication Center 30.00 30.00 37.00 38.00 35.00 35.00 33.00 34.00 0.00 0.00 Fire Department 254.00 254.00 246.00 255.00 258.00 249.00 255.00 257.00 259.00 268.00 Building Maintenance 7.00 7.00 4.00 3.00 3.00 - - - - 3.00
Culture and Recreation Parks and Recreation (2) 122.00 121.00 111.00 113.00 114.00 114.00 113.00 87.00 88.00 89.00 Convention and Events Management (1) 16.00 15.00 13.00 13.00 14.00 14.00 14.00 14.00 14.00 12.00
Economic DevelopmentDepartment of Community Investment 35.00 33.00 26.00 26.00 25.00 24.00 26.00 25.00 25.00 23.00
Highways and Streets Street Department 54.00 54.00 51.00 52.00 56.00 52.00 60.00 59.00 53.00 59.00 Traffic & Lighting 11.00 11.00 6.00 0.00 0.00 0.00 0.00 0.00 0.00 0.00
Enterprise Funds Water Works 86.00 80.00 82.00 75.00 74.00 73.00 70.00 68.00 67.00 65.00 Wastewater 54.50 56.50 48.00 51.00 49.00 46.00 45.00 42.00 43.00 44.00 Organic Resources (formerly in Wastewater) - - - - - 6.00 6.00 6.00 6.00 6.00 Sewer 28.00 28.00 33.00 35.00 36.00 39.00 34.00 33.00 30.00 31.00 Solid Waste 26.00 26.00 26.00 26.00 23.00 24.00 26.00 22.00 21.00 25.00 Building Department 22.00 22.00 15.00 13.00 13.00 13.00 14.00 13.00 13.00 14.00 Code Enforcement/Animal Care & Control 27.00 27.00 27.00 23.00 25.00 25.00 24.00 23.00 23.00 26.00
Internal Service Fund Central Services 49.00 46.00 39.00 41.00 41.00 42.00 43.00 38.00 36.00 37.00
Total Positions 1,230.00 1,213.00 1,116.00 1,132.00 1,133.00 1,122.00 1,131.00 1,098.00 1,060.00 1,079.00

City of South Bend, Indiana
287
Statistical Section Full-Time City Government Employees by Department (Continued)
Last Ten Fiscal Years
Department 2007 2008 2009 2010 2011 2012 2013 2014 2015 2016Summary by Activity General Government 88.50 85.50 73.00 75.00 74.00 75.00 77.00 82.00 82.00 90.00 Public Safety 611.00 608.00 566.00 589.00 589.00 575.00 579.00 586.00 559.00 558.00 Culture and Recreation 138.00 136.00 124.00 126.00 128.00 128.00 127.00 101.00 102.00 101.00 Economic Development 35.00 33.00 26.00 26.00 25.00 24.00 26.00 25.00 25.00 23.00 Highways and Streets 65.00 65.00 57.00 52.00 56.00 52.00 60.00 59.00 53.00 59.00 Enterprise Funds 243.50 239.50 231.00 223.00 220.00 226.00 219.00 207.00 203.00 211.00 Internal Service Fund 49.00 46.00 39.00 41.00 41.00 42.00 43.00 38.00 36.00 37.00
Total Positions 1,230.00 1,213.00 1,116.00 1,132.00 1,133.00 1,122.00 1,131.00 1,098.00 1,060.00 1,079.00
Excludes seasonal, part-time and temporary positions
(1) Includes reduction of 34 positions in the City's convention facility (Century Center) during 2007. Century Center is being managed by a private company under an agreement with the City of South Bend.
(2) Potawatomi Zoo employees (33) became employees of the Potawatomi Zoological Society through a public-private partnership as of January 1, 2014.
Source: City of South Bends Performance Based Budgets and personnel records

City of South Bend, Indiana
288
Statistical Section Salary Rate Comparison
1990 - 2016
-----1st Class Patrol Officer----- ---1st Class Fire Fighter---Year Percent Base Salary Percent Base Salary Non-bargaining Teamsters
1990 3.62% 20,071$ 4.74% 19,869$ 3.00-4.00% .25 per hour1991 0.92% 20,256 2.52% 20,369 3.00% .25 per hour1992 4.69% 21,206 2.45% 20,869 3.00% .30 per hour1993 0.44% 21,300 5.00% 21,912 4.24% 0.00%1994 2.35% 21,800 0.00% 21,912 1.50% + $300 bonus .15 per hour1995 4.82% 22,850 3.00% 22,569 1.50% + $300 bonus .30 per hour1996 4.38% 23,850 5.00% 23,697 3.00% .27 per hour1997 4.19% 24,850 4.87% 24,850 3.00% .33 per hour1998 4.63% 26,000 0.60% 25,000 3.00% .37 per hour1999 3.85% 27,000 2.60% 25,650 3.25% 3.50%2000 5.56% 28,500 9.34% 28,045 3.50% 3.50%2001 9.74% 31,275 11.52% 31,275 3.50% 4.00%2002 4.50% 32,682 4.03% 32,534 4.00% 4.00%2003 5.57% 34,504 4.04% 33,850 4.00% 4.00%2004 6.01% 36,578 5.17% 35,600 4.00% 4.00%2005 9.36% 40,000 12.36% 40,000 4.00% 4.00%2006 2.50% 41,000 2.00% 40,800 2.00% 4.25%2007 2.50% 42,025 2.50% 41,820 $750/0% .38 per hour2008 3.50% 43,496 3.50% 43,285 3.00% 3.00%2009 2.20% 44,453 2.00% 44,150 2.00% 2.00%2010 0.00% 44,453 6.80% 47,150 2.00% 2.00%2011 11.50% 49,563 4.06% 49,066 2.00% 0.00%2012 2.00% 50,554 2.00% 50,047 2.00% 2.00%2013 2.50% 51,818 3.00% 51,550 2.00% 2.00%2014 2.50% 53,113 3.00% 53,100 2.00% 2.00%2015 2.20% 54,281 2.20% 54,268 2.00% 2.00%2016 2.20% 55,475 2.20% 55,462 2.00% 2.00%
Source - City of South Bend personnel records

City of South Bend, Indiana
289
Statistical Section Insurance Coverage
2016
Limits ofType of Coverage Liability
LIABILITY Comprehensive General Liability Statutory Police Professional Liability Statutory Ambulance Malpractice Liability Statutory Premises Liability Statutory (Clay Utilities, Century Center, Parking Garages) CGL - Stadium Statutory Liquor Liability 4/26/16 - 17 $1,000,000 $1,739 Premium Special Events (Arbor Day/Rum Village Aerial) 4/20/16 - 17 $1,000,000 $2,510 Premium
CRIME Public Employee Dishonesty 12/31/16 - 17 $1,000,000 $9,374 Premium
PROPERTY 7/1/16 - 17 All risk blanket building & contents $550,000,000 $391,075 Premium Business Income Included in above Machinery Breakdown Included in above Fine Arts Included in above Valuable Papers & Records Included in above Contractors Equipment Included in above
Flood Insurance - Pump station & contents 1/15/16 - 17 $670,000 $8,071 Premium
Eddy Street Commons Parking Garage 3/2/16-17 Building & Infrastructure $36,000,000 $26,115 Premium Business Income & Rental Value $15,000,000 Flood $25,000,000 Earthquake $25,000,000
OTHER 1/1/16 - 17 Workers Compensation Statutory Third Party Fee Statutory $50,000 Fee Excess Over Self-insured Statutory $133,984 Premium/Fee $250,000 Retention Each Accident
Source: City of South Bend Administration & Finance Department Gibson Insurance Company
Self-Insured
Included in aboveIncluded in aboveIncluded in above
Included in aboveIncluded in above
Included in aboveIncluded in aboveIncluded in above
Self-InsuredSelf-Insured
Annual PremiumEstimated
Self-Insured
Self-InsuredSelf-Insured

City of South Bend, Indiana
290
Statistical Section Financial Institutions
Last Ten Years (Amounts in 000’s)
PercentBanks Savings and Loans Credit Unions Increase/
Year Branches Deposits Branches Deposits Branches Deposits Total Deposits (Decrease)
2007 35 2,183,105$ 5 86,561$ 24 1,975,374$ 4,245,040$ 6.1%2008 40 2,184,092 - - 24 2,699,677 4,883,769 15.0%2009 40 2,443,390 - - 23 2,914,347 5,357,737 9.7%2010 40 3,108,702 - - n/a 2,410,711 5,519,413 3.0%2011 39 3,342,964 - - n/a 2,474,034 5,816,998 5.4%2012 40 3,201,888 - - n/a 2,735,212 5,937,100 2.1%2013 37 3,730,018 - - n/a 2,854,527 6,584,545 10.9%2014 39 2,548,101 - - n/a 2,911,596 5,459,697 -17.1%2015 40 2,454,129 1 25,077 n/a 3,089,732 5,568,938 2.0%2016 39 2,607,360 1 25,077 n/a 3,262,413 5,894,850 5.9%
Banks Credit Unions
1st Source Bank 1,339,031$ 51.36% Teacher's Credit Union 2,335,918$ 71.60%Key Bank 483,104 18.53% 442,906 13.58%Wells Fargo 255,487 9.80% Community Wide Credit Union 329,508 10.10%Others 529,738 20.31% AAA Federal Credit Union 52,355 1.60%Total 2,607,360$ 100.00% Policemen's Federal Credit Union 49,136 1.51%
Others 52,590 1.61%
Total 3,262,413$ 100.00%n/a - information is not available
Bank of America closed operations in South Bend prior to June 30, 2014 reducing total bank deposits.
Sources:Federal Deposit Insurance Corporation Website (www.fdic.gov). Research and Analysis: Summary of Deposits, Deposits Market Share Report, Indiana, St. Joseph County, South Bend, Run Report.
Notre Dame Federal Credit Union

City of South Bend, Indiana
291
Statistical Section Miscellaneous Statistics
December 31, 2016
2015 2016 2015 2016Authorized Officers 260 247 Traffic Signals 158 164Vehicles 394 363 Street Lights (City maintained) 3,015 3,015Special Officer Groups: Miles of Streets 525 525 K-9 Patrols 8 8 Miles of Sidewalks 695 695 SWAT Team 17 17 Miles of Alleys 398 398 Metro Drug Task Force (of 20 total) 12 0 Miles of Sanitary Sewers and Storm Drains 690.16 690.54 NEST - Special Neighborhood Unit 7 9 City Owned Vehicles & Related Units 1,185 1,183 Motorcycle Patrol Officers 5 7 Trash Picked Up Per Week (in tons) 596/wk 556/wk Bomb Squad 5 3 Crime Prevention Officers 4 3 Sign ShopCrime Data: 2015 2016 Murders 17 15 Work orders for sign maintenance, Rapes 88 70 installation or removal 2,380 3,119 Robbery 350 388 Miles of yellow and white paint 275 288 Aggravated Assault 285 565 Pre-formed plastic arrows used for Residential Burglary 943 955 street markings 196 91 Non-residential Burglary 487 286 Crosswalk painting at intersections 436 487 Larceny 3,612 3,359 Turn arrows in turn lanes 0 0 Auto Theft 368 566 Detour routes 50 0 Arson 34 47 Temporary No Parking postings 630 462Calls for Service 97,164 103,183 Built Portables 0 0Dispatches 97,164 103,183 Railroad Crossings 7 0Miles Driven 3,252,664 3,137,616 Special Signs Built 2,165 350Arrests 2,483 2,342
Barricades set up for events (# of events): 185 86Fire Department Block Parties 36 47
Paid Department established 18872015 2016
Sworn Firefighters (51 of which are Paramedics) 251 244 Sewer UtilityFire Apparatus 20 20 2015 2016Hazardous Materials Truck 1 1 Customers 39,763 40,043Reserve Pumper Trucks 3 3 Dry Tons of Sludge produced per year 2,528 2,704Reserve Ladder Trucks 2 2 Miles of Sanitary Sewer Lines 527 230River Rescue Boats 3 3 Miles of Storm Sewer Lines 133 155Ambulances 7 7 Miles of Combined Lines (not separated) 305Neonatal (Newborn) Units 3 3Fire Runs 3,234 3,421 Water UtilityAmbulance Runs 13,967 14,583 2015 2016
Customers/Meters 40,377 40,670Irrigation Customers 2,823 2,973Wells/Pumps in service 30 30Pumping Capacity 60 m.g.d. 53.7 m.g.d.Daily Consumption 14.5 m.g.d. 14.6 m.g.d.Peak Demand 24.9 m.g.d. 26.5 m.g.d.Miles of Distribution Systems 583 583Fire Hydrants 5,439 5,459
Police Department Department of Public Works

City of South Bend, Indiana
292
Statistical Section Miscellaneous Statistics (Continued)
December 31, 2016
South Bend International Airport Convention FacilitiesPassenger Volume
Century Center 75,000 square feet of Airline South Shore Bus to O'Hare/ exhibit space
Year Enplanements Train Midway 2,270 max available seating2012 296,590 272,364 33,668 694 seat theater2013 314,114 257,997 31,058 Morris Performing2014 301,878 251,426 37,315 Arts Center 2,500 available seating2015 314,300 248,506 34,3942016 328,897 243,920 34,145 Hotels/Motels 25 Hotels/Motels
3 Bed & BreakfastsOn average, more than 1,600 airline passengers travel through South Bend International every day.
Major hotels and meeting rooms:DoubleTree by Hilton facilities to seat 600
Commercial airlines with operations at South Bend Waterford Estates Lodge facilities to seat 500International Airport (market share): The Morris Inn facilities to seat 400
2014 2015Allegiant Air 32.01% 31.07%Delta Connection 44.34% 45.34%United Express 21.95% 21.38% Health CareCharters/Nonscheduled 1.70% 2.21%Total 100.00% 100.00% The City of South Bend has excellent health care access
at costs below the national average and the lowest in the*2016 information not available Midwest region. The City has one major hospital:
Transpo Beacon Health Systems (Memorial Hospital) 525 bedsSouth Bend Public Transportation Corporation
2015 2016 CommunicationsMotor Bus (Fixed Route) Route Miles 287.0 287.8 Access to: Ridership 1,873,416 1,676,030 Miles of Service 1,341,234 1,358,176 Revenue Miles 1,271,031 1,283,562 1 Public Broadcasting Television Station (WNIT)Demand Response (ACCESS) 2 Local Television Stations (WHME, WJSV) Ridership 66,604 65,099 1 Major Newspaper (The South Bend Tribune) Total Miles 365,787 342,319 25 Radio Stations Revenue Miles 327,563 306,798
Famous Residents
Other Transportation South Bend has been the home to the many distinguishedindividuals including the following persons:
43 Trucking Lines, 33 Terminals 4 Interstate Bus Lines Schuyler Colfax, 17th U.S. Vice President4 Major Rail Systems (freight and passenger) John Fogerty, singer
Michael Warren, actorChad Everett, actor
Colleges and Universities Sidney Pollack, actor/directorKnute Rockne, football coach
Universities and Colleges John Wooden, basketball coach2015 2016 Joe Kernan, former South Bend Mayor and Indiana Governor
University of Notre Dame * 12,292 12,292 Ryan Newman, racecar driverIndiana University at South Bend 7,574 7,185 Skylar Diggins, woman's basketball playerBethel College 1,600 1,639St. Mary's College 1,557 1,606 Other Holy Cross College * 530 530Trine University - South Bend 78 75 - Incorporated in 1865Purdue University South Bend 158 130 - County Seat of St. Joseph County
- South Bend officially began under the name South Hold, but the Technical Colleges name was changed by the Post Office in 1830 to avoid confusion 2015 2016 with other communities that used that name. The name South IVY Tech Community College * 3,214 3,214 Bend was used because the City is located at the southernmost
point of the St. Joseph River.* 2016 information not available - Average High Temperature:
January 31 degrees Fahrenheit July 83 degrees Fahrenheit
Enrollment
4 Major Television Networks: NBC (WNDU), ABC (WBND), CBS and FOX (WSBT)
Enrollment

7 7 , 6 9 1 F E E Tof new or replaced sidewalk installed by Public Works.
60,295 FEETof new or replaced curb installed by Public Works.
ADA Curb Ramps were installed.769OVER ONE MILLION PEOPLEin attendance at South Bend Cubs, Potawatomi Zoo, Morris Performing Arts Center and events and recreation programming. 10% increase over 2015 and setting a new record!
at Venues, Parks & Arts programs and events.380,000 ATTENDEES
in the 5 year life of the clean and safe patrol program.
3,000th instance of graffiti abatedLegal Department drafted the City’s first dog park lease, leading to the successful opening of the City’s first dog park.
properties were removed from Vacant and Abandoned List.1 8 8
BONDRATING
Bond refunding saved taxpayers
$160,000 in 2016.
$9,067,367And a total of in bond refunding savings has been realized since Mayor Pete assumed office in 2012.
for Police service, 6,500 more than in 2015
103,183 CALLSUse of Force and complaints down
The South Bend Fire Department responded to
20,000+ EMERGENCYCALLS FOR SERVICEand achieved ISO level 2.
by 311, with an average 35 second wait time.150,431 CALLS ANSWERED
1,809 PUBLIC RECORDS REQUESTSwere processed by the Legal Department in 2016, bringing the Administration total to 9,722.
through Code Enforcement’s Landlord Registration.
874 LANDLORDS & PROPERTY MANAGERS
5,100 PROPERTIESregistered
The City’s new Employee Health & Wellness Center opened for employee use in January. The clinic recorded a total of
5,563 APPOINTMENTS.
of lanes were paved in 2016.36.5 MILES
of savings and efficiencies realized through Innovation &Technology.
$2.75 MILLION
4 MILLION POUNDSof litter and debris abated by the NEAT crew in 2016.
of safe drinking water and fire protection for a safer community.
5.2 BILLION GALLONS
We introduced our
DIVERSITY AND INCLUSIONplan with 23 key performance indicators and 62 action items.
through MADE program at MLK Center.7,922 YOUTHS SERVED
in private investment in 2016 created
$261,000,000
downtown plus an additional 400 UNITS300 RESIDENTIAL UNITS
in Eddy St phase II and 300 JOBS.
City negotiated agreements with Pokagon Band of Potawatomi Indians and Pokagon Gaming Authority to result in guaranteed annual
$2 MILLION$5 MILLION community donation impact.
in city revenue and estimated
SOUTH BEND BY THE NUMBERS