comprehensive annual financial report fiscal year … executive directors and a representative of...
TRANSCRIPT

Comprehensive Annual Financial Report For Fiscal Year Ended September 30, 2007
City of Boise
Idaho
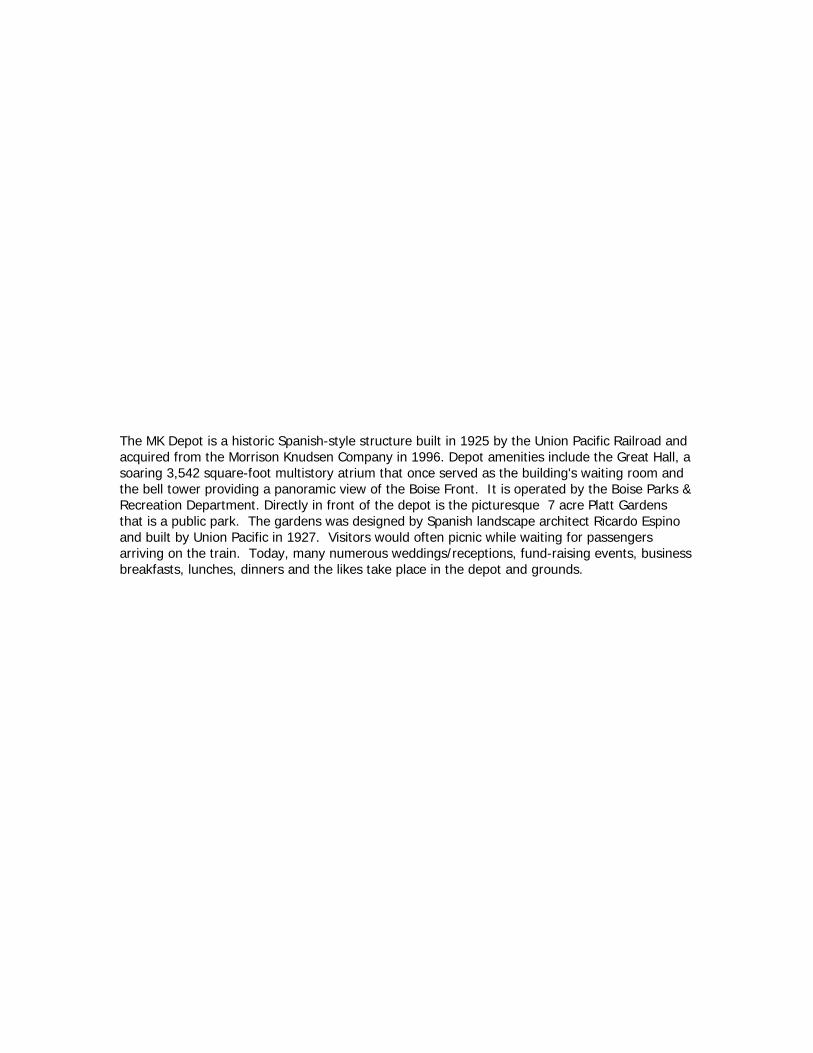
The MK Depot is a historic Spanish-style structure built in 1925 by the Union Pacific Railroad and acquired from the Morrison Knudsen Company in 1996. Depot amenities include the Great Hall, a soaring 3,542 square-foot multistory atrium that once served as the building's waiting room and the bell tower providing a panoramic view of the Boise Front. It is operated by the Boise Parks & Recreation Department. Directly in front of the depot is the picturesque 7 acre Platt Gardens that is a public park. The gardens was designed by Spanish landscape architect Ricardo Espino and built by Union Pacific in 1927. Visitors would often picnic while waiting for passengers arriving on the train. Today, many numerous weddings/receptions, fund-raising events, business breakfasts, lunches, dinners and the likes take place in the depot and grounds.

City of Boise Comprehensive Annual Financial Report
for the Fiscal Year Ended September 30, 2007
TABLE OF CONTENTS
INTRODUCTORY SECTION Letter of Transmittal ................................................................................................................... A-1 GFOA Certificate of Achievement ............................................................................................. A-9 Organization Charts .................................................................................................................. A-10 Names of Principal City Officials............................................................................................. A-12 FINANCIAL SECTION Independent Auditors' Report ......................................................................................................B-1 Management’s Discussion and Analysis .....................................................................................C-1 Basic Financial Statements: Government-wide Financial Statements: Statement of Net Assets .......................................................................................................... D-2 Statement of Activities............................................................................................................ D-6 Fund Financial Statements: Balance Sheet-Governmental Funds....................................................................................... D-8 Reconciliation of the Balance Sheet of Governmental Funds to the Statement of Net Assets ........................................................................................................ D-9 Statement of Revenues, Expenditures, and Changes in Fund Balances- Governmental Funds........................................................................................................... D-10 Reconciliation of the Statement of Revenues, Expenditures, and Changes in Fund Balances of Governmental Funds to the Statement of Activities.......................... D-11 Statement of Revenues, Expenditures, and Changes in Fund Balances- Budget and Actual: General Fund....................................................................................................................... D-13 Statement of Net Assets-Proprietary Funds.......................................................................... D-14 Reconciliation of the Proprietary Funds Statement of Net Assets to the Statement of Net Assets ...................................................................................................... D-18 Statement of Revenues, Expenses, and Changes in Fund Net Assets- Proprietary Funds................................................................................................................ D-20 Reconciliation of the Statement of Revenues, Expenses and Changes in Fund Net Assets of Proprietary Funds to the Statement of Activities ................................ D-22 Statement of Cash Flows-Proprietary Funds ........................................................................ D-24 Statement of Fiduciary Net Assets-Fiduciary Funds ............................................................ D-28 Statement of Changes in Fiduciary Net Assets-Fiduciary Funds ......................................... D-29 Notes to Financial Statements......................................................................................................E-1
TABLE OF CONTENTS (continued)
FINANCIAL SECTION (continued) Combining and Individual Fund Statements and Schedules: Combining Balance Sheet-Nonmajor Governmental Funds.......................................................F-1 Combining Statement of Revenues, Expenditures, and Changes in Fund Balances-Nonmajor Governmental Funds...............................................................................F-2 Schedules of Revenues, Expenditures, and Changes in Fund Balances- Budget and Actual: Capital Projects Fund.............................................................................................................. G-1 Debt Service Fund .................................................................................................................. G-2 Community Development Special Revenue Fund.................................................................. G-3 Permanent Fund - Dedicated Trust ......................................................................................... G-4 Combining Statement of Net Assets-Nonmajor Proprietary Funds.......................................... H-2 Combining Statement of Revenues, Expenses, and Changes in Fund Net Assets-Nonmajor Proprietary Funds....................................................................................... H-6 Combining Statement of Cash Flows-Nonmajor Proprietary Funds ........................................ H-8 Schedule of Revenues, Expenses-Airport Fund .......................................................................I-1 Schedule of Passenger Facility Charges Collected, Held and Used-Airport Fund ...................I-2 Combining Statement of Net Assets-Internal Service Funds .....................................................J-2 Combining Statement of Revenues, Expenses, and Changes in Fund Net Assets- Internal Service Funds .................................................................................................J-3 Combining Statement of Cash Flows-Internal Service Funds....................................................J-4 Statement of Changes in Assets and Liabilities-Agency Fund...................................................J-8 STATISTICAL INFORMATION Financial Trends Net Assets by Component – Last Six Fiscal Years ................................................................. K-1 Changes in Net Assets – Last Six Fiscal Years ....................................................................... K-2 Fund Balances, Governmental Funds –Last Ten Fiscal Years ................................................ K-4 Changes in Fund Balances, Governmental Funds - Last Ten Fiscal Years............................. K-5 Revenue Capacity Assessed Value and Actual Value of Taxable Property – Last Seven Fiscal Years................ K-6 Direct and Overlapping Property Tax Rates – Last Ten Fiscal Years..................................... K-8 Principal Property Tax Payers – Current Year and Nine Years Ago..................................... K-10 Property Tax Levies and Collections – Last Ten Fiscal Years.............................................. K-11 Debt Capacity Ratio of Outstanding Debt By Type – Last Ten Fiscal Years ............................................... K-12 Ratio of Net General Bonded Debt Outstanding – Last Ten Fiscal Years ............................ K-12 Direct and Overlapping Governmental Activities Debt ....................................................... K-13 Legal Debt Margin Information – Last Ten Fiscal Years...................................................... K-14 Pledged Revenue Coverage – Last Ten Fiscal Years ............................................................ K-15
TABLE OF CONTENTS (continued) STATISTICAL INFORMATION (continued) Demographic and Economic Information Demographic and Economic Statistics – Last Ten Calendar Years ...................................... K-17 Principal Employers – Current Year and Nine Years Ago ................................................... K-18 Operating Information Full-time Equivalent City Government Employees by Function/Program ........................... K-19 Operating Indicators by Function/Program ........................................................................... K-20 Capital Asset Statistics by Function/Program ....................................................................... K-22 Insurance Information Schedule of Changes in Liability Estimates for the City of Boise Self-Insurance Plan........ K-24 Schedule of Claims Paid from the City of Boise Self-Insurance Plan................................... K-25 Self-Insured Retention Losses vs. Reserves .......................................................................... K-26 Workers Compensation Self-Insured Retention Losses vs. Reserves ................................... K-28 Schedule of Estimated Workers Compensation Claims ........................................................ K-30 Schedule of paid claims from the Boise City Self-Insured Workers Compensation Plan .............................................................................................................. K-30 SINGLE AUDIT
Schedule of Federal Financial Awards and Passenger Facility Charges Expended for the Fiscal Year Ended September 30, 2006 .......................................................................L-1 Report on Internal Control Over Financial Reporting and on Compliance and Other Matters Based on an Audit of Financial Statements Performed in Accordance with Government Auditing Standards .........................L-5 Report on Compliance With Requirements Applicable to the Passenger Facility Charge Program and on Internal Control Over Compliance ......................L-7 Report on Compliance with Requirements Applicable to Each Major Program and Internal Control Over Compliance in Accordance with OMB Circular A-133.................L-9 Schedule of Findings and Questioned Costs..............................................................................L-11

This page intentionally left blank

A - 2
used and significant estimates made by management; and evaluating the overall financial statement presentation. The independent auditor concluded, based upon the audit, that there was a reasonable basis for rendering an unqualified opinion that the City of Boise’s financial statements for the fiscal year ended September 30, 2007, are fairly presented and in conformity with GAAP. The independent auditor’s report is presented as the first component of the financial section of this report. The independent audit of the financial statements was part of a broader, federally mandated “Single Audit” designed to meet the special needs of federal grantor agencies. The standards governing Single Audit engagements require the independent auditor to report not only on the fair presentation of the financial statements, but also on the audited government’s internal controls and compliance with legal requirements, with special emphasis on internal controls and legal requirements involving the administration of federal awards. These reports are contained in the Single Audit section of this report. GAAP requires that management provide a narrative introduction, overview, and analysis to accompany the basic financial statements in the form of Management’s Discussion and Analysis (MD&A). This letter of transmittal is designed to complement MD&A and should be read in conjunction with it. The City’s MD&A can be found immediately following the report of the independent auditors. Profile of City Government Boise City was chartered in 1866 under the laws of the Territory of Idaho. Since 1961 the City has been governed using a strong mayor organization. Pursuant to Code, the Mayor is the Chief Executive Officer (CEO) of the City and directs its operations, participating with a six-member City Council in developing policy. The Council is organized into several policy groups typically comprised of two Council members each. The Mayor’s Administrative Assistant (Chief of Staff), department executive directors and a representative of the Employee Advisory Committee (EAC) comprise the Executive Management Team (EMT). This group recommends budget and operational priorities to the Mayor and City Council. In March 2005, the Mayor and City Council approved a reorganization that created the Department of Finance and Administration. The Department Head is in charge of various divisions handling financial and administrative matters, and serves as the City’s Chief Financial Officer (CFO). Boise City provides the following services: public safety (police and fire), parks and recreation, libraries and culture, community services (planning and development services, aviation and public transportation, public works, cemetery, downtown on-street parking services, and general government. The streets and

A - 3
sidewalks are owned and maintained by the Ada County Highway District (ACHD). The City’s financial report also includes the Capital City Development Corporation (CCDC). While CCDC is a component entity of the City, its financial statements are reported separately. Additional information on CCDC can be found in Note IV O in the notes to the financial statements. The city limits enclose an area of about 79 square miles. The city’s “area of impact” contains approximately 118 square miles. The “area of impact” is the planned potential size of the city urban service area approved by the county commissioners. The city’s estimated population for 2007 is 213,503 as projected by the Community Planning Association of Southwest Idaho, (COMPASS). Factors Affecting Financial Condition The information presented in the financial statements is perhaps best understood when it is considered from the broader perspective of the specific environment within which the City of Boise operates. Local economy. Boise is the center of business and government activity within the State of Idaho, serving as its economic hub. The City provides financial, medical and commercial services for southern Idaho and a part of eastern Oregon. Corporate headquarters of several major firms contribute to the strong Boise economy with a healthy mix of business, technology, education, health care, retail, manufacturing, government and the military and professional communities, all working together to provide stability and sound prospects for Boise’s residents. While the City’s Comprehensive Annual Financial Report (CAFR) for fiscal year ended 2007 repeatedly underscores another strong year of the City’s financial and economic activity, it would be naïve to assume that the vitality experienced over the last few years contributing to the enviable bottom-line can be counted on to continue. Amid falling prices for its memory products, Micron Technologies, Inc., the State’s largest private employer, posted three straight quarters of losses, including a $320 million deficit in fiscal year 2007. Approximately 1,000 employees were without jobs as the company copes with a challenging global market for its products. Mid-year, the world’s fourth largest construction company, Washington Group International, was purchased by San Francisco-based URS Corp. in a deal valued at over $2.6 billion. The company will remain in Boise and most of its 600-plus headquarters employees will stay in place. That stated, a recent economic report from Zion’s bank asserts, “Idaho should experience moderate economic growth through 2008.” The report predicts the likelihood of the region maintaining a very tight labor availability, reasonable job creation and a softer housing market through the year. The bank’s economic consultant, Jeff Thredgold, asserts “even as the economy has slowed, the state’s long-term economic potential rivals any in the nation.” Thredgold said Idaho’s economy will still likely remain in the nation’s top 10 economies, as the state enjoyed one of the country’s lowest unemployment rates in 2007, continued solid job growth that saw a 2007 increase of 1.7 percent,
A - 4
while home prices in the year recently concluded increased almost 7 percent, the sixth highest in the nation. The City enjoys two regional medical centers that provide extensive associated medical services, one of which is completing a major facility expansion valued at over $ 160 million. Also important to the City’s economy are the activities of the federal and state government including the National Interagency Fire Center, which coordinates fire fighting on public lands throughout the United States, and a Veterans Affairs medical center. The seasonally adjusted area unemployment rate, based on the October 2007 Idaho Employment Report, was a remarkable 2.3 percent, down 0.6 percent from one year ago. This despite the loss of about 1,000 Micron jobs last summer, noted previously. Retail, education and the health care sectors showed the most significant growth in jobs. In FY 2007, the City’s economy continued to benefit from robust construction activity led by increases in commercial construction. However, the year-over-year increase was modest (2.6 percent relative to the previous year (66.5 percent in FY 2006). Single family housing followed a national trend, decreasing almost 34 percent that followed a 21 percent decline in FY 2006. Multi-family housing, typically the most volatile construction category, showed an 8.5 percent gain over the prior year, smaller than that of FY 2006 which was just under 21 percent. That said, permit fees for general, business, and subdivision applications exceeding budgeted revenue by approximately $2.6 million, or 42 percent over budget, due to the strong commercial construction activity and increased development valuation. As of September 2007, total passenger traffic at the Boise Airport continued to grow, although at a slower rate of 2.7 percent compared to the 5 percent and 11 percent experienced over the same time during 2005 and 2006, respectively. Operating revenue in FY 2007 increased over $ 1.8 million, or 7.7 percent, primarily due to increased parking revenue and interest income. Other noteworthy economic developments in FY 2007 include grocery chain WinCo announcing plans to operate a 700,000 square foot distribution center in east Boise that is expected to employee approximately 200 people, and Stevens-Henager (private) College completed a new campus center in west Boise that offers degrees in areas that include business, medical technology, computer science and graphic arts to over 300 students. In January 2008, groundbreaking will occur on a new $28 million air traffic control tower at Boise Airport that will include a new instrument landing system designed to reduce fog-related delays. Funding is being provided in full by the Federal Aviation Administration (FAA), and is expected to be completed in early 2011. The signing in December 2007 of an Omnibus Spending Bill by President Bush includes, among millions of funds for a variety of regional projects, Federal
A - 5
subsidies for the 2009 Special Olympics which will be held in Boise and surrounding communities, and a Treasure Valley community detoxification center. The City will also receive an environmental grant ($175,000) to extend its geothermal system south across the Boise River to provide heat to Boise State University. Finally, the Boise Airport received a $750,000 earmark for planning and design services to widen and lengthen one of its runways. Long-term financial planning. In recent years, the City has endeavored to maintain a totally uncommitted “cash-flow” reserve that was initially targeted to remain at 5 percent of annual revenues. Guidelines of the Government Finance Officers Association (GFOA) formally recommend five percent to be the minimum level and that this reserve range up to fifteen percent. During its June 2005 Budget Workshop, the City Council directed that the general fund cash flow reserve goal be re-set at eight percent of budgeted revenue. It was further established that the reserve requirement should be achieved using one-time monies over a five-year period at a minimum amount of $500,000 per annum. As of September 30, 2007, was $5.7 percent of the subsequent year’s operating revenues. On December 18, 2007, the City Council allocated an additional $800,000 to these reserves bringing the total balance to $9.3 million, or 6.0 percent of FY 2008 operating revenues. In the winter and spring of 2005, the Mayor and City Council conducted an ambitious and thorough Strategic Planning process that established a Vision of where they wanted the City to go, set a Mission Statement of what Boise is as a City, and defined its key Values. A Strategy Map and Balanced Score Card were important outcomes of the first phase of this strategic update. In addition, the Mayor and Council identified several principal policy focus areas, and delineated initiatives, goals and objectives for each. Through the fall and winter months of FY 2007, Phase II of the City’s Strategic Planning initiative was underway, and completed in time for funding consideration during the biennial Budget Workshop in late June. The Strategy Map that was developed as part of the initial Strategic Planning phase was actualized by two processes. A six-year business planning model was developed by every City department, creating an actionable road map to realize the strategic goals and initiatives. As well, a new leadership model for the Mayor and Council was crafted that identifies clearer roles and accountabilities for each. A change management process has enabled the City’s policy leaders and its Executive Management Team to formalize the implementation of department business plans and the attainment of its strategic objectives. The City completed one General Fund debt activity in FY 2007. It executed a defeasance of its Series 2002A Revenue Refunding Bonds, originally issued to refinance the outstanding principal balance on various essential facilities, including two fire stations. Under the then existing bond indenture, title to the fire stations had to be retained in the name of the Bond Trustee, obligating the City to

A - 6
pay property taxes each year until either the bond indenture was changed or the debt was defeased, and retired. The bonds were scheduled to fully mature on December 1, 2021. At its June Budget Workshop, Council supported a recommendation of its Financial Services staff to use an identified overcapacity in Risk Management Fund reserves to defease the entire obligation, saving at least $65,000 a year in property taxes. Further, by eliminating future interest and principal payments, this project freed up cash flow for other purposes, in an amount estimated on average, of $250,000 a year. The transaction successfully closed in October 2007. Like many other government entities across the country, the City is grappling with implementation fiscal impacts from the Government Accounting Standards Board (GASB) pronouncement (Statement 45) that sets out standards for reporting post-employment health benefits (PEHB). Boise City has traditionally funded most of its PEHB, such as life insurance, but it has not funded insurance “rate subsidies” its provides on behalf of its retired employees. Booking the value of this benefit, referred to as the Annual Required Contribution or ARC, will become a GASB-required activity beginning in the City’s FY 2008. Preliminary actuarial analysis has indicated the City’s Unfunded Actuarial Liability (UAL) for pre-Medicare subsidies for its retirees is over $13.3 million, with an associated Actuarially Required Contribution (ARC) of just under $1.9 million. These amounts are expected to increase significantly over time unless fundamental changes are made in the way the City structures its post-employment health-care benefits. The City’s GASB 45 Task Group, its Health Trustees and its Wages and Benefits Team (WBT) will continue to explore proposals and market-tested concepts that will limit cost increases while providing a equitable and competitive comprehensive benefits package for employees and retirees. Major Enterprise Funds Airport – In FY 2007, Boise Airport (BOI) enplanements were up 2.8 percent from the previous fiscal year period, significant because FY 2006 enjoyed record enplanement levels. Growth in this statistic is a key indicator of airport strength as it is the key driver of nearly all revenue sources of the facility. Airline costs per enplaned passenger, an benchmark airport efficiency and performance measure, is $3.34 for the year, slightly higher than the $3.38 for the same period last year. However, this represents a significant cost reduction under the average experienced by small hub airports which is $5.77. As noted previously, Airport and City officials teamed with the Idaho Congressional Delegation to obtain Federal Aviation Authority (FAA) approval to install and fund the Cat III approach lighting and a new air traffic control tower. This will enable aircraft to land in heavy fog with very low visibility, and will be operational in FY 2008. Both of these milestone projects are major accomplishments for the Airport which could not proceed without FAA authorization and funding.
A - 7
Sewer – The City’s sanitary sewer system is comprised of over 655 miles of pipeline. It provides wastewater treatment service not only to Boise, but also to five sewer districts and to Garden City. In 2007, the system treated over 29 million of wastewater each day. Solid Waste – Allied is the solid waste service provider under contract to the City of Boise; it serves approximately 67,000 residential and 4,000 commercial customers. The recycling component of the service diverted approximately 7,500 tons of material from the landfill. Eight household hazardous-waste pick-up sites are distributed throughout the city. Cash Management Policies and Practices. Cash temporarily idle during the year was invested in compliance with the City's investment policy. This policy has been adopted by resolution of the City Council and certified by the Association of Public Treasurers of the United States and Canada. It is currently being updated. Information regarding the types, amounts and risks of investments held are contained in the footnotes in Note IV.A. The maturities range from one day to 5.7 years. The average maturity is 505 days. The average yield on the last day of the fiscal year was 5.2 percent and the total return for the fiscal year was 5.2 percent. Total return includes the effect of increases in market value during the current year. However, increases in market value do not necessarily represent trends that will continue or cash that will be available. Increases in market value are temporary changes in the fair value of investments that the City intends to hold to maturity. Awards and Acknowledgments The Government Finance Officers Association (GFOA) awarded a Certificate of Achievement for Excellence in Financial Reporting to the City of Boise for its Comprehensive Annual Financial Report (CAFR) for the fiscal year ended September 30, 2006. This is the twelfth consecutive year that the City of Boise has earned this distinction. In order to be awarded a Certificate of Achievement, the City published an easily readable and efficiently organized CAFR. This report satisfied both GAAP and applicable legal requirements. The Certificate of Achievement is valid for a period of one year only. We believe that our most recent CAFR will continue to meet the Certificate of Achievement Program’s requirements and are submitting it to the GFOA to determine its eligibility for another certificate. In FY 2006, the City developed and published it first Popular Annual Financial Report or PAFR. The PAFR is not meant to replace the CAFR. It is intended as a supplement for a “quick-read” for citizens on City services and its overall financial condition. Having submitted its initial PAFP to the GFOA for review and comment, the City also received an award for Outstanding Achievement in Popular Annual Financial Reporting.

A - 8
In addition, Boise City government also received the GFOA’s Distinguished Budget Presentation Award for its biennial budget for FY 2006/2007. In order to qualify for the Distinguished Budget Presentation Award, the City’s budget document was judged to be successful in several categories, including its serving as a policy document, a financial plan, an operations guide, and a communications device. The preparation of this report would not have been possible without the efficient and committed services of key staff in the Department of Finance and Administration under the leadership of Controller Mike Middleton and Financial Services Manager Tonya Wallace. I would also like to express my appreciation to all City staff whose dedicated efforts resulted in a timely and successful completion of this year’s report. The Mayor and City Council have continued to demonstrate a commitment to allocate the resources needed to ensure its ability to account, audit, report, monitor, and control the financial operations and transactions of the City of Boise in a responsible and progressive manner. Sincerely,
John E. (Jef) Faw City of Boise, ID Director of Finance and Administration Chief Financial Officer


Introduction A - 10
ORGANIZATION Boise City is one of 200 cities in the State of Idaho. Bellevue is the only charter city left in Idaho. All other cities are "creatures of the state" authorized for organization by the Idaho Constitution. "The legislature shall provide by general laws for the incorporation, organization and classification of the cities and towns in proportion to the population," (Idaho Constitution Article 12, Section 1). "The legislature by general and uniform laws shall provide for such township, precinct and municipal (city) officers as probable convenience may require," (Idaho Constitution Article 18, Section 6). Boise City operates under the mayor-council system of government as a city of the first class under the general laws of the State of Idaho with a mayor and six council members. The mayor is elected to a four-year term. Council members are also elected for four-year terms, three being elected every two years to stagger the terms for continuity. The Mayor is the chief executive officer for the City, responsible for carrying out policies set by the council and for enforcing the ordinances existing in the City Code. The Mayor is assisted in this responsibility by Department Director’s appointed by the Mayor and confirmed with the consent of the council. For reporting purposes, the City is divided into eight general classifications:
1) General Government
2) Fire 3) Police
4) Parks and Recreation
5) Culture
6) Community Service
7) Community Development
8) Interest and Fiscal Charges The major classifications are subdivided into divisions and those units are further subdivided into service units for budgeting, accounting and reporting purposes.

Introduction A - 12
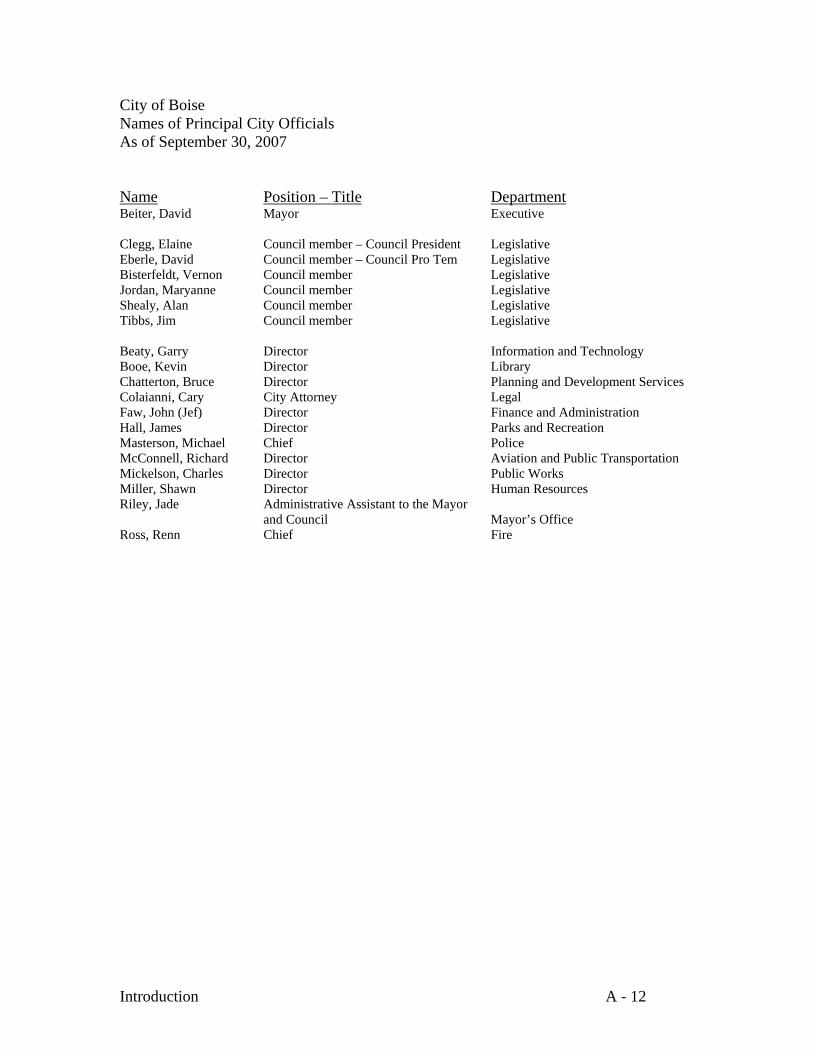
City of Boise Names of Principal City Officials As of September 30, 2007 Name Position – Title Department Beiter, David Mayor Executive Clegg, Elaine Council member – Council President Legislative Eberle, David Council member – Council Pro Tem Legislative Bisterfeldt, Vernon Council member Legislative Jordan, Maryanne Council member Legislative Shealy, Alan Council member Legislative Tibbs, Jim Council member Legislative Beaty, Garry Director Information and Technology Booe, Kevin Director Library Chatterton, Bruce Director Planning and Development Services Colaianni, Cary City Attorney Legal Faw, John (Jef) Director Finance and Administration Hall, James Director Parks and Recreation Masterson, Michael Chief Police McConnell, Richard Director Aviation and Public Transportation Mickelson, Charles Director Public Works Miller, Shawn Director Human Resources Riley, Jade Administrative Assistant to the Mayor and Council Mayor’s Office Ross, Renn Chief Fire


MD&A C - 1
Management’s Discussion and Analysis
As management of the City of Boise, we offer readers of the City of Boise’s financial statements this narrative overview and analysis of the financial activities of the City of Boise for the Fiscal Year (FY) ended September 30, 2007. We encourage readers to consider the information presented here in conjunction with additional information that we have furnished in our letter of transmittal. All amounts in this discussion and analysis, unless otherwise indicated, are expressed in thousands of dollars. Financial Highlights
The assets of the City of Boise exceeded its liabilities at September 30, 2007, by $654,628. Of this amount, unrestricted net assets of $92,553 may be used to meet the City’s on going obligations to citizens and creditors.
The total net assets increased by $42,052. Of this amount, $18,566 was associated with
governmental and $23,486 with business-type activities.
As of the close of the current FY, the City of Boise’s governmental funds reported combined ending fund balances of $75,057, an increase of $4,169 in comparison with the prior year. Of this amount, $38,846 is unreserved and available for spending. However, the City Council has designated the entire balance for future use, leaving none undesignated.
At the end of the current FY, unreserved fund balance for the General Fund (GF) was $24,603 or
18.6% of total GF expenditures.
The City of Boise’s total debt obligations decreased by the net of $4,121. Overview of the Financial Statements This discussion and analysis are intended to serve as an introduction to the City of Boise’s basic financial statements. The City of Boise’s basic financial statements are comprised of three components: 1) government-wide financial statements, 2) fund financial statements, and 3) notes to the financial statements. This report also contains other supplementary information in addition to the basic financial statements themselves. Government-wide financial statements. The government-wide financial statements are designed to provide readers with a broad overview of the City of Boise’s finances, in a manner similar to a private-sector business. The statement of net assets presents information on all of the City’s assets and liabilities, with the difference between the two reported as net assets. Over time, increases or decreases in net assets may serve as a useful indicator of whether the financial position of the City is improving or deteriorating. The statement of activities presents information showing how government’s net assets changed during the most recent FY. All changes in net assets are reported as soon as the underlying event giving rise to the change occurs, regardless of the timing of related cash flows. Thus, revenues and expenses are reported in this statement for some items that will only result in cash flows in future fiscal periods. Both of the government-wide financial statements distinguish functions of the City that are principally supported by taxes and intergovernmental revenues (governmental activities) from other functions that are intended to recover all or a significant portion of their costs through user fees and charges (business-type activities). The governmental activities of the City of Boise include general government, fire, police, parks and recreation, culture, community services, community development and other charges. The major business-type activities of the City include the airport, sewer and solid waste systems.

MD&A C - 2
The government-wide financial statements include not only the City of Boise itself (known as the primary government), but also a legally separate redevelopment agency, a component unit of the City. Financial information for this component unit, Capital City Development Corporation (CCDC), is reported separately from the financial information presented for the primary government itself. Fund financial statements. A fund is a grouping of related accounts that is used to maintain control over resources that have been segregated for specific activities or objectives. The City, like other state and local governments, uses fund accounting to ensure and demonstrate compliance with finance-related legal requirements. All of the funds of the City of Boise can be divided into three categories: governmental funds, proprietary funds, and fiduciary funds. Governmental funds. Governmental funds are used to account for essentially the same functions reported as governmental activities in the government-wide financial statements. However, unlike the government-wide financial statements, governmental fund financial statements focus on near-term inflows and outflows of spendable resources, as well as on balances of spendable resources available at the end of the FY. Such information may be useful in evaluating a government’s near-term financing requirements. Because the focus of governmental funds is narrower than that of the government-wide financial statements, it is useful to compare the information presented for governmental funds with similar information presented for governmental activities in the government-wide financial statements. By doing so, readers may better understand the long-tem impact of the government’s near-term financing decisions. Both the governmental fund balance sheet and the governmental fund statement of revenues, expenditures, and changes in fund balances provide a reconciliation to facilitate this comparison between the two. The City maintains five individual governmental funds. Information is presented separately in the governmental fund balance sheet and in the governmental fund statement of revenues, expenditures, and changes in fund balances for the general, and capital projects, which are considered major funds. Data from the other three funds, which are the community development special revenue fund, dedicated trust permanent fund and the debt service fund are combined into a single, aggregated presentation. Individual fund data for each of these non-major governmental funds is provided in the form of combining statements in a section behind the basic financial statements. The City of Boise approves a two-year budget for it’s GF. A budgetary comparison statement has been provided for the GF to demonstrate compliance with the FY 2007 budget. Proprietary funds. The City of Boise maintains two different types of proprietary funds. Enterprise funds are used to report the same functions presented as business-type activities in the government-wide financial statements. The City maintains seven individual enterprise funds. Information is presented separately in the proprietary statement of net assets and the proprietary statement of revenues, expense and changes in fund net assets for the airport, sewer and solid waste funds, which are considered major funds. Data from the other four funds, which are the geothermal, parking garage, municipal irrigation and housing rehabilitation funds are combined into a single, aggregated presentation. Individual fund data for each of these non-major proprietary funds is provided in the form of combining statements elsewhere in this report. Internal service funds are used to accumulate and allocate costs internally among the City’s various functions. The City of Boise used internal service funds to account for its fleet maintenance, arboretum, and risk management activities. Because these services predominantly benefit governmental rather than business type functions, they have been included within governmental activities in the government-wide financial statements but are combined into a single, aggregated presentation in the proprietary fund financial statements. Individual fund data for the internal service funds is provided in the form of combining statements in a section behind the basic financial statements.

MD&A C - 3
Fiduciary funds. Fiduciary funds are used to account for resources held for the benefit of parties outside the government. Fiduciary funds are not reflected in the government-wide financial statement because the resources of those funds are not available to support the City’s own programs. The accounting used for fiduciary funds is much like that used for proprietary funds. Notes to the financial statements. The notes provide additional information that is essential to a full understanding of the data provided in the government-wide and fund financial statements. Other information. In addition to the basic financial statements and accompanying notes, this report also presents certain other supplementary information. The combining statements referred to earlier in connection with non-major funds and internal service funds are presented immediately after the basic financial statements. Also included are budget comparisons for governmental funds other than the GF. Government-wide Financial Analysis As noted earlier, net assets may serve over time as a useful indicator of a government’s financial position. At September 30, 2007, the City’s assets exceeded liabilities by $654,706. By far the largest portion of the City’s net assets (80 percent) reflects its investment in capital assets, less any related outstanding debt used to acquire those assets. Capital assets are used to provide services to citizens and they are not available for future spending. Although the investment in capital assets is reported net of related debt, it should be noted that the resources needed to repay this debt must be provided from other sources, since the capital assets themselves cannot be used to liquidate these liabilities.
Governmental Activities Business Activities Total2007 2006(1) 2007 2006(1) 2007 2006(1)
Current and other assets 187,871$ 177,335$ 95,034$ 79,144$ 282,905$ 256,479$ Capital assets 165,047 152,148 440,883 427,718 605,930 579,866 Total assets 352,918 329,483 535,917 506,862 888,835 836,345
Long-term liabilities outstanding 32,866 33,523 74,608 78,458 107,474 111,981 Other liabilities 111,123 105,597 15,610 12,612 126,733 118,209 Total liabilities 143,989 139,120 90,218 91,070 234,207 230,190
Net assets:Invested in capital assets, net of related debt 158,509 143,454 363,607 346,846 522,116 490,300 Restricted 22,086 17,884 17,873 16,699 39,959 34,583 Unrestricted 28,334 29,025 64,219 58,668 92,553 87,693 Total net assets 208,929$ 190,363$ 445,699$ 422,213$ 654,628$ 612,576$
Restricted % 6.1%(1) As restated
A portion of the net assets (6.1 percent) represents resources that are subject to external restrictions on how they may be used. The balance of unrestricted net assets ($92,553) may be used to meet the City’s ongoing obligations to citizens and creditors. At the end of the current FY the City is able to report positive balances in all three categories of net assets for the government as a whole. The City is in an improving financial situation as assets are growing faster than liabilities leading to an increase in net assets. While the increase in net assets is not as large as in FY 2006, ($61,519) it was still substantial ($42,052 a 7% increase in net assets for FY 2007)

MD&A C - 4
City of Boise's Changes in Net Assets
2007 2006 2007 2006 2007 2006Revenues:Program revenues:
Charges for services 30,997$ 29,719$ 71,505$ 67,416$ 102,502$ 97,135$
Operating grants and contributions 22,459 19,507 4,389 2,401 26,848 21,908
Capital grants and contributions 5,055 23,647 27,845 24,336 32,900 47,983
General Revenues:Property taxes 88,121 83,484 88,121 83,484 Other taxes 6,940 6,937 6,940 6,937
Other 4,572 3,266 4,380 3,156 8,952 6,422 Total revenues 158,144 166,560 108,119 97,309 266,263 263,869
Expenses:
General government 22,019 16,217 22,019 16,217 Fire 31,644 30,927 31,644 30,927 Police 40,340 36,415 40,340 36,415
Parks and recreation 21,199 19,155 21,199 19,155 Culture 7,333 7,266 7,333 7,266
Community services 13,758 12,066 13,758 12,066 Community development 1,437 585 1,437 585 Interest and fiscal charges 1,872 1,929 1,872 1,929 Airport 32,880 28,622 32,880 28,622 Sewer 27,599 27,004 27,599 27,004 Solid waste 20,203 18,971 20,203 18,971 Other 3,927 3,193 3,927 3,193 Total expenses 139,602 124,560 84,609 77,790 224,211 202,350
Governmental Activities Business-type Activities Total
MD&A C - 5
City of Boise's Changes in Net Assets
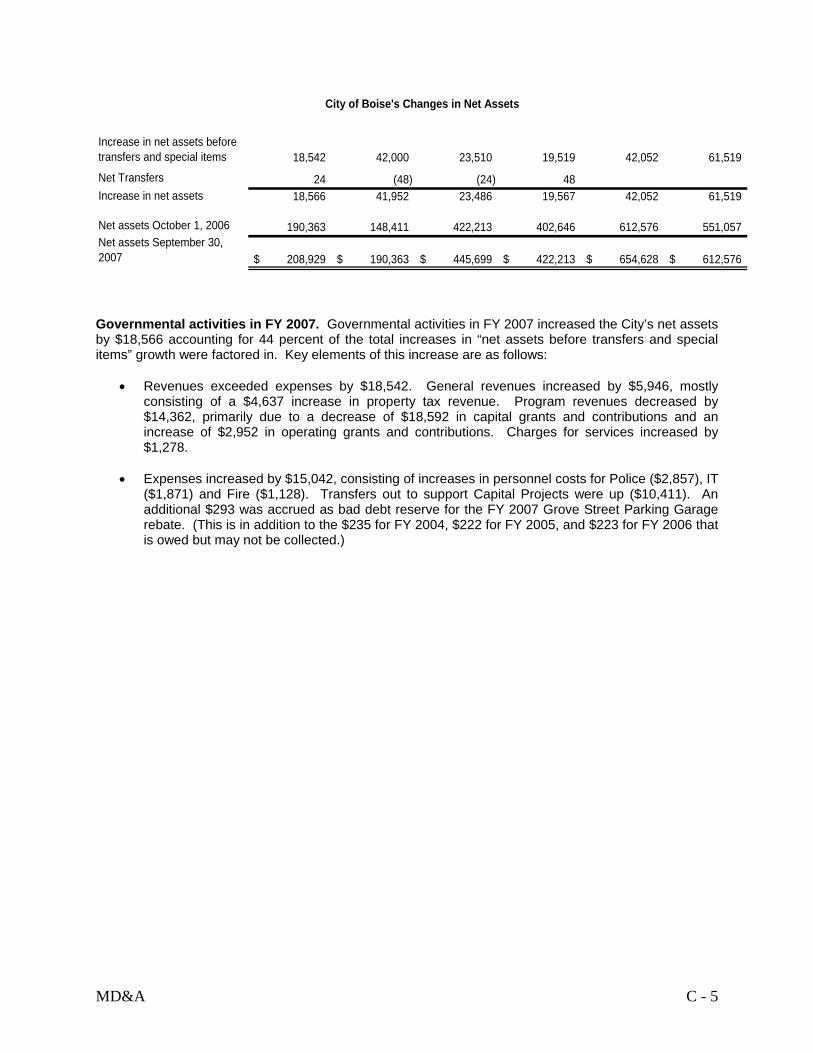
Increase in net assets before transfers and special items 18,542 42,000 23,510 19,519 42,052 61,519
Net Transfers 24 (48) (24) 48 Increase in net assets 18,566 41,952 23,486 19,567 42,052 61,519
Net assets October 1, 2006 190,363 148,411 422,213 402,646 612,576 551,057 Net assets September 30, 2007 208,929$ 190,363$ 445,699$ 422,213$ 654,628$ 612,576$
Governmental activities in FY 2007. Governmental activities in FY 2007 increased the City’s net assets by $18,566 accounting for 44 percent of the total increases in “net assets before transfers and special items” growth were factored in. Key elements of this increase are as follows:
• Revenues exceeded expenses by $18,542. General revenues increased by $5,946, mostly consisting of a $4,637 increase in property tax revenue. Program revenues decreased by $14,362, primarily due to a decrease of $18,592 in capital grants and contributions and an increase of $2,952 in operating grants and contributions. Charges for services increased by $1,278.
• Expenses increased by $15,042, consisting of increases in personnel costs for Police ($2,857), IT
($1,871) and Fire ($1,128). Transfers out to support Capital Projects were up ($10,411). An additional $293 was accrued as bad debt reserve for the FY 2007 Grove Street Parking Garage rebate. (This is in addition to the $235 for FY 2004, $222 for FY 2005, and $223 for FY 2006 that is owed but may not be collected.)

MD&A C - 6
2007 Expense and Program Revenues - Governmental Activities
-
5
10
15
20
25
30
35
40
45
Gen
eral
gove
rnm
ent
F
ire
P
olic
e
P
arks
and
recr
eatio
n
C
ultu
re
C
omm
unity
serv
ices
C
omm
unity
deve
lopm
ent
I
nter
est a
ndfis
cal c
harg
es
Expenses in 1,000,000'sRevenues in 1,000,000's
2007 Revenues by Source - Government Activities
Charges for services20%
Operating grants and contributions
14%
Capital grants and contributions
3%
Property taxes56%
Franchise fees4%
Other 3%

MD&A C - 7
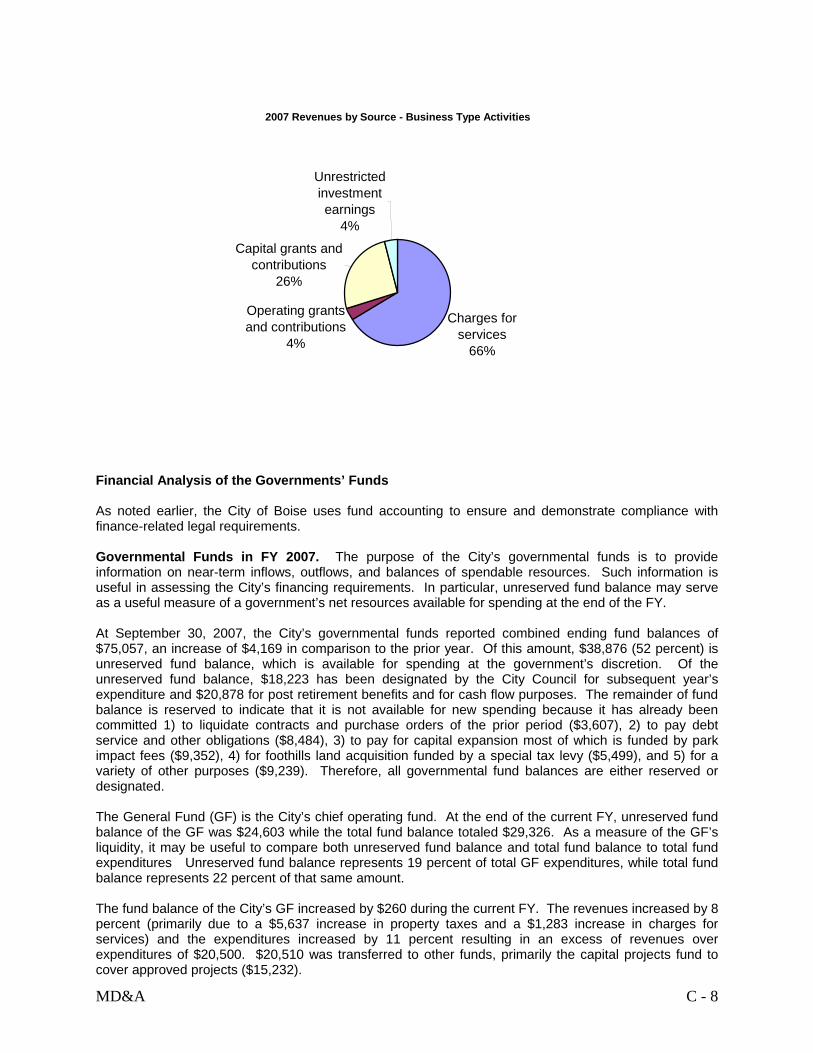
Business-type activities in FY 2007. Business-type activities in FY 2007 increased the City’s net assets by $23,486, accounting for 56 percent of the total growth in the government’s net assets. Key elements of the increase are as follows:
• Revenues increased by $10,810, the difference mostly attributed to increases in charge for services of $4,167 and capital grants of $3,509. The increase in charge for services was mostly due to airport ($1,606 from increased rates due to usage resulting in increased parking revenues $460 and passenger facility charges $300 and increased terminal rental revenue $206) and sewer ($1,504 due to increased commercial sewer billings. The capital grants increase is entirely due to airport construction.
• Expenses increased by $6,819. The increase was attributable to the Airport ($4,258)
construction projects. Solid Waste increased expenses ($1,305) primarily due to increased landfill rates from Ada County and a new contract for trash collection. Sewer equipment expenses increased ($1,241) primarily due to heavy equipment ($682) and other equipment ($384).
2007 Expense and Program Revenues - Business Type Activities
-
5
10
15
20
25
30
35
40
45
Airp
ort
Sew
er
S
olid
was
te
Oth
er
Expenses in 1,000,000'sRevenues in 1,000,000's
MD&A C - 8
2007 Revenues by Source - Business Type Activities
Charges for services
66%
Operating grants and contributions
4%
Capital grants and contributions
26%
Unrestricted investment earnings
4%
Financial Analysis of the Governments’ Funds As noted earlier, the City of Boise uses fund accounting to ensure and demonstrate compliance with finance-related legal requirements. Governmental Funds in FY 2007. The purpose of the City’s governmental funds is to provide information on near-term inflows, outflows, and balances of spendable resources. Such information is useful in assessing the City’s financing requirements. In particular, unreserved fund balance may serve as a useful measure of a government’s net resources available for spending at the end of the FY. At September 30, 2007, the City’s governmental funds reported combined ending fund balances of $75,057, an increase of $4,169 in comparison to the prior year. Of this amount, $38,876 (52 percent) is unreserved fund balance, which is available for spending at the government’s discretion. Of the unreserved fund balance, $18,223 has been designated by the City Council for subsequent year’s expenditure and $20,878 for post retirement benefits and for cash flow purposes. The remainder of fund balance is reserved to indicate that it is not available for new spending because it has already been committed 1) to liquidate contracts and purchase orders of the prior period ($3,607), 2) to pay debt service and other obligations ($8,484), 3) to pay for capital expansion most of which is funded by park impact fees ($9,352), 4) for foothills land acquisition funded by a special tax levy ($5,499), and 5) for a variety of other purposes ($9,239). Therefore, all governmental fund balances are either reserved or designated. The General Fund (GF) is the City’s chief operating fund. At the end of the current FY, unreserved fund balance of the GF was $24,603 while the total fund balance totaled $29,326. As a measure of the GF’s liquidity, it may be useful to compare both unreserved fund balance and total fund balance to total fund expenditures Unreserved fund balance represents 19 percent of total GF expenditures, while total fund balance represents 22 percent of that same amount. The fund balance of the City’s GF increased by $260 during the current FY. The revenues increased by 8 percent (primarily due to a $5,637 increase in property taxes and a $1,283 increase in charges for services) and the expenditures increased by 11 percent resulting in an excess of revenues over expenditures of $20,500. $20,510 was transferred to other funds, primarily the capital projects fund to cover approved projects ($15,232).
MD&A C - 9
The capital projects fund balance increased by $1,517 to a total fund balance of $33,062, of that amount, $20,421 is reserved for 1) park impact fees ($7,675), 2) foothills land aquisition ($5,499), 3) property held for resale that is not considered to be spendable ($5,022), and 4) liquidation of contracts and purchase orders and for other purposes ($2,225). The remaining balance of $12,641 is designated for approved projects and, therefore, all Capital Project balances were either reserved or designated. Proprietary funds in FY 2007. The City’s proprietary funds provide the same type of information found in the government-wide financial statements, but in more detail. Unrestricted net assets of the airport, sewer, and solid waste funds at the end of FY 2007 were $19,843, $43,054, and $1,198 respectively. The total increase (decrease) of restricted and unrestricted net assets was $8,920, $13,902, and ($314) for those same funds. Other factors concerning the finances of these funds have already been addressed in the discussion of the City’s business-type activities. General Fund Budgetary Highlights in FY 2007 The final GF budget is $20,207 more than the original budget. Additionally, numerous adjustments were made from contingent appropriation in general government redistributed to other activities. The use of the budget changes can be briefly summarized as follows:
• $5,700 for repaving of runway 10L28R.
• $3,725 of re-budgets and encumbrances that were either designated or reserved in prior year fund balance.
• $535 to enhance strategic planning contingency for essential projects.
• $500 to increase the General Fund cash flow reserve.
• $428 to return half of the 1% FY 2005 holdbacks to tax-supported departments..
• $400 one time employee bonus.
• $390 to fund neighborhood branch library.
• $373 for additional revenue from development fees and ACHD reimbursement.
• $350 PeopleSoft (Oracle) license renewal.
• $132 to fund the Police Department’s Lateral Transfer Program.
Revenues exceed expenditures in the final budget for GF by $3,633 while actual results were $20,500. The $4,298 difference in revenues and the $12,569 in expenditures can be summarized as follows: Revenues
• License and permit revenues exceeded the budget by $2,048. This is attributable to increased building permit fee activity. Building, heating, electrical and plumbing permit fees were over the budget by $1,950.
• External fees exceeded the budget by $755. Class registrations exceeded the budget by $351,
while building application fees were up $360.
• $498 investment income exceeded the budget amount primarily due to increased average investable balances and increased interest rates.
MD&A C - 10
• Grant revenue exceeded the budget by $304. This was primarily due to the COPS grant for
$452. The was offset by being under budget in several other grants.
Expenditures • All GF departments combined were under by $4,253 due to salary savings.
• Fire Department maintenance and operations was under by $1,505 due to the adjustment
establishing the inventory value for the store inventory ($334), rebudget of EOY, DHR (payroll) Project and Turnouts ($177) and less funding was needed for capital projects due to the increased earnings in the Capital fund. The department was also under budget on equipment by $427. This is primarily due to projects started and not complete and planned purchases not executed yet.
• Parks was under budget by $1,186 consisting of EOY funds rebudgeted ($227), Warm Springs
Golf Course contingency account ($386) and savings on power ($101).
• Planning and Development Services was under budget by $1,342 ($1,178 in maintenance and operations, $164 in equipment) due to several planning projects being funded but not completed during FY 2007 (maintenance and operations) and delayed purchases as the department adjusted to the IT reorganization.
• Information Technology was under budget by $337 in maintenance and operations. This is due
to professional services under budget by $277 due to the RFP processes not being complete for PeopleSoft Improvement Project and the GIS Needs Assessment.
• Library was under budget by $620 ($444 in maintenance and operations, $176 in equipment) due
primarily to the delay in opening branch libraries ($442 in maintenance and operations, $177 in equipment)
Capital Asset and Debt Administration Capital assets in FY 2007. The City’s investment in capital assets for its governmental and business type activities at September 30, 2007, amounts to $605,930 (net of accumulated depreciation). This investment in capital assets includes land, buildings, improvements, service lines, automobiles and equipment, and streetlights. Sidewalks, bridges, and roads belong to the Ada County Highway District (ACHD). The total increase in the City’s investment in capital assets for the current FY was 4.6 percent (a 9.1 percent increase for governmental activities and a 3.1 percent increase for business-type activities). Major capital asset events during the current FY included the following:
• $10,153 – Public Safety Facility. • $1,440 – Collister & Hillcrest Library Branches. • $986 – Hollandale Fire Station.
• $401 – Julia Davis Tennis Court Renovation.
• $290 – Boise Avenue Beautification.
• $234 – Ann Morrison Fountain Vault.
• $197 – Myrtle Land Acquistion
• $192 – Hyatt Lake Parkland Acquistion.

MD&A C - 11
• $148 – Idaho Ice World repairs.
• $82 – City Hall Security. After the FY 2007 ended, several significant contracts were approved by the City Council. While these contracts do not effect the financial reporting for FY 2007, major obligations incurred soon after the fiscal close may be considered for a more complete understanding of the financial position of the City. The contracts included the following:
• $246 – Pelletized Urea for deicing at the airport.
• $246 – PeopleSoft maintenance and support.
City of Boise's Capital Assets Net of depreciation
Governmental Activities Business-type Activities Totals
2007 2006 2007 2006 2007 2006
Land 68,116$ 64,062$ 34,467$ 28,693$ 102,583$ 92,755$ Land improvements 22,092 26,306 22,092 26,306 Buildings 40,769 34,138 177,163 179,869 217,932 214,007 Improvements other than Buildings 29,465 27,909 22,137 22,694 51,602 50,603 Service lines 128,854 119,621 128,854 119,621
Automobiles and trucks 8,600 6,748 4,564 4,253 13,164 11,001 Machinery and equipment 14,640 12,858 34,920 36,778 49,560 49,636
Construction in progress 1,828 3,642 16,245 9,035 18,073 12,677 Other capital assets 1,629 1,999 441 469 2,070 2,468
Total 165,047$ 151,356$ 440,883$ 427,718$ 605,930$ 579,074$
Additional information on the City’s capital assets can be found in note IV.D. Long-term debt in FY 2007. At the end of the current FY, the City had $110,998 in outstanding debt consisting of revenue bonds, capital leases, and an installment loan, but not compensated absences. All of the debt was secured by specific revenue sources.
MD&A C - 12
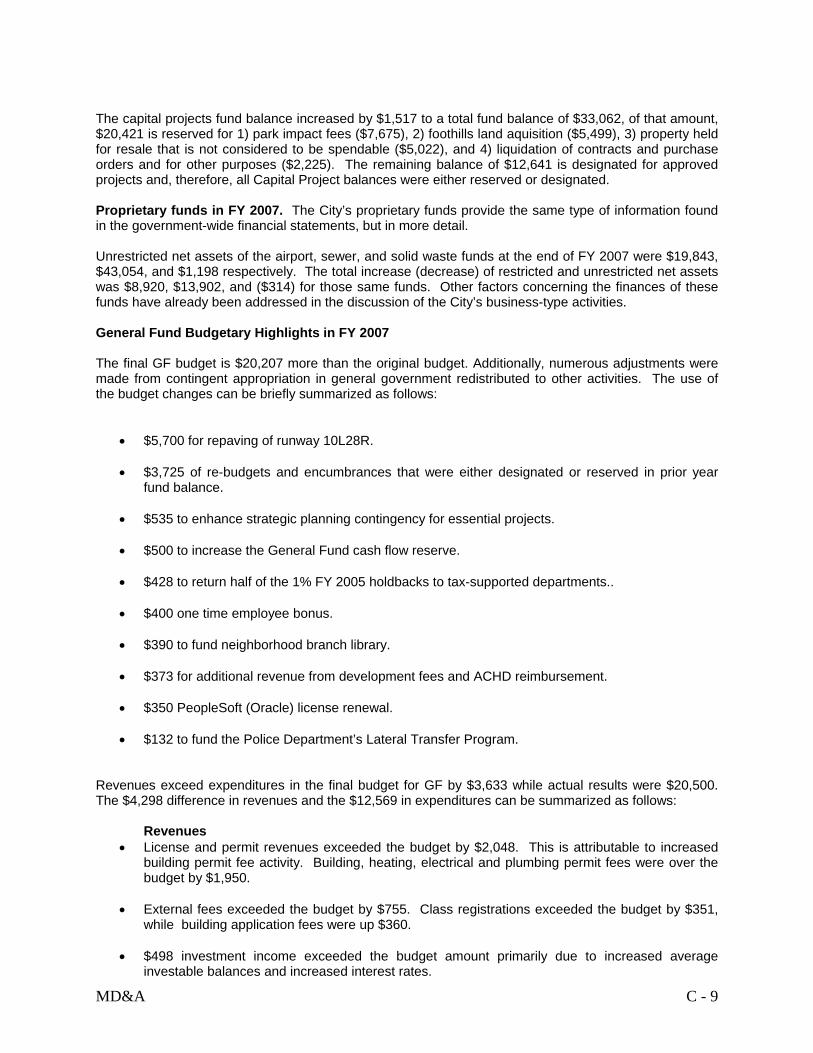
City of Boise's Outstanding Debt
Governmental Activities Business-type Activities Totals2007 2006 2007 2006 2007 2006
Revenue Bonds 28,115$ 28,710$ 20,455$ 22,560$ 48,570$ 51,270$
Capital Leases 3,641 4,084 45,975 46,955 49,616 51,039 Instalment Loans 9,302 9,727 9,302 9,727
Total 31,756$ 32,794$ 75,732$ 79,242$ 107,488$ 112,036$
The City’s total debt decreased by $4,548 during the current FY. Additional information on the City’s long-term debt for the current FY can be found in note IV. G. Economic Factors and Next Year’s Budgets and Rates The City prepares an economic forecast analysis as a component in the process of developing the two- year operating and capital budget. The assumptions in the analysis are reviewed with the City Council as background for decisions about revenue projections and cost allocations. Quarterly reports are transmitted to the City Council that provide “actuals” information relative to the projections. The following were taken into consideration by the City Council when it adopted the forecast for use in building the FY 2008 budget:
• As of September 2007, the total employment for the Boise MSA grew 4.4% and the unemployment rate fell from 3.0% to 2.0%.
• Construction value increased by 41% in FY 2006 compared to 26% in FY 2005. Since January
the increased construction rates are: commercial up 66%, single-family housing decreased 21% and multi-family housing up 20%. This has contributed to the application fees for general, business and subdivision exceeding budgeted revenue by over $653.
• External user fees earned more than projected in most areas. For example, airport terminal
services were $2,458 over projections ($1.026 due to passenger facility charges) while the community recreational services was $256 over projections.
• The City has increased base compensation for general employees by 3%.
Since that time we have received the following updates:
• The unemployment rate for the Boise City MSA in November 2007 was 2.6%. The statewide rate was 2.7%.
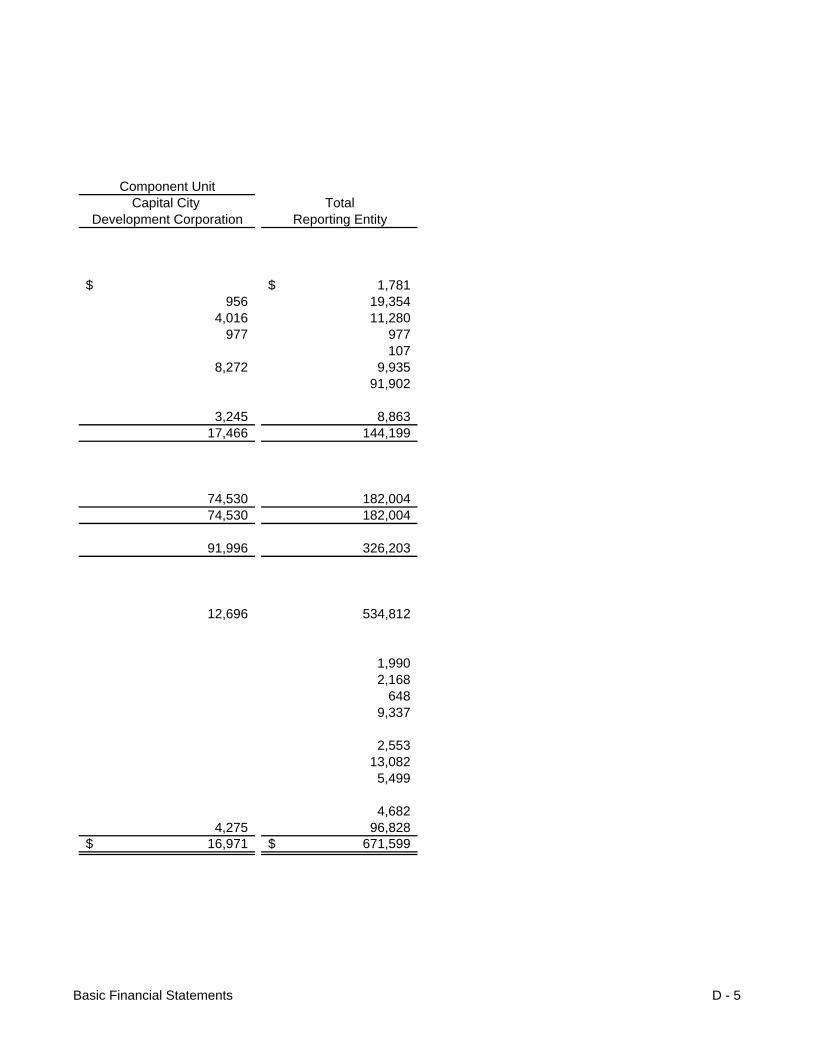
Requests for information - This financial report is designed to provide a general overview of the City of Boise’s finances for all those with an interest in the government’s finances. Questions concerning any of the information provided in this report or request for additional information should be addressed to the Division of Financial Services, City of Boise, Post Office Box 500, Boise, Idaho 83701. Component Unit - The Component Unit column in the accompanying financial statements, contain the financial data of the City’s single component unit, the Capital City Development Corporation (CCDC). CCDC is a separate and distinct legal entity created by state statute but does not have fiscal
MD&A C - 13
independence from the City. The directors are appointed by the Mayor and approved by City Council and if the CCDC should go out of business, its assets would revert to the City. CCDC is, therefore, included in the financial statement as a discretely presented component unit. CCDC provides urban renewal services and off-street parking facilities for the citizens of the City of Boise. Complete financial statements of CCDC can be obtained from its office at 800 W. Idaho Street, Boise, Idaho, c/o Todd Bunderson, Chief Financial Officer.
This page intentionally left blank

This page intentionally left blank
Basic Financial Statements D - 1

Governmental Business-typeASSETS Activities Activities Total
Current assets Cash (Note IV A) 25$ 53$ 78$ Investments (Note IV A) 83,008 61,648 144,656 Receivables (net of allowance for uncollectibles) (Note IV B) Taxes - current 92,363 92,363 Taxes - delinquent 733 733 Accounts and interest 6,259 8,060 14,319 Grants 165 3,185 3,350 Assessments 18 2,336 2,354 Mortgage loans receivable 7,415 7,415 Notes receivable Mortgage loans in process 164 164 Due from component unit 977 977 Due from primary government Due from other governmental units Interfund balances (Note IV E) (2,584) 2,584 Inventory 901 1,358 2,259 Other current assets 5,129 1,556 6,685 Prepaid items 95 224 319 Total current assets 187,089 88,583 275,672
Noncurrent assets Restricted cash and investments (Note IV A and C) 378 4,380 4,758 Long-term receivable (Note IV B) 2,047 2,047 Deferred charges 404 24 428 Capital assets not being depreciated: (Note IV D) Land 68,116 34,467 102,583 Construction in progress 1,828 16,245 18,073 Capital assets net of accumulated depreciation: (Note IV D) Land improvements 22,092 22,092 Buildings 40,769 177,163 217,932 Improvements other than buildings 29,465 22,137 51,602 Service lines 128,854 128,854 Automobiles and trucks 8,600 4,564 13,164 Machinery and equipment 14,640 34,920 49,560 Other capital assets 1,629 441 2,070 Total noncurrent assets 165,829 447,334 613,163 Total assets 352,918$ 535,917$ 888,835$
The notes to the financial statements are an intergral part of this statement.
City of Boise, IdahoStatement of Net Assets (continued)
September 30, 2007(amounts expressed in thousands)
Primary Government
Basic Financial Statements D - 2

Component UnitCapital City Total
Development Corporation Reporting Entity
4,641$ 4,719$ 144,656
6,530 98,893 733
1,418 15,737 3,350 2,354 7,415
943 943 164 977
51,820 51,820
2,259 3,779 10,464 4,069 4,388
73,200 348,872
6,050 10,808 2,047
1,531 1,959
3,944 106,527 18,073
22,092 22,582 240,514 1,536 53,138
128,854 13,164
124 49,684 2,070
35,767 648,930 108,967$ 997,802$
Basic Financial Statements D - 3

Governmental Business-typeActivities Activities Total
LIABILITIESCurrent liabilities Deficit in cash 1,781$ $ 1,781$ Accounts payable 8,427 9,971 18,398 Other accrued liabilities 6,835 429 7,264 Due to primary government Due to component unit 107 107 Unearned revenue 413 1,250 1,663 Deferred revenue - property tax 91,902 91,902 Long term debt - due within one year (Note IV G) 1,658 3,960 5,618 Total current liabilities 111,123 15,610 126,733
Noncurrent liabilities: Long term debt - due in more than one year (Note IV G) 32,866 74,608 107,474 Total noncurrent liabilities 32,866 74,608 107,474
Total liabilities 143,989 90,218 234,207
NET ASSETSInvested in capital assets, net of related debt 158,509 363,607 522,116 Restricted for: Restricted for replacements: West Boise Sewer District 1,990 1,990 Garden City Sewer District 2,168 2,168 Restricted for debt 648 648 Restricted for housing loans 9,337 9,337 Restricted for permanent funds: Nonexpendable 2,553 2,553 Capital expansion 9,352 3,730 13,082 Foothills levy 5,499 5,499 Post-retirement benefits and other restricted debt service 4,682 4,682 Unrestricted 28,334 64,219 92,553 Total net assets 208,929$ 445,699$ 654,628$
The notes to the financial statements are an intergral part of this statement.
(amounts expressed in thousands)
Primary Government
City of Boise, IdahoStatement of Net Assets (continued)
September 30, 2006
Basic Financial Statements D - 4
Component UnitCapital City Total
Development Corporation Reporting Entity
$ 1,781$ 956 19,354
4,016 11,280 977 977
107 8,272 9,935
91,902
3,245 8,863 17,466 144,199
74,530 182,004 74,530 182,004
91,996 326,203
12,696 534,812
1,990 2,168
648 9,337
2,553
13,082 5,499
4,682 4,275 96,828
16,971$ 671,599$
Basic Financial Statements D - 5

Operating Capital Charges for Grants and Grants and
Functions/Programs Expenses Services Contributions ContributionsPrimary government: Governmental activities: General government 22,019$ 5,324$ 18,948$ 9$ Fire 31,644 3,471 111 1,562 Police 40,340 3,707 974 8 Parks and recreation 21,199 7,654 259 2,925 Culture 7,333 484 419 Community services 13,758 10,357 308 551 Community development 1,437 1,440 Interest and fiscal charges 1,872 Total governmental activities 139,602 30,997 22,459 5,055
Business-type activities: Airport 32,880 23,624 671 16,504 Sewer 27,599 25,570 1,670 11,099 Solid waste 20,203 19,707 32 Other 3,927 2,604 2,016 242 Total business-type activities 84,609 71,505 4,389 27,845 Total primary government 224,211$ 102,502$ 26,848$ 32,900$
Component unit: Capital City Development Corporation Total component unit
General revenues: Taxes: Property taxes, levied for general purposes Property taxes, levied for debt service Franchises, based on gross receipts Unrestricted investment earningsInterfund transfers, net Total general revenues, special items and transfers Change in net assetsNet assets-beginning, as restatedNet assets-ending
Program Revenues
(amounts expressed in thousands)
City of Boise, IdahoStatement of Activities (continued)
For the Fiscal Year Ended September 30, 2007
Basic Financial Statements D - 6

Component UnitCapital City
Governmental Business-type Development Activities Activities Total Corporation Reporting Entity
2,262$ $ 2,262$ $ 2,262$ (26,500) (26,500) (26,500) (35,651) (35,651) (35,651) (10,361) (10,361) (10,361) (6,430) (6,430) (6,430) (2,542) (2,542) (2,542)
3 3 3 (1,872) (1,872) (1,872)
(81,091) (81,091) (81,091)
7,919 7,919 7,919 10,740 10,740 10,740
(464) (464) (464) 935 935 935
19,130 19,130 19,130 (81,091) 19,130 (61,961) (61,961)
5,204 5,204 5,204 5,204
85,438 85,438 85,438 2,683 2,683 2,683 6,940 6,940 6,940 4,572 4,380 8,952 332 9,284
24 (24)
99,657 4,356 104,013 332 104,345 18,566 23,486 42,052 5,536 47,588
190,363 422,213 612,576 11,435 624,011 208,929$ 445,699$ 654,628$ 16,971$ 671,599$
Total Primary Government
Net (Expense) Revenue and Changes in Net Assets
Basic Financial Statements D - 7

City of Boise, IdahoBalance Sheet
Governmental FundsSeptember 30, 2007
(amounts expressed in thousands)
Other Total
General Capital Projects Funds FundsASSETSCash and cash equivalents (Note IV A) $ $ 3$ 3$ Investments (Note IV A) 50,030 13,250 10,405 73,685 Receivables (net of allowance for uncollectibles) (Note IV B) Taxes - current 92,363 92,363 Taxes - delinquent 731 2 733 Accounts and interest 5,523 486 127 6,136 Grants 13 113 39 165 Assessments 18 18 Due from component unit 977 977 Interfund receivables (Note IV E) 2,762 15,906 2,223 20,891 Inventory 807 807 Prepaid items 95 95 Restricted assets: (Note IV C) Restricted cash and investments 378 378 Property held for resale 5,129 5,129 Total assets 153,319$ 34,886$ 13,175$ 201,380$
LIABILITIES AND FUND BALANCESLiabilities: Deficit in cash 470$ 995$ 316$ 1,781$
Accounts and interest payable 8,202 37 50 8,289 Other accrued liabilities 703 661 1,364 Interfund payables (Note IV E) 21,582 130 136 21,848 Unearned revenue 312 4 316 Deferred revenue - property tax (Note IV B) 92,724 1 92,725 Total liabilities 123,993 1,824 506 126,323
Fund balances: Reserved for: Capital expansion 1,677 7,675 9,352 Foothills land acquistion 5,499 5,499 Inventory, prepaids and other assets not available for spending 557 5,022 5,579 Encumbrances 1,382 2,225 3,607 Debt service and other obligations 8,484 8,484 Dedicated purposes 1,107 2,553 3,660 Unreserved: Designated for subsequent years' expenditures, reported in: (Note IV I) General fund 3,725 3,725 Capital projects fund 12,641 12,641 Debt service fund 1,632 1,632 Designated for special purposes (Note IV I) 20,878 20,878 Total fund balances 29,326 33,062 12,669 75,057 Total liabilities and fund balances 153,319$ 34,886$ 13,175$ 201,380$
The notes to the financial statements are an integral part of this statement.
Governmental Governmental
Basic Financial Statements D - 8

Amounts reported for governmental activities in the statement of net assets are different because:
Total fund balances--total governmental funds 75,057$
Capital assets used in governmental activities are not financial resources and, therefore are not reported in the funds. 164,082
Internal service funds are used to charge the costs of certain activities, such as insurance, automotive equipment, and plant material and trees, to individual funds. The assets and liabilities of the internal service funds are included in governmental activities in the statement of net assets. 3,639
Property taxes receivable will be collected this year, but are not available soon enough to pay for the current period's expenditures, and therefore are reported as deferred and unearned revenue in the funds. (Note IV B) 823
Long-term liabilities are not due and payable in the current period and therefore are not reported in the funds.
Accrued interest (624)$ Bonds payable (28,115) Capital leases (3,641) Discount on refunding 482 Bond issuance costs 404 Compensated absences (3,178)
(34,672)
Net assets of governmental activities 208,929$
(amounts expressed in thousands)
City of Boise, IdahoReconciliation of the Balance Sheet of Governmental Funds
to the Statement of Net AssetsSeptember 30, 2007
Basic Financial Statements D - 9
City of Boise, IdahoStatement of Revenues, Expenditures, and Changes in Fund Balances
Governmental FundsFor the Fiscal Year Ended September 30, 2007
(amounts expressed in thousands)
Other TotalCapital Governmental Governmental
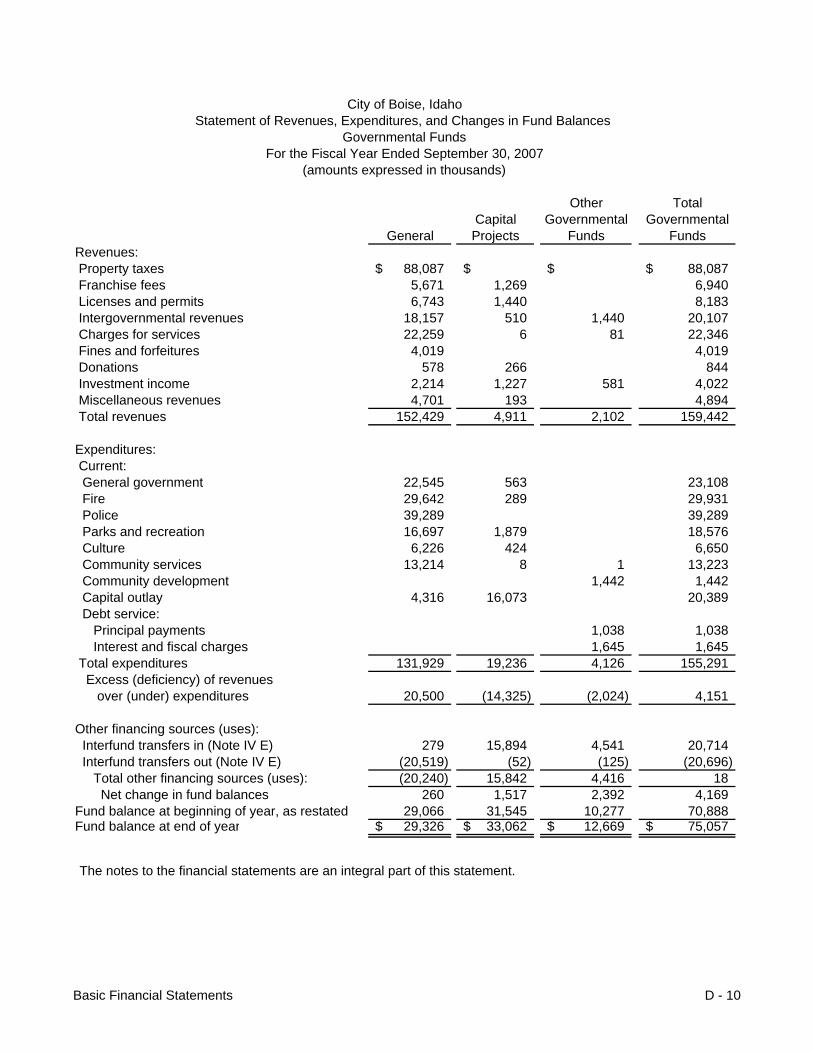
General Projects Funds FundsRevenues: Property taxes 88,087$ $ $ 88,087$ Franchise fees 5,671 1,269 6,940 Licenses and permits 6,743 1,440 8,183 Intergovernmental revenues 18,157 510 1,440 20,107 Charges for services 22,259 6 81 22,346 Fines and forfeitures 4,019 4,019 Donations 578 266 844 Investment income 2,214 1,227 581 4,022 Miscellaneous revenues 4,701 193 4,894 Total revenues 152,429 4,911 2,102 159,442
Expenditures: Current: General government 22,545 563 23,108 Fire 29,642 289 29,931 Police 39,289 39,289 Parks and recreation 16,697 1,879 18,576 Culture 6,226 424 6,650 Community services 13,214 8 1 13,223 Community development 1,442 1,442 Capital outlay 4,316 16,073 20,389 Debt service: Principal payments 1,038 1,038 Interest and fiscal charges 1,645 1,645 Total expenditures 131,929 19,236 4,126 155,291 Excess (deficiency) of revenues over (under) expenditures 20,500 (14,325) (2,024) 4,151
Other financing sources (uses): Interfund transfers in (Note IV E) 279 15,894 4,541 20,714 Interfund transfers out (Note IV E) (20,519) (52) (125) (20,696) Total other financing sources (uses): (20,240) 15,842 4,416 18 Net change in fund balances 260 1,517 2,392 4,169 Fund balance at beginning of year, as restated 29,066 31,545 10,277 70,888 Fund balance at end of year 29,326$ 33,062$ 12,669$ 75,057$
The notes to the financial statements are an integral part of this statement.
Basic Financial Statements D - 10

Amounts reported for governmental activities in the statement of activities are different because:
Net change in fund balances--total governmental funds 4,169$
Net revenues (expenses) of certain internal service funds is included with governmental activities. 52
Some of the City's taxes will be collected after year end, but, are not available soon enough for the current period's expenditure's and therefore are reported as deferred revenue in the funds. The amount represents the net change in deferred revenue. 34
Governmental funds report capital outlays as expenditures. However, in the Statement of Activities the cost of those assets is allocated over their estimated useful lives and reported as depreciation expense. This is the amount by which capital outlay ($20,390) exceeded depreciation ($7,817) in the current period. 12,573
The net effect of various transactions involving capital assets (i.e., sales and donations) is to increase net assets. (Note II) 1,167 The issuance of long-term debt (e.g., bonds, leases) provides current financial resources to governmental funds, while repayment of the principal of long-term debt consumes the current financial resources of governmental funds. Neither transaction, however, has any effect on net assets. Also, governmental funds report the effect of issuance costs, premiums, discounts, and similar items when debt is first issued, whereas these amounts are deferred and amortized in the Statement of Activities. This amount represents the net effect of these differences in the treatment of long-term debt and related items. (Note II) 1,022
Interest expense in the Statement of Activities differ from the amount reported in governmental funds. Additional accrued interest was calculated for bonds and notes payable, and the difference arising from the advance refunding and is being amortized (added to interest expense for the year). This amount represents the net change in accrued interest. (165)
Compensated absences reported in the Statement of Activities do not require the use of current financial resources and therefore are not reported as expenditures in governmental funds. This amount represents the net change in compensated absences. (286)
Change in net assets of governmental activities 18,566$
The notes to the financial statements are an integral part of this statement.
(amounts expressed in thousands)
City of Boise, IdahoReconciliation of the Statement of Revenues, Expenditures,
to the Statement of Activities (continued)For the Fiscal Year Ended September 30, 2007
and Changes in Fund Balances of Governmental Funds
Basic Financial Statements D - 11

This page intentionally left blank
Basic Financial Statements D - 12

Actual Variances with Original Final Amounts Final Budget
Revenues: Property taxes 88,008$ 88,008$ 88,087$ 79$ Franchise fees 5,579 5,579 5,671 92 Licenses and permits 4,635 4,695 6,743 2,048 Intergovernmental revenues 16,639 17,758 18,157 399 Charges for services 19,770 21,083 22,259 1,176 Fines and forfeitures 3,388 3,953 4,019 66 Donations 94 523 578 55 Investment income 716 1,716 2,214 498 Miscellaneous revenues 1,310 4,816 4,701 (115) Total revenues 140,139 148,131 152,429 4,298
Expenditures: Current: General government 26,191 28,873 22,545 6,328 Fire 30,500 30,929 29,642 1,287 Police 36,491 38,855 39,289 (434) Parks and recreation 16,288 17,471 16,697 774 Culture 6,134 6,749 6,226 523 Community services 12,987 14,571 13,214 1,357 Capital outlay 3,692 7,050 4,316 2,734 Total expenditures 132,283 144,498 131,929 12,569 Excess of revenues over expenditures 7,856 3,633 20,500 16,867
Other financing sources (uses): Interfund transfers in (Note IV E) 211 628 279 (349) Interfund transfers out (Note IV E) (8,067) (22,543) (20,519) 2,024 Total other financing sources (uses): (7,856) (21,915) (20,240) 1,675 Net change in fund balances (18,282) 260 18,542 Fund balance at beginning of year,as restated 29,066 29,066 29,066 Fund balance at end of year 29,066$ 10,784$ 29,326$ 18,542$
The notes to the financial statements are an integral part of this statement.
(amounts expressed in thousands)
Budgeted Amounts
City of Boise, IdahoGeneral Fund
Statement of Revenues, Expenditures, and Changes in Fund Balances - Budget and ActualFor the Fiscal Year Ended September 30, 2007
Basic Financial Statements D - 13
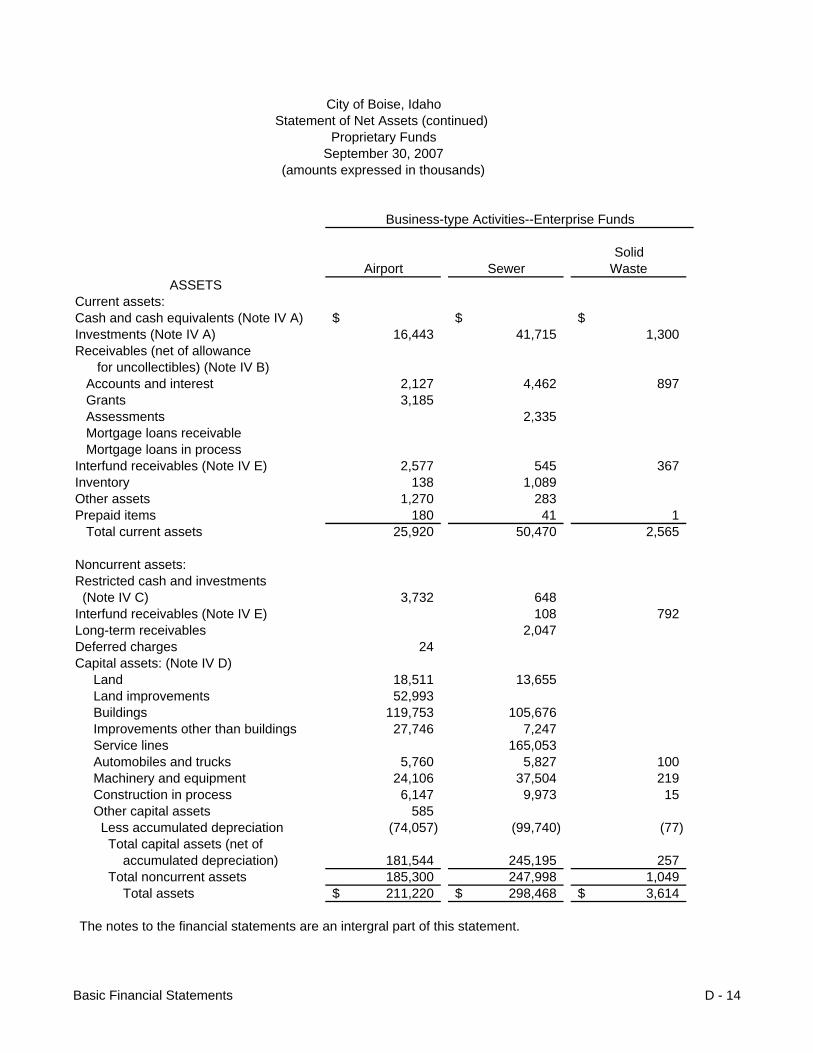
SolidAirport Sewer Waste
ASSETSCurrent assets:Cash and cash equivalents (Note IV A) $ $ $ Investments (Note IV A) 16,443 41,715 1,300 Receivables (net of allowance for uncollectibles) (Note IV B) Accounts and interest 2,127 4,462 897 Grants 3,185 Assessments 2,335 Mortgage loans receivable Mortgage loans in processInterfund receivables (Note IV E) 2,577 545 367 Inventory 138 1,089 Other assets 1,270 283 Prepaid items 180 41 1 Total current assets 25,920 50,470 2,565
Noncurrent assets:Restricted cash and investments (Note IV C) 3,732 648 Interfund receivables (Note IV E) 108 792 Long-term receivables 2,047 Deferred charges 24 Capital assets: (Note IV D) Land 18,511 13,655 Land improvements 52,993 Buildings 119,753 105,676 Improvements other than buildings 27,746 7,247 Service lines 165,053 Automobiles and trucks 5,760 5,827 100 Machinery and equipment 24,106 37,504 219 Construction in process 6,147 9,973 15 Other capital assets 585 Less accumulated depreciation (74,057) (99,740) (77) Total capital assets (net of accumulated depreciation) 181,544 245,195 257 Total noncurrent assets 185,300 247,998 1,049 Total assets 211,220$ 298,468$ 3,614$
The notes to the financial statements are an intergral part of this statement.
(amounts expressed in thousands)
City of Boise, IdahoStatement of Net Assets (continued)
Proprietary FundsSeptember 30, 2007
Business-type Activities--Enterprise Funds
Basic Financial Statements D - 14

GovernmentalOther Nonmajor Activities-Business-type Internal Service
Funds Totals Funds
53$ 53$ 22$ 2,190 61,648 9,323
574 8,060 123 3,185
1 2,336 7,415 7,415
164 164 104 3,593 295 131 1,358 94
3 1,556 2 224
10,637 89,592 9,857
4,380 900 2,047
24
2,301 34,467 52,993
10,462 235,891 1,215 1,341 36,334 84 5,333 170,386
114 11,801 108 738 62,567 161 110 16,245 13
585 (6,512) (180,386) (616)
13,887 440,883 965 13,887 448,234 965 24,524$ 537,826$ 10,822$
Basic Financial Statements D - 15
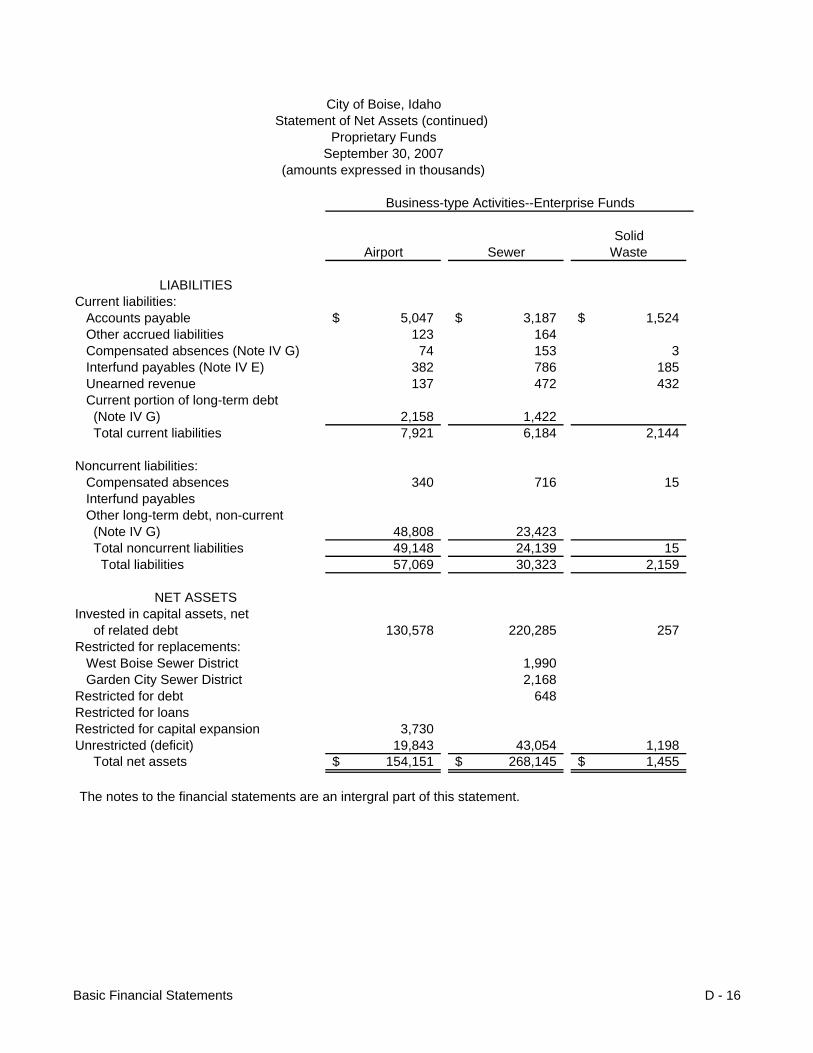
SolidAirport Sewer Waste
LIABILITIESCurrent liabilities: Accounts payable 5,047$ 3,187$ 1,524$ Other accrued liabilities 123 164 Compensated absences (Note IV G) 74 153 3 Interfund payables (Note IV E) 382 786 185 Unearned revenue 137 472 432 Current portion of long-term debt (Note IV G) 2,158 1,422 Total current liabilities 7,921 6,184 2,144
Noncurrent liabilities: Compensated absences 340 716 15 Interfund payables Other long-term debt, non-current (Note IV G) 48,808 23,423 Total noncurrent liabilities 49,148 24,139 15 Total liabilities 57,069 30,323 2,159
NET ASSETSInvested in capital assets, net of related debt 130,578 220,285 257 Restricted for replacements: West Boise Sewer District 1,990 Garden City Sewer District 2,168 Restricted for debt 648 Restricted for loansRestricted for capital expansion 3,730 Unrestricted (deficit) 19,843 43,054 1,198 Total net assets 154,151$ 268,145$ 1,455$
The notes to the financial statements are an intergral part of this statement.
City of Boise, IdahoStatement of Net Assets (continued)
Proprietary Funds
Business-type Activities--Enterprise Funds
September 30, 2007(amounts expressed in thousands)
Basic Financial Statements D - 16

GovernmentalOther Nonmajor Activities-Business-type Internal Service
Funds Totals Funds
213$ 9,971$ 245$ 142 429 4,847 10 240 12
191 1,544 1,387 209 1,250 97
140 3,720 905 17,154 6,588
46 1,117 60 108 108 792
1,260 73,491 1,414 74,716 852 2,319 91,870 7,440
12,487 363,607 965
1,990 2,168
648 9,337 9,337
3,730 381 64,476 2,417
22,205$ 445,956$ 3,382$
Basic Financial Statements D - 17

Amounts reported for business-type activities in the statement of net assets are different because:
Total net assets for Proprietary Funds Statement of Net Assets: 445,956$
Net revenues (expenses) of certain internal service funds is reported with business-type activities for the current year. (257)
Net assets of business-type activities 445,699$
The notes to the financial statements are an integral part of this statement.
City of Boise, IdahoReconciliation of the Proprietary Funds Statement of Net Assets
to the Statement of Net AssetsSeptember 30, 2007
Basic Financial Statements D - 18

This page intentionally left blank
Basic Financial Statements D - 19

SolidAirport Sewer Waste
Operating revenues: Charges for services: Program income $ $ $ Interest income Rental income 5,436 User fees 4,312 25,704 19,707 Parking and concessions 13,876 Total charges for services 23,624 25,704 19,707 Miscellaneous revenues 184 1,670 32 DonationsTotal operating revenues 23,808 27,374 19,739
Operating expenses: Personal services 6,884 10,034 285 Contractual services and utilities 11,643 7,444 19,864 Supplies and materials 331 559 38 Depreciation 11,101 7,721 15 Total operating expenses 29,959 25,758 20,202
Operating income (loss) (6,151) 1,616 (463)
Nonoperating revenues (expenses) Operating grants 487 Developer contributed refund (933) Interest revenue 939 2,951 252 Interest expense (2,876) (825) Total nonoperating revenues (expenses) (1,450) 1,193 252
Income (loss) before interfund transfers and contributions (7,601) 2,809 (211) Capital contributions 8,649 11,117 Passenger facility charges 7,026 Customer facility charges 829 Interfund transfers in (Note IV E) 17 Interfund transfers out (Note IV E) (24) (103)
Change in net assets 8,920 13,902 (314)
Total net assets - beginning, as restated 145,231 254,243 1,769
Total net assets - ending 154,151$ 268,145$ 1,455$
Statement of Revenues, Expenses, and Changes in Fund Net AssetsProprietary Funds
For the Fiscal Year Ended September 30, 2007(amounts expressed in thousands)
Business-type Activities - Enterprise Funds
City of Boise, Idaho
Basic Financial Statements D - 20

Total Nonmajor Governmental Activities-Business-type Funds Totals Internal Service Funds
1,162$ 1,162$ $ 320 320
5,436 640 50,363 5,364 482 14,358
2,604 71,639 5,364 17 1,903 396
7 2,621 73,542 5,767
783 17,986 938 2,490 41,441 4,811
(32) 896 549 592 19,429 68
3,833 79,752 6,366
(1,212) (6,210) (599)
1,999 2,486 (933)
104 4,246 550 (84) (3,785) (38)
2,019 2,014 512
807 (4,196) (87) 242 20,008
7,026 829
68 85 (127)
1,117 23,625 (87)
21,088 422,331 3,469
22,205$ 445,956$ 3,382$ The notes to the financial statements are an integral prart of this statement.
Basic Financial Statements D - 21

Amounts reported for business-type activities in the statement of activities are different because:
Net change in net assets--total business-type funds 23,625$
Net revenues (expenses) of certain internal service funds is reported with business-type activities. (139)
Change in net assets of business-type activities 23,486$
The notes to the financial statements are an integral part of this statement.
For the Fiscal Year Ended September 30, 2007
City of Boise, IdahoReconciliation of the Statement of Revenues, Expenses,
and Changes in Fund Net Assets of Proprietary Fundsto the Statement of Activities
Basic Financial Statements D - 22

This page intentionally left blank
Basic Financial Statements D - 23

Airport SewerCASH FLOWS FROM OPERATING ACTIVITIES Receipts from customers and users 23,219$ 24,844$ Receipts from interfund services used 9 Payments to suppliers (9,502) (7,709) Payments to employees (6,844) (9,966) Payments for interfund services provided (257) (175) Payments for interfund services used (514) Other operating revenue received 4,110 1,931 Other operating payments (27) Net cash provided (used) by operating activities 10,708 8,411 CASH FLOWS FROM NONCAPITAL FINANCING ACTIVITIES Transfers to other funds (24) Receipts from advances to other funds 74 Operating grants received 487 Transfers from other funds 17 Payments for advances from other funds Interest paid Net cash provided (used) by noncapital financing activities 504 50 CASH FLOWS FROM CAPITAL AND RELATED FINANCING ACTIVITIES Acquisition and construction of capital assets (10,249) (21,998) Proceeds from sale of capital assets 27 18 Proceeds from land sale 4 Mobile home lot sales Principal paid on debt (2,120) (1,390) Interest paid on financing (2,820) (1,073) Proceeds from interfund payables Capital contributions received Capital grants received 5,800 Hook-on fees received 7,411 Developer contributed refunds paid (993) Passenger facility charges 6,939 Customer facility charges 818 Net cash provided (used) by capital and related financing activities (1,605) (18,021)
The notes to the financial statements are an intergral part of this statement.
Business-type Activities -Enterprise Funds
City of Boise, IdahoStatement of Cash Flows (continued)
Proprietary FundsFor the Fiscal Year Ended September 30, 2007
(amounts expressed in thousands)
Basic Financial Statements D - 24

Solid Total Nonmajor Governmental Activities-Waste Business-type Funds Totals Internal Service Funds
19,939$ 1,012$ 69,014$ 5,344$ 10 17 36 1,314
(19,903) (2,420) (39,534) (5,099) (285) (779) (17,874) (926) (285) (64) (781) (138)
(9) (523) (1) 32 264 6,337 403
(177) (204) (492) (2,156) 16,471 897
(103) (127) 74
1,999 2,486 68 85
(74) (74) (27) (8) (8)
(103) 1,985 2,436 (27)
(227) (623) (33,097) (20) 153 1 199 1
159 163 15 15
(140) (3,650) (75) (3,968) (38)
27 27 56 56
5,800 7,411 (993)
6,939 818
(47) (607) (20,280) (57)
Basic Financial Statements D - 25
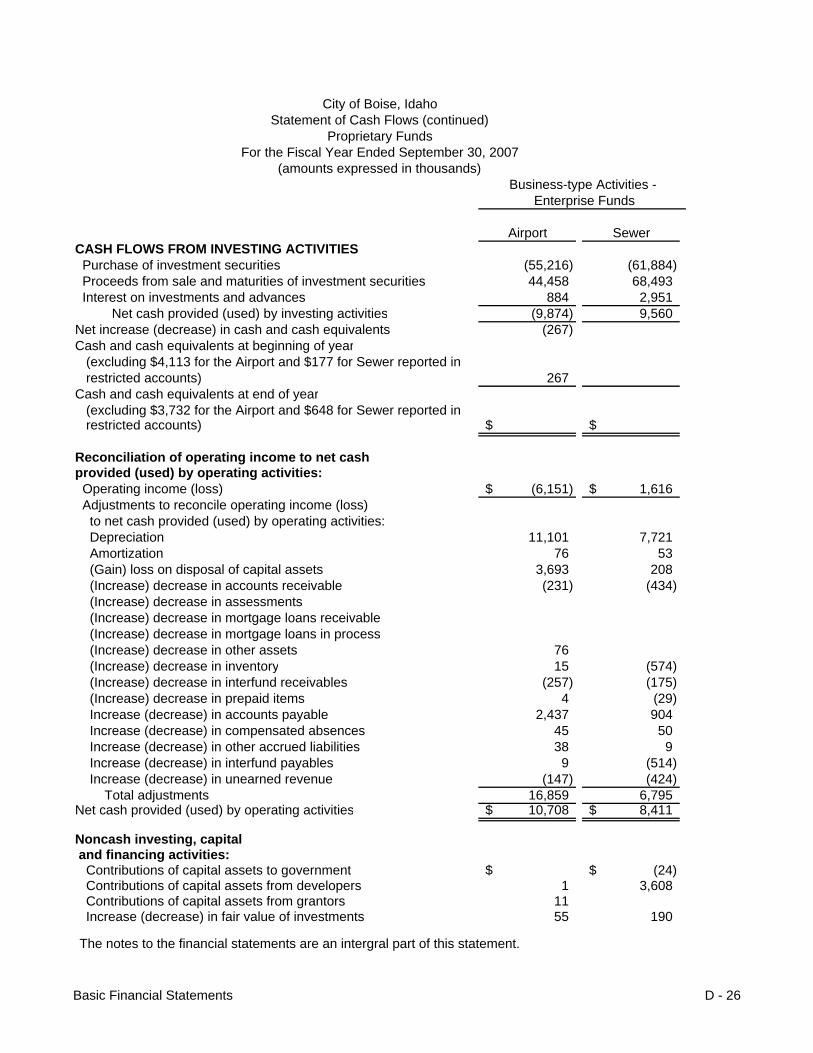
Airport SewerCASH FLOWS FROM INVESTING ACTIVITIES Purchase of investment securities (55,216) (61,884) Proceeds from sale and maturities of investment securities 44,458 68,493 Interest on investments and advances 884 2,951 Net cash provided (used) by investing activities (9,874) 9,560 Net increase (decrease) in cash and cash equivalents (267) Cash and cash equivalents at beginning of year (excluding $4,113 for the Airport and $177 for Sewer reported in restricted accounts) 267 Cash and cash equivalents at end of year (excluding $3,732 for the Airport and $648 for Sewer reported in restricted accounts) $ $
Reconciliation of operating income to net cashprovided (used) by operating activities: Operating income (loss) (6,151)$ 1,616$ Adjustments to reconcile operating income (loss) to net cash provided (used) by operating activities: Depreciation 11,101 7,721 Amortization 76 53 (Gain) loss on disposal of capital assets 3,693 208 (Increase) decrease in accounts receivable (231) (434) (Increase) decrease in assessments (Increase) decrease in mortgage loans receivable (Increase) decrease in mortgage loans in process (Increase) decrease in other assets 76 (Increase) decrease in inventory 15 (574) (Increase) decrease in interfund receivables (257) (175) (Increase) decrease in prepaid items 4 (29) Increase (decrease) in accounts payable 2,437 904 Increase (decrease) in compensated absences 45 50 Increase (decrease) in other accrued liabilities 38 9 Increase (decrease) in interfund payables 9 (514) Increase (decrease) in unearned revenue (147) (424) Total adjustments 16,859 6,795 Net cash provided (used) by operating activities 10,708$ 8,411$
Noncash investing, capital and financing activities: Contributions of capital assets to government $ (24)$ Contributions of capital assets from developers 1 3,608 Contributions of capital assets from grantors 11 Increase (decrease) in fair value of investments 55 190
The notes to the financial statements are an intergral part of this statement.
Business-type Activities - Enterprise Funds
City of Boise, IdahoStatement of Cash Flows (continued)
Proprietary FundsFor the Fiscal Year Ended September 30, 2007
(amounts expressed in thousands)
Basic Financial Statements D - 26

Solid Total Nonmajor Governmental Activities-Waste Business-type Funds Totals Internal Service Funds
(739) (2,218) (120,057) (12,262) 975 2,805 116,731 10,857 251 112 4,198 476 487 699 872 (929)
(155) (79) (501) (116)
155 132 554 138
$ 53$ 53$ 22$
(463)$ (1,212)$ (6,210)$ (599)$
15 593 19,430 68 129
61 3,962 466 323 124 (14)
(1) (1) (1,825) (1,825)
(105) (105) 76
(70) (629) 2 (285) (51) (768) (138)
4 (21) 1 (1) 102 3,442 90 (1) 6 100
9 56 179 10 (5) (500) 1,313
(233) 15 (789) (5) (29) (944) 22,681 1,496
(492)$ (2,156)$ 16,471$ 897$
$ $ (24)$ $3,609
11 1 1 247 55
Basic Financial Statements D - 27

Health InsuranceSelf Funding Trust FundTrust Fund
ASSETS Cash and cash equivalents (Note IV A) 1,208$ 37$ Receivables: (Note IV B) Accounts receivable 989 Interest and dividends 15 1 Investments, at fair value: (Note IV A) U.S. Government Agency Securities Funds 1,451 100 Other investments 1,618 230 Total investments 3,069 330 Total assets 5,281 368
LIABILITIES Accounts and interest payable 1,414 126 Refunds payable and other 242 Total liabilities 1,414 368$
NET ASSETSHeld in trust for: Employees' health insurance benefits 3,867 Total net assets 3,867$
The notes to the financial statements are an intergral part of this statement.
Boise City
Agency Fund
(amounts expressed in thousands)
City of Boise, IdahoStatement of Fiduciary Net Assets
Fiduciary FundsSeptember 30, 2007
Basic Financial Statements D - 28
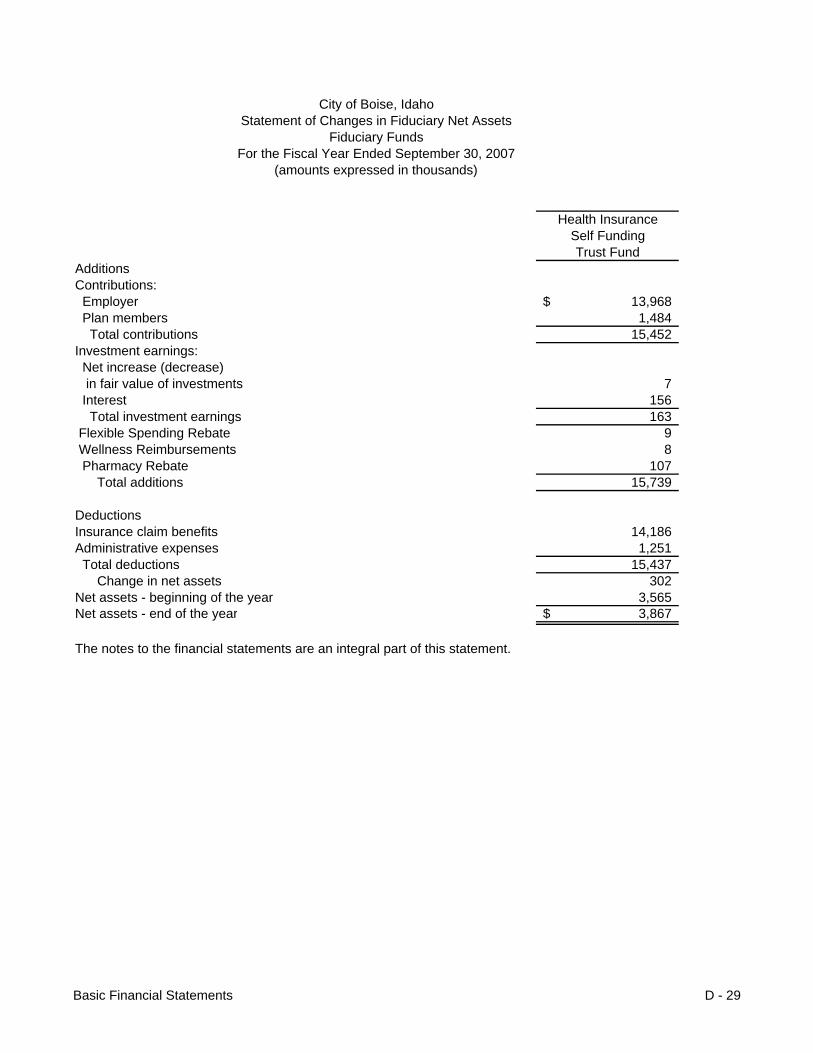
Health InsuranceSelf FundingTrust Fund
AdditionsContributions: Employer 13,968$ Plan members 1,484 Total contributions 15,452 Investment earnings: Net increase (decrease) in fair value of investments 7 Interest 156 Total investment earnings 163 Flexible Spending Rebate 9 Wellness Reimbursements 8 Pharmacy Rebate 107 Total additions 15,739
DeductionsInsurance claim benefits 14,186 Administrative expenses 1,251 Total deductions 15,437 Change in net assets 302 Net assets - beginning of the year 3,565 Net assets - end of the year 3,867$
The notes to the financial statements are an integral part of this statement.
(amounts expressed in thousands)
City of Boise, IdahoStatement of Changes in Fiduciary Net Assets
Fiduciary FundsFor the Fiscal Year Ended September 30, 2007
Basic Financial Statements D - 29

This page intentionally left blank

Footnotes E - 1
City of Boise NOTES TO THE FINANCIAL STATEMENTS FOR THE FISCAL YEAR ENDING SEPTEMBER 30, 2007 (AMOUNTS EXPRESSED IN THOUSANDS) I. SUMMARY OF SIGNIFICANT ACCOUNTING POLICIES The accounting and reporting policies of the City of Boise conform to U.S. generally accepted accounting principles applicable to state and local governments. Generally accepted accounting principles (GAAP) for local governments include those principles prescribed by the Government Accounting Standards Board (GASB), the American Institute of Certified Public Accountants (AICPA) in the publication entitled “Audits of State and Local Governmental Units”, and by the Financial Accounting Standards Board (FASB) when applicable. As allowed in Section P80 of GASB’s “Codification of Governmental Accounting and Financial Reporting Standards”, the City has elected not to apply to its enterprise and government-wide financial statements FASB Statements and interpretations, Accounting Principles Board Opinions, and Accounting Research Bulletins of the Committee of Accounting Procedures issued after November 30, 1989. A. Financial Reporting Entity As required by GAAP, these basic financial statements present the City and its component unit in conformance with the GASB Statement No. 14, “The Financial Reporting Entity” and GASB Statement No. 39, “Determining Whether Certain Organizations Are Component Units.” Under these statements, component units are organizations that are included in the City’s reporting entity because of the significance of their operational or financial relationship with the City. The Component Unit column in the accompanying financial statements contains the financial data of the City’s single component unit, the Capital City Development Corporation (CCDC). CCDC is a separate and distinct legal entity created by state statute but does not have fiscal independence from the City. The directors are appointed by the Mayor and approved by City Council and if the CCDC should go out of business, the assets would revert to the City. CCDC is therefore included in the financial statements as a discretely presented component unit. CCDC provides urban renewal services and parking facilities for the citizens of the City. Complete financial statements of CCDC can be obtained from their office at 800 W. Idaho Street, Boise, Idaho. Organizations for which the City is accountable because it appoints a voting majority of the board but is not financially accountable are referred to as related organizations. Financial information of related organizations in not included in the City’s financial statements. The only related organization of the City is the Boise City/Ada County Housing Authority. B. Government Wide and Fund Financial Statements The government wide financial statements, which are the statement of net assets and the statement of activities, report information on all of the non-fiduciary activities of the primary government and its component unit. For the most part, the effect of inter-fund activity has been removed from these statements. Governmental activities, which normally are supported by taxes and intergovernmental revenues, are reported separately from business-type activities, which rely to a significant extent on fees and charges for support. Likewise, the primary government is reported separately from its legally separated component unit (CCDC) for which the primary government is financially accountable. The statement of activities demonstrates the degree to which the direct expenses of a given function or segment is offset by program revenues. Direct expenses are those that are clearly identifiable with a specific function or segment. Program revenues include 1) charges to customers or applicants who purchase, use or directly benefit from goods, services or privileges

Footnotes E - 2
provided by a given function or segment and 2) grants and contributions that are restricted to meeting the operation or capital requirements of a particular function or segment. Taxes and other items not included among program revenues are reported instead as general revenues. Separate financial statements are provided for governmental funds, proprietary funds and fiduciary funds, even though the latter are excluded from the government wide financial statements. Measurement Focus, Basis of Accounting, and Financial Statement Presentation The government wide financial statements are reported using the economic resources measurement focus and the accrual basis of accounting, as are the proprietary fund and fiduciary fund financial statements. Agency funds use the accrual basis of accounting, but have no measurement focus. Revenues are recorded when earned and expenses are recorded when a liability is incurred regardless of the timing of the cash flows. Property taxes are recognized as revenues in the year for which they are levied. Grants and similar items are recognized as revenue as soon as all eligibility requirements imposed by the provider have been met. Governmental fund financial statements are reported using the current financial resources measurement focus and the modified accrual basis of accounting. Revenues are recognized as soon as they are both measurable and available. Revenues are considered to be available when they are collectible within the current period or soon enough thereafter to pay liabilities of the current period. For this purpose, the City considers property tax revenues to be available if they are collected within 60 days of the end of the current period. Expenditures generally are recorded when a liability is incurred, as under accrual accounting. However, debt service expenditures, as well as expenditures related to compensated absences, claims and judgments, are recorded only when payment is due. Property taxes, sales and liquor taxes, franchise fees and interest associated with the current fiscal period are all considered to be susceptible to accrual and so have been recognized as revenues of the current period. The government reports the following major governmental funds:
The General Fund is the government’s primary operating fund. It accounts for all financial resources of the general government, except those required to be accounted for in another fund. The Capital Projects Fund is used to account for financial resources to bus used for the acquisition of construction of major capital facilities other than those financed by proprietary and fiduciary funds.
The government reports the following major proprietary funds:
The Airport Fund accounts for the operation of the municipal airport. All operations, debt service and capital additions are accounted for in the fund. The Sewer Fund accounts for the operation of the portion of the sewer system owned by the City. Three sewer districts collect sewage within the City and contract with the City to process it in one of the three City operated plants. Debt service and capital improvements are also accounted for in this fund. The Solid Waste Fund accounts for the City solid waste service. The collection service is contracted with an independent firm and Ada County landfill service.

Footnotes E - 3
Additionally, the government reports the following fund types:
Internal Service Funds account for vehicle maintenance, risk management and arboretum services provided to other departments of the government or other government entities, on a cost reimbursement basis. The Health Insurance Trust is used to account for the City’s self insured health insurance trust. Plan assets are dedicated to providing health benefits to current and retired employees. The Agency Fund accounts for items that must be held in trust for any reason. The major item accounted for in this fund is the Boise Improvement District payments.
As a general rule the effect of inter-fund activity has been eliminated from the government wide financial statements. Exceptions to this general rule are charges between the government’s sewer and solid waste functions and various other functions of the government. Elimination of these charges would distort the direct costs and program revenues reported for the various functions concerned. Indirect charges have been eliminated in the entity wide statements. Proprietary funds distinguish operation revenues and expenses from non-operating items. Operating revenues and expenses generally result from providing services, producing and delivering goods in connection with a proprietary fund’s principle ongoing operations. The principal operating revenues of the proprietary and internal service funds are charges to customers for sales and services. Operating expenses for enterprise funds and internal service funds include the cost of sales and services, administrative expenses and depreciation on capital assets. All revenues and expenses not meeting this definition are reported as non-operating revenues and expenses. D. Assets, Liabilities and Net Assets or Equity 1. Cash and Investments Cash represents cash on hand and in banks. Some of the cash resources of the individual funds are combined to form a pool of cash for cash management purposes. Investments made from pooled cash consist primarily of short-term investments. Interest income earned as a result of pooling is distributed to the appropriate funds based on the average daily balance of pooled cash of each fund. Investments are reported at fair value except for money market investments with a remaining life to maturity at time of purchase of less than one year as required by GASB Statement No. 31. Fair value is estimated for investments without quoted market prices by using on line or other sources to identify market prices of similar investments. Restricted cash equivalents are defined differently than unrestricted cash equivalents because they are restricted by and outside source. They are therefore not included in the cash equivalents reported in the statement of cash flows. The City has entered into a master repurchase agreement with several financial institutions. The agreements require short-term repurchase agreements (less than 5 days) be evidenced by a safekeeping certificate segregated in the City’s name. The City has entered into a custodial agreement with a financial institution for the purpose of providing safekeeping and custody of certain investments owned by the City. Idaho Code provides authorization for the investment of funds as well as specific guidelines as to what constitutes and allowable investment. City policy is consistent with these guidelines.

Footnotes E - 4
The City, except as indicated below, is limited to the following general types of investments: • Certain revenue bonds, general obligation bonds, local improvement district bonds, tax
and revenue anticipation notes and registered warrants of state and local government entities.
• Time deposit accounts. • Bonds, treasury bills, interest-bearing notes, debentures or other similar obligations of the
United States Government and the Farm Credit System and it’s agencies and instrumentalities. U.S. Government Securities include U.S. Treasury receipts and U.S. Treasury Stripped interest Payment series (STRIPS).
• Repurchase agreements. • Banker’s acceptance and prime commercial paper • Mutual or Money Market Funds. • Corporate notes.
Investments associated with the City’s deferred compensation plans are subject to the investment guidelines of state laws governing such plans, which allow for investment in equity securities in an addition to the investment alternatives indicated above. Investments associated with the Health Insurance Trust fund must be allowable under both Idaho code 50-1013 and 68:401 et. Seq. 2. Receivables and Payables Outstanding balances between funds at the end of the fiscal year are referred to as either “due to/from other funds” for the current portion of inter-fund loans or “advances to/from other funds” for the noncurrent portion. Any residual balances outstanding between the governmental activities and business type activities are reported in the government wide financial statements as “internal balances”. Idaho Code provides taxing entities the ability to levy property taxes for the current or ensuing year. The City levies property taxes, as most entities do, for the ensuing year. This results in the tax collections being received in the fiscal year they are budgeted for and used to pay expenditures of that period. In the General Fund there is an allowance for uncollectibles for any specific items in dispute. In the proprietary funds, receivables are shown net of an allowance for uncollectibles. In the Sewer and Solid Waste Funds, the allowance consists of amounts equal to utility receivables older than 180 days. The Airport Allowance is made up of specific receivables turned over to collections. The property tax calendar is as follows:
• Property taxes attach as an enforceable lien on property as of January 1st. • Taxes are levied on the third Monday in September for the subsequent year. • Ada County bills and collects property taxes for the City. • The first half of the taxes is payable to Ada County by December 20th and the second by
June 20th of the following year. Taxes are remitted to the City in the month following collection. 3. Inventories Inventories are stated at cost (first in, first out method). The cost of inventory items are recognized as expenditures in governmental financial statements and as expenses in government wide and proprietary fund financial statements when used (consumption method).

Footnotes E - 5
4. Restricted Assets Funds to meet bond reserve and debt service requirements for the debt service and enterprise funds, deferred compensation amounts held for the benefit of employees and cash from Passenger Facility Charges are classified as restricted assets since applicable bond indenture provisions, trust agreements and federal regulations limit their use. While there is no written policy, the practice is to use restricted assets first when a expense is incurred for purposes for which both restricted and unrestricted assets are available. 5. Property, Plant and Equipment Capital Assets, including property, plant, equipment and infrastructure assets (e.g., sewer lines, runways and similar items), are reported in the applicable governmental or business type activities columns in the government wide financial statements. The government defines capital assets as assets with an initial individual cost of more than $5 and an estimated useful life in excess of three years. All material capital assets are valued at historical cost. Donated capital assets are valued at their estimated fair value on the date donated. When an asset is disposed of, cost and related accumulated depreciation is removed and any gain or loss arising from the disposal is credited or charged back to operations. The cost of normal maintenance and repairs that do not add to the value of the asset or materially extend asset lives are not capitalized. Major outlays for capital assets and improvements are capitalized as projects are constructed. Interest incurred during the construction phase of capital assets of business type activities is included as part of the capitalized value of the assets constructed. The total capitalized interest during the current fiscal year was $36 for Airport projects and $267 for Sewer projects. Depreciation is recorded by use of the straight-line method. The book value of each asset is reduced by equal amounts over its estimated useful life as follows:
Estimated Useful Life (Years)
Buildings 3 - 60 Airport terminal building 40 Improvements other than buildings 3 - 50 Airport runways, taxiways and apron 10 - 20 Airport terminal parking 10 - 15 Sewer service lines 20 - 100 Geothermal wells 40 Geothermal service lines 50 Office furniture and equipment 3 - 30 Vehicles 3 - 20 Machinery and equipment 3 - 40
6. Long Term Liabilities Long term liabilities consist bonds, notes and other indebtedness including liabilities associated with compensated absences. In the government wide financial statements and proprietary fund type statements, long term obligations are reported as liabilities in the applicable governmental activities, business type activities or proprietary fund type statement of net assets. Bond premiums and discounts, as well as issuance costs, are deferred and amortized over the life of the bonds using the straight line interest method. Bonds payable are reported net of the

Footnotes E - 6
applicable bond premium or discount. Bond issuance costs are reported as deferred charges and amortized over the term of the related debt. In the fund financial statements, governmental fund types recognize as expenditures bond premiums and discounts as well as bond issuance cost during the current period. The face amount of debt issued is reported as other financing sources. Premiums received on debt issuances are reported as other financing sources. Issuance costs, whether or not withheld from the actual debt proceeds received, are reported as debt service expenditures. The City complies with applicable arbitrage regulations. Governmental Funds: Revenue Refunding Bonds, Series-2001A - $28,445 of Refunding Bonds were issued to refinance the outstanding principal amounts of the Court Facilities Refunding Bonds Series 1993 originally issued in the amount of $2,075 and used for the construction of a court building and the Note Refunding Bonds, Series 1996 originally issued in the amount of $34,900 and used to refinance short term Revenue Anticipation Notes. The City has pledged its General Fund revenues as security on the Bonds. Revenue Refunding Bonds – Series 2002A - $2,410 Refunding Bonds were issued to refinance the following obligations of the City: The Essential Facilities Refunding Bonds Series 1993 originally issued in the amount of $2,840 to refinance debt for the rehabilitation of a parking garage and the construction for the relocation of a fire station; the Certificates of Participation Series 1996A originally issued in the amounts of $1,235 and $1,445 respectively were used for the relocation of two fire stations. The City has pledged its General Fund revenues but the obligation to pay debt service on the bonds is subject to renewal by annual appropriation. Certificates of Participation – The City issued $1,185 in COP’S for a golf course improvement project. The obligation of the City to make payments is subject to annual renewal by appropriation of sufficient funds to make the payments. If the City fails to appropriate funds to make payments under the Certificates, the Certificate holders are entitled to be paid solely to the extent of monies previously appropriated for Certificate payments, amounts held in trust accounts under the agreement, and the monies which become available from foreclosure. The City is not liable to pay any deficiency in the event such sums are not adequate to pay the unpaid amount due. Capital Lease – The City entered into a $5,228 lease with Ada County to purchase a building adjacent to City Hall. Compensated Absences Payable – Boise City provides vacation and sick leave to its full-time employees. Earned vacation is paid to employees when taken or paid to employees or their beneficiaries upon the employee’s termination, retirement or death. Certain employees can elect to be paid each year for a portion of their accrued unused vacation. The amount of unused vacation accumulated by City employees is accrued as expense when incurred in Proprietary funds and the entity-wide financial statements, which both use the accrual basis of accounting. In the Governmental Fund statements only the amount that normally would be liquidated with expendable available financial resources is accrued as current year expenditures and therefore compensated absences are recognized only when they mature. Unless it is anticipated that compensated absences will be used in excess of a normal year’s accumulation, no additional expenditures are accrued. Sick leave is paid to employees when taken and the cost is recognized when payment is made. There are some employee groups in the General Fund that receive a portion of their earned sick leave when they retire due to the provisions of related employee group contracts. During 2007, $73 was paid to these eligible employees. These employee group contracts also provide for some of the sick leave payoff funds to be transferred

Footnotes E - 7
annually to a Post Employment Health Plan (PEHP). In 2007, the City contributed on behalf of employees not belonging to the contract groups mentioned above, a percentage of sick leave accumulated over 600 hours to the PEHP. During 2007, $60 was transferred to the PEHP for this group. See the separate discussion of the PEHP. Enterprise Funds: Wastewater Facility – The City previously entered into three loans with the State of Idaho Department of Health and Welfare to expand and modernize the West Boise and Lander Street wastewater treatment plants. The three loans were then consolidated into one Wastewater Facility Note, which in turn was refinanced during 1999 with the issuance of refunding bonds. The bonds are secured by system revenues and are not a general obligation to the City. The City has the option to redeem bonds maturing on or after February 1, 2009 to August 1, 2009 at 101.0% of par value, from February 1, 2010 to August 1, 2010 at 100.5% of par value and 100% of par value after February 1, 2011. Airport Certificates of Participation – The Certificates of Participation were issued to fund the expansion and remodel of the Airport terminal area. The City’s obligation to make lease payments is limited and is not a general obligation of the City. The City’s payment obligations under the agreement are secured by a security interest in the net revenue derived by the City from its airport facilities and properties and by the funds and accounts created by the COP agreement. The City has the option to redeem Certificates maturing on or after September 1, 2010 on September 1, 2009 or any interest payment date thereafter at par plus accrued interest. Certificates maturing on September 1, 2030 are subject to redemption at the City’s option as of September 1, 2005 or any interest payment date thereafter at the price of par plus accrued interest. Section 108 Advance – The City has entered into an advance with the United States Department of Housing and Urban Development to convert facilities for use as affordable housing units. Optional redemption is available for principal amounts due on or after August 1, 2013. Installment Loans – The City has entered into two loans with the State of Idaho Department of Health and Welfare to realign trunk sewer lines. The loans are secured by a pledge of revenue and income of the Boise Wastewater Treatment Facilities. The loans require that within five years of project completion, loan reserves be established equal to one year’s principal and interest paid on each of the loans in semi-annual installments over a 20-year period. The City has also entered into a line of credit with the State of Idaho Department of Health and Welfare to modify and upgrade existing wastewater treatment facilities. When this project is completed, this obligation will become a loan with similar conditions as the loans described above. Airport Refunding Bonds – On June 29, 2004, the City issued the Airport Revenue Refunding Bonds Series 2004-1 in the amount of $9,515. The Bonds were used to (A) refinance the outstanding principal amount of the Airport Parking Facility Revenue Bonds, Series 1997A originally issued in the aggregate amount of $14,200 and (B) to pay the costs of issuing the Bonds.
Footnotes E - 8
DEFERRED COMPENSATION The City has two deferred compensation plans. The first is available to employees other than sworn police officers and the second for sworn police officers only. Employees may make voluntary contributions to the plans within the limits allowed by the Internal Revenue Service Code Section 457. The first 5 percent of base salary per year contribution made by a sworn police officer is matched by the City up to a maximum of 3.5 percent of salary. The remaining 1.5 percent match is contributed to the Post Employment Health Plan. The City also matches the contribution of certain other employees up to a maximum of 2 percent and 4.5 percent of salary per year. The City has no liability for losses under the plan but does have the duty of due care that would be required of an ordinary prudent investor. The City provides oversight of the plans, selecting the investment options made available and overseeing all training. POST EMPLOYMENT HEALTH PLANS The City has a Post Employment Health Plan for all full time employees. The City makes annual contributions to a medical trust established under IRS code section 501c(9) on behalf of the participants utilizing existing funding sources. Individual accounts are established for the benefit of and are the property of each participant. Each participant is responsible for selecting the investment vehicle for his/her account. Upon separation from service the employee may use the accumulated balance for IRS allowable medical expenses for themselves and qualified dependents. The City has no ongoing responsibility for the trust and has not recorded it in the financial statements. 7. Postretirement Benefits By City Council authorization, the City provides at retirement to all employees eligible for the Public Employee Retirement System of Idaho a $10,000 life insurance policy, the premium of which is paid for by the City. Additionally, the City contributes $50 per month toward a retiree health insurance plan. Funds for the estimated liability associated with the governmental fund types are set-aside in the Debt Service Fund. Amounts related to the proprietary fund types are provided for separately in those funds. The postretirement benefits are advance funded on an actuarial basis. Actuarial valuations of the postretirement benefits were done as of September 30, 2007. The actuarially accrued liability which was set aside was $8,068. The actuarial cost method used is the Projected Unit Credit Actuarial Cost method. The significant actuarial assumptions used to determine funding requirements are: a) a discount rate of 5.75%, b) an expected Asset Return rate of 5.75%, c) the percentage of eligible retirees electing health coverage is 40% for general employees and 70% for Fire and Police and d) the termination rates for general employees are based on the July 1, 2007 Public Employees Retirement System of Idaho assumptions. Termination rates for Fire and Police are based on Boise City historical data. There are 1,482 active plan participants. 8. Risk Management The City is exposed to various risks of loss related to torts, theft of, damage to, or destruction of assets, errors or omissions, or employee injuries. The City has a Risk Management Fund (an internal service fund to account for and finance these risks of loss.) The self-insured retention is summarized as follows:

Footnotes E - 9
Fiscal Workers Year Liability Coverage Property Coverage Compensation Coverage
Per Incident Aggregate Per Incident Aggregate Per Incident Aggregate
1998 $250 unlimited $100 unlimited 1999 $250 unlimited $100 unlimited $250 unlimited 2000 $250 unlimited $100 unlimited $250 unlimited 2001 $250 unlimited $100 unlimited $250 unlimited 2002 $250 unlimited $100 unlimited $300 unlimited 2003 $400 unlimited $100 unlimited $400 unlimited 2004 $400 unlimited $100 unlimited $400 unlimited 2005 $400 unlimited $100 unlimited $400 unlimited 2006 $400 unlimited $100 unlimited $400 unlimited 2007 $400 unlimited $100 unlimited $400 unlimited
The City has purchased commercial insurance for claims in excess of these amounts. All funds of the City participate in the program except for liability coverage for the Airport fund, which is insured under a separate policy purchased from an outside insurance carrier. Amounts to be provided for funding of the self insured retention are based on actuarial estimates of the amounts necessary to pay and current year claims and to establish a reserve for catastrophic losses. A liability for claims is established if information indicates that it is probable a liability has been incurred at the date of the financial statements and the amount of the loss can be reasonably estimated. 9. Self insurance Trust Fund In 2005, the City created a trust fund for its health insurance costs. Plan assets are dedicated to provide benefits to our employees and retirees, are legally protected from creditors and employer contributions to the plan are irrevocable. The trust is basically self insured but has reinsurance for claims over $100 with an aggregate limit of 120% of aggregate claims. 10. Fund Equity In the fund financial statements, governmental funds report reservations of fund balance for amounts that are not available for appropriation or are legally restricted by outside parties for use for a specific purpose. Designations of fund balance represent tentative management plans that are subject to change. II. RECONCILIATION OF GOVERNMENT-WIDE AND FUND FINANCIAL STATEMENTS Explanation of certain differences between the governmental fund statement of revenues, expenditures, and changes in fund balances and the government-wide statement of activities In the statement of activities, only the gain on the sale of capital assets is reported. However, in the governmental funds, the proceeds from the sale increase financial resources. Thus, the change in net assets differs from the change in fund balance by the cost of the capital assets sold. Donations of capital assets increase net assets in the statement of activities, but do not appear in the governmental funds because they are not financial resources. Another element of

Footnotes E - 10
that reconciliation states that: “The net effect of various transactions involving capital assets (i.e., sales and donations) is to increase net assets.” The details of this $1,167 difference are as follows: Loss on capital assets sold $ (2,787) Transfer of vehicle to governmental activities 24 Transfer of vehicle to business activities (18) Donations of capital assets 3,948 Net adjustment to increase net changes in fund balances total governmental funds to arrive at changes in net assets of governmental activities $ 1,167 Another element of that reconciliation states that: “the issuance of long-tem debt (e.g., bonds, leases) provides current financial resources to governmental funds, while the repayment of the principal of long-term debt consumes the current financial resources of governmental funds. Neither transaction, however, has any effect on net assets. Also, governmental funds report the effect of issuance costs, premiums, discounts, and similar items when debt is first issued, whereas these amounts are deferred and amortized in the statement of activities.” The detail of this $983 difference is as follows: Principal repayments: Golf Course Improvement Project $ 80 Refunding 2001A 505 Refunding 2002A 90 City Hall lease 363 Deferred issuance costs: Issuance costs for 2001A (13) Issuance costs for 2002A (3) Net adjustment to increase net changes in fund balances total governmental funds to arrive at changes in net assets of governmental activities $ 1,022 III. STEWARDSHIP, COMPLIANCE, AND ACCOUNTIBILITY A. Budgets and Budgetary Accounting The basis of budgeting refers to the conventions for recognition of costs and revenues in budget development and in establishing and reporting appropriations, which are the legal authority to spend or to collect revenues. Boise City used a modified accrual basis for budgeting in governmental funds. Under Idaho State Law, unspent appropriations from prior years must be specifically “re-budgeted,” via resolution of the City Council, or “encumbered,” in order to be carried forward into the next fiscal year. A valid, legal commitment such as a contract or purchase order is required for encumbrances. Proprietary funds are budgeted using accrual concepts. However, all operating and capital expenses that will be incurred during the year and income to be received and credited to the year are identified in the budgeting process because of the need for appropriation authority. The budget is fully reconciled to the accounting system at the beginning of the year, and in preparing the Comprehensive Annual Financial Report (CAFR) at year-end. A number of adjustments are made to reflect balance sheet needs and their effect on the budget. These include changes in designations and reserves and recognition, via studies and analysis of various sorts, of accrued liabilities. Amounts needed for such long-term liabilities as future payoffs of accumulated employee vacation and sick leave, are budgeted as they are recognized via actuarial projections and subsequently adjusted to actual amounts. The budget does not
Footnotes E - 11
recognize capital construction expense in enterprise funds in the same manner as in the Comprehensive Annual Financial Report. Reconciliation is completed in quarterly and “year end” budget to actual reports. The City uses a two-year budget format to facilitate a strategic approach to financial planning and to reduce the time spent in budget preparation. The FY 2007 budget was the second year of the FY 2006 and 2007 Two Year Budget. Idaho State Code does not recognize the concept of a two-year budget and requires the City to adopt an annual budget each year through formal publishing and hearing requirements and by adopting an annual appropriation ordinance. Therefore, each year of the two-year budget is separately adopted consistent with State Code requirements. However, administratively, the two-year budget incorporates both annual budgets and the second year adoption entails a streamlined mid-biennium review and revision process to address changes that occurred since the two-year budget was developed. The Mayor and City Council also review the results of operation and financial position of funds quarterly for each of the fiscal years within the two-year budget period. The City of Boise has established a Six Year Financial Plan that includes financial and human resource policies that provide direction for accounting, budgeting, cash management, and other financial management for the City. The policies provide broad direction for financial planning, control and reporting. The following procedures are used to establish budgetary control:
1. Prior to October 1, the budget is legally enacted through passage of an ordinance and based upon extensive public budget workshops and public hearings. All funds are recognized in the budget including the General, Special Revenue, Debt Service, Capital Projects, Enterprise, Internal Service and certain Trust Funds.
2. Budgets are adopted on a basis consistent with generally accepted accounting principles
(GAAP). Total appropriations represent budget amounts as originally adopted plus current year adjustments for council approved prior year encumbrances, uncompleted items (primarily capital and equipment) carried forward to the following year and new projects or expenditures approved by council from prior year turn back dollars and appropriation changes approved during the year.
3. Formal budgetary integration is employed as a management control device during the
year for the General, Special Revenue, Capital Projects, Enterprise, Internal Service and certain Trust Funds. To provide oversight and control, the Mayor’s Executive Management Team reviews all proposed changes to the budget that are exceptions to department head authority.
4. During the fiscal year, all expenditures are authorized by Payment Voucher, Purchase
Order, or Journal Entry which are reviewed, according to procedures in the City Code, for budget authority, available funds and adherence to the City’s purchasing procedures and good business practices.
5. Department directors have defined discretionary authority to transfer budget
appropriation amounts within approved budget totals, between line items within funds and consistent with the Mayor’s Budget Flexibility Guidelines.
6. Transfer of budget appropriations not allowed under Department Director discretion, may
be recommended by the Mayor’s Executive Management Team and approved by the City Council. Revisions increasing total expenditure appropriation of any fund or adding permanent employee positions must be approved by the City Council. Any transfers of contingent funds require Mayor and City Council approval. State law does not allow fund expenditures to exceed fund appropriation. Appropriations lapse at year-end.

Footnotes E - 12
7. Idaho State Code allows the City to reopen the annual budget if a need for increased
appropriations beyond the budgeted total is experienced. The reopened budget must be adopted by following a process similar to that, which was used to adopt the original budget, including public hearings and adoption of a revised annual appropriations ordinance. No supplemental appropriations were necessary during fiscal year 2006.
B. Excess of Expenditures over Appropriation. For the fiscal year ended September 30, 2007, expenditures exceeded appropriations in the Debt Service Fund ($621) and Risk Management Fund ($864). C. Deficit Fund Equity The Geothermal Fund has a deficit unrestricted net assets of $203 at September 30, 2007. IV. DETAILED NOTES ON ALL FUNDS A. At September 30, 2007, cash and investments, including restricted investments were invested as follows: Carrying Bank Ledger Amount Balance Cash: demand deposits Insured (FDIC) $ $ Collateralized 1,007 2,923 Less credit balance: Fiduciary fund (1,244) (34) Total Net Cash $ (237) $ 2,889 Investments: Fair Value Commercial paper $ 21,908 U.S. agency securities 95,408 Money market mutual funds 35,499 Subtotal 152,815 Less: Restricted and fiduciary fund investments (8,159) Total Net Investments $144,656 Deposit and Investment Policies Idaho Code 50-1013 limits the City’s legal investments to savings accounts, prime commercial paper, general obligations of the State of Idaho and United States Treasury, notes, bonds and obligations of Government Sponsored Enterprises (FNMA, FHLMC, FFCB, FHLB), A-rated corporate bonds, and money market and mutual funds whose portfolios consist of the aforementioned underlying instruments. The City’s Investment Policy requires that investments within the portfolio are to be diversified as to security type, duration, and issuer in order to maintain a balanced portfolio. The policy does not place specific restrictions with regard to credit, concentration, and interest rate risks. The City only conducts investment purchases on a delivery versus payment basis with all securities held by a safe keeper, in the City’s name, to eliminate custodial credit risk.
Footnotes E - 13
Interest Rate Risk Investments by Type Fair Value Effective Duration U.S. Agency Securities $ 95,408 0.837 Commercial Paper 21,907 0.079 Money Market Mutual Funds 35,177 Not Available Total Fair Value $ 152,492 Portfolio Effective Duration 0.534 In accordance with the City's Investment Policy of diversifying its investments as to type, issuer, and maturity, the City chooses to monitor its interest rate risk exposure utilizing effective duration. Effective duration is the preferred method for callable securities, and measures the price sensitivity of an investment or portfolio, taking into account that expected cash flows will change as interest rates change. The effective duration of the City's Investment Portfolio was .534% on September 30, 2007. Credit Risk Investments by Type Credit Rating Portfolio Percentage U.S. Agency Securities AAA 62.57% Commercial Paper A1/P1 14.37% Money Market Mutual Funds AAA 21.76% Key Bank Account (FDIC Insured) A1/P1 0.65% Bank of The Cascades (FDIC Insured) None 0.65% Total 100.00% All agency securities within the Portfolio at September 30, 2007 are rated AAA by Standard and Poors or Aaa by Moody's. All commercial paper held in the Portfolio on September 30, 2007 is rated A1/P1 by Standard and Poors and Moody's, respectively. All money market mutual funds are rated AAA by Standard and Poor's as of September 30, 2007. Interest bearing accounts are maintained at Key Bank and Bank of the Cascades with $1,000,000 balances. Key Bank account carries a short-term deposit rating of A1/P1 while the Bank of the Cascades account is unrated. Both accounts are insured by the FDIC up to $100,000. Custodial Credit Risk As of September 30, 2007 the City's Investment Portfolio was held in the City's name by a third-party custodian. Consequently, the City is not exposed to custodial credit risk. Concentration of Credit Risk In order to maintain a balanced Portfolio, the City's adopted Investment Policy requires that investments within the Portfolio be diversified as to type of security, duration, and issuer. Consequently, to the extent allowed by State Code, the Investment Policy does not specifically place limits on amounts invested in any one issuer. On September 30, 2007, the City's Investment Portfolio exceeded 5% of total Portfolio value in the following issuers: Issuer Portfolio Percentage Federal Home Loan Bank 25.76% Federal Home Loan Mortgage Corporation 20.82% Federal National Mortgage Association 15.60%

Footnotes E - 14
B. Receivables
September 30, 2007
General Capital Airport Sewer Solid Waste
Nonmajor and Other
Funds Fiduciary TotalReceivables
Interest 85$ 61$ 154$ 499$ 8$ 233$ 16$ 1,056$ Taxes 93,094 2 93,096 Accounts 5,438 425 1,249 1,000 889 468 989 10,458
Passenger Faciltiy Charges 724 724 Sewer District 5,010 5,010 Special Asssessments 18 2,335 1 2,354 Grants 13 113 3,185 39 3,350 Loans 7,579 7,579
Gross Receivables 98,648 601 5,312 8,844 897 8,320 1,005 123,627
Less: Allowance for uncollectibles 977 403 392 1,772
97,671$ 601$ 5,312$ 8,441$ 505$ 8,320$ 1,005$ 121,855$
The Sewer Receivables includes $2,047 in long term. This is included in the Statement of Net Assets under Noncurrent assets. Governmental funds report deferred revenue in connection with receivables for revenues that are not considered to be available to liquidate liabilities of the current period. Governmental funds also defer revenue recognition in connection with resources that have been received but not yet earned. At the end of the current fiscal year, the various components of deferred revenue reported in the governmental fund financials were as follows: Property taxes receivable (general fund) $ 93,094 Property taxes receivable (capital projects fund) 2 Other unearned revenue 316 Total deferred/unearned revenue for governmental funds $ 93,412

Footnotes E - 15
C. Restricted Assets
Debt Bond Fund / PFC and Reserve Lease Payment Reserve Deferred
Fund Fund Funds Compensation Total
Governmental Fund Type Revenue Refunding 2002A 190$ 190$ Warm Springs Golf Course 117 12 59 188 Total 307 12 59 378
Business-Type Airport PFC Restriction 3,730 3,730 Sewer Loan Reserve 650 650 Total - 650 3,730 4,380
Total All Funds 307$ 12$ 709$ 3,730$ 4,758$
Funds set aside for payment of Governmental and Enterprise Fund debt are classified as restricted assets, since their use is limited by applicable debt agreements. Amounts restricted for specific purposes are for transportation PFC funds. D. Capital Assets A Summary of the changes in capital assets for the year ending September 30, 2007 follows: Primary GovernmentGovernmental activities: Balance
September 30, 2006
Additions Transfers Deletions Balance September 30,
2007Capital assets, not being depreciated:Land 64,062$ 4,417$ (363)$ 68,116$ Construction in progress 3,642 (1,346) (468) 1,828 Total capital assets, not being depreciated 67,704 3,071 (831) 69,944
Capital assets, being depreciated:Buildings 58,113 10,734 52 (2,493) 66,406 Improvements Other Than Buildings 51,224 3,441 (72) (168) 54,425 Automobiles and Trucks 18,917 3,331 (1,090) 21,158 Machinery and Equipment 26,402 3,749 20 (753) 29,418 Other Capital Assets 6,788 31 (251) 6,568 Total capital assets being depreciated 161,444 21,286 - (4,755) 177,975
Less Accumulated Depreciation for:Buildings 23,975 2,180 59 (577) 25,637 Improvements other than Buildings 23,315 2,174 (65) (464) 24,960 Automobiles and Trucks 12,169 1,480 (1,090) 12,559 Machinery and Equipment 13,544 1,873 6 (645) 14,778 Other Capital Assets 4,789 178 (29) 4,938 Total accumulated depreciation 77,792 7,885 - (2,805) 82,872
Total capital assets, being depreciated, net 83,652 13,401 (1,950) 95,103
Governmental activities capital assets, net 151,356$ 16,472$ (2,781)$ 165,047$
Footnotes E - 16
Business-type activities: Balance
September 30, 2006
Additions Transfers Deletions Balance September 30,
2007Capital assets, not being depreciated:Land 28,693$ 5,835$ (61)$ 34,467$ Construction-in-progress 9,035 7,904 (694) 16,245 Total capital assets, not being depreciated 37,728 13,739 (755) 50,712
Capital assets, being depreciated:Buildings 231,543 5,935 (1,077) (510) 235,891 Land Improvements/Terminal Parking 57,599 2,024 (6,630) 52,993 Improvements Other Than Buildings 34,675 1,738 (79) 36,334 Service Lines 159,384 11,002 170,386 Automobiles and Trucks 10,995 1,020 (214) 11,801 Machinery and Equipment 61,011 1,276 1,077 (797) 62,567 Other Capital Assets 585 585 Total capital assets, being depreciated 555,792 22,995 (8,230) 570,557
Less Accumulated Depreciation for:Buildings 51,674 7,502 (448) 58,728 Land Improvements/Terminal Parking 31,293 3,145 (3,537) 30,901 Improvements Other Than Buildings 11,981 2,236 (20) 14,197 Service Lines 39,763 1,769 41,532 Automobiles and Trucks 6,742 668 (173) 7,237 Machinery and Equipment 24,233 4,095 (681) 27,647 Other Capital Assets 116 28 144 Total Accumulated Depreciation 165,802 19,443 (4,859) 180,386
Total capital assets, being depreciated, net 389,990 3,552 (3,371) 390,171
Business-type activities capital assets, net 427,718$ 17,291$ (4,126)$ 440,883$ Depreciation Expense was charged to the government functions as follows: General Government $ 1,290 Fire 1,557 Police 822 Parks and Recreation 2,488 Culture and Library 660 Community Service 968 Community development 32 Total government functions 7,817 Capital assets held by the government’s internal service funds charged to the various functions based on their usage 68 Total Depreciation Expense-Governmental Activities $ 7,885

Footnotes E - 17
E. Interfund Receivables, Payables and Transfers The composition of the interfund balances as of September 30, 2007 is as follows:
Receivable (Due to) Fund
General CapitalNon-major
Governmental Airport SewerSolid
WasteNon-major Proprietary
Internal Service Total
Payable (Due from) Fund
General 15,906$ 2,223$ 2,569$ 252$ 303$ 62$ 267$ 21,582$ Capital 88 6 34 2 130 Non-major Governmental 131 5 136 Airport 340 38 4 382 Sewer 771 1 4 10 786 Solid Waste 129 56 185 Non-major Proprietary 58 70 23 40 191
Internal Service 1,245 7 118 3 14 1,387 2,762 15,906 2,223 2,577 545 367 104 295 24,779
Interfund payables to General Fund were:
• Designated for cash flow ($1,403) • Capital Transfer ($0) • Transfer for accrual of compensated absences ($197) • Transfers from other funds to cover fringe benefits to be paid out of General Fund ($403) • Transfer of FY07 fourth quarter indirect costs ($269) • City Sewer, Trash & Geothermal charges ($168) • Other ($322)
Interfund payables to the Capital Projects Fund were:
• Transfer of tax support for capital projects ($15,894) • Other ($12)
Interfund payables to Airport Fund were:
• Cash reclassifications with other funds ($2,548) • Other ($29)
Interfund payables to the Sewer fund were:
• Transfer for payroll liability ($182) • Monthly cross charges ($146) • Risk management rebate ($98) • Cash reclassifications with other funds ($40) • Other ($79)

Footnotes E - 18
Interfund payables to the Solid Waste fund were:
• Cash reclassifications with other funds ($347) • Other ($20)
Advances to/from other funds as of September 30, 2007: Receivable Fund Payable Fund Amount Sewer Non-major proprietary $ 108 Solid Waste Internal Service 792 $ 900 The amount not expected to be repaid within one year from the Solid Waste Fund to the City Shop is $759. The entire $108 balance of the loan from the Sewer Fund to the Geothermal Fund is planned to be paid off in fiscal year 2008.
General(1) CapitalNon-major
Governmental Airport SewerNon-major Proprietary Total
Transfer out:General(1) $ 15,894$ 4,498$ 17$ 24$ 68$ 20,501$ Capital Projects 52 52 Non-major Governmental 82 43 125 Sewer 24 24 Solid Waste 103 103
261$ 15,894$ 4,541$ 17$ 24$ 68$ 20,805$
Transfer in:
(1) The General fund transfers differ from the Financial Statements by $18 due to the reclass of a transaction to capital contributions. Transfers are used to 1) move revenues from the General Fund to Capital Projects to fund authorized projects ($15,894, and 2) transfer support from one fund to another consisting mainly in 2007 of transfers to the debt service fund for debt payments ($4,498).

Footnotes E - 19
F. Risk Management –Claim Liability Liability 2007 2006
Other accrued liabilities, at September 30, of prior year 2,191$ 1,991$ Less: Compensated Absences (16) (16) Total unpaid claims and claim adjustment expenses at September 30 of prior year 2,175 1,975 Provision for self-insured events of the current year 299 473
Total incurred claims and claims adjustment expenses 2,474 2,448
Payments:
Claims and claim adjustment expenses attributable to self insured events of the current year 101 25 Claims and claim adjustment expenses attributed to self insured events of prior years 160 245 Less: Claim payments & (Plus) recoveries in process (13) 3 Plus: Close-out of Prior Years 173 -
Total Payments 421 273
Total unpaid claims and claim adjustment expenses at September 30 2,053 2,175 Add: Compensated Absences 18 16 Other accrued liabilities at September 30 2,071$ 2,191$
Workers Compensation 2007 2006
Other accrued liabilities, at September 30, of prior year 2,503$ 2,318$ Less: Compensated Absences (6) (7) Total unpaid claims and claim adjustment expenses at September 30 of prior year 2,497 2,311 Provision for self-insured events of the current year 1,390 1,209
Total incurred claims and claims adjustment expenses 3,887 3,520
Payments:
Claims and claim adjustment expenses attributable to self insured events of the current year 487 462 Claims and claim adjustment expenses attributed to self insured events of prior years 377 599 Less: Claim payments & (Plus) recoveries in process 35 (38) Plus: Close-out of Prior Years 193 -
Total Payments 1,092 1,023
Total unpaid claims and claim adjustment expenses at September 30 2,795 2,497 Add: Compensated Absences 6 6 Other accrued liabilities at September 30 2,801$ 2,503$
There are no judgments outstanding. Claims expected to be paid within the next year are $136 and $657 for liability and workers compensation respectively.

Footnotes E - 20
G. Long Term Debt The following is a summary of changes in long-term obligations of the City a September 30, 2007.
Long-TermLong-Term Obligations at
Obligations at September Due WithinGovernmental Activities October 1, 2006 Additions Deletions 30, 2007 One Year
Revenue Bonds: Refunding Bonds 2001A 26,640$ 505$ 26,135$ 529$ Refunding Bonds 2002A 2,070 90 1,980 95 Less: Def. Amt On Refunding (670) (188) (482)Capital Leases: Golf Course Improvement Project 730 80 650 80 City Hall 2 3,354 363 2,991 377Other Long-Term Debt Obligations: Compensated Absences 2,960 815 525 3,250 577Total Governmental Activities 35,084 815 1,375 34,524 1,658
Business-Type Activities
Revenue Bonds: Airport Revenue Refunding 6,195 1,140 5,055 1,175 Less deferral (150) (51) (99) (39) Plus premium 44 9 35 9 Wastewater Facility Note 16,365 965 15,400 1,005 Deferred gain 196 53 143 43Capital Leases: Airport Revenue COP's 2000 46,955 980 45,975 1,102Installment Loans: Sewer Line Loan 1,386 95 1,291 94 Sewer Line Loan 241 41 200 42 Sewer Line Loan 8,100 289 7,811 148Other Long-Term Debt Obligations: Section 108 Advance 1,540 140 1,400 140 Compensated Absences and Other Post Employment Benefits 1,257 112 12 1,357 241Total Business-TypeActivities 82,129 112 3,673 78,568 3,960Total 117,213$ 927$ 5,048$ 113,092$ 5,618$
For Governmental Activities, the General Fund generally liquidates compensated absences.
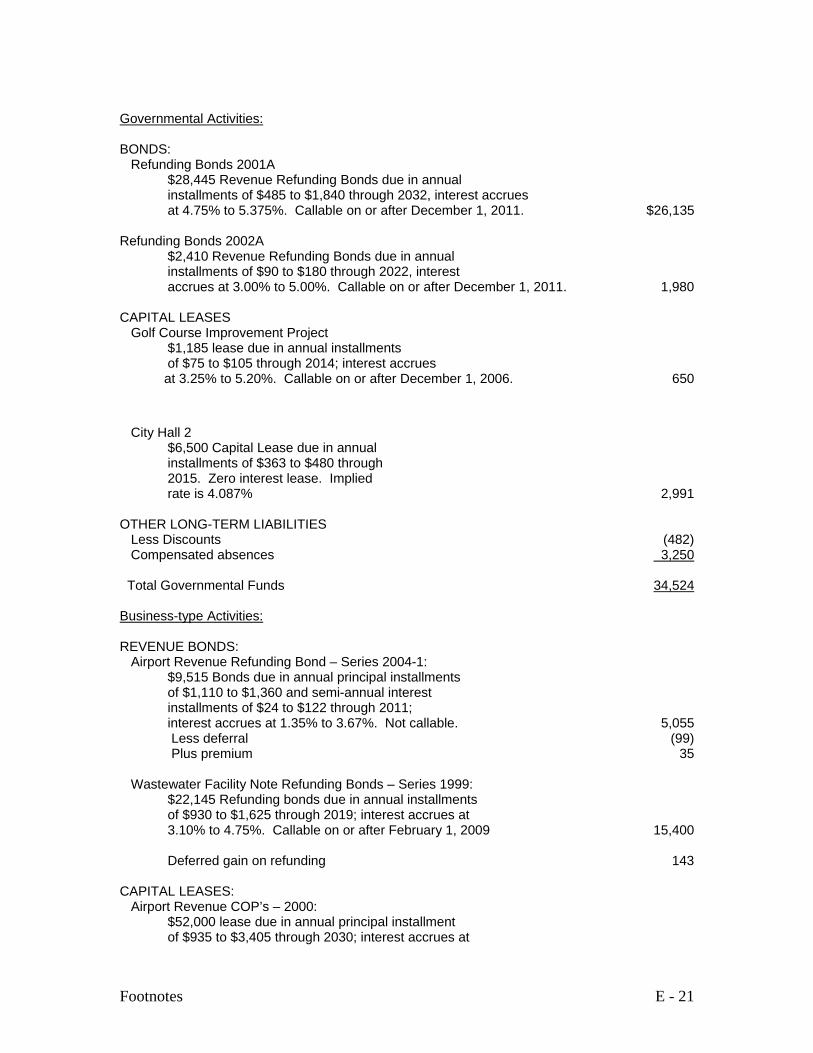
Footnotes E - 21
Governmental Activities: BONDS: Refunding Bonds 2001A $28,445 Revenue Refunding Bonds due in annual installments of $485 to $1,840 through 2032, interest accrues at 4.75% to 5.375%. Callable on or after December 1, 2011. $26,135 Refunding Bonds 2002A $2,410 Revenue Refunding Bonds due in annual installments of $90 to $180 through 2022, interest accrues at 3.00% to 5.00%. Callable on or after December 1, 2011. 1,980 CAPITAL LEASES Golf Course Improvement Project $1,185 lease due in annual installments of $75 to $105 through 2014; interest accrues at 3.25% to 5.20%. Callable on or after December 1, 2006. 650
City Hall 2 $6,500 Capital Lease due in annual installments of $363 to $480 through 2015. Zero interest lease. Implied rate is 4.087% 2,991 OTHER LONG-TERM LIABILITIES Less Discounts (482) Compensated absences 3,250 Total Governmental Funds 34,524 Business-type Activities: REVENUE BONDS: Airport Revenue Refunding Bond – Series 2004-1: $9,515 Bonds due in annual principal installments of $1,110 to $1,360 and semi-annual interest installments of $24 to $122 through 2011; interest accrues at 1.35% to 3.67%. Not callable. 5,055 Less deferral (99)
Plus premium 35 Wastewater Facility Note Refunding Bonds – Series 1999: $22,145 Refunding bonds due in annual installments of $930 to $1,625 through 2019; interest accrues at 3.10% to 4.75%. Callable on or after February 1, 2009 15,400 Deferred gain on refunding 143 CAPITAL LEASES: Airport Revenue COP’s – 2000: $52,000 lease due in annual principal installment of $935 to $3,405 through 2030; interest accrues at

Footnotes E - 22
4.60% to 5.875%. Callable on or after September 1, 2010 45,975 LOANS: Section 108 Loan: $2,100 Section 108 loan due in annual installments of $140 through 2017; interest accrues at 3.45% to 5.77%. 1,400 Sewer Line Loan: $1,616 loan due in semi-annual payments including interest of $59 through 2022; interest accrues at 4%. 1,291 Sewer Line Loan: $672 sewer line loan due in semi-annual payments including interest of $25 through 2012; interest accrues at 4%. 200 Sewer Line Loan: $8,240 sewer line loan; to be repaid in bi-annual installments over 20 years; interest accrues at 3.75%. 7,811 Airport Line of Credit: $0 drawn on a $7,000 variable rate line of credit; to be repaid on or before October 2, 2006; interest accrues at Prime less 2.35%. Interest paid monthly. Compensated Absences 1,357 Total Business-type Activities: 78,568 Total long-term liabilities $113,092 Conduit Bonds The City is authorized under Title 50 Chapter 27 of the Idaho Code to create an industrial development corporation for the purpose of issuing Industrial Revenue Bonds to provide financial assistance to private-sector entities for the acquisition and construction of manufacturing, processing, production, assembly, warehousing, solid waste disposal, ski area and energy facilities (excluding facilities to transmit, distribute or produce electrical energy). Ordinance No. 4700 of the City created the Industrial Development Corporation of the City of Boise, Idaho. From time to time the City, through the Industrial Development Corporation, has issued Industrial Revenue Bonds. The bonds are payable solely from payments received from the private-sector entity served by the issuance. Upon repayment of the bonds, ownership of the acquired facilities transfers to the private-sector entity. Pursuant to Title 50 Chapter 2706 of the Idaho Code, neither the City, the State nor any political subdivision thereof is obligated in any manner for repayment of the bonds. Accordingly, the bonds are not reported as liabilities in the accompanying financial statements. As of September 30, 2007, there is one Industrial Revenue Bond outstanding, with an aggregate principal amount of $4,205.
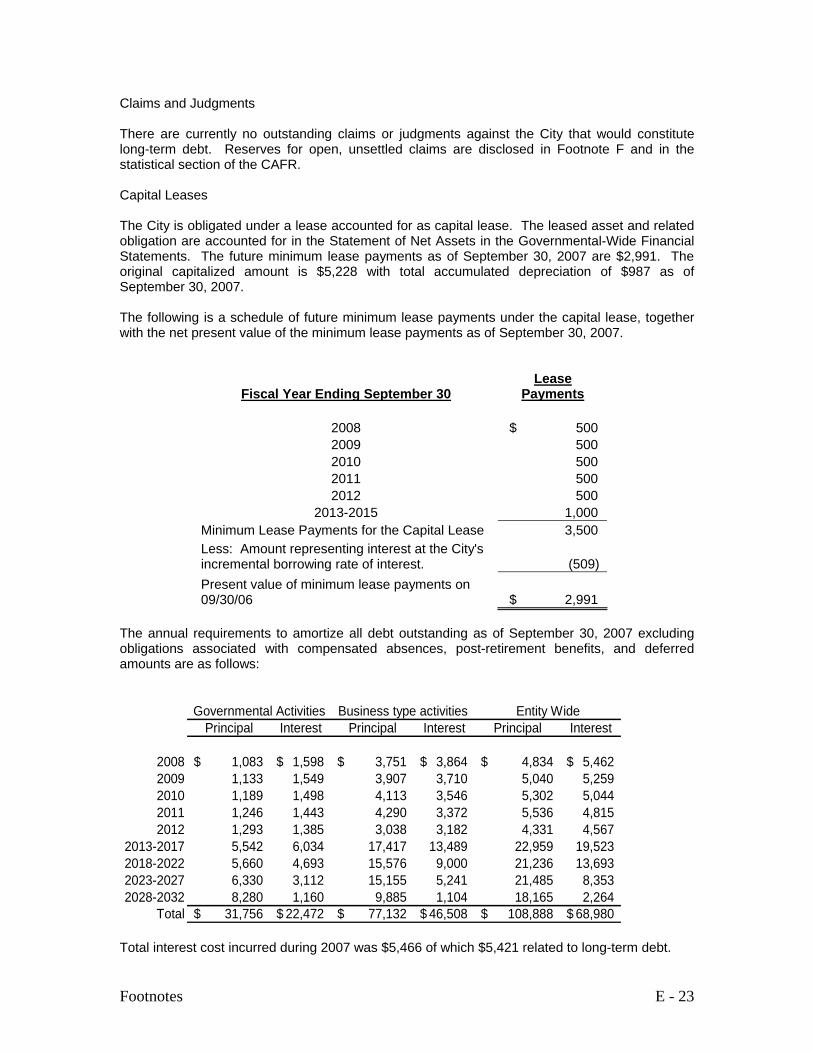
Footnotes E - 23
Claims and Judgments There are currently no outstanding claims or judgments against the City that would constitute long-term debt. Reserves for open, unsettled claims are disclosed in Footnote F and in the statistical section of the CAFR. Capital Leases The City is obligated under a lease accounted for as capital lease. The leased asset and related obligation are accounted for in the Statement of Net Assets in the Governmental-Wide Financial Statements. The future minimum lease payments as of September 30, 2007 are $2,991. The original capitalized amount is $5,228 with total accumulated depreciation of $987 as of September 30, 2007. The following is a schedule of future minimum lease payments under the capital lease, together with the net present value of the minimum lease payments as of September 30, 2007.
Fiscal Year Ending September 30 Lease
Payments
2008 $ 500 2009 500 2010 500 2011 500 2012 500
2013-2015 1,000 Minimum Lease Payments for the Capital Lease 3,500 Less: Amount representing interest at the City's incremental borrowing rate of interest. (509) Present value of minimum lease payments on 09/30/06 $ 2,991
The annual requirements to amortize all debt outstanding as of September 30, 2007 excluding obligations associated with compensated absences, post-retirement benefits, and deferred amounts are as follows:
Governmental Activities Business type activities Entity WidePrincipal Interest Principal Interest Principal Interest
2008 1,083$ 1,598$ 3,751$ 3,864$ 4,834$ 5,462$ 2009 1,133 1,549 3,907 3,710 5,040 5,259 2010 1,189 1,498 4,113 3,546 5,302 5,044 2011 1,246 1,443 4,290 3,372 5,536 4,815 2012 1,293 1,385 3,038 3,182 4,331 4,567
2013-2017 5,542 6,034 17,417 13,489 22,959 19,523 2018-2022 5,660 4,693 15,576 9,000 21,236 13,693 2023-2027 6,330 3,112 15,155 5,241 21,485 8,353 2028-2032 8,280 1,160 9,885 1,104 18,165 2,264
Total 31,756$ 22,472$ 77,132$ 46,508$ 108,888$ 68,980$ Total interest cost incurred during 2007 was $5,466 of which $5,421 related to long-term debt.
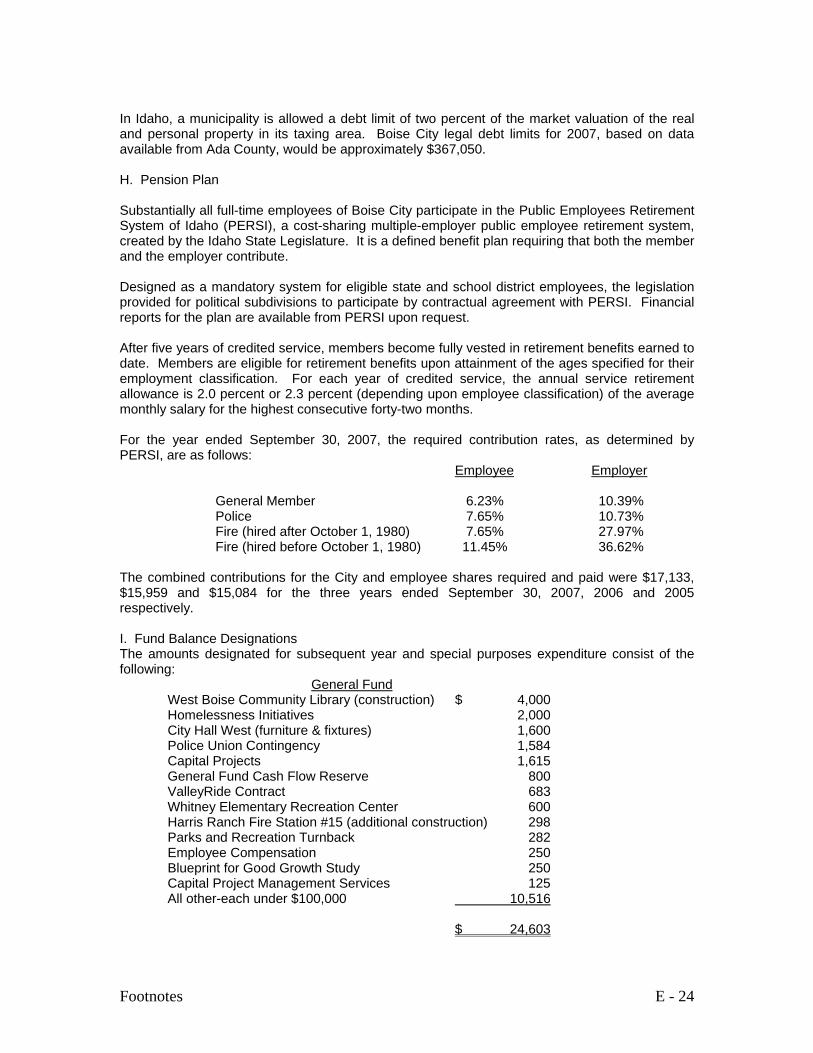
Footnotes E - 24
In Idaho, a municipality is allowed a debt limit of two percent of the market valuation of the real and personal property in its taxing area. Boise City legal debt limits for 2007, based on data available from Ada County, would be approximately $367,050. H. Pension Plan Substantially all full-time employees of Boise City participate in the Public Employees Retirement System of Idaho (PERSI), a cost-sharing multiple-employer public employee retirement system, created by the Idaho State Legislature. It is a defined benefit plan requiring that both the member and the employer contribute. Designed as a mandatory system for eligible state and school district employees, the legislation provided for political subdivisions to participate by contractual agreement with PERSI. Financial reports for the plan are available from PERSI upon request. After five years of credited service, members become fully vested in retirement benefits earned to date. Members are eligible for retirement benefits upon attainment of the ages specified for their employment classification. For each year of credited service, the annual service retirement allowance is 2.0 percent or 2.3 percent (depending upon employee classification) of the average monthly salary for the highest consecutive forty-two months. For the year ended September 30, 2007, the required contribution rates, as determined by PERSI, are as follows: Employee Employer General Member 6.23% 10.39% Police 7.65% 10.73% Fire (hired after October 1, 1980) 7.65% 27.97% Fire (hired before October 1, 1980) 11.45% 36.62% The combined contributions for the City and employee shares required and paid were $17,133, $15,959 and $15,084 for the three years ended September 30, 2007, 2006 and 2005 respectively. I. Fund Balance Designations The amounts designated for subsequent year and special purposes expenditure consist of the following: General Fund West Boise Community Library (construction) $ 4,000 Homelessness Initiatives 2,000 City Hall West (furniture & fixtures) 1,600 Police Union Contingency 1,584 Capital Projects 1,615 General Fund Cash Flow Reserve 800 ValleyRide Contract 683 Whitney Elementary Recreation Center 600 Harris Ranch Fire Station #15 (additional construction) 298 Parks and Recreation Turnback 282 Employee Compensation 250 Blueprint for Good Growth Study 250 Capital Project Management Services 125 All other-each under $100,000 10,516 $ 24,603

Footnotes E - 25
Capital Projects Harris Ranch Fire Station, Phase I $ 2,259 City Hall West Tenant Improvements 2,280 West Boise Branch Library 2,054 Relocate Fire Station #9 1,615 Hillcrest Branch Library 750 Esther Simplot Park/River Rec 745 Asphalt Repair 716 Warm Springs Golf Course Repairs 452 Ustick Road ROW 210 Art Capital Projects 201 African Zoo Exhibit 200 Hyatt Wetland Match (impact fee) 200 Collister Branch Library 190 Greenbelt Repairs 188 All other-each under $100,000 581 $ 12,641 The designation for special purposes is a set aside for cash flow purposes J. Net Assets The government-wide statement of net assets reports $39,959 of restricted net assets, of which $17,540 is restricted by enabling legislation K. Commitments Construction-in-progress in the governmental funds as of September 30, 2007, is $18,073. The estimated cost to complete proprietary construction projects was approximately $27,148. Of the estimated cost to complete, approximately $10,871 will be funded by state and federal grants, and passenger facility charges. See Note I for City commitments that are included in fund balance designations. L. Contingent Liabilities The City is involved in several claims and is a defendant in pending and threatened litigation. While it is not feasible to predict or determine the ultimate outcome of all these matters, in management’s opinion, they will not have a material adverse effect upon accompanying financial statements. M. Special Items In fiscal year 2007 the City determined there were certain inventory balances that were not reflected in the financial statements. A prior period adjustment was recorded to establish the beginning balance. The effects of this change is as follows General Sewer Nonmajor Balance at 9/30/06 $407 $0 $0 Inventory Adjustment 136 515 61 Balance at 9/30/06 As restated 543 515 61 N. Subsequent Events On October 15, 2007 the City defeased the 2002A Refunding Bonds ($1,980 in long term debt.)

Footnotes E - 26
O. Component Unit Capital City Development Corporation is an urban renewal agency created by and existing under the Idaho Urban Renewal Law of 1965, as amended, and is an independent public body. The following is a summary of the disclosures required for a fair presentation of the component unit in the City’s financial statements: The accounting and reporting policies of the Agency relating to the funds included in the accompanying financial statements conform to generally accepted accounting principles applicable to state and local governments. As allowed in Section P80 of GASB’s “Codification of Governmental Accounting and Financial Reporting Standards”, the Corporation has elected not to apply to its proprietary fund and government-wide financial statements Financial Accounting Standards Board Statements and Interpretations, Accounting Principles Board Opinions, and Accounting Research Bulletins of the Committee of Accounting Procedure issued after November 30, 1989. Restricted Assets –Restricted assets are held by the Agency’s agent in the Agency’s name. Investments are generally held until maturity. The bond resolutions limit investments to certain types of securities, which meet defined standards. At September 30, 2007, $5,738 is restricted for debt service reserves and for expenditure on certain capital asset acquisitions. Due From Other Governmental Units Amounts due from other agencies and units of government are as follows:
Ada County Capital Lease 51,820$
The following represents the minimum future payments on the capital lease from Ada County.
2008 4,003$ 2009 4,115 2010 4,232 2011 4,715 2012 4,853
Thereafter 53,637 75,555
Less amount representing interest (23,735) 51,820$

Footnotes E - 27
Long-term Debt The following is long-term debt for the agency for the year ended September 30,2007
Parking and Revenue and Revenue Allocation Bonds
Series 1995 A 3,480$ Series 1995 B 2,915 Series 1998 3,495 Series 1999 2,540 Series 2002 C 2,490 Series 2004 A 6,555 Series 2004 B 2,610 Series 2005 County Complex 51,820 Line of credit 1,620 Other 574
78,099
Deferred interest cost (324)
77,775$
At September 30, 2006, long term debt is classified on the Statement of Net Assets as:
Current portion 3,245$ Long-term debt 74,530
77,775$
The 1995 Series bonds bear interest at rates between 4.5% and 6.125%. The Agency has the option to redeem bonds maturing on or after September 1, 2006 to March 1, 2007 at 102% of par value, from September 1, 2007 to March 1, 2008 at 101% of par value, and 100% of par value after September 1, 2008. Bond covenants place certain restrictions on the sale or encumbrance of the parking facilities. The 1998 Series bonds bear interest at a variable rate and interest is paid monthly. The interest rate at September 30, 2003 was 3.50%. The Agency has the option to redeem bonds maturing at a time greater or equal to 12 years after the date of the bond issuance at 101% of par value and at 100% of par value on the bonds maturing 13 years after the issuance of the bond and thereafter. Bond covenants place certain restrictions on the sale or encumbrance of the parking facilities. The 1999 Series bonds bear interest at rates between 3.7% and 5.15%. The agency has the option to redeem the bonds maturing on or after September 1, 2008 to September 1, 2009 at 101% of par value and 100% of par after March 1, 2010. Bond covenants place certain restriction on the sale or encumbrance of the parking facilities. The 2002 Series C Bonds for the Civic Plaza parking Garage bear a variable interest rate determined annually by the remarketing agent. At September 30, 2005, the interest rate was 3.50%. The Agency has the option to redeem the bonds maturing on or after March 1, 2012, at 102% of par value if the redemption date is more than 9 years to maturity, and at 101% if the redemption date is less than 9 years to maturity. The bonds mature on September 1, 2033. The 2004 Series A and B bonds for the Boise Downtown (BoDo) Project bear a variable interest

Footnotes E - 28
rate determined annually remarketing agent. At September 30, 2005, the interest rates were 3.23% and 4.20%. The Agency has the option to redeem the bonds at a price equal to 100% plus accrued interest in whole or in part on any business day. The bonds mature on March 1, 2024. The 2005 Series bonds bear interest at rates between 3% and 5%. The Agency does not have the option to redeem bonds maturing in years 2006 through 2015 prior to the maturity date, unless extraordinary events happen as prescribed in the debt agreement. Series that mature on or after August 15, 2016 are subject to redemption at the option of the Agency, which option shall be exercised upon the written direction of the County, in whole or in part at any time at a price equal to 100% plus accrued interest. The bonds mature on August 15, 2022. The agency has the option to redeem the bonds maturing on or after September 1, 2008 to September 1, 2009 at 101% of par value and 100% of par after March 1, 2010. Bond covenants place certain restrictions on the sale or encumbrance of the parking facilities. The 2005 Series bonds for the County Complex bear interest rates between 4.2% and 6.25%. The Agency has the option to redeem the bonds maturing on or after August 15, 2009 to August 14, 2010 at 101% of par value. For the bonds maturing August 15, 2010 through August 14, 2011, the option is for 100.5% of par value and 100% thereafter. The Agency executed an agreement with Christensen Corporation, an Idaho corporation, to exchange real property located at 10th Street and Bannock Street with property located at 14th Street and Idaho Street. In order to comply with the bond covenants, the Agency was required to provide a deposit of $645,000, $195,000 of which was used for an early redemption in 2004. Christensen Corporation loaned $645,000 to the Agency in the form of a promissory note, bearing interest at prime plus 1%, not to exceed 7% per annum. The Agency is required to repay the note with excess revenue allocation funds received from the site. Defeasance of Debt - In April, 2005 the Agency defeased 1999 general obligation bonds by placing the proceeds of new bonds in an irrevocable trust to provide for future debt payments on the bonds retired. Accordingly, the trust account assets and the liability for the defeased bonds are not included in the Agency’s financial statements. At September 30, 2007, $61,250 bonds outstanding are considered defeased. As a result of this refunding, the Corporation reduced its total debt service requirements by $37,382, which resulted in an economic gain (difference between the present value of the debt service payments on the old and new debt) of $7,878.

Footnotes E - 29
The annual requirements to retire the debt as of September 30, 2007 are as follows:
GOVERNMENTAL ACTIVITIES BUSINESS TYPE ACTIVITIES
PRINCIPAL INTEREST PRINCIPAL INTEREST
2008 1,698$ 2,813$ 1,547$ 1,018$ 2009 1,869 2,750 1,641 940 2010 2,040 2,681 1,705 856 2011 4,221 2,590 1,804 768 2012 2,863 2,468 1,907 674
2013-2017 19,105 9,854 7,479 1,806 2018-2022 24,748 4,075 2,007 789 2023-2027 1,143 22 717 392 2028-2032 - - 1,235 234 2033-2035 - - 370 14
57,687 27,253 20,412 7,491 Deferred Charges - - (324) - Total 57,687$ 27,253$ 20,088$ 7,491$
The Agency incurred bond issuance costs and deferred interest costs relating to debt. These costs are amortized over the life of the bonds and reduce the carrying amount of the related debt. At September 30, 2007, the deferred costs netted against the bond liabilities are $324. The Agency has a line of credit of $3,000 for the River Street/Myrtle Street project, with an annual limit based on projected revenue. There is an outstanding balance of $1,620 at September 30, 2007. Line of credit advances are secured by the Agency’s incremental tax revenues and lawful available resources. The line of credit agreements expire in December 2010. Long-term liability activity for the year ended September 30, 2007 was as follows:
Beginning Balance Additions Reductions
Ending Balance
Due Within One Year
Government Activities:Line of Credit 280$ 1,620$ (280)$ 1,620$ 2004A&B Series 4,307 (60) 4,247 188 2005 Series 56,425 (4,605) 51,820 1,510
61,012$ 1,620$ (4,945)$ 57,687$ 1,698$
Business- Type Activities:1995 Series A 3,456$ (279)$ 3,177$ 350$ 1995 Series B 3,185 (270) 2,915 285 1998 Series 4,110 (615) 3,495 365 1999 Series 2,762 (242) 2,520 255 202C Series 2,495 (5) 2,490 10 2004A&B Series 6,508 (1,590) 4,918 282 Line of Credit 600 (600) - Other 645 (71) 574
23,761$ -$ (3,672)$ 20,089$ 1,547$
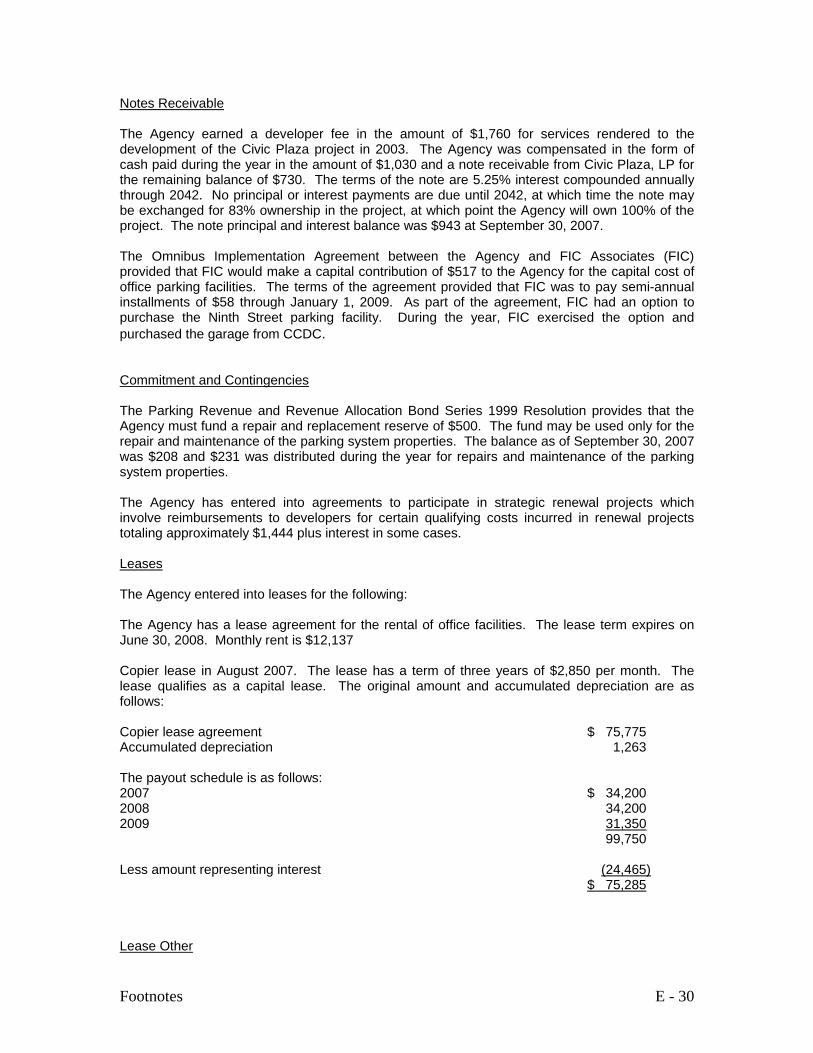
Footnotes E - 30
Notes Receivable The Agency earned a developer fee in the amount of $1,760 for services rendered to the development of the Civic Plaza project in 2003. The Agency was compensated in the form of cash paid during the year in the amount of $1,030 and a note receivable from Civic Plaza, LP for the remaining balance of $730. The terms of the note are 5.25% interest compounded annually through 2042. No principal or interest payments are due until 2042, at which time the note may be exchanged for 83% ownership in the project, at which point the Agency will own 100% of the project. The note principal and interest balance was $943 at September 30, 2007. The Omnibus Implementation Agreement between the Agency and FIC Associates (FIC) provided that FIC would make a capital contribution of $517 to the Agency for the capital cost of office parking facilities. The terms of the agreement provided that FIC was to pay semi-annual installments of $58 through January 1, 2009. As part of the agreement, FIC had an option to purchase the Ninth Street parking facility. During the year, FIC exercised the option and purchased the garage from CCDC. Commitment and Contingencies The Parking Revenue and Revenue Allocation Bond Series 1999 Resolution provides that the Agency must fund a repair and replacement reserve of $500. The fund may be used only for the repair and maintenance of the parking system properties. The balance as of September 30, 2007 was $208 and $231 was distributed during the year for repairs and maintenance of the parking system properties. The Agency has entered into agreements to participate in strategic renewal projects which involve reimbursements to developers for certain qualifying costs incurred in renewal projects totaling approximately $1,444 plus interest in some cases. Leases The Agency entered into leases for the following: The Agency has a lease agreement for the rental of office facilities. The lease term expires on June 30, 2008. Monthly rent is $12,137 Copier lease in August 2007. The lease has a term of three years of $2,850 per month. The lease qualifies as a capital lease. The original amount and accumulated depreciation are as follows: Copier lease agreement $ 75,775 Accumulated depreciation 1,263 The payout schedule is as follows: 2007 $ 34,200 2008 34,200 2009 31,350 99,750 Less amount representing interest (24,465) $ 75,285 Lease Other
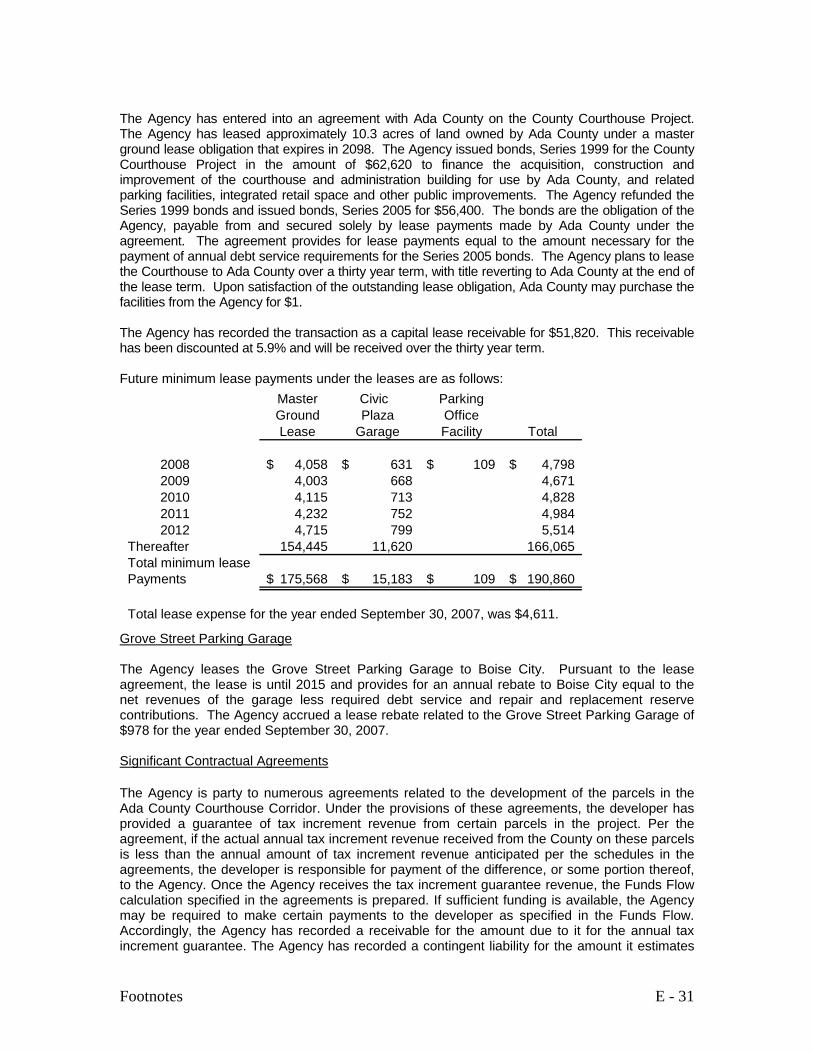
Footnotes E - 31
The Agency has entered into an agreement with Ada County on the County Courthouse Project. The Agency has leased approximately 10.3 acres of land owned by Ada County under a master ground lease obligation that expires in 2098. The Agency issued bonds, Series 1999 for the County Courthouse Project in the amount of $62,620 to finance the acquisition, construction and improvement of the courthouse and administration building for use by Ada County, and related parking facilities, integrated retail space and other public improvements. The Agency refunded the Series 1999 bonds and issued bonds, Series 2005 for $56,400. The bonds are the obligation of the Agency, payable from and secured solely by lease payments made by Ada County under the agreement. The agreement provides for lease payments equal to the amount necessary for the payment of annual debt service requirements for the Series 2005 bonds. The Agency plans to lease the Courthouse to Ada County over a thirty year term, with title reverting to Ada County at the end of the lease term. Upon satisfaction of the outstanding lease obligation, Ada County may purchase the facilities from the Agency for $1. The Agency has recorded the transaction as a capital lease receivable for $51,820. This receivable has been discounted at 5.9% and will be received over the thirty year term. Future minimum lease payments under the leases are as follows:
Grove Street Parking Garage The Agency leases the Grove Street Parking Garage to Boise City. Pursuant to the lease agreement, the lease is until 2015 and provides for an annual rebate to Boise City equal to the net revenues of the garage less required debt service and repair and replacement reserve contributions. The Agency accrued a lease rebate related to the Grove Street Parking Garage of $978 for the year ended September 30, 2007. Significant Contractual Agreements The Agency is party to numerous agreements related to the development of the parcels in the Ada County Courthouse Corridor. Under the provisions of these agreements, the developer has provided a guarantee of tax increment revenue from certain parcels in the project. Per the agreement, if the actual annual tax increment revenue received from the County on these parcels is less than the annual amount of tax increment revenue anticipated per the schedules in the agreements, the developer is responsible for payment of the difference, or some portion thereof, to the Agency. Once the Agency receives the tax increment guarantee revenue, the Funds Flow calculation specified in the agreements is prepared. If sufficient funding is available, the Agency may be required to make certain payments to the developer as specified in the Funds Flow. Accordingly, the Agency has recorded a receivable for the amount due to it for the annual tax increment guarantee. The Agency has recorded a contingent liability for the amount it estimates
Master Civic ParkingGround Plaza OfficeLease Garage Facility Total
2008 4,058$ 631$ 109$ 4,798$ 2009 4,003 668 4,671 2010 4,115 713 4,828 2011 4,232 752 4,984 2012 4,715 799 5,514
Thereafter 154,445 11,620 166,065 Total minimum leasePayments 175,568$ 15,183$ 109$ 190,860$
Total lease expense for the year ended September 30, 2007, was $4,611.

Footnotes E - 32
will be due to the developer upon receipt of the tax increment guarantee funds. The Agency and the developer have not reached final agreement on the interpretation of the provisions of the various agreements, so the estimated amount for both the receivable and the liability may change when final agreement is reached.

City of Boise, IdahoCombining Balance Sheet
Nonmajor Governmental Funds September 30, 2007
(amounts expressed in thousands)
Special Revenue Permanent Fund Community Dedicated Debt Service Total Nonmajor
Development FundASSETS
Cash and cash equivalents $ 3$ $ 3$ Investments 4 2,646 7,755 10,405 Accounts and interest receivable 29 98 127 Grants receivable 39 39 Interfund receivables 1 2,222 2,223 Prepaid Items Restricted cash and investments 378 378 Total assets 44$ 2,678$ 10,453$ 13,175$
LIABILITIESDeficit in cash $ $ 316$ 316$ Accounts payable 29 1 20 50 Interfund payables 11 124 1 136 Unearned revenue 4 4 Total liabilities 44 125 337 506
FUND BALANCESFund balances: Reserved for debt service and other obligations 8,484 8,484 Reserved for dedicated purposes 2,553 2,553 Unreserved, designated for subsequent years' expenditures 1,632 1,632 Total fund balances 2,553 10,116 12,669 Total liabilities and fund balances 44$ 2,678$ 10,453$ 13,175$
Trust Governmental Funds
Nonmajor Governmental Funds F - 1
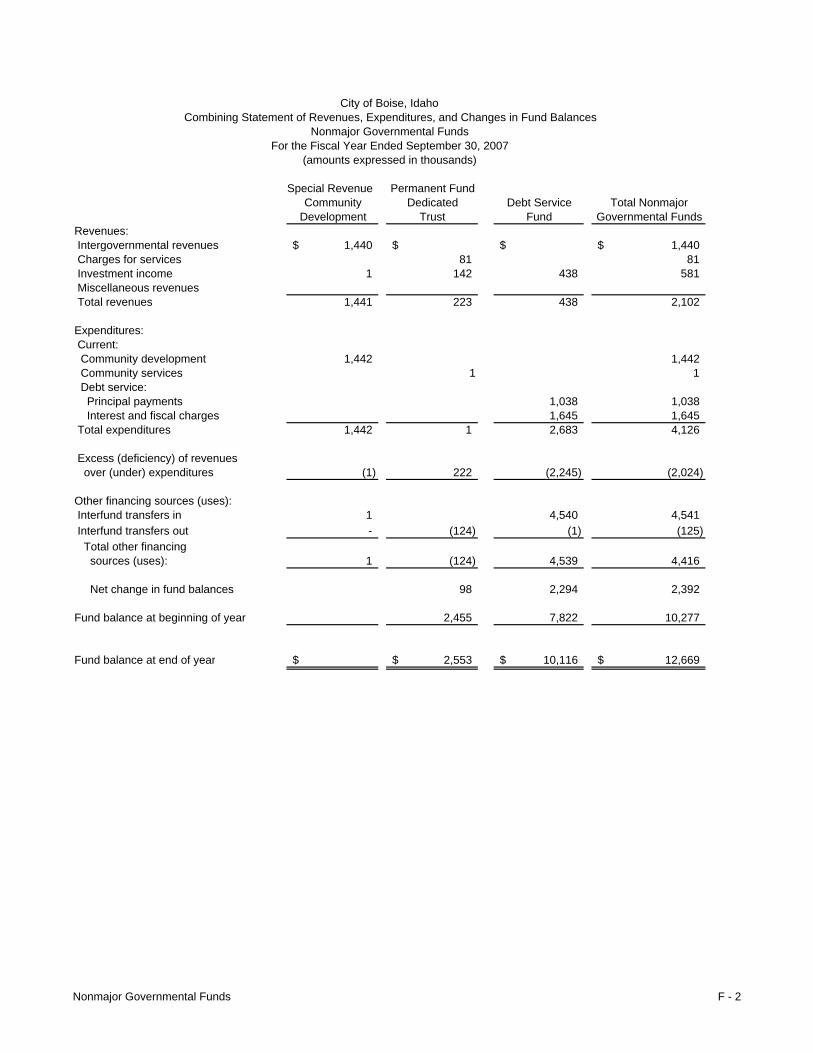
City of Boise, IdahoCombining Statement of Revenues, Expenditures, and Changes in Fund Balances
Nonmajor Governmental FundsFor the Fiscal Year Ended September 30, 2007
(amounts expressed in thousands)
Special Revenue Permanent FundCommunity Dedicated Debt Service Total Nonmajor
Development Trust Fund Governmental FundsRevenues: Intergovernmental revenues 1,440$ $ $ 1,440$ Charges for services 81 81 Investment income 1 142 438 581 Miscellaneous revenues Total revenues 1,441 223 438 2,102
Expenditures: Current: Community development 1,442 1,442 Community services 1 1 Debt service: Principal payments 1,038 1,038 Interest and fiscal charges 1,645 1,645 Total expenditures 1,442 1 2,683 4,126
Excess (deficiency) of revenues over (under) expenditures (1) 222 (2,245) (2,024)
Other financing sources (uses): Interfund transfers in 1 4,540 4,541 Interfund transfers out - (124) (1) (125) Total other financing sources (uses): 1 (124) 4,539 4,416
Net change in fund balances 98 2,294 2,392
Fund balance at beginning of year 2,455 7,822 10,277
Fund balance at end of year $ 2,553$ 10,116$ 12,669$
Nonmajor Governmental Funds F - 2

Actual Variances with Original Final Amounts Final Budget
Revenues: Property taxes $ $ $ $ Franchise fees 1,510 1,510 1,269 (241) Licenses and permits 1,261 1,261 1,440 179 Intergovernmental revenues 22,468 2,387 510 (1,877) Charges for services 620 6 (614) Donations 4,495 5,195 266 (4,929) Investment income 433 433 1,227 794 Miscellaneous revenues 392 193 (199) Total revenues 30,167 11,798 4,911 (6,887)
Expenditures: Current: General Government 1,080 1,569 563 1,006 Fire 553 803 289 514 Parks and recreation 3,601 5,233 1,879 3,354 Culture 811 1,178 424 754 Community services 15 22 8 14 Capital outlay 30,795 44,753 16,073 28,680 Interest and fiscal charges 2,721 3,181 3,181 Total expenditures 39,576 56,739 19,236 37,503 Excess (deficiency) of revenues over expenditures (9,409) (44,941) (14,325) 30,616
Other financing sources (uses):Capital leases 4,695 (4,695) Interfund transfers in 5,371 17,230 15,894 (1,336) Interfund transfers out (50) (453) (52) 401 Total other financing sources (uses) 5,321 21,472 15,842 (5,630) Net change in fund balances (4,088) (23,469) 1,517 24,986 Fund balance at beginning of year 31,545 31,545 31,545 Fund balance at end of year 27,457$ 8,076$ 33,062$ 24,986$
Budgeted Amounts
City of Boise, IdahoCapital Projects Fund
Schedule of Revenues, Expenditures, and Changes in Fund Balances - Budget and ActualFor the Fiscal Year Ended September 30, 2007
(amounts expressed in thousands)
Budget and Actual Comparison for Nonmajor Governmental Funds G - 1
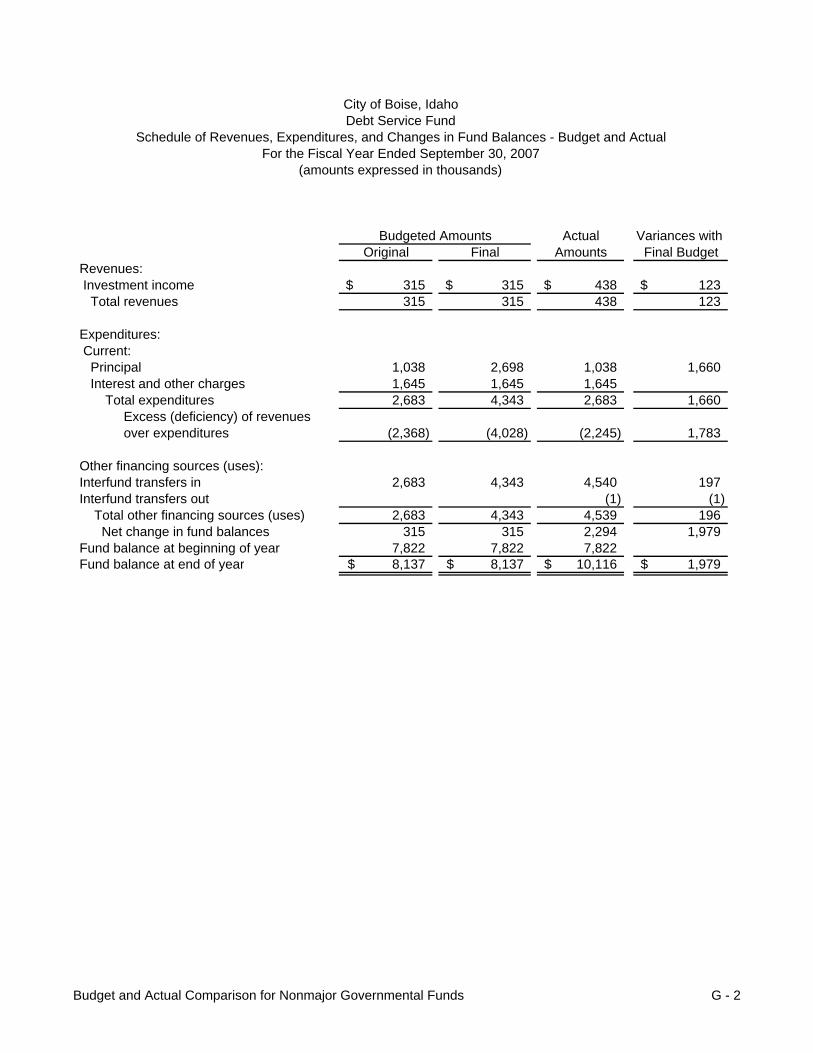
Actual Variances with Original Final Amounts Final Budget
Revenues: Investment income 315$ 315$ 438$ 123$ Total revenues 315 315 438 123
Expenditures: Current: Principal 1,038 2,698 1,038 1,660 Interest and other charges 1,645 1,645 1,645 Total expenditures 2,683 4,343 2,683 1,660 Excess (deficiency) of revenues over expenditures (2,368) (4,028) (2,245) 1,783
Other financing sources (uses):Interfund transfers in 2,683 4,343 4,540 197 Interfund transfers out (1) (1) Total other financing sources (uses) 2,683 4,343 4,539 196 Net change in fund balances 315 315 2,294 1,979 Fund balance at beginning of year 7,822 7,822 7,822 Fund balance at end of year 8,137$ 8,137$ 10,116$ 1,979$
Budgeted Amounts
Debt Service FundCity of Boise, Idaho
Schedule of Revenues, Expenditures, and Changes in Fund Balances - Budget and ActualFor the Fiscal Year Ended September 30, 2007
(amounts expressed in thousands)
Budget and Actual Comparison for Nonmajor Governmental Funds G - 2

Actual Variances with Original Final Amounts Final Budget
Revenues: Intergovernmental revenues 1,742$ 3,166$ 1,440$ (1,726)$ Program income Investment income 1 1 Miscellaneous revenues Total revenues 1,742 3,166 1,441 (1,725)
Expenditures: Current: Community development 1,737 3,225 1,442 1,783 Capital outlay 5 5 5 Total expenditures 1,742 3,230 1,442 1,788 Excess (deficiency) of revenues over expenditures (64) (1) 63 Other financing sources (uses): Interfund transfers in 51 51 Interfund transfers out (1) 1 Total other financing sources (uses) 50 52 Net change in fund balances (14) 14 Fund balance at beginning of year Fund balance at end of year $ (14)$ $ 14$
Budgeted Amounts
(amounts expressed in thousands)
City of Boise, IdahoSpecial Revenue - Community Development
Schedule of Revenues, Expenditures, and Changes in Fund Balances - Budget and ActualFor the Fiscal Year Ended September 30, 2007
Budget and Actual Comparison for Nonmajor Governmental Funds G - 3

Actual Variances with Original Final Amounts Final Budget
Revenues: Charges for services 50$ 50$ 81$ 31$ Investment income 92 92 142 50 Total revenues 142 142 223 81
Expenditures: Current: Community services 84 84 1 83 Total expenditures 84 84 1 83
Excess (deficiency) of revenues over (under) expenditures 58 58 222 164
Other financing sources (uses):Interfund transfers out (58) (58) (124) (66) Total other financing sources (uses): (58) (58) (124) (66) Net change in fund balances 98 98 Fund balance at beginning of year 2,455 2,455 2,455 Fund balance at end of year 2,455$ 2,455$ 2,553$ 98$
Budgeted Amounts
City of Boise, IdahoPermanent Fund - Dedicated Trust
Schedule of Revenues, Expenditures, and Changes in Fund Balances - Budget and ActualFor the Fiscal Year Ended September 30, 2007
(amounts expressed in thousands)
Budget and Actual Comparison for Nonmajor Governmental Funds G - 4

This page intentionally left blank
Nonmajor Proprietary Fund H - 1

Parking Municipal HousingGeothermal Garage Irrigation Rehabilitation
ASSETSCurrent assets:Cash and cash equivalents $ 51$ 2$ $ Investments 48 536 46 1,560 Receivables (net of allowance for uncollectibles) Accounts and interest 28 3 543 Assessments 1 Mortgage loans receivable 7,415 Mortgage loans in process 164 Interfund receivables 10 20 74 Inventory 131 Other assets 3 Prepaid items 2 Total current assets 217 590 69 9,761
Noncurrent assets:Capital assets: Land 2,301 Buildings 110 10,352 Improvements other than buildings 1,336 5 Service lines 5,184 149 Automobiles and trucks 114 Machinery and equipment 388 115 235 Construction in process 51 59 Less accumulated depreciation (2,707) (30) (3,775) Total capital assets (net of accumulated depreciation) 4,362 234 9,291 Total noncurrent assets 4,362 234 9,291 Total assets 4,579$ 590$ 303$ 19,052$
City of Boise, IdahoNonmajor Proprietary Funds
September 30, 2007Combining Statement of Net Assets (continued)
(amounts expressed in thousands)
Nonmajor Proprietary Fund H - 2

Total NonmajorBusiness-type Funds
53$ 2,190
574 1
7,415 164 104 131
3 2
10,637
2,301
10,462 1,341 5,333
114 738 110
(6,512)
13,887 13,887 24,524$
Nonmajor Proprietary Fund H - 3

Parking Municipal HousingGeothermal Garage Irrigation Rehabilitation
LIABILITIESCurrent liabilities: Accounts payable 14$ 47$ $ 152$ Other accrued liabilities 8 134 Compensated absences 10 Interfund payables 93 16 82 Unearned revenue 205 4 Current portion of long-term debt 140 Total current liabilities 312 47 28 518
Noncurrent liabilities: Compensated absences 46 Interfund payables 108 Other long-term debt, non-current 1,260 Total noncurrent liabilities 108 1,306 Total liabilities 420 47 28 1,824
NET ASSETSInvested in capital assets, net of related debt 4,362 234 7,891 Restricted for loans 9,337 Restricted for repairs Unrestricted (deficit) (203) 543 41 Total net assets 4,159$ 543$ 275$ 17,228$
Combining Statement of Net Assets (continued)September 30, 2006
(amounts expressed in thousands)
City of Boise, IdahoNonmajor Proprietary Funds
Nonmajor Proprietary Fund H - 4
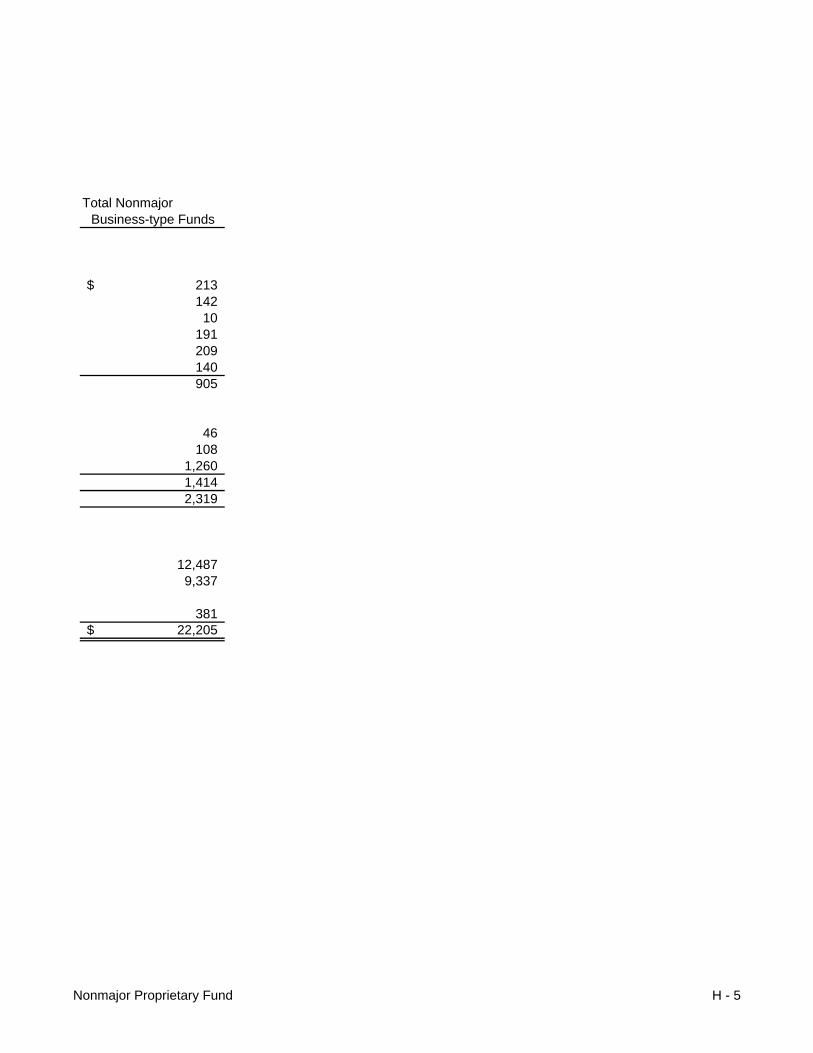
Total NonmajorBusiness-type Funds
213$ 142 10
191 209 140 905
46 108
1,260 1,414 2,319
12,487 9,337
381
22,205$
Nonmajor Proprietary Fund H - 5

Parking Municipal Housing Geothermal Garage Irrigation Rehabilitation
Operating revenues: Charges for services: Program income $ $ $ 1,162$ Interest income 320 User fees 613 27 Parking and concessions 482 Total charges for services 613 482 27 1,482 Miscellaneous revenues 1 16 Total operating revenues 614 482 27 1,498
Operating expenses: Personal services 50 733 Contractual services and utilities 300 455 22 1,713 Supplies and materials (70) 18 20 Depreciation 153 8 431 Total operating expenses 433 473 30 2,897
Operating income (loss) 181 9 (3) (1,399)
Nonoperating revenues (expenses) Operating grants 1,999 Gain (loss) on property sale/exchange Interest revenue 8 28 2 66 Interest expense (8) (76) Total nonoperating revenues (expenses) 28 2 1,989
Income before interfund transfers and contributions 181 37 (1) 590 Interfund transfers in 6 62 Capital contributions 56 186 Change in net assets 181 37 61 838
Total net assets - beginning, as restated 3,978 506 214 16,390
Total net assets - ending 4,159$ 543$ 275$ 17,228$
(amounts expressed in thousands)
City of Boise, IdahoCombining Statement of Revenues, Expenses, and Changes in Fund Net Assets (continued)
Nonmajor Proprietary FundsFor the Fiscal Year Ended September 30, 2007
Nonmajor Proprietary Fund H - 6

Total NonmajorBusiness-type Funds
1,162$ 320 640 482
2,604 17
2,621
783 2,490
(32) 592
3,833
(1,212)
1,999
104 (84)
2,019
807 68
242 1,117
21,088
22,205$
Nonmajor Proprietary Fund H - 7

Geothermal GarageCASH FLOWS FROM OPERATING ACTIVITIES Receipts from customers and users 665$ 482$ Receipts from interfund services provided Receipts from interfund services used Payments to suppliers (300) (426) Payments to employees (50) Payments for interfund services provided (22) Payments for interfund services used (9) Other operating revenue received 1 Other operating payments Net cash provided (used) by operating activities 285 56 CASH FLOWS FROM NONCAPITAL FINANCING ACTIVITIES Interfund transfers to other funds Operating grants received Interfund transfers from other funds Payments for interfund receivables (74) Interest paid (8) Net cash provided (used) by noncapital financing activities (82) CASH FLOWS FROM CAPITAL AND RELATED FINANCING ACTIVITIES Acquisition and construction of capital assets (339) Proceeds from sale of capital assets Proceeds from sale of land Mobile home lot sales Loan foreclosures Principal paid on debt Interest paid on financing Payments of interfund payables Capital contributions Net cash provided (used) by capital and related financing activities (339) CASH FLOWS FROM INVESTING ACTIVITIES Purchase of investment securities (100) (589) Proceeds from sale and maturities of investment securities 228 499 Interest on investments and advances 8 27 Net cash provided (used) by investing activities 136 (63) Net increase (decrease) in cash (7) Cash at beginning of year 58 Cash at end of year $ 51$
Nonmajor Proprietary FundsFor the Fiscal Year Ended September 30, 2007
Parking
(amounts expressed in thousands)
City of Boise, IdahoCombining Statement of Cash Flows (continued)
Nonmajor Proprietary Fund H - 8
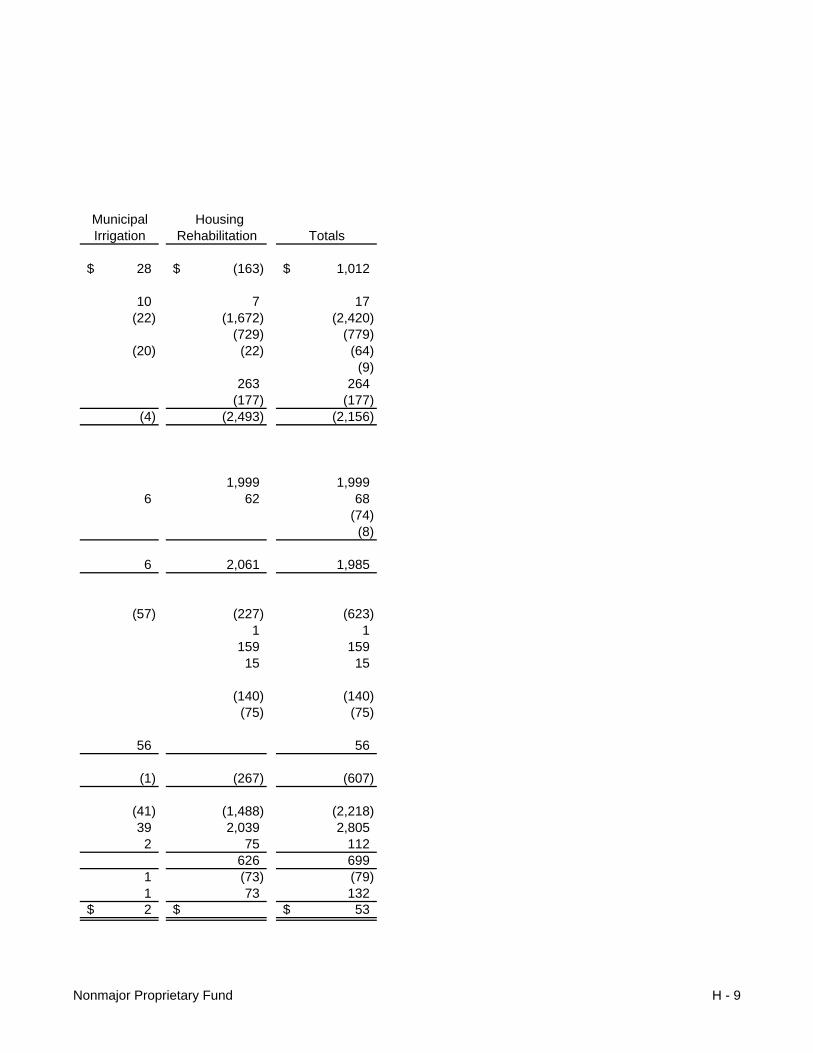
MunicipalIrrigation Rehabilitation Totals
28$ (163)$ 1,012$
10 7 17 (22) (1,672) (2,420)
(729) (779) (20) (22) (64)
(9) 263 264
(177) (177) (4) (2,493) (2,156)
1,999 1,999 6 62 68
(74) (8)
6 2,061 1,985
(57) (227) (623) 1 1
159 159 15 15
(140) (140) (75) (75)
56 56
(1) (267) (607)
(41) (1,488) (2,218) 39 2,039 2,805 2 75 112 626 699 1 (73) (79) 1 73 132 2$ $ 53$
Housing
Nonmajor Proprietary Fund H - 9
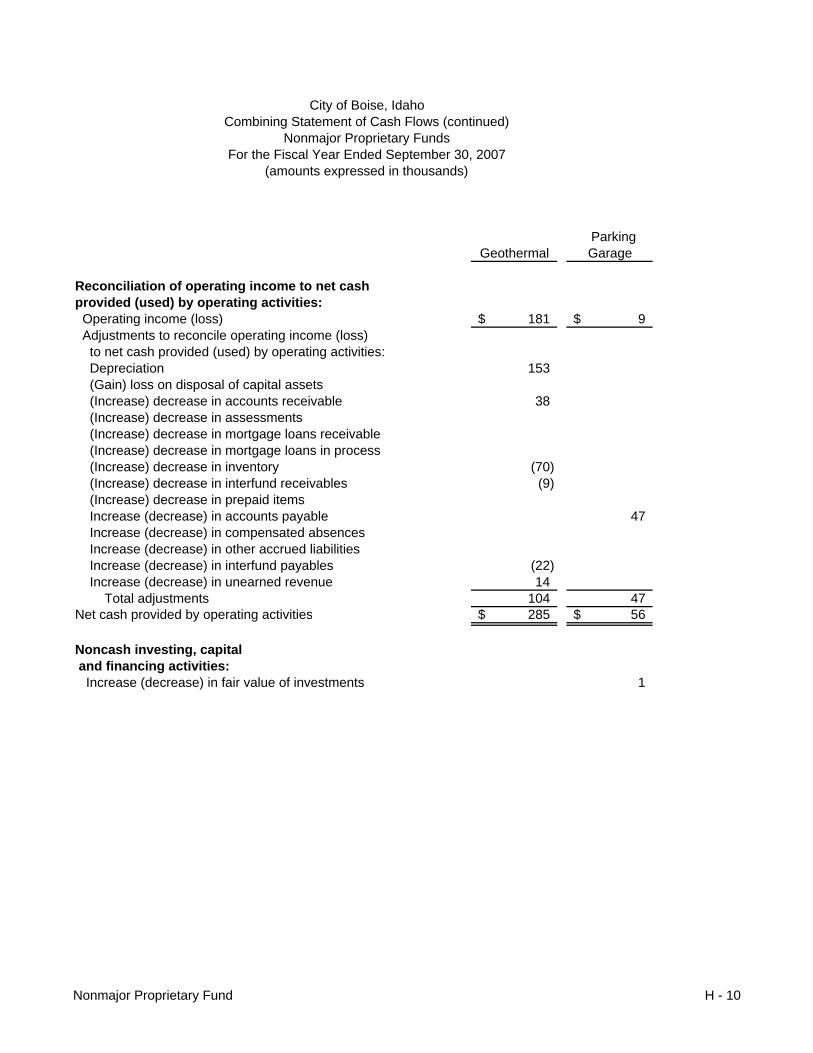
Geothermal Garage
Reconciliation of operating income to net cashprovided (used) by operating activities: Operating income (loss) 181$ 9$ Adjustments to reconcile operating income (loss) to net cash provided (used) by operating activities: Depreciation 153 (Gain) loss on disposal of capital assets (Increase) decrease in accounts receivable 38 (Increase) decrease in assessments (Increase) decrease in mortgage loans receivable (Increase) decrease in mortgage loans in process (Increase) decrease in inventory (70) (Increase) decrease in interfund receivables (9) (Increase) decrease in prepaid items Increase (decrease) in accounts payable 47 Increase (decrease) in compensated absences Increase (decrease) in other accrued liabilities Increase (decrease) in interfund payables (22) Increase (decrease) in unearned revenue 14 Total adjustments 104 47 Net cash provided by operating activities 285$ 56$
Noncash investing, capital and financing activities: Increase (decrease) in fair value of investments 1
City of Boise, IdahoCombining Statement of Cash Flows (continued)
Nonmajor Proprietary FundsFor the Fiscal Year Ended September 30, 2007
Parking
(amounts expressed in thousands)
Nonmajor Proprietary Fund H - 10

MunicipalIrrigation Rehabilitation Totals
(3)$ (1,399)$ (1,212)$
9 431 593 61 61
285 323 (1) (1)
(1,825) (1,825) (105) (105)
(70) (20) (22) (51)
4 4 55 102
6 6 9 9
10 7 (5) 1 15
(1) (1,094) (944) (4)$ (2,493)$ (2,156)$
1
Housing
Nonmajor Proprietary Fund H - 11

This page intentionally left blank

City of Boise, IdahoStatement of Revenues and Expenditures
Airport FundFor the Fiscal Year Ended September 30, 2007
(amounts expressed in thousands)
Annual 2007 YTDBudget Actual PercentFinal Amounts to Budget
Operating revenues: Airline landing fees 3,151$ 3,381$ 107% Airline rent 2,550 3,041 119% Parking fees 6,150 7,848 128% Car rental 3,389 3,869 114% Concessions 1,250 1,749 140% Rental income 2,249 2,471 110% Corporate sponsorship/donations 74 71 96% Inflight food sales 640 522 82% Other 649 856 132% Total operating revenues 20,102 23,808 118%
Operating expenses: Personnel services 7,498 6,884 92% Administration expenses 2,368 5,668 239% Supplies and materials 2,472 1,986 80% Professional services 2,519 2,819 112% Purchased services 532 512 96% Utilities and communications 979 989 101%Total operating expenses 16,368 18,858 115%
Operating income (loss) 3,734 4,950 133%
Nonoperating revenues (expenses) Passenger facility charges 6,000 7,026 117% Customer facility charges 697 829 119% Operating grants 350 487 139% Operating transfers in (Note IV E) 42 17 40% Operating transfers out (Note IV E) (77) 0% Interest revenue 77 939 1219% Interest expense (2,933) (2,876) 98% Asset sales 3 Gain (loss) on property sale/exchangeTotal nonoperating revenue (expenses) 4,156 6,425 155%
Net Income(Loss) before Depreciation and capital grant contributions 7,890 11,375 144%Depreciation (10,378) (11,101) 107%Capital contributions, grants 14,736 8,635 59%Capital contributions, donations 11 Net Income after depreciation and capital grants 12,248$ 8,920$ 73%
Other Proprietary Fund Information - Airport I - 1

City of BoiseBoise Airport
Charge Expiration Date: August 1, 2018Quarter ending: 2007 Q4
Authority and Cumulative Expenditures
Authorizing Authority CumulativeDocument Impose Use Collections + Int Expenditures94-01-C-02-BOI $9,650,423 $9,650,423 9,650,453 9,650,453 96-02-C-02-BOI 10,540,607 10,540,607 10,540,605 10,540,605 99-03-C-02-BOI 96,884,411 96,884,411 42,832,852 34,192,909 06-04-C-00-BOI 5,377,736 5,377,736 - 4,910,420
Total $122,453,177 $122,453,177 $63,023,910 $59,294,387
Collections and Interest
Previously Current Prior PeriodReported Quarter Adjustments Cumulative
PFC Revenue $60,755,084 $1,958,251 -$ $62,713,336Interest Earned 266,128 44,446 - 310,574 Total 61,021,212$ 2,002,697 -$ 63,023,910$
Remaining Authorized Collections $59,429,267
PFC Account Balance $3,729,523
NOTE: This schedule is not rounded to thousands (000) due to Federal reporting requirements.
PFC Quarterly Report - Summary
Other Proprietary Fund Information - Airport I - 2
This page intentionally left blank
Internal Service Fund J - 1

TotalL. M. Risk Internal Service
Shop Cunningham Management FundsASSETS
Current assets:Cash and cash equivalents $ 22$ $ 22$ Investments 180 213 8,930 9,323 Receivables: Accounts and interest 24 1 98 123 Interfund receivables 175 120 295 Inventory 94 94 Prepaid items Total current assets 473 236 9,148 9,857
Noncurrent assets:Interfund receivables Capital assets: Buildings 1,215 1,215 Improvements other than buildings 84 84 Automobiles and trucks 68 40 108 Machinery and equipment 156 5 161 Construction in progress 13 13 Less accumulated depreciation (575) (41) (616) Total capital assets (net of accumulated depreciation) 948 17 965 Total noncurrent assets 948 17 965 Total assets 1,421$ 236$ 9,165$ 10,822$
LIABILITIESCurrent liabilities: Accounts payable 113$ $ 132$ 245$ Other accrued liabilities 4,847 4,847 Compensated absences 8 4 12 Interfund payables 31 1,356 1,387 Unearned revenue 97 97 Total current liabilities 249 6,339 6,588
Noncurrent liabilities: Compensated absences 40 20 60 Interfund payables 792 792 Total noncurrent liabilities 832 20 852 Total liabilities 1,081 6,359 7,440
NET ASSETSInvested in capital assets, net of related debt 948 17 965 Unrestricted (deficit) (608) 236 2,789 2,417 Total net assets 340$ 236$ 2,806$ 3,382$
(amounts expressed in thousands)
City of Boise, IdahoCombining Statement of Net Assets (continued)
Internal Service FundsSeptember 30, 2007
Internal Service Fund J - 2
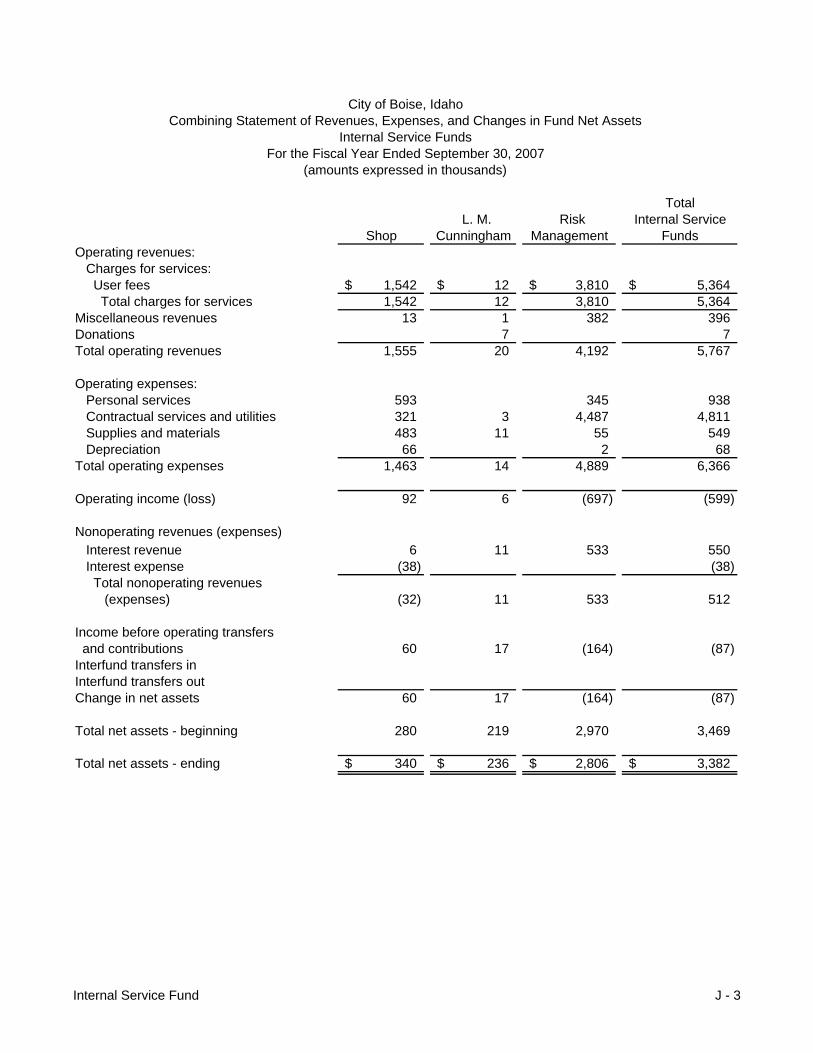
TotalInternal Service
Shop Cunningham Management FundsOperating revenues: Charges for services: User fees 1,542$ 12$ 3,810$ 5,364$ Total charges for services 1,542 12 3,810 5,364 Miscellaneous revenues 13 1 382 396 Donations 7 7 Total operating revenues 1,555 20 4,192 5,767
Operating expenses: Personal services 593 345 938 Contractual services and utilities 321 3 4,487 4,811 Supplies and materials 483 11 55 549 Depreciation 66 2 68 Total operating expenses 1,463 14 4,889 6,366
Operating income (loss) 92 6 (697) (599)
Nonoperating revenues (expenses) Interest revenue 6 11 533 550 Interest expense (38) (38) Total nonoperating revenues (expenses) (32) 11 533 512
Income before operating transfers and contributions 60 17 (164) (87) Interfund transfers in Interfund transfers out Change in net assets 60 17 (164) (87)
Total net assets - beginning 280 219 2,970 3,469
Total net assets - ending 340$ 236$ 2,806$ 3,382$
City of Boise, IdahoCombining Statement of Revenues, Expenses, and Changes in Fund Net Assets
Internal Service FundsFor the Fiscal Year Ended September 30, 2007
L. M. Risk
(amounts expressed in thousands)
Internal Service Fund J - 3

Shop CunninghamCASH FLOWS FROM OPERATING ACTIVITIES Receipts from customers and users 1,521$ 13$ Receipts from interfund services provided Receipts from interfund services used Other operating receipts 13 8 Payments to suppliers (779) (15) Payments to employees (589) Payments for interfund services provided (20) Payments for interfund services used (1) Net cash provided (used) by operating activities 145 6 CASH FLOWS FROM NONCAPITAL FINANCING ACTIVITIES Interfund transfers from other funds Payments for advances from other funds (27) Net cash provided (used) by noncapital financing activities (27) CASH FLOWS FROM CAPITAL AND RELATED FINANCING ACTIVITIES Acquistion and construction of capital assets (2) Proceeds from sale of capital assets 1 Interest paid on financing (38) Net cash provided (used ) by capital and related financing activities (39) CASH FLOWS FROM INVESTING ACTIVITIES Purchase of investment securities (1,108) (142) Proceeds from sale and maturities of investment securities 1,023 125 Interest on investments 6 11 Net cash provided (used) by investing activities (79) (6) Net increase (decrease) in cash and cash equivalents
Cash and cash equivalents at beginning of year 22 Cash and cash equivalents at end of year $ 22$
City of Boise, IdahoCombining Statement of Cash Flows (continued)
Internal Service FundsFor the Fiscal Year Ended September 30, 2007
(amounts expressed in thousands)
L. M.
Internal Service Fund J - 4
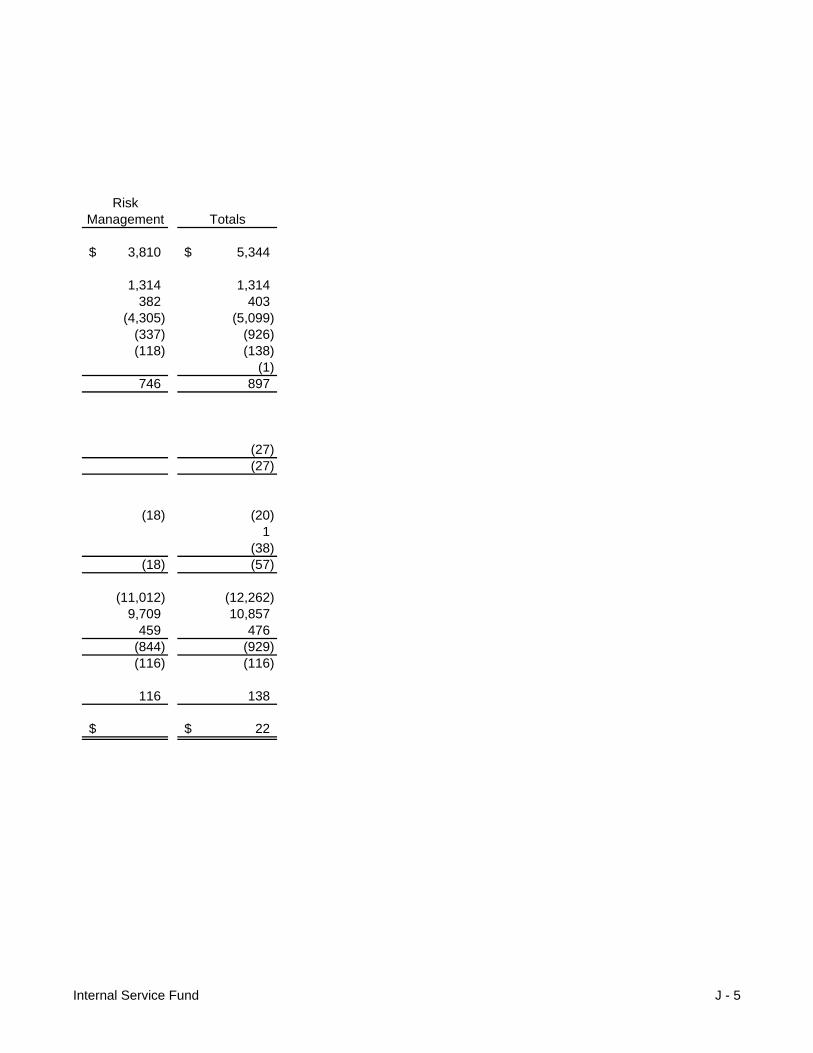
RiskManagement Totals
3,810$ 5,344$
1,314 1,314 382 403
(4,305) (5,099) (337) (926) (118) (138)
(1) 746 897
(27) (27)
(18) (20) 1
(38) (18) (57)
(11,012) (12,262) 9,709 10,857
459 476 (844) (929) (116) (116)
116 138
$ 22$
Internal Service Fund J - 5
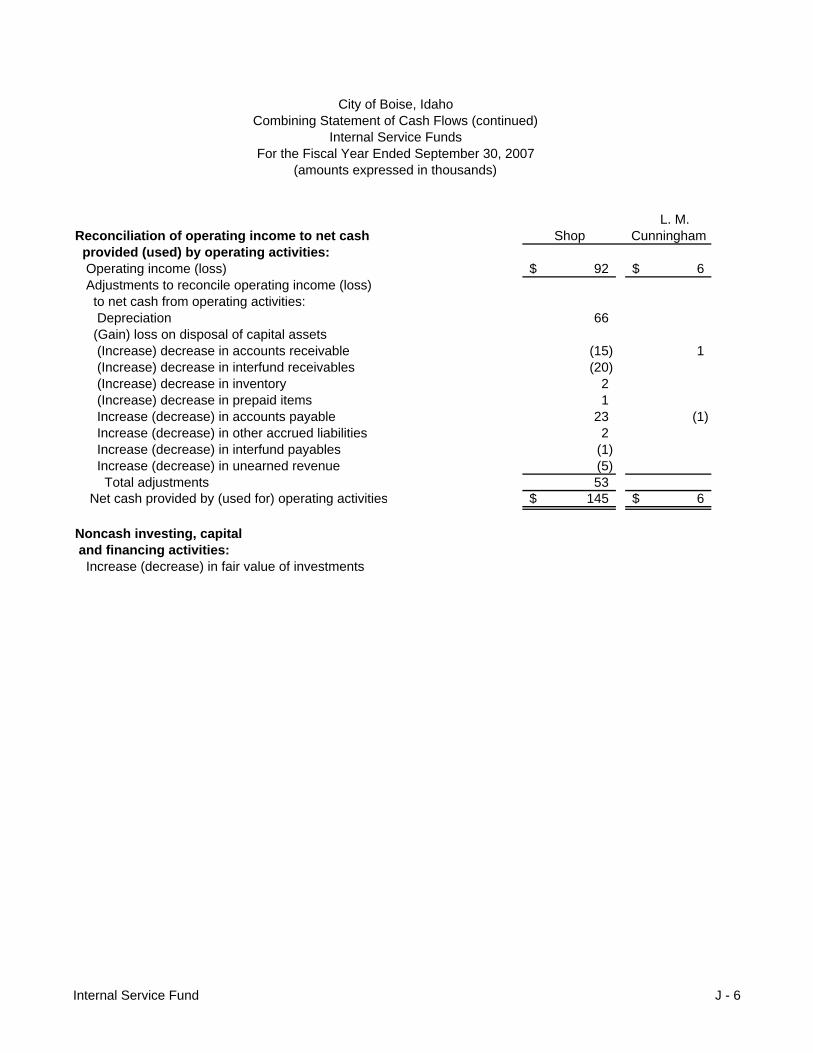
Reconciliation of operating income to net cash Shop Cunningham provided (used) by operating activities: Operating income (loss) 92$ 6$ Adjustments to reconcile operating income (loss) to net cash from operating activities: Depreciation 66 (Gain) loss on disposal of capital assets (Increase) decrease in accounts receivable (15) 1 (Increase) decrease in interfund receivables (20) (Increase) decrease in inventory 2 (Increase) decrease in prepaid items 1 Increase (decrease) in accounts payable 23 (1) Increase (decrease) in other accrued liabilities 2 Increase (decrease) in interfund payables (1) Increase (decrease) in unearned revenue (5) Total adjustments 53 Net cash provided by (used for) operating activities 145$ 6$
Noncash investing, capital and financing activities: Increase (decrease) in fair value of investments
L. M.
(amounts expressed in thousands)
City of Boise, IdahoCombining Statement of Cash Flows (continued)
Internal Service FundsFor the Fiscal Year Ended September 30, 2007
Internal Service Fund J - 6
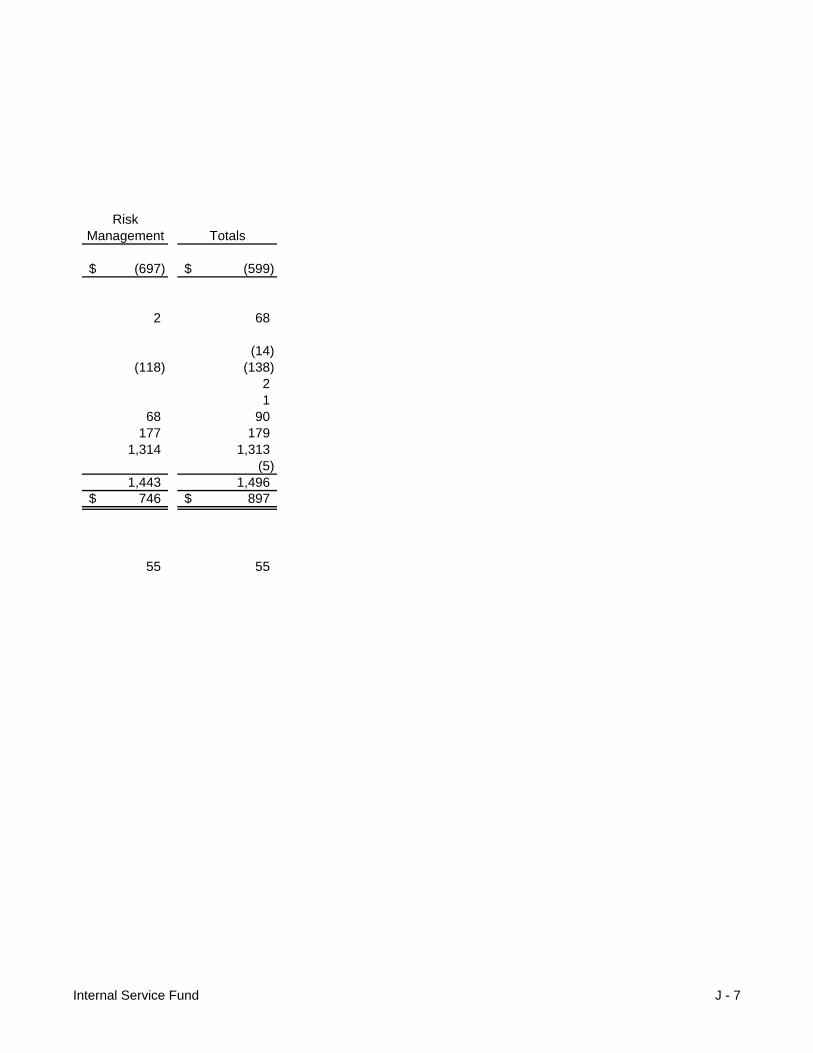
RiskManagement Totals
(697)$ (599)$
2 68 (14)
(118) (138) 2 1
68 90 177 179
1,314 1,313 (5)
1,443 1,496 746$ 897$
55 55
Internal Service Fund J - 7
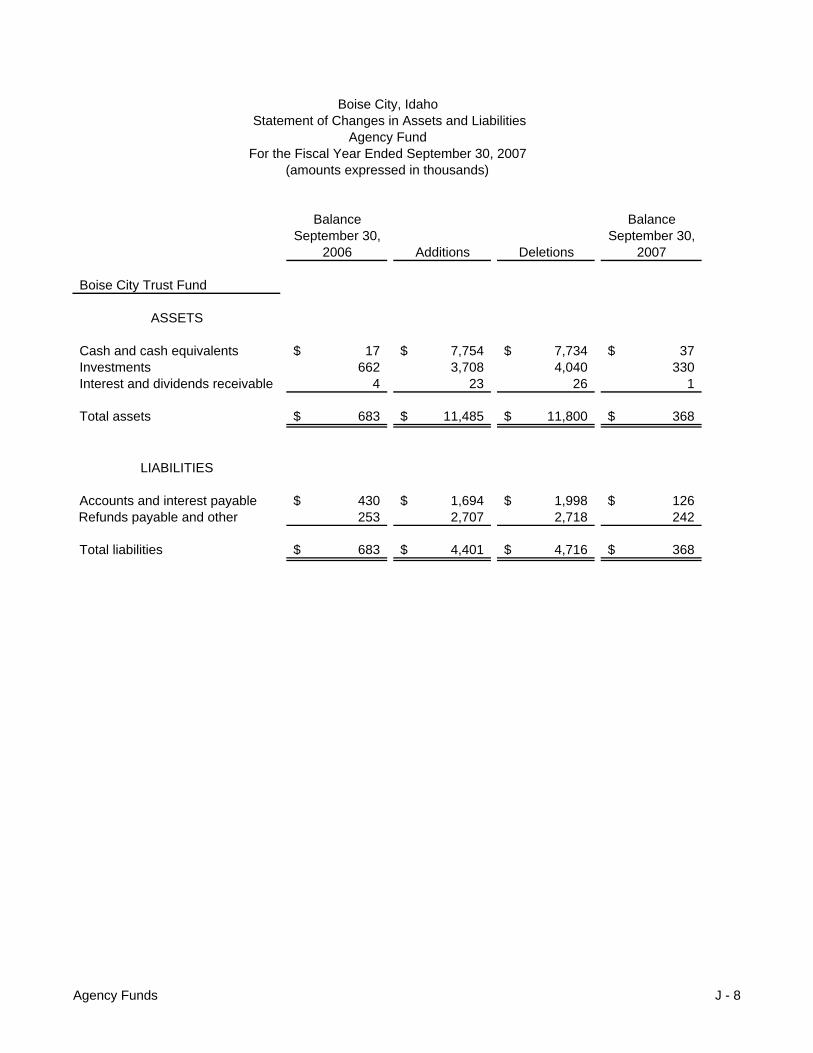
Balance BalanceSeptember 30, September 30,
2006 Additions Deletions 2007
Boise City Trust Fund
ASSETS
Cash and cash equivalents 17$ 7,754$ 7,734$ 37$ Investments 662 3,708 4,040 330 Interest and dividends receivable 4 23 26 1
Total assets 683$ 11,485$ 11,800$ 368$
LIABILITIES
Accounts and interest payable 430$ 1,694$ 1,998$ 126$ Refunds payable and other 253 2,707 2,718 242
Total liabilities 683$ 4,401$ 4,716$ 368$
(amounts expressed in thousands)
Boise City, Idaho Statement of Changes in Assets and Liabilities
Agency FundFor the Fiscal Year Ended September 30, 2007
Agency Funds J - 8

Fiscal Year2007 2006 2005 2004 2003 2002 2001
Invested in capital assets, net of related debt 158,509$ 143,454$ 120,522$ 120,050$ 112,025$ 102,753$ 90,649$ Restricted 22,086 17,884 16,300 16,655 18,386 15,588 11,034 Unrestricted 28,334 28,889 11,589 3,290 (2,427) (33) 2,910
208,929 190,227 148,411 139,995 127,984 118,308 104,593
Invested in capital assets, net of related debt 363,607 346,846 334,807 332,110 318,262 302,695 248,075 Restricted 17,873 16,699 12,177 12,150 11,464 10,848 11,025 Unrestricted 64,219 58,092 55,662 41,682 50,847 64,085 94,777
445,699 421,637 402,646 385,942 380,573 377,628 353,877
Invested in capital assets, net of related debt 522,116 490,300 455,329 452,160 430,287 405,448 338,724 Restricted 39,959 34,583 28,477 28,805 29,850 26,436 22,059 Unrestricted 92,553 86,981 67,251 44,972 48,420 64,052 97,687
654,628$ 611,864$ 551,057$ 525,937$ 508,557$ 495,936$ 458,470$
Primary government
Total primary government activities net assets
Governmental Activities
Total governmental activities net assets
Business-type Activities
Total business-type activities net assets
City of Boise
Amounts Expressed in ThousandsLast Seven Fiscal YearsNet Assets by Component
Statistical Section K - 1

Fiscal Year2007 2006 2005 2004 2003 2002 2001
22,019$ 16,217$ 17,634$ 14,452$ 13,977$ 15,043$ 13,299$ 58,333 52,491 46,868
Fire 31,644 31,063 30,057 26,797 Police 40,340 36,415 34,874 32,681
21,199 19,155 18,092 17,682 15,141 14,943 13,676 7,333 7,266 6,798 5,310 6,207 6,254 5,740
13,758 12,066 11,401 11,545 10,845 10,282 9,921 1,437 585 567 743 757 1,139 994 1,872 1,929 1,999 2,064 2,209 1,754 1,776
139,602 124,696 121,422 111,274 107,469 101,906 92,274
Business-type activitiesAirport 32,880 28,622 27,414 26,268 21,450 18,886 16,805 Sewer 27,599 27,580 26,204 25,312 25,570 25,060 22,260 Solid waste 20,203 18,971 16,207 14,534 13,918 13,667 13,485 Other 3,927 3,193 4,313 4,133 6,790 10,396 8,699
Total business-type activies expenses 84,609 78,366 74,138 70,247 67,728 68,009 61,249 Total primary government expenses 224,211$ 203,062$ 195,560$ 181,521$ 175,197$ 169,915$ 153,523$
Program RevenuesGovernmental activities
Charges for services:General government 5,324$ 4,285$ 3,342$ 1,719$ 2,643$ 2,085$ 3,139$ Public Safety: 5,634 4,969 4,375 Fire 3,471 3,819 3,263 3,218 Police 3,707 3,235 2,974 2,344 Parks and recreation 7,654 7,634 7,055 5,957 5,320 4,320 5,692 Community services 10,357 10,261 8,510 7,382 351 6,772 9,516 Other activities 484 485 528 486 6,339 775 167
Operation grants and contributions 22,459 19,507 18,350 17,808 16,802 16,278 14,512 Capital grants and contributions 5,055 23,647 2,226 6,822 3,490 6,047 7,541
Total governmental activities revenues 58,511 72,873 46,248 45,736 40,579 41,246 44,942
Business-type activitiesCharges for services: 49,672
Airport 23,624 22,242 20,269 17,611 15,745 14,537 Sewer 25,570 24,201 23,066 22,168 20,399 19,295 Solid waste 19,707 18,698 15,623 14,589 13,123 12,712 Other 2,604 2,275 2,523 2,450 3,259 2,903
Operation grants and contributions 4,389 2,401 2,177 1,939 1,508 3,339 2,999 Capital grants and contributions 27,845 24,336 27,757 21,860 31,192 33,393 29,807
103,739 94,153 91,415 80,617 85,226 86,179 82,478
162,250$ 167,026$ 137,663$ 126,353$ 125,805$ 127,425$ 127,420$
Net (Expense)/RevenueGovernmental activities (81,091)$ (51,823)$ (75,174)$ (65,538)$ (66,890)$ (60,660)$ (47,332)$ Business-type activities 19,130 15,787 17,277 10,370 17,498 18,170 21,229 Total primary government net expense (61,961)$ (36,036)$ (57,897)$ (55,168)$ (49,392)$ (42,490)$ (26,103)$
Interest and fiscal chargesTotal governmental activities expenses
Total business-type activities and program revenues
Total primary governement program revenues
Parks and recreationCultureCommunity ServicesCommunity Development
ExpensesGovernmental activities
General GovernmentPublic Safety:
City of BoiseChanges in Net AssetsLast Seven Fiscal YearsAmounts Expressed in Thousands
Statistical Section K - 2

Fiscal Year2007 2006 2005 2004 2003 2002 2001
City of BoiseChanges in Net AssetsLast Seven Fiscal YearsAmounts Expressed in Thousands
General Revenues and Other Changes in Net AssetsGovernmental activities
Taxes 88,121$ 83,484$ 76,350$ 71,660$ 71,388$ 70,152$ 61,462$ Franchise fees 6,940 6,937 5,992 5,253 5,031 5,600 Investment earnings 4,572 3,266 1,532 733 810 1,148 Special itemsMiscellaneous (1,948) (160) 390 Transfers 24 (48) 1,664 (97) (503) (2,915)
Total governmental activities 99,657 93,639 83,590 77,549 76,566 74,375 61,462
Business-type activitiesInvestment earnings 4,380 3,153 1,581 897 1,478 2,446 Gain on sale of capital assets - 3 99 Special items (589) (5,996) (16,534) 220 Transfers (24) 48 (1,664) 97 503 2,915
Total business-type activities 4,356 3,204 (573) (5,002) (14,553) 5,581 - Total primary government 104,013$ 96,843$ 83,017$ 72,547$ 62,013$ 79,956$ 61,462$
Changes in Net AssetsGovernmental activities 18,566$ 41,816$ 8,416$ 12,011$ 9,676$ 13,715$ 14,130$ Business-type activities 23,486 18,991 16,704 5,368 2,945 23,751 21,229 Total primary government 42,052$ 60,807$ 25,120$ 17,379$ 12,621$ 37,466$ 35,359$
Statistical Section K - 3

City of BoiseFund Balances, Governmental FundsLast Ten Fiscal YearsAmounts Expressed in Thousands
2007 2006 2005 2004 2003 2002 2001 2000 1999 1998General Fund
Reserved 4,723$ 4,712$ 1,800$ 1,320$ 855$ 2,510$ 4,620$ 4,588$ 5,469$ 5,154$ Unreserved 24,603 24,218 14,846 11,671 9,455 7,326 8,813 10,208 10,419 6,525
Total general fund 29,326 28,930 16,646 12,991 10,310 9,836 13,433 14,796 15,888 11,679
31,458 28,044 25,540 25,976 28,180 25,937 16,990 12,061 11,331 11,450
Special revenue fundCapital projects fund 12,641 12,255 8,727 4,408 1,268 3,110 5,576 1,581 2,716 3,604 Permanent fund
Debt service fund 1,632 1,523 1,669 1,480 1,378 1,660 4,191
45,731 41,822 35,936 31,864 30,826 30,707 26,757 13,642 14,047 15,054
75,057$ 70,752$ 52,582$ 44,855$ 41,136$ 40,543$ 40,190$ 28,438$ 29,935$ 26,733$
A FY 2002 restatement not reflected in 2001
The City implemented GASB Statement 34 in 2001. Prior years have been restated.
All Other Governmental Funds
Total all governmental funds
Total all other governmental funds
UnreservedReserved
Statistical Section K - 4

City of BoiseChanges in Fund Balances, Governmental FundsLast Ten Fiscal YearsAmounts Expressed in Thousands
2007 2006 2005 2004 2003 2002 2001 2000 1999 1998(2) (1,2)
Revenues
Property taxes 88,087$ 83,635$ 76,446$ 71,761$ 71,382$ 69,020$ 61,461$ 55,455$ 52,044$ 49,410$ Franchise fees 6,940 6,937 5,992 5,253 5,031 5,600 5,167 4,077 4,123 3,539 Licenses and permits 8,183 8,522 7,182 5,826 6,099 5,564 8,053 6,043 5,554 5,634 Intergovernmental revenues 20,107 19,101 17,161 17,186 16,028 15,497 14,362 13,038 11,998 14,042 Program income 9 418 59 25 Charges for services 22,346 21,072 18,999 16,521 14,574 12,917 14,230 11,900 13,245 11,759 Local improvement district assessments 1 Fines and forfeitures 4,019 3,501 3,005 3,079 2,946 2,899 3,272 2,830 2,837 2,821 Donations 844 589 400 1,315 329 372 427 1,848 1,876 2,832 Investment income 4,022 2,904 1,366 649 710 974 2,039 1,909 1,363 1,633 Miscellaneous revenue 4,894 947 1,565 1,375 1,051 1,939 2,558 1,269 1,076 1,401
Total Revenue 159,442 147,208 132,116 122,974 118,150 115,200 111,628 98,394 94,116 93,072
ExpendituresGeneral government 23,108 17,935 17,275 15,960 15,644 18,447 14,626 13,043 13,048 12,133 Public safety 43,485 39,822 37,271 Fire 29,931 29,646 27,364 25,388 23,693 22,852 20,722 Police 39,289 35,828 33,628 31,615 29,709 27,890 26,241 Parks and recreation 18,576 16,767 14,760 14,148 12,715 11,874 11,215 10,970 10,217 9,546 Culture 6,650 6,386 5,631 5,532 5,005 5,074 4,948 4,480 4,226 3,886 Community services 13,223 11,583 11,100 11,080 11,080 9,856 9,468 8,428 8,194 7,657 Community development 1,442 588 589 767 742 1,117 1,030 663 1,006 803 Capital outlay 20,389 7,531 10,895 9,974 15,318 21,204 9,493 11,933 8,762 15,911 Debt sevice 4,644 4,583 5,825 Principle 1,038 999 950 2,877 1,208 1,475 2,920 Interest 1,645 1,714 1,751 1,847 1,925 1,030 1,715
Total expenditures 155,291 128,977 123,943 119,188 117,039 120,819 102,378 97,646 89,858 93,032 Excess of revenues over (under) expenditures 4,151 18,231 8,173 3,786 1,111 (5,619) 9,250 748 4,258 40
Other financing sources usesCapital leases 5,228 1,185 Sale of capital assets 2,231 346 Bonds issued 30,855 3,180 Payments to refunded bond escrow agent (29,265) Transfers in 20,714 11,514 9,277 8,570 5,483 9,930 14,041 9,265 6,673 5,907 Transfers out (20,696) (11,575) (9,723) (8,637) (6,001) (13,007) (16,724) (11,511) (8,914) (7,177) Total other financing sources (uses) 18 (61) (446) (67) (518) 5,972 (2,337) (2,246) (1,056) 1,910
Net change in fund balance 4,169$ 18,170$ 7,727$ 3,719$ 593$ 353$ 6,913$ (1,498)$ 3,202$ 1,950$
Debt service as a percentage of noncapital expenditures 1.73% 2.23% 2.30% 4.33% 3.04% 2.49% 4.89% N/A N/A N/A
1 -The City implemented GASB Statement 34 in 2001. Prior years have been restated.2 -Property taxes increased considerably in 2001 and 2002 as a result of a special election creating a two year $10 million dollar levy to purchase land in the foothills.
Statistical Section K - 5

City of BoiseAssessed Value and Actual Value of Taxable Property,Last Eight Fiscal YearsAmounts Expressed in Thousands
Fiscal YearEnded Residential Commercial Farm Personal Manufacturing Operating Other
9/30 Property Property Property Property Property Property Property2000 6,869,004 4,855,400 4,174 534,734 61,610 260,872 282,832 2001 7,433,343 5,256,200 4,063 608,185 61,392 272,268 29,382 2002 8,030,509 5,528,723 8,854 661,998 60,981 298,135 23,128 2003 8,646,557 5,096,432 9,088 813,673 61,042 282,356 26,638 2004 9,378,241 4,999,759 10,549 650,849 55,208 251,675 24,928 2005 10,632,595 5,092,541 12,768 691,260 53,312 262,437 26,761 2006 12,863,844 5,753,673 18,957 643,990 664,797 252,489 28,398 2007 15,432,901 6,341,805 15,593 692,252 248,836 274,627 35,140
Source: Ada County Auditor's OfficeAll years that data was available
Statistical Section K - 6
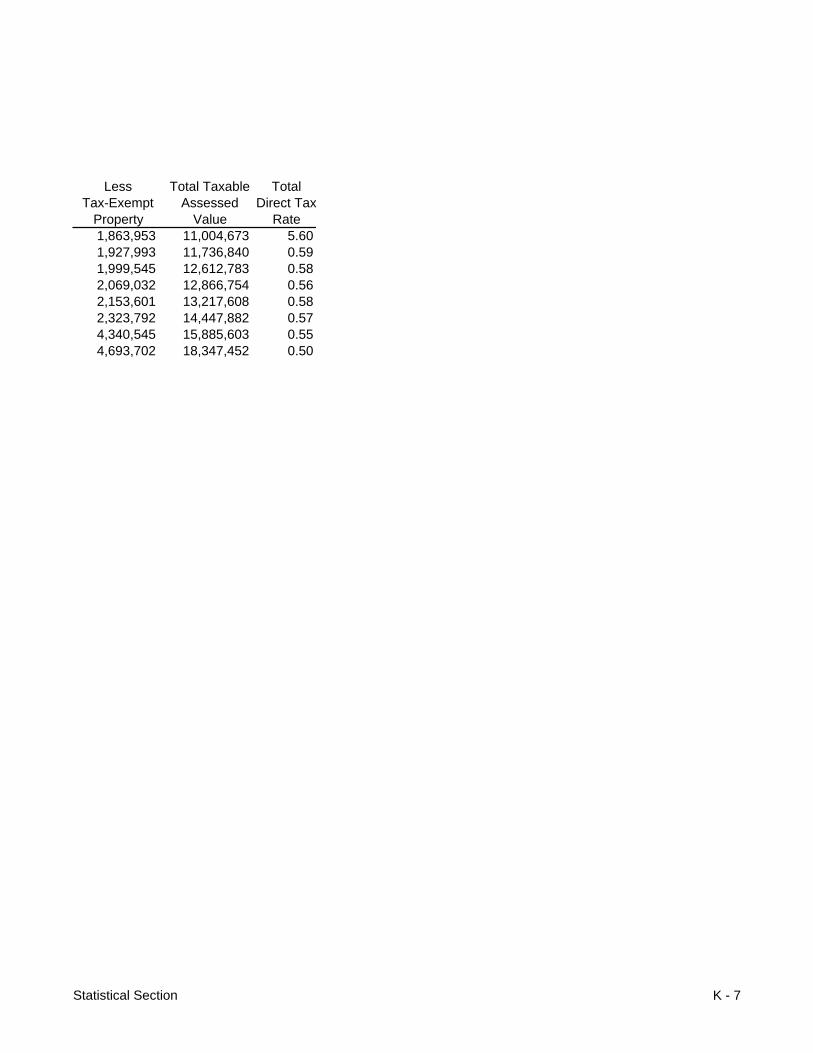
Less Total Taxable TotalTax-Exempt Assessed Direct Tax
Property Value Rate1,863,953 11,004,673 5.601,927,993 11,736,840 0.591,999,545 12,612,783 0.582,069,032 12,866,754 0.562,153,601 13,217,608 0.582,323,792 14,447,882 0.574,340,545 15,885,603 0.554,693,702 18,347,452 0.50
Statistical Section K - 7

City of BoiseDirect and Overlapping Property Tax RatesLast Ten Fiscal Years(rate per $1,000 of assessed value)
City Direct Rates Overlapping Rates 1
Fiscal Year Basic Rate Total Direct
Ada County
Ada County
Highway District
Boise Independent
School District
Meridian School District
Whitney Fire
Flood Control
Emergency Medical
1998 5.62$ 5.62$ 3.08$ 1.06$ 8.40$ 6.75$ 1.73$ 0.11$ 0.13$ 1999 5.60 5.60 3.05 1.05 8.24 6.74 1.73 0.11 0.13 2000 5.70 5.70 2.98 1.06 8.36 6.74 1.89 0.11 0.12 2001 5.87 5.87 2.77 1.01 7.81 6.57 1.75 0.11 0.12 2002 5.81 5.81 2.74 1.00 8.14 6.54 1.75 0.11 0.12 2003 5.56 5.56 2.80 1.01 8.44 6.31 1.83 0.10 0.12 2004 5.79 5.79 2.86 1.03 7.94 6.69 1.50 0.10 0.12 2005 5.73 5.73 2.83 1.01 7.92 6.55 1.94 0.10 0.12 2006 5.49 5.49 2.56 1.01 4.73 3.89 1.58 0.09 0.11 2007 5.03 5.03 2.28 0.87 4.43 3.66 1.69 0.08 0.10
Source: Certification of Ada County Tax Levies provided by Ada County - Form L1.
Note: 1 Overlapping rates are those of local and county governments that apply to property owners within the City of Boise. Not all overlapping rates apply to all Boise Property owners; for example, although the county property tax rate apply to all the city property owners, the Joplin Cemetery rate applies only to the city property owners whose property is located within the district's geographical boundaries.
Statistical Section K - 8

Fiscal Year1998199920002001200220032004200520062007
City of BoiseDirect and Overlapping Property Tax RatesLast Ten Fiscal Years(rate per $1,000 of assessed value)
Overlapping Rates 1
Dry Creek Cemetery
Joplin Cemetery
Meridian Cemetery
Water & Sewer NW Sewer
West Sewer
Mosquito Abatement
West Ada Recreation
0.01$ 0.01$ 0.11$ -$ 0.22$ 0.37$ 0.04$ 0.09$ 0.01 0.01 0.07 - 0.19 0.33 0.03 0.08 0.01 0.01 0.06 - 0.19 0.33 0.03 0.08 0.01 0.01 0.06 - 0.17 0.30 0.02 0.08 0.01 0.01 0.06 - 0.16 0.57 0.02 0.08 0.01 0.01 0.08 - 0.16 - 0.03 0.08 0.01 0.01 0.07 - 0.15 - 0.03 0.08 0.01 0.01 0.06 - 0.14 - 0.03 0.07 0.01 0.01 0.05 - 0.14 - 0.03 0.07 0.01 0.01 0.04 - 0.12 - 0.03 0.06
Statistical Section K - 9

City of BoisePrincipal Property Tax PayersCurrent Year and Nine Years AgoAmount Expressed in Thousands
2007 1998
Market Valuation Rank
Percentage of Total Market
ValuationMarket
Valuation Rank
Percentage of Total Market
Valuation
Micron Technology 703,633$ 1 3.84% 1,478,612$ 1 16.04%Hewlett Packard 183,997 2 1.00% 290,926 2 3.16%Boise Mall LLC 136,157 3 0.74%Qwest 91,258 4 0.50% 89,589 4 0.97%Idaho Power 85,192 5 0.46% 72,259 5 0.78%Albertsons 64,541 6 0.35%United Water 59,339 7 0.32% 52,363 7 0.57%New Albertson's Inc 55,732 8 0.30%Sundance Investments 55,465 9 0.30%MP Mask Technology Center 52,504 10 0.29%MK Plaza Trust (WGI) 36,862 9 0.40%S-16 Limited Partnership 57,946 6 0.63%St. Lukes Regional Medical Center 146,051 3 1.58%Price Development 46,621 8 0.51%Hawkins-Smith 32,560 10 0.35%
1,487,818$ 8.10% 2,303,789$ 24.99%
Total Market Valuation 18,347,452 9,218,574
Source: Idaho Department of Commerce
Note: In 2003, due to a court decision, the market valuation for Micron Technology was reduced by $393,734.
Statistical Section K - 10

City of BoiseProperty Tax Levies and Collections,Last Ten Fiscal YearsAmount Expressed in Thousands
Fiscal Year Ended
September 30Taxes Levied for the Fiscal Year Amount
Percentage of Levy
Collections in Subsequent
Years AmountPercentage
of Levy1998 49,017$ 48,763$ 99.5% 606 49,369$ 100.7%1999 51,830 51,386 99.1% 602 51,988 100.3%2000 55,251 54,793 99.2% 723 55,516 100.5%
2001 (1) 60,813 60,770 99.9% 781 61,551 101.2% 2002 (1) 69,167 68,186 98.6% 751 68,937 99.7%
2003 73,162 70,373 96.2% 713 71,086 97.2% 2004 (2) 72,458 70,828 97.8% 675 71,503 98.7%
2005 76,583 75,921 99.1% 731 76,652 100.1%2006 82,905 82,516 99.5% 445 82,961 100.1%2007 87,442 87,269 99.8% 87,269 99.8%
Sources: Ada County Tax Auditor's Office and Boise City Treasury and Accounting Departments
(1) Includes Foothills Levy
Collected within the Fiscal Year of the Levy Total Collection to Date
(2) Ada County miscalculated the rate for the tax levy, therefore a special remittance was made to correct this error. This amount was added to the levy and to the amount collected for the year. The amount of the correction was $767,146.
Statistical Section K - 11

City of BoiseRatio of Outstanding Debt By TypeLast Ten Fiscal YearsAmounts Expressed in Thousands
Governmental Activities
Fiscal YearRevenue
BondsCapital Leases
Bonds and Warrants
Municipal Lighting Installment Loan Total Debt
Debt per Capita
Debt to Personal Income
1998 38,180 2,783 43 41,006 0.244 0.00811999 35,815 3,605 39,420 0.231 0.00742000 33,340 3,190 36,530 0.197 0.00602001 30,740 2,745 33,485 0.174 0.00522002 33,090 5,738 38,828 0.201 0.00592003 32,315 5,305 37,620 0.192 0.00542004 29,830 4,913 34,743 0.174 0.00462005 29,285 4,508 33,793 0.162 0.00412006 28,710 4,084 32,794 0.155 0.00382007 28,115 3,641 31,756 0.150 0.0036
Ratio of Net General Bonded Debt Outstanding
The City has had no general bonded debt from fiscal years 1998 to 2007.
Statistical Section K - 12
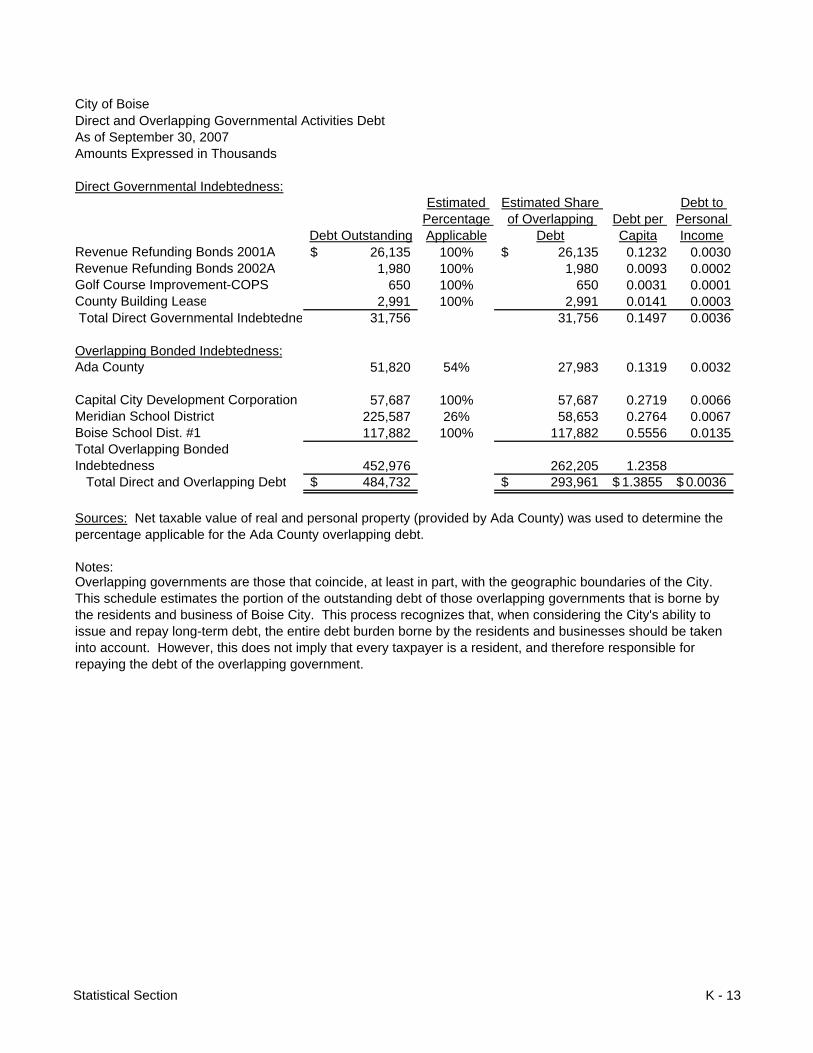
City of BoiseDirect and Overlapping Governmental Activities DebtAs of September 30, 2007Amounts Expressed in Thousands
Direct Governmental Indebtedness:
Debt Outstanding
Estimated Percentage Applicable
Estimated Share of Overlapping
DebtDebt per Capita
Debt to Personal Income
Revenue Refunding Bonds 2001A 26,135$ 100% 26,135$ 0.1232 0.0030Revenue Refunding Bonds 2002A 1,980 100% 1,980 0.0093 0.0002Golf Course Improvement-COPS 650 100% 650 0.0031 0.0001County Building Lease 2,991 100% 2,991 0.0141 0.0003 Total Direct Governmental Indebtedne 31,756 31,756 0.1497 0.0036
Overlapping Bonded Indebtedness:Ada County 51,820 54% 27,983 0.1319 0.0032
Capital City Development Corporation 57,687 100% 57,687 0.2719 0.0066Meridian School District 225,587 26% 58,653 0.2764 0.0067Boise School Dist. #1 117,882 100% 117,882 0.5556 0.0135Total Overlapping Bonded Indebtedness 452,976 262,205 1.2358 Total Direct and Overlapping Debt 484,732$ 293,961$ 1.3855$ 0.0036$
Notes:
Sources: Net taxable value of real and personal property (provided by Ada County) was used to determine the percentage applicable for the Ada County overlapping debt.
Overlapping governments are those that coincide, at least in part, with the geographic boundaries of the City. This schedule estimates the portion of the outstanding debt of those overlapping governments that is borne by the residents and business of Boise City. This process recognizes that, when considering the City's ability to issue and repay long-term debt, the entire debt burden borne by the residents and businesses should be taken into account. However, this does not imply that every taxpayer is a resident, and therefore responsible for repaying the debt of the overlapping government.
Statistical Section K - 13
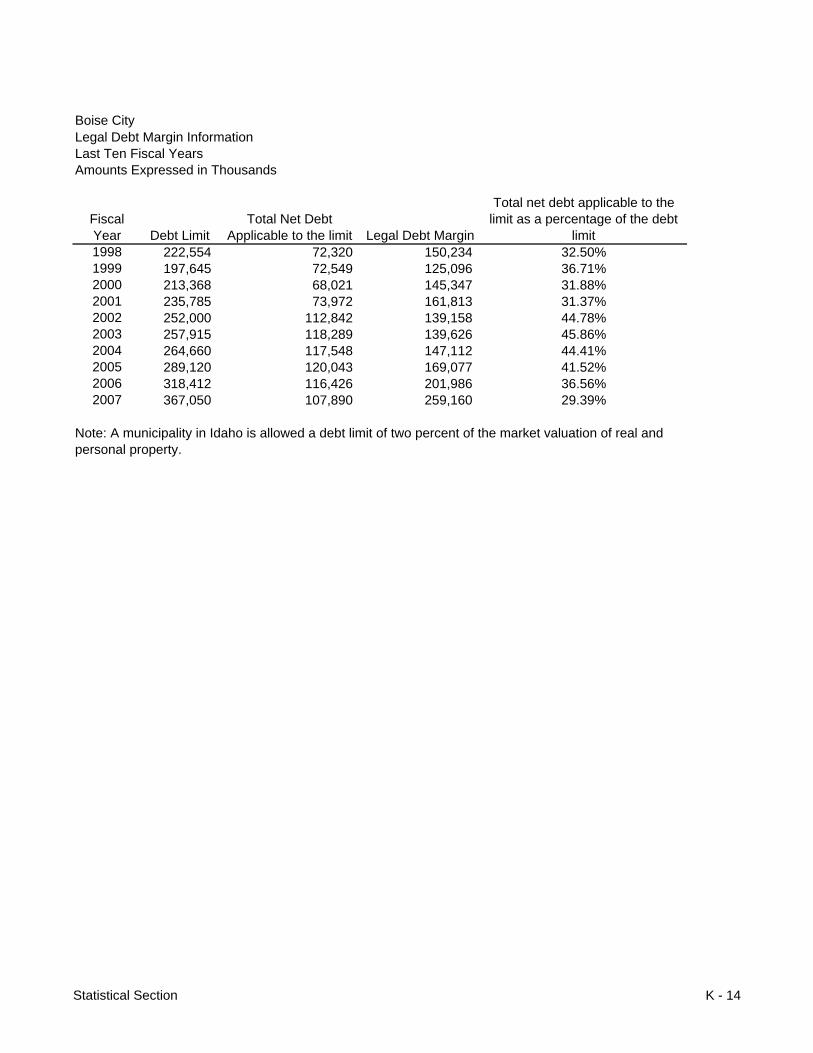
Boise CityLegal Debt Margin InformationLast Ten Fiscal YearsAmounts Expressed in Thousands
Fiscal Year Debt Limit
Total Net Debt Applicable to the limit Legal Debt Margin
Total net debt applicable to the limit as a percentage of the debt
limit1998 222,554 72,320 150,234 32.50%1999 197,645 72,549 125,096 36.71%2000 213,368 68,021 145,347 31.88%2001 235,785 73,972 161,813 31.37%2002 252,000 112,842 139,158 44.78%2003 257,915 118,289 139,626 45.86%2004 264,660 117,548 147,112 44.41%2005 289,120 120,043 169,077 41.52%2006 318,412 116,426 201,986 36.56%2007 367,050 107,890 259,160 29.39%
Note: A municipality in Idaho is allowed a debt limit of two percent of the market valuation of real and personal property.
Statistical Section K - 14

City of BoisePledged Revenue CoverageLast Ten Fiscal YearsAmounts Expressed in Thousands
Golf Course Certificates of Participation
Fiscal YearPledged Revenue
Operating Expenses Net Available Revenue Principal Interest Coverage
1999 1,255 1,255 18 N/A2000 1,336 1,336 50 53 12.97 2001 1,414 1,414 60 51 12.74 2002 1,463 1,463 65 49 12.83 2003 1,461 1,461 65 46 13.16 2004 1,431 1,431 70 43 12.66 2005 1,456 1,456 70 40 13.24 2006 1,441 1,441 75 37 12.84 2007 1,550 1,550 80 34 13.63
Revenue Refunding Bonds, Series 2001A & 2002A
Fiscal YearOperating Revenue
15% of General Fund
Revenue
Debt Service for All Outstanding General Fund Obligations (1)
Available for Future Debt
Service2002 104,165 15,625 2,616 13,009 2003 108,041 16,206 2,593 13,613 2004 117,149 17,572 2,185 15,387 2005 126,468 18,970 2,179 16,791 2006 140,957 21,144 2,187 18,957 2007 152,429 22,864 2,183 20,681
Airport Revenue Certificates of Participation--Air Terminal Project
Fiscal YearPledged
Revenue (1)Operating
Expenses (1) Net Available Revenue Principal Interest Coverage2001 20,616 9,802 10,814 785 2,272 3.54 2002 21,729 11,628 10,101 775 2,824 2.81 2003 22,502 11,761 10,741 810 2,787 2.99 2004 24,066 13,097 10,969 850 2,749 3.05 2005 27,563 13,629 13,934 890 2,708 3.87 2006 30,252 14,659 15,593 935 2,665 4.33 2007 32,260 18,858 13,402 980 2,619 3.72
Debt Service
(1) Includes Operating Revenue, Interest Income, Operating Grants, and Passenger Facilities Charges. Excludes Interest Expense, Depreciation, Gain or Loss on Property Sale/Exchange/Disposal.
(1) Parity debt is allowed so long as the maximum annual principal and interest requirements on all outstanding obligations constituting a lien upon General Fund Revenues, and on the obligations proposed to be issued (excluding reserves) does not exceed 15% of the neral Fund Revenues as set forth on the City's most recent audited financial statement.
Debt Service
Statistical Section K - 15

Airport Revenue Refunding Bonds, Series 2004-1--Parking Facilities Project
Fiscal YearPledged
Revenue (1)Operating
Expenses (1)Senior/Parity Debt
Pledges (2) Net Available
Revenue Principal Interest Coverage2004 18,979 13,097 1,319 4,563 1,135 28 3.92 2005 21,899 13,629 1,085 7,185 1,075 277 5.32 2006 24,361 14,659 1,086 8,616 1,110 244 6.36 2007 26,063 18,858 1,085 6,120 1,140 211 4.53
(2) Does not include portion of debt service covered by Passenger Facility Charges.
Sewer Wastewater Facility Refunding Bonds
Fiscal YearPledged
Revenue (1)Operating
Expenses (1)Senior/Parity Debt
Pledges (2) Net Available
Revenue Principal Interest Coverage1999 17,024 2,123 49 14,852 394 N/A2000 20,290 14,003 49 6,238 690 935 3.84 2001 22,692 15,118 49 7,525 775 912 4.46 2002 20,912 16,488 49 4,375 800 884 2.60 2003 21,682 16,703 49 4,930 830 855 2.92 2004 23,857 17,085 49 6,723 860 822 4.00 2005 25,354 17,665 49 7,640 895 787 4.54 2006 27,693 18,263 49 9,381 930 752 5.58 2007 30,324 17,951 49 12,324 965 715 7.34
(1) Includes Interest Income; Excludes Interest Expense, Depreciation.(2) Annual paymet on loan from State Department of Environmental Quality.
Debt Service
Debt Service
(1) Includes Operating Revenue, Interest Income, Operating Grants, Customer Facility Charges; Excludes Interest Expense, Gain on Property Sale/Exchange, Depreciation and income, expenditures and debt service on senior and parity debt related to Passenger Facilities Charges.
Statistical Section K - 16

City of BoiseDemographic and Economic StatisticsLast Ten Calendar Years
Year Population
Personal Income
(thousands of dollars)
Per Capita Personal Income
Median Age1
Education Level in Years of
Schooling1
K-12 School
EnrollmentUnemployment
Rate
1998 168,258 5,086,439 30,230 32.9 13.7 26,952 5.0%1999 170,327 5,351,674 31,420 33.0 13.8 26,646 4.8%2000 185,787 6,051,268 32,571 33.1 13.8 26,473 2.7%2001 192,290 6,487,672 33,739 33.5 13.8 26,368 4.9%2002 193,085 6,578,792 34,072 33.9 13.8 25,883 5.6%2003 195,931 6,921,067 35,324 34.3 13.8 25,634 4.5%2004 200,062 7,481,118 37,394 34.5 13.8 25,572 4.6%2005 208,219 8,244,015 39,593 34.7 13.8 25,680 3.2%2006 204,027 8,302,369 40,693 35.1 13.8 25,287 2.9%2007 213,503 8,805,344 41,242 35.1 13.8 25,000 2.0%
1 Information provided by Idaho Department of Commerce and Labor using Census informationfrom 1990, 2000 and estimates for 2004 and 2005. The intervening years (96-99 and 01-03)are estimates based on the total change between the years identified by the Census Bureau.The actual estimates made in these years is not available any longer. From 04 forward the amounts will be based on the actual Census Bureau issued estimates.
Sources Idaho Department of Commerce and LaborUS Census BureauUS Bureau of Economic AnalysisBoise Independent School DistrictCommunity Planning Association of Southwest Idaho
Statistical Section K - 17
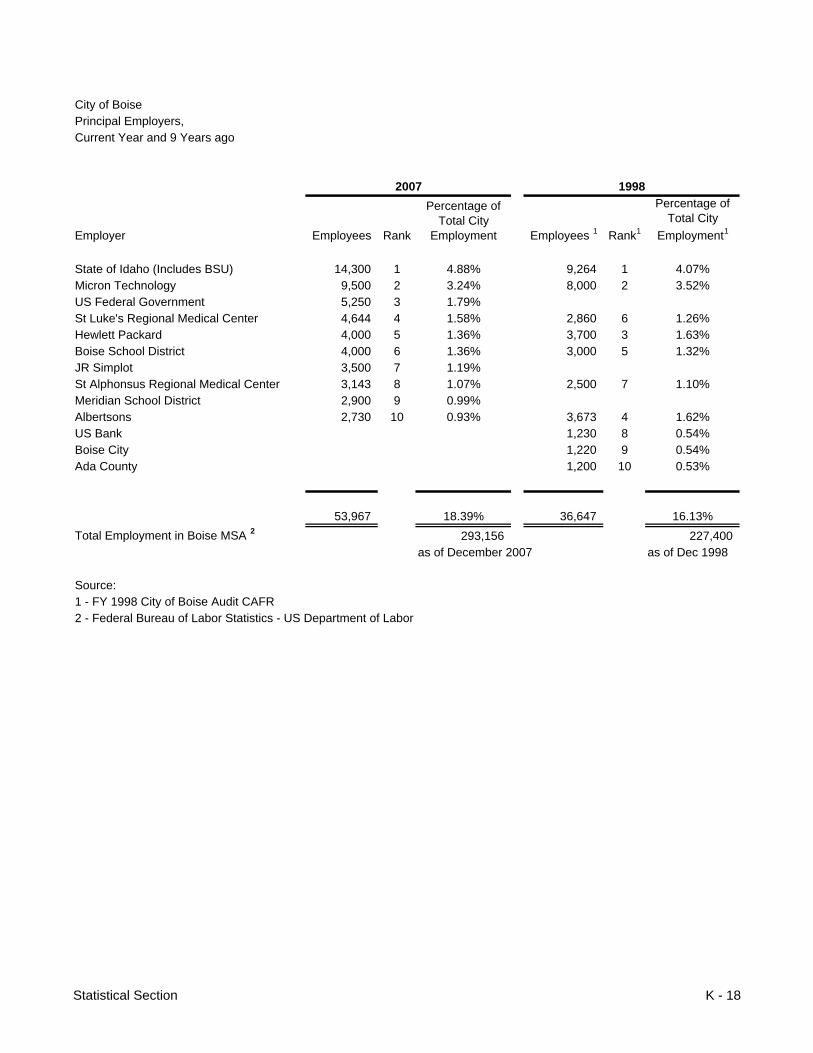
City of BoisePrincipal Employers,Current Year and 9 Years ago
2007 1998
Employer Employees Rank
Percentage of Total City
Employment Employees 1 Rank1
Percentage of Total City
Employment1
State of Idaho (Includes BSU) 14,300 1 4.88% 9,264 1 4.07%Micron Technology 9,500 2 3.24% 8,000 2 3.52%US Federal Government 5,250 3 1.79%St Luke's Regional Medical Center 4,644 4 1.58% 2,860 6 1.26%Hewlett Packard 4,000 5 1.36% 3,700 3 1.63%Boise School District 4,000 6 1.36% 3,000 5 1.32%JR Simplot 3,500 7 1.19%St Alphonsus Regional Medical Center 3,143 8 1.07% 2,500 7 1.10%Meridian School District 2,900 9 0.99%Albertsons 2,730 10 0.93% 3,673 4 1.62%US Bank 1,230 8 0.54%Boise City 1,220 9 0.54%Ada County 1,200 10 0.53%
53,967 18.39% 36,647 16.13%Total Employment in Boise MSA 2 293,156 227,400
as of December 2007 as of Dec 1998
Source:1 - FY 1998 City of Boise Audit CAFR2 - Federal Bureau of Labor Statistics - US Department of Labor
Statistical Section K - 18
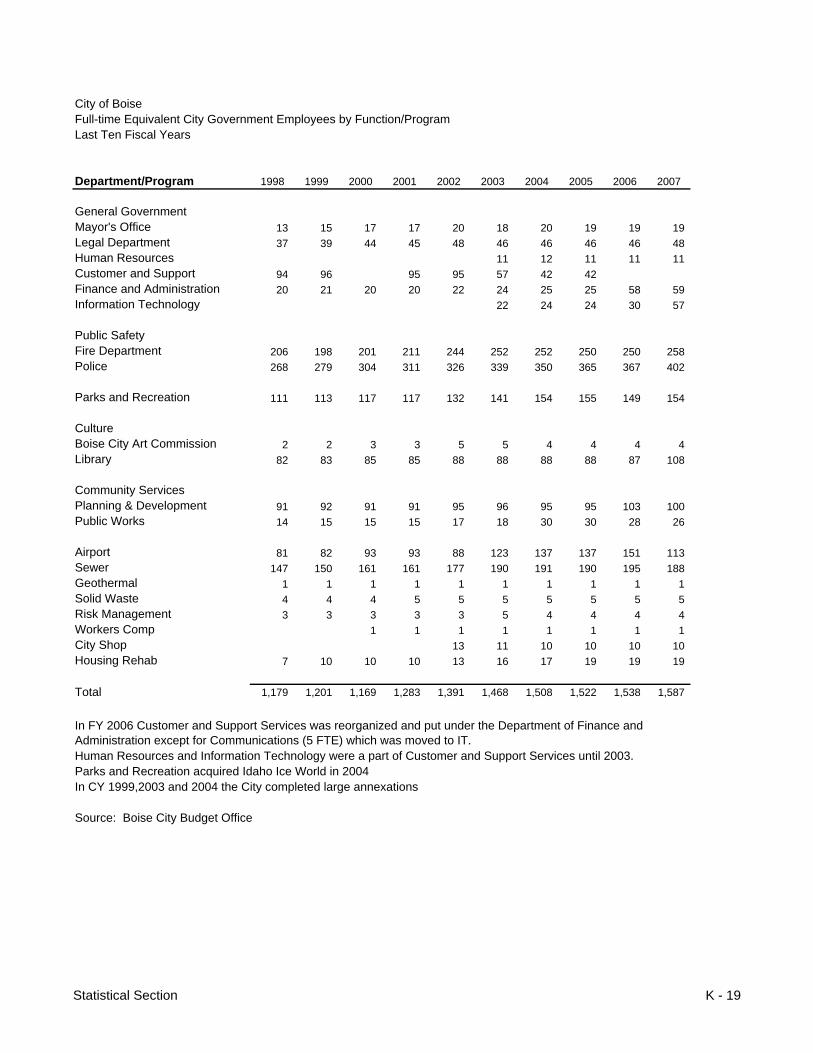
City of BoiseFull-time Equivalent City Government Employees by Function/ProgramLast Ten Fiscal Years
Department/Program 1998 1999 2000 2001 2002 2003 2004 2005 2006 2007
General GovernmentMayor's Office 13 15 17 17 20 18 20 19 19 19 Legal Department 37 39 44 45 48 46 46 46 46 48 Human Resources 11 12 11 11 11 Customer and Support 94 96 95 95 57 42 42 Finance and Administration 20 21 20 20 22 24 25 25 58 59 Information Technology 22 24 24 30 57
Public SafetyFire Department 206 198 201 211 244 252 252 250 250 258 Police 268 279 304 311 326 339 350 365 367 402
Parks and Recreation 111 113 117 117 132 141 154 155 149 154
CultureBoise City Art Commission 2 2 3 3 5 5 4 4 4 4 Library 82 83 85 85 88 88 88 88 87 108
Community ServicesPlanning & Development 91 92 91 91 95 96 95 95 103 100 Public Works 14 15 15 15 17 18 30 30 28 26
Airport 81 82 93 93 88 123 137 137 151 113 Sewer 147 150 161 161 177 190 191 190 195 188 Geothermal 1 1 1 1 1 1 1 1 1 1 Solid Waste 4 4 4 5 5 5 5 5 5 5 Risk Management 3 3 3 3 3 5 4 4 4 4 Workers Comp 1 1 1 1 1 1 1 1 City Shop 13 11 10 10 10 10 Housing Rehab 7 10 10 10 13 16 17 19 19 19
Total 1,179 1,201 1,169 1,283 1,391 1,468 1,508 1,522 1,538 1,587
Source: Boise City Budget Office
In FY 2006 Customer and Support Services was reorganized and put under the Department of Finance and Administration except for Communications (5 FTE) which was moved to IT.Human Resources and Information Technology were a part of Customer and Support Services until 2003.Parks and Recreation acquired Idaho Ice World in 2004In CY 1999,2003 and 2004 the City completed large annexations
Statistical Section K - 19

City of BoiseOperating Indicators by Function/ProgramLast Four Fiscal Years
2004 2005 2006 2007General Government Mayor and City Council
Number of Neighborhood Reinvestment project grants awarded 16 12 19 29 Number of active Neighborhood Reinvestment project grants 35 35 41 58 Ordinances and resolutions adopted 400 525 568 681 General Government Administration Number of children in licensed daycare facilities (City Clerk) 19,988 32,900 19,000 19,500 Number of square feet of facilities maintained (Facilities Maintenance) 273,200 263,059 253,477 405,671 Legal Court cases processed (Boise only) 56,225 60,620 64,059 58,211 Human Resources Days from requisition to applicant referral (HR Control) 25 27 22 n/a Information and Technology Number of supported PCs and printers n/a n/a 1,150 1,843 Number of help desk calls 4,750 2,143 3,537 6,483 Average number of mapping requests per month (internet) n/a 19,132 30,300 31,400 Financial Services Number of purchase orders issued 1,800 1,650 2,060 1,785 Number of dollars recovered by Collections $ 1,555,143 $ 1,226,415.00 $ 1,962,925 $ 2,140,976 Ratio of interest earned vs. interest expense 0.21 0.49 1.07 1.54 Ratio of Portfolio Yield vs. Fed Funds 1.083 0.925 0.957 1.087 Number of loans internally serviced (sewer & housing) 822 763 808 726
Public Safety Fire Average response time 4.08 4.11 4.14 4.45 Number of fires investigated 101 110 100 127 Number of sprinkler plans reviewed 1,500 912 Police Number of police reports taken 42,151 41,403 42,156 46,634 Number of crime scenes processed 3,221 3,148 967 359 Number of citations for hazardous moving violations 26,918 21,118 22,061 23,373 Number of DUI arrests 1,701 1,865 2,240 2,031
Parks and Recreation Parks & Rec Miles of trails maintained 89 95 97 125 Number of adaptive programs offered 190 143 200 216 Number of acres maintained 14,992 15,776 14,800 15,200 Zoo attendance 229,893 259,223 270,850 295,543 Idaho Ice World attendance 398,710 203,514 232,436 550,442 Number of rounds at Warm Springs Golf course 29,920 46,590 47,959 48,745 Average youth scholarship amount $ 40.86 $ 37.46 $ 41.73 $ 34.02 Number of youth scholarships awarded 224 277 606 771 Number of youth served 649,328 559,865 619,201 650,447
Statistical Section K - 20

City of BoiseOperating Indicators by Function/ProgramLast Four Fiscal Years
2004 2005 2006 2007Culture Arts Number of projects completed 9 10 2 8 Number of participants in art programs 17,610 25,448 58,333 60,000 Number of citizens who received public art walking tours 1,679 Library Annual circulation 1,474,816 1,510,530 1,448,423 1,571,639 Reference questions per capita 1.00 0.90 0.23 0.65 Number of special programs 1,499 1,154 1,282
Community Service Planning and Development Services Total construction permit value (millions) $ 369 $ 465 $ 654 $ 657 Total number of permits 14,100 16,593 16,623 16,292 Percent of commercial plans reviewed <30 days 68% 63% 58% 50% Number of affordable housing units available 273 273 273 273 Parking Control Parking tickets issued 59,867 72,506 63,502 63,318 Cemetery Number of burials 172 174 159 157
Airport Airline cost per enplaned passenger $ 3.32 $ 3.35 $ 3.28 $ 3.34 Number of enplanements 1,405,423 1,545,268 1,623,438 1,668,834
Public Works Total number of street lights 9,231 9,757 10,011 10,193 Sewer Dollars per foot of constructed 8" sewer pipe $ 70.54 $ 64.21 $ 92.84 $ 100.48 Number of sewer backups per 100 miles of pipe 2.80 3.35 3.34 3.73 Miles of sewer pipe 611 638 659 675 Gallons of sewage treated per Capita 26 27 28 27 Tons of solid waste per Capita 6,740 7,363 7,500 7,643 Percentage of solid waste recycled 8%
Statistical Section K - 21

City of BoiseCapital Asset Statistics by Function/ProgramLast Ten Fiscal Years
Function/Program 2007 2006 2005 2004 2003 2002 2001 2000 1999 1998Primary Government Governmental activities: Fire Fire trucks 4 4 4 4 4 3 3 3 3 2 Fire engines 16 21 21 21 21 15 15 15 15 15 Rescue/utility vehicles 13 12 10 11 11 9 9 6 6 6 Fire facilities 16 15 14 14 14 14 14 14 14 14 Fire hydrants 7,183 6,913 6,791 6,674 6,583 5,585 5,437 5,306 4,453 4,157
Police Vehicles 242 251 232 214 213 212 209 186 165 166 Motorcycles 12 12 12 13 13 7 9 9 12 9 Police station (non city owned) 1 1 1 1 1 1 1 1 1 1 Police mobile substation 1 1 1 1 1 1 Parks and recreation Park sites 111 110 108 107 105 104 103 102 Picnic areas 62 62 58 58 58 57 56 54 Recreation/community centers 4 4 4 3 3 3 3 3 Ice skating facilities 1 1 1 1 Playgrounds 72 71 71 71 69 66 63 60 Basketball courts 26 26 26 26 Cultural/historical sites 4 4 4 4 4 4 4 4 Golf courses 1 1 1 1 1 1 1 1 Tennis courts 77 77 76 76 76 76 76 76 Youth baseball fields 35 35 35 35 34 33 32 31 Soccer fields 44 44 44 44 44 44 44 44 Skate parks 3 3 3 3 2 2 2 2 Pools 7 7 7 7 7 7 7 7 7 7 Zoo 1 1 1 1 1 1 1 1 1 1 Bike, walking or hiking trails 125 108 108 106 103 100 98 97 Foothills-special levy (acres) 1,199 1,199 1,199 1,079 820 42
Governmental activities: Culture Public art investments 116 106 60 59 51 43 35 28 27 23 Library Locations 2 2 2 2 2 2 2 2 2 2
Items in library collection (thousands) 356 361 376 361 355 358 362 352
Community Services Cemeteries 3 3 3 3 3 3 3 3 3 3 Streetlights 7,425 7,111 6,918 6,463 6,314 4,724 5,461 5,174 4,609 4,228
Statistical Section K - 22
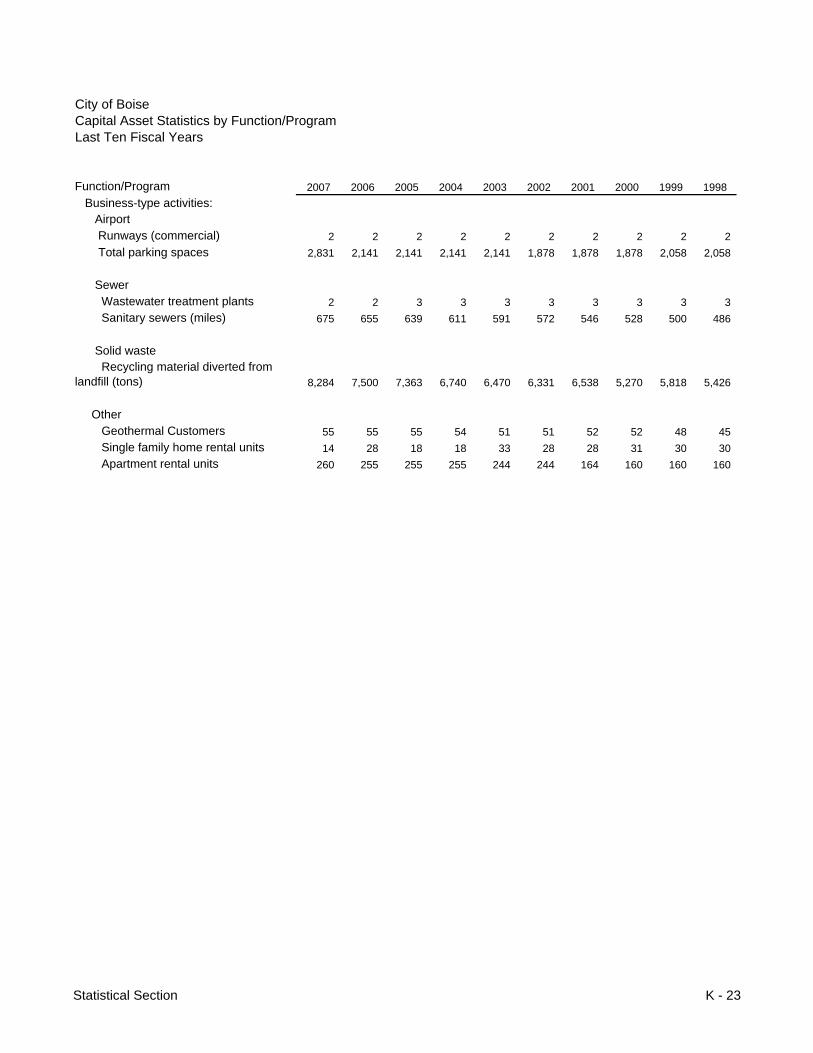
City of BoiseCapital Asset Statistics by Function/ProgramLast Ten Fiscal Years
Function/Program 2007 2006 2005 2004 2003 2002 2001 2000 1999 1998 Business-type activities: Airport Runways (commercial) 2 2 2 2 2 2 2 2 2 2 Total parking spaces 2,831 2,141 2,141 2,141 2,141 1,878 1,878 1,878 2,058 2,058
Sewer Wastewater treatment plants 2 2 3 3 3 3 3 3 3 3 Sanitary sewers (miles) 675 655 639 611 591 572 546 528 500 486
Solid waste Recycling material diverted from landfill (tons) 8,284 7,500 7,363 6,740 6,470 6,331 6,538 5,270 5,818 5,426
Other Geothermal Customers 55 55 55 54 51 51 52 52 48 45 Single family home rental units 14 28 18 18 33 28 28 31 30 30 Apartment rental units 260 255 255 255 244 244 164 160 160 160
Statistical Section K - 23

CITY OF BOISESCHEDULE OF CHANGES IN LIABILITY ESTIMATESFOR THE CITY OF BOISE SELF INSURANCE PLAN
The following schedule shows the development of estimated aggregate liabilityfor known claims since the inception of the City's self-insurance program. Liabilities are periodically reestimated based on changes in factors used tomake the original estimates. Estimates do not include claims that are incurred butnot reported (IBNR).
1998 (1) 1999 (1) 2000 (1) 2001 (1) 2002 (1) 2003 (2) 2004 (2) 2005 (2) 2006 (2) 2007 (2)
LIABILITY FOR KNOWN CLAIMS REESTMATED AS OF:
END OF YEAR 149 116 146 98 95 144 32 115 32 106 ONE YEAR LATER 174 222 520 137 121 282 39 187 112 TWO YEARS LATER 124 375 508 189 140 257 110 215 THREE YEARS LATER 172 363 496 192 176 287 48 FOUR YEARS LATER 342 375 488 187 265 287 FIVE YEARS LATER 342 392 487 184 287 SIX YEARS LATER 342 392 487 320 SEVEN YEARS LATER 342 392 487 EIGHT YEARS LATER 342 392 NINE YEARS LATER 342
(1) Insurance policies purchased by the City effective October 1, 1992 required the City to carry a self-insured retention of $250,000 per incident with no maximum annual aggregate loss provisions.
(2) Insurance policies purchased by the City effective October 1, 2003 required the City to carry a self-insured retention of $400,000 per incident with no maximum annual aggregate loss provisions.
Statistical Section K - 24

CITY OF BOISESCHEDULE OF CLAIMS PAID FROM THECITY OF BOISE INSURANCE PLAN
The following schedule shows the development of claims losses since theinception of the City's self-insurance program. Paid amounts are based onactual settlements. Liability amount shown is the original estimate for eachpolicy year and prior to any reestimates.
1998 (1) 1999 (1) 2000 (1) 2001 (1) 2002 (1) 2003 (2) 2004 (2) 2005 (2) 2006 (2) 2007 (2)
LIABILITY FOR UNPAID CLAIMS AND CLAIM ADJUSTMENT EXPENSES: 149 116 146 98 95 144 32 115 32 106
PAID (CUMULATIVE) AS OF:END OF YEAR 53 43 38 28 41 89 21 36 25 101 ONE YEAR LATER 86 168 179 97 60 234 27 99 62 TWO YEARS LATER 79 260 478 179 80 241 38 195 THREE YEARS LATER 135 345 474 182 118 284 38 FOUR YEARS LATER 342 374 474 183 245 284 FIVE YEARS LATER 342 392 487 184 272 SIX YEARS LATER 342 392 487 184 SEVEN YEARS LATER 342 392 487 EIGHT YEARS LATER 342 392 NINE YEARS LATER 342
(1) Insurance policies purchased by the City effective October 1, 1992 required the City to carry a self-insured retention of $250,000 per incident with no maximum annual aggregate loss provisions.
(2) Insurance policies purchased by the City effective October 1, 2003 required the City to carry a self-insured retention of $400,000 per incident with no maximum annual aggregate loss provisions.
Statistical Section K - 25

CITY OF BOISESELF-INSURED RETENTIONLOSSES VS RESERVES
Fiscal Year
Estimated Ultimate Losses (1) 99-00(1,2,3) 00-01(1,2) 01-02(1) 02-03(1,2,3) 03-04(1) 04-05(1) 05-06(1) 06-07(1)
1997-98 (2) 449 (7) 56 207 - - - - - 1998-99 (2) 462 125 92 85 29 18 - - - 1999-2000 (2) 427 38 141 299 (4) - 13 - - 2000-2001 (2) 426 28 69 82 3 1 1 - 2001-2002 (2) 440 41 19 20 38 127 27 2002-2003 (2) 592 89 145 7 43 - 2003-2004 (2) 583 21 6 11 - 2004-2005 (2) 617 36 63 96 2005-2006 (2) 473 25 37 2006-2007 (2) 299 101
Losses Paid/Projected to be Paid by Year (incl. Allocated Loss Adjustment Expenses) 469 566 706 215 207 101 270 261 Cumulative Losses 4,113 4,679 5,385 5,600 5,807 5,908 6,178 6,439 Loss Funding 427 426 440 592 583 617 473 299 Cumulative Loss Funding 5,084 5,510 5,950 6,542 7,125 7,742 8,215 8,514 Estimated Cash Reserves (42) (140) (266) 377 376 516 203 38
Unallocated Loss Adjustment Expense (less depreciation & dividend expense) (965) (949) (1,055) (1,408) (1,386) (1,790) (1,325) (1,514) Net Claims Expense (1,007) (1,089) (1,321) (1,031) (1,010) (1,274) (1,122) (1,476) Claims incurred but not reported 1,132 1,489 1,999 1,800 1,473 1,856 1,316 (843) Other charges for services 949 1,412 1,398 1,077 1,253 852 1,432 1,910 Operating transfers in (out) - - - - 30 - 1 1,302 Interest Earned on Contingency and Reserves 174 126 113 92 37 89 173 231 Cumulative Interest Earned on Contingency and Reserves 1,667 1,793 1,906 1,998 2,035 2,124 2,297 2,528 Total Cash Reserves & Interest 1,248 1,938 2,189 1,938 1,783 1,523 1,800 1,124
(1) FY 1986 Estimated Ultimate Losses includes losses paid and expected to be paid by insurance coverages(2) Actual funding and paid losses figures(3) Negative numbers in an annual Losses Paid column denote net recoveries during the loss year.
Statistical Section K - 26

Anticipated Future
Losses in Subsequent
Years
Total Anticipated
Losses
- 256 - 349 - 487 - 184
168 440 308 592 545 583 422 617 411 473 198 299
1,854 8,255 7,661
N/A8,514
853
Statistical Section K - 27

CITY OF BOISEWORKERS COMPENSATION SELF-INSURED RETENTIONLOSSES VS RESERVES
YEAR 1 2 3 4 5 6 7 8ESTIMATED LOSS PAYMENT PATTERN 22% 25% 15% 9% 6% 4% 3% 2%
ACTUAL LOSSES PAID
Fiscal Year
Estimated Ultimate Losses (1) 1999(1) 2000(1) 2001(1) 2002(1) 2003(1) 2004(1,3) 2005(1) 2006(1)
1999 698 178 194 25 10 24 (2) - - 2000 721 238 328 125 37 67 26 1 2001 847 238 239 2 35 99 21 2002 872 293 227 33 56 26 2003 984 305 235 42 13 2004 1101 564 363 151 2005 1387 344 387 2006 1209 731 2007 1390
Losses Paid/Projected to be Paid by Year (incl. Allocated Loss Adjustment Expenses) 178 432 591 667 595 932 930 1,330 Cumulative Losses 178 610 1,201 1,868 2,463 3,395 4,325 5,655 Loss Funding 698 721 847 872 984 1,101 1,387 1,209 Cumulative Loss Funding 698 1,419 2,266 3,138 4,122 5,223 6,610 7,819 Estimated Cash Reserves 520 289 256 205 389 169 457 (121) Unallocated Loss Adjustment Expense (less dividend expense) (157) (215) (214) (318) (367) (406) (437) (361) Net Claims Expense 363 74 42 (113) 22 (237) 20 (482) Claims incurred but not reported (560) (463) (28) (45) (407) (124) (457) (148)
Other charges for services 407 351 225 317 431 336 242 505
Operating transfers in (out) - - - - - - - - Interest Earned on
Contingency and Reserves 20 78 137 53 31 45 90 176 Cumulative Interest Earned on
Contingency and Reserves 20 98 235 288 319 364 454 630 Total Cash Reserves & Interest 230 270 646 858 935 955 850 1,170
(1) Actual funding and paid losses figures(2) Projected paid losses(3) Negative numbers in an annual Losses Paid column denote net recoveries during the loss year.(4) Interest projected at 5% APR
Statistical Section K - 28

9 10 >10
1% 2% 11% 100%
ANTICIPATED FUTURE LOSSES
2007(2) 2008(2)
Anticipated Future Losses in
Subsequent Years
Total Anticipated
Losses
- - - 429 - - - 822 1 4 208 847
(23) 8 252 872 28 14 347 984 70 4 60 1,212 55 36 565 1,387
(26) 30 474 1,209 487 54 849 1,390
592 151 2,754 9,152 6,247 6,398 9,152 1,390 - N/A9,209 9,209 9,209
798 (151) 57
(383) 415 (151)
(1,040)
818
-
319 67
949 1,016
1,682 1,598
Statistical Section K - 29

CITY OF BOISESCHEDULE OF ESTIMATED WORKERS COMPENSATION CLAIMS
1999 (1) 2000 (1) 2001 (2) 2002 (3) 2003 (3) 2004 (3) 2005 (3) 2006 (3) 2007 (3)
LIABILITY FOR KNOWN WORKERS COMPENSATION CLAIMS REESTMATED AS OF:
END OF YEAR 507 665 620 711 599 1,051 721 863 852 ONE YEAR LATER 473 833 640 641 605 1,283 917 782 TWO YEARS LATER 429 748 686 674 601 1,142 835 THREE YEARS LATER 430 910 612 609 595 1,213 FOUR YEARS LATER 431 821 658 635 724 FIVE YEARS LATER 429 821 634 615 SIX YEARS LATER 429 822 634 SEVEN YEARS LATER 429 822 EIGHT YEARS LATER 429 NINE YEARS LATER
SCHEDULE OF PAID CLAIMS PAID FROM THE BOISE CITY SELF-INSURED WORKERS COMPENSATION PLAN
1999 (1) 2000 (1) 2001 (2) 2002 (3) 2003 (3) 2004 (3) 2005 (3) 2006 (3) 2007 (3)
LIABILITY FOR UNPAID CLAIMS AND CLAIM ADJUSTMENT EXPENSES:507 665 620 711 599 1,051 721 863 852
PAID (CUMULATIVE) AS OF:END OF YEAR 178 238 238 293 305 565 344 462 487ONE YEAR LATER 372 566 477 520 510 927 731 705TWO YEARS LATER 397 692 479 553 582 1,078 786THREE YEARS LATER 407 729 514 609 595 1,148FOUR YEARS LATER 431 795 613 635 623FIVE YEARS LATER 429 821 634 612SIX YEARS LATER 429 822 635SEVEN YEARS LATER 429 822EIGHT YEARS LATER 429NINE YEARS LATER
(2) Re-insurance policies purchased by the City effective October 1, 2001 are subject to a self-insured retention of $300,000 per incident with no maximum annual aggregate loss provisions.
(3) Re-insurance policies purchased by the City effective October 1, 2002 are subject to a self-insured retention of $400,000 per incident with no maximum annual aggregate loss provisions.
The following schedule shows the development of estimated aggregate liability for known claims since the inception of the City's self-insured Workers Compensation program. Liabilities are periodically reestimated based on changes in factors used to make the original estimates. Estimates do not include claims that are incurred but not reported (IBNR).
The following schedule shows the development of claims losses since theinception of the City's self-insured Workers Compensation program. Paid amounts are based on actual settlements. Liability amount shown is the original estimate for each policy year and prior to any reestimates.
(1) Insurance policies purchased by the City effective October 1, 1998 are subject to a self-insured retention of $250,000 per incident with no maximum annual aggregate loss provisions.
Statistical Section K - 30
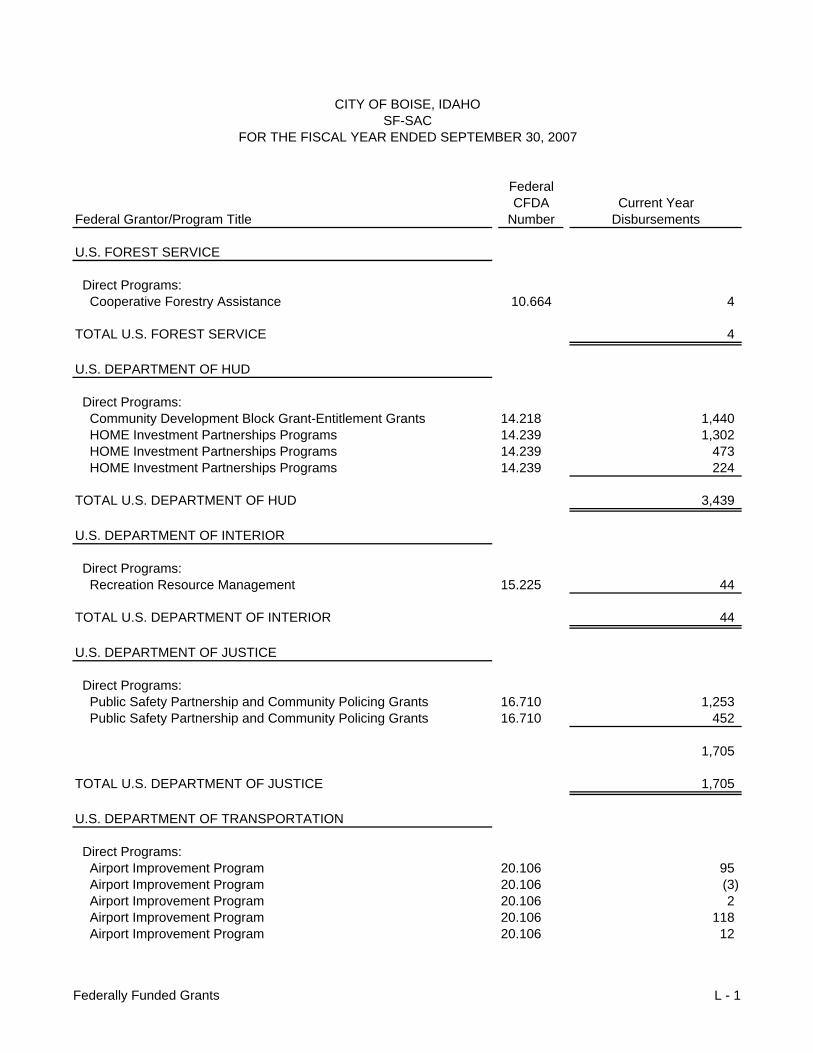
CITY OF BOISE, IDAHOSF-SAC
FOR THE FISCAL YEAR ENDED SEPTEMBER 30, 2007
FederalCFDA Current Year
Federal Grantor/Program Title Number Disbursements
U.S. FOREST SERVICE
Direct Programs: Cooperative Forestry Assistance 10.664 4
TOTAL U.S. FOREST SERVICE 4
U.S. DEPARTMENT OF HUD
Direct Programs: Community Development Block Grant-Entitlement Grants 14.218 1,440 HOME Investment Partnerships Programs 14.239 1,302 HOME Investment Partnerships Programs 14.239 473 HOME Investment Partnerships Programs 14.239 224
TOTAL U.S. DEPARTMENT OF HUD 3,439
U.S. DEPARTMENT OF INTERIOR
Direct Programs: Recreation Resource Management 15.225 44
TOTAL U.S. DEPARTMENT OF INTERIOR 44
U.S. DEPARTMENT OF JUSTICE
Direct Programs: Public Safety Partnership and Community Policing Grants 16.710 1,253 Public Safety Partnership and Community Policing Grants 16.710 452
1,705
TOTAL U.S. DEPARTMENT OF JUSTICE 1,705
U.S. DEPARTMENT OF TRANSPORTATION
Direct Programs: Airport Improvement Program 20.106 95 Airport Improvement Program 20.106 (3) Airport Improvement Program 20.106 2 Airport Improvement Program 20.106 118 Airport Improvement Program 20.106 12
Federally Funded Grants L - 1

CITY OF BOISE, IDAHOSF-SAC
FOR THE FISCAL YEAR ENDED SEPTEMBER 30, 2007
FederalCFDA Current Year
Federal Grantor/Program Title Number Disbursements Airport Improvement Program 20.106 870 Airport Improvement Program 20.106 3,600 Airport Improvement Program 20.106 3,888
8,582
Passed Through State Department of Transportation: Highway Planning and Construction 20.205 61 Highway Planning and Construction 20.205 16 Highway Planning and Construction 20.205 23 Highway Planning and Construction 20.205 52 Highway Planning and Construction 20.205 323 Recreational Trails Program 20.219 36 State and Community Highway Safety 20.600 58 Alcohol traffic Safety & Drunk Driving Prevention 20.601 11 Hazardous Materials Emergency Preparednedss 20.703 6 Transportation Security Administration Reimbursement no known 301
887
TOTAL U.S. DEPARTMENT OF TRANSPORTATION 9,469
NATIONAL ENDOWMENT FOR THE ARTS
Passed Through State Commission on the Arts: Promotion of the Arts-Partnership Agreement 45.025 1
TOTAL NATIONAL ENDOWMENT FOR THE ARTS 1
INSTITUTE OF MUSEUM AND LIBRARY SERVICES
Passed Through the State Library: State Library Program 45.310 1 State Library Program 45.310 1 State Library Program 45.310 1 State Library Program 45.310 1 State Library Program 45.310 3 State Library Program 45.310 1 State Library Program 45.310 8 State Library Program 45.310 1 State Library Program 45.310 1
TOTAL INSTITUTE OF MUSEUM AND LIBRARY SERVICES 18
Federally Funded Grants L - 2

CITY OF BOISE, IDAHOSF-SAC
FOR THE FISCAL YEAR ENDED SEPTEMBER 30, 2007
FederalCFDA Current Year
Federal Grantor/Program Title Number Disbursements
U.S. DEPARTMENT OF HEALTH AND HUMAN SERVICES
Passed through the State Department Health & Welfare: Injury Prevention and Control Research 93.136 17 Injury Prevention and Control Research 93.136 7 Urban Indian Health Services 93.193 8 Temporary Assistance for Needy Families 93.558 2
TOTAL DEPARTMENT OF HEALTH AND HUMAN SERVICES 34
U.S. DEPARTMENT OF HOMELAND SECURITY
Direct Programs:
Domestic Preparedness Grant 97.004 46 Assistance to Firefighters Grant Program 97.044 19 National Explosives Detection Canine Team Program 97.072 186 Commercial Equipment Direct Assistance Program 97.096 11
TOTAL DEPARTMENT OF HOMELAND SECURITY 262
OTHER FEDERAL ASSISTANCE
U.S. DEPARTMENT OF TRANSPORTATION
Passed through Airline Industry: Passenger Facility Charges 6,939
TOTAL U.S. DEPARTMENT OF TRANSPORTATION 6,939
OTHER FEDERAL ASSISTANCE (Continued)
U.S. DEPARTMENT OF HUD
Program Income: Community Development Block Grants/ Entitlement Grants 14.218 890 HOME Investment Partnerships Program 14.239 511
TOTAL U.S. DEPARTMENT OF HUD 1,401
Federally Funded Grants L - 3

CITY OF BOISE, IDAHOSF-SAC
FOR THE FISCAL YEAR ENDED SEPTEMBER 30, 2007
FederalCFDA Current Year
Federal Grantor/Program Title Number Disbursements
TOTAL OTHER FEDERAL ASSISTANCE 8,340
TOTAL FEDERAL ASSISTANCE 23,316
Federally Funded Grants L - 4