comprehensive annual financial report for the year ended ... · with the general manager. an...
TRANSCRIPT
Greater Cleveland Regional Transit Authority
Comprehensive Annual Financial Report for the Year Ended December 31, 2015Cuyahoga County, Ohio

Our Mission
To provide safe, reliable, clean and courteous public transportation.
Our Vision
We will be:
• The transportation mode of choice
• An industry leader
• An employer of choice in Northeast Ohio
• A champion for sustainable transportation
We will have:
• A sustainable financial position
• An increasing impact on regional transportation
We will:
• Upgrade and manage technology
• Achieve an infrastructure state of good repair
• Deliver quality projects on time and on budget
• Enhance the value of RTA to our community
Our Values
• Safety—The safety of our passengers, our employees and the general public is always our top priority.
•Ethics & Integrity—We are dedicated to the highest ethical standards including uncompromising honesty and integrity in our daily activities.
•Service Excellence—We will provide safe, reliable, clean, on-time, courteous service that our customers and the community will view as outstanding.
•Fiscal Responsibility—We are committed to managing every taxpayer and customer generated dollar as if it were coming from our own pocket.
• Teamwork—We believe in teamwork and will foster a spirit of cooperative effort within RTA and with our partners.
• Responsibility & Accountability—Every individual is accountable. Meeting our individual responsibilities will ensure that collectively RTA is a high performing organization. We will meet all regulations and commitments and continually strive to improve.
• Respect—We will treat all members of the RTA family, our customers and the general public with dignity and respect.
Vision
Comprehensive Annual Financial Report
For the Year Ended December 31, 2015
Greater Cleveland Regional Transit Authority
Cuyahoga County, Ohio
George F. Dixon, III President
Board of Trustees
Joseph A. Calabrese CEO, General Manager/
Secretary- Treasurer
Prepared By: Division of Finance and Administration General Accounting

2015 INTRODUCTORY SECTION COMPREHENSIVE ANNUAL FINANCIAL REPORT

- 1 -
GREATER CLEVELAND REGIONAL TRANSIT AUTHORITY
COMPREHENSIVE ANNUAL FINANCIAL REPORT
TABLE OF CONTENTS
PAGE INTRODUCTORY SECTION Title Page Table of Contents ................................................................................................. 1 Certificate of Achievement for Excellence in Financial Reporting ..................... 3 Letter of Transmittal ............................................................................................. 5 Organizational Chart ............................................................................................ 11 Board of Trustees and Executive Management Team ......................................... 12 Community Boundaries in Cuyahoga County ...................................................... 13 FINANCIAL SECTION Independent Auditor’s Report. ............................................................................. 14 Management’s Discussion and Analysis .............................................................. 17 Financial Statements: Statements of Net Position ...................................................................... 31 Statements of Revenues, Expenses and Changes in Net Position ...................................................................... 33 Statements of Cash Flows ....................................................................... 34 Notes to Financial Statements ................................................................. 36 Required Supplementary Information ..................................................... 61
- 2 -
TABLE OF CONTENTS
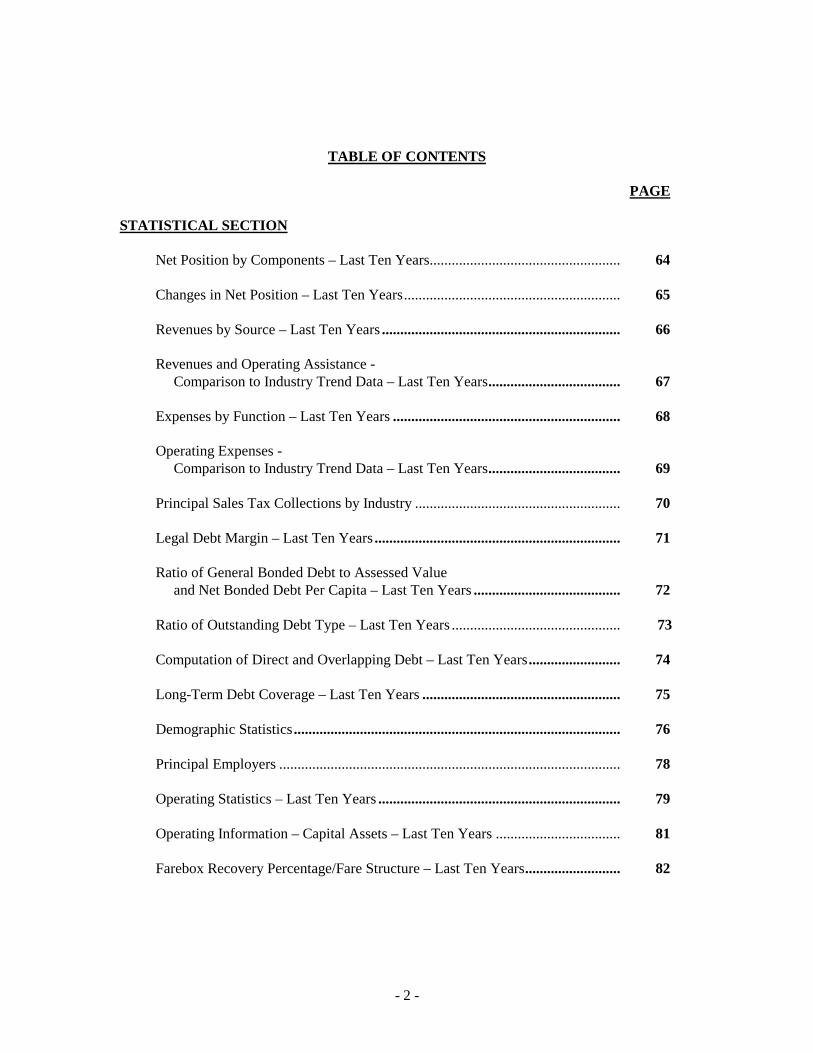
PAGE STATISTICAL SECTION Net Position by Components – Last Ten Years.................................................... 64 Changes in Net Position – Last Ten Years ........................................................... 65 Revenues by Source – Last Ten Years ................................................................. 66 Revenues and Operating Assistance - Comparison to Industry Trend Data – Last Ten Years .................................... 67 Expenses by Function – Last Ten Years .............................................................. 68 Operating Expenses - Comparison to Industry Trend Data – Last Ten Years .................................... 69 Principal Sales Tax Collections by Industry ........................................................ 70 Legal Debt Margin – Last Ten Years ................................................................... 71 Ratio of General Bonded Debt to Assessed Value and Net Bonded Debt Per Capita – Last Ten Years ........................................ 72 Ratio of Outstanding Debt Type – Last Ten Years .............................................. 73 Computation of Direct and Overlapping Debt – Last Ten Years ......................... 74 Long-Term Debt Coverage – Last Ten Years ...................................................... 75 Demographic Statistics ......................................................................................... 76 Principal Employers ............................................................................................. 78 Operating Statistics – Last Ten Years .................................................................. 79 Operating Information – Capital Assets – Last Ten Years .................................. 81 Farebox Recovery Percentage/Fare Structure – Last Ten Years .......................... 82


- 4 -
GFOA Certificate of Achievement for Excellence Statement The Government Finance Officers Association of the United States and Canada (GFOA) awarded a Certificate of Achievement for Excellence in Financial Reporting to the Greater Cleveland Regional Transit Authority for its comprehensive annual financial report for the fiscal year ended December 31, 2014. This was the twenty-seventh consecutive year that the government has achieved this prestigious award. In order to be awarded a Certificate of Achievement, a government must publish an easily readable and efficiently organized comprehensive annual financial report. This report must satisfy both generally accepted accounting principles and applicable legal requirements. A Certificate of Achievement is valid for a period of one year only. We believe that our current comprehensive annual financial report continues to meet the Certificate of Achievement Program's requirements and we are submitting it to the GFOA to determine its eligibility for another certificate.
- 5 -
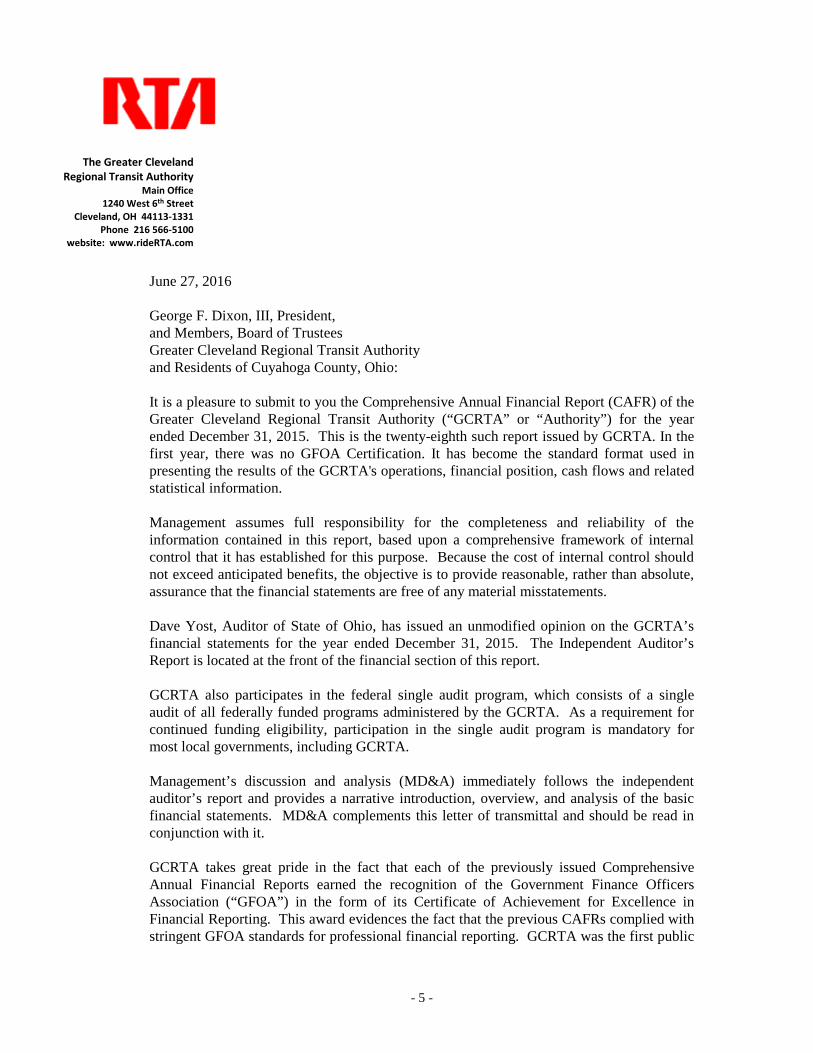
June 27, 2016 George F. Dixon, III, President, and Members, Board of Trustees Greater Cleveland Regional Transit Authority and Residents of Cuyahoga County, Ohio: It is a pleasure to submit to you the Comprehensive Annual Financial Report (CAFR) of the Greater Cleveland Regional Transit Authority (“GCRTA” or “Authority”) for the year ended December 31, 2015. This is the twenty-eighth such report issued by GCRTA. In the first year, there was no GFOA Certification. It has become the standard format used in presenting the results of the GCRTA's operations, financial position, cash flows and related statistical information. Management assumes full responsibility for the completeness and reliability of the information contained in this report, based upon a comprehensive framework of internal control that it has established for this purpose. Because the cost of internal control should not exceed anticipated benefits, the objective is to provide reasonable, rather than absolute, assurance that the financial statements are free of any material misstatements. Dave Yost, Auditor of State of Ohio, has issued an unmodified opinion on the GCRTA’s financial statements for the year ended December 31, 2015. The Independent Auditor’s Report is located at the front of the financial section of this report. GCRTA also participates in the federal single audit program, which consists of a single audit of all federally funded programs administered by the GCRTA. As a requirement for continued funding eligibility, participation in the single audit program is mandatory for most local governments, including GCRTA. Management’s discussion and analysis (MD&A) immediately follows the independent auditor’s report and provides a narrative introduction, overview, and analysis of the basic financial statements. MD&A complements this letter of transmittal and should be read in conjunction with it. GCRTA takes great pride in the fact that each of the previously issued Comprehensive Annual Financial Reports earned the recognition of the Government Finance Officers Association (“GFOA”) in the form of its Certificate of Achievement for Excellence in Financial Reporting. This award evidences the fact that the previous CAFRs complied with stringent GFOA standards for professional financial reporting. GCRTA was the first public
The Greater Cleveland Regional Transit Authority
Main Office 1240 West 6th Street
Cleveland, OH 44113-1331 Phone 216 566-5100
website: www.rideRTA.com

- 6 -
transit agency in Ohio to earn this important recognition and has consistently done so since 1988. The GCRTA also submits its annual operating and capital budgets to the GFOA and has been doing so since 1990. Each of these budget documents has won the Distinguished Budget Presentation Award, having satisfied the most stringent program criteria and proven its value as (1) a policy document, (2) an operations guide, (3) a financial plan, and (4) a communication device.
PROFILE OF GOVERNMENT AND REPORTING ENTITY The Greater Cleveland Regional Transit Authority is an independent political subdivision of the State of Ohio. It was created in December 1974 by ordinance of the City of Cleveland, Ohio, and by resolution of the Board of County Commissioners of Cuyahoga County, Ohio. Operations at GCRTA began in September 1975. The GCRTA provides virtually all-mass transportation within the County. It is a multimodal system delivering bus, paratransit, heavy rail, light rail and bus rapid transit services. A ten-member Board of Trustees (Board) establishes policy and sets direction for the management of the GCRTA. Four of the members are appointed by the Mayor of Cleveland with the consent of City Council; three members, one of whom must reside in the City of Cleveland, are appointed by the County Executive; the remaining three members are elected by suburban mayors, city managers, and township trustees. Board members serve overlapping three-year terms. Under the provisions of General Accounting Standards Board (“GASB”) Statement No. 61, the GCRTA is considered to be a jointly governed organization. Responsibility for the line administration rests with the CEO, General Manager/Secretary-Treasurer. He supervises five Deputy General Managers who head the Operations, Legal Affairs, Finance & Administration, Engineering & Project Management and the Human Resources divisions. Additionally, the Office of Management and Budget, Information Technology and the Office of Marketing and Communications function outside of the divisional configuration and report directly to the General Manager. The Internal Audit Department reports to the Board of Trustees and maintains a close working relationship with the General Manager. An organizational chart, which depicts these relationships, follows later in this introductory section. The GCRTA had 2,128 employees as of December 31, 2015. The system delivered 14.0 million revenue miles of bus service and 3.3 million revenue miles on its heavy and light rail systems. The service fleet was composed of 426 motor bus coaches, 60 heavy rail cars, 48 light rail cars, and 159 Paratransit vehicles. The annual cash-basis operating budget is proposed by management, at the department level, and adopted by the Board of Trustees after public discussion. The budget for each division and department is represented by appropriation. The Board must approve any increase in the total Authority appropriations. The General Manager must approve any inter-divisional budget transfers. The appropriate Deputy General Manager may modify appropriations to applicable departments within a division and to accounts within a department. Budgetary control is maintained at the department level. It is the responsibility of each department to administer its operations in such a manner as to ensure that the use of funds is
- 7 -
consistent with the goals and programs authorized by the Board of Trustees. The GCRTA also maintains an encumbrance accounting system for budgetary control. Unencumbered appropriations lapse at year-end. Encumbered appropriation balances are carried forward to the succeeding year and need not be reauthorized.
ECONOMIC CONDITION AND OUTLOOK
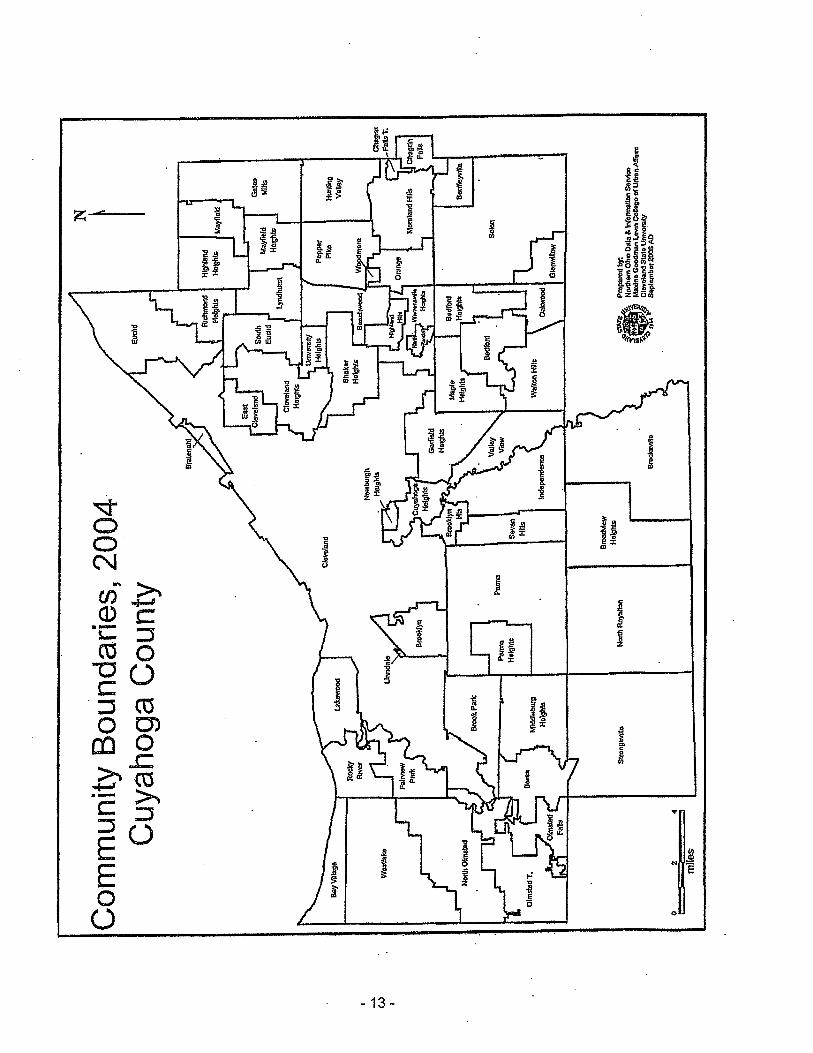
The GCRTA's service area is contiguous with the boundaries of Cuyahoga County, Ohio. The County includes the City of Cleveland, two townships, and fifty-six other jurisdictions. This is the largest metropolitan area in Ohio and one of the largest counties in the United States. The population of this area is approximately 1.26 million people. Historically, the foundation for Greater Cleveland's economic vitality had been heavy industry with the largest employment sector being manufacturing. The largest employment areas in 2015 were in the following industries:
• Healthcare/Education • Trade/Transportation/Utilities • Professional/Business services • Government; • Manufacturing, and • Hospitality
Our local economy continues to grow, resulting in more of our workforce being employed. The County's 2015 unemployment was approximately 5.5% compared to the national rate of 5.0%. Real property, consisting of agricultural, commercial, industrial, and residential real property is reappraised every six years. The current assessed value is estimated to be $27.7 billion. This process is the foundation for property taxation, and it sets the debt limitation for GCRTA.
CURRENT YEAR REVIEW
In 2015, RTA continued its pursuit to provide Greater Clevelanders with unparalleled connectivity, along with high quality service design and delivery. This includes a two-fold plan to purchase new buses that will emit 30% fewer greenhouse gases and 85% less nitrous oxide pollution than the current diesel buses while contributing to RTA’s sustainability commitment to the community-at-large. RTA launched a new website to more easily help current and potential customers ride RTA. Whether customers are looking to plan a route, check the status of major projects, or get the latest RTA news, the new website offers vast amounts of information. RTA launched an iWatch app that allows riders to text, call, or send emails anonymously to Transit Police in response to any safety concerns on RTA. As a result, 2015 was a great year for RTA, marked by infrastructure improvements, customer service enhancements, and a strong fiscal position. Due to lower gasoline prices which led to an increase in individual automobile use, RTA experienced a decrease in its system-wide ridership in 2015. In 2015, RTA delivered 47.03 million passenger trips, a decrease of 4.17% from 2014. The heavy rail service finished the

- 8 -
year by serving 6.4 million customers, an increase over 2014 of 3.78%. The light rail service decreased 6.17% to 2.6 million trips. Paratransit showed a 6.5% decline; the HealthLine, a bus rapid transit line the runs along Euclid Avenue connecting the downtown Cleveland to the Louis Stokes Station at Windermere, declined by 6.5%. During 2015, the Lee-Van Aken and the Little Italy Redline stations were opened. Additionally, RTA:
• Was recognized as one of Northeast Ohio’s “50 Smartest” organizations. • Made strides with our succession planning efforts and was awarded two workforce
development grants. • Was selected by the USDOT to help develop and prototype two separate collision
avoidance technologies to reduce pedestrian accidents. • Was recognized for our Best-In-Class in workforce diversity. • Received an award of distinction for our stations designs from the Urban Land
Institute. • Hosted Labor Secretary Perez at the RTA Rail District to discuss workforce
development initiatives. • Recognized as an Employer of Distinction with the second Smart Commute Award. • Celebrated as a second GCRTA Trustee became the chairperson of the American
Public Transportation Association (APTA). • Continued on our journey towards the Baldridge Award for Excellence.
Despite some challenges, by all measurements, 2015 was a good year both for the region and GCRTA. The future also looks bright, with the final pieces in place to create a new economy in Northeast Ohio.
PRESENT AND FUTURE PLANS
The Authority has continued to implement its Long-Range Plan. This Long-Range Plan serves as a blueprint for building tomorrow’s public transit by addressing shifts in our area’s population and employment centers, as well as changing travel patterns. This plan includes: Transit Centers - Transit centers are strategically located where bus routes intersect
and service is timed to provide easy transferring. Larger centers include indoor waiting areas and concessions. GCRTA has existing Transit Centers at Fairview Park, Euclid, North Olmsted, Maple Heights, Parma Mall and the Stephanie Tubbs Jones center in downtown Cleveland.
Park-N-Ride Lots - Parking lots are strategically located at freeway or other major intersections. Commuters leave their cars and ride express service to and from their destinations. GCRTA provides more than 8,800 parking spaces at 21 of the rapid transit stations. In addition, the Authority operates five Park-N-Ride lots in Berea, Brecksville, Rocky River, Strongsville, and Westlake with more than 1,200 parking spaces combined. An expansion project, added 250 additional parking spaces at the Westlake Park-N-Ride Lot.
Paratransit Facility – The Paratransit Facility was built in 1983 and houses all
Parartansit functions including scheduling, dispatching and both revenue and non-revenue repairs. An 18-month rehabilitation plan was completed in 2013.

- 9 -
CAPITAL IMPROVEMENT PLAN The development of the 2015 budget included preparation of a five-year Capital Improvement Plan (“CIP”). This document is an outline for rebuilding and expanding services by the Authority through the end of 2019. Totaling $349.31 million, the CIP constitutes a significant public works effort aimed at remaking the transit network and positioning the Authority, not just for the short-term, but also for the long-term future. Significant capital improvements planned for the five-year period include: Rail Projects - $80.56 million
This commitment of funds includes the replacement of several substations, stations and track rehabilitation, bridges, train control systems, rail vehicles overhaul, signage and rail expansion. Major significant projects include the rehabilitation of the Brookpark Road Heavy Rail substation for $12.3 million and a combined $9.12 million for various track rehabilitation projects of which $7.0 million is for the construction of Track 8 and the Track 7 Platform under Tower City as the Authority begins a phased multi-year project to rehabilitate all tracks running through the station. Bridge Rehabilitation and Other Facility Improvements - $36.55 million Funding has been provided for the rehabilitation of two track bridges of $7.2 million and includes replacement of Hayden parking lot repaving and other facility improvements totaling $1.1 million. Bus Purchases, Paratransit Vehicles and Circulator Bus- $90.95 million The useful life of a standard bus, as defined by the Federal Transit Administration (“FTA”) is twelve years, or five hundred thousand miles. The Authority is aggressively reducing its fleet's average age by replacing its oldest vehicles. Transit Centers and Shelters and Other - $1.44 million
The Authority will make an investment in the construction of Transit Centers over the next five years of $1.44 million. These centers will be designed to provide our riders with convenient connections between local, regional and downtown transit lines. Comfortable waiting areas and time-coordinated service will make it easier for riders to transfer between routes. Equipment and Other- $12.31 million
This project calls for the on-going upgrades to the Management Information System throughout the Authority including Data Center, Phone System and network improvements.
Local Capital Projects - $18.45 million Classified as Routine Capital Projects ($9.28 million) and Asset Maintenance Projects ($9.17 million), these initiatives are funded entirely from local resources. Routine Capital Projects are typically equipment requested by various departments and not funded through grants. Asset Maintenance funds are used to maintain, rehabilitate, replace, or construct assets of a smaller scope or cost than those typically supported with grants. These projects


- 12 -
Board of Trustees and Executive Management Team
BOARD OF TRUSTEES
President George F. Dixon, III
Vice President Dennis M. Clough
Trustees Charles P. Lucas Trevor K. Elkins
Valarie J. McCall Karen Gabriel Moss
Nick “Sonny” Nardi Gary A. Norton, Jr.
Leo Serrano Georgine Welo
EXECUTIVE MANAGEMENT TEAM
Joseph A. Calabrese Chief Executive Officer,
General Manager/Secretary-Treasurer
Bruce Hampton Deputy General Manager, Human Resources Sheryl King Benford General Counsel, Deputy General Manager, Legal Affairs Stephen Bitto Executive Director, Marketing & Communications Gale Fisk Executive Director, Office of Management and Budget Anthony Garofoli Executive Director, Internal Audit
Loretta Kirk Deputy General Manager, Finance & Administration Michael J. Schipper Deputy General Manager, Engineering & Project Management Michael York Deputy General Manager, Operations Frank Polivka Director, Procurement Pete Anderson CIO, Executive Director – Information Technology

2015
FINANCIAL SECTION
BASIC FINANCIAL STATEMENTS AND NOTES COMPREHENSIVE ANNUAL FINANCIAL REPORT
14
Lausche Building, 615 Superior Ave., NW, Twelfth Floor, Cleveland, Ohio 44113-1801 Phone: 216-787-3665 or 800-626-2297 Fax: 216-787-3361
www.ohioauditor.gov
INDEPENDENT AUDITOR’S REPORT
Greater Cleveland Regional Transit Authority Cuyahoga County 1240 West 6th Street Cleveland, Ohio 44113 To the Board of Trustees: Report on the Financial Statements We have audited the accompanying financial statements of the Greater Cleveland Regional Transit Authority, Cuyahoga County, Ohio (the Authority), as of and for the years ended December 31, 2015 and 2014, and the related notes to the financial statements, which collectively comprise the Authority’s basic financial statements as listed in the table of contents. Management’s Responsibility for the Financial Statements Management is responsible for preparing and fairly presenting these financial statements in accordance with accounting principles generally accepted in the United States of America; this includes designing, implementing, and maintaining internal control relevant to preparing and fairly presenting financial statements that are free from material misstatement, whether due to fraud or error. Auditor's Responsibility Our responsibility is to opine on these financial statements based on our audit. We audited in accordance with auditing standards generally accepted in the United States of America and the financial audit standards in the Comptroller General of the United States’ Government Auditing Standards. Those standards require us to plan and perform the audit to reasonably assure the financial statements are free from material misstatement. An audit requires obtaining evidence about financial statement amounts and disclosures. The procedures selected depend on our judgment, including assessing the risks of material financial statement misstatement, whether due to fraud or error. In assessing those risks, we consider internal control relevant to the Authority’s preparation and fair presentation of the financial statements in order to design audit procedures that are appropriate in the circumstances, but not to the extent needed to opine on the effectiveness of the Authority’s internal control. Accordingly, we express no such opinion. An audit also includes evaluating the appropriateness of management’s accounting policies and the reasonableness of their significant accounting estimates, as well as our evaluation of overall financial statement presentation. We believe the audit evidence we obtained is sufficient and appropriate to support our opinion.
Greater Cleveland Regional Transit Authority Cuyahoga County Independent Auditor’s Report Page 2
15
Opinion In our opinion, the financial statements referred to above present fairly, in all material respects, the financial position of the Greater Cleveland Regional Transit Authority, Cuyahoga County as of December 31, 2015 and 2014, and the changes in its financial position and its cash flows for the years then ended in accordance with the accounting principles generally accepted in the United States of America. Emphasis of Matter As discussed in Note 2 to the financial statements, during the year ended December 31, 2015, the Authority adopted Governmental Accounting Standards Board (GASB) Statement No. 68, Accounting and Financial Reporting for Pensions – an amendment of GASB Statement No. 27 and also GASB Statement No. 71, Pension Transition for Contributions Made Subsequent to the Measurement Date. Also as discussed in Note 2 to the financial statements, the Authority did not restate the financial statements for the year ended December 31, 2014 for the implementation of these statements. The financial statements for the year ended December 31, 2014 were presented based on GASB Statement No. 27. We did not modify our opinion regarding this matter. Other Matters Required Supplementary Information Accounting principles generally accepted in the United States of America require this presentation to include Management’s discussion and analysis and schedules of net pension liabilities and pension contributions listed in the table of contents, to supplement the basic financial statements. Although this information is not part of the basic financial statements, the Governmental Accounting Standards Board considers it essential for placing the basic financial statements in an appropriate operational, economic, or historical context. We applied certain limited procedures to the required supplementary information in accordance with auditing standards generally accepted in the United States of America, consisting of inquiries of management about the methods of preparing the information and comparing the information for consistency with management’s responses to our inquiries to the basic financial statements, and other knowledge we obtained during our audit of the basic financial statements. We do not opine or provide any assurance on the information because the limited procedures do not provide us with sufficient evidence to opine or provide any other assurance. Supplementary and Other Information Our audit was conducted to opine on the Authority’s basic financial statements taken as a whole. The introductory section and the statistical section information present additional analysis and are not a required part of the basic financial statements. We did not subject the introductory section and statistical section information to the auditing procedures applied in the audit of the basic financial statements and, accordingly, we express no opinion or any other assurance on them.
Greater Cleveland Regional Transit Authority Cuyahoga County Independent Auditor’s Report Page 3
16
Other Reporting Required by Government Auditing Standards In accordance with Government Auditing Standards, we have also issued our report dated June 27, 2016, on our consideration of the Authority’s internal control over financial reporting and our tests of its compliance with certain provisions of laws, regulations, contracts and grant agreements and other matters. That report describes the scope of our internal control testing over financial reporting and compliance, and the results of that testing, and does not opine on internal control over financial reporting or on compliance. That report is an integral part of an audit performed in accordance with Government Auditing Standards in considering the Authority’s internal control over financial reporting and compliance. Dave Yost Auditor of State Columbus, Ohio June 27, 2016

- 17 -
MANAGEMENT’S DISCUSSION AND ANALYSIS (UNAUDITED)
As the management team for the Greater Cleveland Regional Transit Authority (otherwise known as GCRTA or for the purpose of this report, the Authority), we offer readers of our basic financial statements this narrative overview and analysis of the financial activities of the Authority for the years ended December 31, 2015 and December 31, 2014. This discussion and analysis is designed to assist the reader in focusing on the significant financial issues, as well as, activities and to identify any significant changes in financial position. We encourage readers to consider the information presented here in conjunction with the basic financial statements taken as a whole. Overview of Financial Highlights
• The Authority’s net position decreased by $69.5 million (10.8%) in 2015 compared to 2014 due to the implementation of Government Accounting Standards Board (GASB) Statement number 68, “Accounting and Financial Reporting for Pensions,” which is discussed in detail in Note 7 of the financial statements. Net position increased by $3.2 million (0.5%) in 2014 compared to 2013.
• Current assets decreased by $10.8 million (10.3%) in 2015 compared to 2014. This decrease is
primarily due to a decrease in restricted cash and investments of approximately $19.2 million. Current assets decreased by $19.3 million (15.6%) in 2014 compared to 2013.
• Current liabilities increased by $.90 million (1.5%) in 2015 compared to 2014. Current
liabilities increased by $5.2 million (9.8%) in 2014 compared to 2013.
• The Authority’s non-current liabilities increased by $127.4 million (77.6%) in 2015 compared to 2014, as a result of the GASB 68 implementation discussed in detail in Note 7 of the financial statements. Non-current liabilities decreased by $15 million (8.4%) in 2014 compared to 2013.
Basic Financial Statements and Presentation The financial statements presented by the Authority are:
1. The Statements of Net Position 2. The Statements of Revenues, Expenses, and the Changes in Net position 3. The Statements of Cash Flows
These statements are presented using the economic resources measurement focus and the accrual basis of accounting. The Authority is structured as a single enterprise fund with revenues recognized when earned and measurable, not when they are received. Expenses are recognized when they are incurred, not when they are paid. Capital assets are capitalized and depreciated over their estimated useful lives. Land is capitalized but is not depreciated. The Statements of Net Position present information on all the Authority’s assets and deferred outflows of resources, and liabilities, and deferred inflows of resources with the difference between the categories reported as net position. Over time, increases and decreases in net position may serve as a useful indicator of whether the financial position of the Authority is improving or deteriorating. Net position increases when revenues exceed expenses. Increases in assets and deferred outflows of resources

- 18 -
without a corresponding increase to liabilities and deferred inflows of resources result in increased net position, which indicates improved financial position. The Statements of Revenues, Expenses, and Changes in Net Position present information on how the Authority’s net position changed during the year. These statements summarize operating revenues and expenses, along with non-operating revenues and expenses. In addition, these statements list capital grant revenues received from federal, state, and local governments. The Statements of Cash Flows allow financial statement users to assess the Authority’s adequacy or ability to generate sufficient cash flows to meet its obligations in a timely manner. The statements are classified into four categories:
1) Cash flows from operating activities 2) Cash flows from non-capital financing activities 3) Cash flows from capital and related financing activities 4) Cash flows from investing activities
The notes to the financial statements provide additional information that is essential to a full understanding of the data provided in the financial statements. The basic financial statements can be found beginning on page 31 of this report.

- 19 -
FINANCIAL ANALYSIS OF THE AUTHORITY
Condensed Summary of Assets and Deferred Outflows of Resources, Liabilities and Deferred Inflows of Resources, and Net Position (amounts in millions)
2015 2014 2013Assets and Deferred Outflows of Resources:
Current assets $ 94.0 $ 104.8 $ 124.1Other noncurrent assets 56.5 38.1 40.6Capital assets (net of accumulated 752.8 721.9 708.8
depreciation)Deferred Outflows of Resources 32.9 4.4 2.3
Total Assets and Deferred Outflows of Resources: $ 936.2 $ 869.2 $ 875.8
Liabilities and Deferred Inflows of Resources:Current liabilities $ 59.3 $ 58.4 $ 53.2Noncurrent liabilities 291.5 164.1 179.1Deferred Inflows of Resources 8.2
Total Liabilities and Deferred Inflows of Resources: 359.0 222.5 232.3
Net position:Net Investment in Capital Assets 601.6 576.0 546.0Restricted 50.7 35.3 49.2Unrestricted (75.1) 35.4 48.3
Total Net position 577.2 646.7 643.5
Total Liabilities, Deferred Inflows of Resources, andNet Position $ 936.2 $ 869.2 $ 875.8
December 31,
Net position serves as a useful indicator of financial position. The Authority’s assets and deferred outflows of resources exceeded liabilities and deferred inflows of resources by $577.2 million as of December 31, 2015, which is an $69.5 million decrease from year ended December 31, 2014 (see Pension Note 7). Assets and deferred outflows of resources exceeded liabilities by $646.7 million for the year ended December 31, 2014, which was an increase of $3.2 million from year ended, December 31, 2013. The largest portion of the Authority’s net position reflect investment in capital assets, (buses, rail cars, right-of-way, and operating facilities), net of accumulated depreciation and minus any related debt used to acquire those assets. These capital assets are used by the Authority to provide public transportation services for the citizens of Cuyahoga County. During 2015, major construction projects totaling $30.1 million were completed and transferred to the appropriate property and facilities accounts. Major projects during 2015 included the Little Italy-

- 20 -
University Circle Red Line Station project with a cost of $7.4 million, the Clifton-Cleveland State Line project with a cost of $8.7 million, and the cost for passenger buses purchased and placed in service for $14 million. The construction in progress balance at December 31, 2015 included costs associated with a portion of the following;
1.) Brookpark Red Line Rapid Station 2.) Bus Replacement project 3.) Various other projects
During 2014, major construction projects totaling $18.7 million were completed and transferred to the appropriate property and facilities accounts. Major projects during 2014 included, the Cedar-University Rapid Station project with a cost of $17.6 million and the Central Rail Maintenance Facility Improvement project with a cost of $1.1 million.
The construction in progress balance at December 31, 2014 included costs associated with a portion of the following;
1.) The Little Italy-University Circle Red Line Station 2.) Van Aken-Lee Rail Station 3.) Various other projects
Readers desiring more detailed information on the Authority’s capital assets related activities should read Note 5 - Capital Assets on page 44, which is included in the notes to the basic financial statements. During 2015, the Authority adopted GASB Statement 68, "Accounting and Financial Reporting for Pensions — an Amendment of GASB Statement 27," which significantly revises accounting for pension costs and liabilities. For reasons discussed below, many end users of this financial statement will gain a clearer understanding of the Authority's actual financial condition by adding deferred inflows and subtracting deferred outflows related to net position.
GASB standards apply to all government financial reports prepared in accordance with generally accepted accounting principles. When accounting for pension costs, GASB 27 focused on a funding approach. This approach limited pension costs to contributions annually required by law, which may or may not be sufficient to fully fund each plan’s net pension liability. GASB 68 takes an earnings approach to pension accounting; however, the nature of Ohio’s statewide pension systems and state law governing those systems requires additional explanation in order to properly understand the information presented in these statements.
Under the new standards required by GASB 68, the net pension liability equals the Authority’s proportionate share of each plan’s collective:
1. Present value of estimated future pension benefits attributable to active and inactive employees’ past service
2. Minus plan assets available to pay these benefits
GASB notes that pension obligations, whether funded or unfunded, are part of the "employment exchange" — that is, the employee is trading his or her labor in exchange for wages, benefits, and the promise of a future pension. GASB noted that the unfunded portion of this pension promise is a present

- 21 -
obligation of the government, part of the bargained-for benefit to the employee, and should accordingly be reported by the government as a liability since they received the benefit of the exchange. However, the Authority is not responsible for certain key factors affecting the balance of this liability. In Ohio, the employee shares the obligation of funding pension benefits with the employer. Both employer and employee contribution rates are capped by State statute. A change in these caps requires action of both Houses of the General Assembly and approval of the Governor. Benefit provisions are also determined by State statute. The employee enters the employment exchange with the knowledge that the employer's promise is limited not by contract but by law. The employer enters the exchange also knowing that there is a specific, legal limit to its contribution to the pension system. In Ohio, there is no legal means to enforce the unfunded liability of the pension systems against the public employer. State law operates to mitigate/lessen the moral obligation of the public employer to the employee, because all parties enter the employment exchange with notice as to the law. The pension system is responsible for the administration of the plan.
Most long-term liabilities have set repayment schedules or, in the case of compensated absences (i.e. sick and vacation leave), are satisfied through paid time-off or termination payments. There is no repayment schedule for the net pension liability. As explained above, changes in pension benefits, contribution rates, and return on investment affect the balance of the net pension liability, but are outside the control of the local government. In the event contributions, investment returns, and other changes are insufficient to keep up with required pension payments, State statute does not assign/identify the responsible party for the unfunded portion.
In accordance with GASB 68, the Authority's statements prepared on an accrual basis of accounting include an annual pension expense for their proportionate share of each plan's change in net pension liability not accounted for as a deferred inflows/outflows .As a result of implementing GASB 68, the Authority is reporting a net pension liability and deferred inflows/outflows of resources related to pension on the accrual basis of accounting. This implementation also had the effect of restating net position at December 31, 2014 from $646,713,009 to $540,105,068.
Under GASB 68, pension expense represents additional amounts earned, adjusted by deferred inflows/outflows. The contractually required contribution is no longer a component of pension expense. Under GASB 68, the 2015 statements report pension expense of $13,804,484. Consequently, in order to compare 2015 total operating expense to 2014, the following adjustments are needed:
Total 2015 operating expense under GASB 68 297,367,303$ Pension expense under GASB 68 (13,804,484) 2015 contractually required contribution 16,116,330 Adjusted 2015 operating expenses 299,679,149 Total 2014 operating expenses under GASB 27 308,296,125 Decrease in operating expense related to pension (8,616,976)$
- 22 -
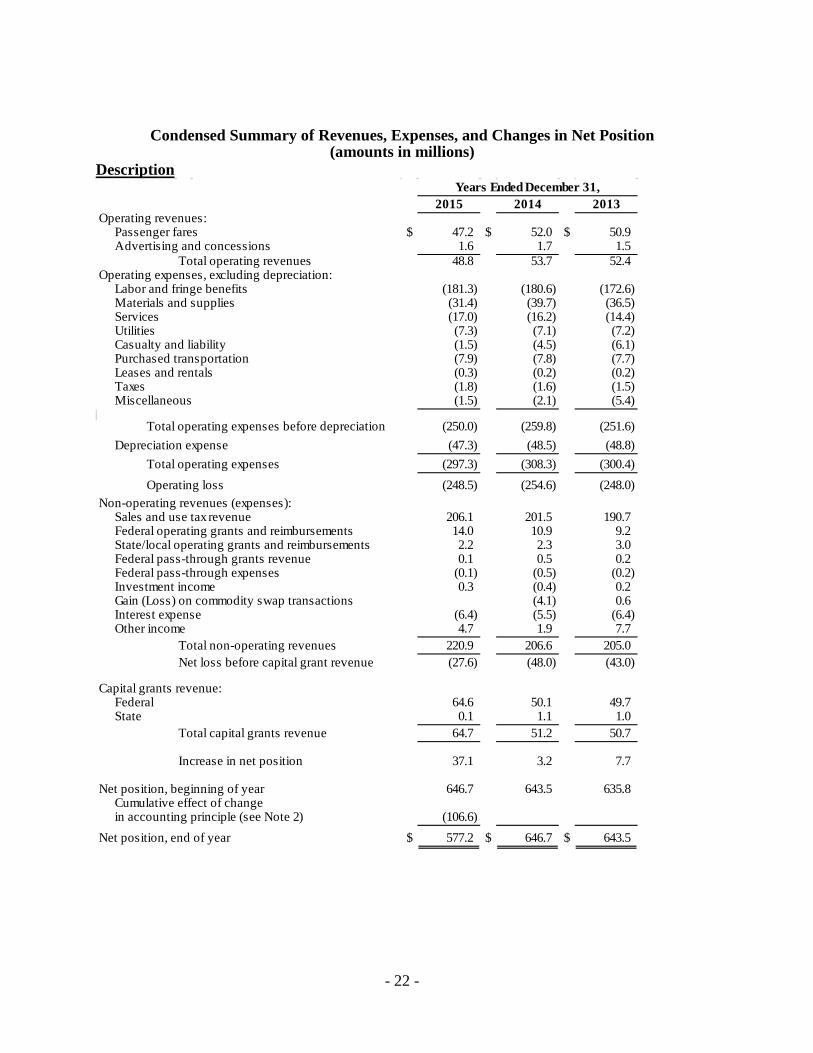
Condensed Summary of Revenues, Expenses, and Changes in Net Position (amounts in millions)
Description
2015 2014 2013Operating revenues:
Passenger fares $ 47.2 $ 52.0 $ 50.9Advertising and concessions 1.6 1.7 1.5
Total operating revenues 48.8 53.7 52.4Operating expenses, excluding depreciation:
Labor and fringe benefits (181.3) (180.6) (172.6)Materials and supplies (31.4) (39.7) (36.5)Services (17.0) (16.2) (14.4)Utilities (7.3) (7.1) (7.2)Casualty and liability (1.5) (4.5) (6.1)Purchased transportation (7.9) (7.8) (7.7)Leases and rentals (0.3) (0.2) (0.2)Taxes (1.8) (1.6) (1.5)Miscellaneous (1.5) (2.1) (5.4)
Total operating expenses before depreciation (250.0) (259.8) (251.6)Depreciation expense (47.3) (48.5) (48.8)
Total operating expenses (297.3) (308.3) (300.4)Operating loss (248.5) (254.6) (248.0)
Non-operating revenues (expenses):Sales and use tax revenue 206.1 201.5 190.7Federal operating grants and reimbursements 14.0 10.9 9.2State/local operating grants and reimbursements 2.2 2.3 3.0Federal pass-through grants revenue 0.1 0.5 0.2Federal pass-through expenses (0.1) (0.5) (0.2)Investment income 0.3 (0.4) 0.2Gain (Loss) on commodity swap transactions (4.1) 0.6Interest expense (6.4) (5.5) (6.4)Other income 4.7 1.9 7.7
Total non-operating revenues 220.9 206.6 205.0Net loss before capital grant revenue (27.6) (48.0) (43.0)
Capital grants revenue:Federal 64.6 50.1 49.7State 0.1 1.1 1.0
Total capital grants revenue 64.7 51.2 50.7
Increase in net position 37.1 3.2 7.7
Net position, beginning of year 646.7 643.5 635.8Cumulative effect of changein accounting principle (see Note 2) (106.6)
Net position, end of year $ 577.2 $ 646.7 $ 643.5
Years Ended December 31,

- 23 -
FINANCIAL OPERATING RESULTS
Revenues Passenger Fares – Farebox receipts and special transit fares are included within this caption.
Passenger fare revenue for the year ended December 31, 2015 decreased by $4.8 million (9.2%) compared with that from year ended December 31, 2014. This decrease is attributed to a decline in ridership resulting from lower gasoline prices during 2015. Total ridership declined from 49.3 million in the year ended December 31, 2014 to 47 million in the year ended December 31, 2015.
Passenger fare revenue for the year ended December 31, 2014 increased by $1.1 million (2.2%) compared with that from year ended December 31, 2013. This increase is a result of the growth in the economy and increased hiring in the area which led to an increase in total ridership from 49.2 million in the year ended December 31, 2013 to 49.3 million in the year ended December 31, 2014.
Sales and Use Tax – The dedicated 1% tax levied in Cuyahoga County is part of the 8.00% overall
tax on retail sales which changed from 7.75% effective September 2013. Sales and use tax revenue accounted for 74.7% of the Authority’s revenue for year ended December 31, 2015. Sales and use tax revenue accounted for 74.5% of the Authority’s revenue for year ended December 31, 2014, and for 72.4% for year ended December 31, 2013.
Revenue received from sales and use tax for the year ended December 31, 2015 increased approximately $4.6 million (2.3%) compared to $10.8 million (5.7%) increase in the year ended December 31, 2014 from the year ended December 31, 2013. This increase was a result of increased spending in the economy.
Federal Operating Grants and Reimbursements – The Authority receives preventive
maintenance reimbursement funds to cover the costs of certain inventory purchases and maintenance costs incurred. For the years ended December 31, 2015, 2014 and 2013, the Authority received approximately $ 14 million, $10.9 million, and $9.2 million respectively.
State/Local Operating Grants and Reimbursements – The Ohio Department of Transportation (ODOT) allocates grants for operating assistance and elderly and handicapped programs. This category also includes reimbursement for state fuel taxes paid by the Authority. In the year ended December 31, 2015, the Authority received $2.2 million in this category, a (4.3%) decrease from the year ended December 31, 2014. In the year ended December 31, 2014, the Authority received $2.3 million in this category, a (23.3%) decrease from the year ended December 31, 2013.
Investment Income – Investment income increased by $676,219 (174.7%) in year ended December
31, 2015, compared to a decrease of $597,381 (284.1%) in the year ended December 31, 2014. This increase was attributed to more investments and higher investment rates.
Other Income – Other income increased by $2,733,665 in the year ended December 31, 2015,
compared to a decrease of $5,838,363 in the year ended December 31, 2014. This increase was a result of higher unrealized gains in fuel hedge costs for the year ended December 31, 2015.

- 24 -
Millions of Dollars
2015 2014 Amount PercentFares $47.2 $52.0 ($4.8) (9.2) %Advertising and concessions 1.6 1.7 (0.1) (5.9) Sales and use tax 206.1 201.5 4.6 2.3 Federal operating grants 14.0 10.9 3.1 28.3 State/local operating grants 2.2 2.3 (0.1) (4.3) Federal pass-through grants 0.1 0.5 (0.4) (80.0) Investment income (loss) 0.3 (0.4) 0.7 (175.0) Other income 4.7 1.9 2.8 (147.4) Total $276.2 $270.4 $5.8 $2.1 %
Revenue
Increase/(Decrease)
($50.0)
$0.0
$50.0
$100.0
$150.0
$200.0
$250.0
Fares Advertising andconcessions
Sales and use tax Federaloperating grants
State/localoperating grants
Federal pass-through grants
Investmentincome (loss)
Other income
2015 2014
Fares19%
Advertising and Concessions
1%
Sales and Use Tax74%
Federal Operating Grants
4%
State Operating Grants
1%
Federal Pass-Through Grants
1%
Investment Income-1%
1%
2014
Fares17%
Advertising and Concessions
1%
Sales and Use Tax74%
Federal Operating Grants
5%
State Operating Grants
1%Investment Income
1%Other Income
1%
2015
- 25 -
Expenses Labor and Fringe Benefits: The personnel and related costs decreased by $14.8 million (8.2%) in the year ended December 31, 2015, compared to that of the year ended December 31, 2014. This increase relates to the implementation of GASB 68, which defers 2015 pension expense until 2016. During 2015, the number of personnel (FTE’s) increased to 2,128, compared to 2,108 for the year ended December 31, 2014. The personnel and related costs increased by $8 million (19.9%) in the year ended December 31, 2014, compared to that of the year ended December 31, 2013. During 2014, the number of personnel (FTE’s) increased to 2,108, compared to 2,033 for the year ended December 31, 2013, which offset the cost of providing health care benefits. Materials and Supplies: The costs in this category decreased by $8.3 million (20.9%) in the year ended December 31, 2015, compared to the year ended December 31, 2014. Due to the diesel fuel commodities program implemented over the years, the Authority has had significant cost savings in periods of rising fuel costs until the prior year. During 2015, however, diesel cost prices began to recover and improved compared to the prior year and the outstanding contract prices. Services: The costs in this category increased by $.8 million (4.9%) in the year December 31, 2015, compared to the year ended December 31, 2014. The increase is due to increased costs for workers’ compensation administration and maintenance contracts. The costs in this category increased by $1.8 million (12.4%) in the year December 31, 2014, compared to the year ended December 31, 2013. The increase is due to increased costs for workers’ compensation administration and maintenance contracts. Casualty and Liability: These costs decreased by $3.1 million (65.3%) for year ended December 31, 2015 compared to the year ended December 31, 2014, which was due to lower claims in 2015 versus 2014. These costs decreased by $1.5 million (24.6%) in 2014 compared to 2013 due to lower claims in 2014. Casualty and liability claims are recorded based on actuarial studies performed for both 2015 and 2014.

- 26 -
2015 2014 Amount PercentLabor $116.2 $113.6 $2.6 2.3 %Fringe benefits 65.2 67.0 (1.8) (2.7)Materials & supplies 31.4 39.7 (8.3) (20.9)Services 17.0 16.2 0.8 4.9Utilities 7.3 7.1 0.2 2.8 Casualty & liability 1.5 4.6 (3.1) (67.4)Purchased transportation 7.9 7.8 0.1 1.3Leases & rentals 0.3 0.2 0.1 50.0Taxes 1.8 1.6 0.2 12.5 Federal pass-through expenses 0.1 0.5 (0.4) (80.0)Interest 6.4 5.5 0.9 16.4Depreciation 47.3 48.5 (1.2) (2.5)Loss on commodity swap 4.1 (4.1) (100.0)Miscellaneous 1.5 2.1 (0.6) (28.6)Total $303.9 $318.5 ($14.6) (4.6) %
Millions of DollarsExpenses by Object Class
Increase/(Decrease)
Labor36%
Fringe Benefits21%
Materials & Supplies12%
Services5%
Utilities2%
Cas. & Liability1%
Purch Transp2%
Leases & rentals1% Taxes
1%
Fed. Pass-Through Expenses
1%Interest
1%
Deprec.15%
Loss on commodity swap1% Misc.
1%
2014
$0.0
$20.0
$40.0
$60.0
$80.0
$100.0
$120.0
Labor Fringe benefitsMaterials & suppliesServices Utilities Casualty & liabilityPurchased transportationLeases & rentals TaxesFederal pass-through expensesInterest DepreciationLoss on commodity swapMiscellaneous
2015 2014
Labor38%
Fringe Benefits21%
Materials & Supplies
10%
Services6%
Utilities2%
Cas. & Liability1%
Purch Transp3%
Taxes1%
Interest2%
Deprec.16%
2015
- 27 -
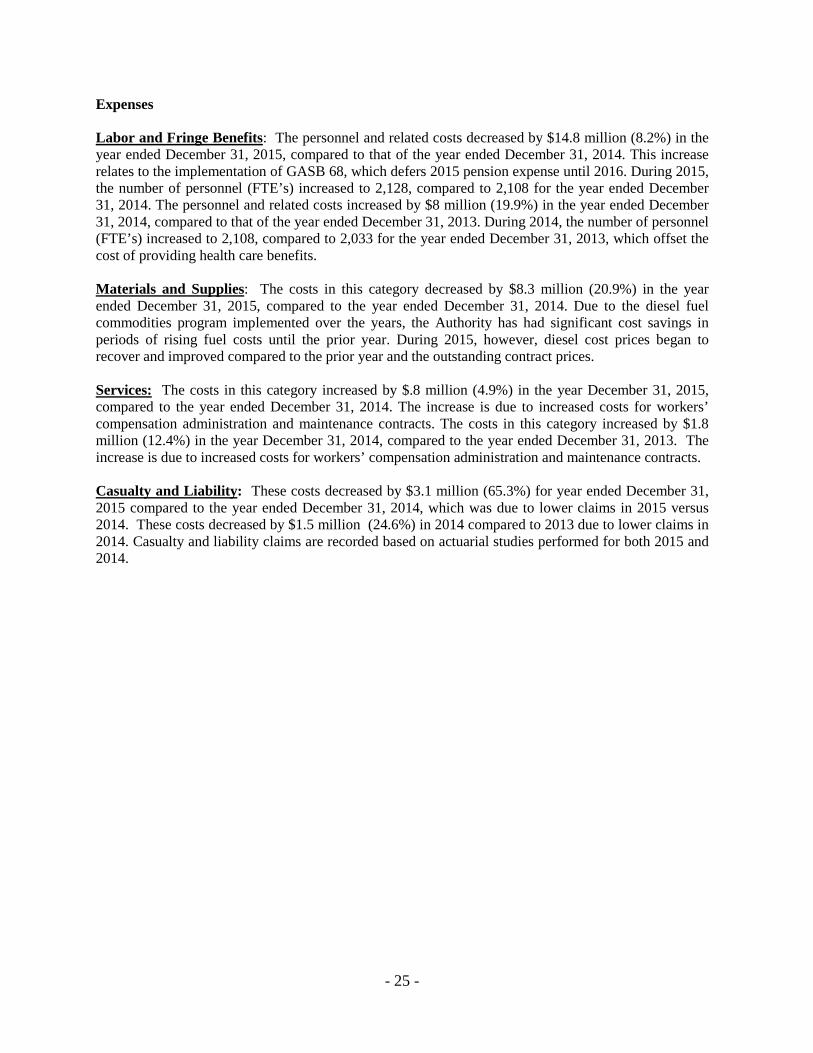
2015 2014 Amount Percent
Transportation $94.8 $102.9 ($8.1) (7.9) %Maintenance 88.2 88.6 (0.4) (0.5)General & administration 67.1 68.4 (1.3) (1.9)Depreciation 47.3 48.5 (1.2) (2.5)Pass-through expenses 0.1 0.5 (0.4) (80.0)Interest 6.4 5.5 0.9 16.4Loss on commodity swap 4.1 (4.1) (100.0)Total $303.9 $318.5 ($14.6) (4.6) %
Increase/(Decrease)
Expenses by FunctionMillions of Dollars
$0.0
$20.0
$40.0
$60.0
$80.0
$100.0
$120.0
Transportation Maintenance General &administration
Depreciation Pass-throughexpenses
Interest Loss oncommodity swap
2015 2014
Transportation32.0%
Maintenance28.0%
General & Administration
21.0%
Depreciation15.0%
Pass-through Expenses
1.0%Interest2.0%
Loss on commodity
swap1.0%
2014
Transportation31.0%
Maintenance29.0%
General & Administration
22.0%
Depreciation16.0%
Interest2.0%
2015
- 28 -
Debt Administration The Authority has sold unvoted general obligation (capital improvement) bonds to partially finance the purchase and construction of various capital assets. Payment of debt service on the outstanding unvoted general obligation bonds of the Authority is secured by a pledge of all revenues of the Authority, except those specifically limited to another use or prohibited from that use by the Ohio Constitution (state or federal law, or any revenue bond trust agreement that the Authority might execute). In practice, debt service has been paid from the receipts of the Authority’s sales and use tax. Subject to the approval of the County Budget Commission, the debt service can also be paid, in the event it is not paid from other sources, from the proceeds of the levy by the Authority of ad valorem taxes within the ten-mill limitation provided by Ohio law. The Authority can also, with the approval of the voters within the territory of the Authority, issue general obligation bonds that, unless paid from other sources, are payable from the proceeds of the levy by the Authority of ad valorem taxes that are outside that ten-mill limitation. On March 17, 2015 the Authority issued $51,425,000 of sales tax supported capital improvement and refunding bonds. $21.4 million of these bonds were used to do a partial refunding of the 2008A outstanding debt and also to prepay the 2007 Master Tax Exempt lease. $30 million was issued to finance current and future capital improvement projects. The bonds bear interest rates ranging from 2% to 5% per annum, and mature in various installments through December 1, 2034. On April 16, 2014, the Authority issued $29,700,000 of sales tax supported capital improvement and refunding bonds. These bonds were used to do a partial refunding of the 2004 and 2006 outstanding debt. The bonds bear interest at rates ranging from 1% to 5.00% per annum, and mature in various installments through December 1, 2025. On June 7, 2012, the Authority issued $42,390,000 of sales tax supported refunding bonds. Of the $42,390,000, $25,000,000 was issued to finance current and future capital improvement projects and the remainder for the advance refunding of the 2004 debt. The bonds bear interest at rates ranging from 1.5% to 5.25% per annum, and mature in various installments though December 1, 2031. On September 12, 2008, the Authority issued $27,390,000 of general obligation capital improvement refunding bonds bearing interest at an average rate of 4.01% and payable through 2016. Proceeds of the bonds were used for the advance refunding of $27,555,000 of the 1998 capital improvement refunding bonds. The proceeds were placed in an irrevocable trust for the purpose of generating resources for all future debt service payments of the refunded debt. In addition, a $175,000 principal payment was made in 2008. On February 20, 2008, the Authority issued $35,000,000 of general obligation capital improvement bonds for the purpose of financing current and future capital improvement projects. The bonds bear interest at a rate ranging from 3.0% to 4.68% per annum, and mature in various installments through December 1, 2027.
On March 7, 2006, The Authority issued $38,490,000 of general obligation capital improvement and refunding bonds. Of the $38,490,000, $25,000,000 was issued to finance current and future capital improvement projects and the remainder for the advance refunding of previous issues. The bonds bear interest at rates ranging from 3.94% to 5.00% per annum, and mature in various installments through December 1, 2025. Proceeds of $14,146,326 were placed in an escrow trust fund for the purpose of generating resources for future debt services payments of the refunded debt.
On November 16, 2004, the Authority issued $67,235,000 of general obligation capital improvement and refunding bonds. Of the $67,235,000, $38,000,000 was issued to finance current and future

- 29 -
capital improvement projects and the remainder for the advance refunding of previous issues. The bonds bear interest at rates ranging from 2.0% to 5.0% per annum, and mature in various installments through December 1, 2024. Proceeds of $32,178,171 were placed in an escrow trust fund for the purpose of generating resources for future debt services payments of the refunded debt. The Authority had $18.7 million of outstanding capital improvement bonds as of December 31, 2015, of which $5.8 million is non-callable and $12.9 million is callable. The Authority general obligation debt is rated ‘Aa2’ by Moody’s Investors Service, Inc. and ‘AAA’ by Standard & Poors. The sales tax revenue bonds were rated AAA by S&P and Aa1 by Moody’s Investors Service, Inc. For more information, see Note 6 on page 46 of this report. Total outstanding bonds payable as of December 31, 2015 include:
December 31,Issue Maturity Original 2015 Average
Series Date Date Principal Balance Interest Rate
General Obligation Improvement Bonds
2004 11/16/04 12/01/2024 $ 67,235,000 $ 5,895,000 4.23%2006 03/07/06 12/01/2025 $ 38,490,000 1,260,000 4.51%2008 02/20/08 12/01/2027 $ 35,000,000 5,750,000 4.57%
General Obligation Improvement Refunding Bonds
Series 2008B (12/1/2008 Annually through 12/1/2016) $ 27,390,000 5,775,000 4.01%
Total General Obligation Bonds 18,680,000
Sales Tax Supported and Refunding Bonds
Series 2012 05/31/12 12/1/2031 $ 42,390,000 38,380,000 5.01%Series 2014A 04/16/14 12/1/2025 $ 13,360,000 13,360,000 4.50%Series 2014B 04/16/14 12/1/2020 $ 16,340,000 16,040,000 1.51%Series 2015 04/16/15 12/1/2031 $ 51,425,000 50,420,000 4.78%
Total Sales Tax Supported Bonds 118,200,000
Premium 19,202,969
Total Bonds Payable $ 156,082,969

- 30 -
Total outstanding bonds payable as of December 31, 2014 include:
December 31,Issue Maturity Original 2014 Average
Series Date Date Principal Balance Interest Rate
General Obligation Improvement Bonds
2004 11/16/04 12/01/2024 $ 67,235,000 $ 11,515,000 4.23%2006 03/07/06 12/01/2025 $ 38,490,000 2,460,000 4.51%2008 02/20/08 12/01/2027 $ 35,000,000 29,680,000 4.57%
General Obligation Improvement Refunding Bonds
Series 2008B (12/1/2008 Annually through 12/1/2016) $ 27,390,000 11,310,000 4.01%
Total General Obligation Bonds 54,965,000
Sales Tax Supported and Refunding Bonds
Series 2012 05/31/12 12/1/2031 $ 42,390,000 39,270,000 5.01%Series 2014A 04/16/14 12/1/2025 $ 13,360,000 13,360,000 4.50%Series 2014B 04/16/14 12/1/2020 $ 16,340,000 16,340,000 1.51%
Total Sales Tax Supported Bonds 68,970,000
Premium 11,899,194
Total Bonds Payable $ 135,834,194
Request for Information This financial report is designed to provide a general overview of the Authority’s finances for those with an interest in the finances of the Authority. Questions concerning any of the information in this report or requests for additional financial information should be addressed to the Deputy General Manager of Finance & Administration, Greater Cleveland Regional Transit Authority, 1240 W. 6th Street, Cleveland, Ohio 44113.

Assets and Deferred Outflows of Resources 2015 2014
Current Assets:Cash and cash equivalents 7,124,859$ 4,649,684$
Restricted for capital assets:Cash and cash equivalents 5,204,588 20,933,998 Investments 3,999,311
Restricted for debt service:Cash and cash equivalents 2,273,403 1,775,683
Receivables:Sales & use tax 54,354,396 54,073,150 Trade & accrued interest (net of allowances) 2,719,164 4,684,544 Naming rights - current portion 497,901 493,900 State capital assistance 1,160,174 102,754 Federal capital assistance 6,160,147 3,000,448
Material & supplies inventory 12,637,688 10,523,017 Deposits & Other Assets 1,840,680 567,358
Total current assets 93,973,000 104,803,847
Non-current Assets:Restricted for capital assets:
Investments 19,393,385 1,993,760 Investments 31,441,340 29,983,045 Naming Rights 5,646,439 6,144,340
Total non-current assets 56,481,164 38,121,145
Capital assets:Land 37,813,005 37,812,954 Infrastructure 63,461,761 63,461,761 Right-of-ways 309,263,778 308,716,518 Buildings, improvments, furniture & fixtures 546,140,010 537,705,702 Transportation & other equipment 470,713,252 441,897,992 Bus rapid transit 163,101,897 163,026,991 Construction in progress 59,521,569 22,257,810
Total capital assets 1,650,015,272 1,574,879,728
Less : Accumulated depreciation (897,194,216) (853,019,480)
Capital assets - net 752,821,056 721,860,248
Total Assets 903,275,220 864,785,240
Total Deferred Outflows of Resources: Refunding; Commodity
Swap; Pension 32,939,333 4,418,415
Total Assets and Deferred Outflows of Resources 936,214,553$ 869,203,655$
The accompanying notes are an integral part of these financial statements
GREATER CLEVELAND REGIONAL TRANSIT AUTHORITY
Statements of Net Position
As of December 31, 2015 and 2014
- 31 -

Total Liabilities, Deferred Inflows of Resources, and Net Position 2015 2014
Current liabilities:
Accounts payable 8,128,711$ 6,978,477$
Contracts & other payables 8,928,917 3,365,369
Contract retainers 1,762,941 2,069,258
Interest payable - bonds 503,126 608,598
Accrued wages & benefits 9,978,465 10,202,674
Current portion - compensated absences 3,107,014 3,439,420
Current portion - long-term debt 16,975,000 17,111,846
Current portion - self-insurance liabilities 7,561,321 8,188,860
Current portion - unearned revenue 2,335,462 2,370,729
Current portion - commodity transactions 4,056,213
Total current liabilities 59,280,957 58,391,444
Non-current liabilities
Compensated absences 6,927,218 6,767,007
Long term debt 139,107,969 133,153,266
Self-insurance liabilities 14,042,453 15,207,884
Net Pension Liability - OPERS 124,832,903
Unearned revenue 5,646,439 6,144,340
Commodity transactions 1,831,049
Other Long Term Liabilities 995,657 995,656
Total non-current liabilities 291,552,639 164,099,202
Total liabilities 350,833,596 222,490,646
Deferred Inflows of Resources :
Total Deferred Inflows of Resources: Commodity Swap;
Pension 8,206,309
Total Liability and Deferred Inflows of Resources 359,039,905 222,490,646
Net Position
Net Investment in Capital Assets 601,570,618 576,013,551
Restricted for Capital Projects 27,276,099 33,960,795
Restricted for Debt Service 23,487,458 1,362,967
Unrestricted (75,159,527) 35,375,696
Total net position 577,174,648 646,713,009 Total Liabilities, Deferred Inflows of Resources, and Net
Position 936,214,553$ 869,203,655$
The accompanying notes are an integral part of these financial statements
GREATER CLEVELAND REGIONAL TRANSIT AUTHORITY
Statements of Net Position
As of December 31, 2015 and 2014
(Continued)
- 32 -
2015 2014
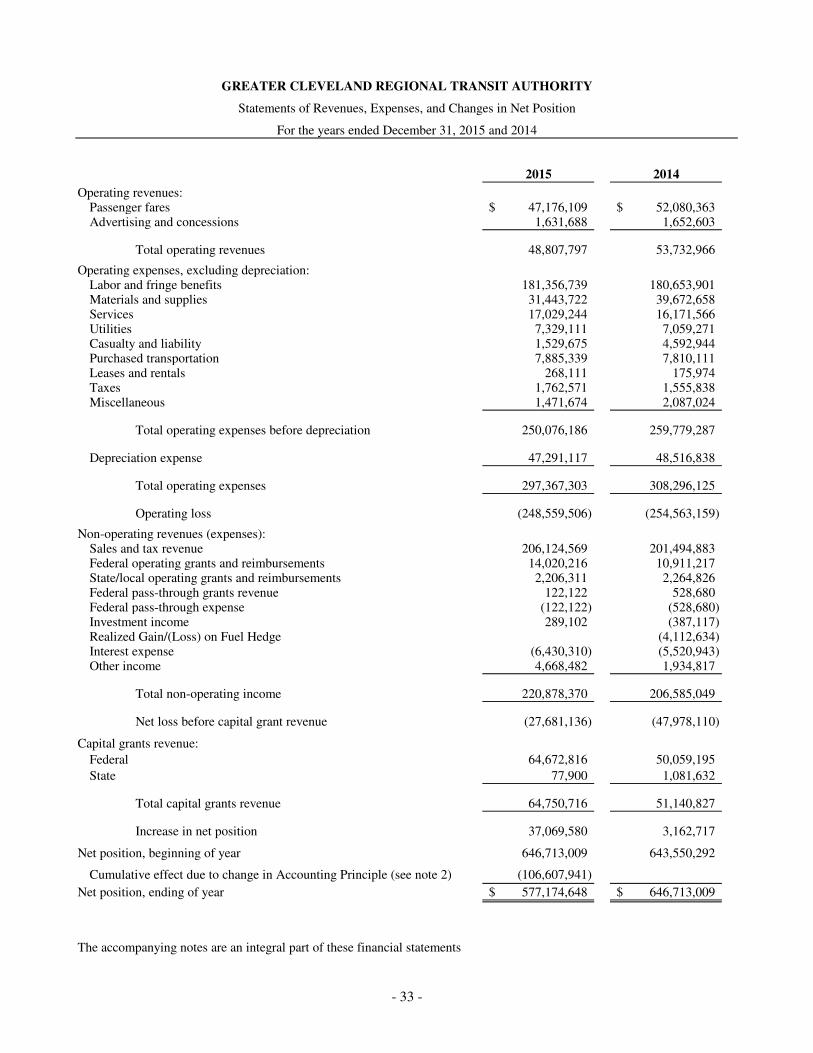
Operating revenues:Passenger fares 47,176,109$ 52,080,363$ Advertising and concessions 1,631,688 1,652,603
Total operating revenues 48,807,797 53,732,966
Operating expenses, excluding depreciation:Labor and fringe benefits 181,356,739 180,653,901 Materials and supplies 31,443,722 39,672,658 Services 17,029,244 16,171,566 Utilities 7,329,111 7,059,271 Casualty and liability 1,529,675 4,592,944 Purchased transportation 7,885,339 7,810,111 Leases and rentals 268,111 175,974 Taxes 1,762,571 1,555,838 Miscellaneous 1,471,674 2,087,024
Total operating expenses before depreciation 250,076,186 259,779,287
Depreciation expense 47,291,117 48,516,838
Total operating expenses 297,367,303 308,296,125
Operating loss (248,559,506) (254,563,159)
Non-operating revenues (expenses):Sales and tax revenue 206,124,569 201,494,883 Federal operating grants and reimbursements 14,020,216 10,911,217 State/local operating grants and reimbursements 2,206,311 2,264,826 Federal pass-through grants revenue 122,122 528,680 Federal pass-through expense (122,122) (528,680) Investment income 289,102 (387,117) Realized Gain/(Loss) on Fuel Hedge (4,112,634) Interest expense (6,430,310) (5,520,943) Other income 4,668,482 1,934,817
Total non-operating income 220,878,370 206,585,049
Net loss before capital grant revenue (27,681,136) (47,978,110)
Capital grants revenue:
Federal 64,672,816 50,059,195
State 77,900 1,081,632
Total capital grants revenue 64,750,716 51,140,827
Increase in net position 37,069,580 3,162,717
Net position, beginning of year 646,713,009 643,550,292
Cumulative effect due to change in Accounting Principle (see note 2) (106,607,941)
Net position, ending of year 577,174,648$ 646,713,009$
The accompanying notes are an integral part of these financial statements
GREATER CLEVELAND REGIONAL TRANSIT AUTHORITY
Statements of Revenues, Expenses, and Changes in Net Position
For the years ended December 31, 2015 and 2014
- 33 -

GREATER CLEVELAND REGIONAL TRANSIT AUTHORITY NOTES TO FINANCIAL STATEMENTS
FOR THE YEARS ENDED DECEMBER 31, 2015 AND 2014
- 36 -
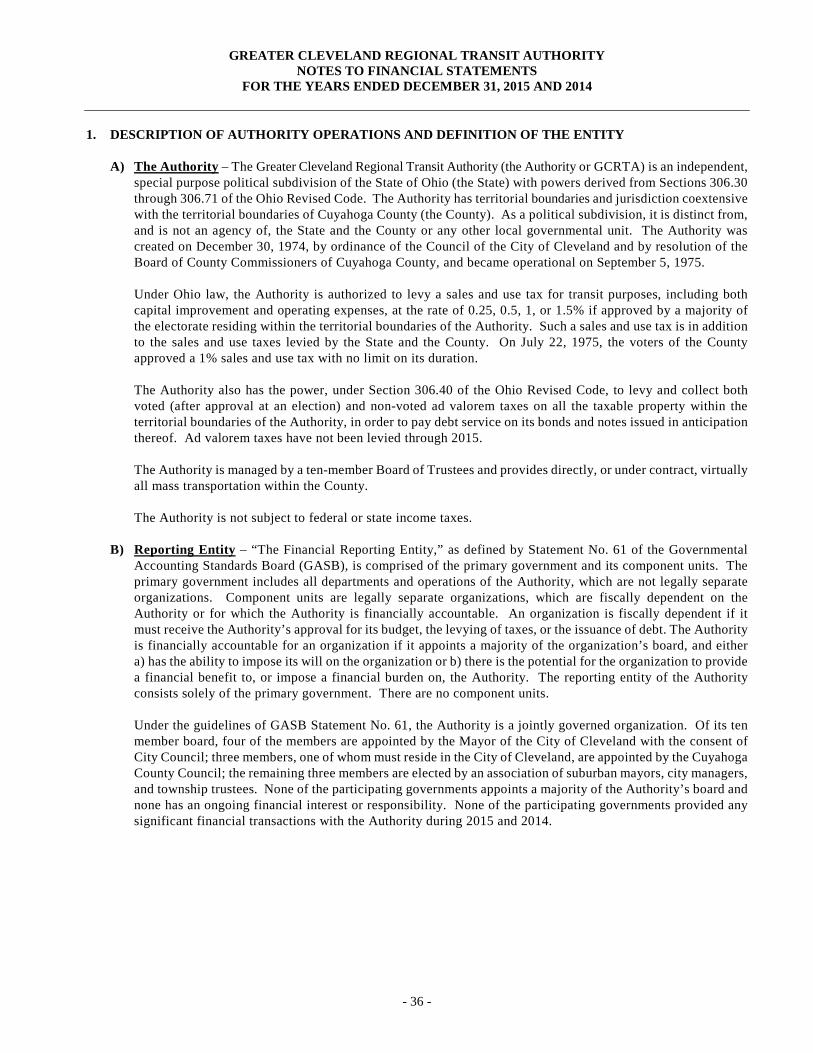
1. DESCRIPTION OF AUTHORITY OPERATIONS AND DEFINITION OF THE ENTITY
A) The Authority – The Greater Cleveland Regional Transit Authority (the Authority or GCRTA) is an independent, special purpose political subdivision of the State of Ohio (the State) with powers derived from Sections 306.30 through 306.71 of the Ohio Revised Code. The Authority has territorial boundaries and jurisdiction coextensive with the territorial boundaries of Cuyahoga County (the County). As a political subdivision, it is distinct from, and is not an agency of, the State and the County or any other local governmental unit. The Authority was created on December 30, 1974, by ordinance of the Council of the City of Cleveland and by resolution of the Board of County Commissioners of Cuyahoga County, and became operational on September 5, 1975.
Under Ohio law, the Authority is authorized to levy a sales and use tax for transit purposes, including both
capital improvement and operating expenses, at the rate of 0.25, 0.5, 1, or 1.5% if approved by a majority of the electorate residing within the territorial boundaries of the Authority. Such a sales and use tax is in addition to the sales and use taxes levied by the State and the County. On July 22, 1975, the voters of the County approved a 1% sales and use tax with no limit on its duration.
The Authority also has the power, under Section 306.40 of the Ohio Revised Code, to levy and collect both
voted (after approval at an election) and non-voted ad valorem taxes on all the taxable property within the territorial boundaries of the Authority, in order to pay debt service on its bonds and notes issued in anticipation thereof. Ad valorem taxes have not been levied through 2015.
The Authority is managed by a ten-member Board of Trustees and provides directly, or under contract, virtually all mass transportation within the County.
The Authority is not subject to federal or state income taxes.
B) Reporting Entity – “The Financial Reporting Entity,” as defined by Statement No. 61 of the Governmental
Accounting Standards Board (GASB), is comprised of the primary government and its component units. The primary government includes all departments and operations of the Authority, which are not legally separate organizations. Component units are legally separate organizations, which are fiscally dependent on the Authority or for which the Authority is financially accountable. An organization is fiscally dependent if it must receive the Authority’s approval for its budget, the levying of taxes, or the issuance of debt. The Authority is financially accountable for an organization if it appoints a majority of the organization’s board, and either a) has the ability to impose its will on the organization or b) there is the potential for the organization to provide a financial benefit to, or impose a financial burden on, the Authority. The reporting entity of the Authority consists solely of the primary government. There are no component units.
Under the guidelines of GASB Statement No. 61, the Authority is a jointly governed organization. Of its ten member board, four of the members are appointed by the Mayor of the City of Cleveland with the consent of City Council; three members, one of whom must reside in the City of Cleveland, are appointed by the Cuyahoga County Council; the remaining three members are elected by an association of suburban mayors, city managers, and township trustees. None of the participating governments appoints a majority of the Authority’s board and none has an ongoing financial interest or responsibility. None of the participating governments provided any significant financial transactions with the Authority during 2015 and 2014.
GREATER CLEVELAND REGIONAL TRANSIT AUTHORITY NOTES TO FINANCIAL STATEMENTS
FOR THE YEARS ENDED DECEMBER 31, 2015 AND 2014
- 37 -
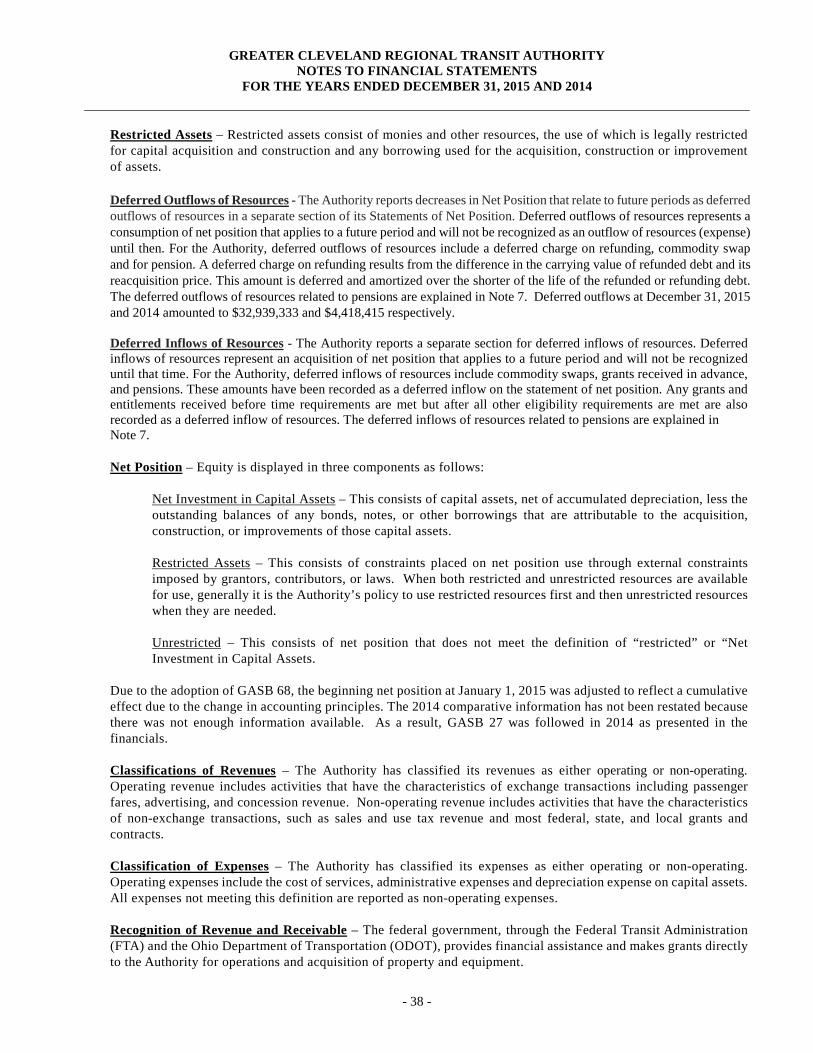
2. SUMMARY OF SIGNIFICANT ACCOUNTING POLICIES
The significant accounting policies followed in the preparation of these financial statements are summarized below. These policies conform to United States of America’s generally accepted accounting principles (GAAP) for local governmental units as prescribed in the statements issued by the GASB and other recognized authoritative sources.
Basis of Accounting – The accounts of the Authority, which are organized as an enterprise fund, are used to account for the Authority’s activities that are financed and operated in a manner similar to a private business enterprise. Accordingly, the Authority maintains its records on the accrual basis of accounting. Revenues from operations, investments, and other sources are recorded when earned. Expenses (including depreciation and amortization) of providing services to the public are accrued when incurred. Non-exchange transactions, in which the Authority receives value without directly giving equal value in return, include sales tax revenue and grants. Revenue from grants is recognized in the fiscal year in which all eligibility requirements have been satisfied. Eligibility requirements include timing requirements, which specify the year when the resources are required to be used or the fiscal year when use is first permitted, and expense requirements, in which the resources are provided to the Authority on a reimbursement basis.
Cash and Cash Equivalents – For purposes of the statements of cash flows, the Authority considers all highly liquid investments (including restricted assets) with a maturity of three months or less when purchased to be cash equivalents.
Investments – Investments are reported at fair value based on quoted market prices or market prices provided by
recognized broker dealers. Materials and Supplies Inventory – Materials and supplies inventory are stated at the lower of average cost or
fair value. Inventory generally consists of maintenance parts and supplies for rolling stock and other transportation equipment. In accordance with industry practice, all inventories are classified as current assets even though a portion of the inventories are not expected to be utilized within one year.
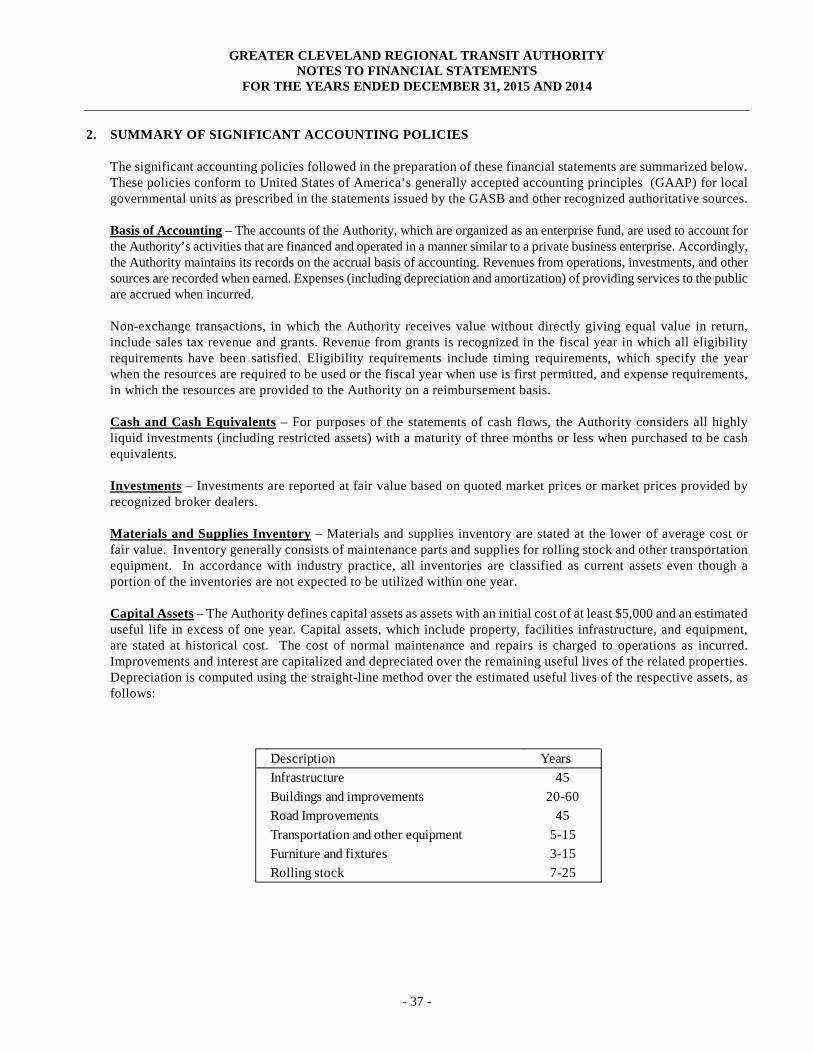
Capital Assets – The Authority defines capital assets as assets with an initial cost of at least $5,000 and an estimated
useful life in excess of one year. Capital assets, which include property, facilities infrastructure, and equipment, are stated at historical cost. The cost of normal maintenance and repairs is charged to operations as incurred. Improvements and interest are capitalized and depreciated over the remaining useful lives of the related properties. Depreciation is computed using the straight-line method over the estimated useful lives of the respective assets, as follows:
Description YearsInfrastructure 45Buildings and improvements 20-60Road Improvements 45Transportation and other equipment 5-15Furniture and fixtures 3-15Rolling stock 7-25
GREATER CLEVELAND REGIONAL TRANSIT AUTHORITY NOTES TO FINANCIAL STATEMENTS
FOR THE YEARS ENDED DECEMBER 31, 2015 AND 2014
- 38 -
Restricted Assets – Restricted assets consist of monies and other resources, the use of which is legally restricted for capital acquisition and construction and any borrowing used for the acquisition, construction or improvement of assets.
Deferred Outflows of Resources - The Authority reports decreases in Net Position that relate to future periods as deferred outflows of resources in a separate section of its Statements of Net Position. Deferred outflows of resources represents a consumption of net position that applies to a future period and will not be recognized as an outflow of resources (expense) until then. For the Authority, deferred outflows of resources include a deferred charge on refunding, commodity swap and for pension. A deferred charge on refunding results from the difference in the carrying value of refunded debt and its reacquisition price. This amount is deferred and amortized over the shorter of the life of the refunded or refunding debt. The deferred outflows of resources related to pensions are explained in Note 7. Deferred outflows at December 31, 2015 and 2014 amounted to $32,939,333 and $4,418,415 respectively.
Deferred Inflows of Resources - The Authority reports a separate section for deferred inflows of resources. Deferred inflows of resources represent an acquisition of net position that applies to a future period and will not be recognized until that time. For the Authority, deferred inflows of resources include commodity swaps, grants received in advance, and pensions. These amounts have been recorded as a deferred inflow on the statement of net position. Any grants and entitlements received before time requirements are met but after all other eligibility requirements are met are also recorded as a deferred inflow of resources. The deferred inflows of resources related to pensions are explained in Note 7.
Net Position – Equity is displayed in three components as follows:
Net Investment in Capital Assets – This consists of capital assets, net of accumulated depreciation, less the outstanding balances of any bonds, notes, or other borrowings that are attributable to the acquisition, construction, or improvements of those capital assets.
Restricted Assets – This consists of constraints placed on net position use through external constraints imposed by grantors, contributors, or laws. When both restricted and unrestricted resources are available for use, generally it is the Authority’s policy to use restricted resources first and then unrestricted resources when they are needed. Unrestricted – This consists of net position that does not meet the definition of “restricted” or “Net Investment in Capital Assets.
Due to the adoption of GASB 68, the beginning net position at January 1, 2015 was adjusted to reflect a cumulative effect due to the change in accounting principles. The 2014 comparative information has not been restated because there was not enough information available. As a result, GASB 27 was followed in 2014 as presented in the financials. Classifications of Revenues – The Authority has classified its revenues as either operating or non-operating. Operating revenue includes activities that have the characteristics of exchange transactions including passenger fares, advertising, and concession revenue. Non-operating revenue includes activities that have the characteristics of non-exchange transactions, such as sales and use tax revenue and most federal, state, and local grants and contracts. Classification of Expenses – The Authority has classified its expenses as either operating or non-operating. Operating expenses include the cost of services, administrative expenses and depreciation expense on capital assets. All expenses not meeting this definition are reported as non-operating expenses. Recognition of Revenue and Receivable – The federal government, through the Federal Transit Administration (FTA) and the Ohio Department of Transportation (ODOT), provides financial assistance and makes grants directly to the Authority for operations and acquisition of property and equipment.
GREATER CLEVELAND REGIONAL TRANSIT AUTHORITY NOTES TO FINANCIAL STATEMENTS
FOR THE YEARS ENDED DECEMBER 31, 2015 AND 2014
- 39 -
Operating grants and special fare assistance awards made on the basis of entitlement periods are recorded as grant receivable and revenues over the entitlement periods. Capital grants for the acquisition of property and equipment (reimbursement type grants) are recorded as grant receivables and non-operating revenues when the related capital expenses are incurred. Capital grants for the maintenance of property, plant and equipment are recorded as grants receivable and non-operating revenues in the period operating expenses are incurred. Capital grants received in advance of project costs being incurred are reported as deferred inflows. The Sales and Use Tax receivable is recorded in the month the vendor submits the tax to the State of Ohio. There is a three-month delay between the collection of the Sales and Use Tax to the State of Ohio and the remittance to the Authority.
When assets acquired with capital grants funds are disposed of, the Authority is required to notify the granting federal agency. A proportional amount of the proceeds or fair market value, if any, of such property and equipment may be used to acquire like-kind replacement vehicles or remitted to the granting federal agency.
Consignment of Fare Media – The Authority has sales agreements with local businesses to sell fare media on its behalf for a commission fee ranging from $.05 to $.65 based on the type of fare media sold. Fare media is on consignment with these businesses. Proceeds from the sale of the fare media and any unsold fare media are returned to the Authority. In addition, the Authority has agreements with local companies under its “Commuter Advantage” Program, where the companies’ employees can sign up to purchase monthly passes using pre-tax dollars. In 2015, approximately 14,200 employees from 763 local organizations participated in the program. In 2014, approximately 14,030 employees from 737 local organizations participated in the program. Federal and State Operating and Preventive Maintenance Assistance Funds – Federal and state operating and preventive maintenance assistance funds to be received by the Authority under the Urban Mass Transportation Act of 1964, as amended, and under the Ohio Public Mass Transportation Grant Program are recorded and reflected as income in the period to which they are applicable. Compensated Absences – The Authority accrues vacation benefits as earned by its employees. Unused vacation benefits are paid to the employees upon separation from service up to a maximum of 50 days. The sick leave liability includes employees who are currently eligible to receive termination benefits, based on accumulated sick leave and employee wage rates at year-end taking into consideration any limits specified by in the Authority’s termination policies.
Self-Insurance Liabilities and Expense – The Authority has a self-insurance program for third-party bodily injury liability, third-party property damage claims, and workers’ compensation claims. For workers’ compensation claims awarded, the Authority pays the same benefits as would be paid by the State of Ohio Bureau of Workers’ Compensation.
2015 2014 Beginning Balance $ 10,206,427 $ 10,197,897 Incurred 9,055,893 8,096,548 Payments (9,228,088) (8,088,018) Balance, End of Year $ 10,034,232 $ 10,206,427 Due Within One Year $ 3,107,014 $ 3,439,420

GREATER CLEVELAND REGIONAL TRANSIT AUTHORITY NOTES TO FINANCIAL STATEMENTS
FOR THE YEARS ENDED DECEMBER 31, 2015 AND 2014
- 40 -
These programs are administered by the Authority. Claims are accrued in the year the expenses are incurred, based upon the estimates of the claim liabilities made by management, legal counsel of the Authority, and actuaries. Permanent total disability claims are discounted at an annual rate of 2%. Also provided for are estimates of claims incurred during the year but not yet reported. Claims expense is accrued in the period the incidents of loss occur, based upon estimates of liability made by management with the assistance of third-party administrators, legal counsel, and actuaries. Passenger Fares – Passenger fares are recorded as revenue at the time services are performed. Estimates – The preparation of financial statements in conformity with the United States generally accepted accounting principles requires management to make estimates and assumptions that affect the reported amounts of assets and liabilities and disclosure of contingent assets and liabilities at the date of the financial statements and the reported amounts of revenues and expenses during the reporting period. Actual results could differ from those estimates.
New Accounting Pronouncements and Change in Accounting Principle - For fiscal year 2015, the Authority implemented the Governmental Accounting Standards Board (GASB) Statement No. 68, "Accounting and Financial Reporting for Pensions" and GASB Statement No. 71, "Pensions Transition for Contributions Made Subsequent to the Measurement Date — an amendment of GASB Statement No. 68." GASB 68 established standards for measuring and recognizing pension liabilities, deferred outflows of resources, deferred inflow of resources, and expenses. The implementation of these pronouncements had the following effect on net position as reported December 31, 2014:
3. CASH, CASH EQUIVALENTS, AND INVESTMENTS
The following is a listing of deposits and investments held by the Authority at December 31, 2015 and 2014:
2015 2014 Demand deposits $ 14,416,555 $ 27,174,071 Cash on hand 186,295 185,295 Investments 50,834,725 35,976,116 Total $ 65,437,575 $ 63,335,482
Bank balance $ 17,113,390 $ 30,347,156
Net Position December 31, 2014 - as previously stated 646,713,009$ Adjustments:Pension Deferred Outflow-Payments made in 2014 15,564,981 Net Pension Liability - (See Note 7) (122,172,922) Net Position December 31, 2014 - restated 540,105,068$

GREATER CLEVELAND REGIONAL TRANSIT AUTHORITY NOTES TO FINANCIAL STATEMENTS
FOR THE YEARS ENDED DECEMBER 31, 2015 AND 2014
- 41 -
The deposits and investments of the Authority at December 31, 2015 and 2014 are reflected in the financial statements as follows:
The deposits and investments of the Authority are governed by the provisions of the Bylaws of the Authority and the Oho Revised Code. In accordance with these provisions, only banks located in Ohio and domestic savings and loan associations are eligible to hold public deposits. The provisions also permit the Authority to invest its monies in certificates of deposit, savings accounts, money market accounts, the state treasurer’s investment pool (STAROhio), and obligations of the United States government or certain agencies thereof. The Authority may also enter into repurchase agreements with any eligible dealer who is a member of the National Association of Securities Dealers for a period not exceeding 30 days.
Custodial Credit Risk of Bank Deposits
Custodial credit risk is the risk that in the event of bank failure, the Authority’s deposits may not be returned by the bank. Public depositories must give security for all public funds on deposit. These institutions may either specifically collateralize individual accounts in lieu of amounts insured by the Federal Deposit Insurance Corporation (FDIC) or may pledge a pool of government securities, the face value of which is at least 105% of the total value of public monies on deposit at the institution. Such collateral, as permitted by the Ohio Revised Code, is held in single financial institution collateral pools at Federal Reserve Banks, or at member banks of the federal reserve system, in the name of the respective depository bank and pledged as a pool of collateral against all of the public deposits it holds at the Federal Reserve Bank. At December 31, 2015, $16,363,390 of the Authority’s bank balance of $17,113,390 was uninsured and uncollateralized as defined by the GASB. At December 31, 2014, $29,597,156 of the Authority’s bank balance of $30,347,156 was uninsured and uncollateralized as defined by the GASB.
Custodial Credit Risk of Investments
Custodial credit risk is the risk that in the event of failure of the counterparty, the Authority will not be able to recover
the value of its investments or collateral securities that are in the possession of an outside party. The Authority is prohibited from investing in any financial instrument, contract, or obligation whose value or return is based upon or linked to another asset, or index, or both; separate from the financial instrument contract or obligation itself (commonly known as a “derivative”). The Authority is also prohibited from investing in reverse repurchase agreements. Repurchase agreements must be secured by the specific government securities upon which the repurchase agreements are based. These securities must be obligations of or guaranteed by the United States and mature or be redeemable within five years of the date of the related repurchase agreement. The fair value of the securities subject to a repurchase agreement must exceed the value of the principal by 2% and be marked to market daily. As of December 31, 2015 and 2014, the Authority has no investment policy dealing with investment custodial risk beyond the requirement in state statute that prohibits payment for investments prior to the delivery of the securities representing such investments to the qualified trustee. Interest Rate Risk
Interest rate risk is the risk that, over time, the value of investments will decrease as a result of a rise in interest rates. The Authority’s policy minimizes interest rate risk by requiring that all funds attempt to match its investments with
2015 2014Current Assets:
Cash and cash equivalents $ 7,124,859 $ 4,649,684Restricted Assets:
Cash and cash equivalents 7,477,991 22,709,682Investments 3,999,311
Noncurrent Assets:Investments 50,834,725 31,976,805
Total $ 65,437,575 $ 63,335,482
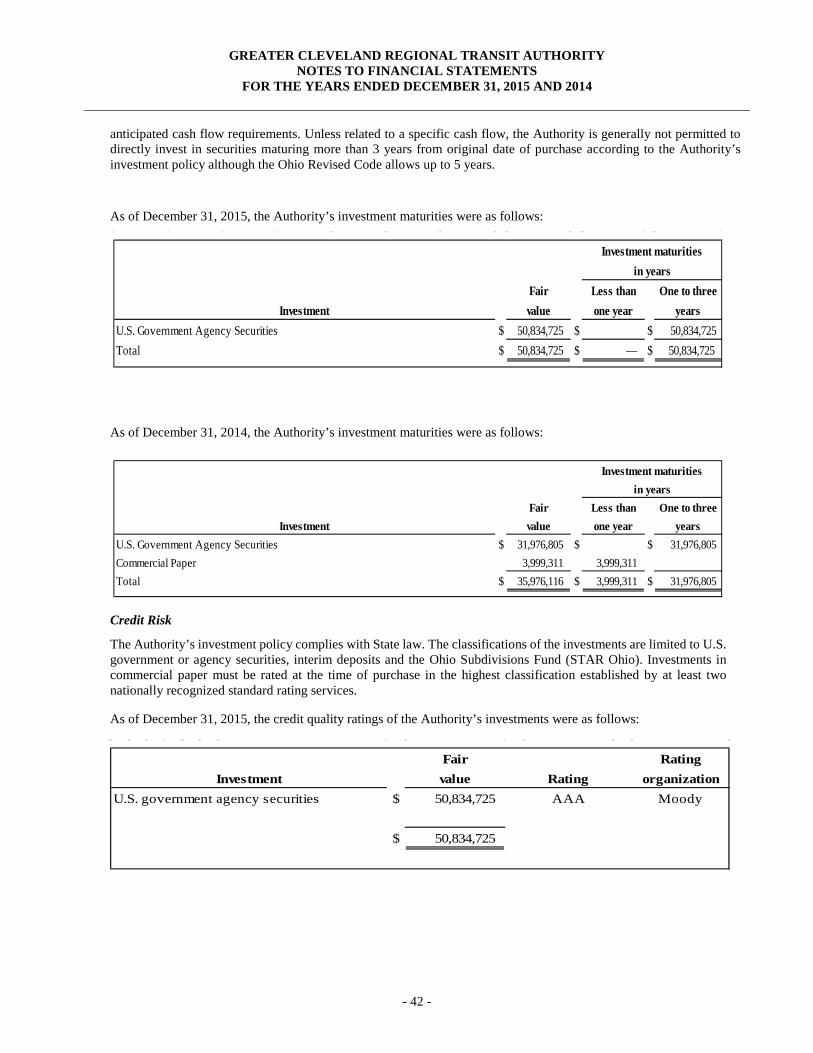
GREATER CLEVELAND REGIONAL TRANSIT AUTHORITY NOTES TO FINANCIAL STATEMENTS
FOR THE YEARS ENDED DECEMBER 31, 2015 AND 2014
- 42 -
anticipated cash flow requirements. Unless related to a specific cash flow, the Authority is generally not permitted to directly invest in securities maturing more than 3 years from original date of purchase according to the Authority’s investment policy although the Ohio Revised Code allows up to 5 years.
As of December 31, 2015, the Authority’s investment maturities were as follows:
As of December 31, 2014, the Authority’s investment maturities were as follows:
Credit Risk
The Authority’s investment policy complies with State law. The classifications of the investments are limited to U.S. government or agency securities, interim deposits and the Ohio Subdivisions Fund (STAR Ohio). Investments in commercial paper must be rated at the time of purchase in the highest classification established by at least two nationally recognized standard rating services.
As of December 31, 2015, the credit quality ratings of the Authority’s investments were as follows:
Fair Less than One to threeInvestment value one year years
U.S. Government Agency Securities $ 50,834,725 $ $ 50,834,725Total $ 50,834,725 $ — $ 50,834,725
Investment maturitiesin years
Fair Less than One to threeInvestment value one year years
U.S. Government Agency Securities $ 31,976,805 $ $ 31,976,805Commercial Paper 3,999,311 3,999,311 Total $ 35,976,116 $ 3,999,311 $ 31,976,805
Investment maturitiesin years
Fair RatingInvestment value Rating organization
U.S. government agency securities $ 50,834,725 AAA Moody
$ 50,834,725
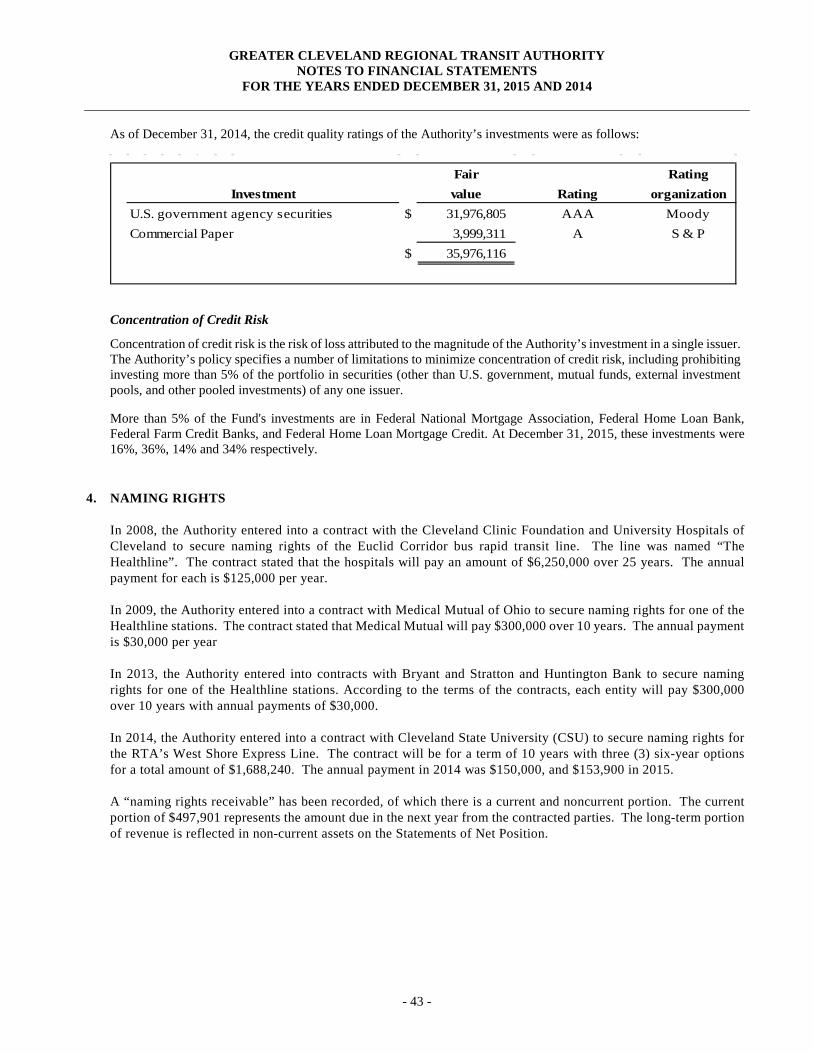
GREATER CLEVELAND REGIONAL TRANSIT AUTHORITY NOTES TO FINANCIAL STATEMENTS
FOR THE YEARS ENDED DECEMBER 31, 2015 AND 2014
- 43 -
As of December 31, 2014, the credit quality ratings of the Authority’s investments were as follows:
Concentration of Credit Risk
Concentration of credit risk is the risk of loss attributed to the magnitude of the Authority’s investment in a single issuer. The Authority’s policy specifies a number of limitations to minimize concentration of credit risk, including prohibiting investing more than 5% of the portfolio in securities (other than U.S. government, mutual funds, external investment pools, and other pooled investments) of any one issuer.
More than 5% of the Fund's investments are in Federal National Mortgage Association, Federal Home Loan Bank, Federal Farm Credit Banks, and Federal Home Loan Mortgage Credit. At December 31, 2015, these investments were 16%, 36%, 14% and 34% respectively.
4. NAMING RIGHTS
In 2008, the Authority entered into a contract with the Cleveland Clinic Foundation and University Hospitals of Cleveland to secure naming rights of the Euclid Corridor bus rapid transit line. The line was named “The Healthline”. The contract stated that the hospitals will pay an amount of $6,250,000 over 25 years. The annual payment for each is $125,000 per year.
In 2009, the Authority entered into a contract with Medical Mutual of Ohio to secure naming rights for one of the Healthline stations. The contract stated that Medical Mutual will pay $300,000 over 10 years. The annual payment is $30,000 per year
In 2013, the Authority entered into contracts with Bryant and Stratton and Huntington Bank to secure naming rights for one of the Healthline stations. According to the terms of the contracts, each entity will pay $300,000 over 10 years with annual payments of $30,000. In 2014, the Authority entered into a contract with Cleveland State University (CSU) to secure naming rights for the RTA’s West Shore Express Line. The contract will be for a term of 10 years with three (3) six-year options for a total amount of $1,688,240. The annual payment in 2014 was $150,000, and $153,900 in 2015. A “naming rights receivable” has been recorded, of which there is a current and noncurrent portion. The current portion of $497,901 represents the amount due in the next year from the contracted parties. The long-term portion of revenue is reflected in non-current assets on the Statements of Net Position.
Fair RatingInvestment value Rating organization
U.S. government agency securities $ 31,976,805 AAA MoodyCommercial Paper 3,999,311 A S & P
$ 35,976,116

GREATER CLEVELAND REGIONAL TRANSIT AUTHORITY NOTES TO FINANCIAL STATEMENTS
FOR THE YEARS ENDED DECEMBER 31, 2015 AND 2014
- 44 -
5. CAPITAL ASSETS Capital asset activity for the year ended December 31, 2015 was as follows:
Remaining costs to complete construction projects, as of December 31, 2015, which will extend over a period of several years, total $99.5 million. Approximately $73.2 million of these costs are eligible for reimbursement under approved capital grants. The remaining portion of these costs is the responsibility of the Authority and will be funded with sales tax revenue or long-term debt. The major projects that the Authority completed in 2015 include the Little Italy-University Circle Red Line Station project, the Cleveland State Line project and the Van-Aken-Lee Rail Station. Major projects in progress in 2015 include the Brookpark Station Reconstruction project and the Bus Replacement project.
For the year ended December 31, 2015, capitalized interest was $513,732.
Balance January 1,
2015Transfers/ Additions
CIP Transfers/ Disposals
Balance December 31,
2015
Capital Assets Not Being Depreciated: Land $ 37,812,954 $ 51 $ 37,813,005 Construction in Progress 22,257,810 67,386,355 $ 30,122,596 59,521,569
Total Capital Assets Not Being Depreciated 60,070,764 67,386,406 30,122,596 97,334,574
Capital Assets Being Depreciated: Infrastructure 63,461,761 63,461,761 Right-of-Ways 308,716,518 547,260 309,263,778 Building, Furniture & Fixtures 537,705,702 8,434,308 546,140,010 Transportation and Other Equipment 441,897,992 31,950,408 3,135,148 470,713,252 Bus Rapid Transit 163,026,991 74,906 163,101,897
Total Capital Assets Being Depreciated 1,514,808,964 41,006,882 3,135,148 1,552,680,698
Less Accumulated Depreciation: Infrastructure 19,512,583 1,563,182 21,075,765 Right-of-Ways 176,783,143 6,888,035 183,671,178 Building, Furniture & Fixtures 289,074,903 18,086,156 307,161,059 Transportation and Other Equipment 345,488,136 17,149,550 3,135,148 359,502,538 Bus Rapid Transit 22,160,715 3,622,961 25,783,676
Total Accumulated Depreciation 853,019,480 47,309,884 3,135,148 897,194,216
Total Capital Assets Being Depreciated, Net 661,789,484 (6,303,002) 655,486,482
Total Capital Assets, Net $ 721,860,248 $ 61,083,404 $ 30,122,596 $ 752,821,056

GREATER CLEVELAND REGIONAL TRANSIT AUTHORITY NOTES TO FINANCIAL STATEMENTS
FOR THE YEARS ENDED DECEMBER 31, 2015 AND 2014
- 45 -
Capital asset activity for the year ended December 31, 2014 was as follows:
Remaining costs to complete construction projects, as of December 31, 2014, which will extend over a period of several years, total $78.1 million. Approximately $77.4 million of these costs are eligible for reimbursement under approved capital grants. The remaining portion of these costs is the responsibility of the Authority and will be funded with sales tax revenue or long-term debt. The major projects that the Authority completed in 2014 include the Central Rail Maintenance Facility Improvement project and the Cedar-University Rapid Station. Major projects in progress in 2014 include the Little Italy- University Circle Red Line Station and the Van Aken-Lee Rail Station.
For the year ended December 31, 2014, capitalized interest was $297,419.
Balance January 1,
2014Transfers/ Additions
CIP Transfers/ Disposals
Balance December 31,
2014
Capital Assets Not Being Depreciated: Land $ 37,818,536 $ 3,708 $ 9,290 $ 37,812,954 Construction in Progress 25,954,738 14,988,211 18,685,139 22,257,810
Total Capital Assets Not Being Depreciated 63,773,274 14,991,919 18,694,429 60,070,764
Capital Assets Being Depreciated: Infrastructure 63,233,488 228,273 63,461,761 Right-of-Ways 301,659,658 7,056,860 308,716,518 Building, Furniture & Fixtures 502,685,402 35,020,300 537,705,702 Transportation and Other Equipment 421,137,763 22,271,122 1,510,893 441,897,992 Bus Rapid Transit 162,343,991 683,000 163,026,991
Total Capital Assets Being Depreciated 1,451,060,302 65,259,555 1,510,893 1,514,808,964
Less Accumulated Depreciation: Infrastructure 18,050,572 1,462,011 19,512,583 Right-of-Ways 169,671,018 7,112,125 176,783,143 Building, Furniture & Fixtures 272,465,305 16,609,598 289,074,903 Transportation and Other Equipment 327,276,898 19,722,131 1,510,893 345,488,136 Bus Rapid Transit 18,549,736 3,610,979 22,160,715
Total Accumulated Depreciation 806,013,529 48,516,844 1,510,893 853,019,480
Total Capital Assets Being Depreciated, Net 645,046,773 16,742,711 661,789,484
Total Capital Assets, Net $ 708,820,047 $ 31,734,630 $ 18,694,429 $ 721,860,248

GREATER CLEVELAND REGIONAL TRANSIT AUTHORITY NOTES TO FINANCIAL STATEMENTS
FOR THE YEARS ENDED DECEMBER 31, 2015 AND 2014
- 46 -
6. LONG-TERM DEBT Long-term bonds and capital lease payable at December 31, 2015 consist of the following:
Long-term bonds and capital lease payable at December 31, 2014 consist of the following: On November 16, 2004, the Authority issued $67,235,000 of general obligation capital improvement and refunding bonds. Of the $67,235,000, $38,000,000 was issued to finance current and future capital improvement projects and the remainder for the advance refunding of previous issues. The bonds bear interest at rates ranging from 2.0% to 5.0% per annum, and mature in various installments through December 1, 2024. Proceeds of $32,178,171 were placed in an escrow trust fund for the purpose of generating resources for future debt services payments of the refunded debt. There was no defeased debt for December 31, 2015.
Average Balance BalanceInterest January 1, December 31, Due Within
Issue Rate 2015 Additions Reductions 2015 One Year
Series 2004-GO Bonds 4.23 $ 11,515,000 $ 5,620,000 $ 5,895,000 $ 5,895,000Series 2006-GO Bonds 4.51 2,460,000 1,200,000 1,260,000 1,260,000Series 2008-GO Bonds 4.57 29,680,000 23,930,000 5,750,000 1,840,000Series 2008B-GO Bonds 4.01 11,310,000 5,535,000 5,775,000 5,775,000Series 2012-Sales Tax Revenue Bonds 5.01 39,270,000 890,000 38,380,000 915,000Series 2014A-Sales Tax Revenue Bonds 4.50 13,360,000 13,360,000Series 2014B-Sales Tax Revenue Bonds 1.51 16,340,000 300,000 16,040,000 300,000Series 2015 Sales Tax Capital Improvement Refunding Bonds 4.78 $ 51,425,000 1,005,000 50,420,000 990,000Premium 11,899,194 9,751,534 2,447,759 19,202,969
Total Bonds Payable 135,834,194 61,176,534 40,927,759 156,082,969 16,975,000
Capital Lease Payable 14,430,918 14,430,918
Total Long-Term Debt $ 150,265,112 $ 61,176,534 $ 55,358,677 $ 156,082,969 $ 16,975,000
Average Balance BalanceInterest January 1, December 31, Due Within
Issue Rate 2014 Additions Reductions 2014 One Year
Series 2004-GO Bonds 4.23 $ 18,610,000 $ 7,095,000 $ 11,515,000 $ 5,620,000Series 2006-GO Bonds 4.51 31,270,000 28,810,000 2,460,000 1,200,000Series 2008-GO Bonds 4.57 31,385,000 1,705,000 29,680,000 1,770,000Series 2008B-GO Bonds 4.01 16,645,000 5,335,000 11,310,000 5,535,000Series 2012-Sales Tax Revenue Bonds 5.01 40,135,000 865,000 39,270,000 890,000Series 2014A-Sales Tax Revenue Bonds 4.50 $ 13,360,000 13,360,000Series 2014B-Sales Tax Revenue Bonds 1.51 16,340,000 16,340,000 300,000Premium 10,893,217 1,972,983 967,006 11,899,194
Total Bonds Payable 148,938,217 31,672,983 44,777,006 135,834,194 15,315,000
Capital Lease Payable 16,149,572 1,718,654 14,430,918 1,796,846
Total Long-Term Debt $ 165,087,789 $ 31,672,983 $ 46,495,660 $ 150,265,112 $ 17,111,846

GREATER CLEVELAND REGIONAL TRANSIT AUTHORITY NOTES TO FINANCIAL STATEMENTS
FOR THE YEARS ENDED DECEMBER 31, 2015 AND 2014
- 47 -
On March 7, 2006, the Authority issued $38,490,000 of general obligation capital improvement and refunding bonds. Of the $38,490,000, $25,000,000 was issued to finance current and future capital improvement projects and the remainder for the advance refunding of previous issues. The bonds bear interest at rates ranging from 4.0% to 5.0% per annum, and mature in various installments through December 1, 2025. Proceeds of $14,146,326 were placed in an escrow trust fund for the purpose of generating resources for future debt services payments of the refunded debt. There was no defeased debt for December 31, 2015. On February 20, 2008, the Authority issued $35,000,000 of general obligation capital improvement bonds for the purpose of financing current and future capital improvement projects. The bonds bear interest at rates ranging from 3.0% to 4.68% per annum, and mature in various installments through December 1, 2027. On September 12, 2008, the Authority issued $27,390,000, of general obligation capital improvement refunding bonds bearing interest at an average rate of 4.01% and payable through December 1, 2016. Proceeds of the bonds were used for the advance refunding of $27,555,000 of the 1998 capital improvement refunding bonds. In addition, a $175,000 principal payment was made in 2008. The proceeds were placed in an irrevocable trust for the purpose of generating resources for all future debt service payments of the refunded debt. There was no defeased debt for December 31, 2015.
On June 7, 2012, the Authority issued $42,390,000 of sales tax supported capital improvement and refunding bonds for the purpose of financing current and future capital improvement projects. The bonds bear interest at rates ranging from 4.23% to 5.01% per annum, and mature in various installments through December 1, 2031.
On April 16, 2014, the Authority issued $13,360,000 in tax-exempt sales tax supported bonds (2014A) and $16,340,000 in taxable sales tax support bonds (2014B). The 2014A bonds bear interest at rates ranging from 3.00% to 5.00%, with a final maturity date of December 1, 2025. The 2014B bonds bear interest at rates ranging from .0735% to 2.937%, with a maturity date of December 1, 2020. Proceeds of the bonds were used for a partial advance refunding of the 2004 and 2006 debt.
On March 17, 2015 the Authority issued $51,425,000 of sales tax supported capital improvement and refunding bonds. $21.4 million of these bonds were used to do a partial refunding of the 2008A outstanding debt and also to prepay the 2007 Master Tax Exempt lease. $30 million was issued to finance current and future capital improvement projects. The bonds bear interest rates ranging from 2% to 5% per annum, and mature in various installments through December 1, 2034.
The annual requirements to pay principal and interest on the bonds outstanding at December 31, 2015 are as follows:
Year Principal Interest2016 $ 16,975,000 $ 6,037,5132017 11,605,000 5,313,1762018 11,935,000 4,986,3122019 9,640,000 4,588,7652020 9,645,000 4,209,6852021-2025 44,435,000 14,497,175
22,175,000 5,671,17510,470,000 1,196,250
Total $ 136,880,000 $ 46,500,051
2026-20302031-2031
Bonds

GREATER CLEVELAND REGIONAL TRANSIT AUTHORITY NOTES TO FINANCIAL STATEMENTS
FOR THE YEARS ENDED DECEMBER 31, 2015 AND 2014
- 48 -
7. RETIREMENT AND OTHER BENEFITS
DEFINED BENEFIT PENSION PLANS
Net Pension Liability
The net pension liability reported on the statement of net position represents a liability to employees for pensions. Pensions are a component of exchange transactions—between an employer and its employees—of salaries and benefits for employee services. Pensions are provided to an employee—on a deferred-payment basis - as part of the total compensation package offered by an employer for employee services each financial period. The obligation to sacrifice resources for pensions is a present obligation because it was created as a result of employment exchanges that already have occurred.
The net pension liability represents the Authority's proportionate share of each pension plan's collective actuarial present value of projected benefit payments attributable to past periods of service, net of each pension plan's fiduciary net position. The net pension liability calculation is dependent on critical long-term variables, including estimated average life expectancies, earnings on investments, cost of living adjustments and others. While these estimates use the best information available, unknowable future events require adjusting this estimate annually.
Ohio Revised Code limits the Authority's obligation for this liability to annually required payments. The Authority cannot control benefit terms or the manner in which pensions are financed; however, the Authority does receive the benefit of employees' services in exchange for compensation including pension.
GASB 68 assumes the liability is solely the obligation of the employer, because (1) they benefit from employee services; and (2) State statute requires all funding to come from these employers. All contributions to date have come solely from these employers (which also includes costs paid in the form of withholdings from employees). State statute requires the pension plans to amortize unfunded liabilities within 30 years. If the amortization period exceeds 30 years, each pension plan's board must propose corrective action to the State legislature. Any resulting legislative change to benefits or funding could significantly affect the net pension liability. Resulting adjustments to the net pension liability would be effective when the changes are legally enforceable.
The proportionate share of each plan's unfunded benefits is presented as a long-term net pension liability on the accrual basis of accounting. Any liability for the contractually-required pension contribution outstanding at the end of the year is included as an accrued expense.
Ohio Public Employees Retirement System
Plan Description — All full-time employees of the Authority participate in the Ohio Public Employees Retirement System (OPERS). OPERS provides retirement, disability, survivor and death benefits, and annual cost-of-living adjustments to members of the traditional and combined plans. Members of the member-directed plan do not qualify for ancillary benefits. Authority to establish and amend benefits is provided by Chapter 145 of the Ohio Revised Code. OPERS issues a stand-alone financial report that includes financial statements, required supplementary information and detailed information about OPERS' fiduciary net position that may be obtained by visiting https://www.opers.org, by writing to the Ohio Public Employees Retirement System, 277 East Town Street, Columbus, Ohio 43215-4642, or by calling (614) 222-5601 or 800-222-7377.
OPERS administers three separate pension plans. The Traditional Plan is a cost-sharing, multiple-employer defined benefit pension plan. The Member-Directed Plan is a defined contribution plan in which the member invests both member and employer contributions (employer vest over 5 years at 20% per year).The Combined Plan is a cost-sharing, multiple-employer defined benefit pension plan. Under the combined plan, OPERS invests employer contributions to provide a formula retirement benefits similar in nature to the traditional pension plan benefit.
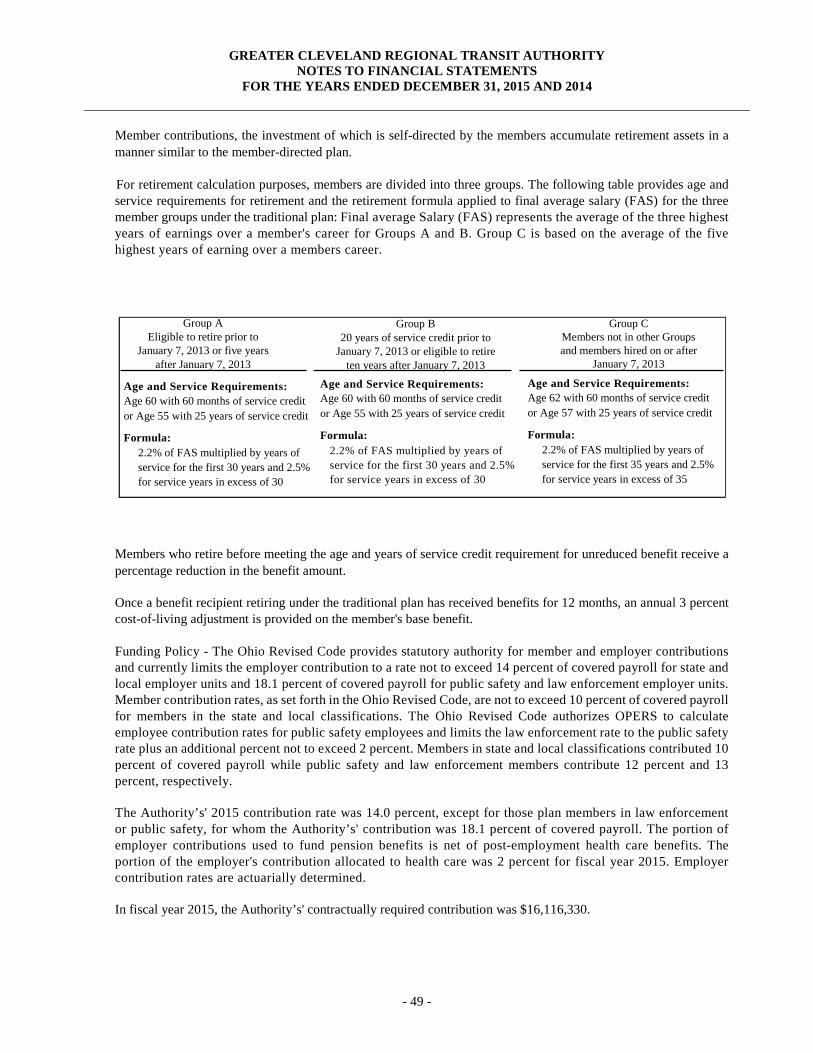
GREATER CLEVELAND REGIONAL TRANSIT AUTHORITY NOTES TO FINANCIAL STATEMENTS
FOR THE YEARS ENDED DECEMBER 31, 2015 AND 2014
- 49 -
Member contributions, the investment of which is self-directed by the members accumulate retirement assets in a manner similar to the member-directed plan.
For retirement calculation purposes, members are divided into three groups. The following table provides age and service requirements for retirement and the retirement formula applied to final average salary (FAS) for the three member groups under the traditional plan: Final average Salary (FAS) represents the average of the three highest years of earnings over a member's career for Groups A and B. Group C is based on the average of the five highest years of earning over a members career.
Members who retire before meeting the age and years of service credit requirement for unreduced benefit receive a percentage reduction in the benefit amount.
Once a benefit recipient retiring under the traditional plan has received benefits for 12 months, an annual 3 percent cost-of-living adjustment is provided on the member's base benefit.
Funding Policy - The Ohio Revised Code provides statutory authority for member and employer contributions and currently limits the employer contribution to a rate not to exceed 14 percent of covered payroll for state and local employer units and 18.1 percent of covered payroll for public safety and law enforcement employer units. Member contribution rates, as set forth in the Ohio Revised Code, are not to exceed 10 percent of covered payroll for members in the state and local classifications. The Ohio Revised Code authorizes OPERS to calculate employee contribution rates for public safety employees and limits the law enforcement rate to the public safety rate plus an additional percent not to exceed 2 percent. Members in state and local classifications contributed 10 percent of covered payroll while public safety and law enforcement members contribute 12 percent and 13 percent, respectively.
The Authority’s' 2015 contribution rate was 14.0 percent, except for those plan members in law enforcement or public safety, for whom the Authority’s' contribution was 18.1 percent of covered payroll. The portion of employer contributions used to fund pension benefits is net of post-employment health care benefits. The portion of the employer's contribution allocated to health care was 2 percent for fiscal year 2015. Employer contribution rates are actuarially determined.
In fiscal year 2015, the Authority’s' contractually required contribution was $16,116,330.
Group A Eligible to retire prior to
January 7, 2013 or five years after January 7, 2013
Group B 20 years of service credit prior to
January 7, 2013 or eligible to retire ten years after January 7, 2013
Group C Members not in other Groups and members hired on or after
January 7, 2013
Age and Service Requirements: Age 60 with 60 months of service credit or Age 55 with 25 years of service credit
Formula: 2.2% of FAS multiplied by years of service for the first 30 years and 2.5% for service years in excess of 30
Age and Service Requirements: Age 60 with 60 months of service credit or Age 55 with 25 years of service credit
Formula: 2.2% of FAS multiplied by years of service for the first 30 years and 2.5% for service years in excess of 30
Age and Service Requirements: Age 62 with 60 months of service credit or Age 57 with 25 years of service credit
Formula: 2.2% of FAS multiplied by years of service for the first 35 years and 2.5% for service years in excess of 35

GREATER CLEVELAND REGIONAL TRANSIT AUTHORITY NOTES TO FINANCIAL STATEMENTS
FOR THE YEARS ENDED DECEMBER 31, 2015 AND 2014
- 50 -
Funding Policy – The Ohio Revised Code provides statutory rates for employee and employer contributions, which are summarized as follows at December 31 2014:
The pension contributions equaled the required contributions for each of the last three years. Healthcare – OPERS maintains a cost-sharing, multiple-employer defined benefit post-employment healthcare plan, which includes a medical plan, prescription drug program and Medicare Part B premium reimbursement, to qualifying members of both the traditional pension and the combined plans. Members of the member-directed plan do not qualify for ancillary benefit, including post-employment healthcare coverage. In order to qualify for post-employment healthcare coverage, age and service retirees under the Tradition Pension and Combined plans must have 10 or more years of qualifying Ohio service credit. Healthcare coverage for disability benefit recipients and qualified survivor recipients is available. The healthcare coverage provided by OPERS meets the definition of an Other Post-employment Benefits (OPEB) as described in GASB Statement No. 45. The Ohio Revised Code permits, but does not mandate, OPERS to provide OPEB benefits to its eligible members and beneficiaries. The authority to establish and amend benefits is provided in Chapter 145 of the Ohio Revised Code. Funding Policy – The Ohio Revised Code provides the statutory authority requiring public employers to fund post-retirement healthcare through their contributions to OPERS. A portion of each employer’s contributions to OPERS is set aside for the funding of post-retirement healthcare benefits. Employer contribution rates are expressed as a percentage of the covered payroll of active members. In 2014, state and local employers contributed at a rate of 14.00% of covered payroll, and public safety and law enforcement employers contributed at 18.10%. The Ohio Revised Code currently limits the employer contribution to a rate not to exceed 14.0% of covered payroll for state and local employer unit and 18.1% of covered payroll for law and public safety employer units. Active members do not make contributions to the OPEB Plan. OPERS’ Post-Employment Healthcare Plan was established under, and is administrated in accordance with, Internal Revenue Code 401(h). Each year, the OPERS Retirement Board determines the portion of the employer contribution rate that will be set aside for funding of post-employment healthcare benefits. The portion of employer contributions allocated to healthcare for members in the plan was 4.0% for 2014. The portion of employer contributions allocated to healthcare for members in the Combined Plan was 4.0% for 2013. The OPERS Board of Trustees is also authorized to establish rules for the payment of a portion of the healthcare coverage provided, by the retiree or their surviving beneficiaries. Payment amounts vary depending on the number of covered dependents and the coverage selected.
ContributionRate
as a % ofCoveredSalaries 2014 2013 2012
By statutory authority 14.0-18.10% 20,720,280$ 20,028,310$ 19,336,503$ Less healthcare portion 4.0% (5,155,299) (5,004,400) (4,831,938) Required employer contribution 15,564,981 15,023,911 14,504,565$ By employees 10.0-12.1% 13,090,428 12,664,738 12,207,917 Total pension contributions 28,655,409$ 27,688,649$ 26,712,482$
Contributions
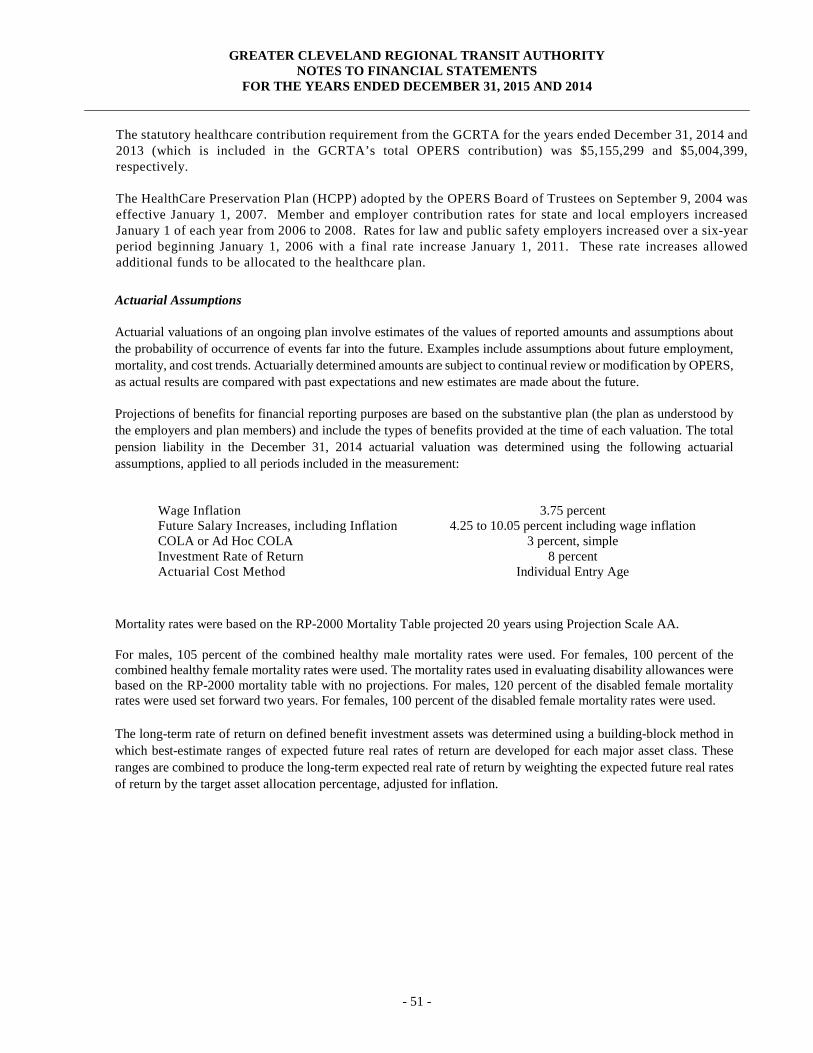
GREATER CLEVELAND REGIONAL TRANSIT AUTHORITY NOTES TO FINANCIAL STATEMENTS
FOR THE YEARS ENDED DECEMBER 31, 2015 AND 2014
- 51 -
The statutory healthcare contribution requirement from the GCRTA for the years ended December 31, 2014 and 2013 (which is included in the GCRTA’s total OPERS contribution) was $5,155,299 and $5,004,399, respectively. The HealthCare Preservation Plan (HCPP) adopted by the OPERS Board of Trustees on September 9, 2004 was effective January 1, 2007. Member and employer contribution rates for state and local employers increased January 1 of each year from 2006 to 2008. Rates for law and public safety employers increased over a six-year period beginning January 1, 2006 with a final rate increase January 1, 2011. These rate increases allowed additional funds to be allocated to the healthcare plan.
Actuarial Assumptions
Actuarial valuations of an ongoing plan involve estimates of the values of reported amounts and assumptions about the probability of occurrence of events far into the future. Examples include assumptions about future employment, mortality, and cost trends. Actuarially determined amounts are subject to continual review or modification by OPERS, as actual results are compared with past expectations and new estimates are made about the future.
Projections of benefits for financial reporting purposes are based on the substantive plan (the plan as understood by the employers and plan members) and include the types of benefits provided at the time of each valuation. The total pension liability in the December 31, 2014 actuarial valuation was determined using the following actuarial assumptions, applied to all periods included in the measurement:
Wage Inflation Future Salary Increases, including Inflation COLA or Ad Hoc COLA Investment Rate of Return Actuarial Cost Method
3.75 percent 4.25 to 10.05 percent including wage inflation
3 percent, simple 8 percent
Individual Entry Age
Mortality rates were based on the RP-2000 Mortality Table projected 20 years using Projection Scale AA.
For males, 105 percent of the combined healthy male mortality rates were used. For females, 100 percent of the combined healthy female mortality rates were used. The mortality rates used in evaluating disability allowances were based on the RP-2000 mortality table with no projections. For males, 120 percent of the disabled female mortality rates were used set forward two years. For females, 100 percent of the disabled female mortality rates were used.
The long-term rate of return on defined benefit investment assets was determined using a building-block method in which best-estimate ranges of expected future real rates of return are developed for each major asset class. These ranges are combined to produce the long-term expected real rate of return by weighting the expected future real rates of return by the target asset allocation percentage, adjusted for inflation.

GREATER CLEVELAND REGIONAL TRANSIT AUTHORITY NOTES TO FINANCIAL STATEMENTS
FOR THE YEARS ENDED DECEMBER 31, 2015 AND 2014
- 52 -
The allocation of investment assets with the Defined Benefit portfolio is approved by the Board of Trustees as outlined in the annual investment plan. Plan assets are managed on a total return basis with a long-term objective of achieving and maintaining a fully funded status for the benefits provided through the defined benefit pension plans. The table below displays the Board-approved asset allocation policy for 2014 and the long-term expected real rates of return:
Weighted Average
Target Long-Term Expected
Asset Class Allocation Real Rates of
Return Fixed Income 23.00 % 2.31 % Domestic Equities 19.90 % 5.84 % Real Estate 10.00 % 4.25 % Private Equity 10.00 % 9.25 % International Equities 19.10 % 7.40 % Other Investments 18.00 % 4.59 % Total 100.00 % 5.28 %
Discount Rate The discount rate used to measure the total pension liability was 8 percent. The projection of cash flows used to determine the discount rate assumed that contributions from plan members and those of the contributing employers are made at the contractually required rates, as actuarially determined. Based on those assumptions, the pension plan's fiduciary net position was projected to be available to make all projected future benefits payments of current plan members. Therefore, the long-term expected rate of return on pension plan investments was applied to all periods of projected benefit payments to determine the total pension liability.
Sensitivity of the Authority's Proportionate Share of the Net Pension Liability to Changes in the Discount Rate The following table presents the Authority's proportionate share of the net pension liability calculated using the current period discount rate assumption of 8 percent, as well as what the Authority's proportionate share of the net pension liability would be if it were calculated using a discount rate that is one-percentage-point lower (7 percent) or one-percentage-point higher (9 percent) than the current rate:
1% Decrease Discount Rate 1% Increase7% 8% 9%
Traditional Plan $ 230,073,303 $ 125,059,292 $ 36,612,233
Combined Plan $ 29,399 $ (226,389) $ (429,230)
Authority's proportionate share of the net pension liability (asset)

GREATER CLEVELAND REGIONAL TRANSIT AUTHORITY NOTES TO FINANCIAL STATEMENTS
FOR THE YEARS ENDED DECEMBER 31, 2015 AND 2014
- 53 -
Pension Liabilities, Pension Expense, and Deferred Outflows of Resources and Deferred Inflow of Resources Related to Pensions The net pension liability was measured as of December 31, 2014 for OPERS. The total pension liability used to calculate the net pension liability was determined by an actuarial valuation as of that date. The Authority's proportion of the net pension liability was based on the Authority's share of contributions to the pension plan relative to the contributions of all participating entities. Following is information related to the proportionate share and pension expense:
SUPPLEMENTAL RETIREMENT BENFIT PLAN GCRTA pays supplemental retirement benefits to various classifications of individuals under several different arrangements. This plan is not governed under ERISA (Employee Retirement Income Security Act of 1974). An actuarial study is performed every two years; the last study completed for the year ended December 31, 2014. Based on the last study available, there were 1,345 participants in pay status and 1,682 active employees and benefit payments of $72,948.
Net Pension Liability and Pension Expense Traditional Combined Total
Proportionate Share of the Net Pension Liability (Asset) $ 125,059,292 $ (226,389) $ 124,832,903
Proportion of the Net Pension Liability (Asset) 1.03688% 0.58799%
Pension Expense $ 13,654,046 $ 150,438 $ 13,804,484
At December, 2015 the Authority reported deferred outflow of resources and deferred inflow resources relatedto pension from the following sources:
Deferred Outflows of Resources Traditional Combined Total
Authority contributions subsequent to measurement date $ 15,848,700 $ 267,630 $ 16,116,330Net difference between projected and actual earnings on pension plan investments 5,338,228 11,054 5,349,282
Total Deferred Outflow of Resources $ 21,186,928 $ 278,684 $ 21,465,612
Difference between expected and actual experience $ 1,503,378 $ 61,739 $ 1,565,117
Total Deferred Inflow of Resources $ 1,503,378 $ 61,739 $ 1,565,117
The $16,116,330 reported as deferred outflows of resources related to pension resulting from Authority contributionssubsequent to the measurement date will be recognized as a reduction of the net pension liability in the yearending December 31, 2016. Other amounts reported as deferred outflows of resources and deferred inflows ofresources related to pension will be recognized in pension expense as follows:
Traditional Combined TotalFiscal Year Ending December 31,:
2016 $ 640,892 $ (4,579) $ 636,3132017 640,892 (4,579) 636,3132018 1,218,508 (4,579) 1,213,9292019 1,334,558 (4,579) 1,329,9792020-2024 (32,369) (32,369)Total $ 3,834,850 $ (50,685) $ 3,784,165
Deferred Inflows of Resources

GREATER CLEVELAND REGIONAL TRANSIT AUTHORITY NOTES TO FINANCIAL STATEMENTS
FOR THE YEARS ENDED DECEMBER 31, 2015 AND 2014
- 54 -
As of December 31, 2015, the Supplemental Pension Fund liability was determined to be $997,961 based on the 2014 actuarial study. The fair value of associated assets totaled $1,262,408 and $1,234,542 as of December 31, 2015 and 2014, respectively. 8. PURCHASED TRANSPORTATION SERVICES
The Greater Cleveland Regional Transit Authority contracts with vendors who use local taxi companies to provide transit services within Cuyahoga County for elderly and handicapped persons. Expenses under this contract amounted to $7,885,339 and $7,810,111 in 2015 and 2014, respectively.
9. GRANTS, REIMBURSEMENTS, AND SPECIAL FARE ASSISTANCE
Grants, reimbursements, and special fare assistance are included in the Non-operating revenues (expenses) and the Capital grant revenue categories on the Statement of Revenues, Expenses, and Changes in Net Position for the years ended December 31, 2015 and 2014 as follows:
2015 2014 FEDERAL: FTA Capital Grants $ 64,672,816 $ 50,059,195 FTA Maintenance Assistance 14,000,000 9,978,271 FTA Operating Grants 20,216 932,946 Pass-Through Grants 122,122 528,680 Total $ 78,815,154 $ 61,499,092 STATE: ODOT Capital Grants $ 77,900 $ 1,081,632 ODOT Fuel Tax Reimbursement 1,188,780 1,275,196 ODOT Operating Grants 1,017,531 989,630 Total $ 2,284,211 $ 3,346,458
10. CONTINGENCIES
Federal and State Grants – Under the terms of the various grants, periodic audits are required where certain costs could be questioned as not being an eligible expense under the terms of the grant. At December 31, 2015 and 2014, there were no questioned costs that had not been resolved with the applicable federal and state agencies. Questioned costs could still be identified during audits to be conducted in the future. Contract Disputes and Legal Proceedings – The Authority has been named as a defendant in a number of contract disputes and other legal proceedings. Although the eventual outcome of these matters cannot be predicted, it is the opinion of management that the ultimate liability is not expected to have a material effect on the Authority’s financial position.

GREATER CLEVELAND REGIONAL TRANSIT AUTHORITY NOTES TO FINANCIAL STATEMENTS
FOR THE YEARS ENDED DECEMBER 31, 2015 AND 2014
- 55 -
11. FUEL PRICE RISK MANAGEMENT
Pursuant to Ohio Revised Code, Section 9.835(A), (B), and (C) and Section 135.14, the Authority utilizes futures contracts and commodity swaps to manage the volatility of fuel costs. These techniques are traditionally used to limit exposure to price fluctuations. Management recognized that fluctuations in fuel prices could have a negative impact on the Authority’s financial affairs. Accordingly, the Authority has utilized both futures contracts and fuel swap agreements to offset against price volatility of diesel fuel in accordance with the Authority’s Energy Price Risk Management Policy established by the Board of Trustees. These transactions are completely separate from the physical fuel purchase transactions. The Authority uses an advisor to help monitor the markets and advise on opportunities.
Futures Contracts – The Authority’s Board limits contracts in-place to 90% of projected consumption within a fiscal year. Heating oil #2 futures contracts were utilized to manage price volatility through December 2019. The initial value of each contract is zero. Upon entering into these contracts, the broker requires a margin to be deposited into the account. The account is marked-to-market each night, with cash settlements occurring daily. Depending on the daily adjustment to the account, the Authority may be requested to make an incremental cash deposit the following day (to continue to meet the required margin requirements) or may receive a cash withdrawal from the brokerage account (if the cash balance in the brokerage account exceeds the margin requirement). The outstanding contracts are being reported at fair value of the investments. Fuel Price Swap Agreements – The Authority has also entered into fuel swap agreements or contracts to manage the price volatility of diesel fuel. These agreements require no initial cash investment and only require settlements on specified dates. The Authority entered into 30 transactions, which represent 50 fuel swap agreements in 2015 and 30 transactions, which represents 131 fuel swap agreements in 2014, which allowed the Authority to plan and manage fuel costs. The Authority entered into commodity transaction agreements for New York Mercantile Exchange (NYMEX) New York Harbor No. 2 heating oil with various counterparties, as shown below as of December 31, 2015:
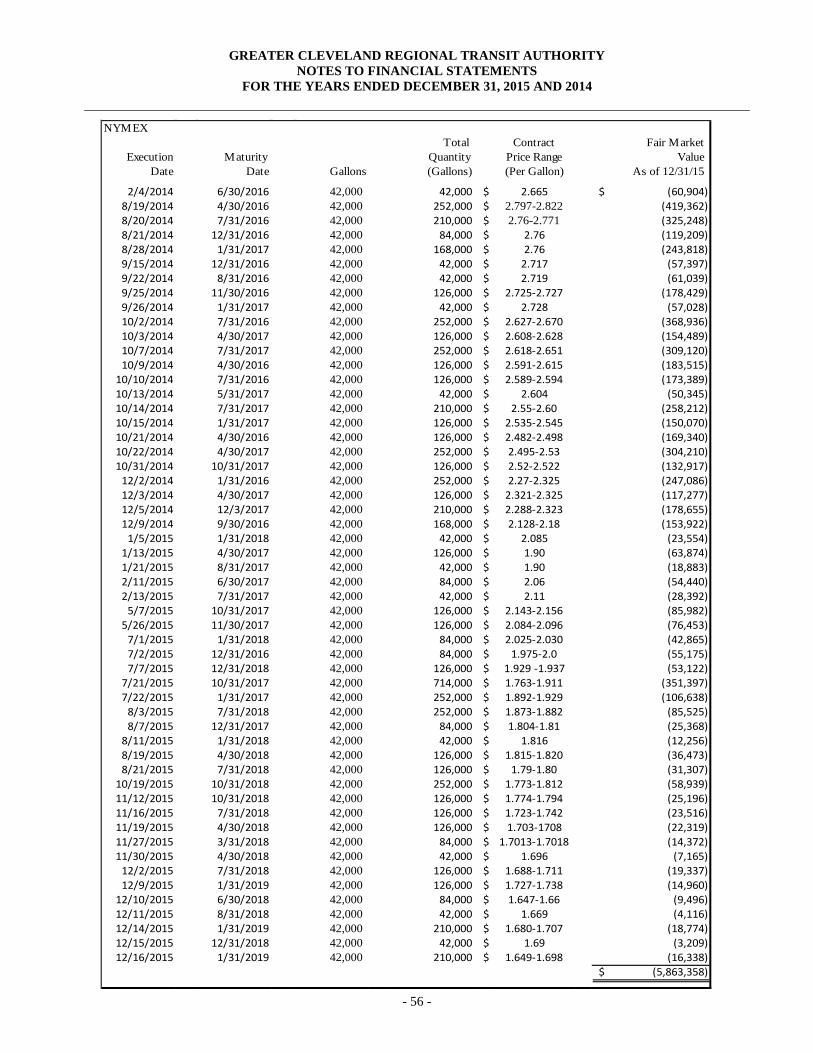
GREATER CLEVELAND REGIONAL TRANSIT AUTHORITY NOTES TO FINANCIAL STATEMENTS
FOR THE YEARS ENDED DECEMBER 31, 2015 AND 2014
- 56 -
NYMEXTotal Contract Fair Market
Execution Maturity Quantity Price Range ValueDate Date Gallons (Gallons) (Per Gallon) As of 12/31/15
2/4/2014 6/30/2016 42,000 42,000 $ 2.665 (60,904)$ 8/19/2014 4/30/2016 42,000 252,000 $ 2.797-2.822 (419,362) 8/20/2014 7/31/2016 42,000 210,000 $ 2.76-2.771 (325,248) 8/21/2014 12/31/2016 42,000 84,000 $ 2.76 (119,209) 8/28/2014 1/31/2017 42,000 168,000 $ 2.76 (243,818) 9/15/2014 12/31/2016 42,000 42,000 $ 2.717 (57,397) 9/22/2014 8/31/2016 42,000 42,000 $ 2.719 (61,039) 9/25/2014 11/30/2016 42,000 126,000 $ 2.725-2.727 (178,429) 9/26/2014 1/31/2017 42,000 42,000 $ 2.728 (57,028) 10/2/2014 7/31/2016 42,000 252,000 $ 2.627-2.670 (368,936) 10/3/2014 4/30/2017 42,000 126,000 $ 2.608-2.628 (154,489) 10/7/2014 7/31/2017 42,000 252,000 $ 2.618-2.651 (309,120) 10/9/2014 4/30/2016 42,000 126,000 $ 2.591-2.615 (183,515)
10/10/2014 7/31/2016 42,000 126,000 $ 2.589-2.594 (173,389) 10/13/2014 5/31/2017 42,000 42,000 $ 2.604 (50,345) 10/14/2014 7/31/2017 42,000 210,000 $ 2.55-2.60 (258,212) 10/15/2014 1/31/2017 42,000 126,000 $ 2.535-2.545 (150,070) 10/21/2014 4/30/2016 42,000 126,000 $ 2.482-2.498 (169,340) 10/22/2014 4/30/2017 42,000 252,000 $ 2.495-2.53 (304,210) 10/31/2014 10/31/2017 42,000 126,000 $ 2.52-2.522 (132,917)
12/2/2014 1/31/2016 42,000 252,000 $ 2.27-2.325 (247,086) 12/3/2014 4/30/2017 42,000 126,000 $ 2.321-2.325 (117,277) 12/5/2014 12/3/2017 42,000 210,000 $ 2.288-2.323 (178,655) 12/9/2014 9/30/2016 42,000 168,000 $ 2.128-2.18 (153,922)
1/5/2015 1/31/2018 42,000 42,000 $ 2.085 (23,554) 1/13/2015 4/30/2017 42,000 126,000 $ 1.90 (63,874) 1/21/2015 8/31/2017 42,000 42,000 $ 1.90 (18,883) 2/11/2015 6/30/2017 42,000 84,000 $ 2.06 (54,440) 2/13/2015 7/31/2017 42,000 42,000 $ 2.11 (28,392)
5/7/2015 10/31/2017 42,000 126,000 $ 2.143-2.156 (85,982) 5/26/2015 11/30/2017 42,000 126,000 $ 2.084-2.096 (76,453)
7/1/2015 1/31/2018 42,000 84,000 $ 2.025-2.030 (42,865) 7/2/2015 12/31/2016 42,000 84,000 $ 1.975-2.0 (55,175) 7/7/2015 12/31/2018 42,000 126,000 $ 1.929 -1.937 (53,122)
7/21/2015 10/31/2017 42,000 714,000 $ 1.763-1.911 (351,397) 7/22/2015 1/31/2017 42,000 252,000 $ 1.892-1.929 (106,638)
8/3/2015 7/31/2018 42,000 252,000 $ 1.873-1.882 (85,525) 8/7/2015 12/31/2017 42,000 84,000 $ 1.804-1.81 (25,368)
8/11/2015 1/31/2018 42,000 42,000 $ 1.816 (12,256) 8/19/2015 4/30/2018 42,000 126,000 $ 1.815-1.820 (36,473) 8/21/2015 7/31/2018 42,000 126,000 $ 1.79-1.80 (31,307)
10/19/2015 10/31/2018 42,000 252,000 $ 1.773-1.812 (58,939) 11/12/2015 10/31/2018 42,000 126,000 $ 1.774-1.794 (25,196) 11/16/2015 7/31/2018 42,000 126,000 $ 1.723-1.742 (23,516) 11/19/2015 4/30/2018 42,000 126,000 $ 1.703-1708 (22,319) 11/27/2015 3/31/2018 42,000 84,000 $ 1.7013-1.7018 (14,372) 11/30/2015 4/30/2018 42,000 42,000 $ 1.696 (7,165)
12/2/2015 7/31/2018 42,000 126,000 $ 1.688-1.711 (19,337) 12/9/2015 1/31/2019 42,000 126,000 $ 1.727-1.738 (14,960)
12/10/2015 6/30/2018 42,000 84,000 $ 1.647-1.66 (9,496) 12/11/2015 8/31/2018 42,000 42,000 $ 1.669 (4,116) 12/14/2015 1/31/2019 42,000 210,000 $ 1.680-1.707 (18,774) 12/15/2015 12/31/2018 42,000 42,000 $ 1.69 (3,209) 12/16/2015 1/31/2019 42,000 210,000 $ 1.649-1.698 (16,338)
(5,863,358)$
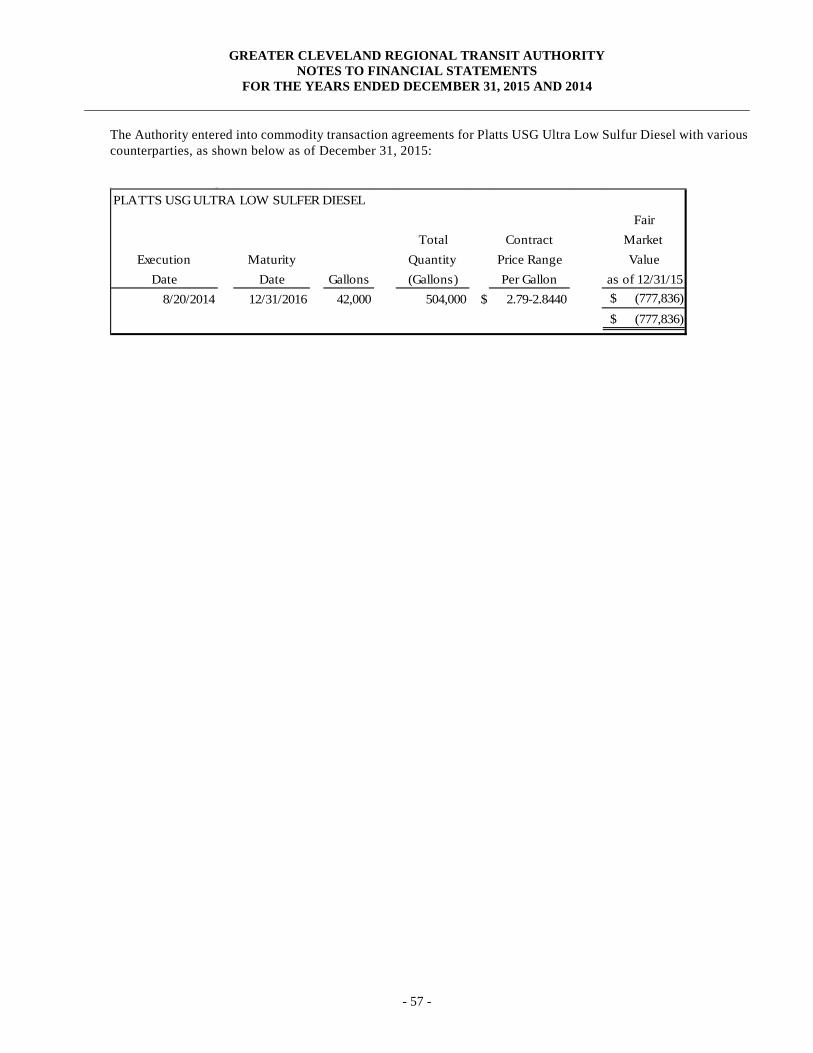
GREATER CLEVELAND REGIONAL TRANSIT AUTHORITY NOTES TO FINANCIAL STATEMENTS
FOR THE YEARS ENDED DECEMBER 31, 2015 AND 2014
- 57 -
The Authority entered into commodity transaction agreements for Platts USG Ultra Low Sulfur Diesel with various counterparties, as shown below as of December 31, 2015:
PLATTS USG ULTRA LOW SULFER DIESELFair
Total Contract Market Execution Maturity Quantity Price Range Value
Date Date Gallons (Gallons) Per Gallon as of 12/31/158/20/2014 12/31/2016 42,000 504,000 $ 2.79-2.8440 (777,836)$
(777,836)$

GREATER CLEVELAND REGIONAL TRANSIT AUTHORITY NOTES TO FINANCIAL STATEMENTS
FOR THE YEARS ENDED DECEMBER 31, 2015 AND 2014
- 58 -
The Authority entered into commodity transaction agreements for New York Mercantile Exchange (NYMEX) New York Harbor No. 2 heating oil with various counterparties, as shown below as of December 31, 2014:
NYMEXTotal Contract Fair Market
Execution Maturity Quantity Price Range ValueDate Date Gallons (Gallons) (Per Gallon) As of 12/31/14
2/28/2013 3/31/2015 42,000 546,000 $ 2.792-2.872 $ (571,670) 3/5/2013 1/31/2015 42,000 42,000 $ 2.857 (42,966)
3/21/2013 4/30/2015 42,000 42,000 $ 2.82 (42,718) 4/12/2013 5/31/2015 42,000 42,000 $ 2.798 (41,769) 4/17/2013 7/31/2015 42,000 84,000 $ 2.777-2.7826 (80,342) 6/21/2013 12/31/2015 42,000 42,000 $ 2.704 (33,163) 11/5/2013 1/31/2016 42,000 210,000 $ 2.7475-2.7675 (182,616) 2/14/2014 6/30/2016 42,000 210,000 $ 2.6655-2.8451 (238,665) 8/12/2014 4/30/2015 42,000 126,000 $ 2.844-2.865 (130,633) 8/19/2014 4/30/2016 42,000 756,000 $ 2.7975-2.8443 (712,106) 8/20/2014 7/31/2016 42,000 210,000 $ 2.76-2.7715 (170,835) 8/21/2014 12/31/2016 42,000 84,000 $ 2.76 (61,127) 8/25/2014 4/30/2016 42,000 546,000 $ 2.7975-2.8365 (518,221) 8/28/2014 10/31/2016 42,000 126,000 $ 2.76 (96,793) 9/2/2014 2/15/2015 42,000 42,000 $ 2.8435 (42,416) 9/8/2014 10/31/2015 42,000 168,000 $ 2.796-2.8075 (157,618)
9/15/2014 12/15/2015 42,000 42,000 $ 2.717 (28,421) 9/22/2014 8/31/2015 42,000 42,000 $ 2.719 (31,193) 9/25/2014 11/30/2015 42,000 126,000 $ 2.725-2.7275 (90,514) 9/26/2014 1/31/2017 42,000 42,000 $ 2.728 (28,358) 10/1/2014 1/31/2016 42,000 252,000 $ 2.694-2.7165 (205,825) 10/2/2014 7/31/2016 42,000 252,000 $ 2.629-2.6705 (176,396) 10/6/2014 1/31/2016 42,000 126,000 $ 2.6665-2.672 (94,996) 10/9/2014 4/30/2016 42,000 126,000 $ 2.5915-2615 (83,609)
10/10/2014 7/31/2016 42,000 126,000 $ 2.5895-2.594 (80,753) 10/14/2014 10/31/2016 42,000 126,000 $ 2.55-2.56 (93,779) 10/15/2014 1/31/2016 42,000 126,000 $ 2.535-2.545 (63,319) 10/21/2014 4/30/2016 42,000 126,000 $ 2.4825-2.6705 (76,658) 10/22/2014 7/31/2016 42,000 126,000 $ 2.495-2.5015 (68,910) 10/31/2014 10/31/2016 42,000 126,000 $ 2.52-2.525 (56,662) 12/1/2014 1/31/2017 42,000 210,000 $ 2.282-2.3255 (59,346) 12/3/2014 4/30/2017 42,000 126,000 $ 2.3215-2.325 (33,961) 12/5/2014 12/31/2017 42,000 252,000 $ 2.2885-2.3295 (60,762) 12/8/2014 7/31/2015 42,000 126,000 $ 2.027-2.0476 (27,817) 12/9/2014 9/30/2016 42,000 21,000 $ 2.082-2.18 (40,992)
(4,525,929)$

GREATER CLEVELAND REGIONAL TRANSIT AUTHORITY NOTES TO FINANCIAL STATEMENTS
FOR THE YEARS ENDED DECEMBER 31, 2015 AND 2014
- 59 -
The Authority entered into commodity transaction agreements for Platts USG Ultra Low Sulfur Diesel with various counterparties, as shown below as of December 31, 2014:
Payments between the swap parties is the difference between the swap price per gallon and the unweighted arithmetic mean of each of the closing settlement prices quoted by the NYMEX, on each NYMEX trading day, during the settlement period for the No. 2 heating oil futures or Platts USG Ultra Low Sulfur Diesel. The derivatives are subject to the following risks: Interest Rate Risk – The Authority is not exposed to interest rate risk. Credit Risk – The Authority is exposed to credit risk in the amount of the derivative’s fair value. When the fair value of any derivative has a positive market value, then the Authority is exposed to the actual risk that the counterparty will not fulfill its obligations. As of December 31, 2015 and 2014, the counterparties had ratings of A3/A-/A- and A3/BBB+/A from Moody’s, Standard & Poor’s and Fitch, respectively. To mitigate the potential for credit risk, the Authority uses two banks so that no one bank holds all of the commodity swaps. The Authority incurred no additional debt in 2014. Market Risk – The Authority is exposed to market risk arising from adverse changes in the market price of the commodity.
12. RISK MANAGEMENT The Authority is exposed to various risks of loss related to third-party liability claims; theft of, damage to, and destruction of assets; errors and omissions; injuries to employees; and natural disasters. The Authority has a contract with an outside insurance company to provide all-risk property coverage with various limits on property and equipment of the Authority. The maximum limit of liability in any one occurrence, regardless of the number of locations or coverages involved, cannot exceed $500,000,000 and the deductible is $250,000. The Authority is self-insured for third-party bodily injury and third-party property damage liability claims, but has protection for the catastrophic loss exposure. Settled claims have not exceeded the self-insured retention in any of the last three years. The Authority purchases excess liability insurance to provide catastrophic protection of its assets against severe third-party liability losses. This umbrella liability coverage is in the amount of $75,000,000 per accident in excess of a $5,000,000 self-insured retention. The Authority provides employees healthcare benefits, which include medical, drug, dental, and vision. These benefits are provided through both insured and self-funded plans under group agreements. A stop-loss policy covers claims in excess of $500,000 per employee and an aggregate of $19,209,995 per year. Neither threshold was exceeded.
PLATTS USG ULTRA LOW SULFER DIESELFair
Total Contract Market Execution Maturity Quantity Price Range Value
Date Date Gallons (Gallons) Per Gallon as of 12/31/1412/16/2011 12/31/2015 42,000 504,000 $ 2.70-2.7975 (446,153)$ 8/19/2014 12/31/2015 42,000 504,000 $ 2.8410-2.8610 (501,942) 8/20/2014 12/31/2016 42,000 504,000 $ 2.79-2.8440 (413,238)
(1,361,333)$

GREATER CLEVELAND REGIONAL TRANSIT AUTHORITY NOTES TO FINANCIAL STATEMENTS
FOR THE YEARS ENDED DECEMBER 31, 2015 AND 2014
- 60 -
The Authority is also an authorized self-insured employer in the State of Ohio and administers its own workers’ compensation claims. Excess workers’ compensation insurance coverage protects the Authority in excess of a self-insured retention of $750,000 for each additional accident and each employee by disease. The GCRTA, by resolution of the Board of Trustees, established an insurance fund in fiscal year 1980 to accumulate monies to satisfy catastrophic or extraordinary losses. The insurance fund as of December 31, 2015 and 2014, was $6.7 and $6.3 million, respectively, and is included on the accompanying Statements of Net Position as part of unrestricted net position. Changes in the Authority’s self-insurance liabilities for third-party public liability, third-party property damage, worker’s compensation and medical claims are reflected in the table below.
13. COMMITMENTS AND CONTINGENCIES
During the normal course of operation, the Authority has been named as a defendant in certain legal actions and claims. The Authority Management is of the opinion that the disposition of these legal actions and claims will not have a material adverse effect on the financial condition of the Authority. The Authority purchases commercial insurance to cover certain potential losses.
14. RECLASSIFICATIONS
Certain prior year amounts have been reclassified for consistency with the current period presentation. These reclassifications had no effect on the reported results of operations.
15. SUBSEQUENT EVENTS During May, 2016, the Authority issued $15,410,000 of Sales Tax Supported Refunding Bonds. The proceeds of the
Series 2016 bonds will be used for the purpose of advance refunding of a portion of the Authority’s outstanding bonds.
2015 2014 2013Balance, Beginning of Year $ 23,396,744 $ 23,143,838 $ 22,639,546Incurred Claims 22,535,398 25,137,946 21,161,043Payments (24,328,368) (24,885,040) (20,656,751)Balance, End of Year $ 21,603,774 $ 23,396,744 $ 23,143,838
Due Within One Year $ 7,561,321 $ 8,188,860 $ 8,100,343

- 61 -
GREATER CLEVELAND REGIONAL TRANSIT AUTHORITY REQUIRED SUPPLEMENTARY INFORMATION
Greater Cleveland Regional Transit Authority implemented the provisions of Governmental Accounting Standards Board Statement No. 68, Accounting and financial Reporting for Pensions – an Amendment of GASB 27.
This section of the Authority Comprehensive Annual Financial Report presents required supplementary information as a context for further understanding of the Authority’s implementation of GASB 68.
The Pension liability (asset) summary information for the Traditional and Combined Plans of the Authority at December 31, 2014 and December 31, 2013 are reflected as follows:
Authority's Proportion of the Net Pension Liability 1.03688 % 1.03688 %
Authority's Proportion Share of the Net Pension Liability $ 125,059,292 $ 122,234,619
Authority's Covered-Employee Payroll $ 128,811,030 $ 121,260,856
Authority's Proportion Share of the Net Pension Liabilityas a Percentage of its Covered-employee Payroll 97.08741 % 100.80303 %
Plan Fiduciary Net Position as a Percentage of theTotal Pension Liability 86.45 % 86.36 %
Authority's Proportion of the Net Pension Liability 0.58799 % 0.58799 %
Authority's Proportion Share of the Net Pension Liability $ (226,389) $ (61,697)
Authority's Covered-Employee Payroll $ 2,115,861 $ 1,991,841
Authority's Proportion Share of the Net Pension Liabilityas a Percentage of its Covered-employee Payroll 10.69962 % 3.09749 %
Plan Fiduciary Net Position as a Percentage of theTotal Pension Liability 114.83 % 104.56 %
Traditional Plan 2014 2013
Combined Plan 2014 2013

- 62 -
The Pension contributions summary information for the Traditional and Combined Plans of the Authority for ten years are reflected as follows:
Traditional Plan:
Contractually Required
Contribution
Contributions in Relation to the
Contractually Required Contribution
Contribution Deficiency
(Excess)Authority Covered-
Employee Payroll
2015 15,848,700$ (15,848,700)$ -$ 130,840,483$ 12.11 %
2014 15,305,114$ (15,305,114)$ -$ 128,811,030$ 11.88 %
2013 14,774,422$ (14,774,422)$ -$ 121,260,856$ 12.18 %
2012 14,263,700$ (14,263,700)$ -$ 116,902,061$ 12.20 %
2011 13,544,025$ (13,544,025)$ -$ 110,431,785$ 12.26 %
2010 15,519,060$ (15,519,060)$ -$ 111,277,117$ 13.95 %
2009 16,541,079$ (16,541,079)$ -$ 124,836,354$ 13.25 %
2008 15,282,642$ (15,282,642)$ -$ 124,188,890$ 12.31 %
2007 15,310,201$ (15,310,201)$ -$ 120,346,494$ 12.72 %
2006 14,618,316$ (14,618,316)$ -$ 110,645,960$ 13.21 %
Combined Plan:
Contractually Required
Contribution
Contributions in Relation to the
Contractually Required Contribution
Contribution Deficiency (Excess)
Authority Covered-Employee Payroll
2015 267,630$ (267,630)$ -$ 2,149,197$ 12.45 %
2014 259,867$ (259,867)$ -$ 2,115,861$ 12.28 %
2013 249,489$ (249,489)$ -$ 1,991,841$ 12.53 %
2012 240,865$ (240,865)$ -$ 1,920,243$ 12.54 %
2011 228,712$ (228,712)$ -$ 1,813,962$ 12.61 %
2010 262,063$ (262,063)$ -$ 1,827,847$ 14.34 %
2009 279,322$ (279,322)$ -$ 2,050,573$ 13.62 %
2008 258,071$ (258,071)$ -$ 2,039,937$ 12.65 %
2007 258,536$ (258,536)$ -$ 1,976,822$ 13.08 %
2006 246,850$ (246,850)$ -$ 1,817,480$ 13.58 %
Contributions as a % of Covered-
Employee Payroll
Contributions as a % of Covered-Employee Payroll

2015
STATISTICAL SECTION COMPREHENSIVE ANNUAL FINANCIAL REPORT
- 63 -
STATISTICAL SECTION
This part of the Greater Cleveland Regional Transit Authority’s Comprehensive Annual Financial Report presents detailed information as a context for understanding what the information in the financial statements, note disclosures, and required supplementary information says about the Authority’s overall financial health.
Contents Page(s)
Financial Trends 64-69These schedules contain trend information to help the reader understand how the Authority 's financial performance and well-being have changed over time.
Revenue Capacity 70This schedule contains information to help the reader assess the Authority's mostsignificant local revenue source and the sales tax.
Debt Capacity 71-75These schedules present information to help the reader assess the affordability ofthe Authority's current levels of outstanding debt and the Authority's ability toissue additional debt in the future.issue additional debt in the future.
Economic and Demographic Information 76-78These schedules offer economic and demographic indicators to help the readerunderstand the environment within which the Authority's financial activities take place.
Operating Information 79-82These schedules contain service and infrastructure data to help the reader understandhow the information in the City's financial report relates to the services the Authority
Sources: Unless otherwise noted, the information in these schedules is derived from the Comprehensive Annual Financial Reports for the relevant year.

2006 2007 2008 2009 2010 2011 2012 2013 2014 2015Net Investment in Capital Assets $539,310 $565,353 $574,960 $574,797 $588,533 $569,852 $546,456 $546,042 $576,014 $601,570Restricted 8,825 6,676 21,659 18,700 16,269 20,739 25,516 49,197 35,324 50,764Unrestricted 35,624 36,060 20,434 16,313 43,446 61,689 63,830 48,311 35,375 (75,145)
Total Net Position $583,759 $608,089 $617,053 $609,810 $648,248 $652,280 $635,802 $643,550 $646,713 $577,189
TABLE 1
GREATER CLEVELAND REGIONAL TRANSIT AUTHORITY
NET POSITION BY COMPONENTS
LAST TEN YEARS (IN THOUSANDS)
-64-
$100,000
$200,000
$300,000
$400,000
$500,000
$600,000
$700,000
2006 2007 2008 2009 2010 2011 2012 2013 2014 2015
NET POSITION
Unrestricted
Restricted
Net Investment in Capital Assets


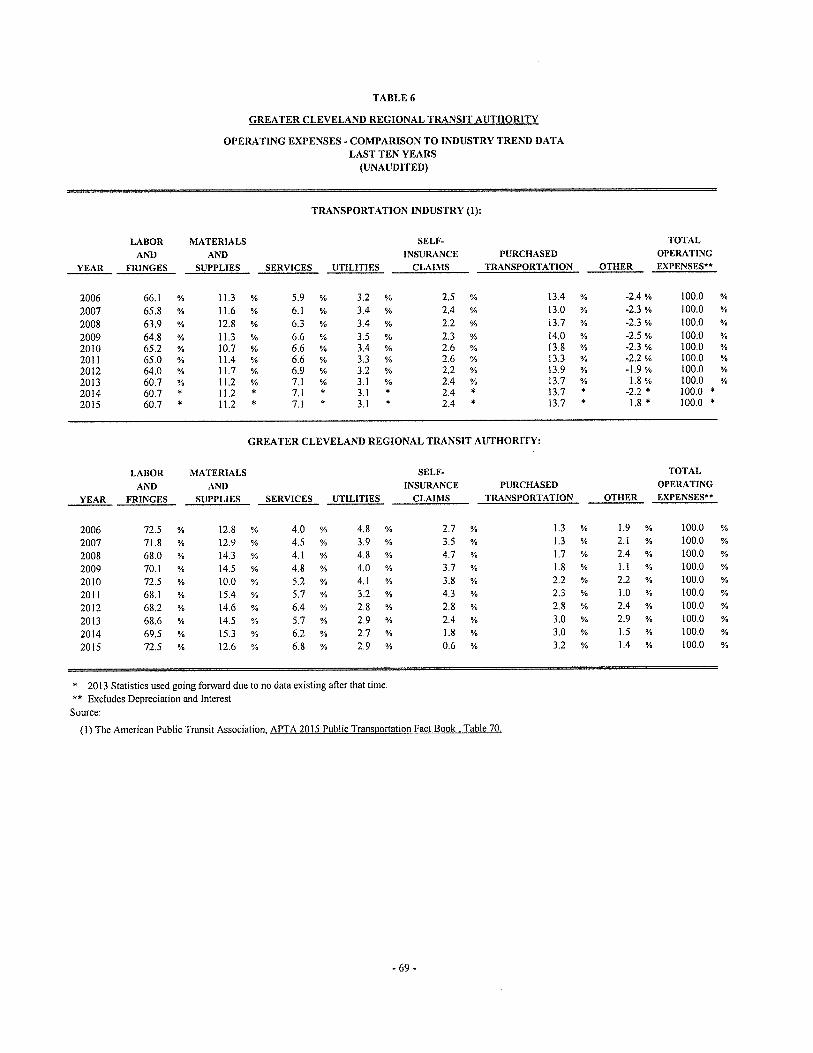
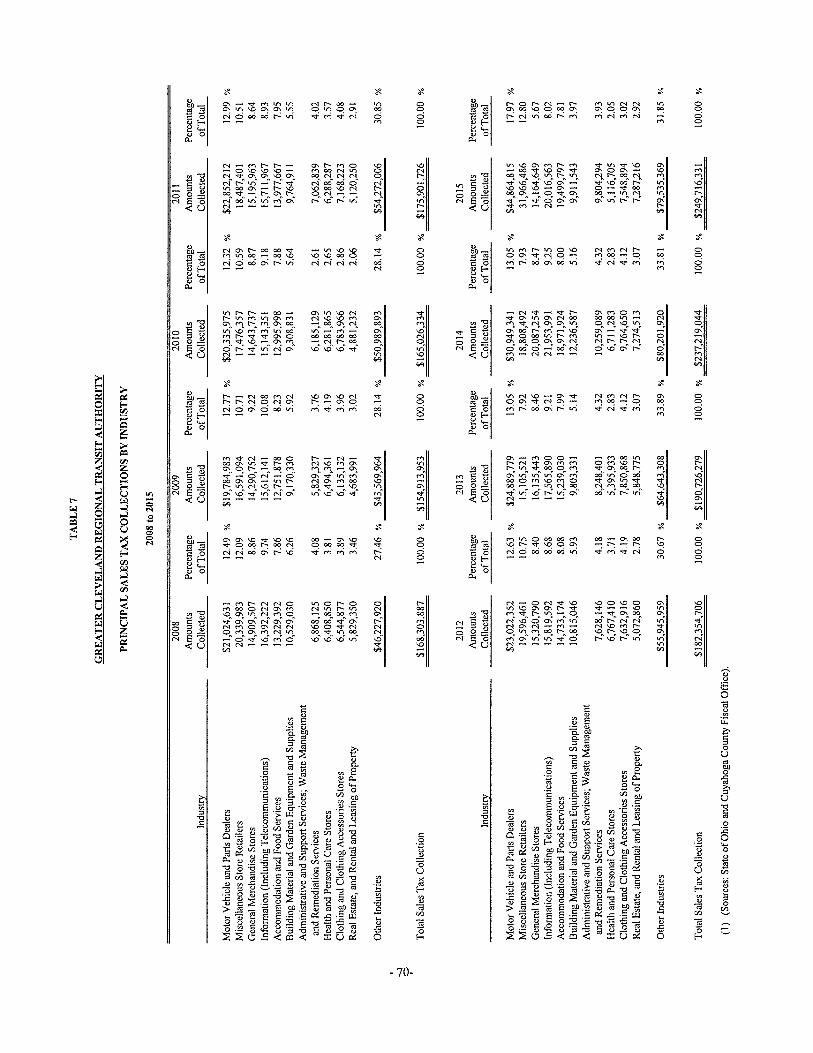


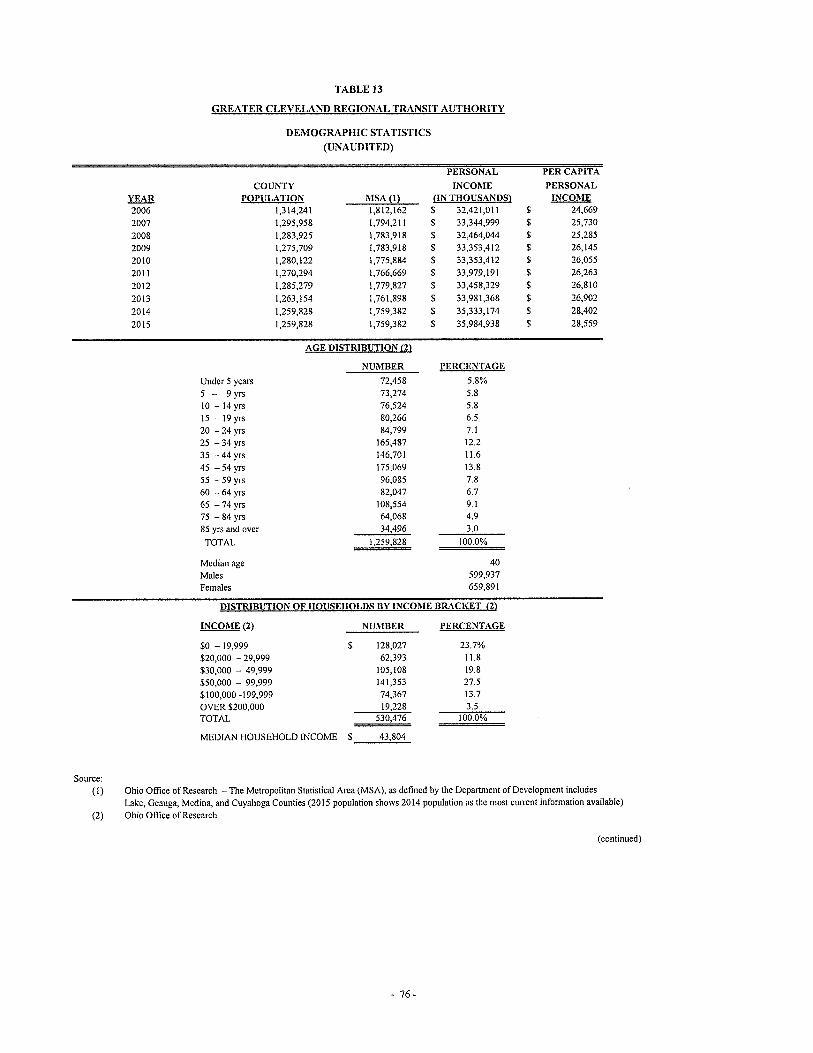
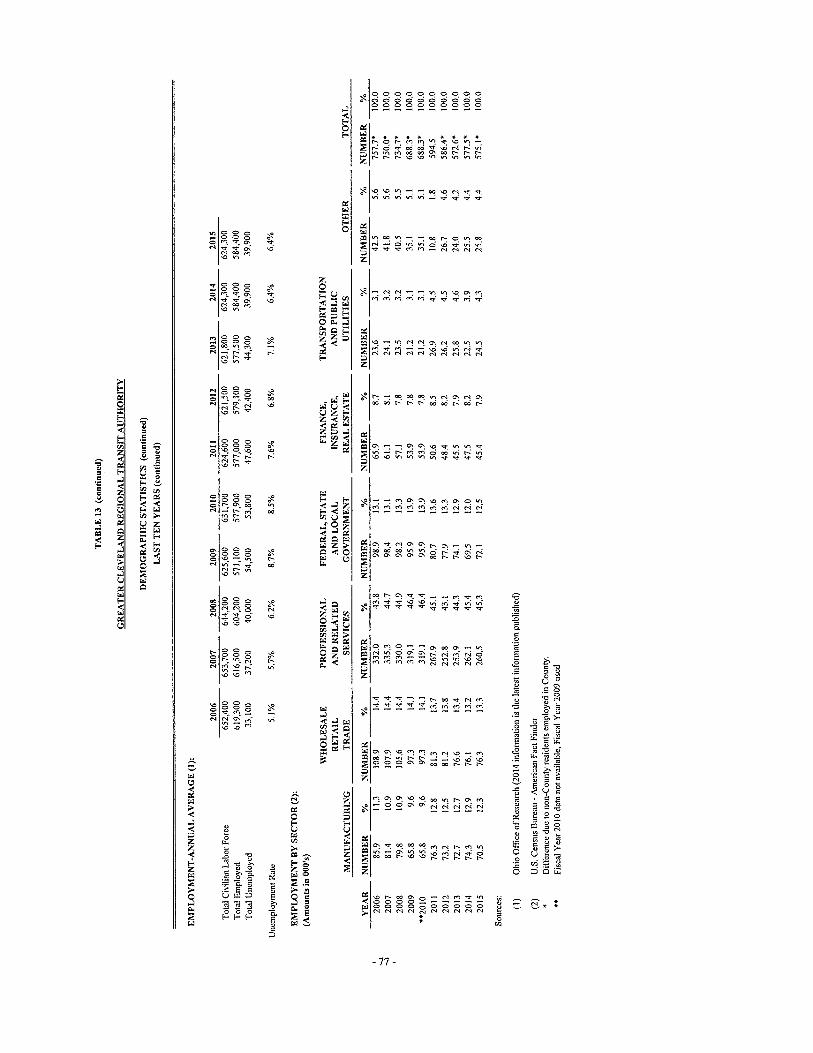
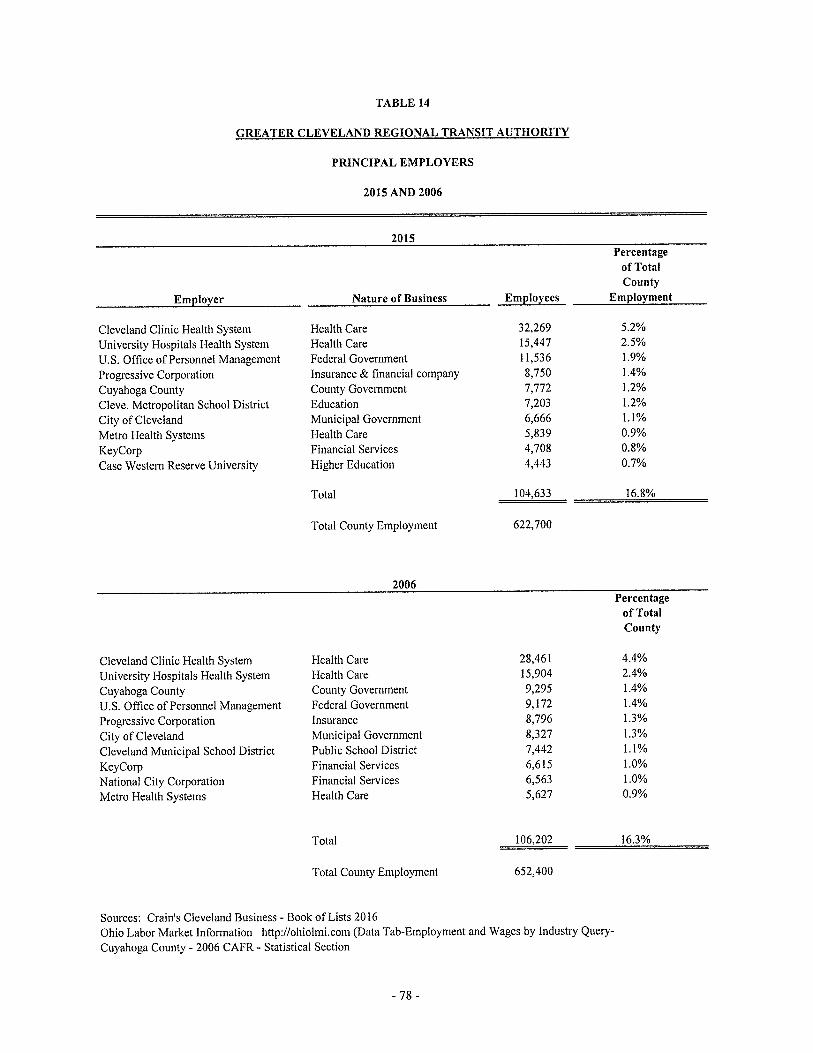

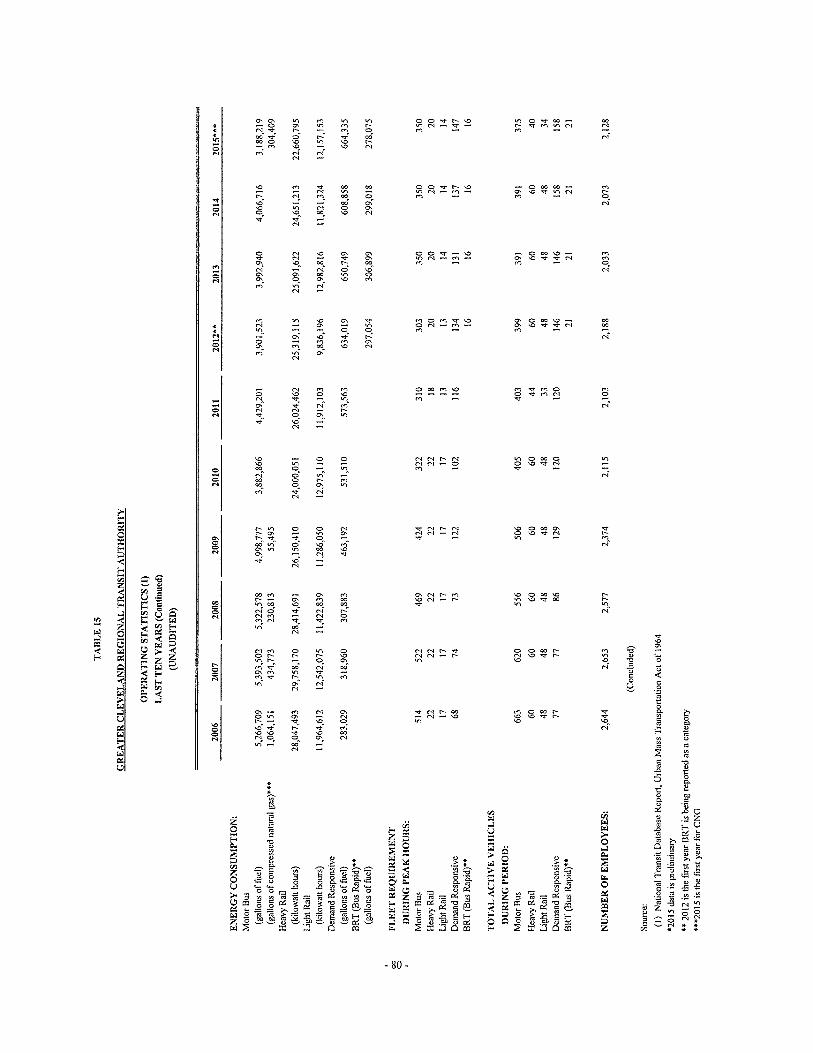
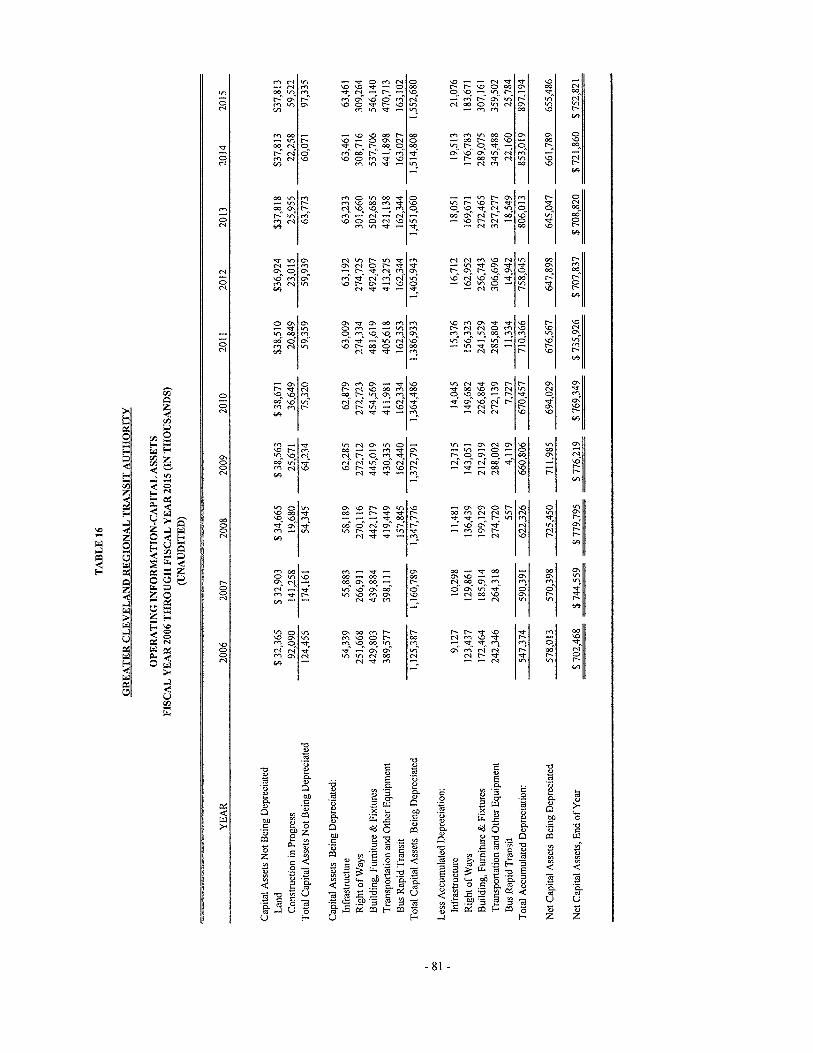
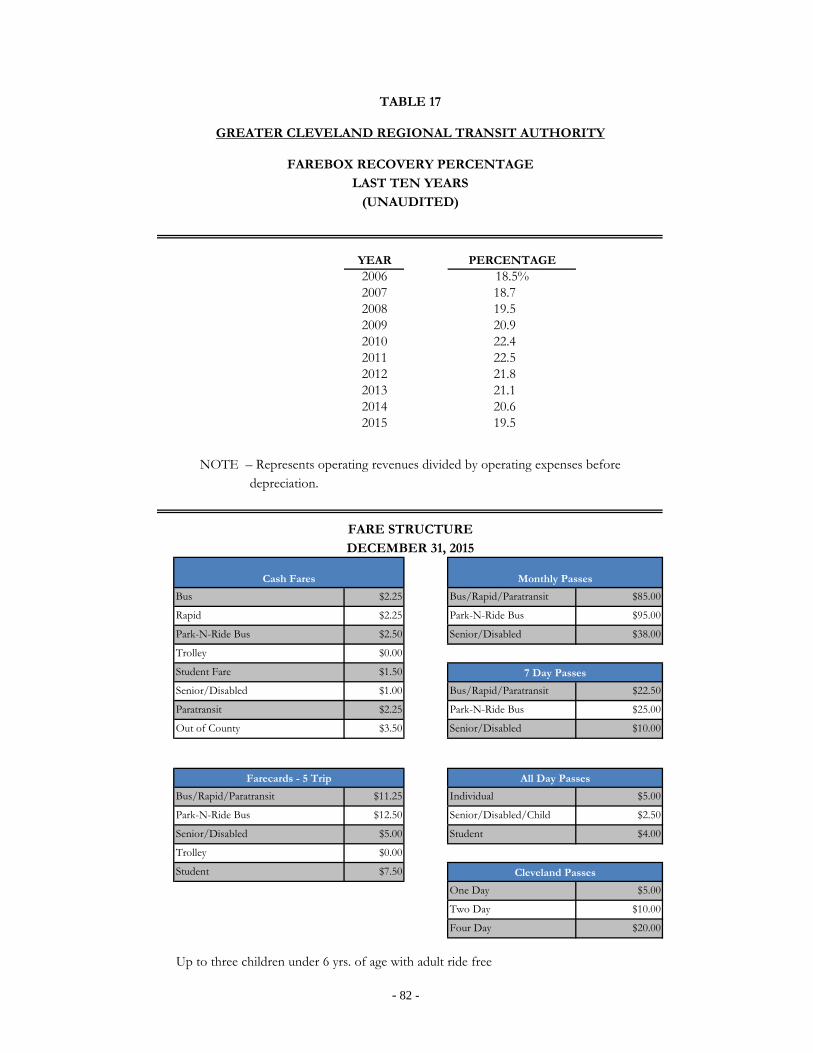
- 82 -
YEAR PERCENTAGE2006 18.5%2007 18.72008 19.52009 20.92010 22.42011 22.52012 21.82013 21.12014 20.62015 19.5
depreciation.
FARE STRUCTUREDECEMBER 31, 2015
Bus $2.25 Bus/Rapid/Paratransit $85.00
Rapid $2.25 Park-N-Ride Bus $95.00
Park-N-Ride Bus $2.50 Senior/Disabled $38.00
Trolley $0.00
Student Fare $1.50
Senior/Disabled $1.00 Bus/Rapid/Paratransit $22.50
Paratransit $2.25 Park-N-Ride Bus $25.00
Out of County $3.50 Senior/Disabled $10.00
Bus/Rapid/Paratransit $11.25 Individual $5.00
Park-N-Ride Bus $12.50 Senior/Disabled/Child $2.50
Senior/Disabled $5.00 Student $4.00
Trolley $0.00
Student $7.50
One Day $5.00
Two Day $10.00
Four Day $20.00
Up to three children under 6 yrs. of age with adult ride free
Cleveland Passes
All Day Passes
7 Day Passes
TABLE 17
GREATER CLEVELAND REGIONAL TRANSIT AUTHORITY
FAREBOX RECOVERY PERCENTAGELAST TEN YEARS
Farecards - 5 Trip
(UNAUDITED)
NOTE – Represents operating revenues divided by operating expenses before
Cash Fares Monthly Passes

Greater Cleveland Regional Transit Authority • 1240 West Sixth Street • Cleveland, Ohio 44113-1302 • rideRTA.com