comprehensive annual financial report - … · governmental funds: ... except for certain special...
TRANSCRIPT

COMPREHENSIVE ANNUAL FINANCIAL REPORT
Fiscal Year Ended June 30, 2015
City of Sonoma, California

This page intentionally left blank.
CITY OF SONOMA, CALIFORNIA
ANNUAL FINANCIAL REPORT
FOR THE FISCAL YEAR ENDED
JUNE 30, 2015
Prepared by:
DeAnna Hilbrants Finance Director

This page intentionally left blank.

City of Sonoma, California Basic Financial Statements For the year ended June 30, 2015 Table of Contents
i
Page
Table of Contents .................................................................................................................................. i Letter of Transmittal ........................................................................................................................... v Organization Chart ............................................................................................................................. x List of Officials .................................................................................................................................... xi
Independent Auditors’ Report ........................................................................................................... 1 Management’s Discussion and Analysis (Required Supplementary Information) ....................... 3 Basic Financial Statements:
Government-Wide Financial Statements: Statement of Net Position ........................................................................................................ 19 Statement of Activities ............................................................................................................ 20
Fund Financial Statements:
Governmental Funds: Balance Sheet ................................................................................................................................ 24 Reconciliation of Governmental Funds Balance Sheet to the
Statement of Net Position ........................................................................................................ 26 Reconciliation of Fund Basis Balance Sheet to Government-wide
Statement of Net Position – Governmental Activities ............................................................. 27 Statement of Revenues, Expenditures, and Changes
in Fund Balances – Governmental Funds ................................................................................ 28 Reconciliation of Fund Basis Statements to Government-wide
Statement of Activities ............................................................................................................ 30 Reconciliation of the Statement of Revenues, Expenditures, and Changes
in Fund Balances of Governmental Funds to the Statement of Activities ............................... 31 Statement of Revenues, Expenditures, and Changes in
Fund Balances - Budget to Actual – General Fund and Major Special Revenue Funds ................................................................................................. 32
FINANCIAL SECTION
INTRODUCTORY SECTION

City of Sonoma, California Basic Financial Statements For the year ended June 30, 2015 Table of Contents, Continued
ii
Page Basic Financial Statements, Continued:
Fund Financial Statements, Continued:
Proprietary Funds: Statement of Net Position – Proprietary Funds ............................................................................ 36 Statement of Revenues, Expenses, and Changes in Fund Net Position –
Proprietary Funds .................................................................................................................... 37 Statement of Cash Flows – Proprietary Funds ............................................................................. 38
Fiduciary Activities: Statement of Fiduciary Net Position – Fiduciary Activities .......................................................... 41 Statement of Changes in Fiduciary Net Position – Private Purpose Trust Fund ........................... 42
Notes to Basic Financial Statements ................................................................................................ 46 Other Supplemental Information: Required Supplementary Information
Schedule of Contributions – Miscellaneous Plan .......................................................................... 90 Schedule of Contributions – PEPRA Miscellaneous Plan ............................................................. 91 Schedule of Contributions – Safety Fire Plan ................................................................................ 92 Schedule of Contributions – Safety Police Plan ............................................................................ 93 Schedule of City’s Proportionate Share of the Net Pension Liability – Miscellaneous Plan .................................................................................................................. 94 Schedule of City’s Proportionate Share of the Net Pension Liability – PEPRA Miscellaneous Plan ..................................................................................................... 95 Schedule of City’s Proportionate Share of the Net Pension Liability – Safety Fire Plan ........................................................................................................................ 96 Schedule of City’s Proportionate Share of the Net Pension Liability – Safety Police Plan .................................................................................................................... 97
Combining and Individual Fund Financial Statements and Schedules:
Nonmajor Governmental Funds: Combining Balance Sheet ........................................................................................................... 102 Combining Statement of Revenues, Expenditures, and Changes
in Fund Balances ................................................................................................................... 103
Nonmajor Special Revenue Funds: Combining Balance Sheet............................................................................................................ 106 Combining Statement of Revenues, Expenditures, and Changes
in Fund Balances .................................................................................................................. 108 Schedule of Revenues, Expenditures, and Changes in Fund Balances –
Budget to Actual – Strong Motion ...................................................................................... 110
City of Sonoma, California Basic Financial Statements For the year ended June 30, 2015 Table of Contents, Continued
iii
Page Combining and Individual Fund Financial Statements and Schedules, Continued:
Schedule of Revenues, Expenditures, and Changes in Fund Balances –
Budget to Actual – Asset Forfeiture .................................................................................... 111 Schedule of Revenues, Expenditures, and Changes in Fund Balances –
Budget to Actual – SLESF .................................................................................................. 112 Schedule of Revenues, Expenditures, and Changes in Fund Balances –
Budget to Actual – Bond Property Maintenance ................................................................... 113 Schedule of Revenues, Expenditures, and Changes in Fund Balances –
Budget to Actual – Maysonnave Property ............................................................................. 114 Schedule of Revenues, Expenditures, and Changes in Fund Balances –
Budget to Actual – Schell Drainage ...................................................................................... 115 Schedule of Revenues, Expenditures, and Changes in Fund Balances –
Budget to Actual – Abandoned Vehicle ................................................................................ 116 Schedule of Revenues, Expenditures, and Changes in Fund Balances –
Budget to Actual – Sonoma Creek Senior Housing .............................................................. 117 Schedule of Revenues, Expenditures, and Changes in Fund Balances –
Budget to Actual – Community Development Block Grant .................................................. 118 Nonmajor Capital Projects and Debt Service Funds: Combining Balance Sheet ........................................................................................................... 120 Combining Statement of Revenues, Expenditures, and Changes
in Fund Balances .................................................................................................................... 122
Internal Service Funds: Combining Statement of Net Position – Internal Service Funds ................................................ 126 Combining Statement of Revenues, Expenses, and Changes
in Net Position – Internal Service Funds .............................................................................. 128 Combining Statement of Cash Flows – Internal Service Funds ................................................. 130 Agency Funds: Combining Statement of Assets and Liabilities – Agency Funds……………………………. 134 Combining Statement of Changes in Assets and Liabilities – Agency Funds…………………. 136
City of Sonoma, California Basic Financial Statements For the year ended June 30, 2015 Table of Contents, Continued
iv
Page Net position by Component ............................................................................................................... 140 Changes in Net position ..................................................................................................................... 142 Fund Balances, Governmental Funds ................................................................................................ 146 Changes in Fund Balances, Governmental Funds ............................................................................. 148 Assessed Value and Actual Value of Taxable Property .................................................................... 150 Direct and Overlapping Tax Rates .................................................................................................... 152 Principal Property Tax Payers ........................................................................................................... 154 Schedule of Top 25 Principal Sales Tax Remitters ........................................................................... 155 Property Tax Levies and Collections ................................................................................................. 156 Direct and Overlapping Debt ............................................................................................................. 157 Legal Debt Margin Information ......................................................................................................... 158 Demographic and Economic Statistics .............................................................................................. 160 Principal Employers ........................................................................................................................... 161 Full-time and Part-time Employees by Function ............................................................................... 162 Operating Indicators by Function ...................................................................................................... 164 Capital Asset Statistics by Function .................................................................................................. 166 Capital Asset Statistics by Funds ....................................................................................................... 168 Report on Internal Control Over Financial Reporting and on Compliance and Other Matters Based on an Audit of Financial Statements Performed in Accordance with Government Auditing Standards ..................................................................... 171
STATISTICAL SECTION (Unaudited)
City of Sonoma No. 1 The Plaza
Sonoma California 95476-6690 Phone (707) 938-3681 Fax (707) 938-8775
E-Mail: [email protected]
June 28, 2016 To the Honorable Mayor and Members of the City Council and Citizens of the City of Sonoma: We are pleased to submit the City of Sonoma’ Annual Financial Report for the fiscal year ended June 30, 2015. It is the policy of the Council that a licensed certified public accountant conducts an annual audit at the end of each fiscal year and issue a complete set of financial statements to be submitted to them. The financial statements are presented in conformity with generally accepted accounting principles (GAAP) and audited in accordance with generally accepted auditing standards. Responsibility for the accuracy of the data and the fairness of presentation, including all footnotes and disclosures, rests with the City. We believe the data presented in this report is accurate in all material respects and all statements and disclosures necessary for the reader to obtain a thorough understanding of the City’s financial activities have been included. Management of the City has established an internal control framework that is designed both to protect the City’s assets from loss, theft, or misuse and to compile sufficient reliable information for the preparation of the City’s financial statements in conformity with GAAP. Because the cost of internal controls should not outweigh their benefits, the City’s framework of internal controls has been designed to provide reasonable rather than absolute assurance that the financial statements will be free from material misstatements. While traditionally addressed to the governing body of the City, this report is intended to provide relevant financial information to the citizens of the City of Sonoma, City staff, creditors, investors, and other concerned readers. We encourage all readers to contact the Finance Department with any questions or comments concerning this report. The City’s financial statements have been audited by JJACPA, Inc., a firm of certified public accountants. The goal of the independent audit is to provide reasonable assurance that the financial statements of the City for the fiscal year ended June 30, 2015, are free of material misstatements. The independent audit involved examining, on a test basis, evidence supporting the amounts and disclosures in the financial statements, assessing the accounting principles used and significant estimates made by management, and evaluating the overall financial statement presentation. Based upon the audit, the independent auditors concluded that there was reasonable basis for rendering an unqualified opinion, which states that the City’s financial statements for the fiscal year ended June 30, 2015, are fairly presented in conformity with GAAP. The independent auditor’s report is presented as the first component of the financial section of this report.

vi
GAAP requires that management provide a narrative introduction, overview, and analysis to accompany the basic financial statements in the form of Management’s Discussion and Analysis (MD&A). This letter of transmittal is designed to complement MD&A and should be read in conjunction with it. The City’s MD&A can be found immediately following the report of the independent auditors. Profile of the City of Sonoma The City of Sonoma is located in southeastern Sonoma County in the San Francisco Bay area on State Highway 12. The City is about 50 miles northeast of San Francisco and 20 miles southeast of the City of Santa Rosa. Approximately 2.2 square miles in size, the City of Sonoma is a small, historic community of some 10,933 residents. Located in the heart of the Wine Country and surrounded by world-class wineries and scenic vineyards, the mainstays of the local economy are agriculture, tourism, and public services. The City serves as the economic hub of Sonoma Valley. Originally founded in 1823, the City was incorporated on September 3, 1883 under the general laws of the State of California. The City is a municipal corporation operating as a general law city. The Sonoma City Council consists of five members, elected at-large to four-year overlapping terms. Council members must be residents of the City. The positions of Mayor and Mayor Pro Tem are chosen by the City Council through policy direction determined by the City Council. The Mayor conducts the Council meetings and represents the City on ceremonial occasions. The City Council serves as the policy board for the municipality. As an elected Board of Directors, the City Council provides policy direction, establishes goals, and sets priorities for the City government. In addition to serving as the policy makers for the community, the City Council also is responsible for numerous land use decisions within its borders, including the General Plan. The City Council appoints the City Manager, City Attorney, and all members of advisory boards, commissions, and committees. The City of Sonoma operates under a Council-Manager form of government and provides municipal services that include public safety, public works and parks, community development and community activities. In addition, the City operates a water system and three cemeteries in the form of enterprise activities. This report includes all funds of the City of Sonoma and its blended component unit, the Successor Agency of the Sonoma Community Development Agency, for which the City is financially accountable. The City Council establishes annual budgets for the General Fund and all Special Revenue Funds, except for certain Special Revenue Funds for which expenditures are controlled by grant funding or by assessments received. Budgetary control is legally maintained at the fund level for these funds. Department heads submit budget requests to the City Manager. The City Manager prepares an estimate of revenues and prepares recommendations for the next year’s budget. The preliminary budget may or may not be amended by the City Council and is adopted by resolution by the City Council on or before June 30 in accordance with the municipal code.
vii
In Sonoma, the total labor force is approximately 8,200. Unemployment in Sonoma is approximately 4.0 %. The City of Sonoma is committed to providing high quality services in an economical manner. For fiscal year 2014/15, the City’s efforts were focused in the following areas. Balancing City Character: To promote effective communication between City Council, residents, and businesses so that decisions reflect the community's desires and expectations; provide open dialog which is responsive to residents, and is characterized by ethical behavior, stability, public trust, transparency, confidence in the future, and cooperative interaction among civic leaders, residents, business representatives, and staff, while recognizing and respecting legitimate differences of opinion on critical issues facing the City; recognize the City’s economic attributes and build a cohesive relationship which allows the City to continue to thrive. Economic Development – Explore Economic Development Drivers to ensure preservation and long term viability of Community Assets. Fiscal Management: Maintain fiscal responsibility that ensures short and long-term prosperity through effective fiscal planning and efficient management of the taxpayers' assets; apply sound budget strategy to assure financial sustainability in the General and Enterprise Funds through the continued application of sound financial policies; maintain stable reserve levels. Infrastructure: To provide reliable, safe and effective infrastructure (streets & roads, sidewalks, transportation, parking and pedestrian safety) throughout the City; work with Sonoma County and Caltrans to increase maintenance on connector streets and/or State Hwy 12 through downtown Sonoma. Policy & Leadership: Provide continuing leadership as elected officials and residents of the community; review Mission and Vision Statement to assure that it reflects the current economic, environmental and social climate and creates a visual image for the community; take steps to assure a safe and vibrant community; respond to County, State and Federal legislative issues with a focus on retaining local control. Public Service: Expand efficiencies with a focus on providing excellent customer service; openly share information about City actions, events and decisions; increase the awareness of City programs and promote community participation; improve public access to City information. Recreation and Community Resources: Promote coordination of efforts of local and regional non-profits, community youth groups, School District and Sonoma Valley organizations; work with County to address lack of County resources available and potential long-range opportunities to share resources with the City Water: Develop long-term strategies to address current and future infrastructure needs, promote water conservation while maintaining a stabilized rate structure; strengthen Capital infrastructure needs with a focus on enhancing the City’s local water supply; promote and support the value of water conservation to protect local resources.
ix
This page intentionally left blank.

City of Sonoma, California Basic Financial Statements For the year ended June 30, 2015 Organization Chart
x

City of Sonoma, California Basic Financial Statements For the year ended June 30, 2015 List of Officials
xi
Laurie Gallian, Mayor Madolyn Agrimonti, Mayor Pro Tem David Cook, Council Member Gary Edwards, Council Member Rachel Hundley, Council Member
Carol Giovanatto, City Manager Gay Johann, Assistant City Manager/City Clerk DeAnna Hilbrants, Finance Director Mark Freeman, Fire Chief David Goodison, Planning Director Bret Sackett, Chief of Police Dan Takasugi, Public Works Director / City Engineer Jeffrey Walter (Walter & Pistole), City Attorney Wayne Wirick, Development Services Director / Building Official
Barbara Cates, Accounting Technician Rebecca Stewart, Accounting Technician Leticia Carranza, Administrative Clerk Anjanette Scott, Volunteer (Analyst)
FINANCE DEPARTMENT
CITY OFFICIALS
CITY COUNCIL

xii
This page intentionally left blank.
7080 Donlon Way, Suite 204, Dublin, CA 94568 ● phone (925) 556-6200 ● fax: (925) 556-6201 www.jjacpa.com
INDEPENDENT AUDITOR’S REPORT To the Honorable Mayor and City Council City of Sonoma Sonoma, California Report on the Financial Statements We have audited the accompanying financial statements of the governmental activities, the business-type activities, each major fund, the aggregate remaining fund information, and the budgetary comparison information of the City of Sonoma, California (City), as of and for the year ended June 30, 2015, and the related notes to the financial statements, which collectively comprise the City’s basic financial statements as listed in the table of contents. Management’s Responsibility for the Financial Statements Management is responsible for the preparation and fair presentation of these financial statements in accordance with accounting principles generally accepted in the United States of America; this includes the design, implementation, and maintenance of internal control relevant to the preparation and fair presentation of financial statements that are free from material misstatement, whether due to fraud or error. Auditor’s Responsibility Our responsibility is to express opinions on these financial statements based on our audit. We conducted our audit in accordance with auditing standards generally accepted in the United States of America and the standards applicable to financial audits contained in Government Auditing Standards, issued by the Comptroller General of the United States. Those standards require that we plan and perform the audit to obtain reasonable assurance about whether the financial statements are free from material misstatement. An audit involves performing procedures to obtain audit evidence about the amounts and disclosures in the financial statements. The procedures selected depend on the auditor’s judgment, including the assessment of the risks of material misstatement of the financial statements, whether due to fraud or error. In making those risk assessments, the auditor considers internal control relevant to the entity’s preparation and fair presentation of the financial statements in order to design audit procedures that are appropriate in the circumstances, but not for the purpose of expressing an opinion on the effectiveness of the entity’s internal control. Accordingly, we express no such opinion. An audit also includes evaluating the appropriateness of accounting policies used and the reasonableness of significant accounting estimates made by management, as well as evaluating the overall presentation of the financial statements. We believe that the audit evidence we have obtained is sufficient and appropriate to provide a basis for our audit opinions. Opinions In our opinion, the financial statements referred to above present fairly, in all material respects, the respective financial position of the governmental activities, the business-type activities, each major fund, the aggregate remaining fund information, and the budgetary comparison information of the City, as of June 30, 2015, and the respective changes in financial position and, where applicable, cash flows thereof for the year then ended in accordance with accounting principles generally accepted in the United States of America.

To the Honorable Mayor and City Council The City of Sonoma Sonoma, California Page 2
Other Matters
Required Supplementary Information
Accounting principles generally accepted in the United States of America require that the management’s discussion and analysis on pages 3–15, the City’s Schedules of Contributions on pages 90-93, and the Schedules of the City’s proportionate Share of the Net Pension Liability on pages 94-97, be presented to supplement the basic financial statements. Such information, although not a part of the basic financial statements, is required by the Governmental Accounting Standards Board who considers it to be an essential part of financial reporting for placing the basic financial statements in an appropriate operational, economic, or historical context. We have applied certain limited procedures to the required supplementary information in accordance with auditing standards generally accepted in the United States of America, which consisted of inquiries of management about the methods of preparing the information and comparing the information for consistency with management’s responses to our inquiries, the basic financial statements, and other knowledge we obtained during our audit of the basic financial statements. We do not express an opinion or provide any assurance on the information because the limited procedures do not provide us with sufficient evidence to express an opinion or provide any assurance.
Other Information
Our audit was conducted for the purpose of forming opinions on the financial statements that collectively comprise the City’s basic financial statements. The combining and individual nonmajor fund financial statements and the introductory section are presented for purposes of additional analysis and are not a required part of the basic financial statements.
The combining and individual nonmajor fund financial statements are the responsibility of management and were derived from and relates directly to the underlying accounting and other records used to prepare the basic financial statements. Such information has been subjected to the auditing procedures applied in the audit of the basic financial statements and certain additional procedures, including comparing and reconciling such information directly to the underlying accounting and other records used to prepare the basic financial statements or to the basic financial statements themselves, and other additional procedures in accordance with auditing standards generally accepted in the United States of America. In our opinion, the combining and individual nonmajor fund financial statements is fairly stated, in all material respects, in relation to the basic financial statements as a whole.
The introductory section and statistical sections have not been subjected to the auditing procedures applied in the audit of the basic financial statements, and accordingly, we do not express an opinion or provide any assurance on it
Implementation of New Accounting Standards
As disclosed in the Note 1 to the financial statements, the City implemented GASB Statement No. 68, Accounting and Financial Reporting for Pensions – an amendment of GASB Statement No. 27, and GASB Statement No. 71, Pension Transition for Contributions Made Subsequent to the Measurement Date – an amendment of GASB Statement No. 68, during the fiscal year 2015.
Other Reporting Required by Government Auditing Standards
In accordance with Government Auditing Standards, we have also issued our report dated June 28, 2016 on our consideration of the City's internal control over financial reporting and on our tests of its compliance with certain provisions of laws, regulations, contracts, and grant agreements and other matters. The purpose of that report is to describe the scope of our testing of internal control over financial reporting and compliance and the results of that testing, and not to provide an opinion on internal control over financial reporting or on compliance. That report is an integral part of an audit performed in accordance with Government Auditing Standards in considering City’s internal control over financial reporting and compliance.
JJACPA, Inc. June 28, 2016 JJACPA, Inc. Dublin, CA
City of Sonoma, California Basic Financial Statements For the year ended June 30, 2015 Management’s Discussion and Analysis, Continued
3
This section provides a narrative overview and analysis of the financial activities of the City of Sonoma (City) for the fiscal year ended June 30, 2015. It should be read in conjunction with the accompanying transmittal letter and basic financial statements. FINANCIAL HIGHLIGHTS
The City's total net position was $57.1 million, an increase of about $3.8 million over the course of this year’s operations after conducting all City operations and programs. This increase is primarily related to an accounting change relating to tracking of capital assets especially for internal service funds and enterprise funds. This increase was offset by a decrease related to entry of long term pension liabilities as required under GASB 68.
The assets of the City exceeded its liabilities by about $58.8 million at the end of the 2015 fiscal year. Of that amount, $3.6 million (the unrestricted net position) may be used to meet the City's ongoing obligations and operating expenses for the next fiscal year. This unrestricted net position has declined as a result of the entry of long term pension liabilities as required under GASB 68.
Overall City-wide revenues from all governmental and business-type activities increased by $1,439,507 compared to the 2014 fiscal year. The City's total expense of all programs in fiscal 2015 decreased by $201,640 compared to the 2014 fiscal year.
The general fund reported a fund balance of $6.9 million at the end of the 2015 fiscal year, an increase of $46,829.
The City also ended the fiscal year with $4.2 million reported in the proprietary enterprise funds (the amount of net position available for use, including unrestricted net position, but excluding the investment in capital assets net of related debt).
OVERVIEW OF THE ANNUAL FINANCIAL REPORT This Annual Financial Report is in two major parts: 1) Introductory section, which includes the Transmittal Letter and general information; and, 2) Financial section, which includes the Management’s Discussion and Analysis (this part), the Basic
Financial Statements, which include the Government-wide and the Fund Financial Statements along with the notes to these financial statements, and Combining and Individual Fund Financial Statements and Schedules.
3) Statistical section, which includes detailed information as a context for understanding what the information in the financial statements, and footnotes says about the City's overall financial health.
City of Sonoma, California Basic Financial Statements For the year ended June 30, 2015 Management’s Discussion and Analysis, Continued
4
OVERVIEW OF THE ANNUAL FINANCIAL REPORT, Continued The Basic Financial Statements The Basic Financial Statements are comprised of the Government-wide Financial Statements and the Fund Financial Statements; these two sets of financial statements provide two different views of the City’s financial activities and financial position. Government-wide Financial Statements The Government-wide Financial Statements provide a broad overview of the City’s activities as a whole and comprise the Statement of Net Position and the Statement of Activities. The Statement of Net Position provides information about the financial position of the City as a whole, including all its capital assets and long-term liabilities on the full accrual basis, similar to that used by corporations. The Statement of Activities provides information about all the City’s revenues and all its expenses, also on the full accrual basis, with the emphasis on measuring net revenues or expenses of each the City’s programs. The Statement of Activities explains in detail the change in Net Position for the year. All of the City’s activities are grouped into Governmental Activities and Business-type activities, as explained below. All the amounts in the Statement of Net Position and the Statement of Activities are separated into Governmental Activities and Business-type Activities in order to provide a summary of these two activities of the City as a whole.
Governmental activities – All of the City’s basic services are considered to be governmental activities, including general government, community development, community activities, public safety, engineering, public improvements, planning and zoning, building inspections, and general administration. These services are supported by general City revenues such as taxes and by specific program revenues such as developer fees.
Business-type activities – All the City’s enterprise activities are reported here, including Water,
and Cemetery. Unlike governmental services, these services are supported by charges paid by users based on the amount of the service they use.
Fund Financial Statements A fund is a grouping of related accounts that is used to maintain control over resources that have been segregated for specific activities or objectives. The City, like other state and local governments, uses fund accounting to ensure and demonstrate compliance with finance-related legal requirements. All of the funds of the City can be divided into two categories: governmental funds and proprietary funds.

City of Sonoma, California Basic Financial Statements For the year ended June 30, 2015 Management’s Discussion and Analysis, Continued
5
OVERVIEW OF THE ANNUAL FINANCIAL REPORT, Continued Fund Financial Statements, Continued Governmental funds. Governmental funds are used to account for essentially the same functions reported as governmental activities in the Government-wide Financial Statements. However, unlike the Government-wide Financial Statements, Governmental Fund Financial Statements focus on near-term inflows and outflows of spendable resources, as well as on balances of spendable resources available at the end of the fiscal year. Such information may be useful in evaluating a government’s near-term financing requirements. Because the focus of the Governmental Fund Financial Statements is narrower than that of the Government-wide Financial Statements, it is useful to compare the information presented for governmental funds with similar information presented for governmental activities in the Government-wide Financial Statement. By doing so, readers may better understand the long-term impact of the government’s near-term financial decisions. Both the governmental fund balance sheet and the governmental fund statement of revenues, expenditures, and changes in fund balances provide a reconciliation to facilitate this comparison between governmental funds and governmental activities. The Governmental Fund Financial Statements provide detailed information about each of the City’s most significant funds, called major funds. The concept of major funds, and the determination of which are major funds, was established by GASB Statement No. 34 and replaces the concept of combining like funds and presenting them as one total. Instead, each major fund is presented individually, with all nonmajor funds summarized and presented only in a single column. Subordinate schedules present the detail of these nonmajor funds. Major funds present the major activities of the City for the year, and may change from year to year as a result of changes in the pattern of the City’s activities. For the fiscal year ended June 30, 2015, the City’s major funds are as follows: GOVERNMENTAL FUNDS:
General Fund Gas Tax Fund
PROPRIETARY FUNDS:
Water Enterprise Fund Cemetery Enterprise Fund
City of Sonoma, California Basic Financial Statements For the year ended June 30, 2015 Management’s Discussion and Analysis, Continued
6
OVERVIEW OF THE ANNUAL FINANCIAL REPORT, Continued Fund Financial Statements, Continued For the fiscal year ended June 30, 2015, the City adopted annual appropriated budgets for all governmental funds. Proprietary funds. The City maintains Enterprise-type and Internal Service proprietary funds. Enterprise funds are used to report the same functions presented as business-type activities in the Government-wide Financial Statements. The City uses enterprise funds to account for Water and Cemetery activities. Internal service funds are an accounting methodology used to accumulate and allocate costs internally among the City’s various functions. The City uses internal service funds to account for benefits, information technology assets, long term building maintenance, and vehicle replacement. Proprietary funds provide the same type of information as the Government-wide Financial Statements, only in more detail. The proprietary fund financial statements provide separate information for all of these operations. Notes to the Basic Financial Statements The notes provide additional information that is essential to a full understanding of the data provided in the Government-wide and Fund Financial Statements. The notes to the basic financial statements can be found on pages 46–88 of this report. Required Supplementary Information follows the notes on pages 90-97. Combining and Individual Fund Financial Statements and Schedules The combining statements referred to earlier in connection with nonmajor governmental funds are presented immediately following the notes to the financial statements. Combining and individual fund statements can be found on pages 102–138 of this report.
City of Sonoma, California Basic Financial Statements For the year ended June 30, 2015 Management’s Discussion and Analysis, Continued
7
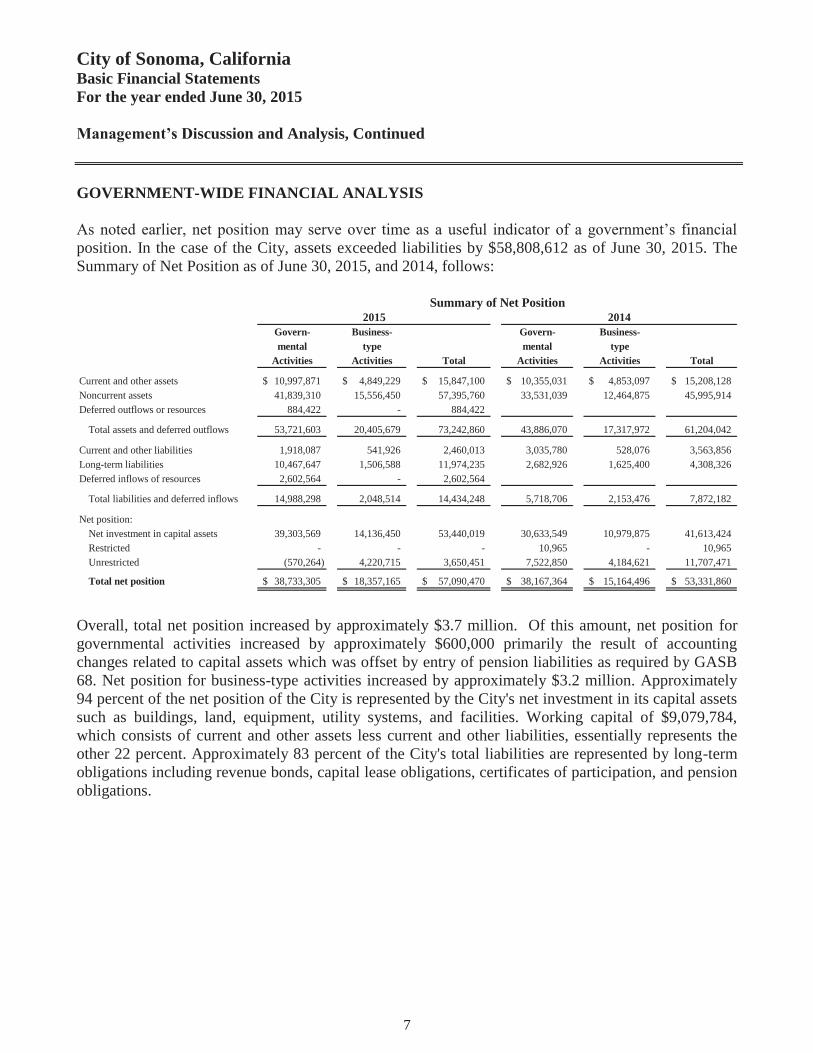
GOVERNMENT-WIDE FINANCIAL ANALYSIS As noted earlier, net position may serve over time as a useful indicator of a government’s financial position. In the case of the City, assets exceeded liabilities by $58,808,612 as of June 30, 2015. The Summary of Net Position as of June 30, 2015, and 2014, follows:
Govern- Business- Govern- Business-mental type mental type
Activities Activities Total Activities Activities Total
Current and other assets 10,997,871$ 4,849,229$ 15,847,100$ 10,355,031$ 4,853,097$ 15,208,128$ Noncurrent assets 41,839,310 15,556,450 57,395,760 33,531,039 12,464,875 45,995,914 Deferred outflows or resources 884,422 - 884,422
Total assets and deferred outflows 53,721,603 20,405,679 73,242,860 43,886,070 17,317,972 61,204,042
Current and other liabilities 1,918,087 541,926 2,460,013 3,035,780 528,076 3,563,856 Long-term liabilities 10,467,647 1,506,588 11,974,235 2,682,926 1,625,400 4,308,326 Deferred inflows of resources 2,602,564 - 2,602,564
Total liabilities and deferred inflows 14,988,298 2,048,514 14,434,248 5,718,706 2,153,476 7,872,182
Net position:Net investment in capital assets 39,303,569 14,136,450 53,440,019 30,633,549 10,979,875 41,613,424 Restricted - - - 10,965 - 10,965 Unrestricted (570,264) 4,220,715 3,650,451 7,522,850 4,184,621 11,707,471
Total net position 38,733,305$ 18,357,165$ 57,090,470$ 38,167,364$ 15,164,496$ 53,331,860$
20142015Summary of Net Position
Overall, total net position increased by approximately $3.7 million. Of this amount, net position for governmental activities increased by approximately $600,000 primarily the result of accounting changes related to capital assets which was offset by entry of pension liabilities as required by GASB 68. Net position for business-type activities increased by approximately $3.2 million. Approximately 94 percent of the net position of the City is represented by the City's net investment in its capital assets such as buildings, land, equipment, utility systems, and facilities. Working capital of $9,079,784, which consists of current and other assets less current and other liabilities, essentially represents the other 22 percent. Approximately 83 percent of the City's total liabilities are represented by long-term obligations including revenue bonds, capital lease obligations, certificates of participation, and pension obligations.

City of Sonoma, California Basic Financial Statements For the year ended June 30, 2015 Management’s Discussion and Analysis, Continued
8
GOVERNMENT-WIDE FINANCIAL ANALYSIS, Continued Revenues The City’s total revenues for governmental and business-type activities were $21,200,123 for the fiscal year ended June 30, 2015. Significant revenues for the City General Fund for fiscal year 2014-15 were derived from Transient Occupancy Tax / TOT (22%), Sales Tax (17%), Property Tax (17%), and Measure J / Transactions and Use Tax (14%). In general, the City saw increases in most revenue sources but the growth in those revenue sources declined from the prior year. The following discusses variances in key revenues from the prior fiscal year: 1. Property Taxes. Property taxes increased by $102,515 (4.8%).
2. Sales Taxes. Sales taxes increased by $109,857 (4.0%).
3. Measure J. Measure J Transactions and Use Tax increased by $26,484 (1.2%). 4. Transient Occupancy Taxes. Annual revenue increased by $313,819 (9.6%) resulting both
from ongoing increases in tourism and the ongoing activity of the Tourism Improvement District focused on marketing tourism in Sonoma.
5. Grants and Contributions – Governmental Activities Operating. Annual receipts
decreased after completion of the Depot Park project in 2014. This project was partially paid from Community Development Block Grant Funds.
City of Sonoma, California Basic Financial Statements For the year ended June 30, 2015 Management’s Discussion and Analysis, Continued
9
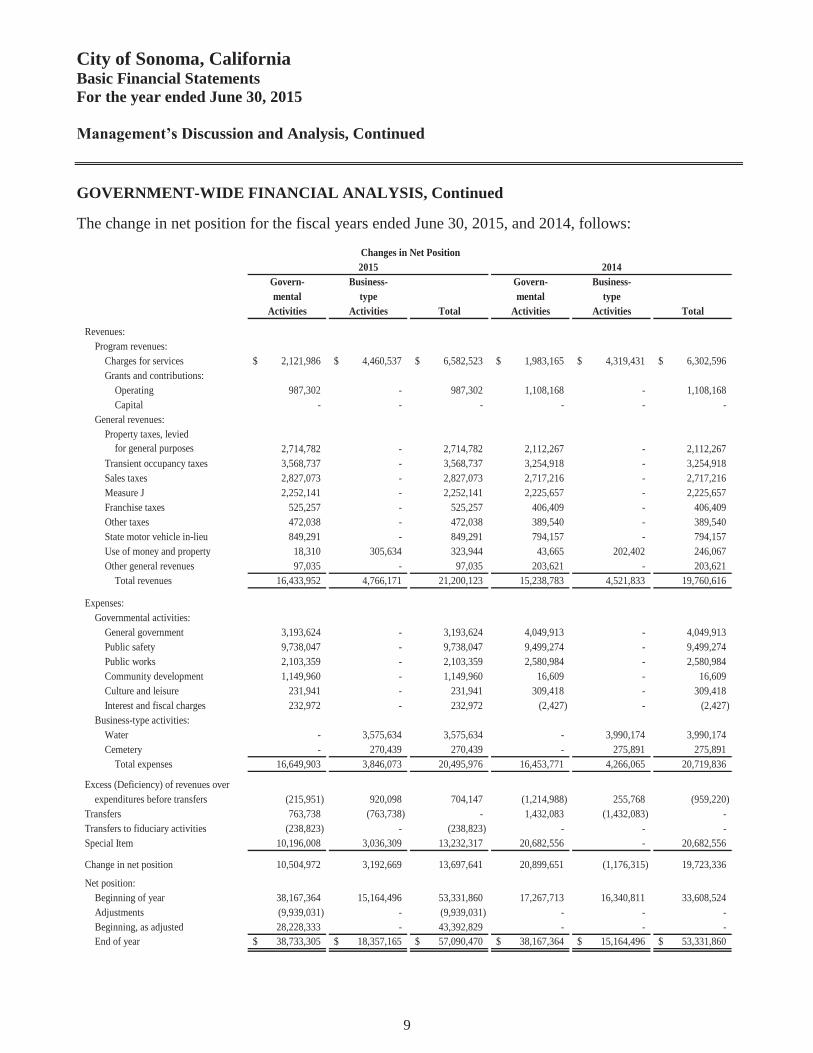
GOVERNMENT-WIDE FINANCIAL ANALYSIS, Continued The change in net position for the fiscal years ended June 30, 2015, and 2014, follows:
Govern- Business- Govern- Business-mental type mental type
Activities Activities Total Activities Activities Total
Revenues:Program revenues:
Charges for services 2,121,986$ 4,460,537$ 6,582,523$ 1,983,165$ 4,319,431$ 6,302,596$ Grants and contributions:
Operating 987,302 - 987,302 1,108,168 - 1,108,168 Capital - - - - - -
General revenues:Property taxes, levied
for general purposes 2,714,782 - 2,714,782 2,112,267 - 2,112,267 Transient occupancy taxes 3,568,737 - 3,568,737 3,254,918 - 3,254,918 Sales taxes 2,827,073 - 2,827,073 2,717,216 - 2,717,216 Measure J 2,252,141 - 2,252,141 2,225,657 - 2,225,657 Franchise taxes 525,257 - 525,257 406,409 - 406,409 Other taxes 472,038 - 472,038 389,540 - 389,540 State motor vehicle in-lieu 849,291 - 849,291 794,157 - 794,157 Use of money and property 18,310 305,634 323,944 43,665 202,402 246,067 Other general revenues 97,035 - 97,035 203,621 - 203,621
Total revenues 16,433,952 4,766,171 21,200,123 15,238,783 4,521,833 19,760,616
Expenses:Governmental activities:
General government 3,193,624 - 3,193,624 4,049,913 - 4,049,913 Public safety 9,738,047 - 9,738,047 9,499,274 - 9,499,274 Public works 2,103,359 - 2,103,359 2,580,984 - 2,580,984 Community development 1,149,960 - 1,149,960 16,609 - 16,609 Culture and leisure 231,941 - 231,941 309,418 - 309,418 Interest and fiscal charges 232,972 - 232,972 (2,427) - (2,427)
Business-type activities:Water - 3,575,634 3,575,634 - 3,990,174 3,990,174 Cemetery - 270,439 270,439 - 275,891 275,891
Total expenses 16,649,903 3,846,073 20,495,976 16,453,771 4,266,065 20,719,836
Excess (Deficiency) of revenues overexpenditures before transfers (215,951) 920,098 704,147 (1,214,988) 255,768 (959,220)
Transfers 763,738 (763,738) - 1,432,083 (1,432,083) - Transfers to fiduciary activities (238,823) - (238,823) - - - Special Item 10,196,008 3,036,309 13,232,317 20,682,556 - 20,682,556
Change in net position 10,504,972 3,192,669 13,697,641 20,899,651 (1,176,315) 19,723,336
Net position:Beginning of year 38,167,364 15,164,496 53,331,860 17,267,713 16,340,811 33,608,524 Adjustments (9,939,031) - (9,939,031) - - - Beginning, as adjusted 28,228,333 - 43,392,829 - - - End of year 38,733,305$ 18,357,165$ 57,090,470$ 38,167,364$ 15,164,496$ 53,331,860$
20142015Changes in Net Position

City of Sonoma, California Basic Financial Statements For the year ended June 30, 2015 Management’s Discussion and Analysis, Continued
10
GOVERNMENT-WIDE FINANCIAL ANALYSIS, Continued Expenses Governmental and business-type activity expenses of the City for the year totaled $20,518,916. Governmental activity expenses totaled $16,672,123 or 81% of total expenses. Business-type activities incurred $3,846,073 of expenses during the fiscal year. Public safety costs represented 58% of total governmental activities expenses. Governmental Activities The following table shows the cost of each of the City’s major programs and the net cost of the programs. Net cost is the total cost less fees and other direct revenue generated by the activities. The net cost reflects the financial burden that was placed on the City’s taxpayers by each of the programs. The total cost of services and the net cost of services for the fiscal years ended June 30, 2015, and 2014, are as follows:
Total Cost Net Cost Total Cost Net Costof Services of Services of Services of Services
General government 3,193,624$ (2,989,602)$ 4,049,913$ (3,855,295)$ Public safety 9,738,047 (7,823,116) 9,499,274 (7,840,529) Public works 2,103,359 (1,639,107) 2,580,984 (1,471,925) Community development 1,149,960 (672,343) 16,609 (16,609) Culture and leisure 231,941 (183,475) 309,418 (180,507) Interest and fiscal charges 232,972 (232,975) (2,427) 2,427
Total 16,649,903$ (13,540,618)$ 16,453,771$ (13,362,438)$
2015 2014

City of Sonoma, California Basic Financial Statements For the year ended June 30, 2015 Management’s Discussion and Analysis, Continued
11
GOVERNMENT-WIDE FINANCIAL ANALYSIS, Continued Governmental Activities, continued Revenues by source for the fiscal years ended June 30, 2015, and 2014, are as follows:
Charges for services, $2,121,986 , 12.9%
Operating grants, $987,302 , 6.0%
Measure J, $2,252,141 , 13.7%
Property taxes, $2,714,782 , 16.5%
Transient occupancy taxes, $3,568,737 ,
21.7%
Sales taxes, $2,827,073 , 17.2%
Franchise taxes, $525,257 , 3.2%
Other taxes, $472,038 , 2.9%
State motor vehicle in-lieu, $849,291 , 5.2%
Use of money and property, $18,310 ,
0.1%Other general revenues,
$97,035 , 0.6%
Revenues by Source - Governmental Activities2015
Charges for services, $1,983,165 , 13.0%
Operating grants, $1,108,168 , 7.3%
Measure J, $2,225,65714.6%
Property taxes, $2,112,267 , 13.9%
Transient occupancy taxes, $3,254,918 ,
Sales taxes, $2,717,216 , 17.8%
Franchise taxes, $406,409 , 2.7%
Other taxes, $389,540 , 2.6%
State motor vehicle in-lieu, $794,157 , 5.2%
Use of money and property, $43,665 ,
0.3%Other general revenues,
$203,621 , 1.3%
Revenues by Source - Governmental Activities2014
City of Sonoma, California Basic Financial Statements For the year ended June 30, 2015 Management’s Discussion and Analysis, Continued
12
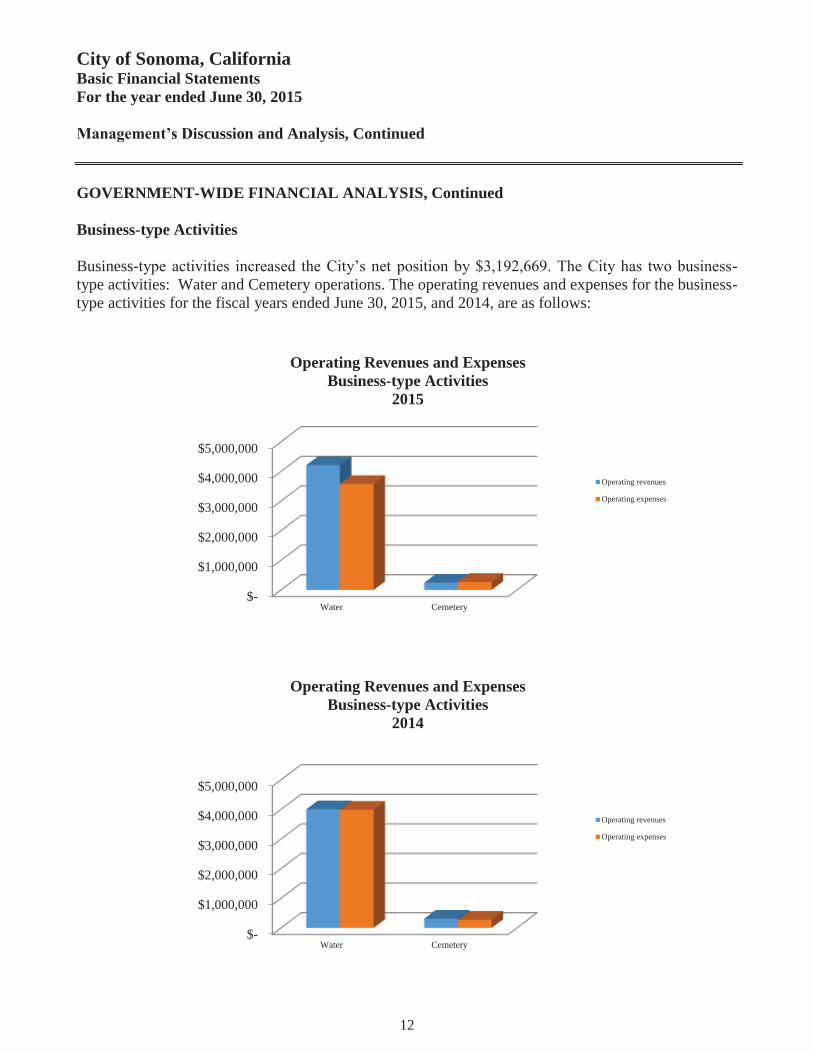
GOVERNMENT-WIDE FINANCIAL ANALYSIS, Continued Business-type Activities Business-type activities increased the City’s net position by $3,192,669. The City has two business-type activities: Water and Cemetery operations. The operating revenues and expenses for the business-type activities for the fiscal years ended June 30, 2015, and 2014, are as follows:
$-
$1,000,000
$2,000,000
$3,000,000
$4,000,000
$5,000,000
Water Cemetery
Operating revenues
Operating expenses
$-
$1,000,000
$2,000,000
$3,000,000
$4,000,000
$5,000,000
Water Cemetery
Operating revenues
Operating expenses
Operating Revenues and Expenses Business-type Activities
2014
Operating Revenues and Expenses Business-type Activities
2015
City of Sonoma, California Basic Financial Statements For the year ended June 30, 2015 Management’s Discussion and Analysis, Continued
13
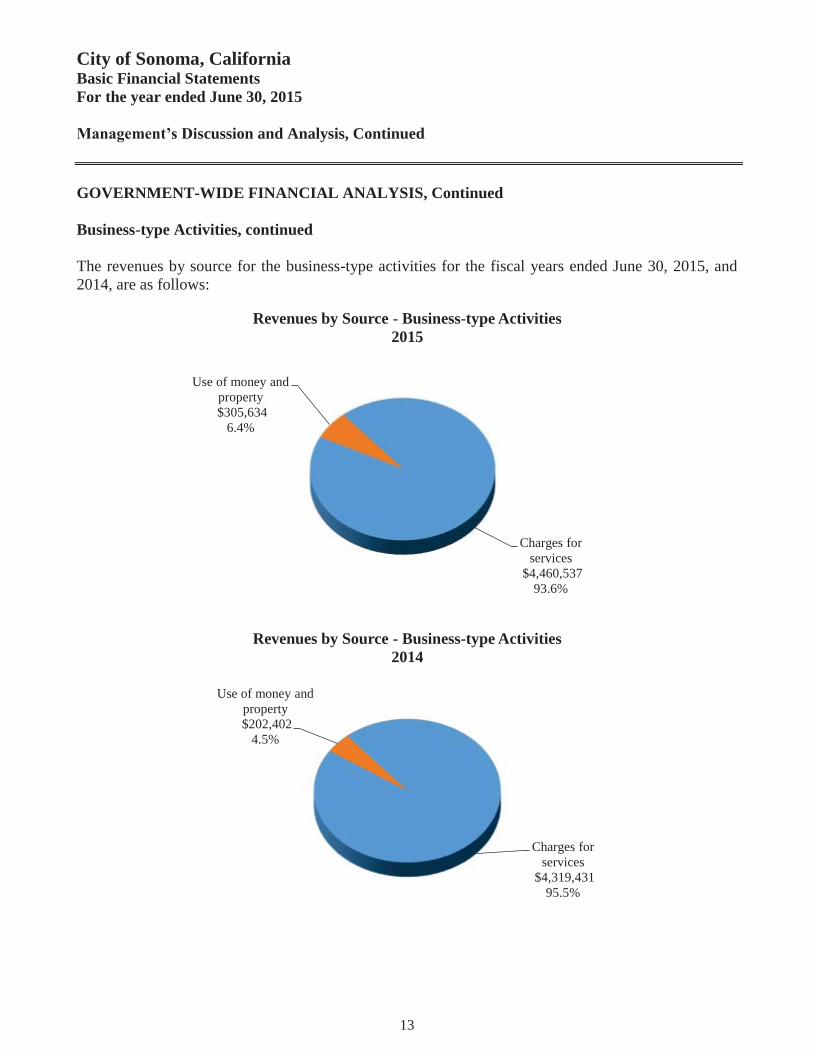
GOVERNMENT-WIDE FINANCIAL ANALYSIS, Continued Business-type Activities, continued The revenues by source for the business-type activities for the fiscal years ended June 30, 2015, and 2014, are as follows:
Charges for services
$4,460,537 93.6%
Use of money and property$305,634
6.4%
Revenues by Source - Business-type Activities2015
Charges for services
$4,319,431 95.5%
Use of money and property$202,402
4.5%
Revenues by Source - Business-type Activities2014
City of Sonoma, California Basic Financial Statements For the year ended June 30, 2015 Management’s Discussion and Analysis, Continued
14
GOVERNMENT-WIDE FINANCIAL ANALYSIS, Continued Financial Analysis of the Government’s Funds The City of Sonoma uses fund accounting to ensure and demonstrate compliance with finance-related legal requirements. The fund financial statements focus on individual parts of the City government, reporting the City’s operations in more detail than the government-wide financial statements. Governmental funds. The City’s governmental funds provide information on near-term inflows, outflows, and balances of spending resources. At the fiscal year ended June 30, 2015, the City’s governmental funds reported combined fund balances of $7,317,067. This is an increase of $828,715. This increase is primarily a result of clearing the deficit balance in the Gas Tax Fund. The General Fund is the chief operating fund of the City. At the fiscal year ended June 30, 2015, General Fund unassigned fund balance totaled $6,982,959. This is an increase of $46,829 from the prior year. Proprietary funds. The City’s proprietary funds unrestricted net position increased by approximately $3.2 million in the fiscal year ended June 30, 2015. This increase primarily resulted from corections to capital asset entries in enterprise funds. General Fund Budgetary Highlights The difference between final budget and actual revenues and expenses is not significant.
City of Sonoma, California Basic Financial Statements For the year ended June 30, 2015 Management’s Discussion and Analysis, Continued
15
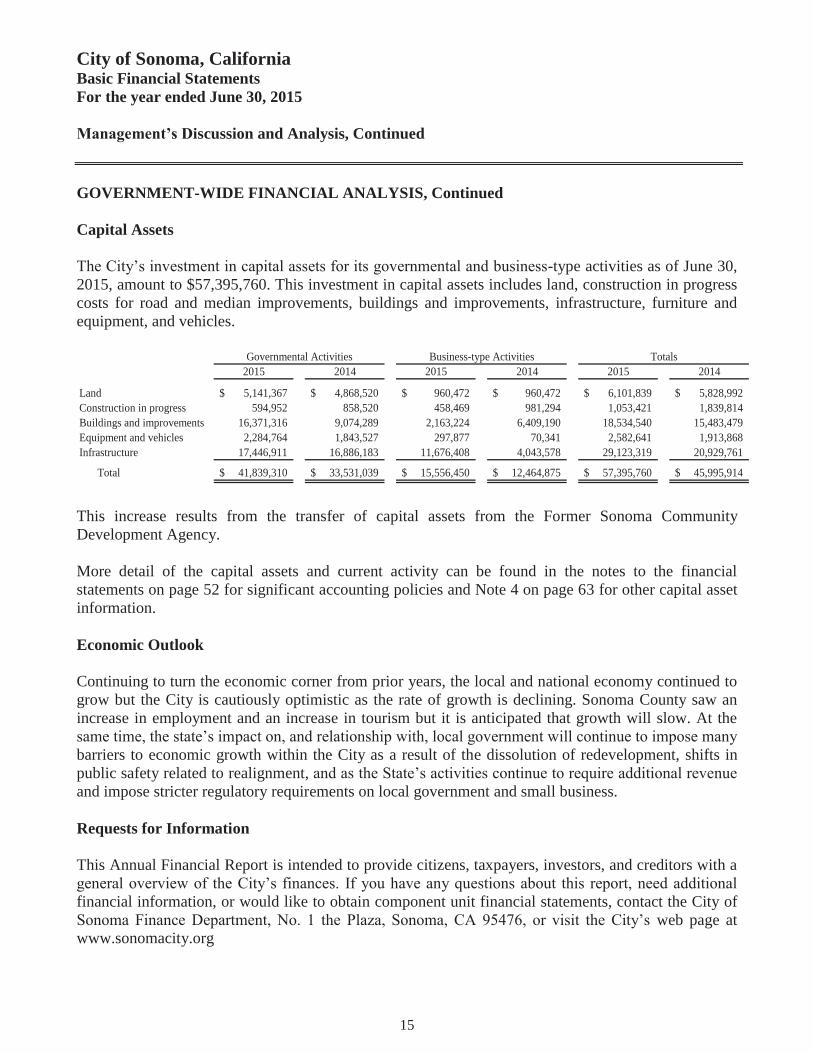
GOVERNMENT-WIDE FINANCIAL ANALYSIS, Continued Capital Assets The City’s investment in capital assets for its governmental and business-type activities as of June 30, 2015, amount to $57,395,760. This investment in capital assets includes land, construction in progress costs for road and median improvements, buildings and improvements, infrastructure, furniture and equipment, and vehicles.
2015 2014 2015 2014 2015 2014
Land 5,141,367$ 4,868,520$ 960,472$ 960,472$ 6,101,839$ 5,828,992$ Construction in progress 594,952 858,520 458,469 981,294 1,053,421 1,839,814 Buildings and improvements 16,371,316 9,074,289 2,163,224 6,409,190 18,534,540 15,483,479 Equipment and vehicles 2,284,764 1,843,527 297,877 70,341 2,582,641 1,913,868 Infrastructure 17,446,911 16,886,183 11,676,408 4,043,578 29,123,319 20,929,761
Total 41,839,310$ 33,531,039$ 15,556,450$ 12,464,875$ 57,395,760$ 45,995,914$
Governmental Activities TotalsBusiness-type Activities
This increase results from the transfer of capital assets from the Former Sonoma Community Development Agency. More detail of the capital assets and current activity can be found in the notes to the financial statements on page 52 for significant accounting policies and Note 4 on page 63 for other capital asset information. Economic Outlook Continuing to turn the economic corner from prior years, the local and national economy continued to grow but the City is cautiously optimistic as the rate of growth is declining. Sonoma County saw an increase in employment and an increase in tourism but it is anticipated that growth will slow. At the same time, the state’s impact on, and relationship with, local government will continue to impose many barriers to economic growth within the City as a result of the dissolution of redevelopment, shifts in public safety related to realignment, and as the State’s activities continue to require additional revenue and impose stricter regulatory requirements on local government and small business. Requests for Information This Annual Financial Report is intended to provide citizens, taxpayers, investors, and creditors with a general overview of the City’s finances. If you have any questions about this report, need additional financial information, or would like to obtain component unit financial statements, contact the City of Sonoma Finance Department, No. 1 the Plaza, Sonoma, CA 95476, or visit the City’s web page at www.sonomacity.org
16
This page intentionally left blank.
BASIC FINANCIAL STATEMENTS
17

This page intentionally left blank.
18
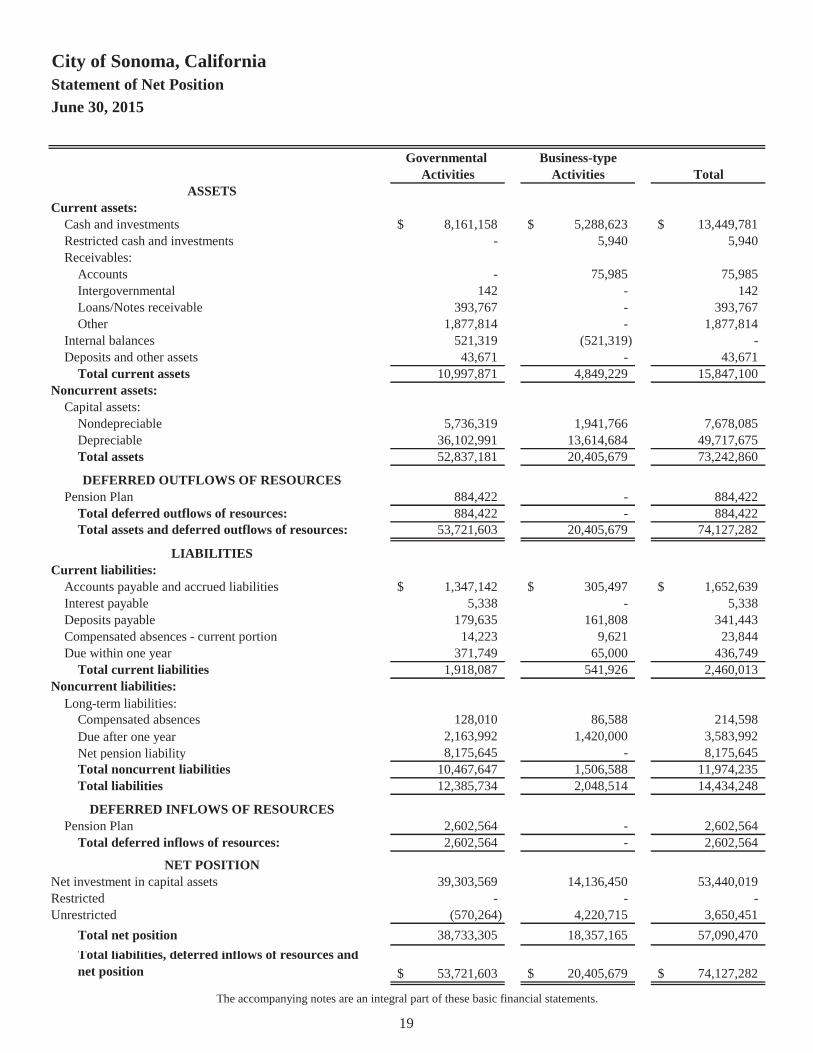
City of Sonoma, CaliforniaStatement of Net Position June 30, 2015
Governmental Business-typeActivities Activities Total
ASSETSCurrent assets:
Cash and investments 8,161,158$ 5,288,623$ 13,449,781$ Restricted cash and investments - 5,940 5,940 Receivables:
Accounts - 75,985 75,985 Intergovernmental 142 - 142 Loans/Notes receivable 393,767 - 393,767 Other 1,877,814 - 1,877,814
Internal balances 521,319 (521,319) - Deposits and other assets 43,671 - 43,671
Total current assets 10,997,871 4,849,229 15,847,100 Noncurrent assets:
Capital assets:Nondepreciable 5,736,319 1,941,766 7,678,085 Depreciable 36,102,991 13,614,684 49,717,675 Total assets 52,837,181 20,405,679 73,242,860
DEFERRED OUTFLOWS OF RESOURCESPension Plan 884,422 - 884,422
Total deferred outflows of resources: 884,422 - 884,422 Total assets and deferred outflows of resources: 53,721,603 20,405,679 74,127,282
LIABILITIESCurrent liabilities:
Accounts payable and accrued liabilities 1,347,142$ 305,497$ 1,652,639$ Interest payable 5,338 - 5,338 Deposits payable 179,635 161,808 341,443 Compensated absences - current portion 14,223 9,621 23,844 Due within one year 371,749 65,000 436,749
Total current liabilities 1,918,087 541,926 2,460,013 Noncurrent liabilities:
Long-term liabilities:Compensated absences 128,010 86,588 214,598 Due after one year 2,163,992 1,420,000 3,583,992 Net pension liability 8,175,645 - 8,175,645 Total noncurrent liabilities 10,467,647 1,506,588 11,974,235 Total liabilities 12,385,734 2,048,514 14,434,248
DEFERRED INFLOWS OF RESOURCESPension Plan 2,602,564 - 2,602,564
Total deferred inflows of resources: 2,602,564 - 2,602,564
NET POSITIONNet investment in capital assets 39,303,569 14,136,450 53,440,019 Restricted - - - Unrestricted (570,264) 4,220,715 3,650,451
Total net position 38,733,305 18,357,165 57,090,470 Total liabilities, deferred inflows of resources and net position 53,721,603$ 20,405,679$ 74,127,282$
The accompanying notes are an integral part of these basic financial statements.
19
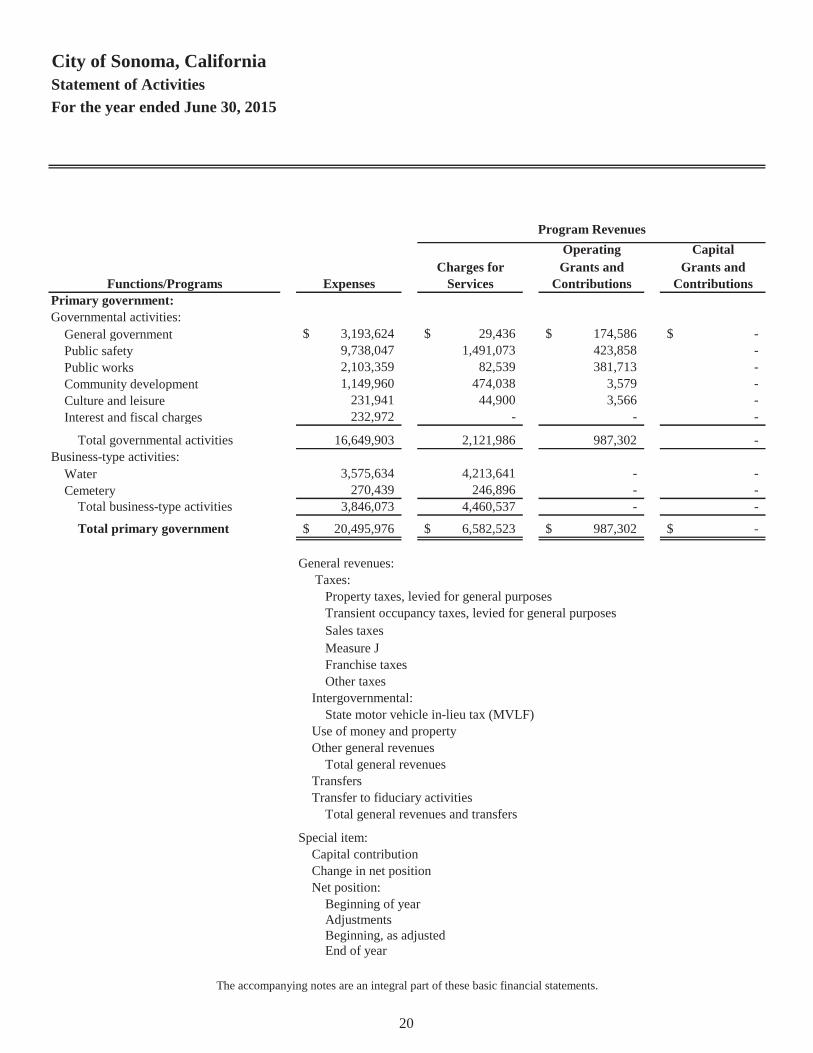
City of Sonoma, CaliforniaStatement of ActivitiesFor the year ended June 30, 2015
Operating CapitalCharges for Grants and Grants and
Functions/Programs Expenses Services Contributions ContributionsPrimary government:Governmental activities:
General government 3,193,624$ 29,436$ 174,586$ -$ Public safety 9,738,047 1,491,073 423,858 - Public works 2,103,359 82,539 381,713 - Community development 1,149,960 474,038 3,579 - Culture and leisure 231,941 44,900 3,566 - Interest and fiscal charges 232,972 - - -
Total governmental activities 16,649,903 2,121,986 987,302 - Business-type activities:
Water 3,575,634 4,213,641 - - Cemetery 270,439 246,896 - -
Total business-type activities 3,846,073 4,460,537 - -
Total primary government 20,495,976$ 6,582,523$ 987,302$ -$
General revenues: Taxes:
Property taxes, levied for general purposesTransient occupancy taxes, levied for general purposesSales taxesMeasure JFranchise taxesOther taxes
Intergovernmental:State motor vehicle in-lieu tax (MVLF)
Use of money and propertyOther general revenues
Total general revenuesTransfersTransfer to fiduciary activities
Total general revenues and transfers
Special item:Capital contributionChange in net positionNet position:
Beginning of yearAdjustmentsBeginning, as adjustedEnd of year
Program Revenues
The accompanying notes are an integral part of these basic financial statements.
20
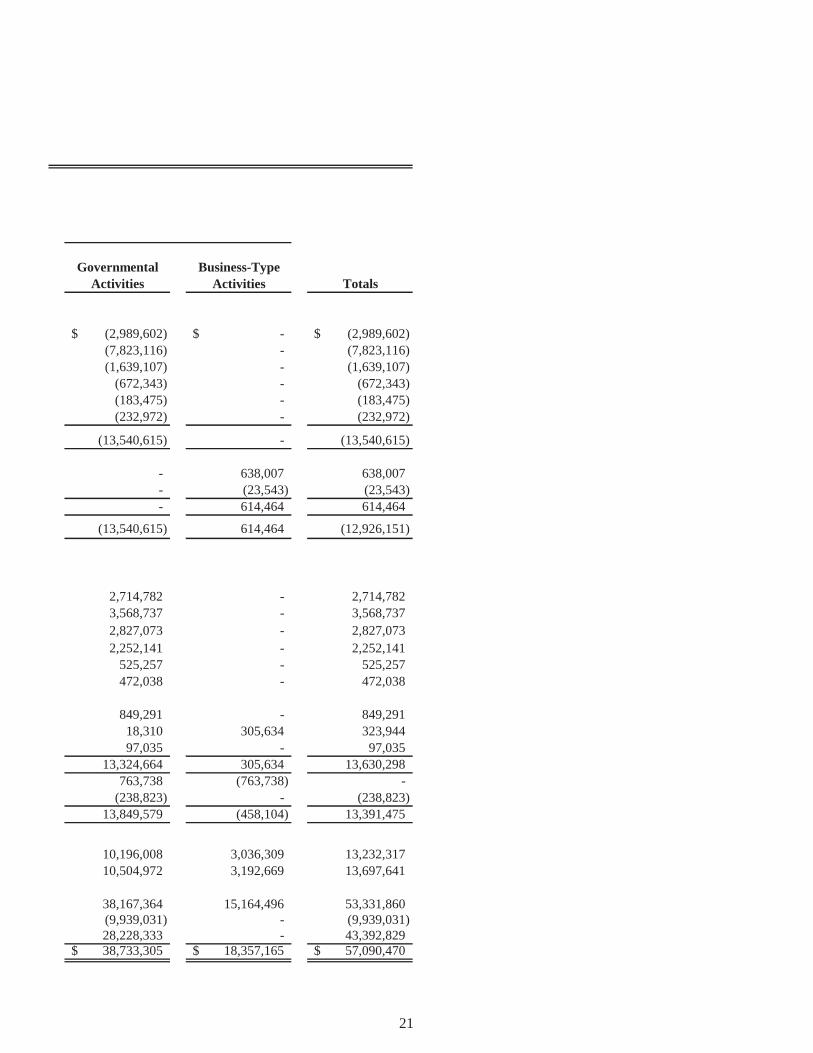
Governmental Business-TypeActivities Activities Totals
(2,989,602)$ -$ (2,989,602)$ (7,823,116) - (7,823,116) (1,639,107) - (1,639,107)
(672,343) - (672,343) (183,475) - (183,475) (232,972) - (232,972)
(13,540,615) - (13,540,615)
- 638,007 638,007 - (23,543) (23,543) - 614,464 614,464
(13,540,615) 614,464 (12,926,151)
2,714,782 - 2,714,782 3,568,737 - 3,568,737 2,827,073 - 2,827,073 2,252,141 - 2,252,141
525,257 - 525,257 472,038 - 472,038
849,291 - 849,291 18,310 305,634 323,944 97,035 - 97,035
13,324,664 305,634 13,630,298 763,738 (763,738) -
(238,823) - (238,823) 13,849,579 (458,104) 13,391,475
10,196,008 3,036,309 13,232,317 10,504,972 3,192,669 13,697,641
38,167,364 15,164,496 53,331,860 (9,939,031) - (9,939,031) 28,228,333 - 43,392,829 38,733,305$ 18,357,165$ 57,090,470$
21

This page intentionally left blank.
22

Fund
Governmental Funds: Governmental funds are used for taxes and grants.
General
Gas Tax Special Revenue Fund Accounts for funds received and expended for street maintenancepurposes as defined in Sections 2105, 2106, 2107, and 2107.5 ofthe Streets and Highway Code.
FUND FINANCIAL STATEMENTS
Description
Primary operating fund of the City; accounts for all activitiesexcept those legally or administratively required to be accountedfor in other funds.
MAJOR FUNDS
23

City of Sonoma, CaliforniaBalance SheetGovernmental FundsJune 30, 2015
General Gas TaxFund Special Revenue
ASSETS
Cash and investments 5,496,615$ 35,963$ Receivables:
Intergovernmental - - Other receivable 1,874,355 -
Due from other funds 654,718 - Prepaid items 36,806 -
Total assets 8,062,494$ 35,963$
LIABILITIESAND FUND BALANCES
Liabilities:Accounts payable and accrued liabilities 1,050,439$ 35,457$ Due to other funds - - Deposits payable 29,096 -
Total liabilities 1,079,535 35,457
Fund balances:Nonspendable - Prepaid items 36,806 - Assigned - - Unassigned (deficit) 6,946,153 506
Total fund balances 6,982,959 506
Total liabilities and fund balances 8,062,494$ 35,963$
The accompanying notes are an integral part of these basic financial statements.
Major Funds
24
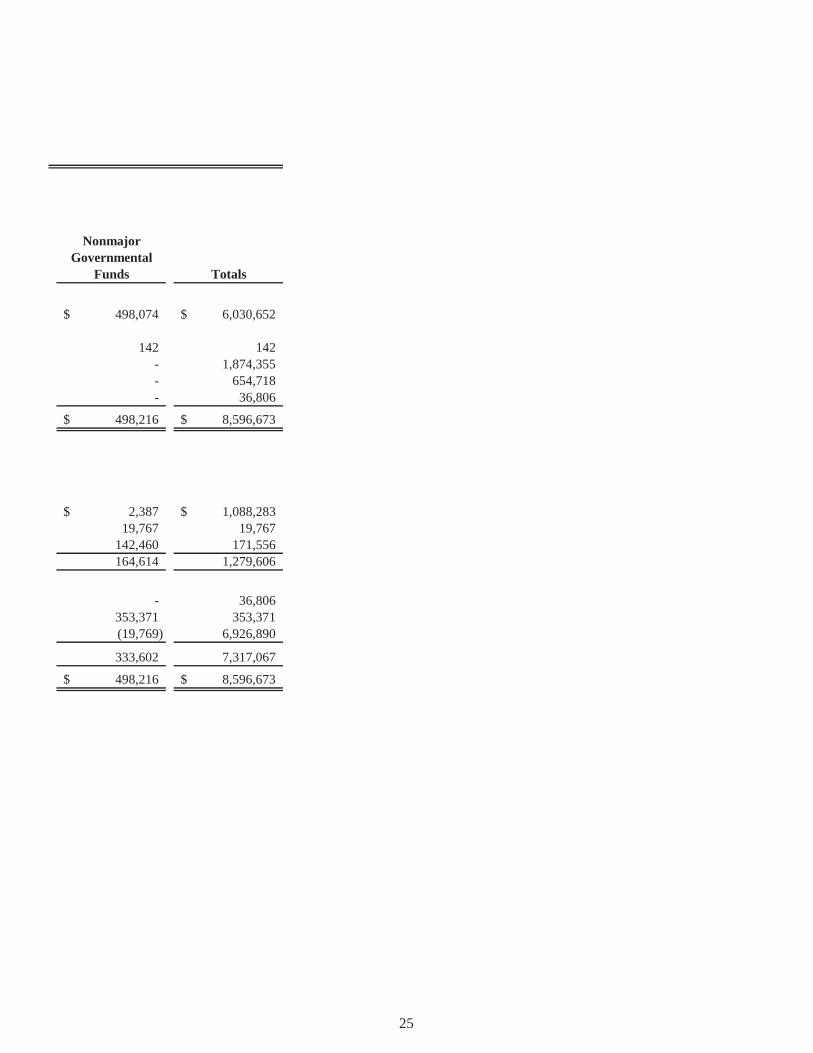
NonmajorGovernmental
Funds Totals
498,074$ 6,030,652$
142 142 - 1,874,355 - 654,718 - 36,806
498,216$ 8,596,673$
2,387$ 1,088,283$ 19,767 19,767
142,460 171,556 164,614 1,279,606
- 36,806 353,371 353,371 (19,769) 6,926,890
333,602 7,317,067
498,216$ 8,596,673$
25

City of Sonoma, CaliforniaReconciliation of the Governmental Funds Balance Sheet
to the Statement of Net PositionJune 30, 2015
Total fund balances - total governmental funds 7,317,067$
39,719,868
Compensated absences (142,233)$ Due within one year (371,749) Due after one year (2,163,992) Net pension liability (8,175,645) (10,853,619)
Deferred outflows of resources 884,422 Deferred inflows of resources (2,602,564) (1,718,142)
(5,338)
Current assets 2,534,597 Accounts payable and accrued liabilities (380,570) 4,273,469
Net Position of governmental activities 38,733,305$
The accompanying notes are an integral part of these basic financial statements.
Internal services funds are used by management to charge the costs of certainactivities, such as information technology and long term building maintenance,to individual funds. The assets and liabilities of the internal service funds are:
Capital assets used in governmental activities are not current financialresources and, therefore, are not reported in the governmental funds balancesheet.
Amounts reported for governmental activities in the Statement of Net Position aredifferent because:
Interest payable on long-term debt does not require the use of current financialresources and, therefore, is not reported in the governmental funds.
Long-term liabilities are not due and payable in the current period and,therefore, are not reported in the governmental funds balance sheet.
Pension obligations result in deferred outflows and inflows of resources associated with the actuarial value of contributions, assets and liabilities:
26
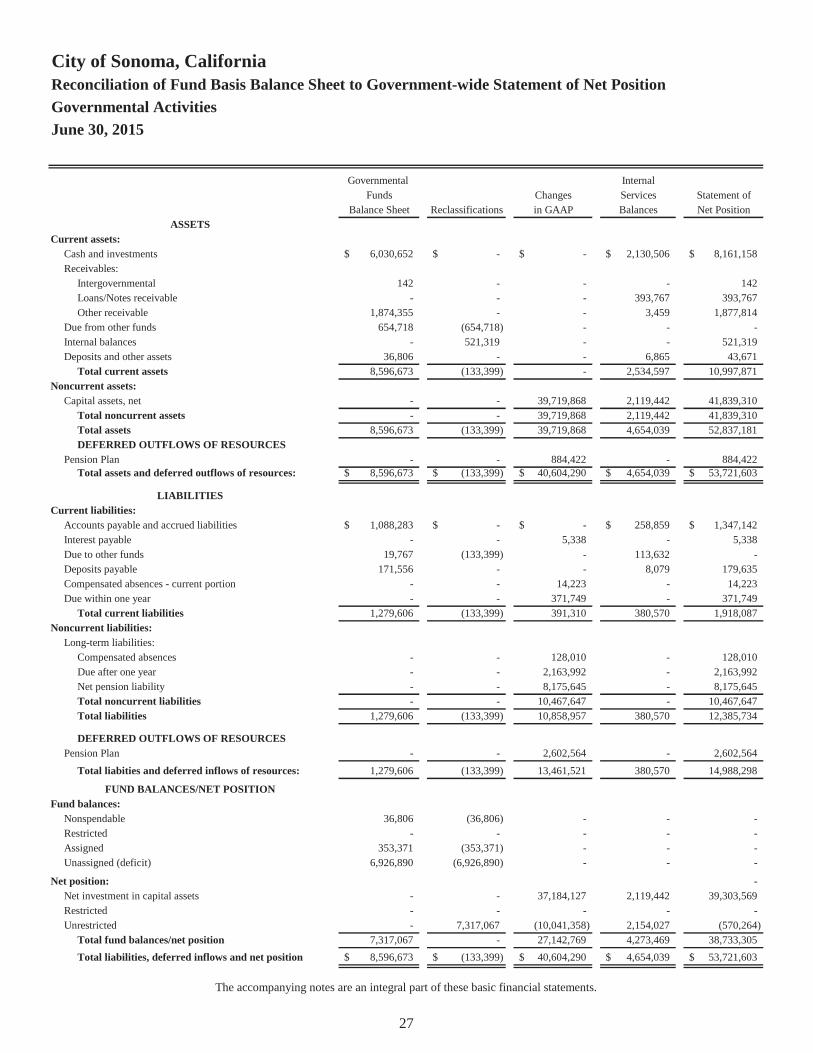
City of Sonoma, CaliforniaReconciliation of Fund Basis Balance Sheet to Government-wide Statement of Net PositionGovernmental ActivitiesJune 30, 2015
Governmental InternalFunds Changes Services Statement of
Balance Sheet Reclassifications in GAAP Balances Net PositionASSETS
Current assets:Cash and investments 6,030,652$ -$ -$ 2,130,506$ 8,161,158$ Receivables:
Intergovernmental 142 - - - 142 Loans/Notes receivable - - - 393,767 393,767 Other receivable 1,874,355 - - 3,459 1,877,814
Due from other funds 654,718 (654,718) - - - Internal balances - 521,319 - - 521,319 Deposits and other assets 36,806 - - 6,865 43,671
Total current assets 8,596,673 (133,399) - 2,534,597 10,997,871 Noncurrent assets:
Capital assets, net - - 39,719,868 2,119,442 41,839,310 Total noncurrent assets - - 39,719,868 2,119,442 41,839,310 Total assets 8,596,673 (133,399) 39,719,868 4,654,039 52,837,181 DEFERRED OUTFLOWS OF RESOURCES
Pension Plan - - 884,422 - 884,422 Total assets and deferred outflows of resources: 8,596,673$ (133,399)$ 40,604,290$ 4,654,039$ 53,721,603$
LIABILITIESCurrent liabilities:
Accounts payable and accrued liabilities 1,088,283$ -$ -$ 258,859$ 1,347,142$ Interest payable - - 5,338 - 5,338 Due to other funds 19,767 (133,399) - 113,632 - Deposits payable 171,556 - - 8,079 179,635 Compensated absences - current portion - - 14,223 - 14,223 Due within one year - - 371,749 - 371,749
Total current liabilities 1,279,606 (133,399) 391,310 380,570 1,918,087 Noncurrent liabilities:
Long-term liabilities:Compensated absences - - 128,010 - 128,010 Due after one year - - 2,163,992 - 2,163,992 Net pension liability - - 8,175,645 - 8,175,645 Total noncurrent liabilities - - 10,467,647 - 10,467,647 Total liabilities 1,279,606 (133,399) 10,858,957 380,570 12,385,734
DEFERRED OUTFLOWS OF RESOURCESPension Plan - - 2,602,564 - 2,602,564
Total liabities and deferred inflows of resources: 1,279,606 (133,399) 13,461,521 380,570 14,988,298
FUND BALANCES/NET POSITIONFund balances:
Nonspendable 36,806 (36,806) - - - Restricted - - - - - Assigned 353,371 (353,371) - - - Unassigned (deficit) 6,926,890 (6,926,890) - - -
Net position: - Net investment in capital assets - - 37,184,127 2,119,442 39,303,569 Restricted - - - - - Unrestricted - 7,317,067 (10,041,358) 2,154,027 (570,264)
Total fund balances/net position 7,317,067 - 27,142,769 4,273,469 38,733,305 Total liabilities, deferred inflows and net position 8,596,673$ (133,399)$ 40,604,290$ 4,654,039$ 53,721,603$
The accompanying notes are an integral part of these basic financial statements.
27

City of Sonoma, CaliforniaStatement of Revenues, Expenditures, and Changes in Fund Balances
Governmental FundsFor the year ended June 30, 2015
General Gas TaxFund Special Revenue
REVENUES:Taxes and assessments 13,263,341$ -$ Licenses and permits 13,691 - Fines and forfeitures 106,457 - Intergovernmental 145,692 314,092 Use of money and property 128,311 - Charges for services 2,092,103 - Reimbursements 82,504 - Other revenues 14,327 -
Total revenues 15,846,426 314,092
EXPENDITURES:Current:
General government 1,697,946 - Public safety 9,330,844 - Public works 824,764 750,519 Community development 1,129,013 - Culture and leisure 206,716 -
Capital outlay 781,751 - Debt service:
Principal - - Interest and fiscal charges - -
Total expenditures 13,971,034 750,519
REVENUES OVER (UNDER)EXPENDITURES 1,875,392 (436,427)
OTHER FINANCING SOURCES (USES):Proceeds from sale of assets 25,000 - Transfer from fiduciary activities - - Transfer to fiduciary activities (250,000) - Transfers in 566,990 1,237,447 Transfers out (2,170,553) (47,897)
Total other financing sources (uses) (1,828,563) 1,189,550
Net change in fund balances 46,829 753,123
FUND BALANCES (deficit):Beginning of year 6,936,130 (752,617)
End of year 6,982,959$ 506$
Major Funds
The accompanying notes are an integral part of these basic financial statements.
28

OtherGovernmental
Funds Totals
75,191$ 13,338,532$ 23,213 36,904
- 106,457 144,596 604,380
5,057 133,368 - 2,092,103 - 82,504
377 14,704
248,434 16,408,952
- 1,697,946 11,219 9,342,063
147,748 1,723,031 20,947 1,149,960 25,225 231,941
- 781,751
506,249 506,249 92,550 92,550
803,938 15,525,491
(555,504) 883,461
- 25,000 30,501 30,501
(19,324) (269,324) 785,782 2,590,219
(212,692) (2,431,142)
584,267 (54,746)
28,763 828,715
304,839 6,488,352
333,602$ 7,317,067$
29

City of Sonoma, CaliforniaReconciliation of Fund Basis Statements to Government-wide Statement of ActivitiesFor the year ended June 30, 2015
Compensated Capital
Absences/ Asset Government-
Fund Based Debt Internal (Additions)/ Pension wide
Functions/Programs Totals Service Service Depreciation Retirements Plan Totals
Governmental activities:
General government 1,697,946$ (110,058)$ (1,141,714)$ 200,413$ 2,592,281$ (45,244)$ 3,193,624$
Public safety 9,342,063 - - 395,984 - - 9,738,047
Public works 1,723,031 - - 485,407 (105,079) - 2,103,359
Community development 1,149,960 - - - - - 1,149,960
Culture and leisure 231,941 - - - - - 231,941
Capital outlay 781,751 - - - (781,751) - -
Debt service/Interest 598,799 (365,827) - - - - 232,972
Total governmental activities 15,525,491$ (475,885)$ (1,141,714)$ 1,081,804$ 1,705,451$ (45,244)$ 16,649,903$
The accompanying notes are an integral part of these basic financial statements.
30
City of Sonoma, CaliforniaReconciliation of the Statement of Revenues, Expenditures, and Changes in
Fund Balances of Governmental Funds to the Statement of ActivitiesFor the year ended June 30, 2015
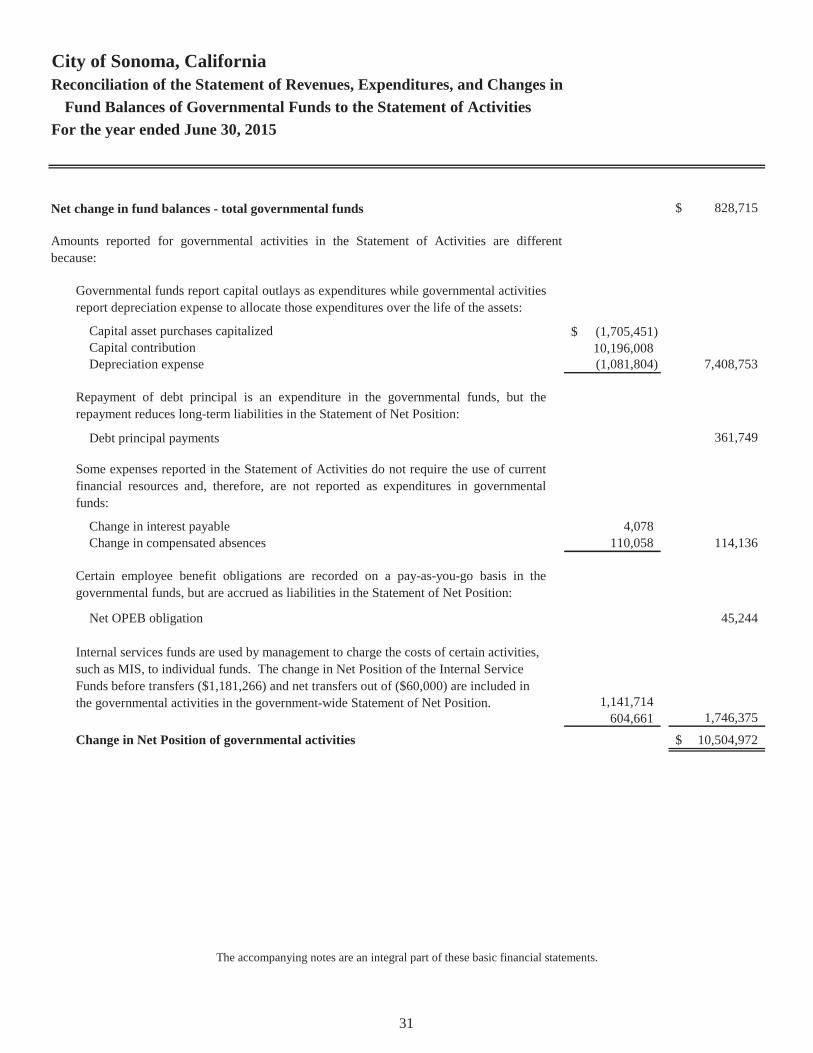
Net change in fund balances - total governmental funds 828,715$
Capital asset purchases capitalized (1,705,451)$ Capital contribution 10,196,008 Depreciation expense (1,081,804) 7,408,753
Debt principal payments 361,749
Change in interest payable 4,078 Change in compensated absences 110,058 114,136
Net OPEB obligation 45,244
1,141,714 604,661 1,746,375
Change in Net Position of governmental activities 10,504,972$
The accompanying notes are an integral part of these basic financial statements.
Amounts reported for governmental activities in the Statement of Activities are differentbecause:
Some expenses reported in the Statement of Activities do not require the use of currentfinancial resources and, therefore, are not reported as expenditures in governmentalfunds:
Repayment of debt principal is an expenditure in the governmental funds, but therepayment reduces long-term liabilities in the Statement of Net Position:
Governmental funds report capital outlays as expenditures while governmental activitiesreport depreciation expense to allocate those expenditures over the life of the assets:
Certain employee benefit obligations are recorded on a pay-as-you-go basis in thegovernmental funds, but are accrued as liabilities in the Statement of Net Position:
Internal services funds are used by management to charge the costs of certain activities, such as MIS, to individual funds. The change in Net Position of the Internal Service Funds before transfers ($1,181,266) and net transfers out of ($60,000) are included in the governmental activities in the government-wide Statement of Net Position.
31

City of Sonoma, CaliforniaStatement of Revenues, Expenditures, and Changes in Fund Balances - Budget to Actual - Major FundsFor the year ended June 30, 2015
Variance w/FinalPositive
Original Final Actual (Negative)REVENUES:
Taxes and assessments 12,251,080$ 12,317,480$ 13,263,341$ 945,861$ Licenses and permits 12,000 12,000 13,691 1,691 Fines and forfeitures 80,900 80,900 106,457 25,557 Intergovernmental 1,042,254 1,042,254 145,692 (896,562) Use of money and property 144,500 144,500 128,311 (16,189) Charges for services 1,933,182 1,933,182 2,092,103 158,921 Reimbursements 44,000 44,000 82,504 38,504 Other revenues - - 14,327 14,327
Total revenues 15,507,916 15,574,316 15,846,426 272,110
EXPENDITURES:Current:
General government 1,735,268 1,745,788 1,697,946 47,842 Public safety 9,432,206 9,432,779 9,330,844 101,935 Public works 964,942 972,795 824,764 148,031 Community development 1,234,787 1,257,241 1,129,013 128,228 Culture and leisure 179,500 204,500 206,716 (2,216)
Capital outlay 2,100,964 2,100,964 781,751 1,319,213
Total expenditures 15,647,667 15,714,067 13,971,034 1,743,033
REVENUES OVER (UNDER)EXPENDITURES (139,751) (139,751) 1,875,392 2,015,143
OTHER FINANCING SOURCES (USES):Proceeds from sale of assets - - 25,000 25,000 Transfer from fiduciary activities - - - - Transfer to fiduciary activities - - (250,000) - Transfers in 554,298 804,298 566,990 (237,308) Transfers out (442,145) (692,145) (2,170,553) (1,478,408)
Total other financing sources (uses) 112,153 112,153 (1,828,563) (1,690,716)
Net change in fund balances (27,598) (27,598) 46,829 324,427
FUND BALANCES (deficit):Beginning of year 6,936,130 6,936,130 6,936,130 - End of year 6,908,532$ 6,908,532$ 6,982,959$ 324,427$
The accompanying notes are an integral part of these basic financial statements.
General Fund
Budgeted Amounts
32
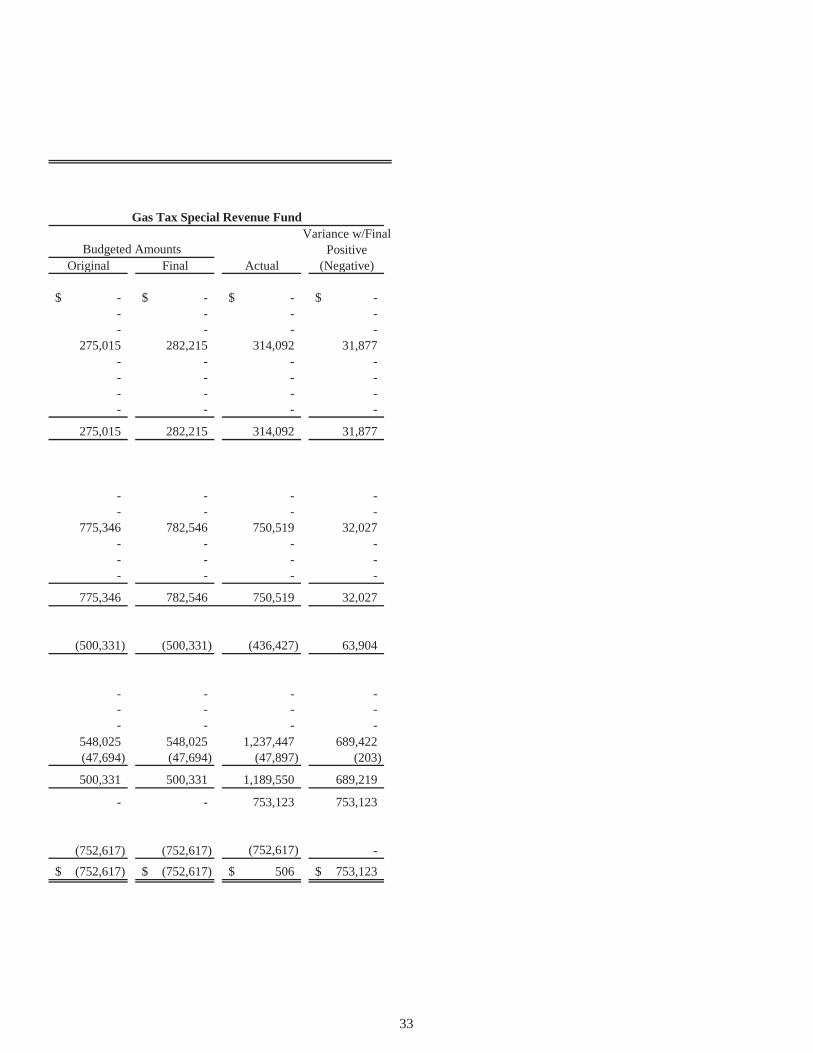
Variance w/FinalPositive
Original Final Actual (Negative)
-$ -$ -$ -$ - - - - - - - -
275,015 282,215 314,092 31,877 - - - - - - - - - - - - - - - -
275,015 282,215 314,092 31,877
- - - - - - - -
775,346 782,546 750,519 32,027 - - - - - - - - - - - -
775,346 782,546 750,519 32,027
(500,331) (500,331) (436,427) 63,904
- - - - - - - - - - - -
548,025 548,025 1,237,447 689,422 (47,694) (47,694) (47,897) (203)
500,331 500,331 1,189,550 689,219
- - 753,123 753,123
(752,617) (752,617) (752,617) - (752,617)$ (752,617)$ 506$ 753,123$
Gas Tax Special Revenue Fund
Budgeted Amounts
33

This page intentionally left blank.
34

Fund
Major Funds:
Water Fund
Cemetery Fund
ENTERPRISE FUNDS
Description
Accounts for the operation and maintenance of the City’s watertreatment and distribution system.
Accounts for the operation and maintenance of the Mountain,Valley and Veteran's Cemeteries
35
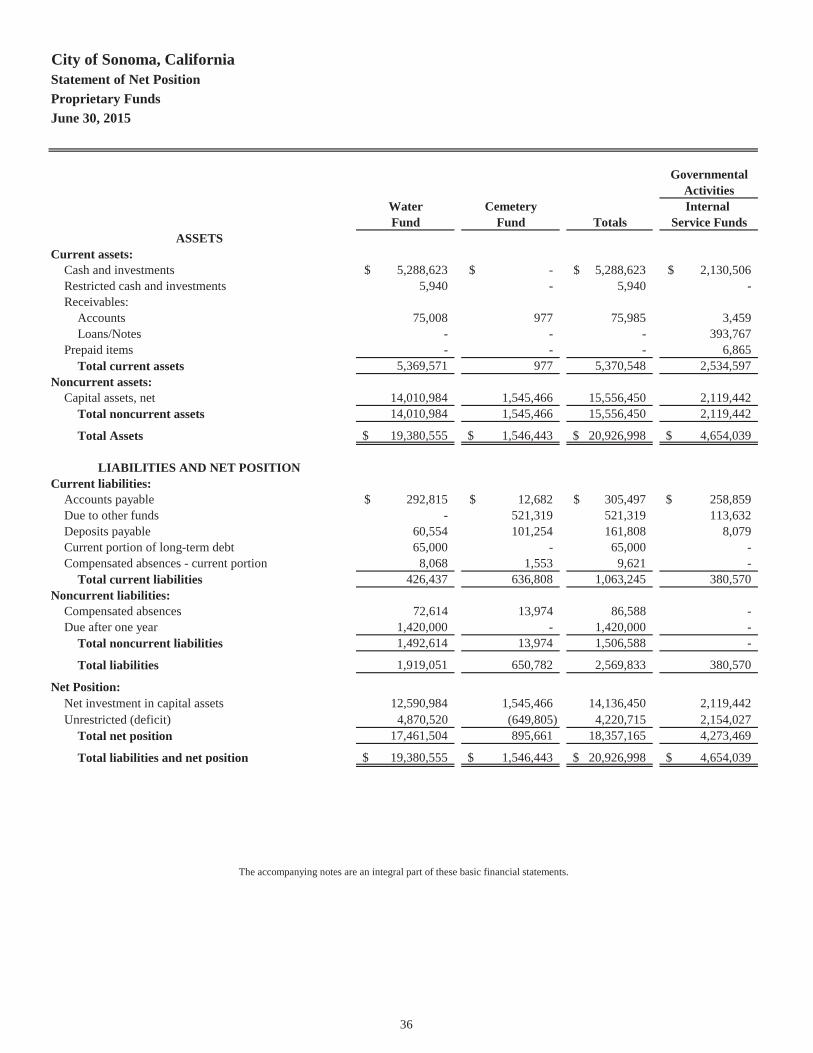
City of Sonoma, CaliforniaStatement of Net PositionProprietary Funds June 30, 2015
GovernmentalActivities
Water Cemetery Internal Fund Fund Totals Service Funds
ASSETSCurrent assets:
Cash and investments 5,288,623$ -$ 5,288,623$ 2,130,506$ Restricted cash and investments 5,940 - 5,940 - Receivables:
Accounts 75,008 977 75,985 3,459 Loans/Notes - - - 393,767
Prepaid items - - - 6,865 Total current assets 5,369,571 977 5,370,548 2,534,597
Noncurrent assets:Capital assets, net 14,010,984 1,545,466 15,556,450 2,119,442
Total noncurrent assets 14,010,984 1,545,466 15,556,450 2,119,442
Total Assets 19,380,555$ 1,546,443$ 20,926,998$ 4,654,039$
LIABILITIES AND NET POSITIONCurrent liabilities:
Accounts payable 292,815$ 12,682$ 305,497$ 258,859$ Due to other funds - 521,319 521,319 113,632 Deposits payable 60,554 101,254 161,808 8,079 Current portion of long-term debt 65,000 - 65,000 - Compensated absences - current portion 8,068 1,553 9,621 -
Total current liabilities 426,437 636,808 1,063,245 380,570 Noncurrent liabilities:
Compensated absences 72,614 13,974 86,588 - Due after one year 1,420,000 - 1,420,000 -
Total noncurrent liabilities 1,492,614 13,974 1,506,588 -
Total liabilities 1,919,051 650,782 2,569,833 380,570
Net Position:Net investment in capital assets 12,590,984 1,545,466 14,136,450 2,119,442 Unrestricted (deficit) 4,870,520 (649,805) 4,220,715 2,154,027
Total net position 17,461,504 895,661 18,357,165 4,273,469
Total liabilities and net position 19,380,555$ 1,546,443$ 20,926,998$ 4,654,039$
The accompanying notes are an integral part of these basic financial statements.
36

City of Sonoma, CaliforniaStatement of Revenues, Expenses, and Changes in Fund Net PositionProprietary Funds For the year ended June 30, 2015
Governmental Activities
Water Cemetery Internal Fund Fund Totals Service Funds
OPERATING REVENUES:Charges for service 4,189,882$ 148,032$ 4,337,914$ -$ Interdepartmental charges - - - 1,944,683 Other operating revenue 23,759 98,864 122,623 -
Total operating revenues 4,213,641 246,896 4,460,537 1,944,683
OPERATING EXPENSES:Salaries and benefits 1,072,392 177,519 1,249,911 423,145 Contractual services 1,529,318 43,806 1,573,124 1,109 Materials and supplies 81,989 4,272 86,261 118,056 Repairs and maintenance 40,944 5,449 46,393 86,826 Utilities 28,966 8,647 37,613 - Insurance 53,731 - 53,731 152,951 Other operating 151,527 - 151,527 - Allocated overhead 110,372 (8,333) 102,039 45,693 Depreciation 447,310 39,079 486,389 -
Total operating expenses 3,516,549 270,439 3,786,988 827,780
OPERATING INCOME (LOSS) 697,092 (23,543) 673,549 1,116,903
NONOPERATING REVENUES (EXPENSES):Gain (Loss) from the sale of capital assets 1,039 - 1,039 - Connection fees 259,110 - 259,110 - Interest revenue 38,180 7,305 45,485 24,811 Interest expense (59,085) - (59,085) -
Total non-operating revenues, net 239,244 7,305 246,549 24,811
NET INCOME (LOSS) BEFORE TRANSFERS 936,336 (16,238) 920,098 1,141,714
Transfers in - 204,617 204,617 664,661 Transfers out (846,052) (122,303) (968,355) (60,000)
Total transfers (846,052) 82,314 (763,738) 604,661
CAPITAL CONTRIBUTIONS 2,914,480 121,829 3,036,309 1,220,337
CHANGE IN NET POSITION 3,004,764 187,905 3,192,669 2,966,712
NET POSITION:Beginning of year 14,456,740 707,756 15,164,496 1,306,757
End of year 17,461,504$ 895,661$ 18,357,165$ 4,273,469$
The accompanying notes are an integral part of these basic financial statements.
37
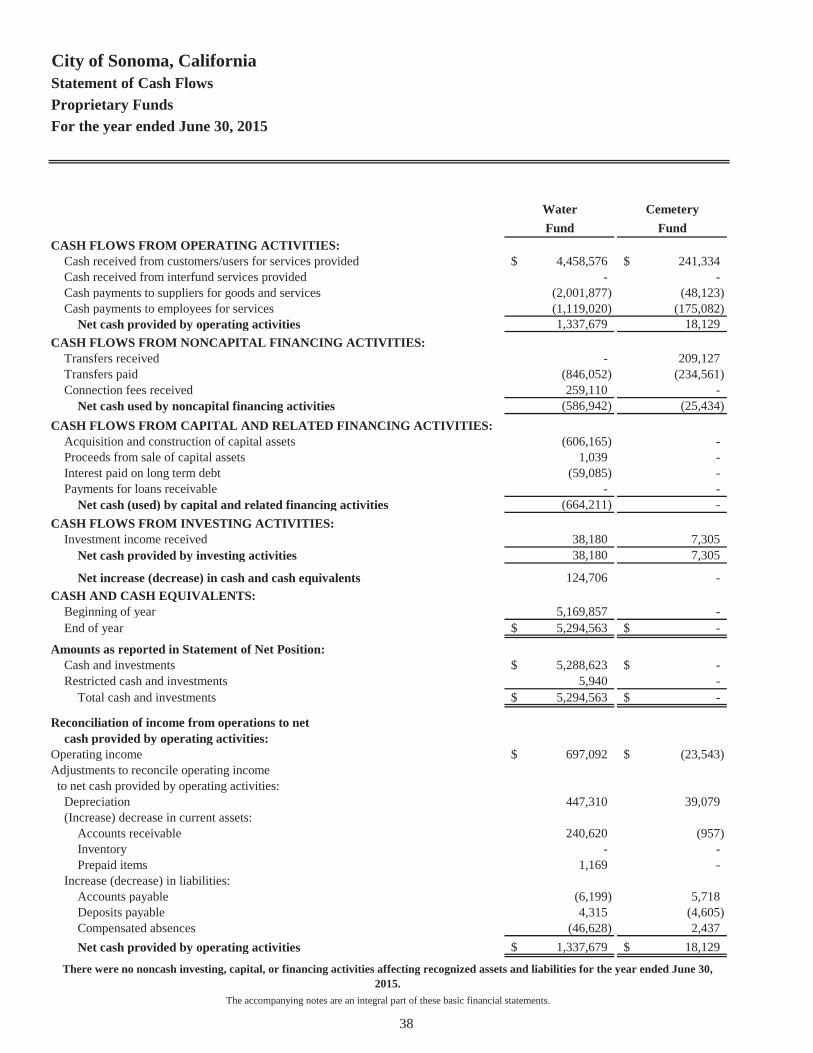
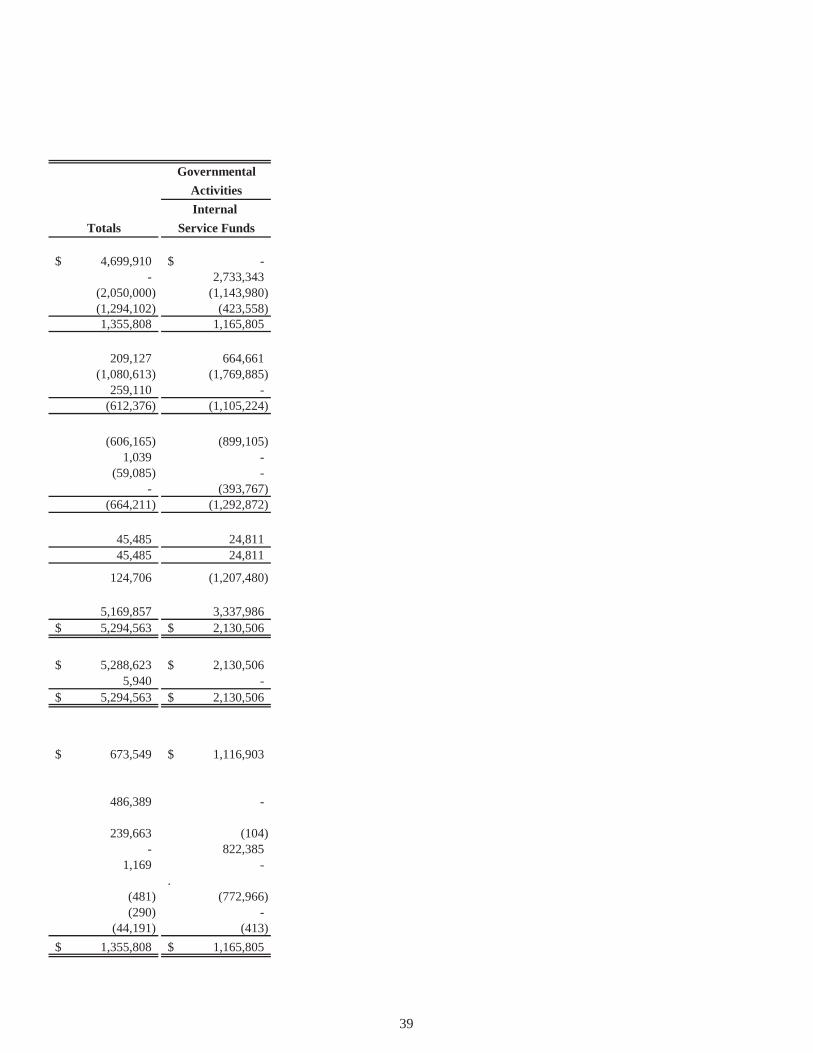
City of Sonoma, CaliforniaStatement of Cash FlowsProprietary Funds For the year ended June 30, 2015
Water CemeteryFund Fund
CASH FLOWS FROM OPERATING ACTIVITIES:Cash received from customers/users for services provided 4,458,576$ 241,334$ Cash received from interfund services provided - - Cash payments to suppliers for goods and services (2,001,877) (48,123) Cash payments to employees for services (1,119,020) (175,082)
Net cash provided by operating activities 1,337,679 18,129 CASH FLOWS FROM NONCAPITAL FINANCING ACTIVITIES:
Transfers received - 209,127 Transfers paid (846,052) (234,561) Connection fees received 259,110 -
Net cash used by noncapital financing activities (586,942) (25,434) CASH FLOWS FROM CAPITAL AND RELATED FINANCING ACTIVITIES:
Acquisition and construction of capital assets (606,165) - Proceeds from sale of capital assets 1,039 - Interest paid on long term debt (59,085) - Payments for loans receivable - -
Net cash (used) by capital and related financing activities (664,211) - CASH FLOWS FROM INVESTING ACTIVITIES:
Investment income received 38,180 7,305 Net cash provided by investing activities 38,180 7,305
Net increase (decrease) in cash and cash equivalents 124,706 - CASH AND CASH EQUIVALENTS:
Beginning of year 5,169,857 - End of year 5,294,563$ -$
Amounts as reported in Statement of Net Position:Cash and investments 5,288,623$ -$ Restricted cash and investments 5,940 -
Total cash and investments 5,294,563$ -$
Reconciliation of income from operations to netcash provided by operating activities:
Operating income 697,092$ (23,543)$ Adjustments to reconcile operating income to net cash provided by operating activities:
Depreciation 447,310 39,079 (Increase) decrease in current assets:
Accounts receivable 240,620 (957) Inventory - - Prepaid items 1,169 -
Increase (decrease) in liabilities:Accounts payable (6,199) 5,718 Deposits payable 4,315 (4,605) Compensated absences (46,628) 2,437 Net cash provided by operating activities 1,337,679$ 18,129$
There were no noncash investing, capital, or financing activities affecting recognized assets and liabilities for the year ended June 30, 2015.
The accompanying notes are an integral part of these basic financial statements.
38
GovernmentalActivitiesInternal
Totals Service Funds
4,699,910$ -$ - 2,733,343
(2,050,000) (1,143,980) (1,294,102) (423,558) 1,355,808 1,165,805
209,127 664,661 (1,080,613) (1,769,885)
259,110 - (612,376) (1,105,224)
(606,165) (899,105) 1,039 -
(59,085) - - (393,767)
(664,211) (1,292,872)
45,485 24,811 45,485 24,811
124,706 (1,207,480)
5,169,857 3,337,986 5,294,563$ 2,130,506$
5,288,623$ 2,130,506$ 5,940 -
5,294,563$ 2,130,506$
673,549$ 1,116,903$
486,389 -
239,663 (104) - 822,385
1,169 - .
(481) (772,966) (290) -
(44,191) (413) 1,355,808$ 1,165,805$
39

Fund
Successor Agency - Sonoma Community Development Agency
Agency Funds are used to account for assets held by the City as an agent for individuals, private organizations and other governments.
The financial activities of these funds are excluded from the government-wide financial statements, but are presented in separate Fiduciary Fund financial statements.
FIDUCIARY ACTIVITIES
Private Purpose Trust Funds are used for resources held for other individuals and entities in a manner similar to private enterprise.
Description
Accounts for funds collected and disbursed for the dissolution of the former Sonoma Community Development Agency related to Administration and Retirement of enforceable obligations
40
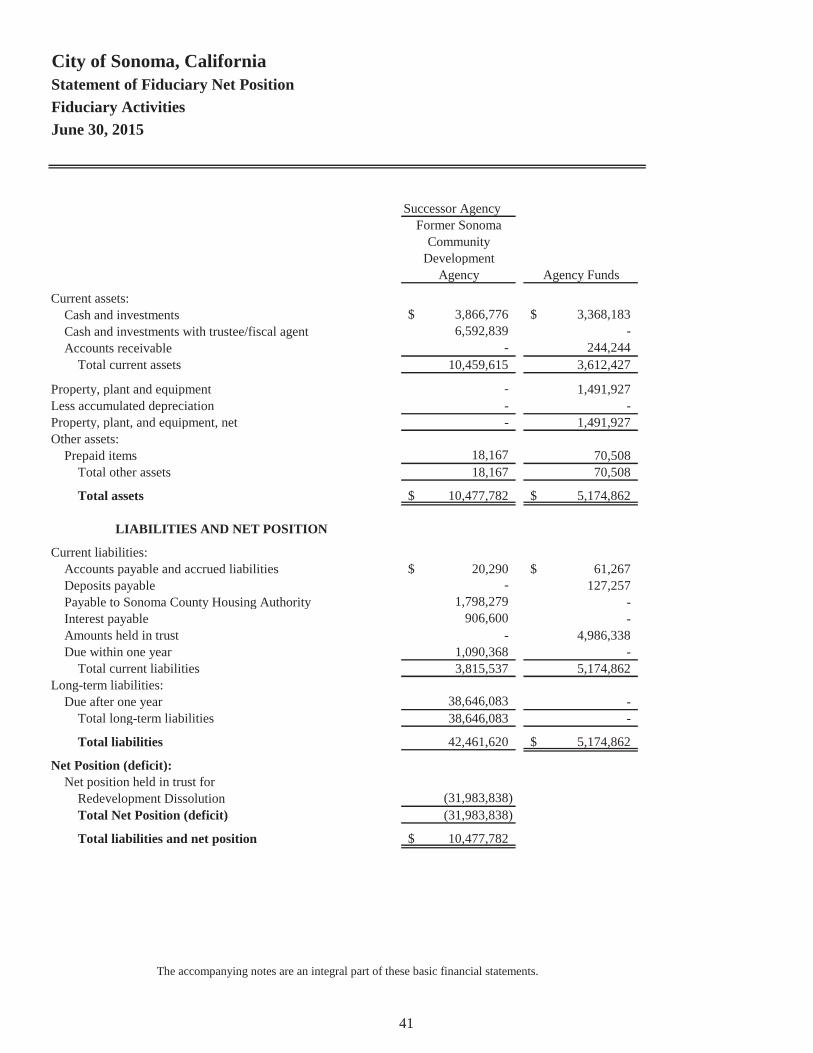
City of Sonoma, CaliforniaStatement of Fiduciary Net PositionFiduciary ActivitiesJune 30, 2015
Successor AgencyFormer Sonoma
CommunityDevelopment
Agency Agency Funds
Current assets:Cash and investments 3,866,776$ 3,368,183$ Cash and investments with trustee/fiscal agent 6,592,839 - Accounts receivable - 244,244
Total current assets 10,459,615 3,612,427
Property, plant and equipment - 1,491,927 Less accumulated depreciation - - Property, plant, and equipment, net - 1,491,927 Other assets:
Prepaid items 18,167 70,508 Total other assets 18,167 70,508
Total assets 10,477,782$ 5,174,862$
LIABILITIES AND NET POSITION
Current liabilities:Accounts payable and accrued liabilities 20,290$ 61,267$ Deposits payable - 127,257 Payable to Sonoma County Housing Authority 1,798,279 - Interest payable 906,600 - Amounts held in trust - 4,986,338 Due within one year 1,090,368 -
Total current liabilities 3,815,537 5,174,862 Long-term liabilities:
Due after one year 38,646,083 - Total long-term liabilities 38,646,083 -
Total liabilities 42,461,620 5,174,862$
Net Position (deficit):Net position held in trust for
Redevelopment Dissolution (31,983,838)Total Net Position (deficit) (31,983,838)
Total liabilities and net position 10,477,782$
The accompanying notes are an integral part of these basic financial statements.
41
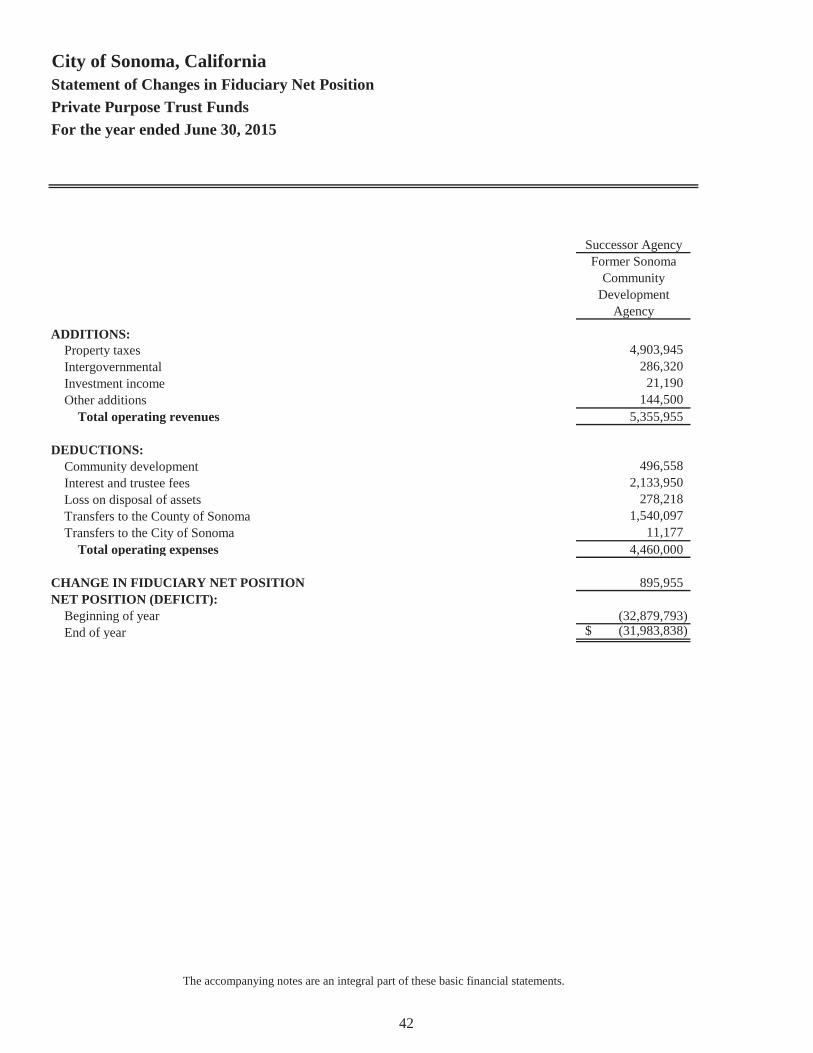
City of Sonoma, CaliforniaStatement of Changes in Fiduciary Net PositionPrivate Purpose Trust FundsFor the year ended June 30, 2015
Successor Agency Former Sonoma
CommunityDevelopment
Agency
ADDITIONS:Property taxes 4,903,945 Intergovernmental 286,320Investment income 21,190 Other additions 144,500
Total operating revenues 5,355,955
DEDUCTIONS:Community development 496,558 Interest and trustee fees 2,133,950 Loss on disposal of assets 278,218Transfers to the County of Sonoma 1,540,097Transfers to the City of Sonoma 11,177
Total operating expenses 4,460,000
CHANGE IN FIDUCIARY NET POSITION 895,955 NET POSITION (DEFICIT):
Beginning of year (32,879,793)End of year (31,983,838)$
The accompanying notes are an integral part of these basic financial statements.
42
43
NOTES TO BASIC FINANCIAL STATEMENTS

44
This page intentionally left blank.

City of Sonoma, California Basic Financial Statements For the year ended June 30, 2015 Index to the Notes to Basic Financial Statements
45
Page Note 1 - Summary of Significant Accounting Policies .................................................................... 46
Financial Reporting Entity ............................................................................................................. 46 Basis of Presentation ...................................................................................................................... 47 Measurement Focus ....................................................................................................................... 49 Basis of Accounting ....................................................................................................................... 50 Assets, Liabilities, and Equity ....................................................................................................... 51 Revenues, Expenditures, and Expenses ......................................................................................... 55 Budgetary Accounting ................................................................................................................... 56
Note 2 – Cash and Investments......................................................................................................... 59 Note 3 – Accounts Receivable ........................................................................................................... 63 Note 4 – Capital Assets ...................................................................................................................... 64 Note 5 – Accounts Payable and Accrued Liabilities ....................................................................... 66 Note 6 – Long-Term Liabilities ........................................................................................................ 66 Note 7 – Net Position/Fund Balances ............................................................................................... 69 Note 8 – Interfund Transactions ...................................................................................................... 72 Note 9 – Risk Management ............................................................................................................... 74 Note 10 – Public Employee Retirement System .............................................................................. 76 Note 11 – Successor Agency for Former Sonoma Community Development Agency ................ 84 Note 12 – Commitments and Contingencies .................................................................................... 86 Note 13 – New Accounting Pronouncements ................................................................................... 86

City of Sonoma, California Notes to the Basic Financial Statements For the year ended June 30, 2015
46
1. SUMMARY OF SIGNIFICANT ACCOUNTING POLICIES The City of Sonoma (City) was incorporated in 1883, under the laws and regulations of the State of California (State). The City operates under a City Council/Manager form of government and provides the following services: public safety, public works and facilities, community services, public utilities, and community development. The financial statements of the City have been prepared in accordance with accounting principles generally accepted in the United States of America (GAAP) as applied to governmental units. The Governmental Accounting Standards Board (GASB) is the standard-setting body for governmental accounting and financial reporting. On June 15, 1987, GASB issued a codification of the existing Governmental Accounting and Financial Reporting Standards which, along with subsequent GASB pronouncements (Statements and Interpretations), constitutes GAAP for governmental units. The City applies all GASB pronouncements to its activities. In addition, the City applies all Financial Accounting Standards Board (FASB) Statements and Interpretations, Accounting Principles Board (APB) Opinions, and Accounting Research Bulletins (ARB) issued after November 30, 1989, unless they conflict with or contradict GASB pronouncements. The more significant of these accounting policies are described below and, where appropriate, subsequent pronouncements will be referenced. Financial Reporting Entity The City operates as a self-governing local government unit within the State. It has limited authority to levy taxes and has the authority to determine user fees for the services that it provides. The City’s main funding sources include sales tax, property tax, Measure J (Transactions and Use Tax), and Transient Occupancy Tax (TOT). The financial reporting entity consists of (a) the primary government, the City, (b) organizations for which the primary government is financially accountable, and (c) other organizations for which the primary government is not accountable, but for which the nature and significance of their relationship with the primary government are such that exclusion would cause the reporting entity’s financial statements to be misleading or incomplete. Financial accountability is defined as the appointment of a voting majority of the component unit’s board, and either (a) the City has the ability to impose its will on the organization, or (b) there is a potential for the organization to provide a financial benefit to or impose a financial burden on the City. As required by GAAP, these financial statements present the government and its component units, entities for which the government is considered to be financially accountable. These component units are reported on a blended basis. Blended component units, although legally separate entities, are, in substance, part of the government’s operations and so data from these units are combined with data of the primary government. The financial statements of the individual component units, if applicable as indicated below, may be obtained by writing to the City of Sonoma, Finance Department, 1 The Plaza Sonoma, CA 95476.
City of Sonoma, California Notes to the Basic Financial Statements, Continued For the year ended June 30, 2015
47
1. SUMMARY OF SIGNIFICANT ACCOUNTING POLICIES, Continued The City’s reporting entity includes the following blended component unit:
Sonoma Community Housing Corporation was created as a public benefit corporation to provide affordable public housing. It is governed by two members of the City Council and two City employees. The Sonoma Community Housing Corporation activities are reported in a special revenue fund. Sonoma Public Financing Authority is governed by a board comprised of members of the City’s elected council.
The above component units are included in the City’s basic financial statements using the blended method because of the significance of their operational or financial relationships with the City. There are no component units of the City that meet the criteria for discrete presentation. Basis of Presentation Government-Wide Financial Statements The statement of net position and statement of activities display information about the reporting government as a whole. They include all funds of the reporting entity except for fiduciary funds. The statements distinguish between governmental and business-type activities. Governmental activities generally are financed through taxes, intergovernmental revenues, and other nonexchange revenues. Amounts reported as program revenues include 1) charges to customers or applicants for goods, services, or privileges provided by a given function or segment, 2) operating grants and contributions, and 3) capital grants and contributions restricted to the operating or capital requirements of a specific function or segment. All taxes and internally dedicated resources are reported as general revenues rather than program revenues. Fund Financial Statements Fund financial statements of the reporting entity are organized into funds, each of which is considered to be a separate accounting entity. Each fund is accounted for by providing a separate set of self-balancing accounts, which constitute its assets, liabilities, fund equity, revenues, and expenditures/expenses. Funds are organized into three major categories: governmental, proprietary, and fiduciary. An emphasis is placed on major funds within the governmental and proprietary categories. A fund is considered major if it is the primary operating fund of the City or meets the following criteria:
a. Total assets, liabilities, revenues, or expenditures/expenses of that individual governmental fund are at least ten percent of the corresponding total for all funds of that category or type; and
City of Sonoma, California Notes to the Basic Financial Statements, Continued For the year ended June 30, 2015
48
1. SUMMARY OF SIGNIFICANT ACCOUNTING POLICIES, Continued Basis of Presentation, Continued
b. Total assets, liabilities, revenues, or expenditures/expenses of the individual governmental fund are at least five percent of the corresponding total for all governmental funds combined.
The City reports the following major funds:
General Fund Gas Tax Fund Water Fund Cemetery Fund
Descriptions of these funds are included on the divider page preceding the Governmental Funds Balance Sheet. The funds of the financial reporting entity are described below: Governmental Funds General Fund The General Fund is used to account for resources traditionally associated with the City which are not required legally or by sound financial management to be accounted for in another fund. From this fund are paid the City’s general operating expenditures, the fixed charges, and the capital costs that are not paid through other funds. Special Revenue Funds The Special Revenue Funds are used to account for specific revenues that are legally or otherwise restricted to expenditures for particular purposes. Capital Project Funds The Capital Projects Funds are used to account for financial resources used for the acquisition or construction of major capital facilities other than those financed by proprietary funds. Debt Service Funds Debt Service Funds account for the accumulation of resources to pay principal and interest on debt.
City of Sonoma, California Notes to the Basic Financial Statements, Continued For the year ended June 30, 2015
49
1. SUMMARY OF SIGNIFICANT ACCOUNTING POLICIES, Continued Proprietary Funds Enterprise Funds Enterprise Funds are used to account for operations that are financed and operated in a manner similar to private business enterprises. Costs are financed or recovered primarily through user charges. Internal Service Funds Internal Service Funds are used to account for financial transactions related to the City’s Management Information Systems, Vehicle Replacement, Liability and Property Insurance, Employee Benefits, and Long Term Building Maintenance. These services are provided based on a prorated share of costs or based on anticipated equipment replacement timelines. Fiduciary Funds Private Purpose Trust Funds Private Purpose Trust Funds account for resources held for other individuals or entities in a manner similar to private enterprise. Agency Funds Agency Funds are used to account for assets held by the City as an agent for individuals, private organizations and other governments.
The City closed the following funds during the fiscal year: Community Development Block Grant. Measurement Focus Measurement focus is a term used to describe which transactions are recorded within the various financial statements. On the government-wide Statement of Net Position and the Statement of Activities, governmental and business-type activities are presented using the economic resources measurement focus. The accounting objectives of this measurement focus are the determination of net income, financial position, and cash flows. All assets and liabilities (whether current or noncurrent) associated with their activities are reported. Fund equity is classified as net position, which serves as an indicator of financial position. In the fund financial statements, the “current financial resources” measurement focus is used for governmental funds. Only current financial assets and liabilities are generally included on their balance sheets. Their operating statements present sources and uses of available spendable financial resources during a given period. These funds use fund balance as their measure of available spendable financial resources at the end of the period.
City of Sonoma, California Notes to the Basic Financial Statements, Continued For the year ended June 30, 2015
50
1. SUMMARY OF SIGNIFICANT ACCOUNTING POLICIES, Continued The enterprise funds and private purpose trust funds utilize an “economic resources” measurement focus. The accounting objectives of this measurement focus are the determination of net income, financial position, and cash flows. Enterprise fund and private purpose trust funds equity is classified as net position. Agency funds are not involved in the measurement of results of operations; therefore, measurement focus is not applicable to them. Basis of Accounting In the government-wide Statement of Net Position and Statement of Activities, governmental and business-type activities are presented using the accrual basis of accounting. Under the accrual basis of accounting, revenues are recognized when earned and expenses are recorded when the liability is incurred or economic asset used. Revenues, expenses, gains, losses, assets, and liabilities resulting from exchange and exchange-like transactions are recognized when the exchange takes place. In the fund financial statements, governmental funds are presented on the modified accrual basis of accounting. Under this modified accrual basis of accounting, revenues are recognized when “measurable and available.” Measurable means knowing or being able to reasonably estimate the amount. Available means the amount is collectible within the current period or soon enough thereafter to pay current liabilities. The City considers all revenues reported in the governmental funds to be available if the revenues are anticipated to be collected within 60 days after year end. Property taxes, franchise taxes, licenses, and interest associated with the current fiscal period are all considered to be susceptible to accrual and so have been recognized as revenues of the current fiscal year. All other revenue items are considered to be measurable and available only when cash is received by the government. Expenditures (including capital outlay) are recorded when the related fund liability is incurred. The enterprise funds and agency funds utilize the accrual basis of accounting. Under the accrual basis of accounting, revenues are recognized when earned and expenses are recorded when the liability is incurred or economic asset used. Operating revenues in the fund are those revenues that are generated from the primary operations of the fund. All other revenues are reported as non-operating revenues. Operating expenses are those expenses that are essential to the primary operations of the fund. All other expenses are reported as non-operating expenses. Cash Deposits and Investments The City’s cash and cash equivalents are considered to be cash on hand, demand deposits, and short-term investments with original maturities of three months or less from the date of acquisition. The City pools cash and investments from all funds for the purpose of increasing income through investment activities. Highly liquid money market investments with maturities of one year or less at time of purchase are stated at amortized cost. All other investments are stated at fair value in accordance with GASB Statement No. 31, Accounting and Financial Reporting for Certain Investments and for External Investment Pools. Market value is used as fair value for those securities for which market quotations are readily available.

City of Sonoma, California Notes to the Basic Financial Statements, Continued For the year ended June 30, 2015
51
1. SUMMARY OF SIGNIFICANT ACCOUNTING POLICIES, Continued Assets, Liabilities, and Equity Interfund Receivables and Payables During the course of operations, numerous transactions occur between individual funds that may result in amounts owed between funds. Those related to goods and services type transactions are classified as “due to and from other funds.” Long-term interfund loans (noncurrent portion) are reported as “advances from and to other funds.” Interfund receivables and payables between funds within governmental activities are eliminated in the Statement of Net Position. See Note 8 for details of interfund transactions, including receivables and payables at year-end. Receivables In the government-wide statements, receivables consist of all revenues earned at year-end and not yet received. Major receivable balances for the governmental activities include: property taxes, sales taxes, Measure J, Emergency Medical Services charges, and Transient Occupancy Tax (TOT). In the fund financial statements, material receivables in governmental funds include revenue accruals such as property tax, sales tax, and intergovernmental subventions since they are usually both measurable and available. Non-exchange transactions collectible but not available, such as property tax, are deferred in the fund financial statements in accordance with the modified accrual basis, but not deferred in the government-wide financial statements in accordance with the accrual basis. Interest and investment earnings are recorded when earned only if paid within 60 days since they would be considered both measurable and available. The loans receivable are recorded in the fund statements, but are deferred to indicate they do not represent current financial resources. The loans are recognized when advanced in the government-wide statements. The City’s experience is that all accounts receivable are collectible; therefore an allowance for doubtful accounts is unnecessary. Inventory All inventories are valued at cost using the first-in/first-out (FIFO) method. Inventories of supplies are expended when purchased because the amounts are not considered to be material. Inventories of governmental funds are recorded as expenditures when used or consumed. Prepaid Items Certain payments to vendors reflect costs applicable to future accounting periods and are recorded as prepaid items in both government-wide and fund financial statements. In the governmental fund financial statements, prepaid items are offset with a reservation of fund balance for long-term assets to indicate they do not constitute current resources available for appropriation.

City of Sonoma, California Notes to the Basic Financial Statements, Continued For the year ended June 30, 2015
52
1. SUMMARY OF SIGNIFICANT ACCOUNTING POLICIES, Continued Assets, Liabilities, and Equity, Continued Capital Assets The City's assets are capitalized at historical cost or estimated historical cost, if actual is unavailable, except for donated Capital Assets which are recorded at their estimated fair value at the date of donation. Policy has set the capitalization threshold for reporting at $5,000 for non-infrastructure capital assets and $25,000 for infrastructure capital assets. Government-Wide Statements Public domain (infrastructure) capital assets include roads, bridges, curbs and gutters, streets, sidewalks, drainage systems, and lighting systems. The accounting treatment of property, plant and equipment (capital assets) depends on whether the assets are used in governmental fund operations or proprietary fund operations and whether they are reported in the government-wide or fund financial statements. Depreciation of all exhaustible capital assets is recorded as an allocated expense in the Statement of Activities, with accumulated depreciation reflected in the Statement of Net Position. Depreciation is provided over the assets’ estimated useful lives using the straight-line method of depreciation. No depreciation is recorded in the year of acquisition or in the year of disposition. The range of estimated useful lives by type of asset is as follows: Buildings and improvements 25 – 50 years Machinery and equipment 8 – 30 years Furniture and fixtures 5 – 12 years Software 5 – 7 years Infrastructure 5 – 60 years Fund Financial Statements In the fund financial statements, capital assets used in governmental fund operations are accounted for as capital outlay expenditures of the governmental fund upon acquisition. Capital assets used in proprietary fund operations are accounted for the same way as in the government-wide statements.
City of Sonoma, California Notes to the Basic Financial Statements, Continued For the year ended June 30, 2015
53
1. SUMMARY OF SIGNIFICANT ACCOUNTING POLICIES, Continued Assets, Liabilities, and Equity, Continued Deferred outflows/inflows of resources In addition to assets, the statement of net position will sometimes report a separate section for deferred outflows of resources. This separate financial statement element, deferred outflows of resources, represents a consumption of net position that applies to a future period(s) and so will not be recognized as an outflow of resources (expense/expenditure) until then. The City has one item reported as a deferred outflow of resources. The item is a deferred charge on pension plan contributions in the government-wide statement of net position. In addition to liabilities, the statement of position will sometimes report a separate section for deferred inflows of resources. This separate financial statement element, deferred inflows of resources, represents an acquisition of net position that applies to a future period(s) and so will not be recognized as an inflow of resources (revenue) until that time. The City has item reported as a deferred inflow of resources. The item is the net difference between projected and actual earnings on pension plan investments and is reported in the government-wide statement of net position. Compensated Absences Employees accrue vacation, sick, holiday, and compensatory time off benefits. City employees have vested interests in the amount of accrued time off, with the exception of sick time, and are paid on termination. Also, annually an employee may elect to be compensated for 40 to 120 hours of unused annual leave depending upon their length of service. All vacation pay is accrued when incurred in the government-wide and proprietary financial statements. A liability for these amounts is reported in the governmental funds only if they have matured, for example, as a result of employee resignations or retirements and is currently payable. The City had no employee resignations or retirements for which compensated absences should be accrued in governmental funds at year-end. The general fund is typically used to liquidate compensated absences.

City of Sonoma, California Notes to the Basic Financial Statements, Continued For the year ended June 30, 2015
54
1. SUMMARY OF SIGNIFICANT ACCOUNTING POLICIES, Continued Equity Classification Government-Wide Statements Equity is classified as net position and is displayed in three components:
a. Net investment in capital assets – consists of capital assets, including restricted capital assets, net of accumulated depreciation and reduced by the outstanding balances of any bonds, mortgages, notes, or other borrowings that are attributable to the acquisition, construction, or improvement of those assets.
b. Restricted net position – consists of net position with constraints placed on the use by
external groups such as creditors, grantors, contributors, or bylaws or regulations of other governments or law through constitutional provisions or enabling legislation.
c. Unrestricted net position – all other net position that do not meet the definition of
“restricted” or “invested in capital assets, net of related debt.” Fund Financial Statements Governmental fund equity is classified as fund balance. Fund balance is classified as nonspendable, restricted, committed, assigned, or unassigned. Proprietary fund equity is classified the same as in the government-wide statements. The classifications for governmental funds are defined as follows for the City: Nonspendable Fund Balance –
Assets that will never convert to cash (prepaid items, inventory). Assets that will not convert to cash soon enough to affect the current period (long-term notes or
loans receivable). Resources that must be maintained intact pursuant to legal or contractual requirements (the
principal of an endowment). Restricted Fund Balance –
Resources that are subject to externally enforceable legal restrictions imposed by parties altogether outside the government (creditors, grantors, contributors and other governments).
Resources that are subject to limitations imposed by law through constitutional provisions or enabling legislation (Gas Tax).
Committed Fund Balance –
Self imposed limitations set in place prior to the end of the period (encumbrances, economic contingencies and uncertainties).
Limitation at the highest level of decision-making (Council) that requires formal action at the same level to remove.
Council resolution is required to be taken to establish, modify or rescind a fund balance commitment.

City of Sonoma, California Notes to the Basic Financial Statements, Continued For the year ended June 30, 2015
55
1. SUMMARY OF SIGNIFICANT ACCOUNTING POLICIES, Continued Assets, Liabilities, and Equity, Continued Assigned Fund Balance –
Amounts in excess of nonspendable, restricted and committed fund balance in funds other than the general fund automatically are reported as assigned fund balance.
Assigned amounts for a specific purpose are as authorized by the City’s Finance Director through its fund balance policy.
Unassigned Fund Balance –
Residual net resources Total fund balance in the general fund in excess of nonspendable, restricted, committed, and
assigned fund balance (surplus). Excess of nonspendable, restricted, and committed fund balance over total fund balance
(deficit).
Revenues, Expenditures, and Expenses Property Tax Property taxes in the State of California are administered for all local agencies at the county level and consist of secured, unsecured, and utility tax rolls. The following is a summary of major policies and practices relating to property taxes.
Property Valuations – are established by the Assessor of the County of Sonoma (County) for the secured and unsecured property tax rolls; the utility property tax rolls are valued by the State Board of Equalization. Under the provisions of Article XIIIA of the State Constitution (Proposition 13 adopted by voters on June 6, 1978) properties are assessed at 100% of full value. From this base of assessment, subsequent annual increases in valuation are limited to a maximum of 2%. However, increases to full value are allowed for property improvements or upon change in ownership. Personal property is excluded from these limitations, and is subject to annual reappraisal. Tax Levies – are limited to 1% of full value which results in a tax rate of $1.00 per $100 assessed valuation, under the provisions of Proposition 13. Tax rates for voter-approved indebtedness are excluded from this limitation. Tax Levy Dates – are attached annually on January 1 preceding the fiscal year for which the taxes are levied. The fiscal year begins July 1 and ends June 30 of the following year. Taxes are levied on both real and unsecured personal property as it exists at that time. Liens against real estate, as well as the tax on personal property, are not relieved by subsequent renewal or change in ownership.

City of Sonoma, California Notes to the Basic Financial Statements, Continued For the year ended June 30, 2015
56
1. SUMMARY OF SIGNIFICANT ACCOUNTING POLICIES, Continued Revenues, Expenditures, and Expenses, Continued
Tax Collections – are the responsibility of the County Tax Collector. Taxes and assessments on secured and utility rolls which constitute a lien against the property, may be paid in two installments: The first is due on November 1 of the fiscal year and is delinquent if not paid by December 10; and the second is due on March 1 of the fiscal year and is delinquent if not paid by April 10. Unsecured personal property taxes do not constitute a lien against real property unless the taxes become delinquent. Payment must be made in one installment, which is delinquent if not paid by August 31 of the fiscal year. Significant penalties are imposed by the County for late payments. The County levies, bills, and collects property taxes and special assessments for the City. Property taxes levied are recorded as revenue when received, in the fiscal year of levy, due to the adoption of the “alternate method of property tax distribution”, known as the Teeter Plan, by the City and the County. The Teeter Plan authorizes the Auditor/Controller of the County to allocate 100% of the secured property taxes billed, but not yet paid. The County remits tax monies to the City in three installments as follows:
50 percent remitted in December 45 percent remitted in April 5 percent remitted in June
Interfund Transfers Resources are reallocated between funds by reporting them as interfund transfers. For the purposes of the Statement of Activities, all interfund transfers between individual governmental funds have been eliminated. Budgetary Accounting The City Council establishes budgets for the General Fund and all Special Revenue Funds, except for certain Special Revenue Funds for which expenditures are controlled by grant funding or by assessments received. Budgetary control is legally maintained at the fund level for these funds. Department heads submit budget requests to the City Manager. The City Manager prepares an estimate of revenues and prepares recommendations for the next year’s budget. The preliminary budget may or may not be amended by the City Council and is adopted by resolution by the City Council on or before June 30 in accordance with the municipal code. The City Council may amend the budget by motion during the fiscal year. Only the Council can authorize transfers between funds and approve inter-fund loans. The City Manager is authorized to transfer budgeted amounts within a fund without formal council action or approval. The City Manager is authorized to increase expenditures in relation to revenues in funds receiving assigned revenues without approval by the City Council.
City of Sonoma, California Notes to the Basic Financial Statements, Continued For the year ended June 30, 2015
57
1. SUMMARY OF SIGNIFICANT ACCOUNTING POLICIES, Continued Budgetary Accounting, Continued Expenditures may not legally exceed appropriations at the fund level, which is the legal level of control. Supplemental appropriations, which increase appropriations, may be made during the fiscal year. There were supplemental appropriations of $420,225 made for the fiscal year ended June 30, 2015. Budget information is presented for the General and budgeted Special Revenue Funds in the fund financial statements. The budget information is presented on a basis consistent with generally accepted accounting principles. Appropriations, except open project appropriations, and unexpended grant appropriations, lapse at the end of each fiscal year. Use of Estimates The preparation of financial statements in conformity with accounting principles generally accepted in the United States of America requires management to make estimates and assumptions that affect the reported amounts of assets, liabilities, revenues and expenses. Actual results could differ from those estimates. Implementation of GASB Statements 68 and 71 related to Pension Plans The GASB issued Statement No. 68, “Accounting and Financial Reporting for Pensions – An Amendment of GASB Statement No. 27” The primary objective of this Statement is to improve accounting and financial reporting by state and local governments for pensions. It also improves information provided by state and local governmental employers about financial support for pensions that is provided by other entities. This Statement establishes accounting and financial reporting requirements related to pensions for governments whose employees are provided with pensions through pension plans that are covered by the scope of this Statement, as well as for nonemployer governments that have a legal obligation to contribute to those plans. In addition, the GASB issued Statement No. 71, “Pension Transition for Contributions Made Subsequent to the Measurement Date” The objective of this Statement is to address an issue regarding application of the transition provisions of Statement No. 68, “Accounting and Financial Reporting for Pensions”. The issue relates to amounts associated with contributions, if any, made by a state or local government employer or nonemployer contributing entity to a defined benefit pension plan after the measurement date of the government’s beginning net pension liability. In implementing these Statements, the City recognizes a net pension liability, which represents the City’s proportionate share of the excess of the total pension liability over the fiduciary net position of the Plan reflected in an actuarial report provided by the California Public Employees’ Retirement System (CalPERS). The net pension liability is measured as of the City’s prior Plan year end. Changes in the net pension liability are recorded, in the period incurred, as pension expense or as deferred inflows of resources or deferred outflows of resources depending on the nature of the change in the liability.
City of Sonoma, California Notes to the Basic Financial Statements, Continued For the year ended June 30, 2015
58
1. SUMMARY OF SIGNIFICANT ACCOUNTING POLICIES, Continued Implementation of GASB Statements 68 and 71 related to Pension Plans, Continued The changes in net pension liability that are recorded as deferred inflows of resources or deferred outflows of resources (that arise from changes in actuarial assumptions or other inputs and differences between expected or actual experience) are amortized over the weighted average remaining service life of all participants in the respective pension plan and are recorded as a component of pension expense beginning with the period in which they are incurred. For purposes of measuring the net pension liability and deferred outflows/inflows or resources relating to pensions and pension expense, information about the fiduciary net position of the City’s pension plan with CalPERS and additions to/deductions from the plan’s fiduciary net position have been determined on the same basis as they are reported by CalPERS. For this purpose, benefit payments (including refunds of employee contributions) are recognized when due and payable in accordance with the benefits terms. Investments are reported at fair value. Projected earnings on pension investments are recognized as a component of pension expense. Differences between projected and actual investment earnings are reported as deferred inflows of resources or deferred outflows of resources and amortized as a component of pension expense on a closed basis over a five year period beginning with the period in which the difference occurred. Each subsequent year will incorporate an additional closed basis five year period of recognition. Prior Period Adjustment Due to the City’s adoption of GASB 68, net position was adjusted at June 30, 2015. The following is a reconciliation of the total net position as previously reported at July 1, 2014, to the restated net position.
Governmental Activities
Net Position at June 30, 2014 38,167,364$ Adjustment:
Adoption of GASB 68, pensions (9,939,031) Total Adjustments (9,939,031) Net Position at July 1, 2014, as adjusted 28,228,333$
Reclassifications Certain amounts have been reclassified to provide for comparable results on a year to year basis.

City of Sonoma, California Notes to the Basic Financial Statements, Continued For the year ended June 30, 2015
59
2. CASH AND INVESTMENTS At June 30, 2015, the City’s pooled cash and investments, classified by maturity, consisted of the following stated at fair value:
Fair<1 1 to 3 3 to 5 Deposits Market Value
Cash equivalents and investments pooledPooled cash, at fair value
Cash in bank -$ -$ -$ 1,307,541$ 1,307,541$ Petty cash - - - 850 850
Total pooled items - - - 1,308,391 1,308,391
Pooled investments, at fair valueInterest obligations
Par Rate6,451,000$ 0.750 - 2.650% Certificate of Deposits 210,218 6,009,532 - - 6,219,750
0.010% Money Market 6,598,779 - - - 6,598,779
State of California Local Agency Investment Fund 13,156,599 - - - 13,156,599 Total pooled investments - interest obligations 19,965,596 6,009,532 - - 25,975,128 Total cash equivalents and investments pooled 19,965,596$ 6,009,532$ -$ 1,308,391$ 27,283,519$
Amounts reported in:Governmental activities 8,161,158$ Business-type activities 5,288,623 Business-type activities - Restricted 5,940 Fiduciary activities 7,234,959 Fiduciary activities - Restricted 6,592,839 Total 27,283,519$
Maturities (in years)
Weighted Average
Investment Type Fair Value Maturity (Years)Certificates of deposit 6,219,750$ 1.60State investment pool 13,156,599 0.00Held by bond trustees:
Money market funds 6,598,779 0.00Total fair value 25,975,128$
Portfolio weighted average maturity 0.37

City of Sonoma, California Notes to the Basic Financial Statements, Continued For the year ended June 30, 2015
60
2. CASH AND INVESTMENTS, Continued California statutes authorize cities to invest idle or surplus funds in a variety of credit instruments as provided for in the California Government Code, Section 53600, Chapter 4 – Financial Affairs. The table below identifies the investment types that are authorized for the City by the California Government Code (or the City’s investment policy, where more restrictive) that address interest rate risk, credit risk, and concentration of credit risk. The table does not address investments of debt proceeds held by bond trustees that are governed by the provisions of debt agreements of the City, rather than the general provisions of the California Government Code of the City’s investment policy. During the year ended June 30, 2015, the City’s permissible investments included the following instruments:
Maximum MaximumMaximum Percentage Investment
Authorized Investment Type Maturity of Portfolio in One IssuerBankers' Acceptances 180 days 40% NoneCertificates of Deposits 180 days 20% NoneNegotiable Certificates of Deposit 180 days 30% NoneCommercial Paper 180 days 15% NoneState of California Local Agency
Investment Fund (State Pool) N/A Unlimited $50 Million per entityMedium Term Notes 5 years 30% NoneMoney Market Funds N/A Unlimited NonePassbook Savings and Money Market
Accounts (Insured) None Unlimited NoneU.S. Treasury Obligations None Unlimited NoneU.S. Government Agency Issues None Unlimited NoneRepurchase Agreements 30 days 10% NoneMortgage pass-through and
asset backed securities 5 years 20% None Investment of debt proceeds held by bond trustees are governed by provisions of the debt agreements, rather than the general provisions of the California Government Code or the City’s investment policy. The table below identifies the investment types that are authorized for investments held by bond trustees. The table also identifies certain provisions of these debt agreements that address interest rate risk, credit risk, and concentration of credit risk.

City of Sonoma, California Notes to the Basic Financial Statements, Continued For the year ended June 30, 2015
61
2. CASH AND INVESTMENTS, Continued
Maximum MaximumMaximum Percentage Investment
Authorized Investment Type Maturity of Portfolio in One IssuerU.S. Treasury Obligations None None NoneU.S. Agency Securities None None NoneCommercial Paper 270 days None NoneMoney Market Mutual Funds N/A None NoneInvestment Contracts None None NoneLocal Agency Investment Fund (State Pool) N/A None NoneCertificates of Deposit with Banks
and Savings and Loans None None NoneMunicipal Obligations None None None
Interest rate risk –Interest rate risk is the risk that changes in market interest rates will adversely affect the fair value of an investment. Generally, the longer the maturity of an investment the greater the sensitivity of its fair value to changes in market interest rates. One of the ways that the City manages its exposure to interest rate risk is by purchasing a combination of shorter term and longer term investments and by timing cash flows from maturities so that a portion of the portfolio is maturing or coming close to maturity evenly over time as necessary to provide the cash flow and liquidity needed for operations. Credit risk – As of June 30, 2015, the City’s investments in money market funds were rated AAA by Standard & Poor’s and Fitch Ratings, and Aaa by Moody’s Investors Service. The State of California Local Agency Investment Fund is not rated. Concentration of credit risk – The City’s investment policy does not allow for an investment in any one issuer that is in excess of five percent of the government’s total investments. The investments made by the City Treasurer are limited to those allowable under State statutes as incorporated into the City’s Investment Policy, which is accepted annually by the City Council. There were no concentrations in any one issuer for the year. The City participates in an investment pool managed by the State of California titled Local Agency Investment Fund (LAIF) which has invested 0.97% of the pool funds in Structured Notes and Asset-Backed Securities. LAIF's investments are subject to credit risk with the full faith and credit of the State of California collateralizing these investments. In addition, these Structured Notes and Asset-Backed Securities are subject to market risk as to changes in interest rates.
City of Sonoma, California Notes to the Basic Financial Statements, Continued For the year ended June 30, 2015
62
2. CASH AND INVESTMENTS, Continued Custodial credit risk – deposits. For deposits, this is the risk that, in the event of a bank failure, the City’s deposits may not be returned. The City’s Investment Policy addresses custodial credit risk, which follows the Government Code. At June 30, 2015, the carrying amount of the City’s deposits was $1,062,140 and the balances in financial institutions were $1,914,719. Of the balance in financial institutions, $250,000 was covered by federal depository insurance and $1,664,719 was collateralized as required by State law (Government Code Section 53630), by the pledging financial institution with assets held in a common pool for the City and other governmental agencies, but not in the name of the City. As of June 30, 2015, the City’s investments were held by the City’s custodial agent, but not in the City’s name, and were insured up to specified limits by the Securities Investor Protection Corporation (SIPC) and supplemental private insurance up to a limit of $150 million. Custodial credit risk – investments. For investments, this is the risk that, in the event of the failure of the counterparty, the City will not be able to recover the value of its investments or collateral securities that are in the possession of an outside counterparty. For the investments maintained by the City, no security was uninsured or unregistered or held by a brokerage firm which is also the counterparty for the security. Investment in LAIF The City is a voluntary participant in California Local Agency Investment Fund (LAIF), which is regulated by California Government Code Section under the oversight of the Local Investment Advisory Board (Board). The Board consists of five members as designated by state statute, and is chaired by the State Treasurer who is responsible for day to day administration of LAIF. The total amount invested by all public agencies as of June 30, 2015 was $21,495,234,784 of which the City had a balance of $13,156,598. LAIF is part of the California Pooled Money Investment Account (PMIA), which at June 30, 2015 has a portfolio of $69,606,487,716. Of the total invested, 99.03% was invested in non-derivative financial products and 0.97% in structured notes and asset-backed securities. The fair value of the City’s investment in this pool is reported in the accompanying financial statements at amounts based upon the City’s pro-rata share of the fair value provided by LAIF for the entire LAIF portfolio (in relation to the amortized cost of that portfolio). The balance available for withdrawal is based on the accounting records maintained by LAIF, which are recorded on an amortized cost basis.

City of Sonoma, California Notes to the Basic Financial Statements, Continued For the year ended June 30, 2015
63
3. ACCOUNTS RECEIVABLE Accounts receivable consisted of the following at June 30, 2015:
Governmental Business-type FiduciaryActivities Activities Activities Totals
Taxes -$ -$ -$ -$ Accounts receivable - 75,985 244,244 320,229 Intergovernmental 142 - - 142 Other 1,877,814 - - 1,877,814
1,877,956$ 75,985$ 244,244$ 2,198,185$
These amounts resulted in the following concentrations in receivables: Individuals/Business 14.6% Other 85.4% Amounts do not indicate a significant concentration (greater than 25%) with any single individual, business or agency.

City of Sonoma, California Notes to the Basic Financial Statements, Continued For the year ended June 30, 2015
64
4. CAPITAL ASSETS Governmental capital asset activity for the year ended June 30, 2015, was as follows:
Balance Transfers/ BalanceJuly 1, 2014 Additions Deletions Adjustments June 30, 2015
Governmental activities:Nondepreciable assets:
Land 4,868,520$ -$ -$ 272,847$ 5,141,367$ Construction in progress 858,520 122,433 (583,132) 197,131 594,952
Total nondepreciable assets 5,727,040 122,433 (583,132) 469,978 5,736,319
Depreciable assets:Buildings and structures 18,598,131 - (2,312,084) 7,800,528 24,086,575 Equipment and vehicles 5,166,119 764,397 (142,168) (228,110) 5,560,238 Infrastructure 22,858,229 - (738,565) (2,270,132) 19,849,532
Total depreciable assets 46,622,479 764,397 (3,192,817) 5,302,286 49,496,345 Total 52,349,519 886,830 (3,775,949) 5,772,264 55,232,664
Accumulated depreciation:Buildings and structures (9,523,842) (483,652) 838,475 1,453,760 (7,715,259) Equipment and vehicles (3,322,592) (211,540) 142,168 116,490 (3,275,474) Infrastructure (5,972,046) (386,612) 203,025 3,753,012 (2,402,621)
Total accumulated depreciation (18,818,480) (1,081,804) 1,183,668 5,323,262 (13,393,354)
Net depreciable assets 27,803,999 (317,407) (2,009,149) 10,625,548 36,102,991
Total net capital assets 33,531,039$ (194,974)$ (2,592,281)$ 11,095,526$ 41,839,310$
Depreciation expense for capital assets was charged to functions as follows:
General government 200,413$ Public safety 395,984Public works 485,407
1,081,804$

City of Sonoma, California Notes to the Basic Financial Statements, Continued For the year ended June 30, 2015
65
4. CAPITAL ASSETS, Continued Business-type capital asset activity for the year ended June 30, 2015, was as follows:
Balance Transfers/ BalanceJuly 1, 2014 Additions Deletions Adjustments June 30, 2015
Business-type activitiesNondepreciable assets:
Land 960,472$ -$ -$ -$ 960,472$ Construction in progress 981,294 260,496 - (783,321) 458,469
Total nondepreciable assets 1,941,766 260,496 - (783,321) 1,418,941
Depreciable assets:Buildings and improvements 16,876,552 - - (13,707,957) 3,168,595 Equipment and vehicles 942,455 258,233 - (562,373) 638,315 Infrastructure 4,715,513 - - 16,102,792 20,818,305
Total depreciable assets 22,534,520 258,233 - 1,832,462 24,625,215 Total 24,476,286 518,729 - 1,049,141 26,044,156
Accumulated depreciation:Buildings and improvements (10,467,362) (62,547) - 9,524,538 (1,005,371) Equipment and vehicles (872,114) (24,561) - 556,237 (340,438) Infrastructure (671,935) (399,281) - (8,070,681) (9,141,897)
Total accumulated depreciation (12,011,411) (486,389) - 2,010,094 (10,487,706)
Net depreciable assets 10,523,109 (228,156) - 3,842,556 14,137,509
Total net capital assets 12,464,875$ 32,340$ -$ 3,059,235$ 15,556,450$
Depreciation expense for capital assets was charged to functions as follows:
Water 447,310$ Cemetery 39,079
486,389$
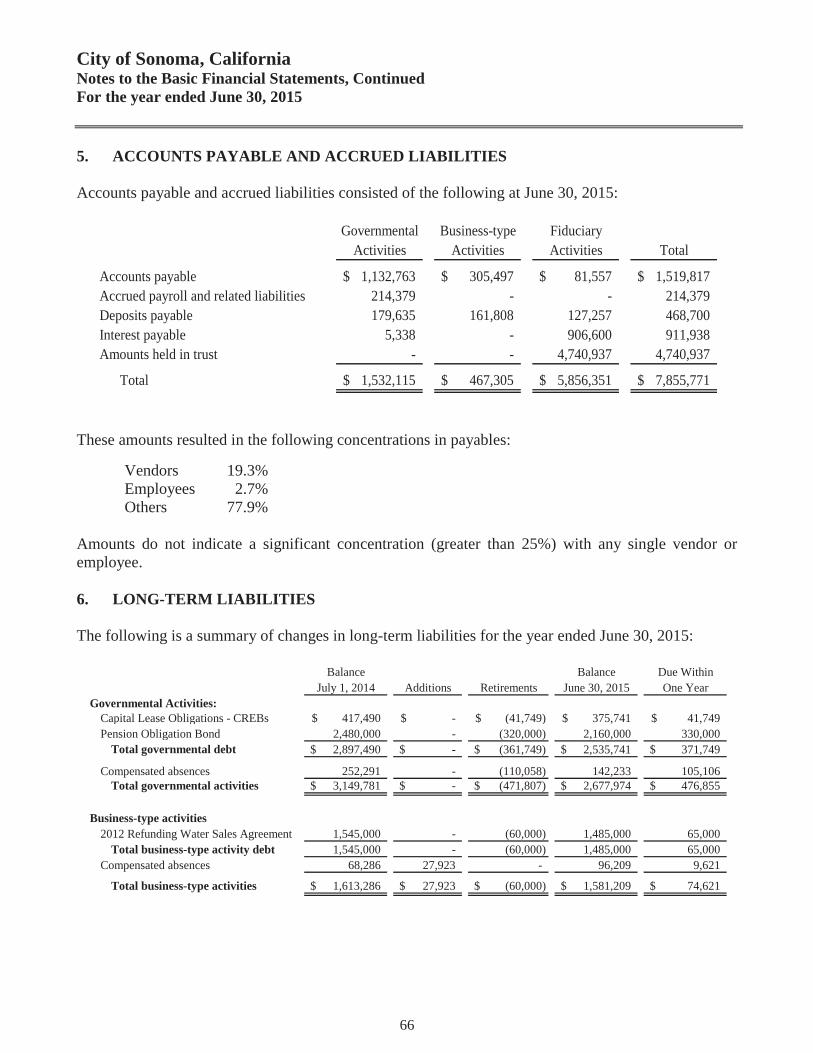
City of Sonoma, California Notes to the Basic Financial Statements, Continued For the year ended June 30, 2015
66
5. ACCOUNTS PAYABLE AND ACCRUED LIABILITIES Accounts payable and accrued liabilities consisted of the following at June 30, 2015:
Governmental Business-type FiduciaryActivities Activities Activities Total
Accounts payable 1,132,763$ 305,497$ 81,557$ 1,519,817$ Accrued payroll and related liabilities 214,379 - - 214,379 Deposits payable 179,635 161,808 127,257 468,700 Interest payable 5,338 - 906,600 911,938 Amounts held in trust - - 4,740,937 4,740,937
Total 1,532,115$ 467,305$ 5,856,351$ 7,855,771$
These amounts resulted in the following concentrations in payables: Vendors 19.3% Employees 2.7% Others 77.9% Amounts do not indicate a significant concentration (greater than 25%) with any single vendor or employee. 6. LONG-TERM LIABILITIES The following is a summary of changes in long-term liabilities for the year ended June 30, 2015:
Balance Balance Due WithinJuly 1, 2014 Additions Retirements June 30, 2015 One Year
Governmental Activities:Capital Lease Obligations - CREBs 417,490$ -$ (41,749)$ 375,741$ 41,749$ Pension Obligation Bond 2,480,000 - (320,000) 2,160,000 330,000
Total governmental debt 2,897,490$ -$ (361,749)$ 2,535,741$ 371,749$
Compensated absences 252,291 - (110,058) 142,233 105,106 Total governmental activities 3,149,781$ -$ (471,807)$ 2,677,974$ 476,855$
Business-type activities2012 Refunding Water Sales Agreement 1,545,000 - (60,000) 1,485,000 65,000
Total business-type activity debt 1,545,000 - (60,000) 1,485,000 65,000 Compensated absences 68,286 27,923 - 96,209 9,621
Total business-type activities 1,613,286$ 27,923$ (60,000)$ 1,581,209$ 74,621$

City of Sonoma, California Notes to the Basic Financial Statements, Continued For the year ended June 30, 2015
67
6. LONG-TERM LIABILITIES, Continued Governmental Activities Capital Lease Obligations Municipal Finance Corporation Lease – In 2007, the City submitted applications to the United States Internal Revenue Service (IRS) for allocation of Clean Renewable Energy Bonds (CREBs). The IRS awarded the City and allocation of $1,156,000 to finance solar paneling project at four different municipal facilities within the City limits. Bonds were issued on July 10, 2008 and tax credits were granted to lender upon financing. The obligation is a lease agreement with Municipal Finance Corporation in the amount of $1,156,000 entered into on July 10, 2008. Principal installments of $41,749 are made on December 15 of each year, with the final installment due on December 15, 2024. 2012 Pension Obligation Bond On December 20, 2012, the City issued Taxable Pension Obligation Bonds in the amount of $2,925,000 to refund its obligation to make certain payments to PERS in respect of retired public safety and miscellaneous employees under the Side Fund program of PERS which amortizes such obligations over a fixed period of time. The current annual interest rate imputed by PERS to side funds is 7.5%. Debt service will be funded from the revenue of the general fund. Interest rates vary from 2% to 4%. The principal installments and interest are payable annually beginning on June 1, 2013 and the final payment will be made on June 1, 2021. The bond was issued at a premium of $117,206 with underwriter discount of $43,875 which will be amortized over the life of the bonds. Business-type Activities 2012 Refunding Water Installment Sale On October 1, 2001, the Sonoma Public Financing Authority issued the 2001 Revenue Bonds, Series A in the amount of $1,605,000 to finance improvements to the Water System. On October 1, 2012, the City entered into an agreement with Public Property Financing Corporation of California (“Corporation”) whereby Corporation purchases and resale the improvements to the Water System from and to the City for $1,605,000. The proceeds from the 2012 Refunding Water Installment Sale was used to repay the 2001 Revenue Bonds, Series A. The Corporation assigned and transferred certain of its rights, including the right to receive the installment payment to City National Bank. The principal amount is payable annually beginning from October 1, 2013 until October 1, 2031. Interests are payable semi-annually on April 1 and October 1. The outstanding balance of the loan at June 30, 2015, was $1,485,000.

City of Sonoma, California Notes to the Basic Financial Statements, Continued For the year ended June 30, 2015
68
6. LONG-TERM LIABILITIES, Continued Compensated Absences The City records employee absences, such as vacation, illness, and holidays, for which it is expected that employees will be paid as compensated absences. Compensated absences had a balance of $238,442 at June 30, 2015; of that amount $114,727 is expected to be paid within a year. Future debt service for Governmental Activities at June 30, 2015, is as follows for all debt except compensated absences and claims liabilities:
Year Ending June 30, Principal Interest Principal Interest
2016 41,749$ -$ 330,000$ 69,688$ 2017 41,749 - 340,000 63,369 2018 41,749 - 350,000 55,019 2019 41,749 - 365,000 44,383 2020 41,749 - 380,000 29,733
2021-2024 166,996 - 395,000 14,483 Total 375,741$ -$ 2,160,000$ 276,675$
Due within one year 41,749$ -$ 330,000$ 69,688$ Due after one year 333,992 - 1,830,000 206,987
Total 375,741$ -$ 2,160,000$ 276,675$
Year Ending June 30, Principal Interest
2016 371,749$ 69,688$ 2017 381,749 63,369 2018 391,749 55,019 2019 406,749 44,383 2020 421,749 29,733
2021-2024 561,996 14,483 Total 2,535,741$ 276,675$
Due within one year 371,749$ 69,688$ Due after one year 2,163,992 206,987
Total 2,535,741$ 276,675$
Pension Obligation BondGovernmental Activities
Capital lease
Total
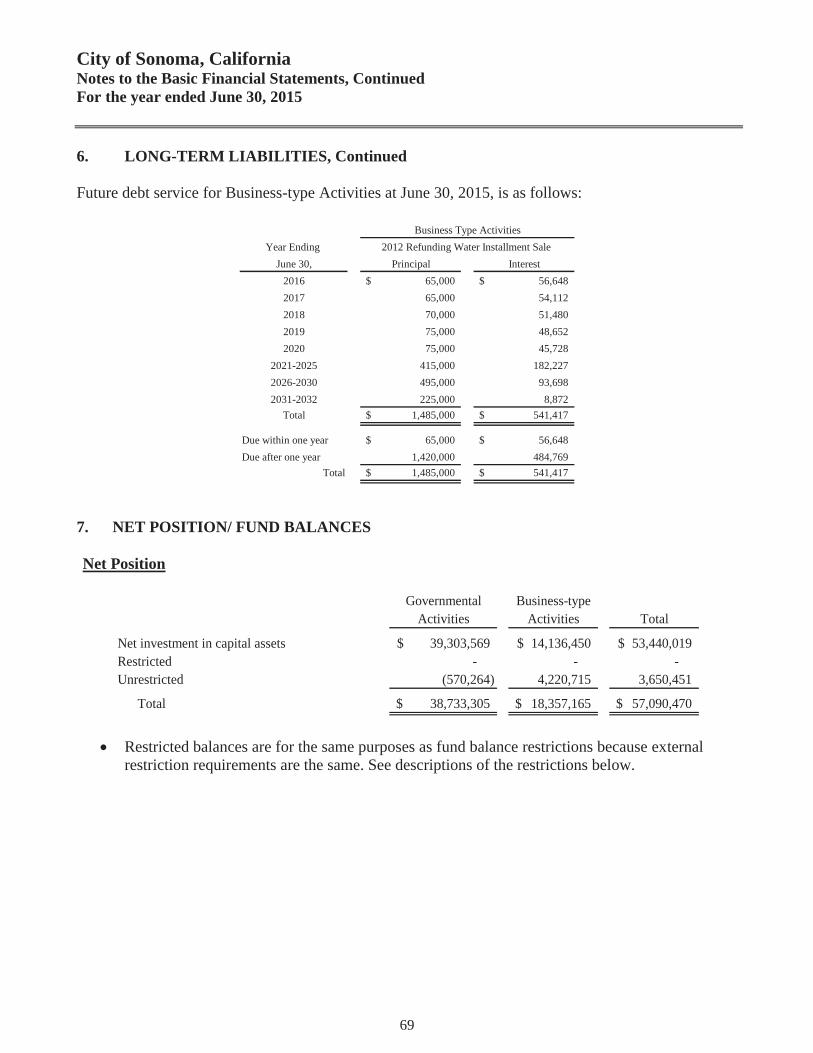
City of Sonoma, California Notes to the Basic Financial Statements, Continued For the year ended June 30, 2015
69
6. LONG-TERM LIABILITIES, Continued Future debt service for Business-type Activities at June 30, 2015, is as follows:
Year Ending June 30, Principal Interest
2016 65,000$ 56,648$ 2017 65,000 54,112 2018 70,000 51,480 2019 75,000 48,652 2020 75,000 45,728
2021-2025 415,000 182,227 2026-2030 495,000 93,698 2031-2032 225,000 8,872
Total 1,485,000$ 541,417$
Due within one year 65,000$ 56,648$ Due after one year 1,420,000 484,769
Total 1,485,000$ 541,417$
Business Type Activities2012 Refunding Water Installment Sale
7. NET POSITION/ FUND BALANCES Net Position
Governmental Business-type
Activities Activities Total
Net investment in capital assets 39,303,569$ 14,136,450$ 53,440,019$ Restricted - - - Unrestricted (570,264) 4,220,715 3,650,451
Total 38,733,305$ 18,357,165$ 57,090,470$
Restricted balances are for the same purposes as fund balance restrictions because external
restriction requirements are the same. See descriptions of the restrictions below.

City of Sonoma, California Notes to the Basic Financial Statements, Continued For the year ended June 30, 2015
70
7. NET POSITION/ FUND BALANCES, Continued Fund Balance Nonspendable and Restricted fund balance consisted of the following at June 30, 2015:
Nonspendable:Prepaid items 36,806$
Total Nonspendable 36,806$
The following describe the purpose of each nonspendable, restricted, and committed category used by the City: Nonspendable
Prepaid items – represents amounts classified as prepaid items as they do not represent current, spendable financial resources.
Fund Balance Deficits Deficit fund balances consisted of the following:
June 30, 2015Nonmajor Special Revenue Funds:
Strong Motion 626$ Bond Property Maintenance 19,143 Total Nonmajor Special Revenue 19,769
Fiduciary Funds:Successor Agency Private Purpose Trust 30,165,523
The above deficit fund balances have occurred due to the spending of funds prior to the receipt of revenues (cost reimbursements). The Fund balances will be restored in the near future as revenues are received.
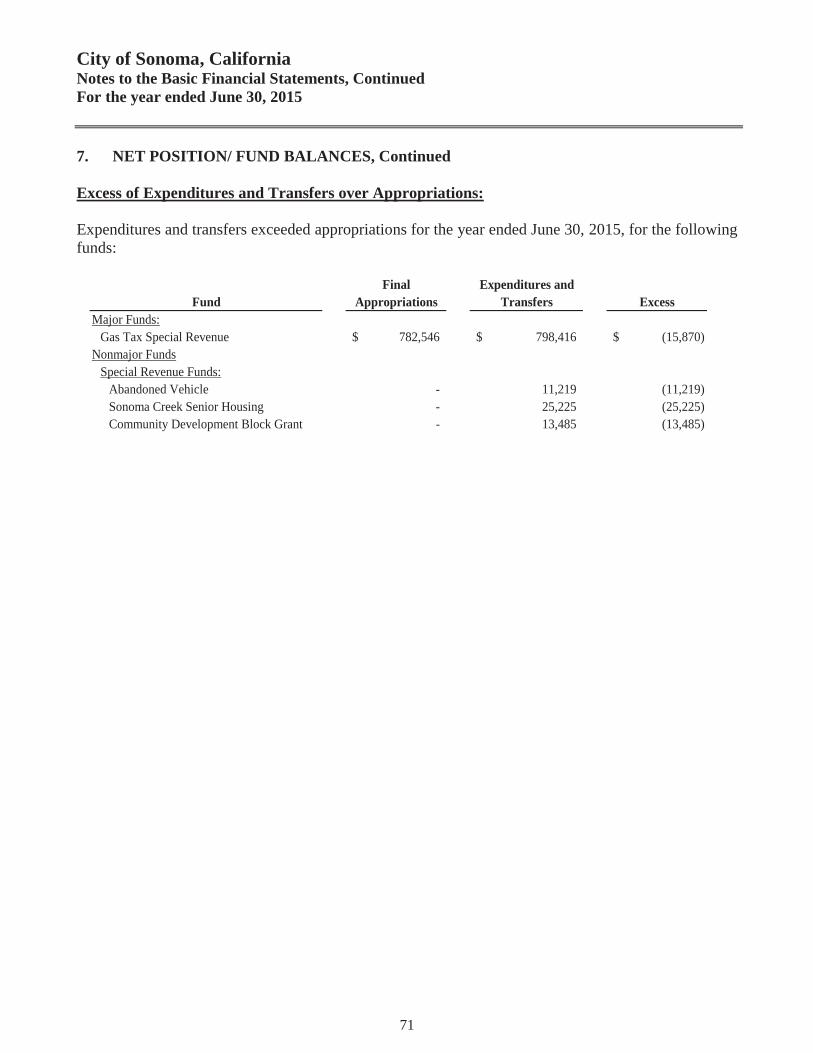
City of Sonoma, California Notes to the Basic Financial Statements, Continued For the year ended June 30, 2015
71
7. NET POSITION/ FUND BALANCES, Continued Excess of Expenditures and Transfers over Appropriations: Expenditures and transfers exceeded appropriations for the year ended June 30, 2015, for the following funds:
Final Expenditures andFund Appropriations Transfers Excess
Major Funds:Gas Tax Special Revenue 782,546$ 798,416$ (15,870)$
Nonmajor FundsSpecial Revenue Funds:
Abandoned Vehicle - 11,219 (11,219) Sonoma Creek Senior Housing - 25,225 (25,225) Community Development Block Grant - 13,485 (13,485)

City of Sonoma, California Notes to the Basic Financial Statements, Continued For the year ended June 30, 2015
72
8. INTERFUND TRANSACTIONS Due to and from balances result from the time lag between the dates that (1) interfund goods and services are provided or reimbursable expenditures occur, (2) transactions are recorded in the accounting system, and (3) payments between funds are made. Due to and due from other funds consisted of the following as of June 30, 2015:
Due from Due to Other Funds Other Funds
Governmental Funds
Major Funds:General Fund 654,718$ -$
Total Major Funds 654,718 -
Nonmajor Funds:Strong Motion Special Revenue - 624 Bond Property Maintenance Special Revenue - 19,143
Total Nonmajor Funds - 19,767 Total Governmental Funds 654,718 19,767
Proprietary Funds
Major Enterprise Funds:Cemetery - 521,319
Major Enterprise Funds - 521,319 Internal Service Funds:
Employee Benefits Fund - 113,632 Total Proprietary Funds - 634,951
Total 654,718$ 654,718$
Transfers are used to (1) move revenues from the fund that statute or budget requires to collect them to the fund that statute or budget requires to expend them, and (2) use unrestricted revenues collected in the general fund to finance various programs accounted for in other funds in accordance with budgetary authorizations.
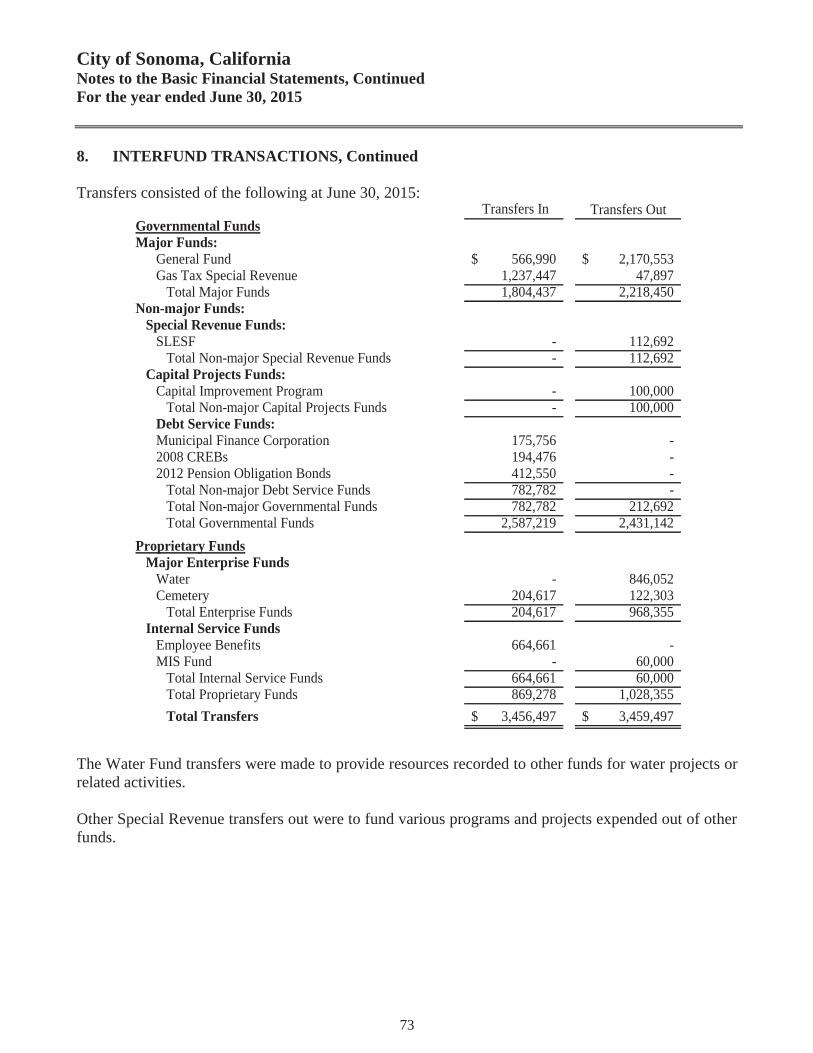
City of Sonoma, California Notes to the Basic Financial Statements, Continued For the year ended June 30, 2015
73
8. INTERFUND TRANSACTIONS, Continued Transfers consisted of the following at June 30, 2015:
Transfers In Transfers OutGovernmental FundsMajor Funds:
General Fund 566,990$ 2,170,553$ Gas Tax Special Revenue 1,237,447 47,897
Total Major Funds 1,804,437 2,218,450 Non-major Funds:
Special Revenue Funds:SLESF - 112,692
Total Non-major Special Revenue Funds - 112,692 Capital Projects Funds:
Capital Improvement Program - 100,000 Total Non-major Capital Projects Funds - 100,000
Debt Service Funds:Municipal Finance Corporation 175,756 - 2008 CREBs 194,476 - 2012 Pension Obligation Bonds 412,550 -
Total Non-major Debt Service Funds 782,782 - Total Non-major Governmental Funds 782,782 212,692 Total Governmental Funds 2,587,219 2,431,142
Proprietary FundsMajor Enterprise Funds
Water - 846,052 Cemetery 204,617 122,303
Total Enterprise Funds 204,617 968,355 Internal Service Funds
Employee Benefits 664,661 - MIS Fund - 60,000
Total Internal Service Funds 664,661 60,000 Total Proprietary Funds 869,278 1,028,355 Total Transfers 3,456,497$ 3,459,497$
The Water Fund transfers were made to provide resources recorded to other funds for water projects or related activities. Other Special Revenue transfers out were to fund various programs and projects expended out of other funds.
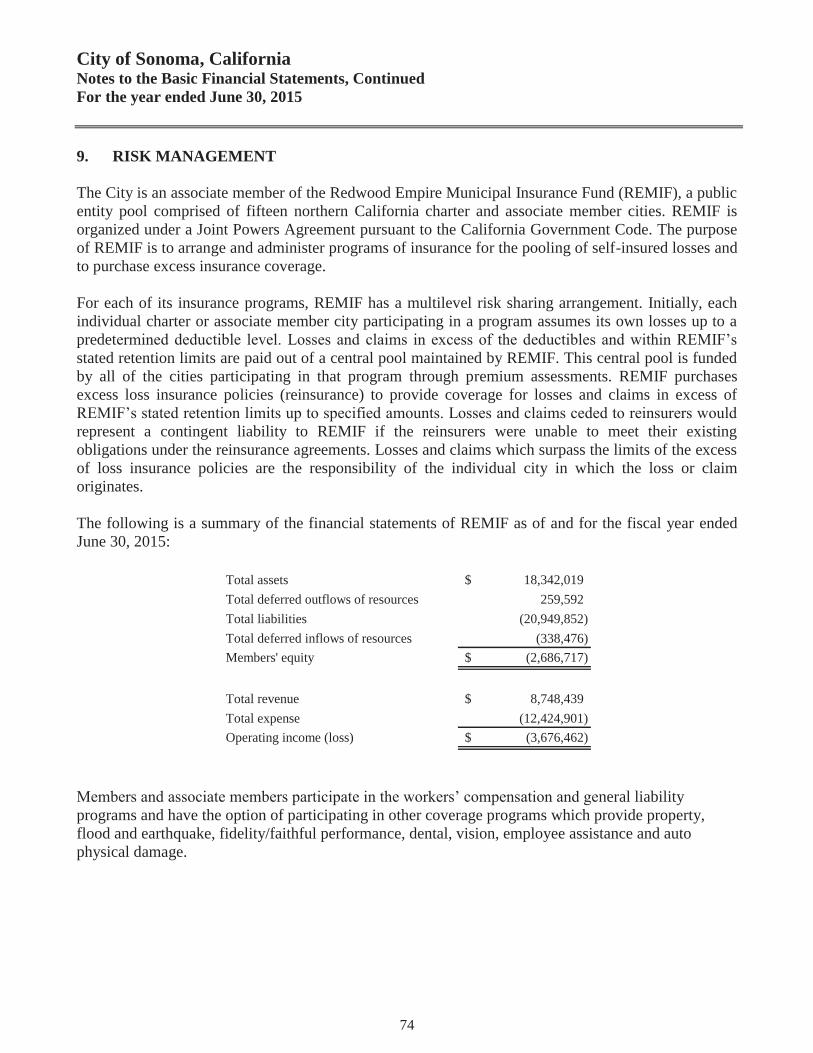
City of Sonoma, California Notes to the Basic Financial Statements, Continued For the year ended June 30, 2015
74
9. RISK MANAGEMENT The City is an associate member of the Redwood Empire Municipal Insurance Fund (REMIF), a public entity pool comprised of fifteen northern California charter and associate member cities. REMIF is organized under a Joint Powers Agreement pursuant to the California Government Code. The purpose of REMIF is to arrange and administer programs of insurance for the pooling of self-insured losses and to purchase excess insurance coverage. For each of its insurance programs, REMIF has a multilevel risk sharing arrangement. Initially, each individual charter or associate member city participating in a program assumes its own losses up to a predetermined deductible level. Losses and claims in excess of the deductibles and within REMIF’s stated retention limits are paid out of a central pool maintained by REMIF. This central pool is funded by all of the cities participating in that program through premium assessments. REMIF purchases excess loss insurance policies (reinsurance) to provide coverage for losses and claims in excess of REMIF’s stated retention limits up to specified amounts. Losses and claims ceded to reinsurers would represent a contingent liability to REMIF if the reinsurers were unable to meet their existing obligations under the reinsurance agreements. Losses and claims which surpass the limits of the excess of loss insurance policies are the responsibility of the individual city in which the loss or claim originates. The following is a summary of the financial statements of REMIF as of and for the fiscal year ended June 30, 2015:
Total assets 18,342,019$ Total deferred outflows of resources 259,592 Total liabilities (20,949,852) Total deferred inflows of resources (338,476) Members' equity (2,686,717)$
Total revenue 8,748,439$ Total expense (12,424,901) Operating income (loss) (3,676,462)$
Members and associate members participate in the workers’ compensation and general liability programs and have the option of participating in other coverage programs which provide property, flood and earthquake, fidelity/faithful performance, dental, vision, employee assistance and auto physical damage.

City of Sonoma, California Notes to the Basic Financial Statements, Continued For the year ended June 30, 2015
75
9. RISK MANAGEMENT, Continued The City of Sonoma participates in the following REMIF programs: General Liability Insurance Annual premiums are paid by the member cities and are adjusted retrospectively to cover costs. The City of Sonoma self-insures for the first $5,000 of each loss and pays 100% of all losses incurred under $5,000. The City does not share or pay for losses of other cities under $5,000, depending on the entity’s deductible amount. Participating cities then share in the next $5,000 to $500,000 per loss occurrence. Excess of $500,000 to a total of $25,000,000 coverage per occurrence is covered by Munich Reinsurance America and SCOR Reinsurance Co. Included in the general liability insurance premium is bonds coverage of up to $10,000 per occurrence against loss of money, securities and other property through employee’s dishonesty, forgery or alteration loss, computer fraud involving money, securities and other property, loss related to the fraudulent transfer of funds and public official faithful performance. The City of Sonoma has a $5,000 deductible for this coverage. Workers’ Compensation Periodic deposits are paid by member cities and are adjusted retrospectively to cover costs. The City of Sonoma is self-insured for the first $5,000 of each loss and pays 100% of all losses incurred under $5,000. The City does not share or pay for losses of other cities under $5,000. Losses in excess of $5,000 up to $2,000,000 are covered by Safety National Casualty. Property Insurance The City participates in REMIF’s property insurance program. The annual deposits paid by participating member cities are based upon deductibility levels and are not subject to retroactive adjustments. The City of Sonoma has a deductible level of $10,000 and a coverage limit of $290,000,000. The property insurance program includes boiler and machinery coverage which provides up to $21,245,000 coverage per occurrence. The City of Sonoma has a deductible of $5,000. Auto Physical Damage Insurance The City of Sonoma has a deductible of $10,000 per vehicle. Damages in excess of $10,000 up to $9,990,000 per occurrence is covered by Hanover Insurance Company

City of Sonoma, California Notes to the Basic Financial Statements, Continued For the year ended June 30, 2015
76
10. PUBLIC EMPLOYEES’ RETIREMENT SYSTEM General Information about the Pension Plans
Plan Descriptions - All qualified permanent and probationary employees are eligible to participate in the City's separate Safety (police and fire) and Miscellaneous (all other) Employee Pension Plans, cost-sharing multiple employer defined benefit pension plans administered by the California Public Employees' Retirement System (CaIPERS). Benefit provisions under the Plans are established by State statute and City resolution. CalPERS issues publicly available reports that include a full description of the pension plans regarding benefit provisions, assumptions and membership information that can be found on the CalPERS website. Benefits Provided - CalPERS provides service retirement and disability benefits, annual cost of living adjustments and death benefits to plan members, who must be public employees and beneficiaries. Benefits are based on years of credited service, equal to one year of full time employment. Members with five years of total service are eligible to retire at age 50 with statutorily reduced benefits. All members are eligible for non-duty disability benefits after 10 years of service. The death benefit is one of the following: the Basic Death Benefit, the 1957 Survivor Benefit, or the Optional Settlement 2W Death Benefit. The cost of living adjustments for each plan are applied as specified by the Public Employees' Retirement Law. The Plans' provisions and benefits in effect at June 30, 2015, are summarized as follows:
Miscellaneous
Hire datePrior to
January 1, 2013Benefit formula 2.0% @ 55Benefit vesting schedule 5 years service Benefit payments monthly for lifeRetirement age 50 - 63Monthly benefits, as a % of elgigible compensation 1.4% to 2.4%Required employee contribution rates 7%Required employer contribution rates 12.50%
PEPRA Midcellaneous
Hire dateOn or after
January 1, 2013Benefit formula 2.0% @ 62Benefit vesting schedule 5 years serviceBenefit payments monthly for lifeRetirement age 52 - 67Monthly benefits, as a % of elgigible compensation 1.0% to 2.5%Required employee contribution rates 6.5%Required employer contribution rates 6.70%
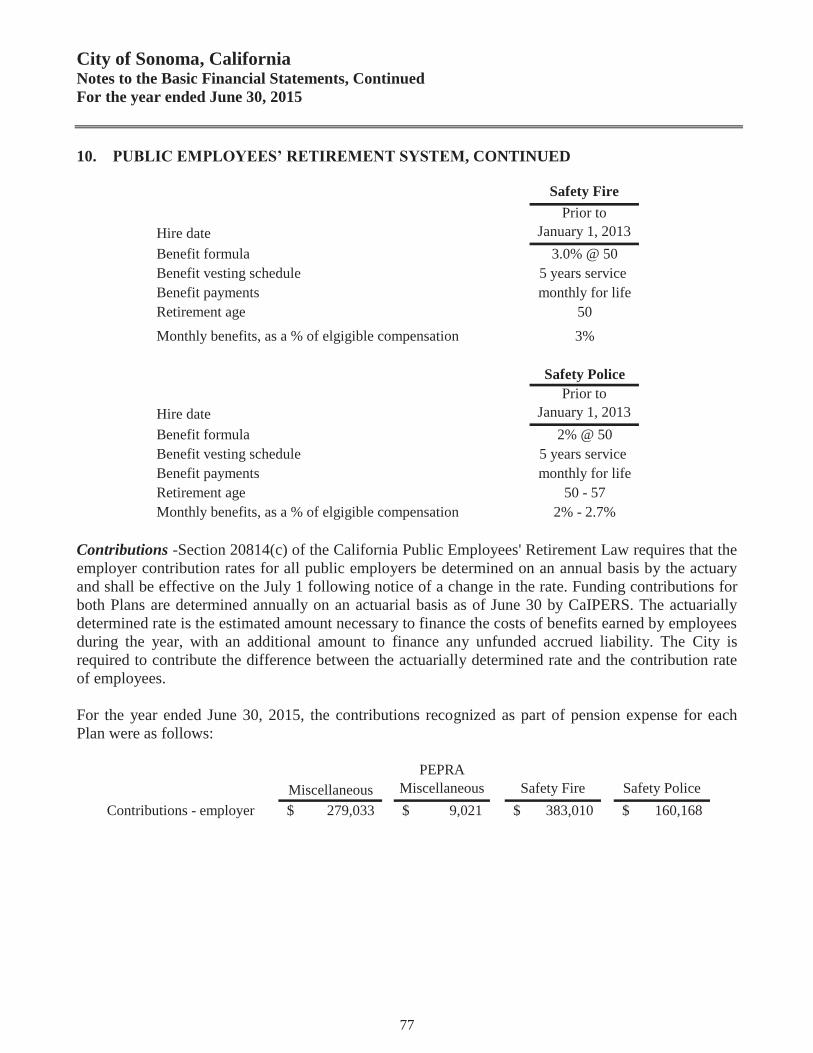
City of Sonoma, California Notes to the Basic Financial Statements, Continued For the year ended June 30, 2015
77
10. PUBLIC EMPLOYEES’ RETIREMENT SYSTEM, CONTINUED
Safety Fire
Hire datePrior to
January 1, 2013Benefit formula 3.0% @ 50Benefit vesting schedule 5 years service Benefit payments monthly for lifeRetirement age 50Monthly benefits, as a % of elgigible compensation 3%
Safety Police
Hire datePrior to
January 1, 2013Benefit formula 2% @ 50Benefit vesting schedule 5 years service Benefit payments monthly for lifeRetirement age 50 - 57Monthly benefits, as a % of elgigible compensation 2% - 2.7%
Contributions -Section 20814(c) of the California Public Employees' Retirement Law requires that the employer contribution rates for all public employers be determined on an annual basis by the actuary and shall be effective on the July 1 following notice of a change in the rate. Funding contributions for both Plans are determined annually on an actuarial basis as of June 30 by CaIPERS. The actuarially determined rate is the estimated amount necessary to finance the costs of benefits earned by employees during the year, with an additional amount to finance any unfunded accrued liability. The City is required to contribute the difference between the actuarially determined rate and the contribution rate of employees. For the year ended June 30, 2015, the contributions recognized as part of pension expense for each Plan were as follows:
MiscellaneousPEPRA
Miscellaneous Safety Fire Safety PoliceContributions - employer 279,033$ 9,021$ 383,010$ 160,168$

City of Sonoma, California Notes to the Basic Financial Statements, Continued For the year ended June 30, 2015
78
10. PUBLIC EMPLOYEES’ RETIREMENT SYSTEM, CONTINUED Pension Liabilities, Pension Expenses and Deferred Outflows/Inflows of Resources Related to Pensions As of June 30, 2015, the City reported net pension liabilities for its proportionate shares of the net pension liability of each Plan as follows:
Proportionate Shareof Net Pension Liability
Miscellaneous 3,750,127$ PEPRA Miscellaneous 374 Safety Fire 2,775,168 Safety Police 1,649,976 Total Net Pension Liability 8,175,645.00$
The City's net pension liability for each Plan is measured as the proportionate share of the net pension liability. The net pension liability of each of the Plans is measured as of June 30, 2014, and the total pension liability for each Plan used to calculate the net pension liability was determined by an actuarial valuation as of June 30, 2013 rolled forward to June 30, 2014 using standard update procedures. The City's proportion of the net pension liability was based on a projection of the City's long-term share of contributions to the pension plans relative to the projected contributions of all participating employers, actuarially determined. The City’s proportionate share of the net pension liability for each Plan as of June 30, 2013 and 2014 was as follows:
MiscellaneousPEPRA
Miscellaneous Safety Fire Safety Police
Proportion - June 30, 2013 N/A N/A N/A N/AProportion - June 30, 2014 0.06027% 0.00001% 0.04460% 0.02652%Change - Increase (Decrease) N/A N/A N/A N/A
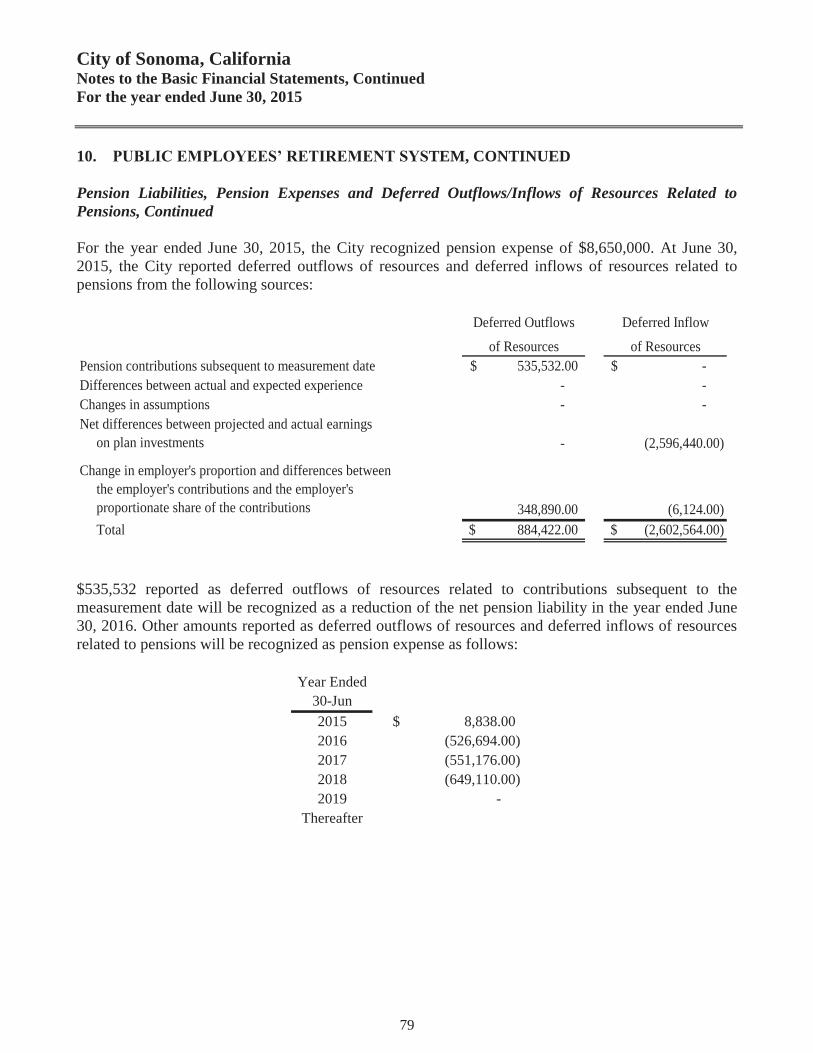
City of Sonoma, California Notes to the Basic Financial Statements, Continued For the year ended June 30, 2015
79
10. PUBLIC EMPLOYEES’ RETIREMENT SYSTEM, CONTINUED Pension Liabilities, Pension Expenses and Deferred Outflows/Inflows of Resources Related to Pensions, Continued For the year ended June 30, 2015, the City recognized pension expense of $8,650,000. At June 30, 2015, the City reported deferred outflows of resources and deferred inflows of resources related to pensions from the following sources:
Deferred Outflows Deferred Inflow
of Resources of ResourcesPension contributions subsequent to measurement date 535,532.00$ -$ Differences between actual and expected experience - - Changes in assumptions - - Net differences between projected and actual earnings on plan investments - (2,596,440.00)
Change in employer's proportion and differences between the employer's contributions and the employer's proportionate share of the contributions 348,890.00 (6,124.00) Total 884,422.00$ (2,602,564.00)$
$535,532 reported as deferred outflows of resources related to contributions subsequent to the measurement date will be recognized as a reduction of the net pension liability in the year ended June 30, 2016. Other amounts reported as deferred outflows of resources and deferred inflows of resources related to pensions will be recognized as pension expense as follows:
Year Ended30-Jun2015 8,838.00$ 2016 (526,694.00) 2017 (551,176.00) 2018 (649,110.00) 2019 -
Thereafter
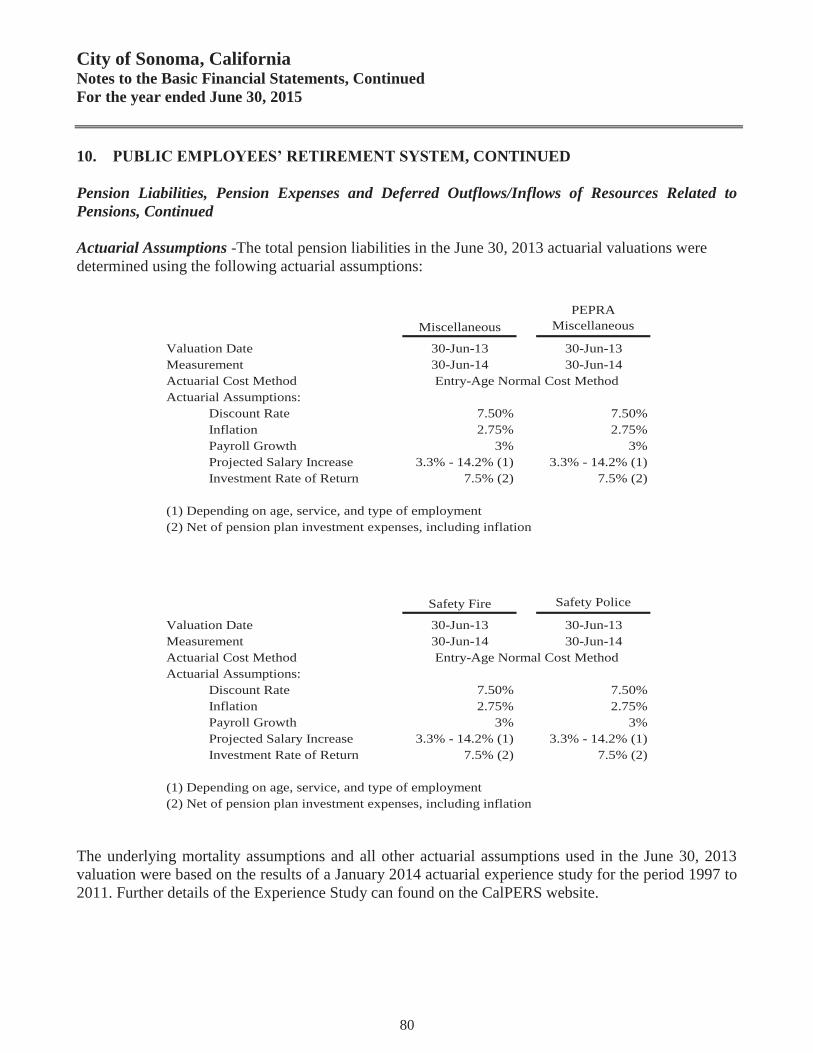
City of Sonoma, California Notes to the Basic Financial Statements, Continued For the year ended June 30, 2015
80
10. PUBLIC EMPLOYEES’ RETIREMENT SYSTEM, CONTINUED Pension Liabilities, Pension Expenses and Deferred Outflows/Inflows of Resources Related to Pensions, Continued Actuarial Assumptions -The total pension liabilities in the June 30, 2013 actuarial valuations were determined using the following actuarial assumptions:
MiscellaneousPEPRA
Miscellaneous
Valuation Date 30-Jun-13 30-Jun-13Measurement 30-Jun-14 30-Jun-14Actuarial Cost MethodActuarial Assumptions: Discount Rate 7.50% 7.50% Inflation 2.75% 2.75% Payroll Growth 3% 3% Projected Salary Increase 3.3% - 14.2% (1) 3.3% - 14.2% (1) Investment Rate of Return 7.5% (2) 7.5% (2)
(1) Depending on age, service, and type of employment(2) Net of pension plan investment expenses, including inflation
Entry-Age Normal Cost Method
Safety Fire Safety Police
Valuation Date 30-Jun-13 30-Jun-13Measurement 30-Jun-14 30-Jun-14Actuarial Cost MethodActuarial Assumptions: Discount Rate 7.50% 7.50% Inflation 2.75% 2.75% Payroll Growth 3% 3% Projected Salary Increase 3.3% - 14.2% (1) 3.3% - 14.2% (1) Investment Rate of Return 7.5% (2) 7.5% (2)
(1) Depending on age, service, and type of employment(2) Net of pension plan investment expenses, including inflation
Entry-Age Normal Cost Method
The underlying mortality assumptions and all other actuarial assumptions used in the June 30, 2013 valuation were based on the results of a January 2014 actuarial experience study for the period 1997 to 2011. Further details of the Experience Study can found on the CalPERS website.
City of Sonoma, California Notes to the Basic Financial Statements, Continued For the year ended June 30, 2015
81
10. PUBLIC EMPLOYEES’ RETIREMENT SYSTEM, CONTINUED Pension Liabilities, Pension Expenses and Deferred Outflows/Inflows of Resources Related to Pensions, Continued Discount Rate -The discount rate used to measure the total pension liability was 7.50% for each Plan. To determine whether the municipal bond rate should be used in the calculation of a discount rate for each plan, CalPERS stress tested plans that would most likely result in a discount rate that would be different from the actuarially assumed discount rate. Based on the testing, none of the tested plans run out of assets. Therefore, the current 7.50 percent discount rate is adequate and the use of the municipal bond rate calculation is not necessary. The long term expected discount rate of 7.50 percent will be applied to all plans in the Public Employees Retirement Fund (PERF). The stress test results are presented in a detailed report that can be obtained from the CalPERS website. According to Paragraph 30 of Statement 68, the long-term discount rate should be determined without reduction for pension plan administrative expense. The 7.50 percent investment return assumption used in this accounting valuation is net of administrative expenses. Administrative expenses are assumed to be 15 basis points. An investment return excluding administrative expenses would have been 7.65 percent. Using this lower discount rate has resulted in a slightly higher Total Pension Liability and Net Pension Liability. CalPERS checked the materiality threshold for the difference in calculation and did not find it to be a material difference. CalPERS is scheduled to review all actuarial assumptions as part of its regular Asset Liability Management (ALM) review cycle that is scheduled to be completed in February 2018. Any changes to the discount rate will require Board action and proper stakeholder outreach. For these reasons, CalPERS expects to continue using a discount rate net of administrative expenses for GASB 67 and 68 calculations through at least the 2017-18 fiscal year. CalPERS will continue to check the materiality of the difference in calculation until a change in methodology. The long -term expected rate of return on pension plan investments was determined using a building-block method in which best-estimate ranges of expected future real rates of return (expected returns, net of pension plan investment expense and inflation) are developed for each major asset class. In determining the long-term expected rate of return, CalPERS took into account both short-term and long-term market return expectations as well as the expected pension fund cash flows. Using historical returns of all the funds' asset classes, expected compound returns were calculated over the short-term (first 10 years) and the long-term (11-60 years) using a building-block approach. Using the expected nominal returns for both short-term and long-term, the present value of benefits was calculated for each fund. The expected rate of return was set by calculating the single equivalent expected return that arrived at the same present value of benefits for cash flows as the one calculated using both short-term and long-term returns. The expected rate of return was then set equivalent to the single equivalent rate calculated above and rounded down to the nearest one quarter of one percent.
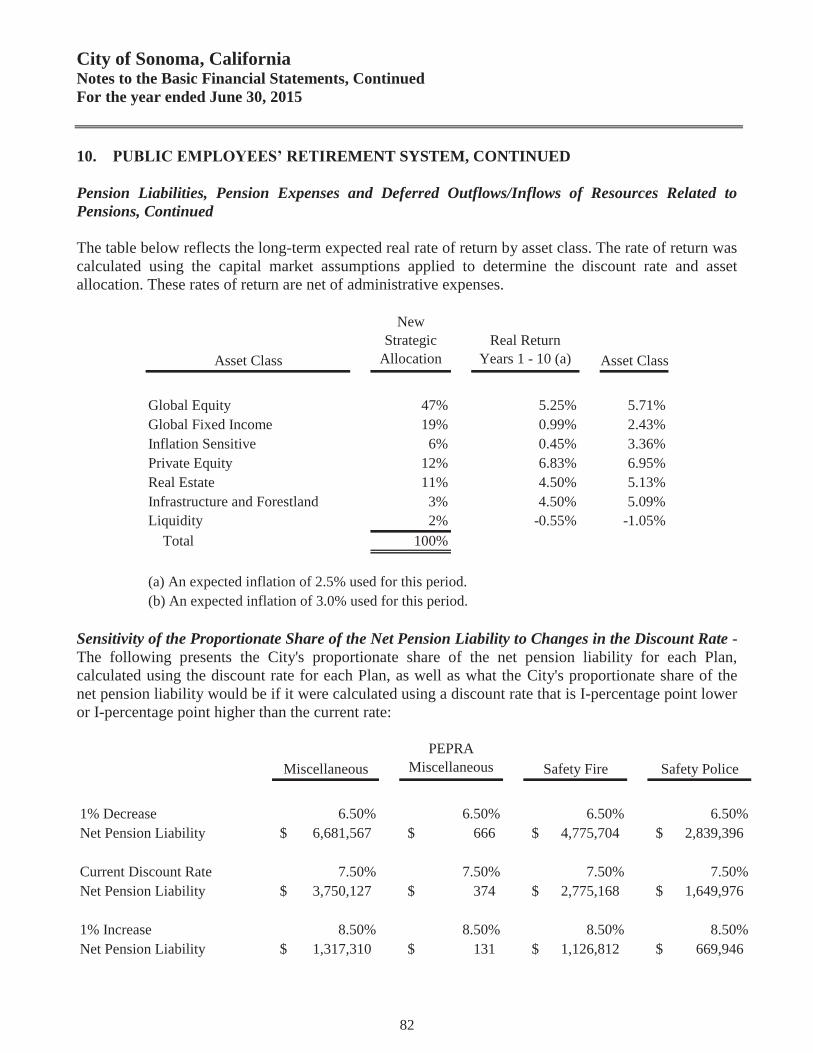
City of Sonoma, California Notes to the Basic Financial Statements, Continued For the year ended June 30, 2015
82
10. PUBLIC EMPLOYEES’ RETIREMENT SYSTEM, CONTINUED Pension Liabilities, Pension Expenses and Deferred Outflows/Inflows of Resources Related to Pensions, Continued The table below reflects the long-term expected real rate of return by asset class. The rate of return was calculated using the capital market assumptions applied to determine the discount rate and asset allocation. These rates of return are net of administrative expenses.
Asset Class
NewStrategic
AllocationReal Return
Years 1 - 10 (a) Asset Class
Global Equity 47% 5.25% 5.71%Global Fixed Income 19% 0.99% 2.43%Inflation Sensitive 6% 0.45% 3.36%Private Equity 12% 6.83% 6.95%Real Estate 11% 4.50% 5.13%Infrastructure and Forestland 3% 4.50% 5.09%Liquidity 2% -0.55% -1.05% Total 100%
(a) An expected inflation of 2.5% used for this period.(b) An expected inflation of 3.0% used for this period.
Sensitivity of the Proportionate Share of the Net Pension Liability to Changes in the Discount Rate -The following presents the City's proportionate share of the net pension liability for each Plan, calculated using the discount rate for each Plan, as well as what the City's proportionate share of the net pension liability would be if it were calculated using a discount rate that is I-percentage point lower or I-percentage point higher than the current rate:
MiscellaneousPEPRA
Miscellaneous Safety Fire Safety Police
1% Decrease 6.50% 6.50% 6.50% 6.50%Net Pension Liability 6,681,567$ 666$ 4,775,704$ 2,839,396$
Current Discount Rate 7.50% 7.50% 7.50% 7.50%Net Pension Liability 3,750,127$ 374$ 2,775,168$ 1,649,976$
1% Increase 8.50% 8.50% 8.50% 8.50%Net Pension Liability 1,317,310$ 131$ 1,126,812$ 669,946$
City of Sonoma, California Notes to the Basic Financial Statements, Continued For the year ended June 30, 2015
83
10. PUBLIC EMPLOYEES’ RETIREMENT SYSTEM, CONTINUED Pension Plan Fiduciary Net Position -Detailed information about each pension plan's fiduciary net position is available in the separately issued CalPERS financial reports. Payable to the Pension Plan At June 30, 2015, the City reported a payable of $2,811 for the outstanding amount of contributions to the pension plan required for the year ended June 30, 2015. 11. SUCCESSOR AGENCY TRUST FOR FORMER SONOMA COMMUNITY DEVELOPMENT AGENCY On December 29, 2011, the California Supreme Court upheld Assembly Bill 1X 26 (“the Bill”) that provides for the dissolution of all redevelopment agencies in the State of California. This action impacted the reporting entity of the City of Sonoma that previously had reported a redevelopment agency within the reporting entity of the City as a blended component unit. The Bill provides that upon dissolution of a redevelopment agency, either the city or another unit of local government will agree to serve as the “successor agency” to hold the assets until they are distributed to other units of state and local government. On January 12, 2012, the City Council elected to become the Successor Agency for the Former Sonoma Community Development Agency in accordance with the Bill. After enactment of the law, which occurred on June 28, 2011, redevelopment agencies in the State of California cannot enter into new projects, obligations or commitments. Subject to the control of a newly established oversight board, remaining assets can only be used to pay enforceable obligations in existence at the date of dissolution (including the completion of any unfinished projects that were subject to legally enforceable contractual commitments). In future fiscal years, successor agencies will only be allocated revenue in the amount that is necessary to pay the estimated annual installment payments on enforceable obligations of the Former Sonoma Community Development Agency until all enforceable obligations of the prior community development agency have been paid in full and all assets have been liquidated. In accordance with the timeline set forth in the Bill (as modified by the California Supreme Court on December 29, 2011) all redevelopment agencies in the State of California were dissolved and ceased to operate as a legal entity as of February 1, 2012. After the date of dissolution, the assets and activities of the dissolved redevelopment agency are reported in a fiduciary fund (private-purpose trust fund) in the financial statements of the City. Investment in Land Held for Resale or Transfer The amounts shown below as investment in land held for resale or transfer consist of two parcels of land there were sold during Fiscal Year 2014 – 2015. 32 Patten Street was sold in December 2014 with proceeds distributed to taxing entities via the RPTTF.

City of Sonoma, California Notes to the Basic Financial Statements, Continued For the year ended June 30, 2015
84
11. SUCCESSOR AGENCY TRUST FOR FORMER SONOMA COMMUNITY DEVELOPMENT AGENCY, CONTINUED
Below is the change in this account for the fiscal year ended June 30, 2015:
Balance BalanceJuly 1, 2014 Additions Transferred June 30, 2015
Fiduciary Activities:Old Fire Station (32 Patten St.) 15,000$ -$ (15,000)$ -$ .42 Acres Fire/EMS 1,803,315 - (1,803,315) -
Total capital assets held 1,818,315 - (1,818,315) - Total assets held 1,818,315$ -$ (1,818,315)$ -$
Long-term Liabilities The following is a summary of changes in long-term liabilities for the year ended June 30, 2015:
Balance Balance Due WithinJuly 1, 2014 Additions Retirements June 30, 2015 One Year
Fiduciary Activities:2003 Tax Allocation Bonds 15,810,000$ -$ (520,000)$ 15,290,000$ 535,000$ 2010 Tax Allocation Bonds 8,830,000 - (395,000) 8,435,000 405,000 2011 Tax Allocation Bonds 15,370,000 - (135,000) 15,235,000 145,000 2005 Note Payable - USDA 781,526 - (5,075) 776,451 5,368 2005 Note Payable - Exchange Bank 1,866,953 - (1,866,953) - -
Total fiduciary debt 42,658,479$ -$ (2,922,028)$ 39,736,451$ 1,090,368$
2003 Tax Allocation Bonds In May 2003, the Agency issued tax allocation bonds in the amount of $20,635,000, with variable interest rates of 2.09% to 4.45% per annum, to provide funds for certain community development projects. The bond mature semi-annually in increasing amounts on each December 1, through 2033. 2010 Tax Allocation Refunding Bonds In September 2010, the Agency issued $10,120,000 of tax allocation bonds in order to refund the 1997 Tax Allocation Bonds and the 2000 Tax Allocation Refunding Bonds. Annual interest rates vary between 2% and 5% per annum. The Bonds mature semi-annually in increasing amounts on each December 1, through 2030. 2011 Tax Allocation Bonds In February 2011, the Agency issued tax allocation bonds in the amount of $15,750,000, with variable interest rates of 2.25% to 6.50% per annum, to provide funds for certain community development projects. The bond mature semi-annually in increasing amounts on each December 1, through 2036.

City of Sonoma, California Notes to the Basic Financial Statements, Continued For the year ended June 30, 2015
85
11. SUCCESSOR AGENCY TRUST FOR FORMER SONOMA COMMUNITY DEVELOPMENT AGENCY, CONTINUED
Long-term Liabilities, Continued 2005 Note Payable - USDA In April 2005, the Agency obtained an $816,635 loan from the U.S. Department of Agriculture to assist the Agency in purchasing and operating the Village Green Apartments II low/moderate income housing rental project. The loan is fully amortized over 30 years at an interest rate of 5.625%. The loan is secured by an interest in the property and rental income and is subordinated to an existing loan with Exchange Bank. Future debt service for Fiduciary Activities at June 30, 2015, is as follows
Year Ending June 30, Principal Interest Principal Interest Principal Interest
2016 535,000$ 661,134$ 405,000$ 334,873$ 145,000$ 1,061,319$ 2017 560,000 641,740 420,000 323,968 145,000 1,054,069 2018 580,000 619,340 430,000 313,655 155,000 1,046,819 2019 600,000 596,140 440,000 302,012 165,000 1,039,069 2020 630,000 572,140 450,000 289,102 170,000 1,030,489
2021 - 2025 3,575,000 2,440,580 2,495,000 1,194,947 995,000 4,990,445 2026 - 2030 4,455,000 1,581,085 3,085,000 578,125 1,360,000 4,607,145 2031 - 2035 4,355,000 494,840 710,000 17,750 6,415,000 3,726,325
2036 - - - - 5,685,000 614,531 Total 15,290,000$ 7,606,999$ 8,435,000$ 3,354,432$ 15,235,000$ 19,170,211$
Due within one year 535,000$ 661,134$ 405,000$ 334,873$ 145,000$ 1,061,319$ Due after one year 14,755,000 6,945,865 8,030,000 3,019,559 15,090,000 18,108,892
Total 15,290,000$ 7,606,999$ 8,435,000$ 3,354,432$ 15,235,000$ 19,170,211$
Year Ending June 30, Principal Interest Principal Interest Principal Interest
2016 5,368$ 43,538$ -$ -$ 1,090,368$ 2,100,864$ 2017 5,677 43,229 - - 1,130,677 2,063,006 2018 6,005 42,901 - - 1,171,005 2,022,715 2019 6,352 42,554 - - 1,211,352 1,979,775 2020 6,718 42,188 - - 1,256,718 1,933,919
2021 - 2025 39,877 204,653 - - 7,104,877 8,830,625 2026 - 2030 52,793 191,737 - - 8,952,793 6,958,092 2031 - 2035 68,561 171,894 - - 11,548,561 4,410,809
2036 585,100 - - - 6,270,100 614,531 Total 776,451$ 782,694$ -$ -$ 39,736,451$ 30,914,336$
Due within one year 5,368$ 43,538$ -$ -$ 1,090,368$ 2,100,864$ Due after one year 771,083 739,156 - - 38,646,083 28,813,472
Total 776,451$ 782,694$ -$ -$ 39,736,451$ 30,914,336$
Total2005 Note Payable - Exchange Bank2005 Note Payable - USDA
2010 Tax Allocation Refunding Bond
Fiduciary Activities
2003 Tax Allocation Bond 2011 Tax Allocation Bonds

City of Sonoma, California Notes to the Basic Financial Statements, Continued For the year ended June 30, 2015
86
12. COMMITMENTS AND CONTINGENCIES Litigation The City is involved in litigation incurred in the normal course of conducting City business. Although the outcome of these lawsuits is not presently determinable, in the opinion of the City’s counsel, the resolution of these matters will not have a material adverse effect on the financial condition of the City. Grants and Allocations Amounts received or receivable from grant agencies are subject to audit and adjustment by grantor agencies, principally the federal and state government. Any disallowed claims, including amounts already collected, may constitute a liability of the applicable funds. The amount, if any, of expenditures that may be disallowed by the grantor cannot be determined at this time, although the City expects such amounts, if any, to be immaterial. Commitments The City had no significant unexpended contractual commitments as of June 30, 2015. 13. NEW ACCOUNTING PRONOUNCEMENTS The GASB has issued Statement No. 72, “Fair Value Measurement and Application”. The objective of this Statement is to improve financial reporting by clarifying the definition of fair value for financial reporting purposes, establishing general principles for measuring fair value, providing additional fair value application guidance, and enhancing disclosures about fair value measurements. These improvements are based in part on the concepts and definitions established in Concepts Statement No. 6, Measurement of Elements of Financial Statements, and other relevant literature. The requirements of this Statement are effective for financial statements for reporting periods beginning after June 15, 2015. The City will implement this statement, as applicable, to its financial statements for the year ending June 30, 2016. The GASB has issued Statement No. 73, “Accounting and Financial Reporting for Pensions and Related Assets That Are Not within the Scope of GASB Statement 68, and Amendments to Certain Provisions of GASB Statements 67 and 68”. The objective of this Statement is to improve the usefulness of information about pensions included in the general purpose external financial reports of state and local governments for making decisions and assessing accountability. This Statement results from a comprehensive review of the effectiveness of existing standards of accounting and financial reporting for all postemployment benefits with regard to providing decision-useful information, supporting assessments of accountability and interperiod equity, and creating additional transparency. This Statement establishes requirements for defined benefit pensions that are not within the scope of Statement No. 68, “Accounting and Financial Reporting for Pensions”, as well as for the assets accumulated for purposes of providing those pensions. In addition, it establishes requirements for defined contribution pensions that are not within the scope of Statement 68. It also amends certain provisions of Statement No. 67, “Financial Reporting for Pension Plans”, and Statement 68 for pension plans and pensions that are within their respective scopes.

City of Sonoma, California Notes to the Basic Financial Statements, Continued For the year ended June 30, 2015
87
13. NEW ACCOUNTING PRONOUNCEMENTS, CONTINUED The requirements of this Statement that address accounting and financial reporting by employers and governmental nonemployer contributing entities for pensions that are not within the scope of Statement 68 are effective for financial statements for fiscal years beginning after June 15, 2016, and the requirements of this Statement that address financial reporting for assets accumulated for purposes of providing those pensions are effective for fiscal years beginning after June 15, 2015. The requirements of this Statement for pension plans that are within the scope of Statement 67 or for pensions that are within the scope of Statement 68 are effective for fiscal years beginning after June 15, 2015. The City will evaluate the applicability of the provisions of this Statement and implement it in the applicable year, accordingly. The GASB has issued Statement No. 74, “Financial Reporting for Postemployment Benefit Plans Other Than Pension Plans”. The objective of this Statement is to improve the usefulness of information about postemployment benefits other than pensions (other postemployment benefits or OPEB) included in the general purpose external financial reports of state and local governmental OPEB plans for making decisions and assessing accountability. This Statement results from a comprehensive review of the effectiveness of existing standards of accounting and financial reporting for all postemployment benefits (pensions and OPEB) with regard to providing decision-useful information, supporting assessments of accountability and interperiod equity, and creating additional transparency. This Statement replaces Statements No. 43,“Financial Reporting for Postemployment Benefit Plans Other Than Pension Plans”, as amended, and No. 57, OPEB Measurements by Agent Employers and Agent Multiple-Employer Plans. It also includes requirements for defined contribution OPEB plans that replace the requirements for those OPEB plans in Statement No. 25, Financial Reporting for Defined Benefit Pension Plans and Note Disclosures for Defined Contribution Plans, as amended, Statement 43, and Statement No. 50, Pension Disclosures. The provisions in Statement 74 are effective for fiscal years beginning after June 15, 2016. The City will implement this Statement in fiscal year ending June 30, 2017. The GASB has issued Statement No. 75, “Accounting and Financial Reporting for Postemployment Benefits Other Than Pensions”. The primary objective of this Statement is to improve accounting and financial reporting by state and local governments for postemployment benefits other than pensions (other postemployment benefits or OPEB). It also improves information provided by state and local governmental employers about financial support for OPEB that is provided by other entities. This Statement results from a comprehensive review of the effectiveness of existing standards of accounting and financial reporting for all postemployment benefits (pensions and OPEB) with regard to providing decision-useful information, supporting assessments of accountability and interperiod equity, and creating additional transparency. This Statement replaces the requirements of Statements No. 45, “Accounting and Financial Reporting by Employers for Postemployment Benefits Other Than Pensions”, as amended, and No. 57, “OPEB Measurements by Agent Employers and Agent Multiple-Employer Plans”, for OPEB. Statement No. 74, “Financial Reporting for Postemployment Benefit Plans Other Than Pension Plans”, establishes new accounting and financial reporting requirements for OPEB plans. The provisions in Statement 75 are effective for fiscal years beginning after June 15, 2017. The City will implement this statement, as applicable, to its financial statements for the year ending June 30, 2018.

City of Sonoma, California Notes to the Basic Financial Statements, Continued For the year ended June 30, 2015
88
13. NEW ACCOUNTING PRONOUNCEMENTS, CONTINUED The GASB has issued Statement No. 76, “The Hierarchy of Generally Accepted Accounting Principles for State and Local Governments”. The objective of this Statement is to identify—in the context of the current governmental financial reporting environment—the hierarchy of generally accepted accounting principles (GAAP). The “GAAP hierarchy” consists of the sources of accounting principles used to prepare financial statements of state and local governmental entities in conformity with GAAP and the framework for selecting those principles. This Statement reduces the GAAP hierarchy to two categories of authoritative GAAP and addresses the use of authoritative and nonauthoritative literature in the event that the accounting treatment for a transaction or other event is not specified within a source of authoritative GAAP. This Statement supersedes Statement No. 55, “The Hierarchy of Generally Accepted Accounting Principles for State and Local Governments”. The requirements of this Statement are effective for financial statements for periods beginning after June 15, 2015, and should be applied retroactively. The City will implement this statement, as applicable, to its financial statements for the year ending June 30, 2016. The GASB has issued Statement No. 77, “Tax Abatement Disclosures”. This information is intended, among other things, to assist these users of financial statements in assessing (1) whether a government’s current-year revenues were sufficient to pay for current-year services (known as interperiod equity), (2) whether a government complied with finance-related legal and contractual obligations, (3) where a government’s financial resources come from and how it uses them, and (4) a government’s financial position and economic condition and how they have changed over time. The requirements of this Statement are effective for reporting periods beginning after December 15, 2015. The City will implement this statement, as applicable, to its financial statements for the year ending June 30, 2017.

REQUIRED SUPPLEMENTARY INFORMATION
89

City of Sonoma, CaliforniaRequired Supplementary Information - Schedule of ContributionsMiscellaneous PlanLast 10 Fiscal Years*
2014
Contractually required contribution (actuarially determined) 279,033$
Contributions in relation to the actuarially determined contributions (279,033)
Contribution deficiency (excess) -$
Covered-employee payroll 2,384,713$
Contribution as a percentage of covered-employee payroll 11.70%
Notes to Schedule1) Covered employee payroll represents compensation earnable and pensionable compensation. Only compensation earnable and pensionable compensation that would possibly go into the determination of retirement benefits are included.
* - Fiscal year 2015 was the first year of implementation, therefore only the first year was available.
90
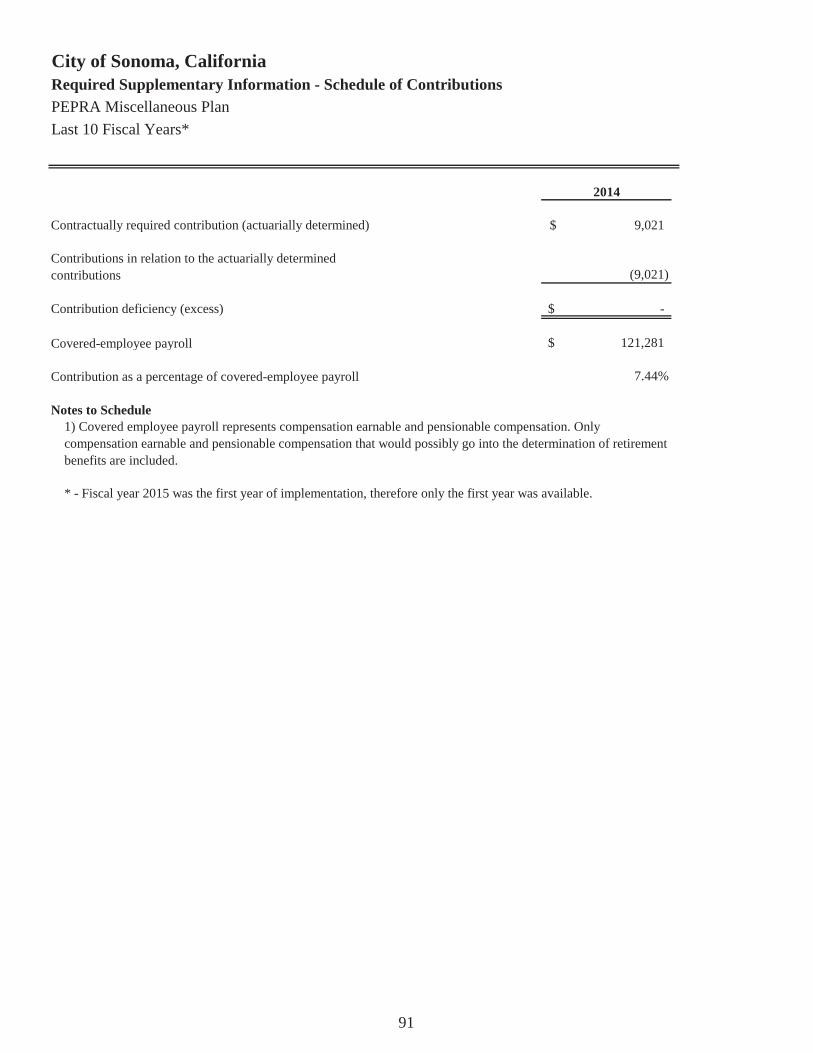
City of Sonoma, CaliforniaRequired Supplementary Information - Schedule of ContributionsPEPRA Miscellaneous PlanLast 10 Fiscal Years*
2014
Contractually required contribution (actuarially determined) 9,021$
Contributions in relation to the actuarially determined contributions (9,021)
Contribution deficiency (excess) -$
Covered-employee payroll 121,281$
Contribution as a percentage of covered-employee payroll 7.44%
Notes to Schedule1) Covered employee payroll represents compensation earnable and pensionable compensation. Only compensation earnable and pensionable compensation that would possibly go into the determination of retirement benefits are included.
* - Fiscal year 2015 was the first year of implementation, therefore only the first year was available.
91
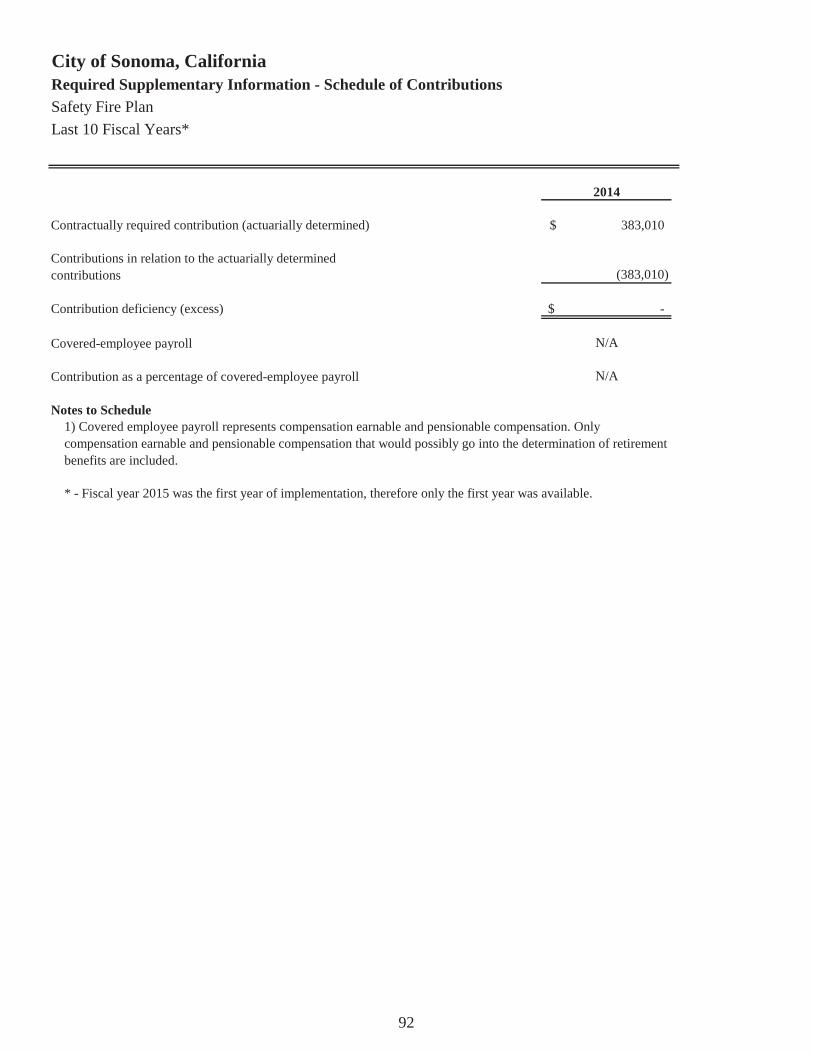
City of Sonoma, CaliforniaRequired Supplementary Information - Schedule of ContributionsSafety Fire PlanLast 10 Fiscal Years*
2014
Contractually required contribution (actuarially determined) 383,010$
Contributions in relation to the actuarially determined contributions (383,010)
Contribution deficiency (excess) -$
Covered-employee payroll N/A
Contribution as a percentage of covered-employee payroll N/A
Notes to Schedule1) Covered employee payroll represents compensation earnable and pensionable compensation. Only compensation earnable and pensionable compensation that would possibly go into the determination of retirement benefits are included.
* - Fiscal year 2015 was the first year of implementation, therefore only the first year was available.
92
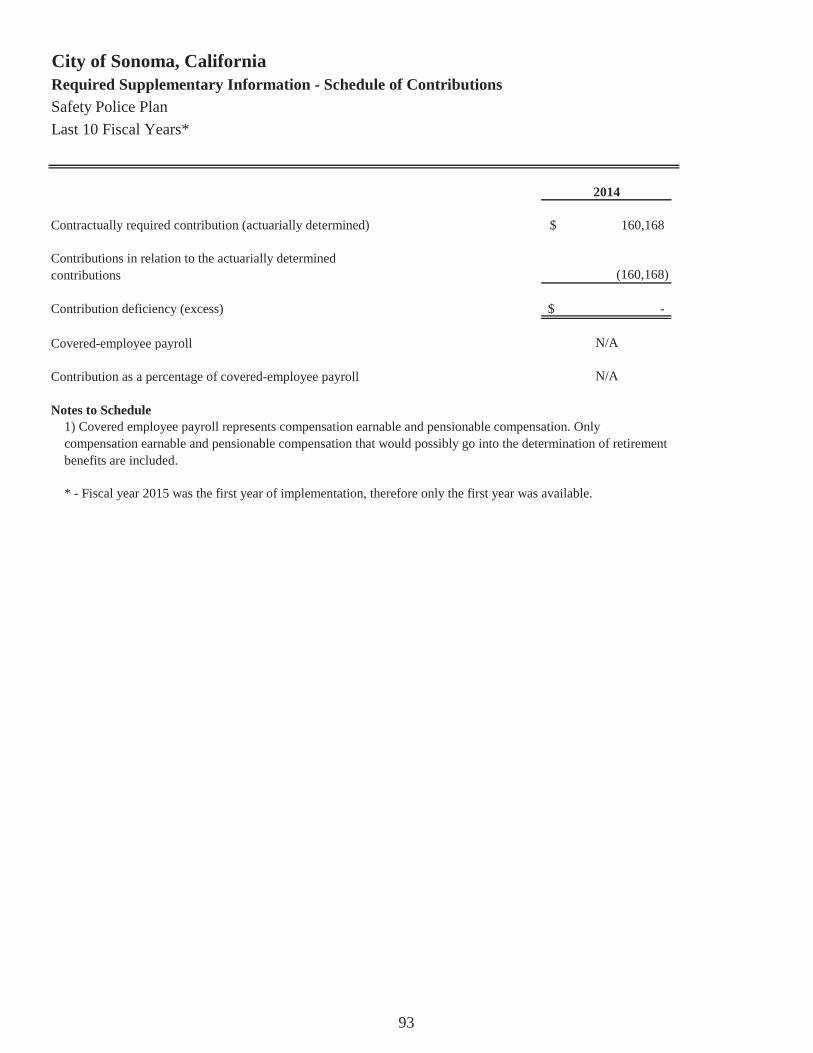
City of Sonoma, CaliforniaRequired Supplementary Information - Schedule of ContributionsSafety Police PlanLast 10 Fiscal Years*
2014
Contractually required contribution (actuarially determined) 160,168$
Contributions in relation to the actuarially determined contributions (160,168)
Contribution deficiency (excess) -$
Covered-employee payroll N/A
Contribution as a percentage of covered-employee payroll N/A
Notes to Schedule1) Covered employee payroll represents compensation earnable and pensionable compensation. Only compensation earnable and pensionable compensation that would possibly go into the determination of retirement benefits are included.
* - Fiscal year 2015 was the first year of implementation, therefore only the first year was available.
93

City of Sonoma, CaliforniaRequired Supplementary Information - Schedule of the City's ProportionateShare of the Net Pension LiabilityMiscellaneous PlanLast 10 Fiscal Years*
2014
Plan's Proportion of the Net Pension Liability/(Asset) 0.06027%
Plan's Proportionate Share of the Net Pension Liability/(Asset) 3,750,127$
Plan's Covered-Employee Payroll 2,384,713$
Plan's Proportionate Share of the Net Pension Liability/(Asset) as a Percentage of its Covered-Employee Payroll 157.26%
Plan's Proportionate Share of the Fiduciary Net Position as a Percentage of the Plan’s Total Pension Liability 83.03%
Plan's Proportionate Share of Aggregate Employer Contribution 496,128$
Notes to Schedule1) Covered employee payroll represents compensation earnable and pensionable compensation. Only compensation earnable and pensionable compensation that would possibly go into the determination of retirement benefits are included.
* - Fiscal year 2015 was the first year of implementation, therefore only the first year was available.
94
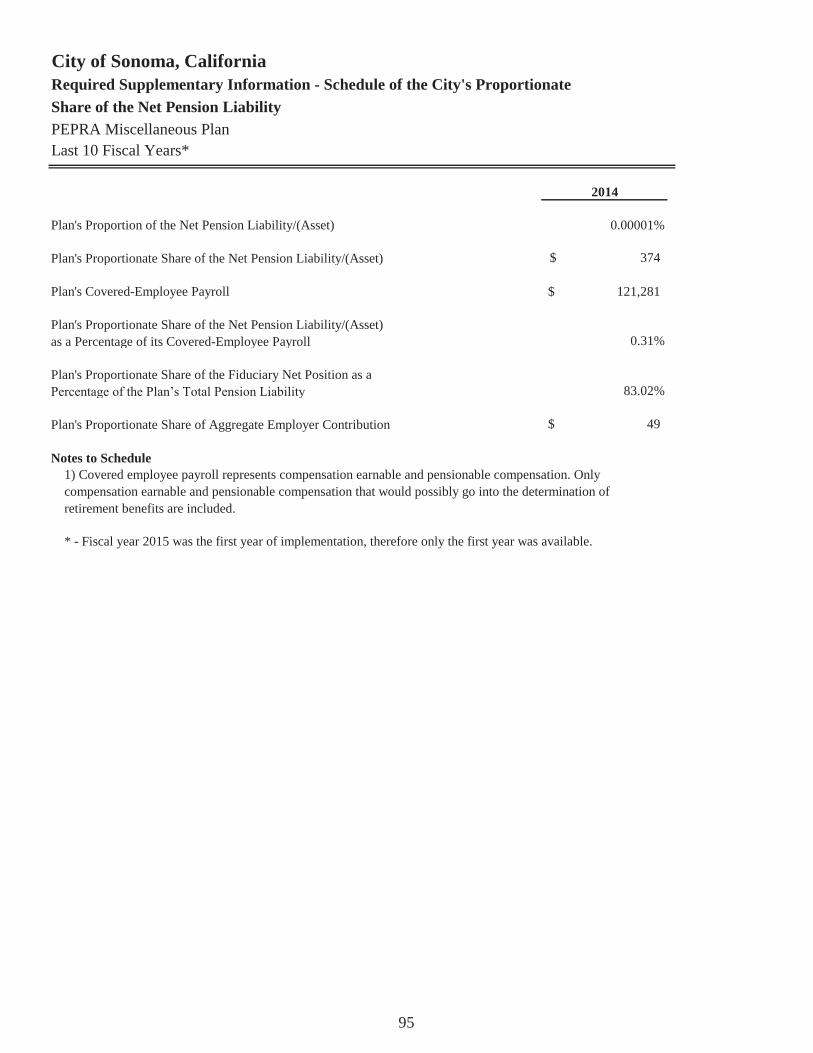
City of Sonoma, CaliforniaRequired Supplementary Information - Schedule of the City's ProportionateShare of the Net Pension LiabilityPEPRA Miscellaneous PlanLast 10 Fiscal Years*
2014
Plan's Proportion of the Net Pension Liability/(Asset) 0.00001%
Plan's Proportionate Share of the Net Pension Liability/(Asset) 374$
Plan's Covered-Employee Payroll 121,281$
Plan's Proportionate Share of the Net Pension Liability/(Asset) as a Percentage of its Covered-Employee Payroll 0.31%
Plan's Proportionate Share of the Fiduciary Net Position as a Percentage of the Plan’s Total Pension Liability 83.02%
Plan's Proportionate Share of Aggregate Employer Contribution 49$
Notes to Schedule1) Covered employee payroll represents compensation earnable and pensionable compensation. Only compensation earnable and pensionable compensation that would possibly go into the determination of retirement benefits are included.
* - Fiscal year 2015 was the first year of implementation, therefore only the first year was available.
95

City of Sonoma, CaliforniaRequired Supplementary Information - Schedule of the City's ProportionateShare of the Net Pension LiabilitySafety Fire PlanLast 10 Fiscal Years*
2014
Plan's Proportion of the Net Pension Liability/(Asset) 0.04460%
Plan's Proportionate Share of the Net Pension Liability/(Asset) 2,775,168$
Plan's Covered-Employee Payroll N/A
Plan's Proportionate Share of the Net Pension Liability/(Asset) as a Percentage of its Covered-Employee Payroll N/A
Plan's Proportionate Share of the Fiduciary Net Position as a Percentage of the Plan’s Total Pension Liability 81.42%
Plan's Proportionate Share of Aggregate Employer Contribution 344,266$
Notes to Schedule1) Covered employee payroll represents compensation earnable and pensionable compensation. Only compensation earnable and pensionable compensation that would possibly go into the determination of retirement benefits are included.
* - Fiscal year 2015 was the first year of implementation, therefore only the first year was available.
96
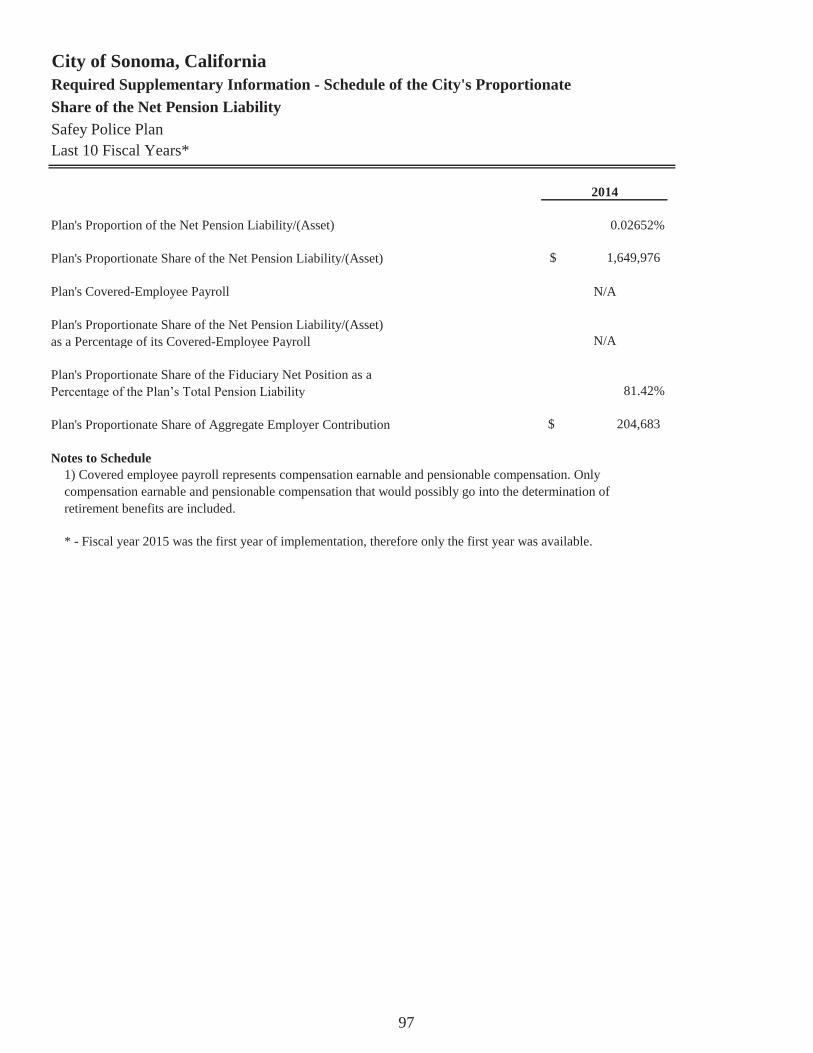
City of Sonoma, CaliforniaRequired Supplementary Information - Schedule of the City's ProportionateShare of the Net Pension LiabilitySafey Police PlanLast 10 Fiscal Years*
2014
Plan's Proportion of the Net Pension Liability/(Asset) 0.02652%
Plan's Proportionate Share of the Net Pension Liability/(Asset) 1,649,976$
Plan's Covered-Employee Payroll N/A
Plan's Proportionate Share of the Net Pension Liability/(Asset) as a Percentage of its Covered-Employee Payroll N/A
Plan's Proportionate Share of the Fiduciary Net Position as a Percentage of the Plan’s Total Pension Liability 81.42%
Plan's Proportionate Share of Aggregate Employer Contribution 204,683$
Notes to Schedule1) Covered employee payroll represents compensation earnable and pensionable compensation. Only compensation earnable and pensionable compensation that would possibly go into the determination of retirement benefits are included.
* - Fiscal year 2015 was the first year of implementation, therefore only the first year was available.
97

This page intentionally left blank.
98
COMBINING AND INDIVIDUAL FUND STATEMENTS AND SCHEDULES
99

This page intentionally left blank.
100
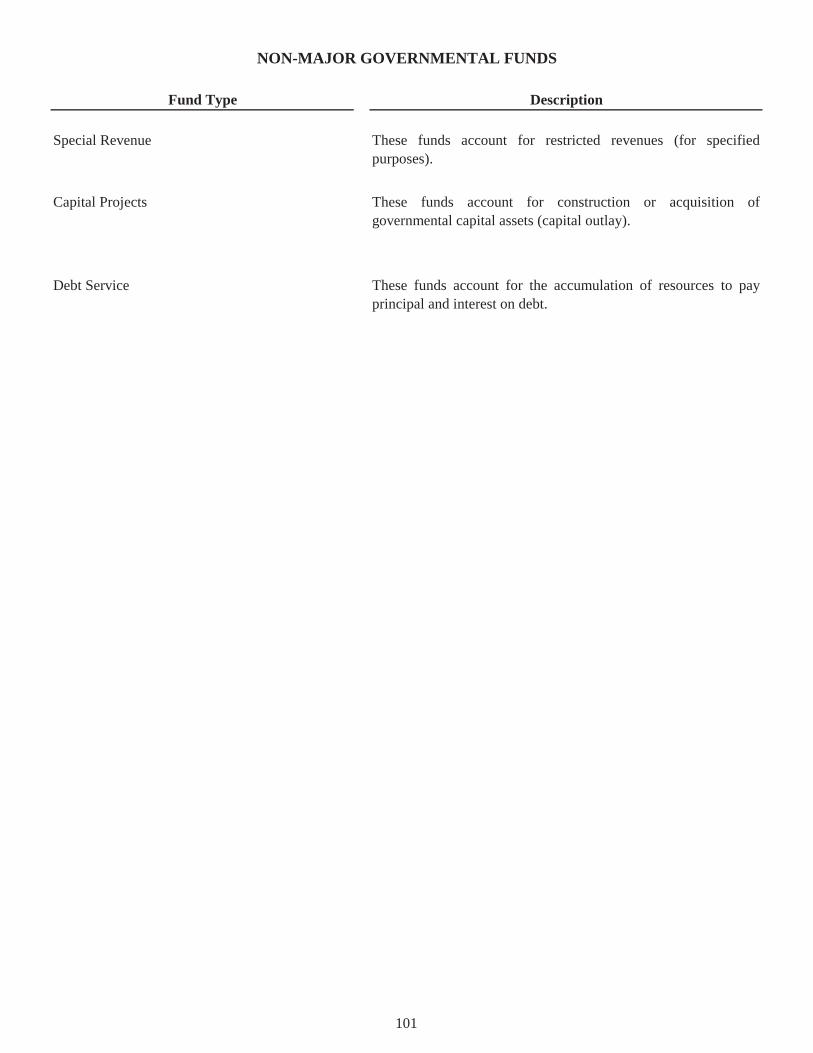
Fund Type
Special Revenue
Capital Projects
Debt Service
NON-MAJOR GOVERNMENTAL FUNDS
Description
These funds account for restricted revenues (for specifiedpurposes).
These funds account for construction or acquisition ofgovernmental capital assets (capital outlay).
These funds account for the accumulation of resources to payprincipal and interest on debt.
101
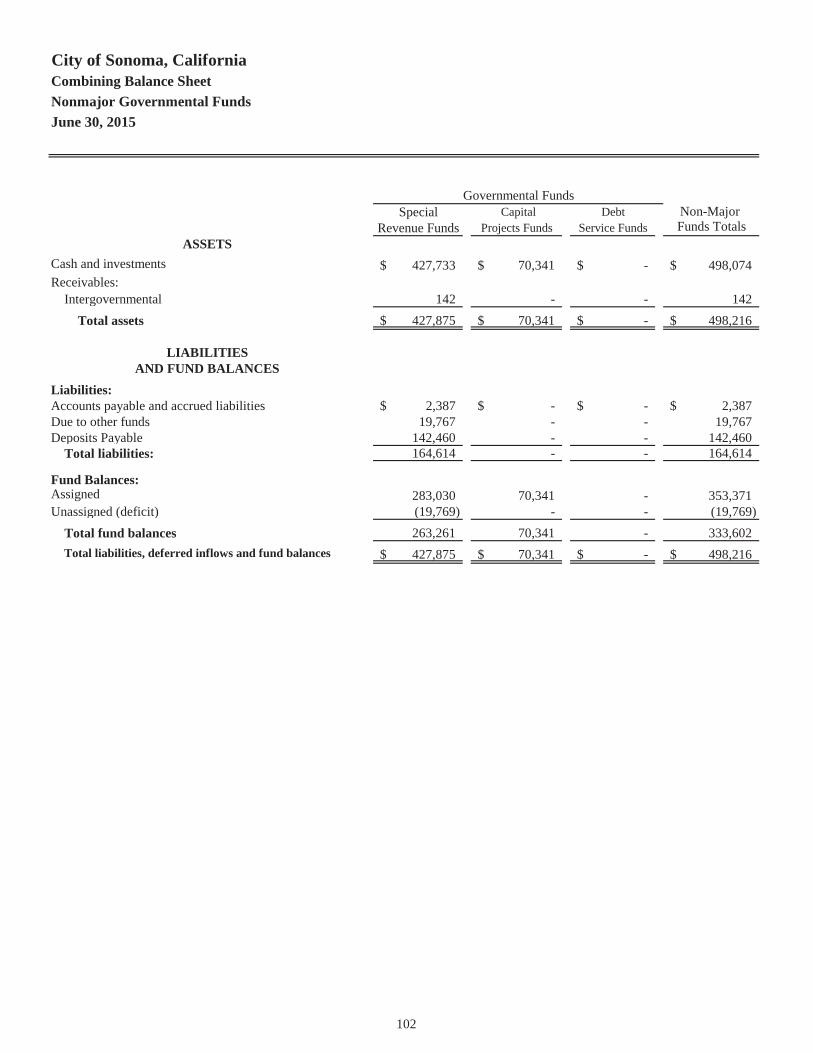
City of Sonoma, CaliforniaCombining Balance SheetNonmajor Governmental FundsJune 30, 2015
Special Capital DebtRevenue Funds Projects Funds Service Funds
ASSETSCash and investments 427,733$ 70,341$ -$ 498,074$ Receivables:
Intergovernmental 142 - - 142 Total assets 427,875$ 70,341$ -$ 498,216$
LIABILITIESAND FUND BALANCES
Liabilities:Accounts payable and accrued liabilities 2,387$ -$ -$ 2,387$ Due to other funds 19,767 - - 19,767 Deposits Payable 142,460 - - 142,460
Total liabilities: 164,614 - - 164,614
Fund Balances:Assigned 283,030 70,341 - 353,371 Unassigned (deficit) (19,769) - - (19,769)
Total fund balances 263,261 70,341 - 333,602 Total liabilities, deferred inflows and fund balances 427,875$ 70,341$ -$ 498,216$
Funds TotalsNon-Major
Governmental Funds
102

City of Sonoma, CaliforniaCombining Statement of Revenues, Expenditures and Changes in Fund BalancesNonmajor Governmental FundsFor the year ended June 30, 2015
Special Capital DebtRevenue Funds Projects Funds Service Funds
REVENUES:Taxes and assessments -$ 75,191$ -$ 75,191$ Licenses and permits 1,059 22,154 - 23,213 Intergovernmental 133,630 10,966 - 144,596 Use of money and property 3,393 1,664 - 5,057 Other revenues 377 - - 377
Total revenues 138,459 109,975 - 248,434
EXPENDITURES:Current:
Public safety 11,219 - - 11,219 Public works - 147,748 - 147,748 Community development 20,947 - - 20,947 Culture and leisure 25,225 - - 25,225
Capital outlay - - - - Debt Service
Principal - - 506,249 506,249 Interest and fiscal charges - - 92,550 92,550
Total expenditures 57,391 147,748 598,799 803,938
REVENUES OVER (UNDER) EXPENDITURES 81,068 (37,773) (598,799) (555,504)
OTHER FINANCING SOURCES (USES):Transfer from fiduciary activities - - 30,501 30,501 Transfer to fiduciary activities - - (19,324) (19,324) Transfers in - - 785,782 785,782 Transfers out (112,692) (100,000) - (212,692)
Total other financingsources (uses) (112,692) (100,000) 796,959 584,267
REVENUES AND OTHER FINANCING SOURCES OVER (UNDER) EXPENDITURES AND OTHERFINANCING (USES) (31,624) (137,773) 198,160 28,763
FUND BALANCES (deficit):Beginning of year 294,885 208,114 (198,160) 304,839 End of year 263,261$ 70,341$ -$ 333,602$
Funds TotalsNon-Major
Governmental Funds
103

This page intentionally left blank.
104

Fund
Strong Motion
Asset Forfeiture
SLESF Law Enforcement Fund
Bond Property Maintenace Fund
Maysonnave Propety Fund
Schell Drainage Fund
Abandoned Vehicle Fund
Sonoma Creek Senior Housing Fund
Community Development Block Grant Fund Accounts for revenues and expenditures related to the City'sCommunity Development Block program.
NON-MAJOR SPECIAL REVENUE FUNDS
Description
Accounts for Supplemental Law Enforcement Services Funds(SLESF) which are collected by the State of California as part ofthe State Vehicle License Fee.
Accounts for State of California "strong motion" fees paid bybuilding permit applicants. Funds are paid regularly to StateDepartment of Conservation.
Accounts for funds received from seizure and forfeiture of assetsthat represent the proceeds of, or were used to facilitate crime.Funds are expended according to legal restrictions.
Accounts for funds used for tracking of mitigation fees for specificprojects.
Accounts for funds received from the Abandoned VehicleAbatement program and must be expended in compliance withlegal restrictions.
Accounts for revenues and expenditures related to Sonoma CreekSenior Housing.
Accounts for revenues and expenditures related to maintenance of the Bond Property.
Accounts for revenues and expenditures related to ongoing maintenance of the Maysonnave Property.
105

City of Sonoma, CaliforniaCombining Balance SheetNonmajor Special Revenue FundsJune 30, 2015
Strong AssetMotion Forfeiture SLESF
ASSETSCash and investments -$ 3,770$ 13,384$ Receivables:
Intergovernmental - - -
Total assets -$ 3,770$ 13,384$
LIABILITIES, DEFERRED INFLOWSAND FUND BALANCES
Liabilities:Accounts payable 2$ -$ -$ Due to other funds 624 - - Deposits payable - - -
Total liabilities 626 - -
Fund Balances:Assigned - 3,770 13,384 Unassigned (deficit) (626) - -
Total fund balances (626) 3,770 13,384
Total liabilities deferred inflows and fund balances -$ 3,770$ 13,384$
106
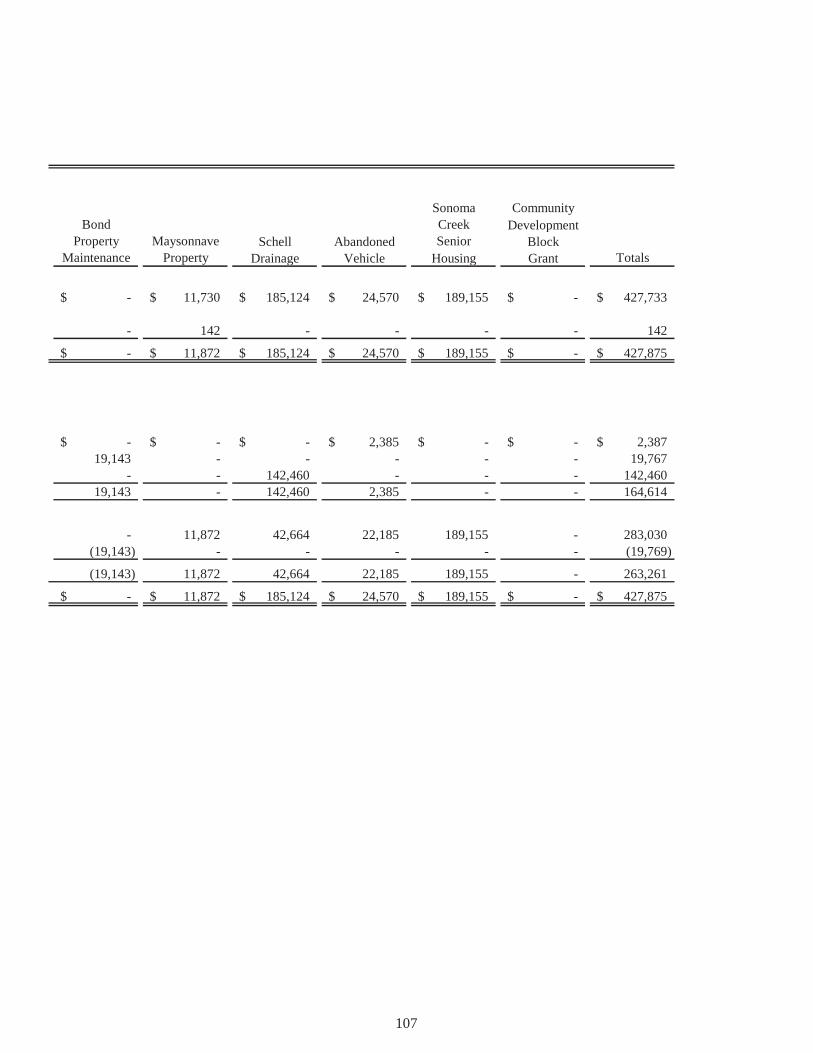
Sonoma CommunityBond Creek Development
Property Maysonnave Schell Abandoned Senior BlockMaintenance Property Drainage Vehicle Housing Grant
-$ 11,730$ 185,124$ 24,570$ 189,155$ -$ 427,733$
- 142 - - - - 142
-$ 11,872$ 185,124$ 24,570$ 189,155$ -$ 427,875$
-$ -$ -$ 2,385$ -$ -$ 2,387$ 19,143 - - - - - 19,767
- - 142,460 - - - 142,460 19,143 - 142,460 2,385 - - 164,614
- 11,872 42,664 22,185 189,155 - 283,030 (19,143) - - - - - (19,769)
(19,143) 11,872 42,664 22,185 189,155 - 263,261
-$ 11,872$ 185,124$ 24,570$ 189,155$ -$ 427,875$
Totals
107

City of Sonoma, CaliforniaCombining Statement of Revenues, Expenditures and Changes in Fund BalancesNonmajor Special Revenue FundsFor the year ended June 30, 2015
BondStrong Asset PropertyMotion Forfeiture SLESF Maintenance
REVENUES:Licenses and permits 1,059$ -$ -$ -$ Intergovernmental - - 125,517 - Use of money and property - 23 559 - Other revenues - - - 377
Total revenues 1,059 23 126,076 377
EXPENDITURES:Current:
Public safety - - - - Community development - - - 146 Culture and leisure - - - -
Total expenditures - - - 146
REVENUES OVER (UNDER)EXPENDITURES 1,059 23 126,076 231
OTHER FINANCING SOURCES (USES):Transfers out - - (112,692) -
Total other financingsources and uses - - (112,692) -
REVENUES AND OTHER FINANCINGSOURCES OVER (UNDER)EXPENDITURES AND OTHERFINANCING (USES) 1,059 23 13,384 231
FUND BALANCES (deficit):Beginning of year (1,685) 3,747 - (19,374) End of year (626)$ 3,770$ 13,384$ (19,143)$
108
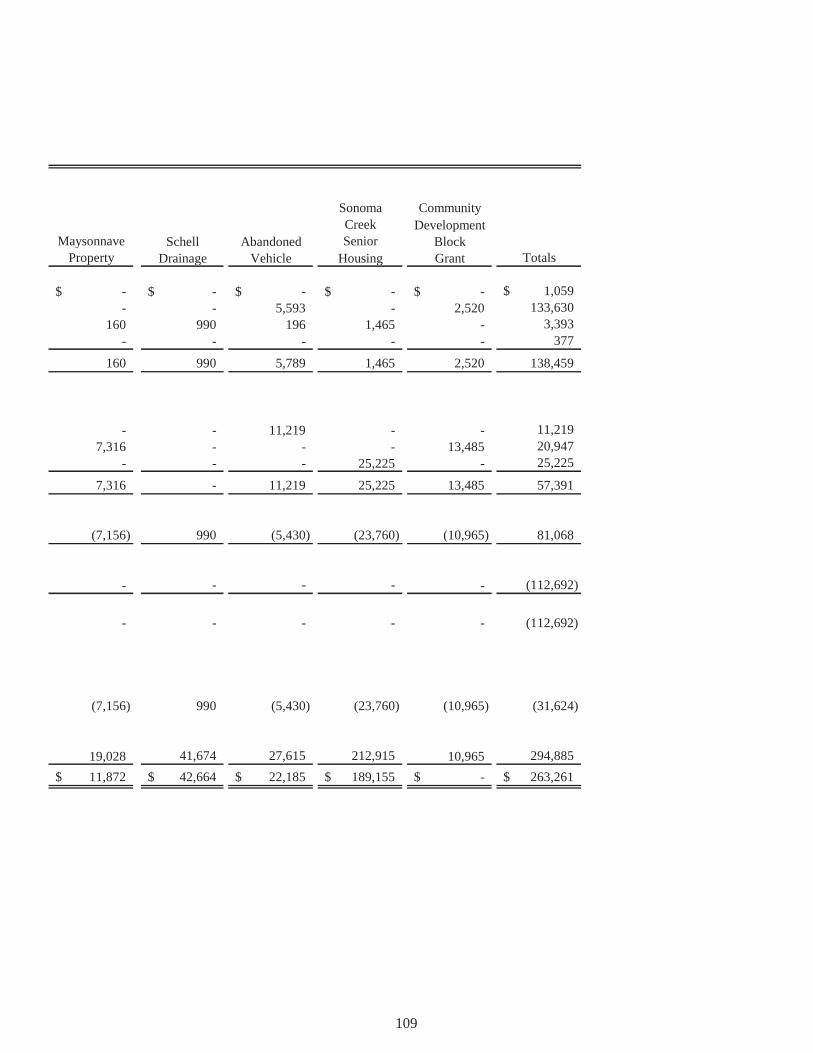
Sonoma CommunityCreek Development
Maysonnave Schell Abandoned Senior BlockProperty Drainage Vehicle Housing Grant Totals
-$ -$ -$ -$ -$ 1,059$ - - 5,593 - 2,520 133,630
160 990 196 1,465 - 3,393 - - - - - 377
160 990 5,789 1,465 2,520 138,459
- - 11,219 - - 11,219 7,316 - - - 13,485 20,947
- - - 25,225 - 25,225
7,316 - 11,219 25,225 13,485 57,391
(7,156) 990 (5,430) (23,760) (10,965) 81,068
- - - - - (112,692)
- - - - - (112,692)
(7,156) 990 (5,430) (23,760) (10,965) (31,624)
19,028 41,674 27,615 212,915 10,965 294,885 11,872$ 42,664$ 22,185$ 189,155$ -$ 263,261$
109

City of Sonoma, CaliforniaSchedule of Revenues, Expenditures, and Changes in Fund Balances - Budget to ActualStrong Motion Special Revenue FundFor the year ended June 30, 2015
Variance w/FinalPositive
Original Final Actual (Negative)REVENUES:
Licenses and permits -$ -$ 1,059$ 1,059$
Total revenues - - 1,059 1,059
EXPENDITURES:Current:
Culture and leisure - - - -
Total expenditures - - - -
REVENUES OVER (UNDER)EXPENDITURES - - 1,059 1,059
OTHER FINANCING SOURCES (USES):Transfers in - - - -
Total other financing sources (uses) - - - -
Net change in fund balances - - 1,059 1,059
FUND BALANCES (DEFICIT):Beginning of year (1,685) (1,685) (1,685) - End of year (1,685)$ (1,685)$ (626)$ 1,059$
Budgeted Amounts
110

City of Sonoma, CaliforniaSchedule of Revenues, Expenditures, and Changes in Fund Balances - Budget to ActualAsset Forfeiture Special Revenue FundFor the year ended June 30, 2015
Variance w/FinalPositive
Original Final Actual (Negative)REVENUES:
Use of money and property -$ -$ 23$ 23$
Total revenues - - 23 23
EXPENDITURES:Current:
Public safety - - - -
Total expenditures - - - -
REVENUES OVER (UNDER)EXPENDITURES - - 23 23
OTHER FINANCING SOURCES (USES):Transfers in - - - -
Total other financing sources (uses) - - - -
Net change in fund balances - - 23 23
FUND BALANCES:Beginning of year 3,747 3,747 3,747 - End of year 3,747$ 3,747$ 3,770$ 23$
Budgeted Amounts
111

City of Sonoma, CaliforniaSchedule of Revenues, Expenditures, and Changes in Fund Balances - Budget to ActualSLESF Special Revenue FundFor the year ended June 30, 2015
Variance w/FinalPositive
Original Final Actual (Negative)REVENUES:
Intergovernmental -$ -$ 125,517$ 125,517$ Use of money and property - - 559 559
Total revenues - - 126,076 126,076
EXPENDITURES:Current:
Public safety - - - -
Total expenditures - - - -
REVENUES OVER (UNDER)EXPENDITURES - - 126,076 126,076
OTHER FINANCING SOURCES (USES):Transfers out (112,692) (112,692)
Total other financing sources (uses) - - - (112,692)
Net change in fund balances - - 126,076 13,384
FUND BALANCES (DEFICIT):Beginning of year - - - - End of year -$ -$ 126,076$ 13,384$
Budgeted Amounts
112

City of Sonoma, CaliforniaSchedule of Revenues, Expenditures, and Changes in Fund Balances - Budget to ActualBond Property Maintenance Special Revenue FundFor the year ended June 30, 2015
Variance w/FinalPositive
Original Final Actual (Negative)REVENUES:
Other revenues -$ -$ 377$ 377$
Total revenues - - 377 377
EXPENDITURES:Current:
Community development 5,044 5,044 146 4,898
Total expenditures 5,044 5,044 146 4,898
REVENUES OVER (UNDER)EXPENDITURES (5,044) (5,044) 231 5,275
OTHER FINANCING SOURCES (USES):Transfers in 5,044 5,044 - (5,044)
Total other financing sources (uses) 5,044 5,044 - (5,044)
Net change in fund balances - - 231 231
FUND BALANCES (DEFICIT):Beginning of year (19,374) (19,374) (19,374) - End of year (19,374)$ (19,374)$ (19,143)$ 231$
Budgeted Amounts
113
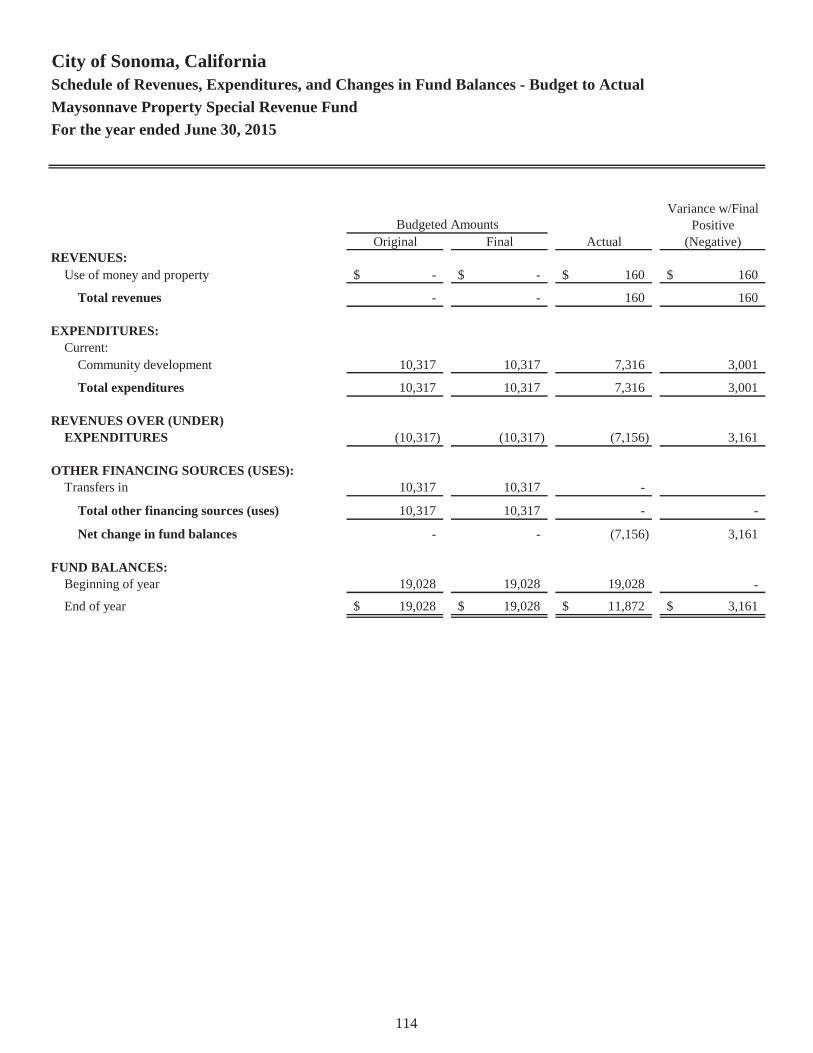
City of Sonoma, CaliforniaSchedule of Revenues, Expenditures, and Changes in Fund Balances - Budget to ActualMaysonnave Property Special Revenue FundFor the year ended June 30, 2015
Variance w/FinalPositive
Original Final Actual (Negative)REVENUES:
Use of money and property -$ -$ 160$ 160$
Total revenues - - 160 160
EXPENDITURES:Current:
Community development 10,317 10,317 7,316 3,001
Total expenditures 10,317 10,317 7,316 3,001
REVENUES OVER (UNDER)EXPENDITURES (10,317) (10,317) (7,156) 3,161
OTHER FINANCING SOURCES (USES):Transfers in 10,317 10,317 -
Total other financing sources (uses) 10,317 10,317 - -
Net change in fund balances - - (7,156) 3,161
FUND BALANCES:Beginning of year 19,028 19,028 19,028 - End of year 19,028$ 19,028$ 11,872$ 3,161$
Budgeted Amounts
114
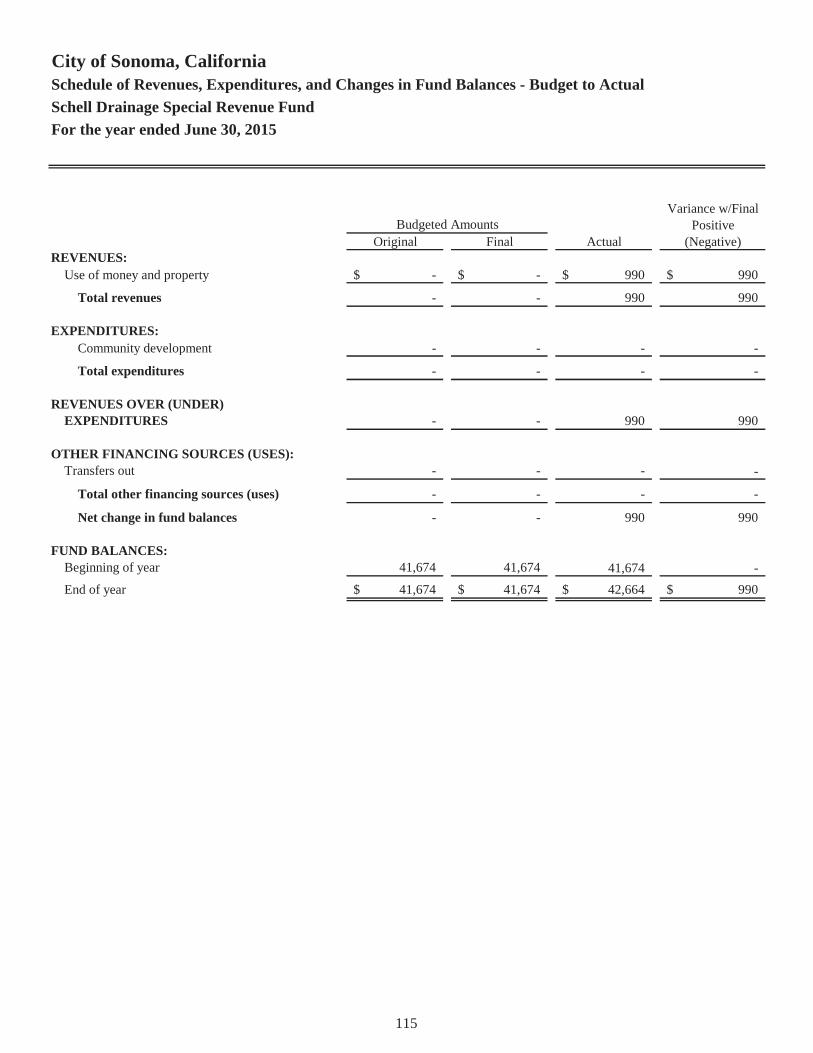
City of Sonoma, CaliforniaSchedule of Revenues, Expenditures, and Changes in Fund Balances - Budget to ActualSchell Drainage Special Revenue FundFor the year ended June 30, 2015
Variance w/FinalPositive
Original Final Actual (Negative)REVENUES:
Use of money and property -$ -$ 990$ 990$
Total revenues - - 990 990
EXPENDITURES:Community development - - - -
Total expenditures - - - -
REVENUES OVER (UNDER)EXPENDITURES - - 990 990
OTHER FINANCING SOURCES (USES):Transfers out - - - -
Total other financing sources (uses) - - - -
Net change in fund balances - - 990 990
FUND BALANCES:Beginning of year 41,674 41,674 41,674 - End of year 41,674$ 41,674$ 42,664$ 990$
Budgeted Amounts
115

City of Sonoma, CaliforniaSchedule of Revenues, Expenditures, and Changes in Fund Balances - Budget to ActualAbandoned Vehicle Special Revenue FundFor the year ended June 30, 2015
Variance w/FinalPositive
Original Final Actual (Negative)REVENUES:
Intergovernmental -$ -$ 5,593$ 5,593$ Use of money and property - - 196 196
Total revenues - - 5,789 5,789
EXPENDITURES:Current:
Public safety - - 11,219 (11,219)
Total expenditures - - 11,219 (11,219)
REVENUES OVER (UNDER)EXPENDITURES - - (5,430) (5,430)
OTHER FINANCING SOURCES (USES):Transfers out - - - -
Total other financing sources (uses) - - - -
Net change in fund balances - - (5,430) (5,430)
FUND BALANCES:Beginning of year 27,615 27,615 27,615 - End of year 27,615$ 27,615$ 22,185$ (5,430)$
Budgeted Amounts
116
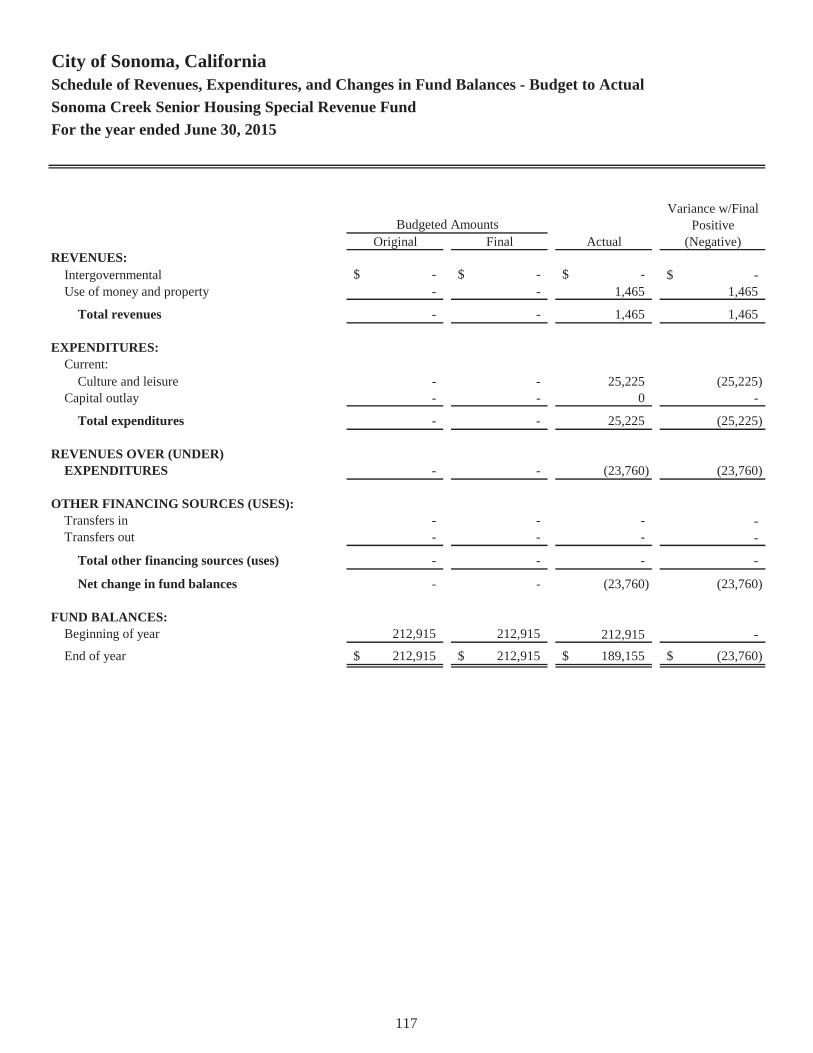
City of Sonoma, CaliforniaSchedule of Revenues, Expenditures, and Changes in Fund Balances - Budget to ActualSonoma Creek Senior Housing Special Revenue FundFor the year ended June 30, 2015
Variance w/FinalPositive
Original Final Actual (Negative)REVENUES:
Intergovernmental -$ -$ -$ -$ Use of money and property - - 1,465 1,465
Total revenues - - 1,465 1,465
EXPENDITURES:Current:
Culture and leisure - - 25,225 (25,225) Capital outlay - - 0 -
Total expenditures - - 25,225 (25,225)
REVENUES OVER (UNDER)EXPENDITURES - - (23,760) (23,760)
OTHER FINANCING SOURCES (USES):Transfers in - - - - Transfers out - - - -
Total other financing sources (uses) - - - -
Net change in fund balances - - (23,760) (23,760)
FUND BALANCES:Beginning of year 212,915 212,915 212,915 - End of year 212,915$ 212,915$ 189,155$ (23,760)$
Budgeted Amounts
117
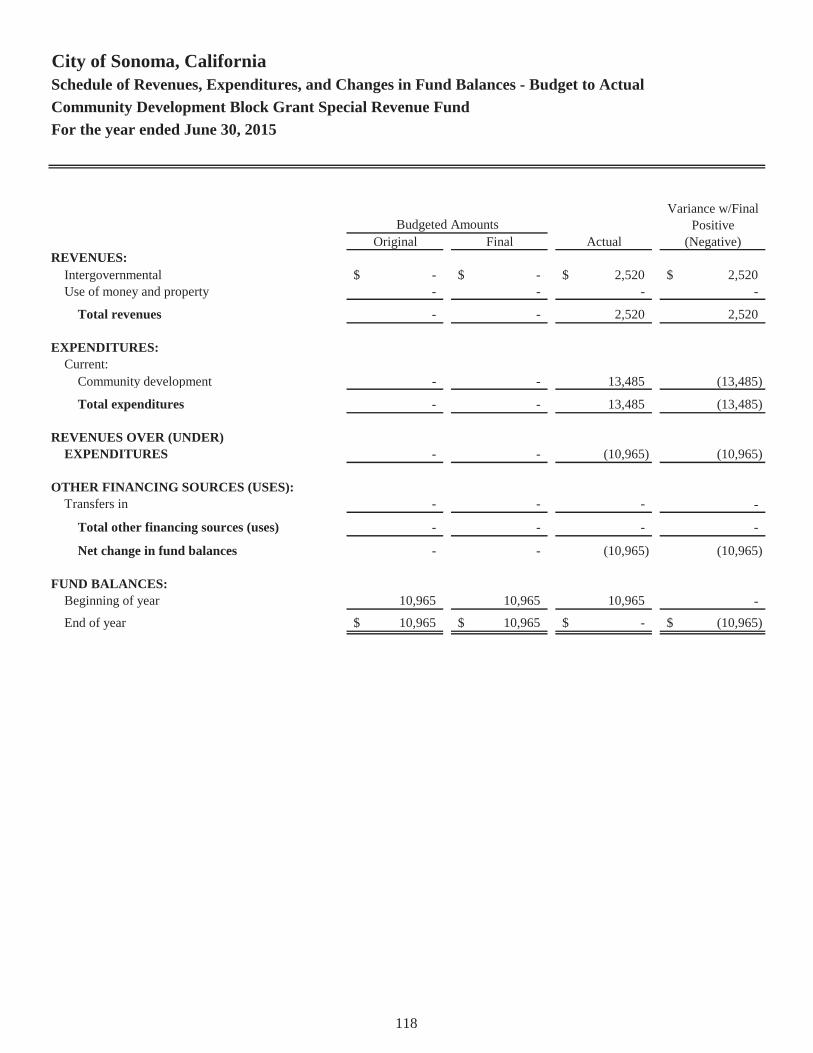
City of Sonoma, CaliforniaSchedule of Revenues, Expenditures, and Changes in Fund Balances - Budget to ActualCommunity Development Block Grant Special Revenue FundFor the year ended June 30, 2015
Variance w/FinalPositive
Original Final Actual (Negative)REVENUES:
Intergovernmental -$ -$ 2,520$ 2,520$ Use of money and property - - - -
Total revenues - - 2,520 2,520
EXPENDITURES:Current:
Community development - - 13,485 (13,485)
Total expenditures - - 13,485 (13,485)
REVENUES OVER (UNDER)EXPENDITURES - - (10,965) (10,965)
OTHER FINANCING SOURCES (USES):Transfers in - - - -
Total other financing sources (uses) - - - -
Net change in fund balances - - (10,965) (10,965)
FUND BALANCES:Beginning of year 10,965 10,965 10,965 - End of year 10,965$ 10,965$ -$ (10,965)$
Budgeted Amounts
118

Fund
Capital Projects Funds
Capital Improvement Program
Measure M
Debt Service FundsMunicipal Finance Corporation
2008 CREBs
2012 Pension Obligation Bonds
Accounts for debt service for the Redwood Empire FinancingAuthority Lease. Final payment was made on this lease in 2013and the fund will be closed.
Accounts for debt service related to the Clean Renewable EnergyBonds.
Accounts for debt service for the Pension Obligation Bond issued in 2012.
NON-MAJOR CAPITAL PROJECTS AND DEBT SERVICE FUNDS
Description
The Capital Projects Funds are used to account for financialresources used for the acquisition or construction of major capitalfacilities other than those financed by proprietary funds.
Accounts for funds received from a Countywide 1/4 cent sales taxand designated to be used for transportation projects.
119
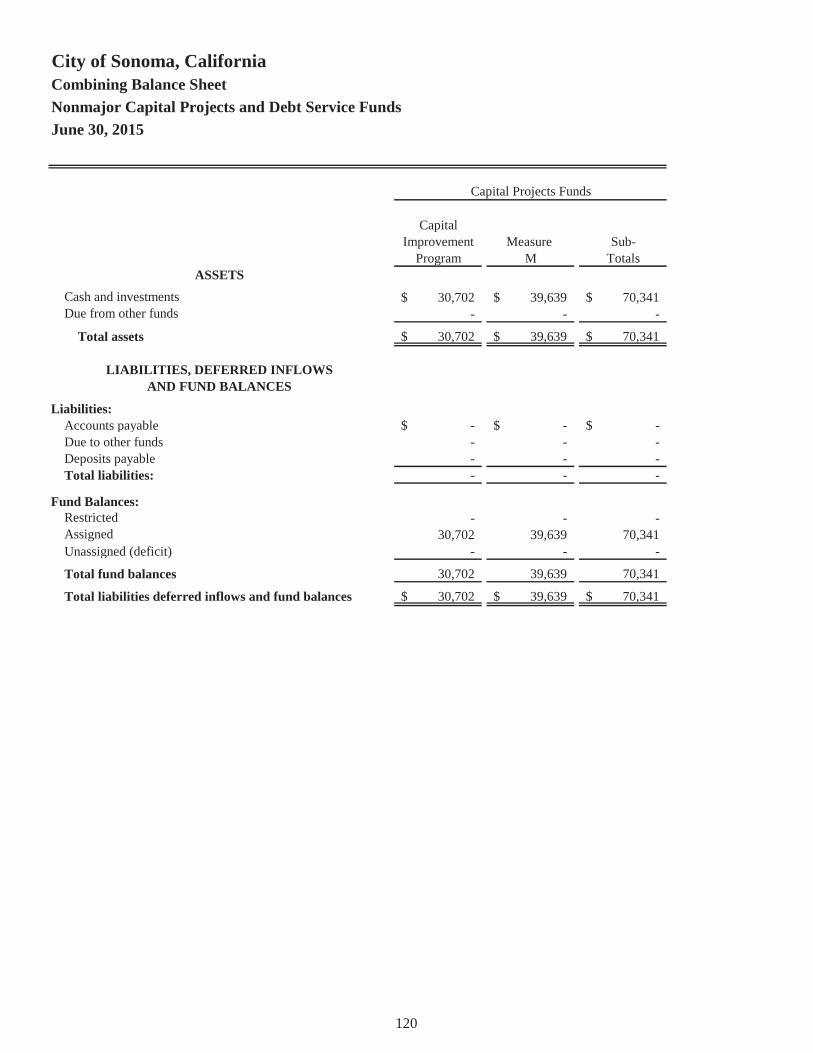
City of Sonoma, CaliforniaCombining Balance SheetNonmajor Capital Projects and Debt Service FundsJune 30, 2015
CapitalImprovement Measure Sub-
Program M TotalsASSETS
Cash and investments 30,702$ 39,639$ 70,341$ Due from other funds - - -
Total assets 30,702$ 39,639$ 70,341$
LIABILITIES, DEFERRED INFLOWSAND FUND BALANCES
Liabilities:Accounts payable -$ -$ -$ Due to other funds - - - Deposits payable - - - Total liabilities: - - -
Fund Balances:Restricted - - - Assigned 30,702 39,639 70,341 Unassigned (deficit) - - -
Total fund balances 30,702 39,639 70,341
Total liabilities deferred inflows and fund balances 30,702$ 39,639$ 70,341$
Capital Projects Funds
120
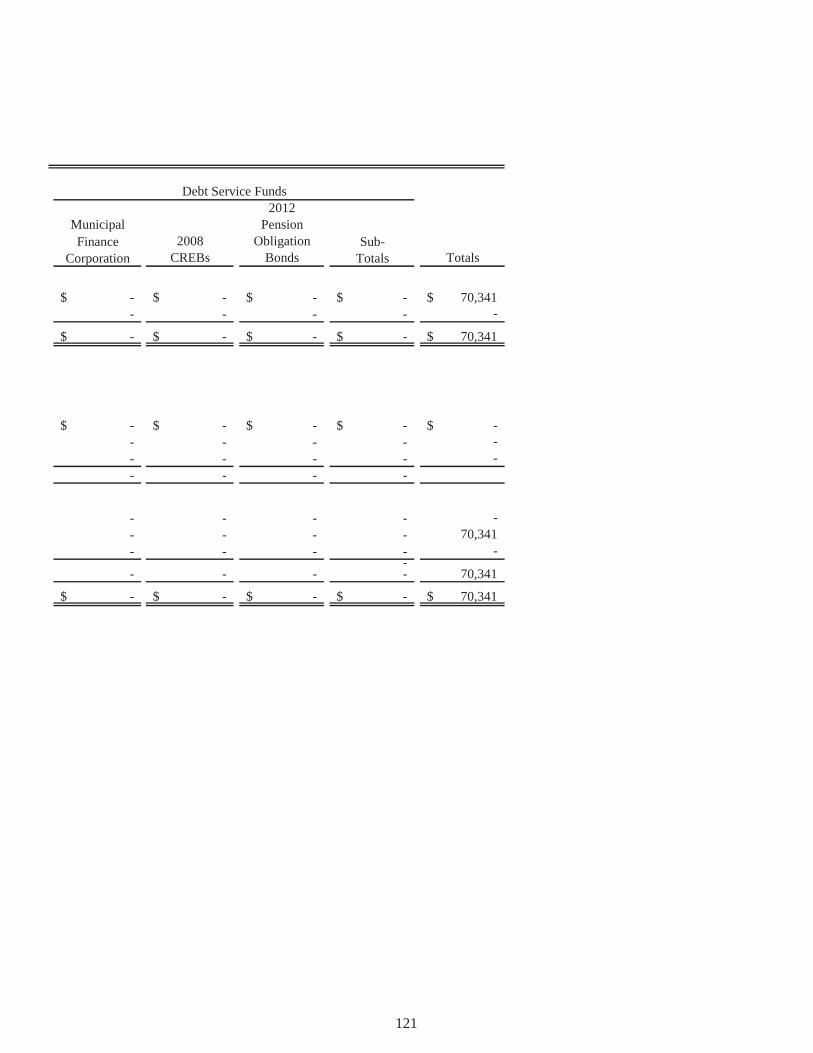
2012Municipal PensionFinance 2008 Obligation Sub-
Corporation CREBs Bonds Totals Totals
-$ -$ -$ -$ 70,341$ - - - - -
-$ -$ -$ -$ 70,341$
-$ -$ -$ -$ -$ - - - - - - - - - - - - - -
- - - - - - - - - 70,341 - - - - -
-- - - - 70,341
-$ -$ -$ -$ 70,341$
Debt Service Funds
121
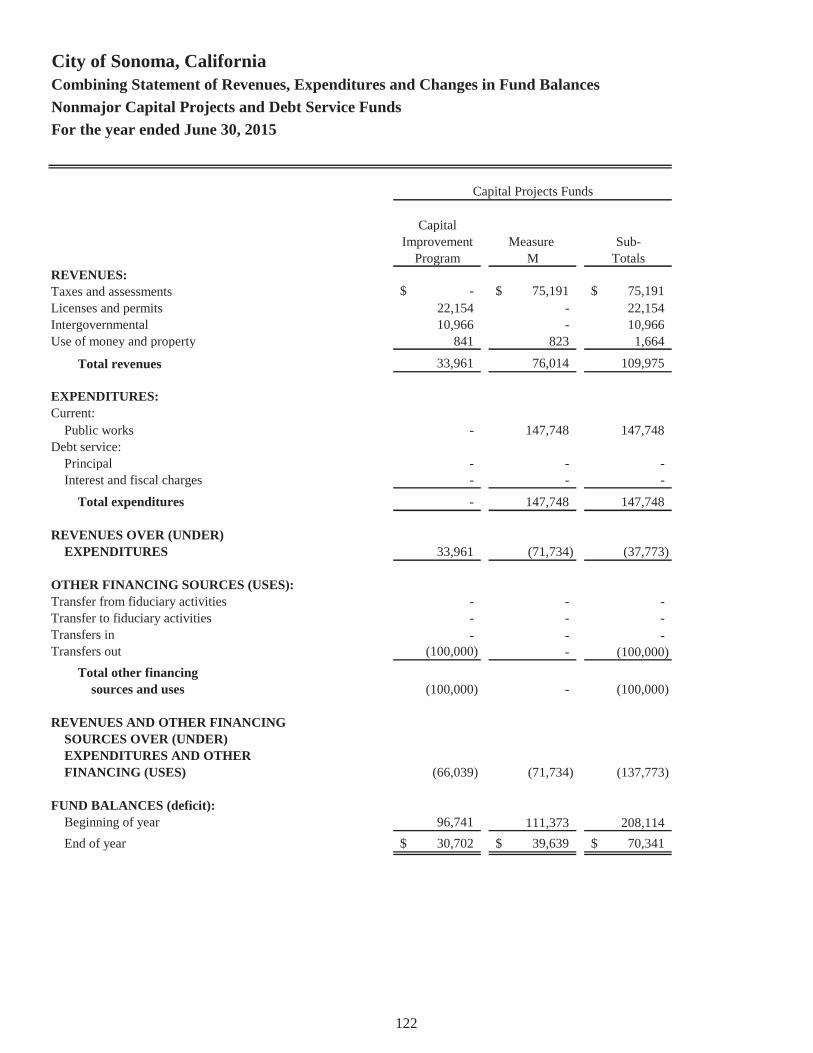
City of Sonoma, CaliforniaCombining Statement of Revenues, Expenditures and Changes in Fund BalancesNonmajor Capital Projects and Debt Service FundsFor the year ended June 30, 2015
CapitalImprovement Measure Sub-
Program M TotalsREVENUES:Taxes and assessments -$ 75,191$ 75,191$ Licenses and permits 22,154 - 22,154 Intergovernmental 10,966 - 10,966 Use of money and property 841 823 1,664
Total revenues 33,961 76,014 109,975
EXPENDITURES:Current:
Public works - 147,748 147,748 Debt service:
Principal - - - Interest and fiscal charges - - -
Total expenditures - 147,748 147,748
REVENUES OVER (UNDER)EXPENDITURES 33,961 (71,734) (37,773)
OTHER FINANCING SOURCES (USES):Transfer from fiduciary activities - - - Transfer to fiduciary activities - - - Transfers in - - - Transfers out (100,000) - (100,000)
Total other financingsources and uses (100,000) - (100,000)
REVENUES AND OTHER FINANCINGSOURCES OVER (UNDER)EXPENDITURES AND OTHERFINANCING (USES) (66,039) (71,734) (137,773)
FUND BALANCES (deficit):Beginning of year 96,741 111,373 208,114 End of year 30,702$ 39,639$ 70,341$
Capital Projects Funds
122

2012Municipal PensionFinance 2008 Obligation Sub-
Corporation CREBs Bonds Totals Totals
-$ -$ -$ -$ 75,191$ - - - - 22,154 - - - - 10,966 - - - - 1,664
- - - - 109,975
- - - - 147,748
- 186,249 320,000 506,249 506,249 - - 92,550 92,550 92,550
- 186,249 412,550 598,799 746,547
- (186,249) (412,550) (598,799) (636,572)
- 30,501 - 30,501 30,501 (19,324) - - (19,324) (19,324) 175,756 197,476 412,550 785,782 785,782
- - - - (100,000)
156,432 227,977 412,550 796,959 696,959
156,432 41,728 - 198,160 60,387
(156,432) (41,728) - (198,160) 9,954 -$ -$ -$ -$ 70,341$
Debt Service Funds
123

This page intentionally left blank.
124
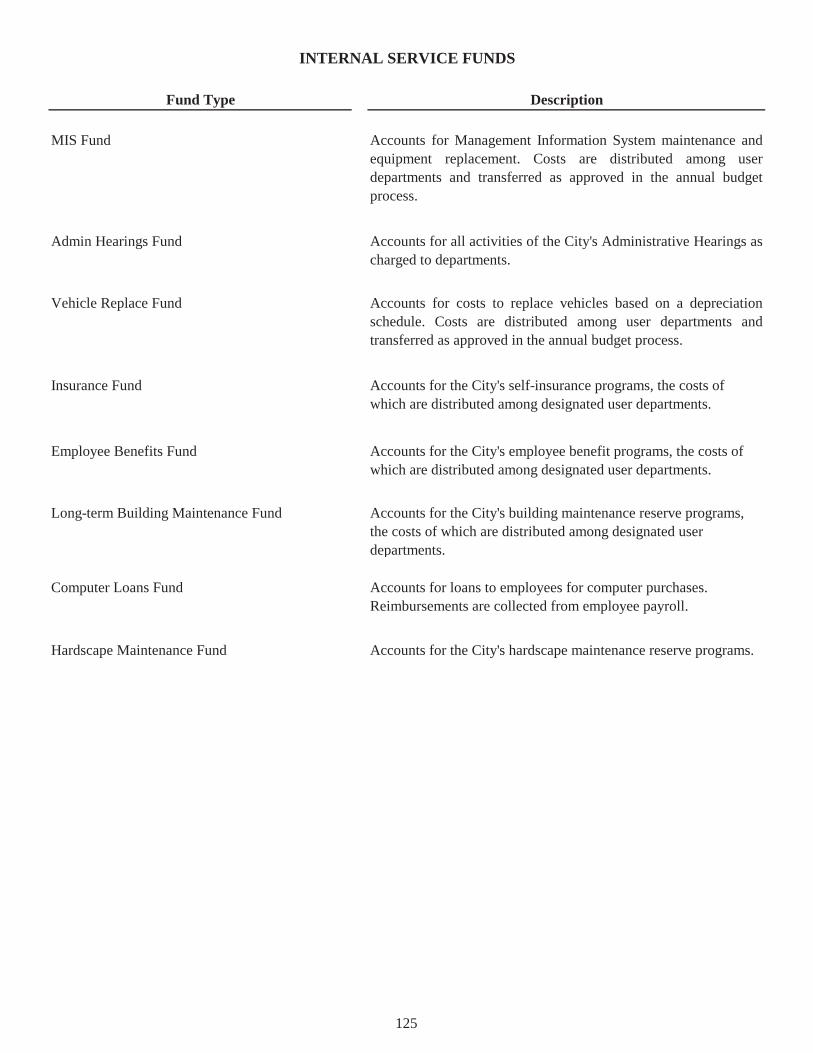
Fund Type
MIS Fund
Admin Hearings Fund
Vehicle Replace Fund
Insurance Fund
Employee Benefits Fund
Long-term Building Maintenance Fund
Computer Loans Fund
Hardscape Maintenance Fund
INTERNAL SERVICE FUNDS
Description
Accounts for Management Information System maintenance andequipment replacement. Costs are distributed among userdepartments and transferred as approved in the annual budgetprocess.
Accounts for costs to replace vehicles based on a depreciationschedule. Costs are distributed among user departments andtransferred as approved in the annual budget process.
Accounts for the City's self-insurance programs, the costs of which are distributed among designated user departments.
Accounts for the City's employee benefit programs, the costs of which are distributed among designated user departments.
Accounts for the City's building maintenance reserve programs, the costs of which are distributed among designated user departments.
Accounts for the City's hardscape maintenance reserve programs.
Accounts for loans to employees for computer purchases. Reimbursements are collected from employee payroll.
Accounts for all activities of the City's Administrative Hearings ascharged to departments.
125

City of Sonoma, CaliforniaCombining Statement of Net PositionInternal Service FundsFor the year ended June 30, 2015
Admin VehicleMIS Hearings ReplacementFund Fund Fund
ASSETS
Current assets:Cash and investments 405,119$ 9,217$ 296,132$ Receivables:
Accounts - - - Loans/Notes - - 393,767
Deposits and other assets - - - Total current assets 405,119 9,217 689,899
Noncurrent assets:Capital assets, net 40,544 - 2,078,898
Total noncurrent assets 40,544 - 2,078,898
Total assets 445,663$ 9,217$ 2,768,797$
LIABILITIES AND NET POSITION
Current liabilities:Accounts payable 9,586$ -$ -$ Due to other funds - - - Deposits payable - 8,079 -
Total current liabilities 9,586 8,079 -
Net Position:Net investment in capital assets 40,544 - 2,078,898 Unrestricted 395,533 1,138 689,899
Total net position 436,077 1,138 2,768,797
Total liabilities and net position 445,663$ 9,217$ 2,768,797$
126

Employee Building Computer Hardscape Insurance Benefits Maintenance Loans Maintenance
Fund Fund Fund Fund Fund Totals
40,680$ -$ 1,298,657$ 56,987$ 23,714$ 2,130,506$
- 3,459 - - - 3,459 - - - - - 393,767 - 6,865 - - - 6,865
40,680 10,324 1,298,657 56,987 23,714 2,534,597
- - - - - 2,119,442 - - - - - 2,119,442
40,680$ 10,324$ 1,298,657$ 56,987$ 23,714$ 4,654,039$
-$ 214,379$ 22,000$ 12,894$ -$ 258,859$ - 113,632 - - - 113,632 - - - - - 8,079 - 328,011 22,000 12,894 - 380,570
- - - - - 2,119,442 40,680 (317,687) 1,276,657 44,093 23,714 2,154,027 40,680 (317,687) 1,276,657 44,093 23,714 4,273,469
40,680$ 10,324$ 1,298,657$ 56,987$ 23,714$ 4,654,039$
127

City of Sonoma, CaliforniaCombining Statement of Revenues, Expenses, and Changes in Net PositionInternal Service FundsFor the year ended June 30, 2015
Admin VehicleMIS Hearings ReplacementFund Fund Fund
OPERATING REVENUES:Interdepartmental charges 183,574$ -$ 187,500$
Total operating revenues 183,574 - 187,500
OPERATING EXPENSES:Salaries and benefits - - - Contractual services 780 - - Materials and supplies - - - Repairs and maintenance 86,826 - - Insurance - - - Allocated overhead 45,693 - -
Total operating expenses 133,299 - -
OPERATING INCOME (LOSS) 50,275 - 187,500
NONOPERATING REVENUES (EXPENSES):Interest revenue 1,962 47 9,641
Total non-operating revenues (expenses) 1,962 47 9,641
NET INCOME (LOSS) BEFORE TRANSFERS 52,237 47 197,141
Transfers in - - - Transfers out (60,000) - -
Total transfers (60,000) - -
CONTRIBUTED CAPITAL 40,544 - 1,179,793Change in net position 32,781 47 1,376,934
NET POSITION (Deficit):Beginning of year 403,296 1,091 1,391,863
End of year 436,077$ 1,138$ 2,768,797$
128

Employee Building Computer Hardscape Insurance Benefits Maintenance Loans Maintenance
Fund Fund Fund Fund Fund Totals
132,648$ 1,225,983 214,978$ -$ -$ 1,944,683$
132,648 1,225,983 214,978 - - 1,944,683
- 423,145 - - - 423,145 - - 329 - - 1,109 - - 115,999 2,057 - 118,056 - - - - - 86,826
147,723 5,228 - - - 152,951 - - - - - 45,693
147,723 428,373 116,328 2,057 - 827,780
(15,075) 797,610 98,650 (2,057) - 1,116,903
287 4,949 7,524 278 123 24,811
287 4,949 7,524 278 123 24,811
(14,788) 802,559 106,174 (1,779) 123 1,141,714
- 664,661 - - - 664,661 - - - - - (60,000) - 664,661 - - - 604,661
- - - - - 1,220,337 (14,788) 1,467,220 106,174 (1,779) 123 2,966,712
55,468 (1,784,907) 1,170,483 45,872 23,591 1,306,757
40,680$ (317,687)$ 1,276,657$ 44,093$ 23,714$ 4,273,469$
129

City of Sonoma, CaliforniaCombining Statement of Cash FlowsInternal Service FundsFor the year ended June 30, 2015
Admin Vehicle MIS Hearings ReplacementFund Fund Fund
CASH FLOWS FROM OPERATING ACTIVITIES:Cash received from interfund services provided 183,574$ -$ 976,264$ Cash paid to suppliers for goods and services (123,357) - - Cash paid to employees for services (413) - -
Net cash provided (used) by operating activities 59,804 - 976,264
CASH FLOWS FROM NONCAPITAL FINANCING ACTIVITIES:Transfers received - - - Transfers paid (60,000) - -
Net cash provided (used) by noncapital financing activities (60,000) - -
CASH FLOWS FROM CAPITAL AND RELATED FINANCING ACTIVITIES:Acquisition and construction of capital assets - - (899,105) Payments for loans receivable - - (393,767)
Net cash (used) by capital and related financing activities - - (1,292,872)
CASH FLOWS FROM INVESTING ACTIVITIES:Interest on investments 1,962 47 9,641
Net cash provided by investing activities 1,962 47 9,641
Net increase (decrease) in cash and cash equivalents 1,766 47 (306,967)
CASH AND CASH EQUIVALENTS:Beginning of year 403,353 9,170 603,099
End of year 405,119$ 9,217$ 296,132$
Reconciliation of income from operations to netcash provided (used) by operating activities:
Operating income (loss) 50,275$ -$ 187,500$ Adjustments to reconcile operating income to net cash provided by operating activities:
Depreciation - - - (Increase) decrease in current assets:
Accounts receivable - - - Deposits and other assets 3,999 - 788,764
Increase (decrease) in liabilities:Accounts payable 5,943 - - Compensated absences (413) - -
Net cash provided by operating activities 59,804$ -$ 976,264$
130

Employee Building Computer HardscapeInsurance Benefits Maintenance Loans Maintenance
Fund Fund Fund Fund Fund Totals
132,648$ 1,225,879$ 214,978$ -$ -$ 2,733,343$ (147,723) (717,143) (158,799) 3,042 - (1,143,980)
- (423,145) - - - (423,558) (15,075) 85,591 56,179 3,042 - 1,165,805
- 664,661 - - - 664,661 - (1,709,885) - - - (1,769,885) - (1,045,224) - - - (1,105,224)
- - - - - (899,105) - - - - - (393,767) - - - - - (1,292,872)
287 4,949 7,524 278 123 24,811 287 4,949 7,524 278 123 24,811
(14,788) (954,684) 63,703 3,320 123 (1,207,480)
55,468 954,684 1,234,954 53,667 23,591 3,337,986
40,680$ -$ 1,298,657$ 56,987$ 23,714$ 2,130,506$
(15,075)$ 797,610$ 98,650$ (2,057)$ -$ 1,116,903$
- - - - - -
- (104) - - - (104) - 29,622 - - - 822,385
- (741,537) (42,471) 5,099 - (772,966) - - - - - (413)
(15,075)$ 85,591$ 56,179$ 3,042$ -$ 1,165,805$
131
This page intentionally left blank.
132

Fund
Agency Funds
Cultural Fine Arts
Tree Trust
Public Art
Pool Scholarship Fund
Bid Deposits
Valley of the Moon Fire Protection District
AGENCY FUNDS
Description
Accounts for assets held to be used for cultural fine art programs.
Accounts for assets held to be used for planting and replacement of trees.
Accounts for assets held to be used for public art displays.
Accounts for deposits received from applicants for City Engineering, Special Events, and other special services.
Accounts for assets held to be used for services and programs in agreement with Sonoma Valley Health and Recreation Association (SVHRA).
Accounts for assets held as the fiscal agent for the Valley of the Moon Fire District.
133

City of Sonoma, CaliforniaCombining Statement of Assets and LiabilitiesAgency FundsJune 30, 2015
PoolCultural Tree ScholarhipFine Arts Trust Public Art Fund
ASSETS
Cash and investments 10,697$ 15,598$ 18,021$ 250,000$ Due from other funds - - - - Receivables:
Accounts - - - - Prepaids - - - - Capital Assets - - - -
Total assets 10,697$ 15,598$ 18,021$ 250,000$
LIABILITIES
Accounts payable -$ -$ -$ -$ Deposits payable - - - - Amounts held in trust 10,697 15,598 18,021 250,000
Total liabilities 10,697$ 15,598$ 18,021$ 250,000$
134
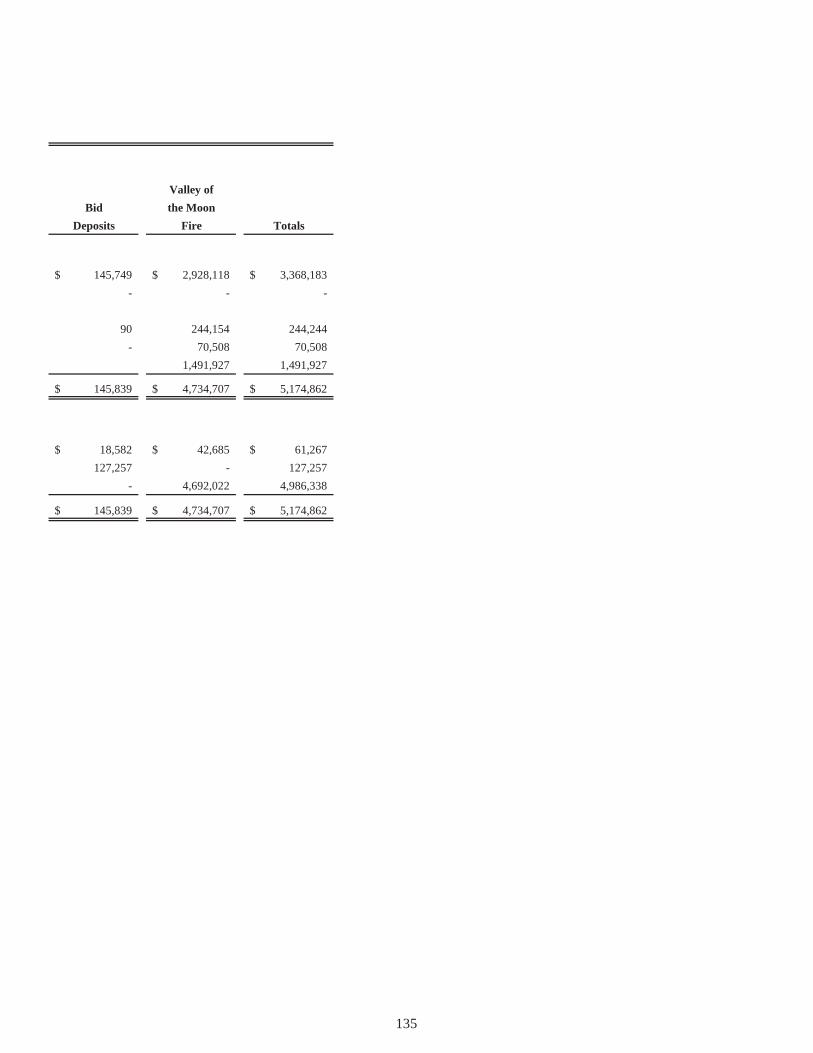
Valley ofBid the Moon
Deposits Fire Totals
145,749$ 2,928,118$ 3,368,183$ - - -
90 244,154 244,244 - 70,508 70,508
1,491,927 1,491,927
145,839$ 4,734,707$ 5,174,862$
18,582$ 42,685$ 61,267$ 127,257 - 127,257
- 4,692,022 4,986,338
145,839$ 4,734,707$ 5,174,862$
135
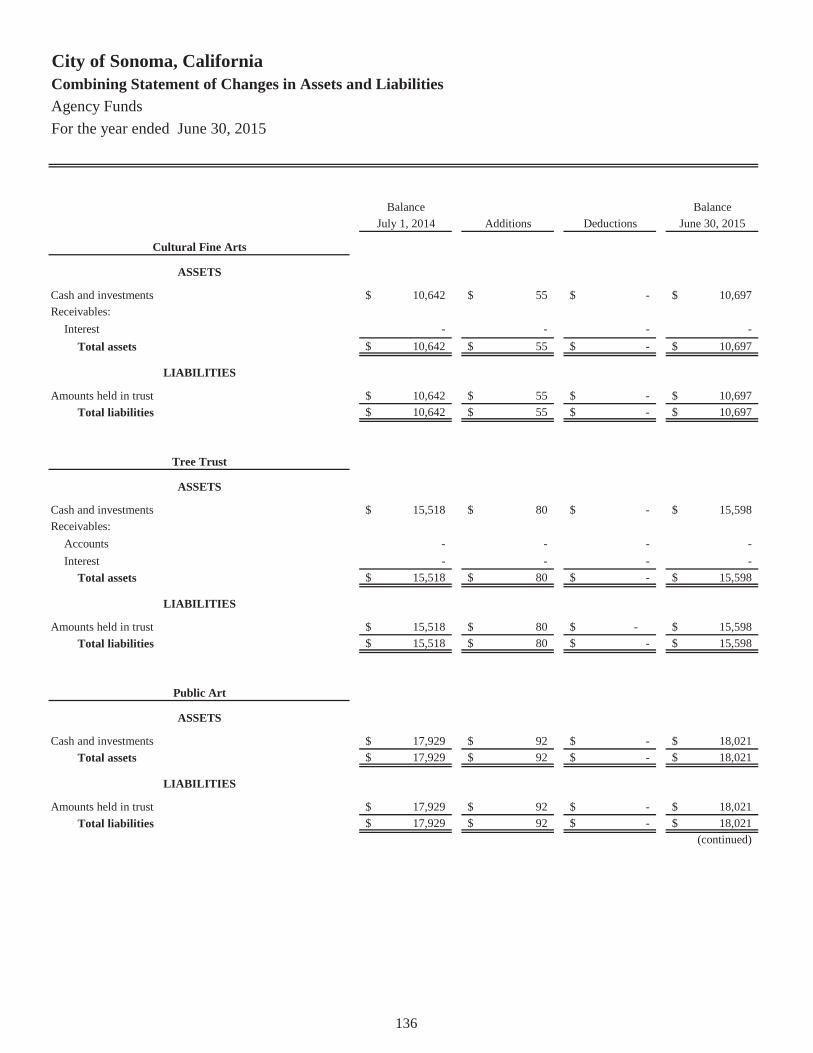
City of Sonoma, CaliforniaCombining Statement of Changes in Assets and LiabilitiesAgency FundsFor the year ended June 30, 2015
Balance BalanceJuly 1, 2014 Additions Deductions June 30, 2015
Cultural Fine Arts
ASSETS
Cash and investments 10,642$ 55$ -$ 10,697$ Receivables:
Interest - - - - Total assets 10,642$ 55$ -$ 10,697$
LIABILITIES
Amounts held in trust 10,642$ 55$ -$ 10,697$ Total liabilities 10,642$ 55$ -$ 10,697$
Tree Trust
ASSETS
Cash and investments 15,518$ 80$ -$ 15,598$ Receivables:
Accounts - - - - Interest - - - -
Total assets 15,518$ 80$ -$ 15,598$
LIABILITIES
Amounts held in trust 15,518$ 80$ -$ 15,598$ Total liabilities 15,518$ 80$ -$ 15,598$
Public Art
ASSETS
Cash and investments 17,929$ 92$ -$ 18,021$ Total assets 17,929$ 92$ -$ 18,021$
LIABILITIES
Amounts held in trust 17,929$ 92$ -$ 18,021$ Total liabilities 17,929$ 92$ -$ 18,021$
(continued)
136

City of Sonoma, CaliforniaCombining Statement of Changes in Assets and LiabilitiesAgency FundsFor the year ended June 30, 2015
Balance BalanceJuly 1, 2014 Additions Deductions June 30, 2015
Pool Sholarship Fund
ASSETS
Cash and investments -$ 250,000$ -$ 250,000$ Total assets -$ 250,000$ -$ 250,000$
LIABILITIES
Amount held in trust -$ 250,000$ -$ 250,000$ Total liabilities -$ 250,000$ -$ 250,000$
Bid Deposits
ASSETS
Cash and investments 154,450$ (8,701)$ -$ 145,749$ Receivables:
Accounts (1,168) 1,258 - 90 Total assets 153,282$ (7,443)$ -$ 145,839$
LIABILITIES
Accounts payable 3,863$ 14,719$ -$ 18,582$ Deposits payable 149,419 (22,162) - 127,257 Amounts held in trust - - - -
Total liabilities 153,282$ (7,443)$ -$ 145,839$
Valley of the Moon Fire
ASSETS
Cash and investments 2,642,375$ 2,928,118$ (2,642,375)$ 2,928,118$ Receivables:
Accounts 176,660 244,154 (176,660) 244,154 Prepaids 271,347 70,508 (271,347) 70,508 Capital Assets 1,039,210 1,491,927 (1,039,210) 1,491,927
Total assets 4,129,592$ 4,734,707$ (4,129,592)$ 4,734,707$
LIABILITIESAccounts payable 352,695$ -$ (310,010)$ 42,685$ Deposits payable - - - - Amounts held in trust 3,776,897 4,734,707 (3,819,582) 4,692,022
Total liabilities 4,129,592$ 4,734,707$ (4,129,592)$ 4,734,707$ (continued)
137
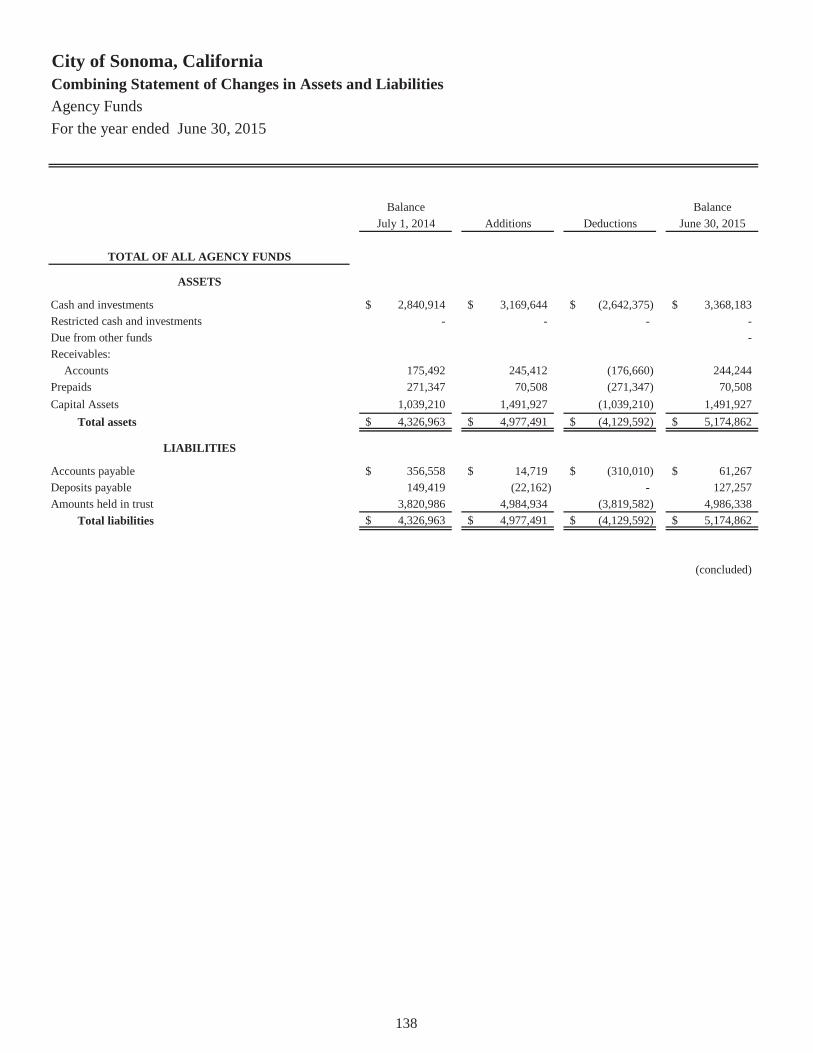
City of Sonoma, CaliforniaCombining Statement of Changes in Assets and LiabilitiesAgency FundsFor the year ended June 30, 2015
Balance BalanceJuly 1, 2014 Additions Deductions June 30, 2015
TOTAL OF ALL AGENCY FUNDS
ASSETS
Cash and investments 2,840,914$ 3,169,644$ (2,642,375)$ 3,368,183$ Restricted cash and investments - - - - Due from other funds - Receivables:
Accounts 175,492 245,412 (176,660) 244,244 Prepaids 271,347 70,508 (271,347) 70,508 Capital Assets 1,039,210 1,491,927 (1,039,210) 1,491,927
Total assets 4,326,963$ 4,977,491$ (4,129,592)$ 5,174,862$
LIABILITIES
Accounts payable 356,558$ 14,719$ (310,010)$ 61,267$ Deposits payable 149,419 (22,162) - 127,257 Amounts held in trust 3,820,986 4,984,934 (3,819,582) 4,986,338
Total liabilities 4,326,963$ 4,977,491$ (4,129,592)$ 5,174,862$
(concluded)
138

Page(s)
Financial Trends140-149
Revenue Capacity150-156
Debt Capacity157-159
Demographic and Economic Information160-161
Operating Information162-169
These schedules offer demographic and economic indicators to helpthe reader understand the environment within which the City'sfinancial activities take place.
These schedules contain service and infrastructure data to help thereader understand how the information in the City's financial reportrelates to the services the City provides and the activities it performs.
Sources: Unless otherwise noted, the information in these schedules is derived from theannual financial reports for the relevant year. Information was available beginning with theyear ended June 30, 2005 for the financial trend schedules.
STATISTICAL SECTION
Contents
These schedules contain trend information to help the readerunderstand how the City's financial performance and well-being havechanged over time.
City's ability to generate revenues. Property taxes, sales and usetaxes, charges for services, licenses, permits and fees andintergovernmental revenue are the City's most significant revenuesources.
These schedules contain information to help the reader assess theaffordability of the City's current levels of outstanding debt and theCity's ability to issue additional debt in the future.
This part of the City of Sonoma's comprehensive annual financial report presents detailedinformation as a context for understanding what the information in the financial statements,footnotes, and required supplementary information says about the City's overall financial health.
139
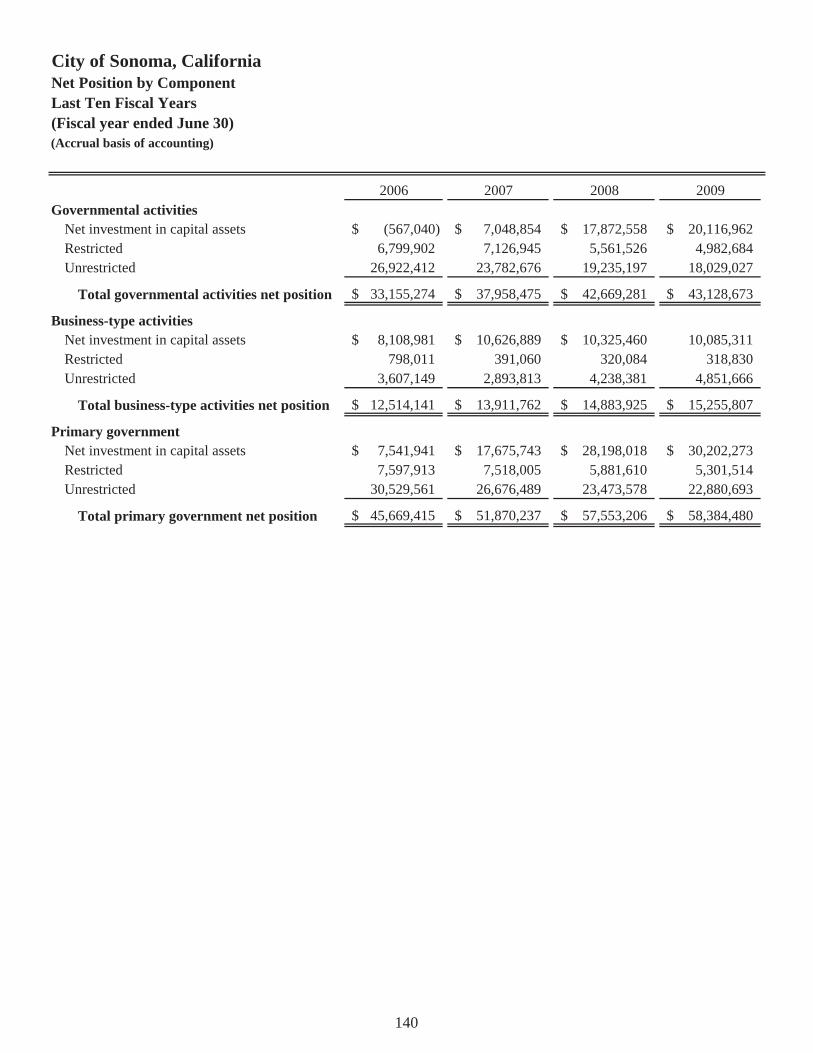
City of Sonoma, CaliforniaNet Position by ComponentLast Ten Fiscal Years(Fiscal year ended June 30)(Accrual basis of accounting)
2006 2007 2008 2009Governmental activities
Net investment in capital assets (567,040)$ 7,048,854$ 17,872,558$ 20,116,962$ Restricted 6,799,902 7,126,945 5,561,526 4,982,684 Unrestricted 26,922,412 23,782,676 19,235,197 18,029,027
Total governmental activities net position 33,155,274$ 37,958,475$ 42,669,281$ 43,128,673$
Business-type activitiesNet investment in capital assets 8,108,981$ 10,626,889$ 10,325,460$ 10,085,311 Restricted 798,011 391,060 320,084 318,830 Unrestricted 3,607,149 2,893,813 4,238,381 4,851,666
Total business-type activities net position 12,514,141$ 13,911,762$ 14,883,925$ 15,255,807$
Primary governmentNet investment in capital assets 7,541,941$ 17,675,743$ 28,198,018$ 30,202,273$ Restricted 7,597,913 7,518,005 5,881,610 5,301,514 Unrestricted 30,529,561 26,676,489 23,473,578 22,880,693
Total primary government net position 45,669,415$ 51,870,237$ 57,553,206$ 58,384,480$
140
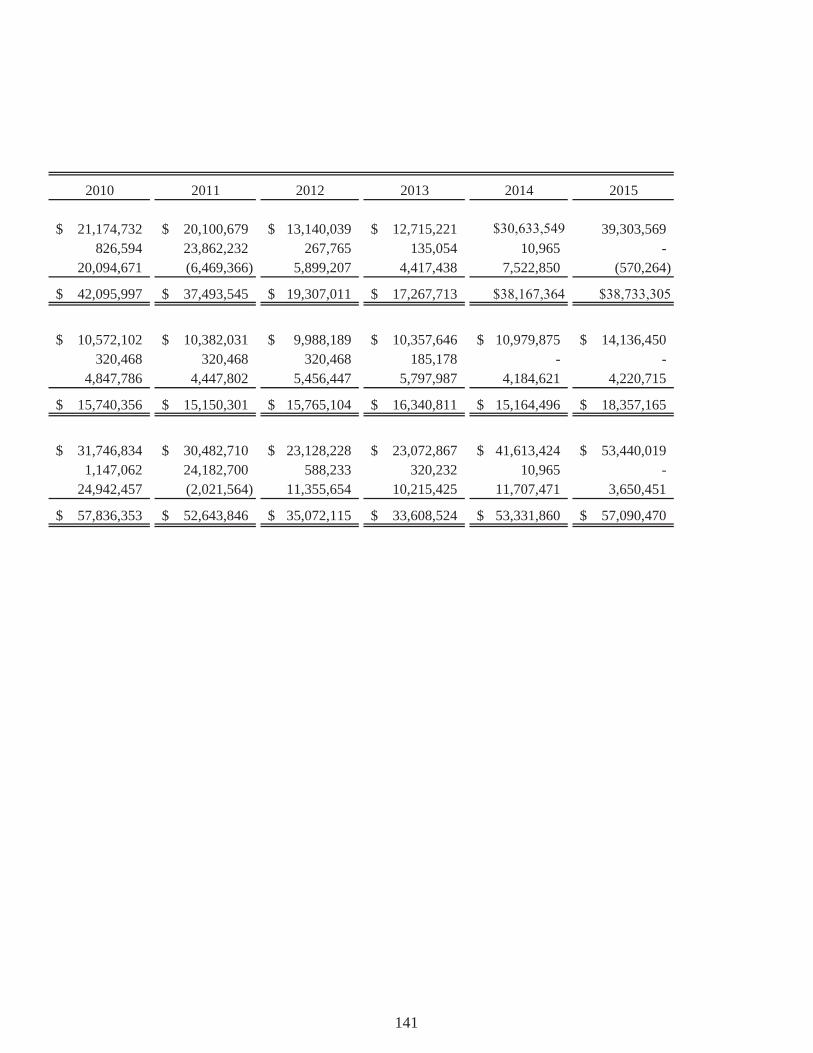
2010 2011 2012 2013 2014 2015
21,174,732$ 20,100,679$ 13,140,039$ 12,715,221$ $30,633,549 39,303,569 826,594 23,862,232 267,765 135,054 10,965 -
20,094,671 (6,469,366) 5,899,207 4,417,438 7,522,850 (570,264)
42,095,997$ 37,493,545$ 19,307,011$ 17,267,713$ $38,167,364 $38,733,305
10,572,102$ 10,382,031$ 9,988,189$ 10,357,646$ 10,979,875$ 14,136,450$ 320,468 320,468 320,468 185,178 - -
4,847,786 4,447,802 5,456,447 5,797,987 4,184,621 4,220,715
15,740,356$ 15,150,301$ 15,765,104$ 16,340,811$ 15,164,496$ 18,357,165$
31,746,834$ 30,482,710$ 23,128,228$ 23,072,867$ 41,613,424$ 53,440,019$ 1,147,062 24,182,700 588,233 320,232 10,965 -
24,942,457 (2,021,564) 11,355,654 10,215,425 11,707,471 3,650,451
57,836,353$ 52,643,846$ 35,072,115$ 33,608,524$ 53,331,860$ 57,090,470$
141
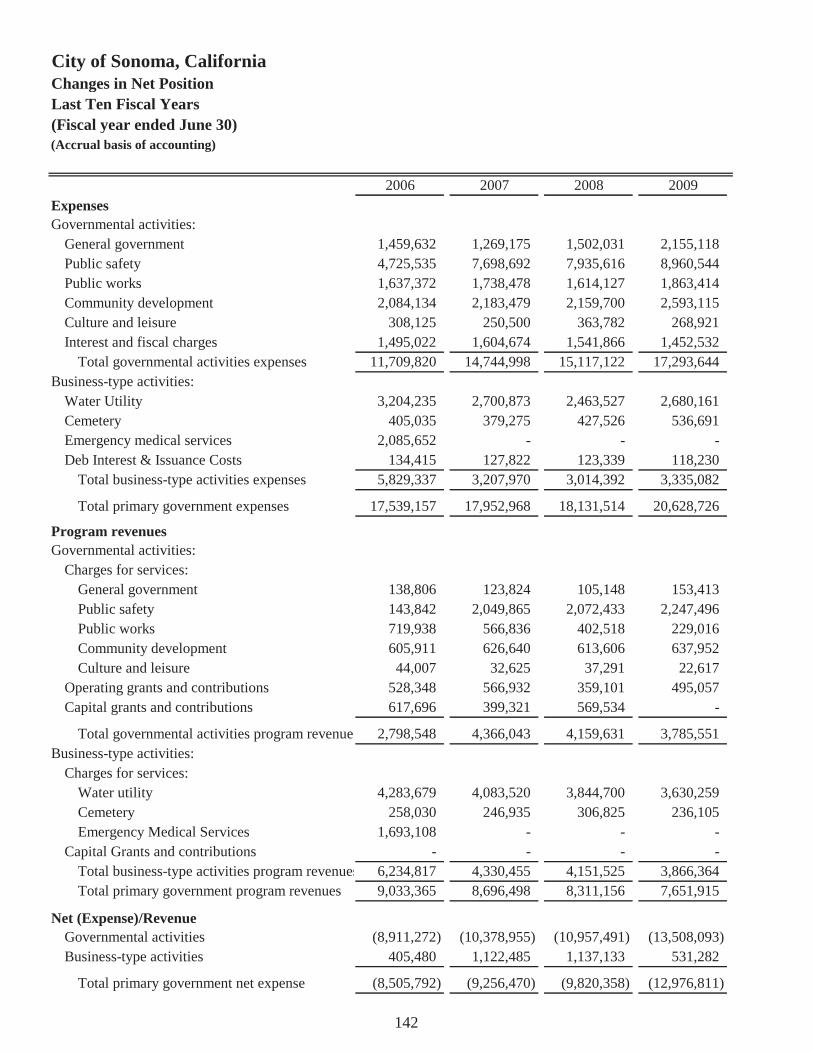
City of Sonoma, CaliforniaChanges in Net PositionLast Ten Fiscal Years(Fiscal year ended June 30)(Accrual basis of accounting)
2006 2007 2008 2009ExpensesGovernmental activities:
General government 1,459,632 1,269,175 1,502,031 2,155,118 Public safety 4,725,535 7,698,692 7,935,616 8,960,544 Public works 1,637,372 1,738,478 1,614,127 1,863,414 Community development 2,084,134 2,183,479 2,159,700 2,593,115 Culture and leisure 308,125 250,500 363,782 268,921 Interest and fiscal charges 1,495,022 1,604,674 1,541,866 1,452,532
Total governmental activities expenses 11,709,820 14,744,998 15,117,122 17,293,644 Business-type activities:
Water Utility 3,204,235 2,700,873 2,463,527 2,680,161 Cemetery 405,035 379,275 427,526 536,691 Emergency medical services 2,085,652 - - - Deb Interest & Issuance Costs 134,415 127,822 123,339 118,230
Total business-type activities expenses 5,829,337 3,207,970 3,014,392 3,335,082
Total primary government expenses 17,539,157 17,952,968 18,131,514 20,628,726
Program revenuesGovernmental activities:
Charges for services:General government 138,806 123,824 105,148 153,413 Public safety 143,842 2,049,865 2,072,433 2,247,496 Public works 719,938 566,836 402,518 229,016 Community development 605,911 626,640 613,606 637,952 Culture and leisure 44,007 32,625 37,291 22,617
Operating grants and contributions 528,348 566,932 359,101 495,057 Capital grants and contributions 617,696 399,321 569,534 -
Total governmental activities program revenues 2,798,548 4,366,043 4,159,631 3,785,551 Business-type activities:
Charges for services:Water utility 4,283,679 4,083,520 3,844,700 3,630,259 Cemetery 258,030 246,935 306,825 236,105 Emergency Medical Services 1,693,108 - - -
Capital Grants and contributions - - - - Total business-type activities program revenues 6,234,817 4,330,455 4,151,525 3,866,364 Total primary government program revenues 9,033,365 8,696,498 8,311,156 7,651,915
Net (Expense)/RevenueGovernmental activities (8,911,272) (10,378,955) (10,957,491) (13,508,093) Business-type activities 405,480 1,122,485 1,137,133 531,282
Total primary government net expense (8,505,792) (9,256,470) (9,820,358) (12,976,811)
142
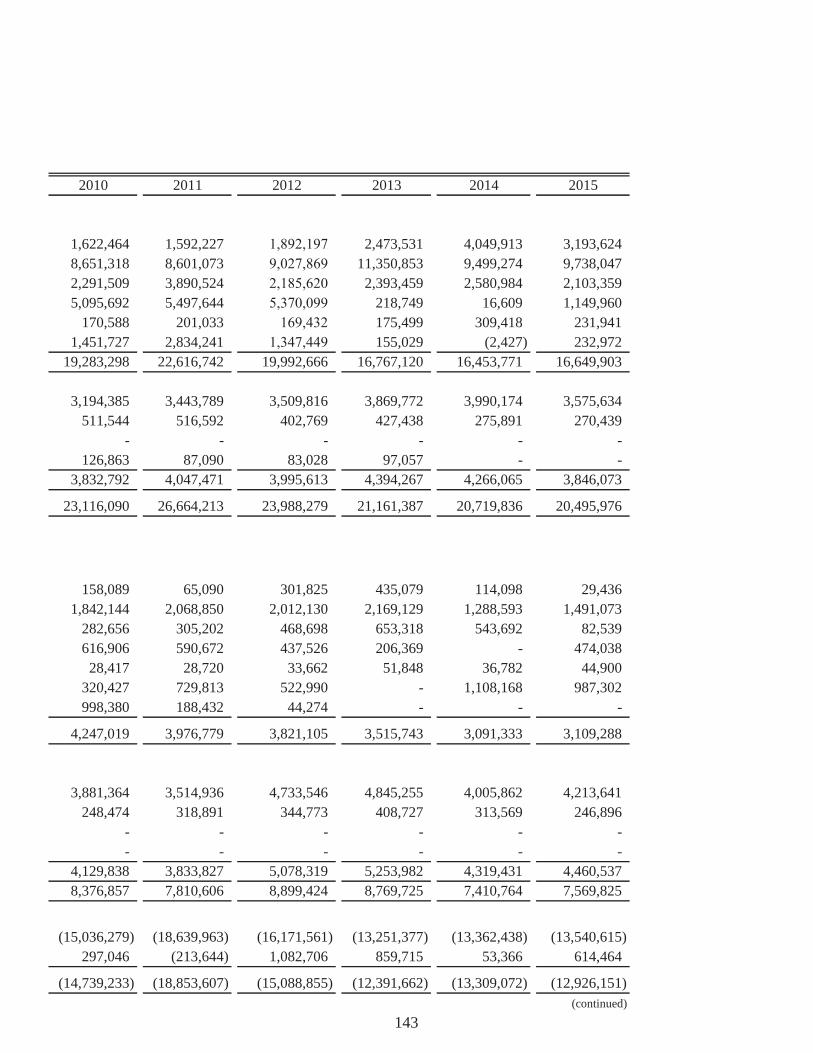
2010 2011 2012 2013 2014 2015
1,622,464 1,592,227 1,892,197 2,473,531 4,049,913 3,193,624 8,651,318 8,601,073 9,027,869 11,350,853 9,499,274 9,738,047 2,291,509 3,890,524 2,185,620 2,393,459 2,580,984 2,103,359 5,095,692 5,497,644 5,370,099 218,749 16,609 1,149,960
170,588 201,033 169,432 175,499 309,418 231,941 1,451,727 2,834,241 1,347,449 155,029 (2,427) 232,972
19,283,298 22,616,742 19,992,666 16,767,120 16,453,771 16,649,903
3,194,385 3,443,789 3,509,816 3,869,772 3,990,174 3,575,634 511,544 516,592 402,769 427,438 275,891 270,439
- - - - - - 126,863 87,090 83,028 97,057 - -
3,832,792 4,047,471 3,995,613 4,394,267 4,266,065 3,846,073
23,116,090 26,664,213 23,988,279 21,161,387 20,719,836 20,495,976
158,089 65,090 301,825 435,079 114,098 29,436 1,842,144 2,068,850 2,012,130 2,169,129 1,288,593 1,491,073
282,656 305,202 468,698 653,318 543,692 82,539 616,906 590,672 437,526 206,369 - 474,038 28,417 28,720 33,662 51,848 36,782 44,900
320,427 729,813 522,990 - 1,108,168 987,302 998,380 188,432 44,274 - - -
4,247,019 3,976,779 3,821,105 3,515,743 3,091,333 3,109,288
3,881,364 3,514,936 4,733,546 4,845,255 4,005,862 4,213,641 248,474 318,891 344,773 408,727 313,569 246,896
- - - - - - - - - - - -
4,129,838 3,833,827 5,078,319 5,253,982 4,319,431 4,460,537 8,376,857 7,810,606 8,899,424 8,769,725 7,410,764 7,569,825
(15,036,279) (18,639,963) (16,171,561) (13,251,377) (13,362,438) (13,540,615) 297,046 (213,644) 1,082,706 859,715 53,366 614,464
(14,739,233) (18,853,607) (15,088,855) (12,391,662) (13,309,072) (12,926,151) (continued)
143
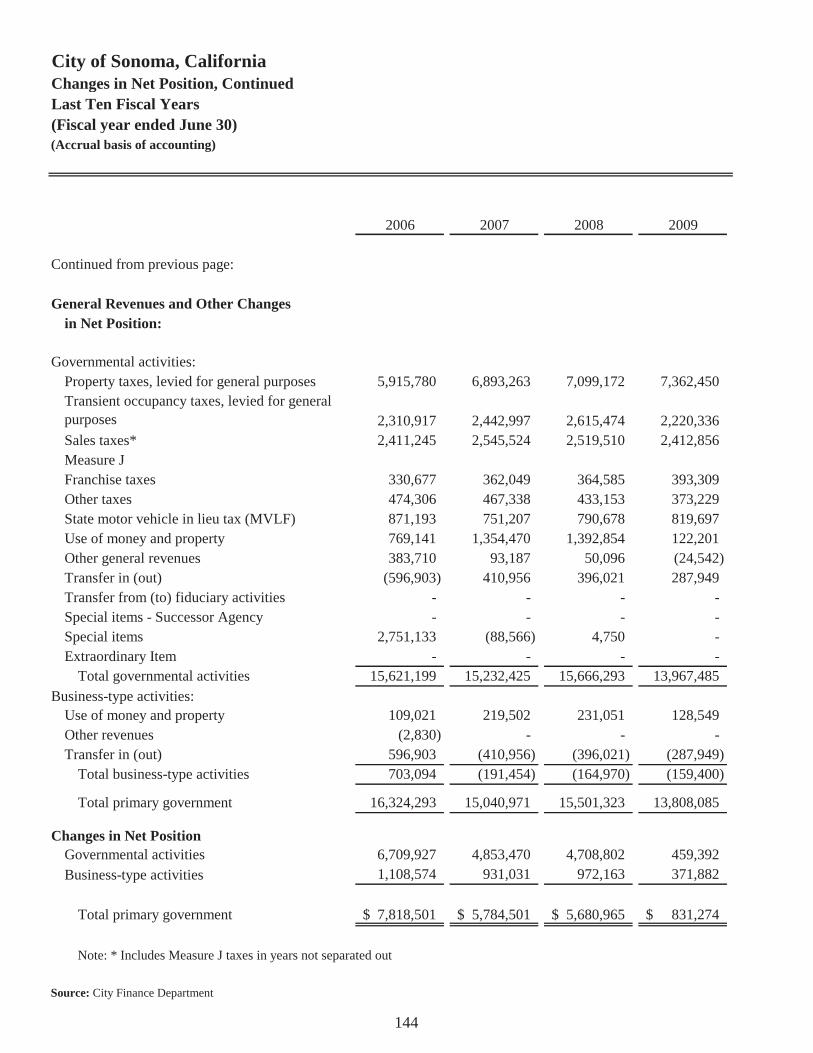
City of Sonoma, CaliforniaChanges in Net Position, ContinuedLast Ten Fiscal Years(Fiscal year ended June 30)(Accrual basis of accounting)
2006 2007 2008 2009
Continued from previous page:
General Revenues and Other Changesin Net Position:
Governmental activities:Property taxes, levied for general purposes 5,915,780 6,893,263 7,099,172 7,362,450 Transient occupancy taxes, levied for general purposes 2,310,917 2,442,997 2,615,474 2,220,336 Sales taxes* 2,411,245 2,545,524 2,519,510 2,412,856 Measure JFranchise taxes 330,677 362,049 364,585 393,309 Other taxes 474,306 467,338 433,153 373,229 State motor vehicle in lieu tax (MVLF) 871,193 751,207 790,678 819,697 Use of money and property 769,141 1,354,470 1,392,854 122,201 Other general revenues 383,710 93,187 50,096 (24,542) Transfer in (out) (596,903) 410,956 396,021 287,949 Transfer from (to) fiduciary activities - - - - Special items - Successor Agency - - - - Special items 2,751,133 (88,566) 4,750 - Extraordinary Item - - - -
Total governmental activities 15,621,199 15,232,425 15,666,293 13,967,485 Business-type activities:
Use of money and property 109,021 219,502 231,051 128,549 Other revenues (2,830) - - - Transfer in (out) 596,903 (410,956) (396,021) (287,949)
Total business-type activities 703,094 (191,454) (164,970) (159,400)
Total primary government 16,324,293 15,040,971 15,501,323 13,808,085
Changes in Net PositionGovernmental activities 6,709,927 4,853,470 4,708,802 459,392 Business-type activities 1,108,574 931,031 972,163 371,882
Total primary government 7,818,501$ 5,784,501$ 5,680,965$ 831,274$
Note: * Includes Measure J taxes in years not separated out
Source: City Finance Department
144

2010 2011 2012 2013 2014 2015
7,301,420 6,614,323 6,969,768 1,544,204 2,112,267 2,714,782
2,084,450 2,385,554 2,358,718 2,974,285 3,254,918 3,568,737 2,172,544 2,260,632 2,610,144 3,845,116 2,717,216 2,827,073
- 2,225,657 2,252,141 370,989 405,110 378,854 370,686 406,409 525,257 359,624 351,726 407,896 355,836 389,540 472,038 804,095 830,142 756,031 805,258 794,157 849,291 746,141 378,424 135,782 14,998 43,665 18,310 131,614 304,978 79,177 151,799 203,621 97,035 (33,386) 540,046 529,479 311,114 1,432,083 763,738
- - - - - (238,823) - - - - 20,682,556 - - - - - - 10,196,008 - - (16,534,666) 850,711 - -
13,937,491 14,070,935 (2,308,817) 11,224,007 34,262,089 24,045,587
154,117 163,633 61,576 27,103 202,402 305,634 - - - - -
33,386 (540,046) (529,479) (311,114) (1,432,083) (763,738) 187,503 (376,413) (467,903) (284,011) (1,229,681) (458,104)
14,124,994 13,694,522 (2,776,720) 10,939,996 33,032,408 23,587,483
(1,098,788) (4,569,028) (18,480,378) (2,027,370) 20,899,651 10,504,972 484,549 (590,057) 614,803 575,704 (1,176,315) 156,360
(614,239)$ (5,159,085)$ (17,865,575)$ (1,451,666)$ 19,723,336$ 10,661,332$
(concluded)
145
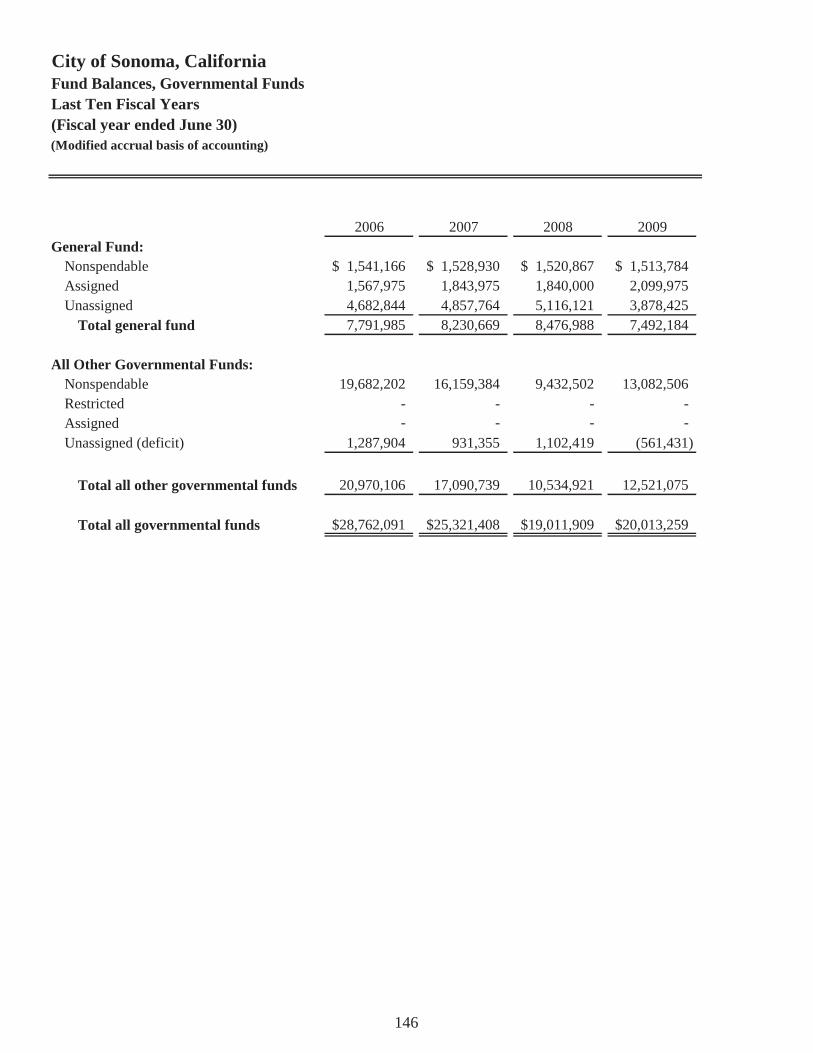
City of Sonoma, CaliforniaFund Balances, Governmental FundsLast Ten Fiscal Years(Fiscal year ended June 30)(Modified accrual basis of accounting)
2006 2007 2008 2009General Fund:
Nonspendable 1,541,166$ 1,528,930$ 1,520,867$ 1,513,784$ Assigned 1,567,975 1,843,975 1,840,000 2,099,975 Unassigned 4,682,844 4,857,764 5,116,121 3,878,425
Total general fund 7,791,985 8,230,669 8,476,988 7,492,184
All Other Governmental Funds:Nonspendable 19,682,202 16,159,384 9,432,502 13,082,506 Restricted - - - - Assigned - - - - Unassigned (deficit) 1,287,904 931,355 1,102,419 (561,431)
Total all other governmental funds 20,970,106 17,090,739 10,534,921 12,521,075
Total all governmental funds 28,762,091$ 25,321,408$ 19,011,909$ 20,013,259$
146

2010 2011 2012 2013 2014 2015
1,518,991$ 18,991$ 18,991$ 18,991$ 8,492$ 36,806$ 2,099,975 - - - - - 1,754,784 5,150,335 4,828,454 6,441,203 6,927,638 6,946,153 5,373,750 5,169,326 4,847,445 6,460,194 6,936,130 6,982,959
4,527,841 1,920,016 - - - - 21,942,216 267,769 135,054 10,965
- 1,216,338 648,092 560,032 513,093 353,371 6,815,818 (1,324,763) (1,519,903) (2,000,939) (971,836) (19,263)
11,343,659 23,753,807 (604,042) (1,305,853) (447,778) 334,108
16,717,409$ 28,923,133$ 4,243,403$ 5,154,341$ 6,488,352$ 7,317,067$
147

City of Sonoma, CaliforniaChanges in Fund Balances, Governmental FundsLast Ten Fiscal Years(Fiscal year ended June 30)(Modified accrual basis of accounting)
Revenues: 2006 2007 2008Taxes 12,196,679$ 13,315,366$ 13,779,725$ Licenses and permits 1,335,472 580,338 440,924 Fines and forfeitures 55,377 66,732 76,523 Intergovernmental 687,081 1,200,158 1,039,138 Use of money and property 1,479,056 2,082,312 2,119,008 Charges for services 82,868 1,957,865 1,919,739 Reimbursements - Sale of Property 2,811,492 6,186 4,750 Other revenues 460,367 67,123 50,096
Total revenues 19,108,392 19,276,080 19,429,903
Expenditures:Current:-
General government 1,085,349 1,113,720 1,232,791 Public safety 4,483,707 7,289,780 7,356,219 Public works 1,530,020 1,681,757 1,491,389 Community development 1,069,387 1,197,594 1,141,904 Culture and leisure 308,125 250,500 363,782
Capital Outlay 8,018,772 8,670,488 12,222,955 Debt Service:
Principal retirement 834,394 960,048 793,731 Interest and fiscal charges 1,489,767 1,612,674 1,543,427 Bond issuance costs - - -
Total expenditures 18,819,521 22,776,561 26,146,198
Reconciliation of Governmental RevenuesLess Expenditures to Fund Equity:
Revenues over (under) expenditures 288,871$ (3,500,481)$ (6,716,295)$ Other financing sources (uses):
Proceeds from sale of assets - - - Proceeds from issuance debt - - - Transfers from (to) the Successor Agency Private Purpose Trust - - - Transfers in 3,063,090 3,847,585 3,856,163 Transfers out (2,990,231) (3,465,610) (3,451,371) Total other financing sources (uses) 72,859 381,975 404,792
Extraordinary gain (loss) -$ -$ -$
Net change in fund balances 361,730$ (3,118,506)$ (6,311,503)$
Debt service as a percentage of noncapital expenditures 10% 8% 7%
148

2009 2010 2011 2012 2013 2014 201513,451,894$ 12,742,434$ 12,825,025$ 13,439,006$ 10,060,936$ 12,010,532$ 13,338,532$
274,508 339,942 364,171 518,454 399,554 60,750 36,904 68,068 100,841 96,285 81,668 91,239 72,941 106,457
672,364 1,499,521 865,355 559,015 421,799 805,912 604,380 825,648 1,450,616 1,180,678 651,840 448,331 148,610 133,368
2,193,769 1,775,514 1,755,180 1,955,458 2,289,023 1,906,605 2,092,103 - - - - - 23,494 82,504 - - - - - - -
228,836 145,728 1,908,656 312,030 135,767 209,939 14,704
17,715,087 18,054,596 18,995,350 17,517,471 13,846,649 15,238,783 16,408,952
1,763,696 1,427,859 1,373,732 1,607,249 2,253,139 2,806,182 1,697,946 8,331,541 8,604,796 8,443,394 8,780,054 11,306,638 9,293,207 9,342,063 1,727,394 2,224,132 2,331,859 2,136,544 2,556,846 1,607,707 1,723,031
635,162 3,729,242 4,973,078 3,435,716 218,809 16,609 1,149,960 268,921 170,588 201,033 169,432 184,693 309,418 231,941
3,570,252 2,771,516 3,136,331 2,835,022 297,342 1,082,417 781,751 -
849,684 895,483 10,465,665 1,525,572 277,839 351,749 506,249 1,454,395 1,450,232 1,530,740 1,433,188 48,707 98,008 92,550
- - 837,960 - 114,018 - -
18,601,045 21,273,848 33,293,792 21,922,777 17,258,031 15,565,297 15,525,491
(885,958)$ (3,219,252)$ (14,298,442)$ (4,405,306)$ (3,411,382)$ (326,514)$ 883,461$ - -
- - - - - - 25,000 - - 25,730,650 - 2,925,000 - - - 66,131 - 117,206 168,472 (238,823)
4,190,408 3,483,235 15,262,994 4,371,970 1,107,018 2,214,279 2,590,219 (3,428,938) (3,491,810) (14,559,369) (3,727,520) (723,596) (722,196) (2,431,142)
761,470 (8,575) 26,500,406 644,450 3,425,628 1,660,555 (54,746)
-$ -$ -$ (21,183,407)$ 908,630$ -$ -$
(124,488)$ (3,227,827)$ 12,201,964$ (24,944,263)$ 922,876$ 1,334,041$ 828,715$
7% 6% 65% 9% 2% 3% 4%
149
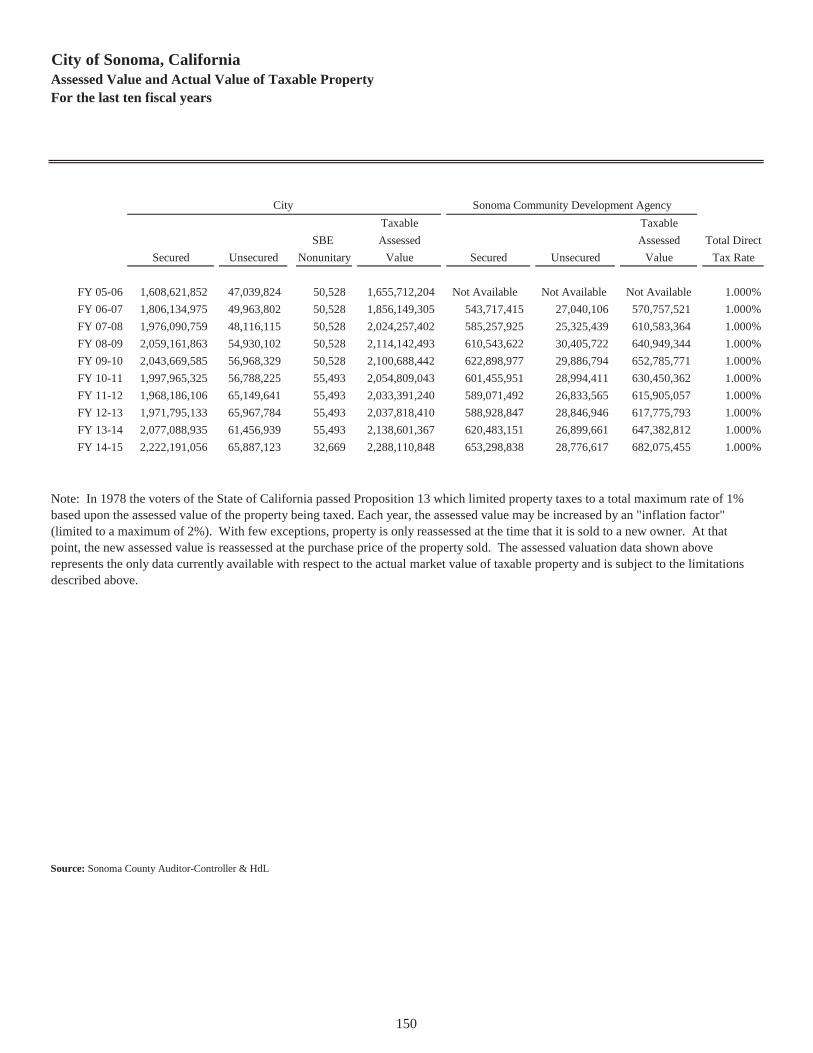
City of Sonoma, CaliforniaAssessed Value and Actual Value of Taxable PropertyFor the last ten fiscal years
Taxable TaxableSBE Assessed Assessed Total Direct
Secured Unsecured Nonunitary Value Secured Unsecured Value Tax Rate
FY 05-06 1,608,621,852 47,039,824 50,528 1,655,712,204 Not Available Not Available Not Available 1.000%FY 06-07 1,806,134,975 49,963,802 50,528 1,856,149,305 543,717,415 27,040,106 570,757,521 1.000%FY 07-08 1,976,090,759 48,116,115 50,528 2,024,257,402 585,257,925 25,325,439 610,583,364 1.000%FY 08-09 2,059,161,863 54,930,102 50,528 2,114,142,493 610,543,622 30,405,722 640,949,344 1.000%FY 09-10 2,043,669,585 56,968,329 50,528 2,100,688,442 622,898,977 29,886,794 652,785,771 1.000%FY 10-11 1,997,965,325 56,788,225 55,493 2,054,809,043 601,455,951 28,994,411 630,450,362 1.000%FY 11-12 1,968,186,106 65,149,641 55,493 2,033,391,240 589,071,492 26,833,565 615,905,057 1.000%FY 12-13 1,971,795,133 65,967,784 55,493 2,037,818,410 588,928,847 28,846,946 617,775,793 1.000%FY 13-14 2,077,088,935 61,456,939 55,493 2,138,601,367 620,483,151 26,899,661 647,382,812 1.000%FY 14-15 2,222,191,056 65,887,123 32,669 2,288,110,848 653,298,838 28,776,617 682,075,455 1.000%
Source: Sonoma County Auditor-Controller & HdL
City Sonoma Community Development Agency
Note: In 1978 the voters of the State of California passed Proposition 13 which limited property taxes to a total maximum rate of 1% based upon the assessed value of the property being taxed. Each year, the assessed value may be increased by an "inflation factor" (limited to a maximum of 2%). With few exceptions, property is only reassessed at the time that it is sold to a new owner. At that point, the new assessed value is reassessed at the purchase price of the property sold. The assessed valuation data shown above represents the only data currently available with respect to the actual market value of taxable property and is subject to the limitations described above.
150
This page intentionally left blank
151
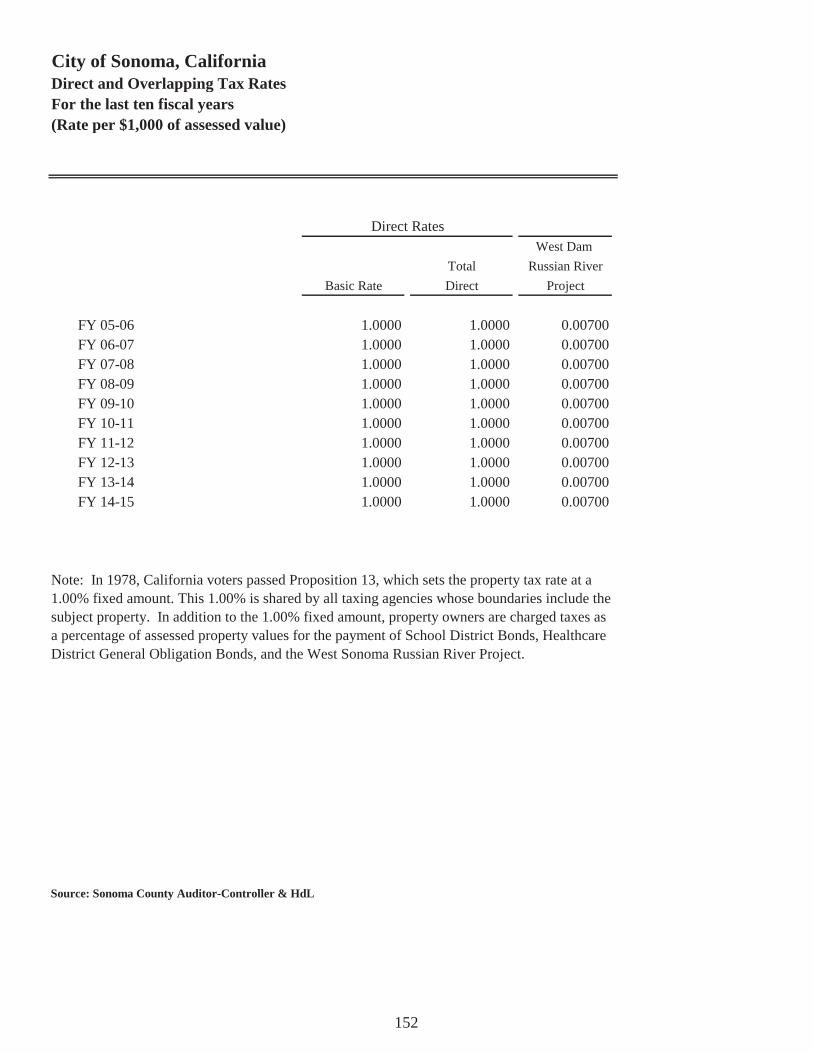
City of Sonoma, CaliforniaDirect and Overlapping Tax Rates For the last ten fiscal years(Rate per $1,000 of assessed value)
West Dam Total Russian River
Basic Rate Direct Project
FY 05-06 1.0000 1.0000 0.00700FY 06-07 1.0000 1.0000 0.00700FY 07-08 1.0000 1.0000 0.00700FY 08-09 1.0000 1.0000 0.00700FY 09-10 1.0000 1.0000 0.00700FY 10-11 1.0000 1.0000 0.00700FY 11-12 1.0000 1.0000 0.00700FY 12-13 1.0000 1.0000 0.00700FY 13-14 1.0000 1.0000 0.00700FY 14-15 1.0000 1.0000 0.00700
Source: Sonoma County Auditor-Controller & HdL
Direct Rates
Note: In 1978, California voters passed Proposition 13, which sets the property tax rate at a 1.00% fixed amount. This 1.00% is shared by all taxing agencies whose boundaries include the subject property. In addition to the 1.00% fixed amount, property owners are charged taxes as a percentage of assessed property values for the payment of School District Bonds, Healthcare District General Obligation Bonds, and the West Sonoma Russian River Project.
152

Sonoma County Sonoma Valley Sonoma County Total Healthcare District Unified Junior College Tax
G.O. Bonds Bond Bond Rate
0.00000 0.05500 0.02500 1.087000.00000 0.05250 0.02500 1.084500.00000 0.05000 0.02500 1.082000.00000 0.05840 0.02500 1.090400.02700 0.04800 0.02100 1.103000.02710 0.04800 0.02100 1.103100.02730 0.05350 0.02100 1.108800.02710 0.05200 0.01880 1.104900.03700 0.04850 0.01800 1.110500.03700 0.04850 0.01800 1.11050
(concluded)
Overlapping Rates
153

City of Sonoma, CaliforniaPrincipal Property Tax PayersCurrent Year and Ten Years Ago
Assessed % of Assessed % ofProperty Owner Valuation Rank Total Valuation Rank Total
Diamond Rock Sonoma 33,863,362$ 1 1.47% 33,082,744$ 1 1.98%Foley Family Wines 30,400,840 2 1.32% - - - S And N Company Sonoma Limited 22,066,036 3 0.96% 16,854,916 2 1.01%800 Oregon Street LLC 20,846,688 4 0.90% - - - Comcast of East San Fernando Valley LP 17,343,523 5 0.75% 11,631,955 5 0.70%Richard and Mary Ann Sebastiani Cuneo 14,190,413 6 0.61% 9,068,978 7 0.54%Maria J and Michael T Lounibos 11,905,870 7 0.52% - - - N William Jasper Jr Trust 10,956,552 8 0.47% - - - 29 East MacArthur Trust 10,842,386 9 0.47% 9,621,440 6 0.58%Avalon At Sonoma LLC 10,579,260 10 0.46% - - - Sebastiani Vineyards - - - 16,718,357 3 1.00%Westlake Development Company - - - 11,758,521 4 0.70%Auburn Manor Holding Corporation - - - 7,896,975 8 0.47%Sonoma Court Shops - - - 7,526,322 9 0.45%Tim Gamber - - - 6,879,392 10 0.41%
182,994,930$ 7.93% 131,039,600$ 7.84%
Source: County of Sonoma and HdL
2014 - 2015 2005 - 2006
154
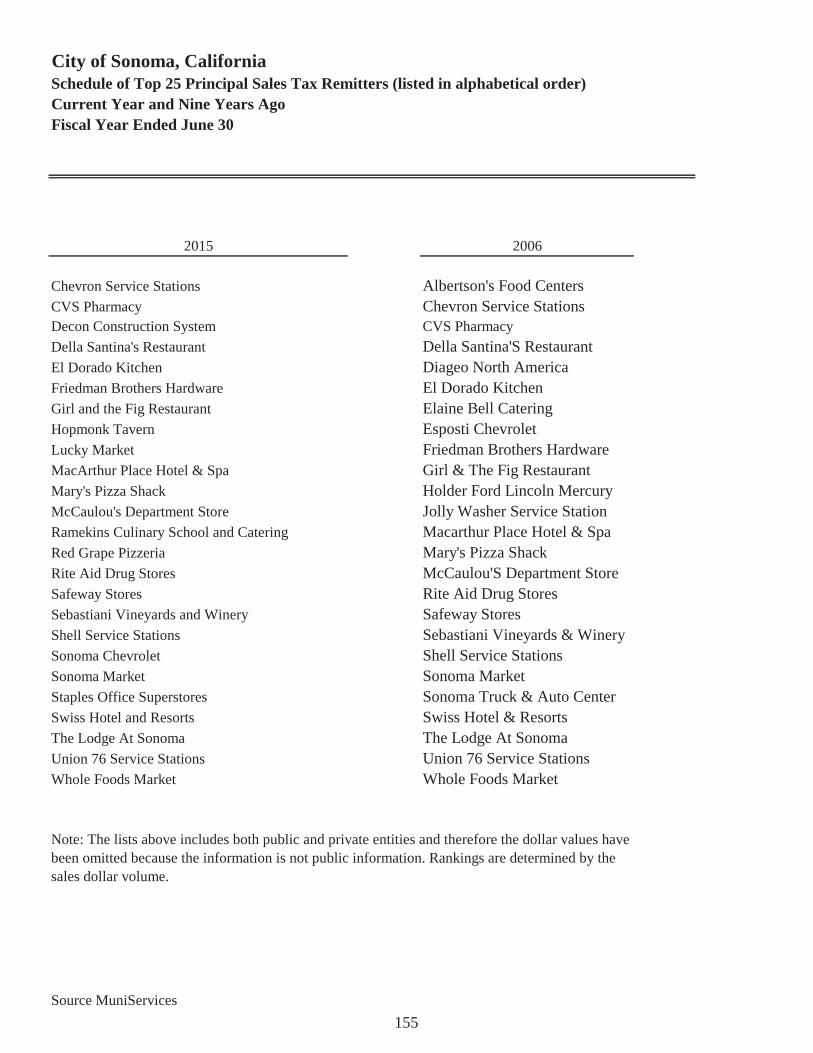
City of Sonoma, CaliforniaSchedule of Top 25 Principal Sales Tax Remitters (listed in alphabetical order)Current Year and Nine Years AgoFiscal Year Ended June 30
2015 2006
Chevron Service Stations Albertson's Food CentersCVS Pharmacy Chevron Service StationsDecon Construction System CVS PharmacyDella Santina's Restaurant Della Santina'S RestaurantEl Dorado Kitchen Diageo North AmericaFriedman Brothers Hardware El Dorado KitchenGirl and the Fig Restaurant Elaine Bell CateringHopmonk Tavern Esposti ChevroletLucky Market Friedman Brothers HardwareMacArthur Place Hotel & Spa Girl & The Fig RestaurantMary's Pizza Shack Holder Ford Lincoln MercuryMcCaulou's Department Store Jolly Washer Service StationRamekins Culinary School and Catering Macarthur Place Hotel & SpaRed Grape Pizzeria Mary's Pizza ShackRite Aid Drug Stores McCaulou'S Department StoreSafeway Stores Rite Aid Drug StoresSebastiani Vineyards and Winery Safeway StoresShell Service Stations Sebastiani Vineyards & WinerySonoma Chevrolet Shell Service StationsSonoma Market Sonoma MarketStaples Office Superstores Sonoma Truck & Auto CenterSwiss Hotel and Resorts Swiss Hotel & ResortsThe Lodge At Sonoma The Lodge At SonomaUnion 76 Service Stations Union 76 Service StationsWhole Foods Market Whole Foods Market
Source MuniServices
Note: The lists above includes both public and private entities and therefore the dollar values have been omitted because the information is not public information. Rankings are determined by the sales dollar volume.
155

City of Sonoma, CaliforniaProperty Tax Levies and CollectionsFor the last ten fiscal years
FiscalYear Taxes Levied Collections
Ended for the Percentage in Subsequent PercentageJune 30, Fiscal Year* Amount of Levy Years Amount of Levy
2006 2,521,965 2,521,965 100% - 2,521,965 100%2007 2,887,073 2,887,073 100% - 2,887,073 100%2008 3,019,199 3,019,199 100% - 3,019,199 100%2009 2,935,212 2,935,212 100% - 2,935,212 100%2010 2,664,676 2,664,676 100% - 2,664,676 100%2011 2,757,912 2,757,912 100% - 2,757,912 100%2012 2,884,143 2,884,143 100% - 2,884,143 100%2013 4,172,979 4,172,979 100% - 4,172,979 100%2014 3,497,523 3,497,523 100% - 3,497,523 100%2015 3,623,939 3,623,939 100% - 3,623,939 100%
Source: Sonoma County Auditor-Controller's Office
Collected within theFiscal Year of the Levy Total Collections to Date
City in the year of the levy with the County retaining any interest or penalties on uncollected balances.
156

City of Sonoma, CaliforniaDirect and Overlapping DebtCurrent Year June 30, 2015
2014-2015 Assessed Valuation: 2,288,110,848$
Total Debt City's Share of DIRECT AND OVERLAPPING TAX AND ASSESSMENT DEBT: 6/30/2015 (1) Debt 6/30/2015Sonoma County Joint Community College District 169,770,000$ 3.138% 5,327,383$ Sonoma Valley Unified School District 65,718,881 28.315% 18,608,301 Sonoma Valley HealthCare District 35,437,000 28.826% 10,215,070 Schell-Vista Fire Protection District Community Facilities District 1,659,351 5.860% 97,238 TOTAL DIRECT AND OVERLAPPING TAX AND ASSESSMENT DEBT 34,247,992$
DIRECT AND OVERLAPPING GENERAL FUND DEBT:Sonoma County Certificates of Participation 25,272,861$ 3.168% 800,644$ Sonoma County Pension Obligation Bonds 443,565,000 3.168% 14,052,139 Sonoma County Office of Education of Certificates of Participation 4,500,000 3.168% 47,520 Sonoma County Joint Community College District General Fund Obligation 1,575,000 3.138% 49,424 City of Sonoma General Fund Obligation 417,490 100% 417,490 City of Sonoma Pension Obligation Bonds 2,160,000 100% 2,160,000 TOTAL DIRECT AND OVERLAPPING GENERAL FUND DEBT 17,527,217.00$
OVERLAPPING TAX INCREMENT DEBT (Successor Agency) 38,960,000$ 97.714% 38,069,374$
TOTAL DIRECT DEBT 2,577,490$ TOTAL OVERLAPPING DEBT 87,267,093$
COMBINED TOTAL DEBT 89,844,583.00$ (2)
Ratios to 2014-15 Assessed Valuation:Total Overlapping Tax and Assessment Debt 1.50%Total Direct Debt ($2,577,490) 0.11%Combined Total Debt 3.93%
Ratio to Redevelopment Successor Agency Incremental Valuation ($819,396,241):Total Overlapping Tax Increment Debt 4.65%
Source: California Municipal Statistics
(1) The percentage of overlapping debt applicable to the city is estimated using taxable assessed property value. Applicable percentages were estimated by determining the portion of the overlapping district’s assessed value that is within the boundaries of the city divided by the district’s total taxable assessed value.
(2) Excludes tax and revenue anticipation notes, enterprise revenue, mortgage revenue and non-bonded capital lease obligations.
157
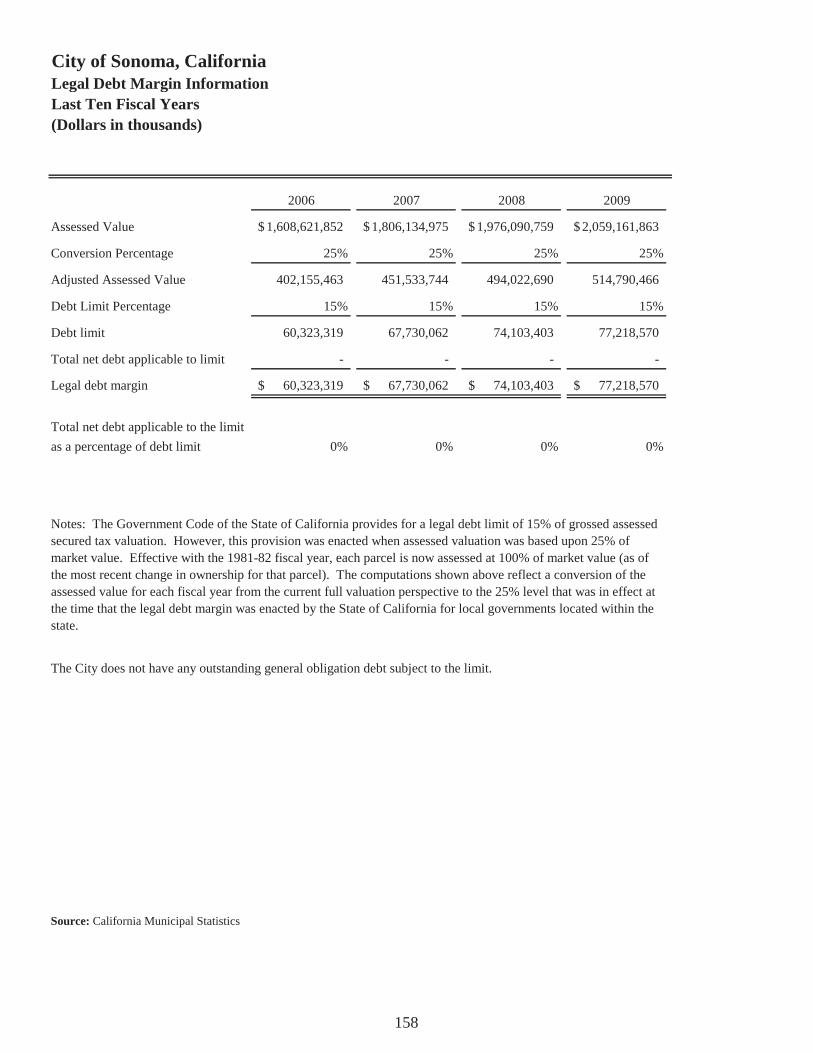
City of Sonoma, CaliforniaLegal Debt Margin InformationLast Ten Fiscal Years(Dollars in thousands)
2006 2007 2008 2009
Assessed Value 1,608,621,852$ 1,806,134,975$ 1,976,090,759$ 2,059,161,863$
Conversion Percentage 25% 25% 25% 25%
Adjusted Assessed Value 402,155,463 451,533,744 494,022,690 514,790,466
Debt Limit Percentage 15% 15% 15% 15%
Debt limit 60,323,319 67,730,062 74,103,403 77,218,570
Total net debt applicable to limit - - - -
Legal debt margin 60,323,319$ 67,730,062$ 74,103,403$ 77,218,570$
Total net debt applicable to the limitas a percentage of debt limit 0% 0% 0% 0%
Source: California Municipal Statistics
Notes: The Government Code of the State of California provides for a legal debt limit of 15% of grossed assessed secured tax valuation. However, this provision was enacted when assessed valuation was based upon 25% of market value. Effective with the 1981-82 fiscal year, each parcel is now assessed at 100% of market value (as of the most recent change in ownership for that parcel). The computations shown above reflect a conversion of the assessed value for each fiscal year from the current full valuation perspective to the 25% level that was in effect at the time that the legal debt margin was enacted by the State of California for local governments located within the state.
The City does not have any outstanding general obligation debt subject to the limit.
158
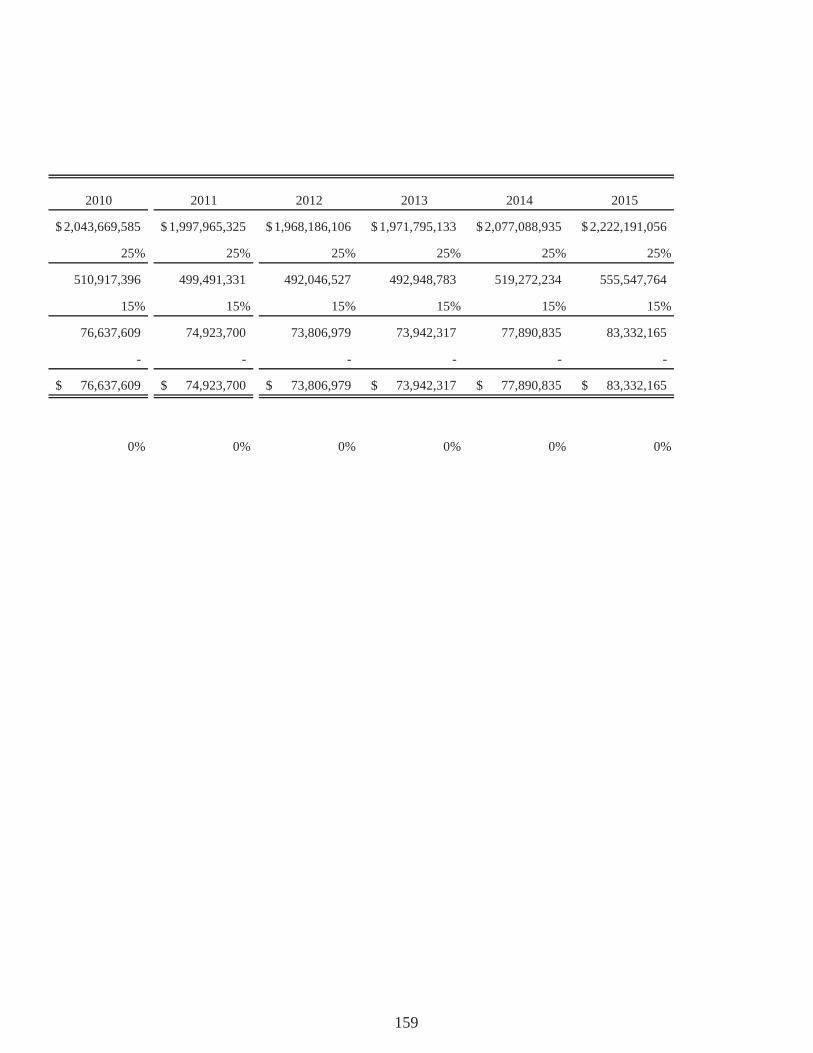
2010 2011 2012 2013 2014 2015
2,043,669,585$ 1,997,965,325$ 1,968,186,106$ 1,971,795,133$ 2,077,088,935$ 2,222,191,056$
25% 25% 25% 25% 25% 25%
510,917,396 499,491,331 492,046,527 492,948,783 519,272,234 555,547,764
15% 15% 15% 15% 15% 15%
76,637,609 74,923,700 73,806,979 73,942,317 77,890,835 83,332,165
- - - - - -
76,637,609$ 74,923,700$ 73,806,979$ 73,942,317$ 77,890,835$ 83,332,165$
0% 0% 0% 0% 0% 0%
159

City of Sonoma, CaliforniaDemographic and Economic StatisticsLast Ten Calendar Years
Personal Income Per CapitaCity of Sonoma Personal Income Unemployment Rate
Year Population (in thousands) City of Sonoma City of Sonoma
2005 9,792 $366,847 $37,464 3.62006 9,847 $401,973 $40,822 3.22007 9,887 $425,670 $43,053 3.52008 9,911 $431,815 $43,569 4.62009 9,984 $418,863 $41,953 7.92010 10,078 $410,366 $40,719 8.62011 10,665 $408,896 $38,340 8.02012 10,731 $440,776 $41,075 5.32013 10,801 $463,460 $42,909 4.22014 10,821 $488,319 $45,127 5.0
Sources
Population: California Department of Finance; Unemployment: California Employment Development Department
2000-2009 Income, Age, and Education Data: ESRI-Demographic estimates are based on last Census data. Projections are developed by incorporating all the prior census data released to date. Demographic data is totaled from Census Block Groups that overlap the City's boundaries. 2010 and later- Income, Age, and Education Data-US Census Bureaua, most recent American Community Survey
160

City of Sonoma, CaliforniaPrincipal EmployersCurrent Year
Percentageof Top 10
Employer Employees Rank Employment
Sonoma Valley Hospital 400 1 22.86%Sonoma Valley Unified School District 280 2 16.00%The Lodge at Sonoma 240 3 13.71%Sonoma Market 200 4 11.43%MacArthur Place 130 5 7.43%Gloria Ferrer Winery 100 6 5.71%Whole Foods 100 6 5.71%Safeway 100 6 5.71%Sebastiani Winery 100 6 5.71%The Girl and The Fig 100 6 5.71%
Total 1,750
Source: City of Sonoma
2014 - 2015
161
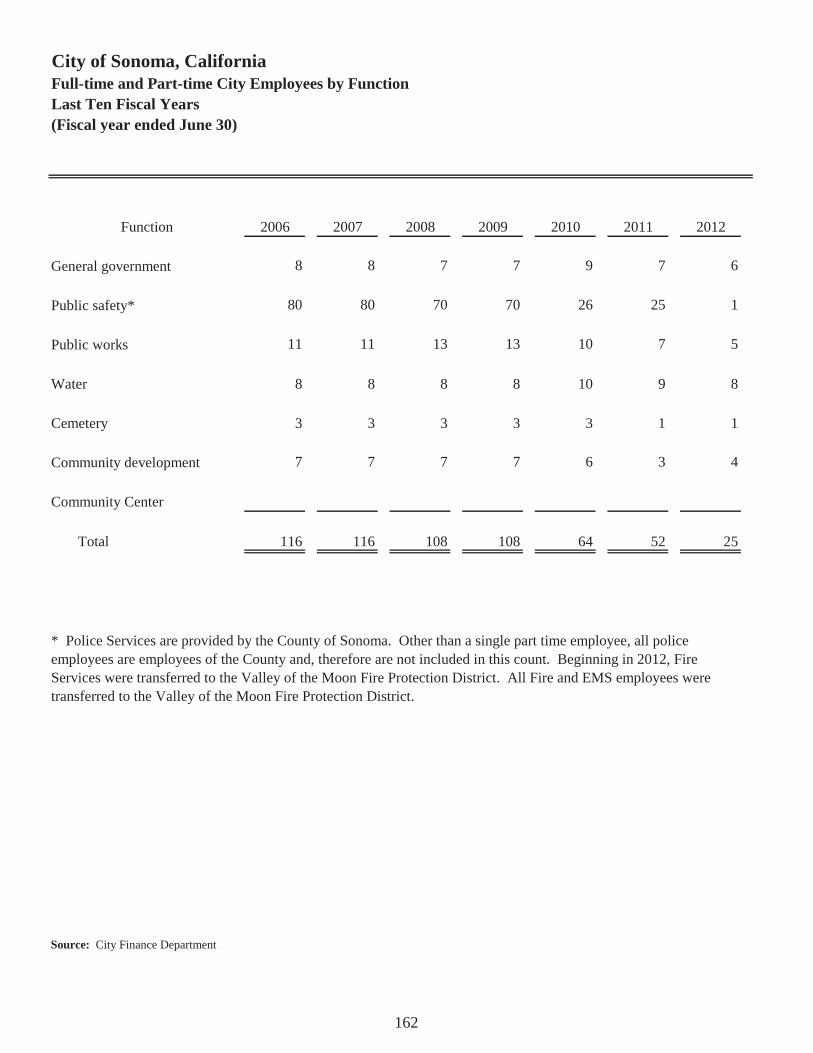
City of Sonoma, CaliforniaFull-time and Part-time City Employees by FunctionLast Ten Fiscal Years(Fiscal year ended June 30)
Function 2006 2007 2008 2009 2010 2011 2012
General government 8 8 7 7 9 7 6
Public safety* 80 80 70 70 26 25 1
Public works 11 11 13 13 10 7 5
Water 8 8 8 8 10 9 8
Cemetery 3 3 3 3 3 1 1
Community development 7 7 7 7 6 3 4
Community Center
Total 116 116 108 108 64 52 25
Source: City Finance Department
* Police Services are provided by the County of Sonoma. Other than a single part time employee, all police employees are employees of the County and, therefore are not included in this count. Beginning in 2012, Fire Services were transferred to the Valley of the Moon Fire Protection District. All Fire and EMS employees were transferred to the Valley of the Moon Fire Protection District.
162
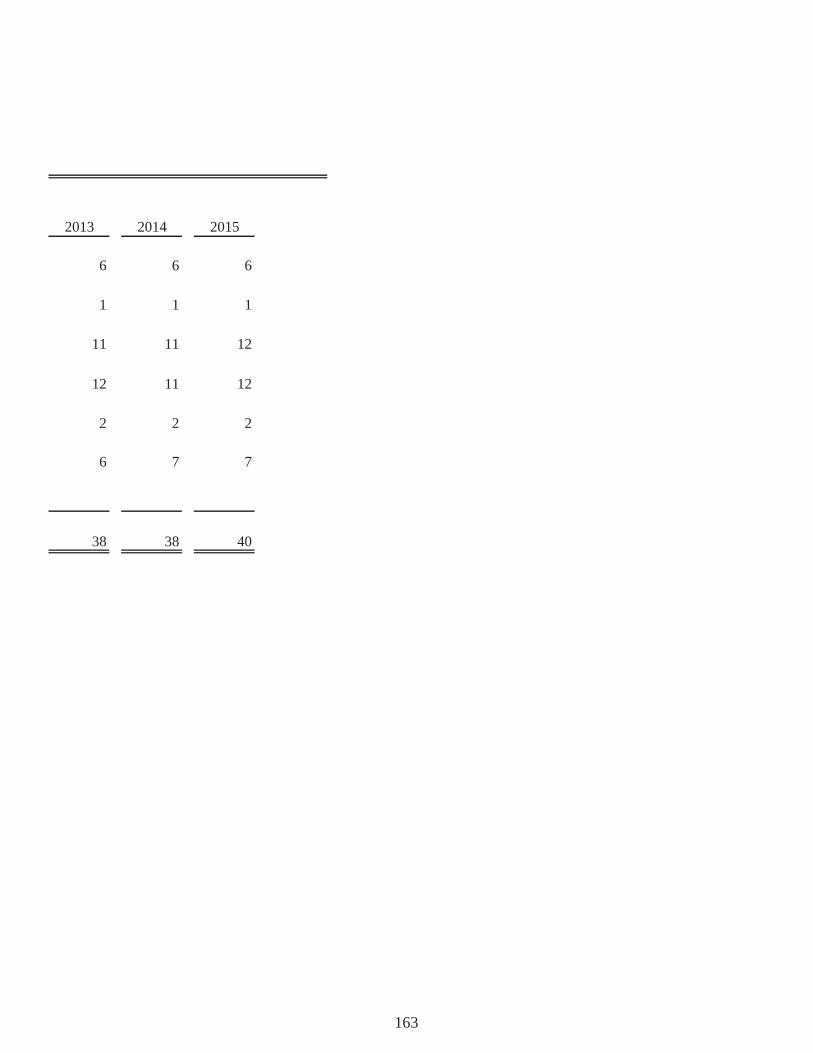
2013 2014 2015
6 6 6
1 1 1
11 11 12
12 11 12
2 2 2
6 7 7
38 38 40
163

City of Sonoma, CaliforniaOperating Indicators by FunctionLast Six Fiscal Years(Fiscal year ended June 30)
Function 2006 2007 2008 2009
Police1
Median Response Time to Priority Calls1 5 min 13 sec 4 min 38 sec 4 min 43 sec 4 min 34 secArrests 782 719 814 760DUI Arrests 59 71 80 147Parking citations issued 1,829 1,436 1,681 3,043
Fire 2
Calls for Service (Fire) 34 29 32 40Calls for Service (Medical) 997 1,317 1,396 1,298Calls for Service (All Other) 405 311 332 327
Public worksPavement Condition Index (PCI)3 80 79 79 79
Water4
Water Service Line Breaks / Leaks 26 33 18 19Water Main Breaks / Leaks 2 4 0 1Complaints Reported 5 5 5 4
Building:Permits Issued 572 512 401 357Building Inspections 3,331 2,838 1,856 1,362Plan Checks 492 593 # 472 344Residential Unit Finals 63 116 20 18Valuation 31,382,041 25,141,940 16,492,938 7,488,818
1. Police Data is issued on a calendar year basis. 2. Fire Department Data is issued on a calendar year basis3. Pavement Condition Index as reported to Metropolitan Transportation Commission.
Source: City Finance Department
4. From Division of Drinking Water Annual Reports
164
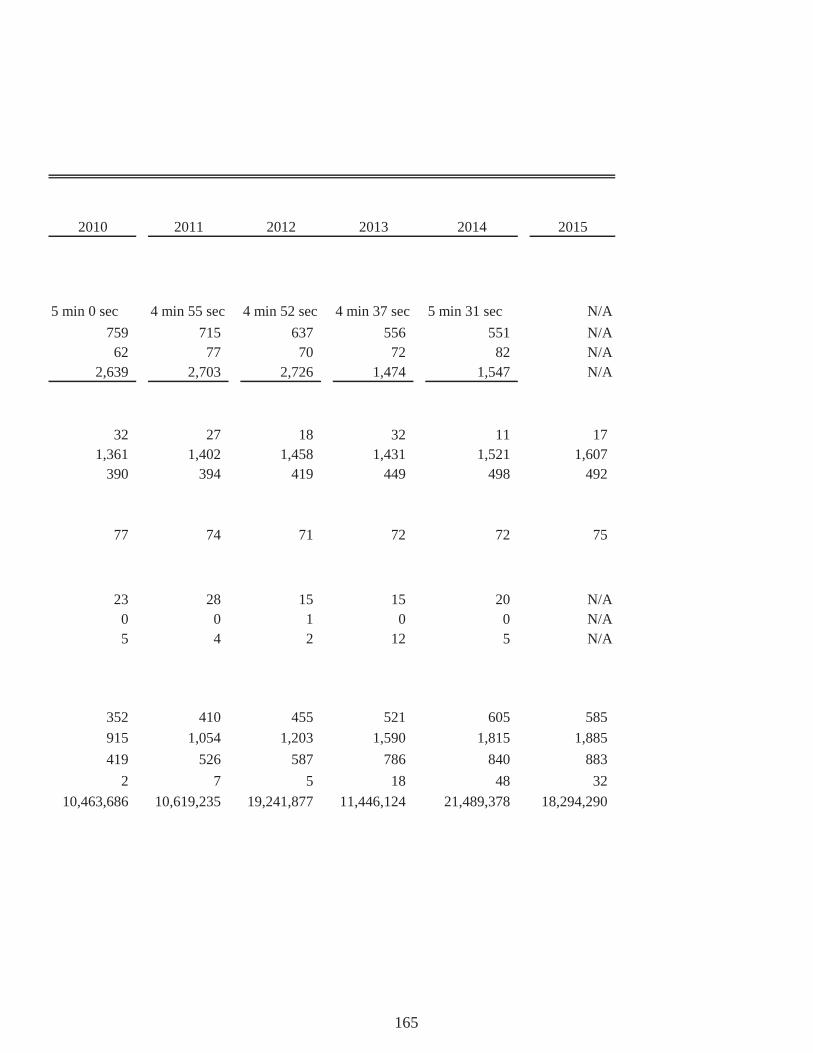
2010 2011 2012 2013 2014 2015
5 min 0 sec 4 min 55 sec 4 min 52 sec 4 min 37 sec 5 min 31 sec N/A759 715 637 556 551 N/A62 77 70 72 82 N/A
2,639 2,703 2,726 1,474 1,547 N/A
32 27 18 32 11 171,361 1,402 1,458 1,431 1,521 1,607
390 394 419 449 498 492
77 74 71 72 72 75
23 28 15 15 20 N/A0 0 1 0 0 N/A5 4 2 12 5 N/A
352 410 455 521 605 585915 1,054 1,203 1,590 1,815 1,885419 526 587 786 840 883
2 7 5 18 48 3210,463,686 10,619,235 19,241,877 11,446,124 21,489,378 18,294,290
165

City of Sonoma, CaliforniaCapital Asset Statistics by FunctionLast Six Fiscal Years(Fiscal year ended June 30)
Function 2006 2007 2008 2009 2010
Police1
Stations 1 1 1 1 1
Fire2
Fire stations 1 1 1 1 1
Public worksStreets (miles) N/A N/A N/A N/A N/ABridges N/A N/A N/A N/A N/ACatch Basins N/A N/A N/A N/A N/AParks N/A N/A N/A N/A N/A
Cemetery:# of Cemeteries 3 3 3 3 3
Water:Service Connections / Customers N/A N/A N/A 3900 3900Valves N/A N/A N/A N/A N/AFire Hydrants N/A N/A N/A 476 476Water Tanks N/A N/A N/A 6 6Wells N/A N/A N/A 7 7Booster Pump Stations N/A N/A N/A 2 2Water Main (miles) N/A N/A N/A 49 49
Source: City Finance Department
2. Beginning in 2012, Fire Services were transferred to the Valley of the Moon Fire Protection District. The City owns all assets associated with providing fire and EMS services within City limits.
1. Police Services are provided by the County of Sonoma. The City owns assets such as the Police Station and some equipment. Other equipment such as vehicles is owned by the County and leased to the City.
166

2011 2012 2013 2014 2015
1 1 1 1 1
1 1 1 1 1
N/A N/A 33.8 33.8 33.8N/A N/A 11 11 11N/A N/A 485 485 485N/A 17 17 17 17
3 3 3 3 3
3900 4300 N/A 4383 4367N/A N/A N/A 1437 1437476 476 N/A 476 4766 6 N/A 6 67 7 N/A 7 72 2 N/A 2 2
49 49 N/A 49 49
167

City of Sonoma, CaliforniaCapital Asset Statistics by FundsLast Six Fiscal Years(Fiscal year ended June 30)
2010 2011 2012 2013
Governmental-typeLand 15,308,268$ 13,858,268$ 2,901,725$ 2,901,724$ Construction-in-progress 1,288,119 1,029,988 - 75,667 Buildings & Improvements 20,944,077 21,183,915 7,963,822 7,777,032 Infrastructure 21,220,898 22,676,786 6,042,115 6,422,255 Equipment & Vehicles 5,404,995 5,629,140 5,317,195 5,493,506 Total 64,166,357 64,378,097 22,224,857 22,670,184
Accumulated depreciationLand - - - - Buildings & Improvements 6,796,804 4,747,978 4,851,206 4,996,824 Infrastructure 1,754,328 682,747 800,753 922,626 Equipment & Vehicles 2,934,927 2,988,537 3,385,702 3,593,904 Total Accumulated depreciation - 8,419,262 9,037,661 9,513,354
Total Governmental net capital assets 64,166,357 55,958,835 13,187,196 13,156,830
Business-type ActivitiesLand 960,472 960,472 960,472 960,472 Construction in Progress - 60,504 - 83,735 Buildings & Improvements 21,015,514 21,143,368 21,203,872 21,566,493 Infrastructure 25,572 25,572 25,572 25,572 Equipment & Vehicles 911,680 911,680 942,455 942,455 Total 22,913,238 23,101,596 23,132,371 23,578,727
Accumulated depreciationLand - - - - Construction in ProgressBuildings & Improvements 8,554,104 8,809,501 8,813,736 9,148,366 Infrastructure 1,046,877 1,222,982 1,224,192 1,578,822 Equipment & Vehicles 745,795 783,859 783,859 818,578 Total accumulated depreciation 10,346,776 10,816,342 10,821,787 11,545,766
Total Business-type net capital assets 12,566,462$ 12,285,254$ 12,310,584$ 12,032,961$
168

2014 2015
4,868,520$ 5,141,367$ 858,520 594,952
18,598,131 24,086,575 22,858,229 19,849,532 5,166,119 4,867,626
52,349,519 54,540,052
- - 9,523,842 7,715,259 5,972,046 2,402,620 3,322,592 2,750,504
18,818,480 12,868,383
33,531,039 41,671,669
960,472 960,472 981,294 458,469
16,876,552 3,136,523 4,715,513 20,850,377
942,455 1,297,993 24,476,286 26,703,834
- - - -
10,467,362 1,005,371 671,935 9,141,897 872,114 865,058
12,011,411 11,012,326
12,464,875$ 15,691,508$
169

This page intentionally left blank.
170
7080 Donlon Way, Suite 204, Dublin, CA 94568 ● phone (925) 556-6200 ● fax: (925) 556-6201 www.jjacpa.com
REPORT ON INTERNAL CONTROL OVER FINANCIAL REPORTING AND ON COMPLIANCE AND OTHER MATTERS BASED ON AN AUDIT OF FINANCIAL
STATEMENTS PERFORMED IN ACCORDANCE WITH GOVERNMENT AUDITING STANDARDS
Independent Auditor’s Report
To the Honorable Mayor and City Council of the City of Sonoma Sonoma, California
We have audited, in accordance with the auditing standards generally accepted in the United States of America and the standards applicable to financial audits contained in Government Auditing Standards issued by the Comptroller General of the United States, the financial statements of the governmental activities, the business-type activities, each major fund, the aggregate remaining fund information, and the budgetary comparison information of the City of Sonoma (City), as of and for the year ended June 30, 2015, and the related notes to the financial statements, which collectively comprise the City’s basic financial statements, and have issued our report thereon dated June 28, 2016.
Internal Control Over Financial Reporting
In planning and performing our audit of the financial statements, we considered the City’s internal control over financial reporting (internal control) to determine the audit procedures that are appropriate in the circumstances for the purpose of expressing our opinions on the financial statements, but not for the purpose of expressing an opinion on the effectiveness of the City’s internal control. Accordingly, we do not express an opinion on the effectiveness of the City’s internal control.
A deficiency in internal control exists when the design or operation of a control does not allow management or employees, in the normal course of performing their assigned functions, to prevent, or detect and correct, misstatements on a timely basis. A material weakness is a deficiency, or a combination of deficiencies, in internal control, such that there is a reasonable possibility that a material misstatement of the entity’s financial statements will not be prevented, or detected and corrected on a timely basis. A significant deficiency is a deficiency, or a combination of deficiencies, in internal control that is less severe than a material weakness, yet important enough to merit attention by those charged with governance.
Our consideration of internal control was for the limited purpose described in the first paragraph of this section and was not designed to identify all deficiencies in internal control that might be material weaknesses or significant deficiencies. Given these limitations, during our audit we did not identify any deficiencies in internal control that we consider to be material weaknesses. However, material weaknesses may exist that have not been identified.
Compliance and Other Matters
As part of obtaining reasonable assurance about whether the City’s financial statements are free from material misstatement, we performed tests of its compliance with certain provisions of laws, regulations, contracts, and grant agreements, noncompliance with which could have a direct and material effect on the determination of financial statement amounts. However, providing an opinion on compliance with those provisions was not an objective of our audit, and accordingly, we do not express such an opinion. The results of our tests disclosed no instances of noncompliance or other matters that are required to be reported under Government Auditing Standards.
Purpose of this Report
The purpose of this report is solely to describe the scope of our testing of internal control and compliance and the results of that testing, and not to provide an opinion on the effectiveness of the entity’s internal control or on compliance. This report is an integral part of an audit performed in accordance with Government Auditing Standards in considering the entity’s internal control and compliance. Accordingly, this communication is not suitable for any other purpose.
JJACPA, Inc. June 28, 2016 JJACPA, Inc. Dublin, CA