comprehensive annual financial report s-4 schedule of delinquent prop erty taxes receivable 153 s-5...
TRANSCRIPT

Comprehensive Annual Financial ReportFiscal Year Ended June 30, 2014

ARLINGTON COUNTY, VIRGINIA
Comprehensive Annual Financial Report
FISCAL YEAR 2014
(July 1, 2013 - June 30, 2014)
DEPARTMENT OF MANAGEMENT AND FINANCE
Michelle G. Cowan, Director Barbara A. Wiley, Comptroller

The FY 2014 Comprehensive Annual Financial Report is printed on paper consisting of 100% recycled content (post-consumer fiber).

Vision
“Arlington will be a diverse and inclusive world-class community with secure, attractive residential and commercial neighborhoods where people unite to form a caring, learning, participating, sustainable community in which each person is important.”
ARLINGTON COUNTY BOARD
Mission
High Quality Service
Leadership Philosophy
We believe that people want to do the best job possible. When all of us share responsibility for creating a work environment with clear goals, mutual support and opportunities for continuos learning, Arlington County can best achieve its
goals. We will realize our full potential through teamwork, respect for each other, sharing information, and support for individual creativity and initiative.
Principles of Government Service
*Ethics/Stewardship * Diversity / Inclusion * *Commitment to Employees
*Leadership * Teamwork * Empowerment / Accountability *

i
ARLINGTON COUNTY, VIRGINIA
COMPREHENSIVE ANNUAL FINANCIAL REPORT For the Fiscal Year Ended June 30, 2014
TABLE OF CONTENTS
INTRODUCTION Page
Letter of Transmittal .................................................................................................................................................... 1
Certificate of Achievement for Excellence in Financial Reporting ................................................................................................................................................................... 10 Organization Chart ....................................................................................................................................................... 11 Directory of Officials ................................................................................................................................................... 12 FINANCIAL Independent Auditors' Report ...................................................................................................................................... 15 Management’s Discussion and Analysis ..................................................................................................................... 19
Basic Financial Statements Exhibit 1 Statement of Net Position ............................................................................................................................................ 30 2 Statement of Activities ................................................................................................................................................. 31 3 Balance Sheet – Governmental Funds ......................................................................................................................... 32 3(A) Reconciliation of Total Governmental Fund Balances to Net Assets of Governmental Activities .......................................................................................................................................... 33 4 Statement of Revenues, Expenditures, and Changes in Fund Balances - Governmental Funds ................................................................................................................................................. 34 4(A) Reconciliation of the Statement of Revenues, Expenditures, and Changes in Fund Balances to the Statement of Activities ...................................................................................................... 35 5 Statement of Revenues, Expenditures, and Changes in Fund Balance – Budget and Actual – General Fund ............................................................................................. 36 6 Statement of Net Position – Proprietary Funds ............................................................................................................ 38 7 Statement of Revenues, Expenses, and Changes in Net Assets - Proprietary Funds ...................................................................................................................................................... 39 8 Statement of Cash Flows – Proprietary Funds ............................................................................................................. 40 9 Statement of Fiduciary Net Assets ............................................................................................................................... 41 10 Statement of Changes in Fiduciary Net Assets ............................................................................................................ 42 Notes to the Financial Statements ............................................................................................................................... 43

ii
Other Supplementary Information X Combining Balance Sheet- Non-Major Governmental Funds ...................................................................................... 90 Y Combining Statement of Revenues, Expenditures and Changes in Fund Balances .................................................... 91 General Fund: A-1 Balance Sheet .............................................................................................................................................................. 94 A-2 Schedule of Revenues, Expenditures and Changes in Fund Balance - Budget (GAAP Basis) and Actual ............................................................................................................................... 95 Special Revenue Funds: B-1 Combining Balance Sheet ........................................................................................................................................... 97 B-2 Combining Statement of Revenues, Expenditures and Changes in Fund Balances .................................................... 98 B-3 Ballston Business Improvement District Fund ............................................................................................................ 99 B-4 Rosslyn Business Improvement District Fund ......................................................................................................... 100 B-5 Crystal City Business Improvement District Fund .................................................................................................... 101 B-6 Community Development Grants Fund ................................................................................................................... 102 B-7 Section 8 Housing Program ...................................................................................................................................... 103 Capital Projects Funds: C-1 Combining Balance Sheet ......................................................................................................................................... 105 C-2 Combining Statement of Revenues, Expenditures and Changes in Fund Balances .................................................. 106 Enterprise Funds: D-1 Combining Balance Sheet ......................................................................................................................................... 108 D-2 Combining Statement of Revenues, Expenses and Changes in Net Assets ............................................................... 110 D-3 Combining Statement of Cash Flows ........................................................................................................................ 111 Internal Service Funds: E-1 Combining Balance Sheet ......................................................................................................................................... 113 E-2 Combining Statement of Revenues, Expenses and Changes in Net Assets ............................................................... 114 E-3 Combining Statement of Cash Flows ........................................................................................................................ 115 Fiduciary Funds: F-1 Combining Statements of Net Position Trust Funds .................................................................................................. 117 F-2 Combining Statements of Changes in Net Assets Trust Funds .................................................................................. 118 F-3 Statement of Changes in Plan Net Assets – Pension Trust Fund .............................................................................. 119 F-4 Combining Statements of Net Position Agency Funds .............................................................................................. 120 F-5 Combining Statements of Changes in Assets and Liabilities - Agency Funds .......................................................... 121 Discretely Presented Component Unit - Schools: G-1 Combining Balance Sheet ......................................................................................................................................... 123 G1(A) Reconciliation of the Fund Balances of Component Unit – Schools to Net Assets of the Component Unit - Schools ................................................................................................................ 124 G-2 Combining Statement of Revenues, Expenditures and Changes in Fund Balances .................................................. 125 G2(A) Reconciliation of the Statement of Revenues, Expenditures, and Changes in Fund Balances to the Statement of Activities Component Unit - Schools .......................................................... 126 G-3 Combining Statement of Revenues, Expenditures and Changes in Fund Balances - Budget (GAAP Basis) and Actual .......................................................................................................................... 127 G-4 OPEB Trust Fund – Schools, Balance Sheet ............................................................................................................. 130 G-5 OPEB Trust Fund – Schools, Statement of Changes in Plan Net Assets .................................................................. 131 SUPPLEMENTAL SCHEDULES S-1 Schedule of Treasurer's Accountability to the County - All Funds ............................................................................ 133 S-2 Combined Schedule of Investments - All Funds ....................................................................................................... 136 S-3 Combined Schedule of Long-Term Obligations ....................................................................................................... 140

iii
S-4 Schedule of Delinquent Property Taxes Receivable ................................................................................................. 153 S-5 Real Estate and Personal Property Tax Levies and Collections ................................................................................. 154 S-6 Schedule of General Capital Assets - By Source ...................................................................................................... 155 S-7 Schedule of Changes in General Capital Assets - By Function and Activity ............................................................ 156 S-8 Schedule of General Capital Assets - By Function and Activity ............................................................................... 157 S-9 Detail Schedule of Revenues - Budget (GAAP Basis) and Actual - General and Special Revenue Funds ......................................................................................................................... 158 S-10 Detail Schedule of Expenditures - Budget (GAAP Basis) and Actual - General and Special Revenue Funds ......................................................................................................................... 160 S-11 Schedule of Capital Outlays and Capital Projects - Governmental Fund Types ....................................................... 162 STATISTICAL (Unaudited) A Net Assets by Component – Last Nine Fiscal Years .................................................................................................. 164 B Changes in Net Assets – Last Nine Fiscal Years ....................................................................................................... 165 C Fund Balances, Governmental Funds and Other Component Unit-Last Ten Fiscal Years ....................................... 167 D Changes in Fund Balances of Governmental Funds - Last Nine Fiscal Years .......................................................... 169 D-1 General Governmental Expenditures by Functions –Last Ten Fiscal Years .............................................................. 170 D-2 General Governmental Revenues by Source –Last Ten Fiscal Years ........................................................................ 171 E General Governmental Tax Revenues by Source - Last Ten Fiscal Years ................................................................ 172 F Assessed and Actual Value of Taxable Property - Last Ten Fiscal Years ................................................................ 173 G Principal Taxpayers – Current and Nine Years Ago ................................................................................................. 174 H Property Tax Levies and Collections – Last Ten Fiscal Years .................................................................................. 175 I Ratios of Outstanding Debt by Type - Last Ten Fiscal Years ................................................................................... 176 I-1 Ratio of General Bonded Debt Outstanding – Last Ten Years ................................................................................. 177 J-1 Pledged-Revenue Coverage Ballston Public Parking Garage-Last Ten Fiscal Years ............................................... 178 J-2 Pledged-Revenue Coverage Utilities Bond Coverage-Last Ten Fiscal Years ........................................................... 179 K Demographic Statistics – Last Ten Fiscal Years ....................................................................................................... 180 L Principal Employers-Current and Nine Years Ago .................................................................................................... 181 M Full-time Equivalent Government Employees by Function ....................................................................................... 182 N Operating Indicators by Function-Program –June 30, 2014 ...................................................................................... 183 O Capital Assets Statistics by Function/Program – June 30, 2014 ............................................................................... 184 P Percentage of Annual Debt Service Expenditures for General Obligation Bonded Debt to Total General Governmental Expenditures ................................................................................................................ 185 Q Schedule of Insurance – June 30, 2014 ..................................................................................................................... 186 R Construction Activity, Bank Deposits and Real Property Value-Last Ten Fiscal Years ........................................... 190 S Business and Professional License Tax Revenues – Fiscal Years 2005-2014 ........................................................... 191 T Certificate of No Default - June 30, 2014 .................................................................................................................. 192 U Largest Users of the Water & Sewer Systems - For the twelve months ending June 30, 2014 .................................. 193 V Description of the Wastewater & Water System & Wastewater & Water Rates- June 30, 2014 ............................... 194 W Certificate of Consulting Engineer ............................................................................................................................. 197 FEDERALLY ASSISTED PROGRAMS
Independent Auditors' Reports on: Internal Control Over Financial Reporting and on Compliance and Other Matters Based on an Audit of
Financial Statements Performed in accordance with Government Auditing Standards................................. 199 Compliance with Requirements Applicable to Each Major Program and on Internal Control Over
Compliance in accordance with OMB Circular A-133 ................................................................................ 201 Schedule of Expenditures of Federal Awards ........................................................................................................... 204 Notes to Schedule of Expenditures of Federal Awards ............................................................................................. 210 Schedule of Findings and Questioned Costs ............................................................................................................. 211 Schedule of Prior Year Findings and Questioned Costs ............................................................................................ 213

INTRODUCTION

DEPARTMENT OF MANAGEMENT AND FINANCE 2100 Clarendon Blvd., Suite 501 Arlington, VA 22201 TEL 703.228.3415 FAX 703.228.3401 EMAIL [email protected]
October 31, 2014 Chairman Jay Fisette and Members of the County Board: Section 15.2-2511 of the Code of Virginia requires that all general-purpose local governments publish within six months of the close of each fiscal year a complete set of financial statements presented in conformity with Generally Accepted Accounting Principles (“GAAP”) and audited in accordance with generally accepted auditing standards by a firm of licensed certified public accountants. Pursuant to that requirement, we hereby issue the Comprehensive Annual Financial Report (the “CAFR”) of Arlington County, Virginia (the “County”) for the fiscal year ended June 30, 2014. This report consists of management’s representations concerning the finances of the County. Consequently, management assumes full responsibility for the completeness and reliability of all of the information presented in the report. To provide a reasonable basis for making these representations, management of the County has established a comprehensive internal control framework that is designed both to protect the government’s assets from loss, theft, or misuse and to compile sufficient reliable information for the preparation of the County’s financial statements in conformity with GAAP. As management, we assert that to the best of our knowledge and belief, this financial report is complete and reliable in all material respects. The County’s financial statements have been audited by CliftonLarsonAllen LLP, a firm of licensed certified public accountants. The goal of the independent audit was to provide reasonable assurance that the financial statements of the County for the fiscal year ended June 30, 2014, are free of material misstatement. The independent audit involved examining, on a test basis, evidence supporting the amounts and disclosures in the financial statements; assessing the accounting principles used and significant estimates made by management; and evaluating the overall financial statement presentation. The independent auditor concluded, based upon the audit, that there was a reasonable basis for rendering an unmodified opinion that the Arlington County financial statements for the fiscal year ended June 30, 2014, are fairly presented in conformity with GAAP. The independent auditor’s report is presented as the first component of the financial section of this report. The independent audit of the financial statements of the County was part of a broader, federally mandated “Single Audit” designed to meet the special needs of federal grantor agencies. The standards governing Single Audit engagements require the independent auditor to report not only on the fair presentation of the financial statements, but also on the audited government’s internal controls and compliance with legal requirements, with special emphasis on internal controls and legal requirements involving the administration of federal awards. The reports are available in the last section of the CAFR under the heading Federally Assisted Programs. GAAP requires that management provide a narrative introduction, overview, and analysis to accompany the basic financial statements in the form of Management’s Discussion and Analysis (“MD&A”). This letter of transmittal is designed to complement the MD&A and should be read in conjunction with it. Arlington County’s MD&A can be found immediately following the report of the independent auditors. Profile of the Government Arlington, Virginia is a world-class residential, business and tourist location that was originally part of the 10-mile square parcel of land surveyed in 1791 to be the Nation’s Capital. It is the geographically smallest self-governing county in the United States, occupying slightly less than 26 square miles. Arlington maintains a rich variety of stable neighborhoods, quality schools and diversified land use. Home to some of the most influential organizations in the world – including the Pentagon – Arlington stands out as one of America’s preeminent places to live, visit and do business. The geographical area of the County is 25.7 square miles of which 4.6 square miles is under the control of the Federal Government. There are no cities or towns within the County giving Arlington County both city and county functions, and thereby establishing Arlington County as one of the few urban unitary forms of government in the United States. The Virginia Supreme Court held in 1923 that the County is a continuous, contiguous, homogeneous entity and therefore cannot be subdivided for the establishment of towns, nor can any part of the County be annexed by neighboring jurisdictions. The land
1

2

in Arlington County is almost totally developed. In addition to single family neighborhoods, there are sizable concentrations of high-rise commercial and office space, especially in the Rosslyn-Ballston and Jefferson Davis/Crystal City Metro corridors. As required by Virginia Law, the County seeks to have real property in the County assessed annually at 100% of fair market value. The assessed value of taxable real property on January 1, 2014 was $66.4 billion. The County government’s adopted budget for all funds for Fiscal Year 2014 totaled $1,407.3 million, which included $523.0 million for public primary and secondary education. The legislative and policy-making body of the County is the five-member County Board whose members are elected at-large for staggered four-year terms. The County Board appoints the County Manager who serves as the chief executive and administrative officer. It is the County Manager’s responsibility to appoint the department heads. Arlington County was the first county in the United States to choose by referendum the Professional County Manager form of government in 1932. Arlington County is also financially accountable for a legally separate school system (the “Schools”) which is reported separately within the County financial statements. The five-member School Board is elected by the citizens. The School Board appoints the Superintendent of Schools as the chief administrative officer for the County’s public school system. The School Board has no taxing authority or authority to issue debt and receives its spending authority from the County Board. Additional information on this legally separate entity can be found in Note 1.I.A in the notes to the financial statements. In addition to the County and School Boards, other elected County officials include the Commonwealth’s Attorney, the Commissioner of Revenue, the Treasurer, the Sheriff, and the Clerk of the Circuit Court. The Commonwealth of Virginia’s General Assembly appoints the judges of the Circuit Court, the General District Court, and the Juvenile and Domestic Relations Court. Because of its unique unitary structure, the County provides a full range of local government services often associated with both cities and counties. These services include public safety (police and fire protection), judicial (courts, prosecuting offices and detention center), water and sewer, health, welfare and social services, public improvements, streets and highways, planning and zoning, community planning and development, libraries, parks and recreation, education and general administrative services. With respect to streets and highways, the County is one of only a few of the ninety-five counties in the Commonwealth of Virginia which are responsible for street and highway construction and maintenance; in the other counties, the Virginia Department of Transportation is the responsible entity. Also, the County is one of the few jurisdictions in Virginia that has fully melded the State health function into its County government organization. The annual budget serves as the foundation for Arlington County’s financial planning and control. All departments of the County are required to submit requests for appropriation to the County Manager by November of each year. The County Manager uses these requests as the starting point for developing a proposed budget. The County Manager’s proposed budget for the following fiscal year is presented to the County Board in February. Public hearings on the proposed budget and tax rates are held in March; the County Board also holds a series of work sessions during which preliminary funding decisions regarding proposed operating and capital programs are considered. Final County Board decisions are incorporated into the appropriation, tax, and budget resolutions for the fiscal year. These resolutions are generally approved by the County Board in April and a separate Adopted Budget document is issued subsequent to the Board approval. Under Virginia law, the County Board must adopt a School Board budget no later than May 1 of the current fiscal year. The annual budget is prepared by fund, department, program and type of expense within departments/programs. Department directors may make transfers of appropriations within a department with Department of Management and Finance approval. Transfers of appropriations between departments, and transfers between funds require the approval of the County Manager and County Board. Budget-to-actual comparisons are provided in this report for each individual governmental fund for which an appropriated annual budget has been adopted. For the general fund, this comparison is presented in Exhibit 5 as part of the basic financial statements for the governmental activities. For governmental funds, other than the general fund, with appropriated annual budgets, these comparisons are presented in the supplemental subsections of this report, in Exhibits B-3, B-4, B-5, B-6, B-7 and B-8. For the discrete component unit Schools, these comparisons are presented in Exhibit G-3. Factors Affecting Financial Condition The information presented in the financial statements is perhaps best understood when it is considered from the broader perspective of the specific environment within which the County operates.
3

Arlington Vision
"Arlington will be a diverse and inclusive world-class urban community with secure, attractive residential and
commercial neighborhoods where people unite to form a caring, learning, participating, sustainable community in
which each person is important."
— Arlington County Board
Local Economy Beyond world-famous sites and attractions in the nation’s capital, and located just across the Potomac River, Arlington is a lively hub of commerce, culture, recreation and tourism, supported by one of the most diverse, educated and affluent populations in the world. In addition, the County contains substantial office, residential, and rental development that serves to diversify its property tax base. The outlook for the Arlington economy is stable, in spite of a recession nationally and regionally. Arlington's economy is outperforming national and regional averages, as evidenced by key metrics related to office demand, retail sales, and tourism all showing stable or improved levels over the past three years. Arlington’s 2014 tax base is approximately divided between 49% commercial and 51% residential properties, enabling the County to maintain a competitive property tax rate in the Washington DC region. In CY 2014, the tax rate (the base rate plus the county wide sanitary district tax rate) decreased to $0.996 per $100 of assessed value. CY 2014 assessments showed solid performance with growth primarily fueled by strength in the residential market as well as new construction in commercial properties and strength in apartments. Assessed valuation of real property held their values, increased 5.8% from CY 2013 to CY 2014. CY 2014 commercial assessments (including multifamily rental buildings) increased 5.4% over CY 2013. Apartment buildings showed growth of 7.1% driven by increasing rents and some reductions in vacancies. Despite office vacancies and decreasing hotel revenues, commercial properties increased 4.4% primarily fueled by new construction – which made up 1.7% of the increase – as well as strength in general commercial properties and slightly higher office rents. The residential property assessment base increased 6.1% in the aggregate. Including new construction, single-family houses (including townhouses) increased 6.2%, while condominium assessment totals increased by 5.9% in CY 2014. The average value of a single-family property increased by 5.3%: from $524,700 in CY 2013 to $552,700 in CY 2014. The Arlington blend of urban sophistication and neighborhood charm is unmatched in the region. Elegant high-rises, national and regional corporate and association headquarters, bustling Metro stations, upscale hotels, a dynamic and diverse retail sector, a diverse cultural scene, an exciting nightlife with more than six million square feet of retail space, over 500 restaurants and live theaters make Arlington a premier place to live, work, play and stay. Arlington is the epitome of smart growth and new urbanism. Since 1960, some thirty-eight million (38M) square feet of office and commercial space has been built in the Rosslyn-Ballston or Jefferson Davis corridors, which also contain ninety percent (90%) of Arlington’s over 10,000 hotel rooms. This excludes federally owned office buildings such as the Pentagon, which is the headquarters of the U.S. Department of Defense. In addition, more than 2,800 new residential units have been delivered in the past three years and nearly 2,500 remain under construction. In the 2nd quarter of 2014, the County’s office vacancy rate was 20.4%. The residential unemployment rate is very low, averaging 3.5% for FY 2014, below regional, state, and national averages. Arlington's per capita income and property wealth indicators are among the highest in the nation. In May 2014, the County’s outstanding financial management, sizable and affluent tax base, controlled expenditure growth and moderate debt burden were cited as reasons Standard and Poor’s, Moody’s, and Fitch’s Investor Services reaffirmed the County’s top AAA/Aaa/AAA ratings. The triple AAA/Aaa/AAA rating validates that Arlington’s financial position is strong, with ample liquidity, sound general fund reserves, a competitive tax structure, and excellent financial planning. The continued growth of high wage jobs in the technology, research and financial services sectors, high per-capita retail sales and strong operating reserves serve to establish Arlington County, as of June 30, 2014, as only one of 39 counties in the United States with top bond ratings from all three major bond-rating agencies.
Long-Term Financial Planning The Arlington Vision adopted by the Arlington County Board in 2001, provides the overarching framework for our strategic and operational decision making. The vision provides the continuity necessary to execute both short and long-term policy and resource decisions. The annual budget serves as Arlington’s annual operations plan. Multi-year strategies are incorporated into a Management Plan, which supports the Board’s vision and is updated annually. Eight core themes are contained in the 2014 Management Plan that support the Board’s vision:
Social Safety Net
4

Economic Sustainability Fiscal Sustainability Environmental Sustainability Civic Engagement Capital Improvement Plan County-School Collaboration Fitness & Health
The budget adopted by the County Board for FY 2015 continues to provide high quality service by maintaining core County services and infrastructure, while liming the growth of the County budget and the burden to taxpayers who have seen real estate values rise. The adopted budget balances the needs of our Schools, employees, social safety net programs, continuing service operations and Arlington County taxpayers. The county government’s adopted budget for all funds for FY 2015 provides a 4.9% funding increase preserves key services; infrastructure maintenance; our social safety net; and adds significant funding for Schools, while giving some tax relief to homeowners. The adopted General Fund budget includes a 1.0 cent real estate tax decrease and the General Fund budget is 5.1% higher than the FY 2014 adopted budget. Despite the economic challenges, the General Fund budget of $1.15 billion protects the community’s key priorities. Arlington continues to economically surpass much of the region and the nation. Arlington’s unemployment rate remains the lowest in the Commonwealth. The county’s per capital income remains among the highest in the state. Home prices continue on a positive trajectory, which help balance the flat commercial real estate sector. While Arlington is in a better position than many communities in the nation, the Base Realignment and Closure (BRAC) process and the sluggish pace of the nation’s economic recovery will continue to put pressure on the county budget for at least the next two years. Taxes and Fees Under state law, the County’s budget must be balanced fiscally. The Arlington County Board works equally hard to adopt a budget that also is balanced in policies, programs and values. It is committed to a diverse community, which means diverse needs and interests. The Board approved a CY 2014 real estate tax rate of $0.996 cents per hundred dollars of assessed value (including the sanitary district tax). Arlington continues to have one of the lowest real estate tax rates in the Northern Virginia region, maintaining its history of providing excellent value. A greater share of the tax burden is carried by the commercial sector, relative to homeowners, than any of its neighbors. This is the fiscal benefit of “smart growth.” Because of the assessment method used for automobiles, it also has one of the lowest effective personal property tax rates. The FY 2015 budget includes no increases for personal property tax, business tangible property, business and professional occupational licenses, or commercial transportation tax rates. Social Safety Net Funding for the County’s most vulnerable continues to be a priority for the community and the County Board. Funding continued for many programs that were funded in FY 2014 through a combination of one-time and ongoing funding. The county increased funding for the Arlington Free Clinic and Offender Aide and restoration, while adding one-time funding for a local unified hotline response system for domestic and sexual violence, Arlington Neighborhood Villages, BU-GATA, and Food for Others. Affordable Housing Building on the commitment made in FY 2013 and FY 2014, the FY2015 adopted budget increased spending $0.50 million to a total of $13.0 million. The County continues to make progress on the long-range housing study which will assess the gaps in existing housing programs, determine long-term goals and funding priorities, and identify funding strategies and new tools that can help the County achieve its goals. Commitment to the Environment The FY 2015 adopted budget reaffirmed the County’s commitment to Arlington’s natural environment, with funding for tree planting and increasing staffing for Stormwater programs. These positions are paid for with dedicated revenues available in the Stormwater Fund and are critical to meet Arlington’s commitment to the Chesapeake Bay and local watershed health. Commitment to Employees
5

The County recognizes that employees are being asked to do more with less. With the reductions that have been made to a number of programs, employees are being asked to continue providing the high quality and range of services the community expects. The County is in the midst of a four-year competitiveness review and will continue to adjust salaries based on our findings. The FY 2015 adopted budget includes funding for merit step increases and provides a 1% pay adjustment to those employees at the top of their grade – who haven’t seen a pay increase in two years. Education Like most local governments, Arlington’s largest single expenditure is for schools. The public school system represents more than a third of total general fund spending, and accounts for almost half of local tax dollars. For FY 2015, the Schools will receive $440.6 million, a 6.0% increase. The funding includes adding $19.6 million to base fund and another $8.4 million for school construction or other one-time expenses. The County also added funds for another school clinic aide and three new School Resources Officers. Under the FY 2015 Budget, Arlington’s support for our students now exceeds $19,000 per pupil – more than any other school district in the region. The County is proud of the continuing accomplishments of its students and schools with the many notable achievements by Arlington Public Schools (APS).
Pass rates on state assessments remain at or above 90% for all students, while the achievement gap among groups continues to narrow.
Approximately 75% of graduating seniors completed at least one AP or IB course. In 2014, 92% of all APS students graduated on time, and the dropout rate has been reduced by almost two-thirds since
2010. APS students have maintained strong performance on the SAT exam, with mean total scores ranging from 1623 to
1645 in the last four years, outpacing state and national averages. The 2014 Washington Post Challenge Index ranked all four APS high schools in the top two percent of high schools
in the U.S. This is the seventh year in a row all APS high schools have made the list. APS is the recipient of the prestigious Medallion of Excellence Award present by the U.S. Senate Productivity and
Quality Awards for Virginia and the District of Columbia, becoming the first school division in almost a decade to receive this award and one of only nine districts ever to earn this honor.
Arlington’s Superintendent was named the 2014 Superintendent of the Year by the Virginia Association of School Superintendents.
Arlington’s commitment to schools is especially significant given that this County gets less help than other jurisdictions; under the state funding formula, less than 20 percent of APS school-funding comes from sources other than local taxes. In contrast, half the cost of Prince William County Public Schools, for example, is paid by the state, while Arlington pays over 80 percent of the cost of educating our students. Internal Control and Budgetary Accounting The County’s management team is responsible for designing, implementing and monitoring internal controls to protect the assets of the government from loss, theft or misuse and to ensure the financial statements are prepared in conformity with generally accepted accounting principals. Internal controls are intended to provide reasonable, but not absolute, assurance that these objectives are met. The concept of reasonable assurance recognizes that the costs of controls should not exceed the benefits that are expected from the controls. The annual fiscal year budget serves as the annual operating plan, and is one of the three major strategic documents in the County regarding planning, in conjunction with the Annual Management Plan and the County Comprehensive Plan. Annual appropriations are adopted for the General, Utilities, Special Revenue and Internal Service Funds. Appropriations are controlled at the department level. Management can transfer funds within a department’s budget as long as the total departmental appropriation is not changed without approval from the County Board. The County Board must approve changes to adopted appropriation levels. These changes can be in the form of allocations from previously established contingent accounts, appropriations from new or additional revenues, especially grants from the state or federal government, and from reappropriations from a previous fiscal year. A ten-year capital improvement program is developed and approved separately from the operating budget. The School Board prepares a separate operations budget, supported to a large degree by transfers from the County General Fund. Capital Improvement Program
6

The County Manager biennially submits a ten year Capital Improvement Plan (CIP) to the County Board. Starting with the FY 2013 – FY 2022, this CIP presented a ten year planning period instead of six years. This shift to a longer planning horizon has many benefits including facilitating better planning and financing of major multi-year transportation and utility projects, and analyzing operating budget impacts. The CIP addresses all known facility and infrastructure needs of the County, including the needs of the Arlington County Public Schools. The CIP includes a detailed description of each capital project, identifying every source of funding, including pay-as-you-go (PAYG), bond financing, and master lease financing. Each project budget identifies the financial impact on the operating budget, if any. The County balances the use of debt financing sources against the ability to utilize PAYG funding for capital projects. While major capital facility projects will generally be funded through bonds, the County attempts to maintain an appropriate balance of PAYG vs. debt, particularly in light of the County’s debt capacity and analysis of maintenance capital needs. As part of each biennial CIP process, the County conducts a comprehensive assessment of its maintenance capital needs. The CIP includes an analysis of the impact the CIP has on the County’s debt capacity, debt ratios and long-term financial plan. On July 19, 2014 the Arlington County Board adopted a Capital Improvement Plan (CIP) for fiscal year 2015 to 2024, totaling $3.2 billion for the County and Arlington Public Schools. Highlights include:
Transportation commitment for Metro rail; ART bus; Columbia Pike Transit Stations; new entrances or elevators at
Ballston-MU, Pentagon City, Courthouse and Crystal City Metro stations; Capital Bikeshare and BikeArlington, and
Complete Streets projects at Army Navy Drive and East Falls Church
Columbia Pike and Crystal City streetcar system.
Replacement of Lubber Run Community Center, one of the County’s oldest community centers.
Initial planning processes for site evaluation for a fire station in northern Arlington.
Expansion of ConnectArlington, a County-owned fiber communications network, to further economic development
goals.
Full funding of the CIP adopted by the School Board of $534.1 million, including one new elementary school, additions
and renovations at four elementary school, and additional seats at secondary schools.
Continued emphasis on maintenance capital – facilities, parks, technology, with increased funding in the ten year period
for street paving. Financial and Debt Management The County prudently uses debt instruments, including general obligation bonds, revenue bonds, industrial development authority (IDA) revenue bonds, and master lease financing in order to provide re-investment in public infrastructure and to meet other public purposes, including inter-generational tax equity in capital investment. In July 2014, the Board adopted revised financial and debt management policies to ensure maintenance of Arlington’s triple-Aaa bond ratings. The updated policies confirm the County’s operating reserve level of five percent of general government expenditures. The policies also confirm the County’s debt affordability ratios, including a modified, more conservative variable rate debt policy. Finally, a new policy regarding tax increment financing areas was added. The County adheres to the following debt affordability criteria (excluding overlapping and self-supporting debt).
1. The ratio of net tax-supported debt service to general expenditures should not exceed ten percent, within the ten-year projection.
2. The ratio of net tax-supported debt to full market value should not exceed three percent, within the ten-year projection.
3. The ratio of net tax-supported debt to income should not exceed six percent, within the ten-year projection. 4. Growth in debt service should be sustainable and consistent with the projected growth of revenues. Debt service
growth over the six year projection should not exceed the average ten year historical revenue growth. 5. The term and amortization structure of County debt will be based on an analysis of the useful life of the asset(s) being
financed and the variability of the supporting revenue stream. The County will attempt to maximize the rapidity of principal repayment where possible. In no case will debt maturity exceed the useful life of the project.
6. The County will refund debt when it is in the best financial interest of the County to do so. When a refunding is undertaken to generate interest rate cost savings, the minimum aggregate present value savings will be three percent of the refunded bond principal amount.
7

Variable Rate Debt 1. Variable rate debt exposure should not exceed twenty percent of total outstanding debt.
2. Debt service on variable rate bonds will be budgeted at a conservative rate. 3. Before issuing variable rate bonds, the County will determine how potential spikes in the debt service will be funded. 4. Before issuing any variable rate bonds, the County will determine the impact of the bonds on the County’s total debt
capacity under various interest rate scenarios; evaluate the risk inherent in the County’s capital structure, giving consideration to both the County’s assets and its liabilities; and develop a method for budgeting for debt service.
Moral Obligation Debt or Support On an infrequent basis, the County provides its “moral obligation” support for partners, including regional public safety agencies and affordable housing partners, among others. A moral obligation exists when the County Board has made a commitment to support the debt of another entity to prevent a potential default. The County’s moral obligation will only be authorized after an evaluation of the risk to the County’s balance sheet and stress testing of the financial assumptions underlying the proposed project Other Post-employment Benefits (OPEB) In addition to the pension benefits described in footnote 16, the County provides post-employment health care benefits to all permanent employees who meet the requirements under the County's or the State's pension plans. Eligibility is contingent upon the retiree being eligible for one of the County's current health plans at the time of retirement. The County Board considers and approves these benefits annually as part of the Adopted Budget process. As of July 1, 2013, 1,766, and 2,044 retirees were both eligible and received benefits from the health and life plans, respectively. Funding for these OPEB benefits were made through a combination of pay-as-you-go contribution from the County’s general fund and additional pre-funding contribution into the OPEB Trust that is sufficient to fully fund the Annual OPEB cost annually. In June 2004, the Government Accounting Standards Board (GASB) issued Statement Number 45, Accounting and Financial Reporting by Employers for Post Employment Benefits Other Than Pensions. The County, beginning in fiscal year 2008, accounted for and reported in its financial statements the cost of Other Post Employment Benefits (OPEB) – health insurance, life insurance and other non-pension benefits provided to its retirees. GASB 45 required that the cost of our OPEB commitments be accounted for and reported in the same manner as pensions. In an actuarial analysis dated June 30, 2014 the County's actuary estimated an OPEB liability of $205.7 million (for the Fiscal Year ending June 30, 2014) with an Annual OPEB Cost (AOC) of $19.9 million and net OPEB assets of $0.4 million. The County Budget for FY 2015 fully funds the AOC. In an actuarial analysis dated, June 30, 2014 the Schools’ actuary estimated an OPEB liability of $81.9 million (for Fiscal Year ending June 30, 2014) with an AOC of $7.9 million and a net OPEB liability of $14.6 million. The Schools’ Budget for FY 2015 fully funds the AOC. Both the County and Schools will receive annual actuarial updates and continue to monitor health care costs and consider additional plan design changes if necessary. Annual Disclosure As required by the U.S. Securities and Exchange Commission Rule 15c2-12, the County has agreed, for the benefit of the owners of County bonds, to provide to Electronic Municipal Market Access (EMMA) system operated by the Municipal Securities Rulemaking Board (MSRB) and to any appropriate state information depository (“SID”), if any is hereafter created, certain financial information (the “Annual Report”) not later than 270 days after the end of each of its fiscal years, commencing with the fiscal year ending June 20, 1996. The financial information which the County has agreed to annually provide includes “Debt Statement”, “Total General Obligation Debt Service”, “Ten-Year Summary of General Fund Revenues and Expenditures”, “General Fund Balance”, “Principal Tax Revenues by Source”, “Property Tax Levies and Collections”, “Historical Assessed Valuation”, “Local Sales Tax Revenue”, “Business and Professional License Tax Revenues”, “Description of County’s Wastewater and Water Systems”, “Debt Payable From or Secured By County’s Wastewater and Water Systems”, “Financial Information and Operating Data for the Utilities Enterprise Fund, as of the Preceding Fiscal Year, including Description of Revenues and Expenses, Largest Users, Summary of Rates and Fees, and a Historical Summary of Debt Service Coverage”. These are included as Exhibit S-3 and Notes to the Financial Statements #9, Table I, Table I-1,
8

9
10

ORGANIZATION OF ARLINGTON COUNTY GOVERNMENT
11

ARLINGTON COUNTY, VIRGINIA
DIRECTORY OF OFFICIALS June 30, 2014
COUNTY BOARD
Jay Fisette, Chairman
Mary Hynes, Vice Chairman
J. Walter Tejada Libby Garvey John Vihstadt
COUNTY SCHOOL BOARD
Emma Violand-Sanchez, Chairman
Sally M. Baird, Vice Chairman
James Lander Abby Raphael Noah Simon
FINANCE BOARD
Jay Fisette, Chairman
Francis X. O’Leary (Retired July 2014)
Carla de la Pava Theo Stamos Larry Mayer
JUDICIAL
Circuit Court Judges: William T. Newman Jr. Daniel S. Fiore, II Louise M. DiMatteo General District Court Judges: Thomas J. Kelley, Jr R. Frances O’Brien Richard J. McCue Juvenile and Domestic Relations: George D. Varoutsos Esther G. Wiggins
12

ARLINGTON COUNTY, VIRGINIA DIRECTORY OF OFFICIALS (continued)
COUNTY OFFICIALS
Elective Attorney for the Commonwealth Theo Stamos Clerk of the Court Paul Ferguson Commissioner of the Revenue Ingrid H. Morroy Sheriff Beth Arthur Treasurer Francis X. O’Leary (Retired July 2014) Carla de la Pava Administrative – General County County Manager Barbara M. Donnellan Deputy County Manager Mark J. Schwartz County Attorney Stephen MacIsaac Clerk to the County Board Hope Halleck Director of Community Planning, Housing and Development Robert E. Brosnan Director of Parks and Recreation Jane Rudolph Fire Chief James H. Schwartz Director of Department of Human Services Susanne Eisner Director of Department of Libraries Diane Kresh Director of Department of Management and Finance Michelle G. Cowan Director of Department of Human Resources Marcy Foster Chief of Police M. Douglas Scott Director of Department of Environmental Services Greg Emanuel Director of Department of Technology Services Jack Belcher Acting Director of Department of Economic Development Cynthia Richmond Registrar of Voters Linda Lindberg Director Office of Emergency Management Jack Brown Administrative - County School Board Superintendent of Schools Dr. Patrick Murphy Clerk of the School Board Melanie Elliott Deputy Clerk of the School Board Karen Allen Assistant Superintendent, Personnel Dr. Betty Hobbs Assistant Superintendent, Finance & Management Deirdra McLaughlin Assistant Superintendent, Information Services Raj Adusumilli Assistant Superintendent, Instruction Connie Skelton Assistant Superintendent, Student Services Brenda Wilks Assistant Superintendent, Administrative Services Cintia Johnson Assistant Superintendent, Schools & Community Relations Linda M. Erdos Assistant Superintendent Operations and Facilities John Chadwick
13

FINANCIAL
14

Independent Auditor’s Report The County’s financial statements and accounting systems are audited each fiscal year by an independent public accounting firm. The audits are conducted in accordance with generally accepted auditing standards, governmental auditing standards and the “single audit” concept applicable to Federally Assisted Programs. The independent auditor’s report on the County’s financial statements is contained in this section. The reports required under the “single audit” concept are included in the Federal Grant Activity section of this report, entitled “FEDERALLY ASSISTED PROGRAMS:
15

CliftonLarsonAllen LLP www.CLAconnect.com
INDEPENDENT AUDITORS' REPORT The Honorable Members of the County Board Arlington County, Virginia Report on the Financial Statements
We have audited the accompanying financial statements of the governmental activities, the business‐type activities, the aggregate discretely presented component units, each major fund, the budgetary comparison for the General Fund, and the aggregate remaining fund information of Arlington County, Virginia (the County) as of and for the year ended June 30, 2014, and the related notes to the financial statements, which collectively comprise the County’s basic financial statements as listed in the table of contents.
Management’s Responsibility for the Financial Statements
Management is responsible for the preparation and fair presentation of these financial statements in accordance with accounting principles generally accepted in the United States of America; this includes the design, implementation, and maintenance of internal control relevant to the preparation and fair presentation of financial statements that are free from material misstatement, whether due to fraud or error.
Auditors’ Responsibility
Our responsibility is to express opinions on these financial statements based on our audit. We did not audit the financial statements of the Gates Partnership, which represents 11 percent, 4 percent, and 1 percent, respectively, of the assets, net position, and revenues of the discretely presented component units. Those statements were audited by other auditors whose report has been furnished to us, and our opinion, insofar as it relates to the amounts included for the gates Partnership, based solely on the report of the other auditors. We conducted our audit in accordance with auditing standards generally accepted in the United States of America and the standards applicable to financial audits contained in Government Auditing Standards, issued by the Comptroller General of the United States, and the Specifications for Audits of Counties, Cities, and Towns, issued by the Auditor of Public Accounts of the Commonwealth of Virginia. Those standards require that we plan and perform the audit to obtain reasonable assurance about whether the financial statements are free from material misstatement.
An audit involves performing procedures to obtain audit evidence about the amounts and disclosures in the financial statements. The procedures selected depend on the auditors’ judgment, including the assessment of the risks of material misstatement of the financial statements, whether due to fraud or error. In making those risk assessments, the auditor considers internal control relevant to the entity’s preparation and fair presentation of the financial statements in order to design audit procedures that are appropriate in the circumstances, but not for the purpose of expressing an opinion on the effectiveness of the entity’s internal control. Accordingly, we express no such opinion. An audit also includes evaluating the appropriateness of accounting policies used and the reasonableness of significant accounting estimates made by management, as well as evaluating the overall presentation of the financial statements.
An independent member of Nexia International16

We believe that the audit evidence we have obtained is sufficient and appropriate to provide a basis for our audit opinions.
Opinions In our opinion, based on our audit and the report of other auditors, the financial statements referred to above present fairly, in all material respects, the respective financial position of the governmental activities, the business‐type activities, the aggregate discretely presented component units, each major fund, and the aggregate remaining fund information of the County as of June 30, 2014, and the respective changes in financial position and, where applicable, cash flows thereof and the budgetary comparison of the General Fund for the year then ended in accordance with accounting principles generally accepted in the United States of America.
Other Matters Required Supplementary Information Accounting principles generally accepted in the United States of America require that the Management’s Discussion and Analysis on pages 19 ‐ 28 be presented to supplement the basic financial statements. Such information, although not a part of the basic financial statements, is required by the Governmental Accounting Standards Board who considers it to be an essential part of financial reporting for placing the basic financial statements in an appropriate operational, economic, or historical context. We and other auditors have applied certain limited procedures to the required supplementary information in accordance with auditing standards generally accepted in the United States of America, which consisted of inquiries of management about the methods of preparing the information and comparing the information for consistency with management’s responses to our inquiries, the basic financial statements, and other knowledge we obtained during our audit of the basic financial statements. We do not express an opinion or provide any assurance on the information because the limited procedures do not provide us with sufficient evidence to express an opinion or provide any assurance.
Other Information Our audit was conducted for the purpose of forming opinions on the financial statements that collectively comprise the County’s basic financial statements. The supplementary information, as noted in the table of contents are presented for purposes of additional analysis and are not a required part of the basic financial statements.
The accompanying schedule of expenditures of federal awards, as noted in the Federally Assisted Programs section of the table of contents, is presented for purposes of additional analysis as required by the US Office of Management and Budget Circular A‐133, Audits of States, Local Governments, and Non‐ Profit Organizations, and is a required part of the basic financial statements.
The combining and individual non‐major fund financial statements and the budgetary comparison of the General Fund and the schedule of expenditures of federal awards is the responsibility of management and was derived from and relates directly to the underlying accounting and other records used to prepare the basic financial statements. Such information has been subjected to the auditing procedures applied in the audit of the basic financial statements and certain additional procedures, including comparing and reconciling such information directly to the underlying accounting and other records used to prepare the basic financial statements or to the basic financial statements themselves, and other additional procedures in accordance with auditing standards generally accepted in the United States of America by us and the other auditors. In our opinion, based on our audit, the procedures performed as described above, and the report of the other auditors, the information is fairly stated, in all material respects, in relation to the basic financial statements as a whole.
17

We also previously audited, in accordance with auditing standards generally accepted in the United States of America, the basic financial statements of Arlington County, Virginia as of and for the year ended June 30, 2013 (not presented herein), and have issued our report thereon dated October 28, 2013, which contained unmodified opinions on the respective financial statements of the governmental activities, the business‐type activities, the aggregate discretely presented component units, each major fund, and the aggregate remaining fund information. The 2013 comparative totals or summarized comparative totals included in the other supplemental schedules, such as the combining and individual nonmajor fund financial statements, general fund financial statements and budgetary comparison statements for the year ended June 30, 2014 is presented for purposes of additional analysis and is not a required part of the basic financial statements. Such information is the responsibility of management and was derived from and relates directly to the underlying accounting and other records used to prepare the 2013 financial statements. The other supplemental schedules containing comparative totals or summarized comparative totals have been subjected to the auditing procedures applied in the audit of the 2013 basic financial statements and certain additional procedures, including comparing and reconciling such information directly to the underlying accounting and other records used to prepare those financial statements or to those financial statements themselves, and other additional procedures in accordance with auditing standards generally accepted in the United States of America. In our opinion, the other supplemental schedules containing comparative totals or summarized comparative totals is fairly stated in all material respects in relation to the basic financial statements as a whole for the year ended June 30, 2013. The introductory and statistical tables, as noted in the table of contents, have not been subjected to the auditing procedures applied in the audit of the basic financial statements, and accordingly, we do not express an opinion or provide any assurance on them. Report on Other Legal and Regulatory Requirements
In accordance with Government Auditing Standards, we have also issued our report dated October 31, 2014, on our consideration of the County's internal control over financial reporting and on our tests of its compliance with certain provisions of laws, regulations, contracts, and grant agreements and other matters. The purpose of that report is to describe the scope of our testing of internal control over financial reporting and compliance and the result of that testing, and not to provide an opinion on internal control over financial reporting or on compliance. That report is an integral part of an audit performed in accordance with Government Auditing Standards and should be considered in assessing the results of our audit.
a Arlington, Virginia October 31, 2014
18

Management’s Discussion and Analysis
The Management’s Discussion and Analysis (MD&A) is intended to provide the narrative introduction and overview that users need to interpret the Basic Financial Statements. MD&A also provides analysis of some key data presented in the Basic Financial Statements.
19

Management’s Discussion and Analysis As management of Arlington County, Virginia (“the County”), we offer readers of the County’s financial statements this narrative overview and analysis of the financial activities of the County and its component units-Schools, and Gates Partnership for the fiscal year ended June 30, 2014. We encourage readers to consider the information presented here in conjunction with additional information that we have furnished in our letter of transmittal, which can be found on page 1 of this report. All amounts, unless otherwise indicated, are expressed in millions of dollars. Overview of the Financial Statements This discussion and analysis is intended to serve as an introduction to the basic financial statements. The basic financial statements comprise three components: 1) government-wide financial statements, 2) fund financial statements, and 3) notes to the financial statements. This report also contains other supplementary information in addition to the basic financial statements themselves. Government-wide financial statements. The government-wide financial statements are designed to provide readers with a broad overview of the County’s finances, in a manner similar to a private-sector business. The government-wide financial statements include not only the County itself (known as the primary government), but also its component units, a legally separate school system (“Schools”) for which the County is financially accountable and Gates Partnership for which the County has the ability to impose will and fiscal dependency. Financial information for these component units is reported in separate columns from the financial information presented for the primary government itself. The statement of net positions presents information on all of the primary government’s and its component units’ assets and liabilities, with the difference between the two reported as net positions. Over time, increases or decreases in net positions may serve as a useful indicator of whether the financial position of the County is improving or deteriorating. The statement of activities presents information showing how the government’s net positions changed during the most recent fiscal year. All changes in net positions are reported as soon as the underlying event giving rise to the change occurs, regardless of the timing of related cash flows. Thus, revenues and expenses are reported in this statement for some items that will only result in cash flows in future fiscal periods (e.g., uncollected taxes and earned but unused vacation leave). Government-wide financial statements distinguish functions of the County and Schools that are principally supported by taxes and intergovernmental revenues (governmental activities) from other functions that are intended to recover all or a significant portion of their costs through user fees and charges (business-type activities). The governmental activities of the County and Schools include: public safety (police and fire protection), judicial (courts, prosecuting offices and detention center), health, welfare and social services, public improvements, streets and highways, community planning and development, libraries, parks and recreation, education and general administrative services. The business-type activities of the County include the water and sewer functions, the public parking garage operation, and planning and zoning. The government-wide financial statements can be found in Exhibits 1 and Exhibit 2, and Exhibits 6 through 8 of this report. Fund financial statements. A fund is a grouping of related accounts that is used to maintain control over resources that have been segregated for specific activities or objectives. The County and Schools, like other state and local governments, use fund accounting to ensure and demonstrate compliance with finance-related legal requirements. All of the funds of the County and Schools can be divided into three categories: governmental funds, proprietary funds, and fiduciary funds. Governmental funds. Governmental funds are used to account for essentially the same functions reported as governmental activities in the government-wide financial statements. However, unlike the government-wide financial statements, governmental fund financial statements focus on near-term inflows and outflows of expendable resources, as well as on balances of expendable resources available at the end of the fiscal year. Such information may be useful in evaluating a government’s near-term financing requirements. Because the focus of governmental funds is narrower than that of the government-wide financial statements, it is useful to compare the information presented for governmental funds with similar information presented for governmental activities in the government-wide financial statements. By doing so, readers may better understand the long-term impact of the government’s near-term financing decisions. Both the governmental fund balance sheet and the governmental fund statement of revenues,
20

expenditures, and changes in fund balances provide a reconciliation to facilitate this comparison between governmental funds and governmental activities. The County maintains 21 individual governmental funds and the Schools maintain 8 individual governmental funds. Information is presented separately in the governmental fund balance sheet and in the governmental fund statement of revenues, expenditures, and changes in fund balances for the general fund and general capital projects fund, which are considered to be major funds. Data from the other 19 County governmental funds are combined into a single, aggregated presentation; data from the Schools 8 governmental funds are combined into a single, aggregated presentation as a component-unit, a presentation mandated by state law. Individual fund data for each of these non-major governmental funds is provided in the form of combining statements elsewhere in the report. The County adopts an annual appropriated budget for its general fund and special revenue funds, including Schools. Budgetary comparison statements have been provided for these funds to demonstrate compliance with this budget. The governmental fund financial statements can be found in Exhibit 3, Exhibit 3(A), Exhibit 4, Exhibit 4(A), Exhibit 5, Exhibit A-1 through Exhibit C-2, Exhibit G-1 through Exhibit G-3, Exhibit X and Exhibit Y of this report. Proprietary funds. The County maintains two different types of proprietary funds. Enterprise funds are used to report the same functions presented as business-type activities in the government-wide financial statements. The County uses enterprise funds to account for its water and sewer operations, its public parking garage operations, including the Eighth-Level Ballston Public Parking Garage, and the Community Planning Housing Development (CPHD) Fund. Internal service funds are an accounting device used to accumulate and allocate costs internally among the County’s various functions. The County uses internal service funds to account for its fleet of vehicles, and printing operation. Because these services predominantly benefit governmental rather than business-type functions, they have been included within governmental activities in the government-wide financial statements. Proprietary funds provide the same type of information as the government-wide financial statements, only in more detail. The proprietary fund financial statements provide separate information for the water and sewer operations, public parking garage operations, including the Eighth-Level Ballston Public Parking Garage, and the CPHD Development Fund. The water and sewer operations and public parking garage are considered to be major funds of the County. Conversely, the two internal service funds are combined into a single, aggregated presentation in the proprietary fund financial statements. Individual fund data for the internal service funds is provided in the form of combining statements elsewhere in this report. The basic proprietary fund financial statements can be found in Exhibits 6, 7, 8 and Exhibit D-1 through Exhibit E-3 of this report. Fiduciary funds. Fiduciary funds are used to account for resources held for the benefit of parties outside the government. Fiduciary funds are not reflected in the government-wide financial statements because the resources of those are not available to support the County’s own programs. The OPEB trust funds are used to account for the assets held in trust by the County and Schools for other post-employment benefits. The accounting used for fiduciary funds is much like that used for proprietary funds. The basic fiduciary fund financial statements can be found in Exhibits 9 and 10, Exhibit F-1 through Exhibit F-5 and Exhibit G-4 and Exhibit G-5 of this report. Notes to the financial statements. The notes provide additional information that is essential to a full understanding of the data provided in the government-wide and fund financial statements. The notes to the financial statements can be found in the section titled “NOTES TO THE FINANCIAL STATEMENTS” of this report. Statement of Net Positions The following table (Table A-1) reflects the condensed statement of net positions for FY 2014 and FY 2013:
21

Table A-1 Condensed Net Positions
June 30, 2014 With Comparative Totals for June 30, 2013
(in millions of dollars)
Component UnitsGates
Business-type Activities Total
2014 2013 2014 2013 2014 2013 2014 2013 2014 2013 2014 2013
Current and other assets $1,082.8 $993.9 $119.4 $122.2 $1,202.2 $1,116.1 $194.0 $191.5 $7.7 $8.1 $1,403.9 $1,315.7Capital assets 1,000.4 952.0 1,032.6 1,024.9 2,033.0 1,976.9 539.8 525.3 78.6 80.4 2,651.4 2,582.6 Total assets 2,083.2 1,945.9 1,152.0 1,147.1 3,235.2 3,093.0 733.8 716.8 86.3 88.5 4,055.3 3,898.3
Long-term debt outstanding 1,012.1 1,011.4 395.1 414.6 1,407.2 1,426.0 37.9 40.0 55.5 56.4 1,500.6 1,522.4Other liabilities 167.4 182.3 22.5 22.5 189.9 204.8 91.2 89.8 3.7 5.0 284.8 299.6 Total liabilities 1,179.5 1,193.7 417.6 437.1 1,597.1 1,630.8 129.1 129.8 59.2 61.4 1,785.4 1,822.0
Deferred Inflows 19.1 - - - 19.1 - - - - - 19.1 -Total liabilities and deferred inflows 1,198.6 1,193.7 417.6 437.1 1,616.2 1,630.8 129.1 129.8 59.2 61.4 1,804.5 1,822.0
Net Positions: Investment in capital assets 527.7 476.4 667.6 648.3 1,195.3 1,124.7 535.3 520.3 23.8 24.6 1,754.5 1,669.6 Restricted 303.1 267.3 - - 303.1 267.3 69.4 66.7 - - 372.6 334.0 Unrestricted 53.8 8.5 66.8 61.7 120.6 70.2 - - 3.3 2.5 123.9 72.7
Total Net Positions $884.7 $752.2 $734.4 $710.0 $1,619.1 $1,462.2 $604.7 $587.0 $27.3 $27.1 $2,251.0 $2,076.3
Note: Totals may not add due to rounding.
Primary Government
Governmental Activities Total Schools Partnership
Government-wide Financial Analysis As noted earlier, net position may serve over time as a useful indicator of government’s financial position. In the case of the governmental activities, assets exceeded liabilities by $884.7 and in the case of the business-type activities, assets exceeded liabilities by $734.4 for a primary government total of $1,619.1 at the close of the most recent fiscal year. In the case of the Schools, assets exceeded liabilities by $604.7, and in the case of the Gates Partnership, assets exceeded liabilities by $27.2. By far the largest portion of the primary government’s, Schools’, Gates Partnership’s net positions (77.9%) reflects the investment in capital assets (e.g., land, buildings, machinery, and equipment), less any related debt used to acquire those assets that is still outstanding. The primary government and Schools use these capital assets to provide services to citizens; consequently, these assets are not available for future spending. Although the primary government’s, and Schools’ investment in its capital assets is reported net of related debt, it should be noted that the resources needed to repay this debt must be provided from other sources, since the capital assets themselves cannot be used to liquidate these liabilities. An additional portion of the primary government’s and Schools’ net positions, (16.5%) represents resources that are subject to external restrictions on how they may be used. Any remaining net positions are classified as “Unrestricted net positions”. In Virginia, state law provides that a school board is a separate legal entity and has long held that school boards hold title to all school assets. However, whether separately elected or appointed by the governing body, Virginia’s local school boards do not have the power to levy and collect taxes or issue debt. Purchases of school equipment, buildings or improvements (fixed assets) to be funded by debt financing require the local government to issue the debt. To accommodate Governmental Accounting Standards Board (GASB) Statement No. 34, a state law was passed in FY 2002 to allow the County and Schools to consider the debt-financed School assets owned by “tenancy in common” and would permit the County to display these assets in the County column. The County has chosen not to do so. Accordingly, in the government-wide financial statements, the “school debt” is reflected in the governmental activities column of the primary government, although the capital assets are reflected in the “Component–unit Schools” column. The final “Total” column, which displays the “Unrestricted capital assets” for the entire government, gives a more complete picture of debt-financed capital assets. At the end of the current fiscal year, the primary government and component units are able to report positive balances in all three categories of net positions for the government as a whole. Statement of Changes in Net Positions The following table (Table A-2) displays the changes in net positions for FY 2014 and FY 2013:
22

Table A-2 Changes in Net Positions Year Ended June 30, 2014
With Comparative Totals for June 30, 2013 (in millions of dollars)
Component Units
Governmental Activities Business-type Activities
2014 2013 2014 2013 2014 2013 2014 2013 2014 2013 2014 2013RevenuesProgram revenue Charges for services $78.8 $71.2 $125.0 $127.0 $203.8 $198.2 $21.0 $23.9 $7.4 $7.4 $232.4 $229.5 Operating grants and contributions 134.8 120.8 - - 134.8 120.8 465.7 507.0 - - 600.5 627.8 Capital grants and contributions - - 3.8 6.3 3.8 6.3 - - - - 3.8 6.3 General revenue 0.0 Property taxes 794.7 755.6 - - 794.7 755.6 - - - - 794.7 755.6 Other local taxes 202.4 205.0 - - 202.4 205.0 19.4 18.2 - - 221.8 223.2 Investment and interest earnings 6.6 4.3 0.2 - 6.8 4.3 0.1 0.1 - - 6.9 4.4 Miscellaneous 34.4 50.2 - - 34.4 50.2 - - 0.1 - 34.5 50.2
Total revenues 1,251.7 1207.1 129.0 133.3 1,380.7 1,340.5 506.2 549.2 7.5 7.4 1,894.6 1,897.20
Expenses General government 238.9 197.9 - - 238.9 197.9 - - - - 238.9 197.9 Public safety 126.2 121.0 - - 126.2 121.0 - - - - 126.2 121.0 Environmental services 89.8 84.4 - - 89.8 84.4 - - - - 89.8 84.4 Health and welfare 117.6 113.9 - - 117.6 113.9 - - - - 117.6 113.9 Libraries 12.8 12.5 - - 12.8 12.5 - - - - 12.8 12.5 Parks, culture and recreation 37.4 36.1 - - 37.4 36.1 - - - - 37.4 36.1 Planning and community development 61.7 60.4 - - 61.7 60.4 - - - - 61.7 60.4 Education 418.1 462.6 - - 418.1 462.6 488.4 485.1 - - 906.5 947.7 Debt service: Interest and other charges 16.8 28.1 - - 16.8 28.1 - - - - 16.8 28.1 Water and sewer - - 85.4 93.6 85.4 93.6 - - - - 85.4 93.6 Parking garage - - 5.4 5.8 5.4 5.8 - - - - 5.4 5.8 8th Level Ballston Public Parking Garage - - 0.1 - 0.1 0.1 - - - - 0.1 0.1 Rental Properties - - - - - - - - 7.4 7.4 7.4 7.4 CPHD Development Fund - - 13.7 12.2 13.7 12.2 - - - - 13.7 12.2 Total expenses 1,119.3 1,116.9 104.6 111.6 1,223.9 1,228.6 488.4 485.1 7.4 7.4 1,719.8 1,721.1
Increase/(Decrease) in Net Positions $132.4 $90.2 $24.4 $21.7 $156.9 $111.9 $17.8 $64.1 $0.1 $0.0 $174.8 $176.3
Note: Totals may not add due to rounding.
Total
Primary Government
Total Schools Gates Partnership
To summarize, the activities of the primary government and component units increased net positions as follows:
Governmental activities $132.4 75.7% Business type activities $24.4 14.0% Component-unit Schools $17.8 10.2% Component-unit Gates Partnership $0.1 0.1%
Total $174.8 100.0%
Revenues. Revenues for the County’s governmental activities were $1,251.7 for fiscal year 2014. General revenues from governmental activities increased $44.6, primarily due to increases in property tax revenue and a moderate increase in charges for services and operating grants. These increases were partially offset by decrease in other local taxes and miscellaneous revenue.
Taxes constitute the largest source of County revenues, amounting to $997.10 for fiscal year 2014, an increase of $36.5 over fiscal year 2013. Real estate taxes increased by $35.43 to $684.7 due to increased assessments and the CY 2013 tax rate increase of $0.35 per $100 of assessed property value, partially offset by the CY 2014 tax rate decrease of $0.01 per $100 of assessed property value. Personal property taxes increased $3.8 to $110.7 partially due to very modest increases in the average assessed value of cars and the number of cars registered within the County. The other local taxes revenue category, which includes taxes on business licenses, general sales tax, hotel rooms, restaurant meals, utility purchases, car rentals, cigarettes and other totaled $202.4 which represents $2.5 decrease from the previous year. This decrease is primarily attributable to decreases in recordation, transient occupancy, car rental, and sales taxes, partially offset by slight increases in business license, meals, and utility taxes. Program revenues are derived directly from the program itself and reduce the net cost of the function to the County. Total program revenues from governmental activities were $213.6. Operating Grants and Contributions represent the most significant of these revenues, totaling $134.8. Other program revenue category was Charges for Services, totaling $78.8. For additional information and comparative results, see Table A-2.
23
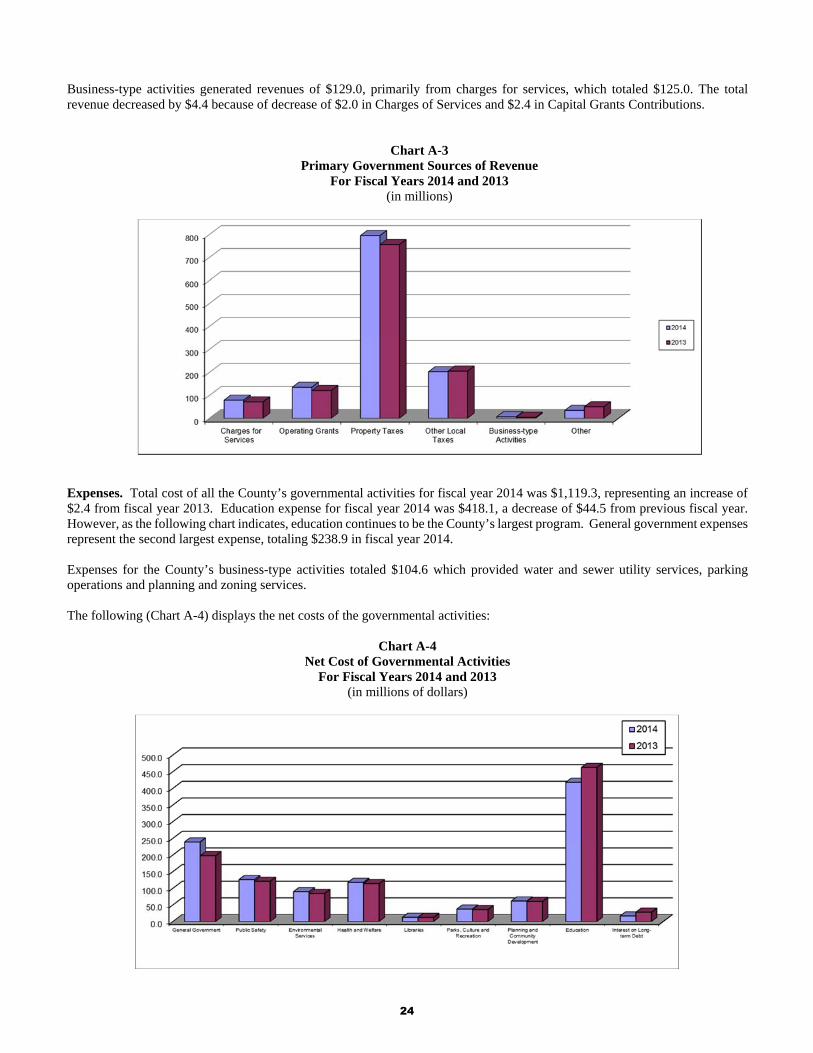
Business-type activities generated revenues of $129.0, primarily from charges for services, which totaled $125.0. The total revenue decreased by $4.4 because of decrease of $2.0 in Charges of Services and $2.4 in Capital Grants Contributions.
Chart A-3
Primary Government Sources of Revenue For Fiscal Years 2014 and 2013
(in millions)
Expenses. Total cost of all the County’s governmental activities for fiscal year 2014 was $1,119.3, representing an increase of $2.4 from fiscal year 2013. Education expense for fiscal year 2014 was $418.1, a decrease of $44.5 from previous fiscal year. However, as the following chart indicates, education continues to be the County’s largest program. General government expenses represent the second largest expense, totaling $238.9 in fiscal year 2014.
Expenses for the County’s business-type activities totaled $104.6 which provided water and sewer utility services, parking operations and planning and zoning services.
The following (Chart A-4) displays the net costs of the governmental activities:
Chart A-4 Net Cost of Governmental Activities
For Fiscal Years 2014 and 2013 (in millions of dollars)
24

Financial Analysis of the Government’s Funds As noted earlier, the County and Schools use fund accounting to ensure and demonstrate compliance with finance-related legal requirements. Governmental funds. The focus of the County’s and Schools governmental funds is to provide information on near-term inflows, outflows, and balances of expendable resources. Such information is useful in assessing the County’s and Schools financial requirements. In particular, unrestricted (committed and assigned) fund balance may serve as a useful measure of a government’s net resources available for spending at the end of the fiscal year. As of the end of the current fiscal year, the County’s governmental funds reported combined ending fund balances of $536.2 an increase of $69.3 in comparison with the prior year. Approximately, 93.55% of this total amount ($501.6) constitutes unrestricted fund balance and is comprised of - $446.1 is committed fund balance which can only be used for the specific purposes imposed by formal action of the County Board and $55.5 is assigned fund balance which applies to amounts that are intended for specific purposes but do not meet the criteria to be classified as restricted or committed. The general fund is a major governmental fund of the County. At the end of the current fiscal year, committed and assigned fund balance of the general fund was $230.5 while total fund balance reached $233.1. As a measure of the general fund’s liquidity, it may be useful to compare both committed and assigned fund balances and total fund balance to total expenditures. In FY2014, both committed and assigned fund balance and total fund balance represents 21.52% and 21.75% of total general fund expenditures respectively. The fund balance of the County’s general fund increased by $33.4 during the current fiscal year; driven by higher revenue than anticipated primarily due to taxes and department expenditure savings. The general capital projects fund is another major fund of the County. At the end of the current fiscal year, total fund balance of the general capital projects fund was $80.7. As a measure of the general capital project fund’s liquidity, it may be useful to compare total fund balance to total expenditures. Total fund balance represents 242.72% of total general capital project fund expenditures. The fund balance of the County’s general capital projects fund increased by $21.9 during the current fiscal year. This is due to combination of increase in revenue of $6.5 ($24.1 of revenues in FY14 compared to $17.6 in FY13) as well as decrease in capital outlay of $18.7 ($37.2 of expenditures in FY14 vs $56.1 in FY13). Proprietary funds. The County’s proprietary funds provide the same type of information found in the government-wide financial statements, but in more detail. Unrestricted net positions (deficits) of the Utilities Fund at the end of the fiscal year amounted to $69.6, the Ballston Public Parking Garage Fund amounted to ($21.3), 8th Level of the Ballston Public Parking Garage amounted to $.3, and the CPHD Development Fund amounted to $18.2. The total change in net positions of the Utilities Fund was $22.8, the Ballston Public Parking Garage Fund was ($.9), the 8th Level of the Ballston Public Parking Garage Fund was $1.5, and CPHD Development Fund was $.9. Other factors concerning the finances of these funds have been addressed in the discussion of the County’s business-type activities. General Fund Budgetary Highlights At the end of fiscal year 2014, the difference in General Fund balance between the original (adopted) budget and the final budget was $127.4 million, which was primarily due to the increased expenditure budget in the following:
73.1 million in increases allocated to Non-Departmental for affordable housing, budget stabilization contingency, master
lease financing, and incomplete projects from FY 2013. This includes $3.9 million allocated to Non-Departmental for planning projects, consultant contingent, public safety technology, funding for the new homeless services center and County office space, an agreement with Dominion Power for pole attachments, and Four Mile Run as a result of FY 2013 closeout. In addition, $18.1 million increase in transfer to Pay as You Go funding for capital projects.
$4.5 million in increases from grants funding to the Police Department, Office of Emergency Management, and Fire department for equipment purchases, training, software, and emergency preparedness.
$3.0 million in increases allocated to the Department of Environmental Services for carryover of incomplete projects from prior years, and additional funding relating to commuter services program and Northern Virginia Transportation Commission funding for bus services (ART Route 43).
25

$1.3 million in increases allocated to the Judicial Administration. This includes grant funding relating to gangs and carryover of incomplete project from prior years for digital conversion, seized assets, and grant funding for Drug Court.
$0.5 million in increases allocated to Planning and Community Development from carryover of incomplete projects from prior years for planning and grant-related activities, technology support, housing needs survey funding, MIPAP, and neighborhood services.
$2.5 million in increases allocated to the General Government from carryover of incomplete projects from prior years, including Microsoft agreements, network security, funding for a healthcare consultant, and a barrier analysis.
$6.5 million in increases allocated to the Department of Human Services through carryover of incomplete projects for prior years as well as new grants and funding for a wide variety of services for persons with mental illness, substance abuse services, emergency assistance, transportation, homelessness prevention, housing assistance resources, and employment and health services.
$2.1 million in increases allocated to the Department of Parks and Recreation in grant and FY 2013 carryover funding for a variety of services, including program revenue and expense for various supplemental fee programs, program review, public space master plan, safety equipment, wetlands restoration, urban agriculture, mowing services for schools, and moving funds from trust and agency to the general fund.
$21.7 million increase in transfers out to the Schools, primarily as a result of FY 2013 closeout. At the end of fiscal year 2014, the difference in General Fund balance between the final budget and actual was $160.7 million which consisted of a $117.8 million favorable expenditure variance and a $40.4 million favorable revenue variance and $2.5 million favorable other financing source activities. The favorable expenditure variance consisted of the following:
The $64.9 million favorable expenditure balance in Non-Departmental is primarily due to the affordable housing investment fund and under expenditures in lease purchase, consultants, contingent funds, and OPEB contributions.
$2.5 million favorable expenditure balance in General Government Administration primarily due to position vacancies, savings in consultants, recruitment and safety.
$3.0 million favorable in Parks and Recreation primarily due to vacancy savings and contractual services. $1.1 million favorable in Planning and Community Development primarily due to position vacancies and under
expenditures in contracted services. $1.7 million favorable in Environmental Services primarily due to position vacancies, overtime savings, and expenditure
reductions in contracted services and regional programs and Freshaire programs. $10.3 million favorable in Department of Human Services primarily due to under expenditures in various program areas
and staff vacancies. This also includes $3.0 million in delays in spending grant funds (which will be carried over and expended in FY 2015).
$3.5 million favorable in Public Safety primarily due to position vacancies and under expenditures in contracted services and operating supplies.
$0.2 million favorable in Judicial Administration primarily due to position vacancies, unexpended grants, seized asset funding and other incomplete projects which will be carried forward and expended in the next fiscal years.
$30.1 million favorable in the schools transfer; unspent balances will be carried over to the next fiscal year for the schools.
$2.4 million in premium related to the sale of bonds.
Additional information on the County’s statement of revenues, expenditures and changes in fund balance, budget and actual can be found in Exhibit 5 in Basic Financial Statements of this report. Capital Asset and Debt Administration Capital assets. The County’s investment in capital assets for its governmental, business type activities, and component units as of June 30, 2014 amounts to $2,651.7 (net of accumulated depreciation). This investment in capital assets includes land, building and systems, improvements, machinery and equipment, park facilities, roads, highways, and bridges and intangible assets. Major capital asset acquisitions during the current fiscal year from the capital projects funds included the following:
$16.2 million for Parks and Recreation center improvements including Arlington Mill Community Center, playgrounds, land acquisition, and field and court upgrades.
$11.3 million for Government facilities construction including the Homeless Services Center, Arlington Mill Community Center, DHS Consolidation at Sequoia, Fire Training Academy, and maintenance capital improvements at the Detention Facility, Central Library and the Equipment Bureau.
26

$4.8 million for Neighborhood Conservation projects to include improvements to streetlights, sidewalks, and parks, and construction of neighborhood beautification projects,
$7.5 million for Information Technology investments including PC replacement, public safety mobile data computers and infrastructure, police in-car cameras, network refreshment, remote access hardware, and network security.
$1.2 million for Capital funding contributions to several regional organizations such as Northern Virginia Community College and the Northern Virginia Criminal Justice Academy which provide beneficial services to Arlington residents and visitors.
$2.6 million for shared facilities and infrastructure with Arlington Public Schools $10.3 million for locality’s share of the regional Metro projects. $12.2 million for the Rosslyn Metro Station Improvements, Potomac Yard Transitway, Art Bus procurement, Streetcar
planning and engineering and other transit projects $3.1 million for traffic and pedestrian signal upgrades $0.2 million for street light installation and LED conversion $2.1 million for bicycle and pedestrian safety improvements $5.8 million for paving $0.4 million for bridge maintenance $9.1 million for safety and capacity improvements to arterial streets such as Pentagon City Multi-Modal
improvements and along Columbia Pike corridor
The following table (Table A-5) displays the capital assets:
Table A-5 Capital Assets June 30, 2014
With Comparative Totals for June 30, 2013 (net of depreciation, in millions of dollars)
Component Units
GatesBusiness-type Activities
2014 2013 2014 2013 2014 2013 2014 2013 2014 2013 2014 2013
Land $164.5 $160.9 $6.2 $6.2 $170.7 $167.1 $4.7 $4.7 $13.3 $13.3 $188.7 $185.1Buildings 234.2 225.1 12.6 9.7 246.8 234.8 507.4 494.2 65.3 67.0 819.5 796.0 Equipment 102.8 93.6 2.5 2.5 105.3 96.1 27.8 26.4 - - 133.1 122.5 Infrastructure 238.8 204.7 - - 238.8 204.7 - - - - 238.8 204.7 Intangible assets 2.3 1.4 0.4 0.6 2.7 2.0 - - - - 2.7 2.0 Plant -sewer system - - 253.1 247.9 253.1 247.9 - - - - 253.1 247.9 Plant - water system - - 631.9 634.3 631.9 634.3 - - - - 631.9 634.3 Construction in progress 220.5 232.1 125.9 123.6 346.4 355.7 - - - - 346.4 355.7 Internal service funds 37.4 34.2 - - 37.4 34.2 - - - - 37.4 34.2
Total $1,000.5 $952.0 $1,032.6 $1,024.8 $2,033.1 $1,976.8 $539.9 $525.2 $78.7 $80.4 $2,651.7 $2,582.5
Note: Totals may not add due to rounding
Total
Primary Government
Governmental Activities Total Schools Partnership
Additional information on the County’s capital assets can be found in Note 5 in Notes to the Financial Statements of this report. Long-term debt. At the end of the current fiscal year, the primary government and component units had total long-term liabilities outstanding of $1,501.7. Of this amount, $1,280.4 comprises general obligation bonds, notes payable and related accrued interest and capital leases backed by the full faith and credit of the government. The remainder of the County’s debt ($221.3) represents bonds secured solely by specified revenue sources (i.e., revenue bonds) ($148.7), workers compensation reserves ($3.4) and accrued compensated absences ($69.2). The following table (Table A-6) reflects the long-term debt:
27

Table A-6 Arlington County Outstanding Debt
June 30, 2014 With Comparative Totals for June 30, 2013
(in millions of dollars)
2014 2013 2014 2013 2014 2013 2014 2013 2014 2013 2014 2013
General obligation bonds** $838.3 $832.1 $119.2 $126.5 $957.5 $958.6 $- $- $- $- $957.5 $958.6Revenue bonds - - 8.9 9.4 8.9 9.4 - - - - 8.9 9.4IDA Revenue Bonds 116.5 125.3 - - 116.5 125.3 - - - - 116.5 125.3Mortgage payable - - 3.4 3.4 3.4 3.4 - - 19.9 20.1 23.3 23.5Note payable - - 233.3 246.2 233.3 246.2 - - 8.6 8.1 241.9 254.3Obligations under capital lease 20.0 17.3 0.1 0.2 20.1 17.5 4.5 5.0 - - 24.6 22.5Worker's compensation claims 3.4 3.8 - - 3.4 3.8 - - - - 3.4 3.8Accrued compensated absences 33.9 33.0 1.9 2.0 35.8 35.0 33.4 34.9 - - 69.2 69.9Mortgage and bond interest payable - - 28.5 26.9 28.5 26.9 - - - - 28.5 26.9Bonds Payable - - - - - - - - 27.1 28.2 27.1 28.2Development fee payable - - - - - - - - 0.8 - 0.8 -
Total $1,012.1 $1,011.5 $395.3 $414.6 $1,407.4 $1,426.1 $37.9 $39.9 $56.4 $56.4 $1,501.7 $1,522.4
Note: Totals may not add due to rounding** General fund is responsible for bond-financed school capital assets
Primary Government
Schools Gates Partnership TotalGovernmental
ActivitiesBusiness-type
Activities Total
Component Units
The County’s total debt decreased by $20.1 during the current fiscal year. The key factors that contributed to this change include decreases of $8.3 on IDA revenue bonds, and $12.9 on VRA note payable. The County maintains a “AAA” rating from Standard & Poor’s and Fitch Investor Services and a “Aaa” rating from Moody’s Investor Service for general obligation debt. Additional information of the County’s long-term debt can be found in Note 9 in Notes to the Financial Statements of this report. Economic Factors and Next Year’s Budgets and Rates
The unemployment rate for the County is currently 3.6%, which is a decrease of 0.4% from a year ago. This compares favorably to the Northern Virginia’s average unemployment rate of 5.9% and the national average rate of 6.3%.
The vacancy rate of the County’s office buildings increased from 17.1% to 20.4%. Inflationary trends in the region compare favorably to national indices.
All of these factors were considered in preparing the County’s budget for the 2015 fiscal year. Requests for Information This financial report is designed to provide a general overview of the County’s finances for all those with an interest in the government’s finances. Questions concerning any of the information provided in this report or requests for additional financial information should be addressed to Department of Management and Finance, 2100 Clarendon Boulevard, Suite 501, Arlington, Virginia, 22201, or at www.arlingtonva.us/dmf.
28

Basic Financial Statements are the core of general-purpose external financial reporting for state and local governments. Basic Financial Statements have three components:
Government-wide financial statements which include the Statement of Net Assets and the Statement of Activities.
Fund financial statements which include separate sets
of financial statements for governmental funds, proprietary funds and fiduciary funds.
Notes to the financial statements.
Basic Financial Statements
29

EXHIBIT 1
Component Units
Governmental Business-Type Gates Total
Activities Activities Total Schools Partnership Government
ASSETS:
Equity in pooled cash and investments $655,004,159 $96,573,799 $751,577,958 $103,797,411 $1,944,016 $857,319,385
Petty cash 1,950 - 1,950 815 - 2,765
Cash with fiscal agents 272,176 25,221 297,397 - - 297,397
Receivables, net 404,796,936 18,818,703 423,615,639 4,442,209 58,697 428,116,545
Receivable from primary government - - - 85,647,645 - 85,647,645
Receivable from other governments 5,570,514 - 5,570,514 - - 5,570,514
Inventory - 1,365,393 1,365,393 166,293 - 1,531,686
Other assets 17,115,392 2,635,744 19,751,136 - 1,601,204 21,352,340
Reserves and escrow deposits - - - - 4,140,104 4,140,104
OPEB 352,496 - 352,496 - - 352,496
Capital assets:
Land 164,478,229 6,161,255 170,639,484 4,697,946 13,369,961 188,707,391
Intangible assets, net 2,374,857 394,983 2,769,840 - - 2,769,840
Depreciable, net 613,127,891 900,072,159 1,513,200,050 535,180,630 65,285,878 2,113,666,558
Construction in progress 220,497,892 125,999,949 346,497,841 - - 346,497,841
Total capital assets, net 1,000,478,869 1,032,628,346 2,033,107,215 539,878,576 78,655,839 2,651,641,630
Total assets 2,083,592,492 1,152,047,206 3,235,639,698 733,932,949 86,399,860 4,055,972,507
LIABILITIES:
Accounts payable 20,496,936 10,619,808 31,116,744 9,703,554 340,784 41,161,082
Unearned revenue 22,558,111 - 22,558,111 681,792 - 23,239,903
Due to component unit 85,647,645 - 85,647,645 - - 85,647,645
Accrued liabilities 21,890,610 11,933,079 33,823,689 55,735,206 1,118,921 90,677,816
Other liabilities 17,187,561 - 17,187,561 10,483,254 1,347,660 29,018,475
Non-current liabilities:
Development fee payable - - - - 883,713 883,713
OPEB liability - - - 14,626,895 - 14,626,895
Due within one year 85,118,474 53,886,421 139,004,895 5,421,763 691,278 145,117,936
Due in more than one year 926,941,941 341,175,279 1,268,117,220 32,541,142 54,843,971 1,355,502,333
Total liabilities 1,179,841,278 417,614,587 1,597,455,865 129,193,606 59,226,327 1,785,875,798
Deferred Inflows 19,072,342 - 19,072,342 - - 19,072,342
Total liability and deferred inflows 1,198,913,620 417,614,587 1,616,528,207 129,193,606 59,226,327 1,804,948,140
NET POSITION:
Net investment in capital assets 527,691,722 667,676,811 1,195,368,533 535,315,558 23,811,868 1,754,495,959
Restricted for:
Capital projects 300,867,564 - 300,867,564 57,977,311 - 358,844,875
Other projects 2,290,690 - 2,290,690 11,446,474 - 13,737,164
Unrestricted 53,828,896 66,755,808 120,584,704 - 3,361,665 123,946,369
Total net position $884,678,872 $734,432,619 $1,619,111,491 $604,739,343 $27,173,533 $2,251,024,367
The notes to the financial statements are an integral part of this statement.
Primary Government
ARLINGTON COUNTY, VIRGINIA
STATEMENT OF NET POSITION
JUNE 30, 2014
30

EXHIBIT 2
Charges for services Operating(Includes Licenses, Grants and Capital Grants Governmental Business-Type Gates
Functions/Programs Expenses Permits & Fees) Contributions & Contributions Activities Activities Total Schools PartnershipPrimary Government:Governmental Activities: General government $238,920,444 $20,009,810 $29,899,556 $- ($189,011,078) $- ($189,011,078) $- $- Public safety 126,239,238 11,590,616 11,570,161 - (103,078,461) - (103,078,461) - - Environmental services 89,774,303 26,811,532 9,809,437 - (53,153,334) - (53,153,334) - - Health & welfare 117,588,487 3,167,690 33,885,692 - (80,535,105) - (80,535,105) - - Libraries 12,784,342 533,958 176,293 - (12,074,091) - (12,074,091) - - Parks, recreation & culture 37,416,330 9,154,266 89,343 - (28,172,721) - (28,172,721) - - Planning & community development 61,703,864 7,591,659 49,426,107 - (4,686,098) - (4,686,098) - - Education 418,066,409 - - - (418,066,409) - (418,066,409) - - Interest and other charges 16,786,171 - - - (16,786,171) - (16,786,171) - -
Total governmental activities 1,119,279,588 78,859,531 134,856,589 - (905,563,468) - (905,563,468) - -
Business-type activities: Utilities 85,448,387 105,668,151 - 2,421,745 - 22,641,509 22,641,509 - - Ballston Public Parking Garage 5,315,660 4,411,414 - - - (904,246) (904,246) - - 8th Level Ballston Public Parking Garage 157,097 328,547 - 1,367,321 - 1,538,771 1,538,771 - - CPHD Development Fund 13,762,118 14,621,512 - - - 859,394 859,394 - - Total business-type activities 104,683,262 125,029,624 - 3,789,066 - 24,135,428 24,135,428 - -
Total Primary government 1,223,962,850 203,889,155 134,856,589 3,789,066 (905,563,468) 24,135,428 (881,428,040) - -
Component unit: Schools 488,403,844 21,075,957 465,682,654 - - - - (1,645,233) - Gates Partnership 7,468,573 7,489,067 - - - - - - 20,494 Total component units 495,872,417 28,565,024 465,682,654 - - - - (1,645,233) 20,494
General Revenues:Property Taxes:
Real estate property taxes 683,987,883 - 683,987,883 - -Personal property taxes 110,688,939 - 110,688,939 - -
Other Local taxes:Business, professional occupancy license taxes 62,752,491 - 62,752,491 - -Sales tax 39,046,328 - 39,046,328 19,368,052 -Meals tax 34,951,030 - 34,951,030 - -Transient tax 20,784,241 - 20,784,241 - -Utility tax 12,095,016 - 12,095,016 - -Recordation, car rental and other local taxes 32,745,168 - 32,745,168 - -
Investment and interest earnings 6,578,889 272,989 6,851,878 72,867 24,810 Miscellaneous 34,381,768 - 34,381,768 - 75,121
Total general revenues 1,038,011,753 272,989 1,038,284,742 19,440,919 99,931
Change in net position 132,448,285 24,408,417 156,856,702 17,795,686 120,425
Net position, beginning 752,230,587 710,024,202 1,462,254,789 586,943,657 27,053,108
Net position, ending $884,678,872 $734,432,619 $1,619,111,491 $604,739,343 $27,173,533
The notes to the financial statements are an integral part of this statement.
Program RevenuesComponent Units
ARLINGTON COUNTY, VIRGINIASTATEMENT OF ACTIVITIES
FOR THE YEAR ENDED JUNE 30, 2014
31

EXHIBIT 3
All Other Total
General General Capital Governmental Governmental
ASSETS Fund Projects Fund Funds Funds
Equity in pooled cash and investments $319,574,683 $91,294,484 $231,692,206 $642,561,373
Petty cash 1,950 - - 1,950
Cash with fiscal agents 272,176 - - 272,176
Receivables, net 377,657,651 2,143,969 22,655,671 402,457,291
Due from other funds 182,600 - - 182,600
Receivables from other governments 5,070,454 - 500,060 5,570,514
Other assets 15,197,337 - 1,292,866 16,490,203
Totals assets $717,956,851 $93,438,453 $256,140,803 $1,067,536,107
LIABILITIES
Accounts payable 7,403,093 4,055,051 7,556,682 19,014,826
Unearned revenue 15,309,223 7,248,888 - 22,558,111
Due to component unit 85,647,645 - - 85,647,645
Accrued liabilities 21,890,610 - - 21,890,610
Other liabilities 1,724,943 1,433,892 12,173,265 15,332,100
Total liabilities 131,975,514 12,737,831 19,729,947 164,443,292
Deferred Inflows 352,927,400 - 13,953,224 366,880,624
Total Liabilities and Deferred Inflows 484,902,914 12,737,831 33,683,171 531,323,916
FUND BALANCES
Non spendable:
Prepaid - - 1,292,866 1,292,866
Restricted for:
Seized assets 2,522,979 - - 2,522,979
Debt service - - 29,790,565 29,790,565
Grants - - 1,002,099 1,002,099
Committed to:
Self insurance reserve 5,000,000 - - 5,000,000
Subsequent years' County budget 4,860,024 - - 4,860,024
Capital projects 14,831,642 80,700,622 190,372,102 285,904,366
Operating reserve 54,575,340 - - 54,575,340
Economic & revenue stabilization contingent 3,000,000 - - 3,000,000
Incomplete projects 412,220 - - 412,220
Affordable Housing Investment Fund 45,631,924 - - 45,631,924
Subsequent years' School budget 46,735,944 - - 46,735,944
Assigned to:
Subsequent years' County budgets 15,593,759 - - 15,593,759
Subsequent years' County capital projects 11,782,428 - - 11,782,428
Operating reserves 2,810,020 - - 2,810,020
Fresh AIRE program 1,480,249 - - 1,480,249
Incomplete projects 3,772,275 - - 3,772,275
Affordable Housing Investment Fund 20,045,133 - - 20,045,133
Total fund balances 233,053,937 80,700,622 222,457,632 536,212,191
Total liabilities and fund balance $717,956,851 $93,438,453 $256,140,803 $1,067,536,107
ARLINGTON COUNTY, VIRGINIA
BALANCE SHEET
GOVERNMENTAL FUNDS
JUNE 30, 2014
The notes to the financial statements are an integral part of this statement.
32

EXHIBIT 3(A)
Total governmental fund balances $536,212,191
Amounts reported for governmental activities in the Statement of Net Position
are different because:
Capital assets used in governmental activities
are not financial resources and are not reported in the funds 963,117,037
Other long-term assets are not available to pay for
current period expenditures and are deferred in the funds 347,808,282
Long-term liabilities, including bonds payable, are
not due and payable in the current period and are not reported in the funds (1,005,865,063)
OPEB liabilities are not due and payable in the
current period and are not reported in the funds 352,496
Internal service funds 43,053,929
Net position of governmental activities $884,678,872
ARLINGTON COUNTY, VIRGINIA
RECONCILIATION OF TOTAL GOVERNMENTAL FUND BALANCES TO
NET POSITION OF GOVERNMENTAL ACTIVITIES
JUNE 30, 2014
The notes to the financial statements are an integral part of this statement.
33

EXHIBIT 4
All Other Total
General General Capital Governmental Governmental
Fund Projects Fund Funds Funds
REVENUES:
General property taxes:
Real estate property taxes $631,515,416 $- $37,040,760 $668,556,176
Personal property taxes 110,688,939 - - 110,688,939
Other local taxes:
Business, professional and occupancy license (BPOL) tax 62,752,491 - - 62,752,491
Sales tax 39,046,328 - - 39,046,328
Meals tax 34,951,030 - - 34,951,030
Transient tax 20,784,241 - - 20,784,241
Utility tax 12,095,016 - - 12,095,016
Recordation, car rental and other local taxes 25,205,143 - 7,540,025 32,745,168
Fines and forfeitures 8,113,863 - - 8,113,863
Licenses, permits and fees 12,396,844 - - 12,396,844
Intergovernmental 85,999,950 13,311,154 31,577,537 130,888,641
Charges for services 53,136,621 4,393,070 819,133 58,348,824
Interest and rent 6,414,252 - 164,638 6,578,890
Miscellaneous revenues 28,844,099 2,473,616 3,050 31,320,765
Total revenues 1,131,944,233 20,177,840 77,145,143 1,229,267,216
EXPENDITURES:
Current operating:
General government 218,071,915 645,155 6,426,089 225,143,159
Public safety 123,600,685 109,220 - 123,709,905
Environmental services 80,154,573 - - 80,154,573
Health and welfare 117,309,171 - - 117,309,171
Libraries 12,486,165 - - 12,486,165
Parks, recreation and culture 34,194,780 2,515 - 34,197,295
Planning and community development 21,199,554 124,008 27,666,755 48,990,317
Principal 38,279,170 - 321,460 38,600,630
Interest and other charges 17,606,604 - 351,957 17,958,561
Cost of refunding bonds - - (1,172,390) (1,172,390)
Intergovernmental
Community development - 1,214,210 10,290,000 11,504,210
Education - Schools 407,323,010 - 36,460,000 443,783,010
Capital outlay 1,257,715 31,153,074 44,700,760 77,111,549
Total expenditures 1,071,483,342 33,248,182 125,044,631 1,229,776,155
Excess(deficiency) of revenues over
expenditures 60,460,891 (13,070,342) (47,899,488) (508,939)
OTHER FINANCING SOURCES(USES):
Transfers in 368,089 29,553,643 - 29,921,732
Transfers out (29,816,042) - (238,089) (30,054,131)
Issuance of capital leases - 5,459,005 - 5,459,005
Issuance of refunding bonds - - 37,690,000 37,690,000
Payments to refunded bond escrow agent - - (38,862,390) (38,862,390)
Bond premium 2,442,072 - - 2,442,072
Issuance of general obligation debt - - 63,210,000 63,210,000
Total other financing sources and (uses) (27,005,881) 35,012,648 61,799,521 69,806,288
Net change in fund balances 33,455,010 21,942,306 13,900,033 69,297,349
Fund balances, beginning 199,598,927 58,758,316 208,557,599 466,914,842
Fund balances, ending $233,053,937 $80,700,622 $222,457,632 $536,212,191
The notes to the financial statements are an integral part of this statement.
ARLINGTON COUNTY, VIRGINIA
STATEMENT OF REVENUES, EXPENDITURES, AND CHANGES IN FUND BALANCES
GOVERNMENTAL FUNDS
FOR THE YEAR ENDED JUNE 30, 2014
34

EXHIBIT 4(A)
Net change in fund balances - total governmental funds $69,297,349
Amounts reported for governmental activities in the Statement
of Activities are different because:
Governmental funds report capital outlays as expenditures
while governmental activities report depreciation expense
to allocate those expenditures over the life of the assets.
Add: Capital acquisitions 77,111,546
Less: Depreciation expense (31,846,532) 45,265,014
Revenues in the Statement of Activities that do not provide
current financial resources are not reported as revenues in
the funds. 15,431,707
Bond proceeds provide current financial resources to the
governmental funds, but issuing debt increases long-term
liabilities in the Statement of Position. Repayment of bond
principal is an expenditure in the governmental funds, but the
repayment reduces long-term liabilities in the Statement of
Net Position.
Add: Debt repayment-debt principal 111,483,865
Less: Proceeds from bonds and capital leases (106,359,004)
Bond premium to be amortized (2,301,246)
Amortization and other charges (1,349,574) 1,474,041
Some expenses reported in the Statement of Activities do not
require the use of current financial resources and
are not reported as expenditures in governmental funds
such as compensated absences and workers compensation (586,062)
OPEB expenses reported in the Statement of Activities do not
require the use of current financial resources and
are not reported as expenditures in governmental funds 1,056,772
Internal service funds are used by management to charge the
costs of certain services to individual funds. The net revenue
(expense) of the internal service funds is reported by
governmental activities:
Additional expense for internal service 446,810
Net operating gain internal service funds 62,654 509,464
Change in net position of governmental activities $132,448,285
ARLINGTON COUNTY, VIRGINIA
RECONCILIATION OF THE STATEMENT OF REVENUES, EXPENDITURES,
AND CHANGES IN FUND BALANCES TO THE STATEMENT OF ACTIVITIES
FOR THE YEAR ENDED JUNE 30, 2014
The notes to the financial statements are an integral part of this statement.
35

EXHIBIT 5
Page 1 of 2
Budgeted Amounts
Variance
Original Final Actual Positive (Negative)
REVENUES:
General Property taxes:
Real estate $603,955,907 $603,033,449 $631,515,416 $28,481,967
Personal 106,500,000 106,500,000 110,688,939 4,188,939
Other Local taxes 195,695,000 195,695,000 194,834,249 (860,751)
Licenses, permits and fees 10,411,637 10,411,637 12,396,844 1,985,207
Charges for services 51,159,610 52,386,128 53,136,621 750,493
Fines and forfeitures 9,605,548 9,605,548 8,113,863 (1,491,685)
Grants:
State grants 64,888,782 69,777,014 67,984,661 (1,792,353)
Federal grants 14,506,102 18,844,633 18,015,289 (829,344)
Use of money and property 5,811,510 5,866,760 6,414,252 547,492
Miscellaneous revenue 28,972,707 19,394,204 28,844,099 9,449,895
Total revenues 1,091,506,803 1,091,514,373 1,131,944,233 40,429,860
EXPENDITURES:
General Government Administration
County Board 1,050,933 1,149,412 1,078,257 71,155
County Manager 5,132,881 5,160,483 5,191,702 (31,219)
Financial Management 6,792,326 6,792,326 6,018,001 774,325
Human Resources 8,380,437 8,742,437 7,908,723 833,714
Technology Services 16,998,579 18,879,880 18,319,387 560,493
County Attorney 2,536,808 2,570,719 2,653,243 (82,524)
Commissioner of Revenue 5,255,843 5,266,409 4,994,779 271,630
Treasurer 6,201,472 6,215,675 6,423,281 (207,606)
Electoral Board 1,214,817 1,314,349 1,020,051 294,298
Total General Government 53,564,096 56,091,690 53,607,424 2,484,266
Judicial Administration
Circuit Court & Circuit Court Judiciary 3,430,307 3,843,762 3,450,728 393,034
District Court 371,760 373,176 364,869 8,307
Juvenile & Domestic Relations Court 5,964,623 6,105,051 5,731,030 374,021
Commonwealth Attorney 4,037,100 4,174,814 3,981,380 193,434
Sheriff & Jail 37,207,931 37,784,494 38,526,817 (742,323)
Magistrate's Office 43,746 43,746 41,363 2,383
Total Judicial Administration 51,055,467 52,325,043 52,096,187 228,856
Public Safety
Police 61,647,300 64,789,260 60,965,129 3,824,131
Office of Emergency Management 10,505,165 11,254,353 10,966,169 288,184
Fire 50,993,422 51,663,185 52,274,199 (611,014)
Total Public Safety 123,145,887 127,706,798 124,205,497 3,501,301
Environmental Services 79,219,719 82,274,902 80,533,785 1,741,117
Health & Welfare 121,180,468 127,728,332 117,358,298 10,370,034
Libraries 12,526,566 12,744,549 12,493,400 251,149
ARLINGTON COUNTY, VIRGINIA
GENERAL FUND
STATEMENT OF REVENUES, EXPENDITURES AND CHANGES IN FUND BALANCE- BUDGET AND ACTUAL
FOR THE YEAR ENDED JUNE 30, 2014
The notes to the financial statements are an integral part of this statement.
36

EXHIBIT 5
Page 2 of 2
Budgeted Amounts
Variance
Original Final Actual Positive (Negative)
Planning & Community Development
Economic Development 10,097,867 11,144,190 10,829,236 314,954
Community Planning, Housing & development 10,733,322 11,194,329 10,377,073 817,256
Total Planning & Community Development 20,831,189 22,338,519 21,206,309 1,132,210
Parks and Recreation 35,161,920 37,268,040 34,273,106 2,994,934
Education 415,703,129 437,407,759 407,323,010 30,084,749
Non-Departmental
Non-Departmental 63,576,731 136,547,562 76,452,328 60,095,234
Debt Service
Principal payment 37,005,960 37,005,960 38,279,170 (1,273,210)
Interest payment 23,394,040 23,394,040 17,598,928 5,795,112
Other costs 200,000 200,000 7,676 192,324
Regionals/Contributions 7,860,712 7,990,495 7,854,224 136,271
METRO 28,194,000 28,194,000 28,194,000 -
Total Non-Departmental 160,231,443 233,332,057 168,386,326 64,945,731
Total expenditures 1,072,619,884 1,189,217,689 1,071,483,342 117,734,347
Excess of revenues over expenditures 18,886,919 (97,703,316) 60,460,891 158,164,207
OTHER FINANCING SOURCES (USES):
Transfers in 207,018 207,018 368,089 161,071
Transfers out (18,886,919) (29,749,496) (29,816,042) (66,546)
Premium from sale of bonds - - 2,442,072 2,442,072
Total other financing sources/(uses) (18,679,901) (29,542,478) (27,005,881) 2,536,597
Net change in fund balance 207,018 (127,245,794) 33,455,010 160,700,804
Fund Balance - beginning of year 199,598,927 199,598,927 199,598,927 -
Fund Balance - end of year $199,805,945 $72,353,133 $233,053,937 $160,700,804
The notes to the financial statements are an integral part of this statement.
FOR THE YEAR ENDED JUNE 30, 2014
ARLINGTON COUNTY, VIRGINIA
GENERAL FUND
STATEMENT OF REVENUES, EXPENDITURES AND CHANGES IN FUND BALANCE- BUDGET AND ACTUAL
37

EXHIBIT 6
Utilities
Ballston Public
Parking Garage
8th Level
Ballston Public
Parking Garage
CPHD
Development
Fund Total
Governmental
Activities
Internal
Service Funds
ASSETS:
Current assets:
Equity in pooled cash and investments $62,453,741 $14,468,987 $290,000 $19,361,071 $96,573,799 $12,442,786
Cash with fiscal agents 25,221 - - - 25,221 -
Receivables, net 18,817,533 1,170 - - 18,818,703 2,157,045
Inventory, at cost 1,365,393 - - - 1,365,393 625,189
Other current Assets 2,447,864 187,880 - - 2,635,744 -
Total current assets 85,109,752 14,658,037 290,000 19,361,071 119,418,860 $15,225,020
Non-current assets:
Capital assets:
Land 6,161,255 - - - 6,161,255 -
Depreciable, net 885,767,407 9,332,943 3,438,315 1,533,494 900,072,159 37,361,832
Intangible assets, net 31,889 - - 363,094 394,983 -
Construction in progress 125,971,069 28,880 - - 125,999,949 -
Total capital assets, net 1,017,931,620 9,361,823 3,438,315 1,896,588 1,032,628,346 37,361,832
Total non current assets 1,017,931,620 9,361,823 3,438,315 1,896,588 1,032,628,346 37,361,832
Total assets 1,103,041,372 24,019,860 3,728,315 21,257,659 1,152,047,206 52,586,852
LIABILITIES:
Current liabilities:
Accounts payable 9,771,387 372,971 - 475,450 10,619,808 1,482,110
Accrued liabilities 417,492 11,395,640 - 119,947 11,933,079 1,855,461
Due within one year 25,677,562 28,150,641 - 58,218 53,886,421 1,195,955
Total current liabilities 35,866,441 39,919,252 - 653,615 76,439,308 4,533,526
Non-current liabilities:
Due in more than one year 332,251,316 8,400,000 - 523,963 341,175,279 4,999,397
Total liabilities 368,117,757 48,319,252 - 1,177,578 417,614,587 9,532,923
NET POSITION:
Net investment in capital assets 665,309,764 (2,967,856) 3,438,315 1,896,588 667,676,811 31,693,675
Unrestricted 69,613,851 (21,331,536) 290,000 18,183,493 66,755,808 11,360,254
Total net position (deficit) $734,923,615 ($24,299,392) $3,728,315 $20,080,081 $734,432,619 $43,053,929
The notes to the financial statements are an integral part of this statement.
Business-type activities - Enterprise Funds
ARLINGTON COUNTY, VIRGINIA
STATEMENT OF NET POSITION - PROPRIETARY FUNDS
JUNE 30, 2014
38

EXHIBIT 7
Governmental8th Level CPHD Total Activities
Ballston Public Ballston Public Development Business-type Internal ServiceUtilities Parking Garage Parking Garage Fund Activities Funds
OPERATING REVENUES: Water-sewer service charges $88,880,766 $- $- $- $88,880,766 $- Water-service hook-up charges 5,499,780 - - - 5,499,780 - Water-service connection charges 1,412,500 - - - 1,412,500 - Sewage treatment service charges 6,553,790 - - - 6,553,790 - Permits and Fees - - - 14,621,512 14,621,512 - Other charges for services 3,321,315 - - - 3,321,315 23,761,795 Parking charges - 4,411,414 328,547 - 4,739,961 -
Total Operating revenues 105,668,151 4,411,414 328,547 14,621,512 125,029,624 23,761,795
OPERATING EXPENSES: Personnel services 13,841,929 - 5,229 5,918,129 19,765,287 4,175,915 Fringe benefits 4,987,709 - - 2,300,119 7,287,828 1,781,333 Cost of store issuances - - - - - 5,681,026 Contractual services 12,842,119 2,187,273 45,902 2,607,889 17,683,183 - Purchases of water 8,032,924 - - - 8,032,924 - Materials and supplies 9,028,776 298,650 32,810 364,255 9,724,491 328,887 Utilities - - - - - 202,281 Operating Equipment - - - - - 12,899 Outside services - - - - - 5,349,813 Depreciation 13,845,860 516,007 73,156 519,323 14,954,346 6,166,989 Amortization - 34,427 - - 34,427 - Deferred rent - 773,747 - - 773,747 - Equipment (Construction Contracts) 4,438,816 - - 294,031 4,732,847 - Internal Services - - - 1,758,372 1,758,372 - Miscellaneous 5,571,587 - - - 5,571,587 -
Total Operating expenses 72,589,720 3,810,104 157,097 13,762,118 90,319,039 23,699,143
Operating income 33,078,431 601,310 171,450 859,394 34,710,585 62,652
NON-OPERATING REVENUES(EXPENSES) Interest income and other income 192,461 7,482 - 73,046 272,989 - Interest expense and fiscal charges (12,955,913) (1,505,556) - - (14,461,469) - Interest payment on capital lease (4,781) - - - (4,781) (128,654) Gain on disposal of assets - - - - - 509,611
Total non-operating revenues(expenses) (12,768,233) (1,498,074) - 73,046 (14,193,261) 380,957
Net Income(loss) before contributions and transfers 20,310,198 (896,764) 171,450 932,440 20,517,324 443,609
CONTRIBUTIONS AND NET TRANSFERS Contributions from developers and other sources 2,421,745 - 1,367,321 - 3,789,066 - Transfers in 102,027 - - - 102,027 195,853 Transfers out - - - - - (130,000)
Total contributions and net transfers 2,523,772 - 1,367,321 - 3,891,093 65,853 `Change in net position 22,833,970 (896,764) 1,538,771 932,440 24,408,417 509,462
Net position - beginning of year 712,089,645 (23,402,628) 2,189,544 19,147,641 710,024,202 42,544,467
Net position - end of year $734,923,615 ($24,299,392) $3,728,315 $20,080,081 $734,432,619 $43,053,929
The notes to the financial statements are an integral part of this statement.
Business-type activities-Enterprise Funds
ARLINGTON COUNTY, VIRGINIASTATEMENT OF REVENUES, EXPENSES, AND CHANGES IN NET POSITION
PROPRIETARY FUNDSFOR THE YEAR ENDED JUNE 30, 2014
39

EXHIBIT 8
Utilities
Ballston Public
Parking Garage
8th Level
Ballston Public
Parking Garage
CPHD
Development
Fund Total
Governmental
Activities Internal
Service Funds
CASH FLOWS FROM OPERATING ACTIVITIES:
Cash received from customers $102,623,153 $4,412,374 ($497,820) $14,621,512 $121,159,219 $23,428,752
Cash paid to suppliers (40,178,635) (2,522,557) 75,705 (4,835,963) (47,461,450) (9,678,920)
Cash paid to employees (18,964,980) - - (8,233,522) (27,198,502) (5,988,883)
Net cash flows from operating activities 43,479,538 1,889,817 (422,115) 1,552,027 46,499,267 7,760,949
CASH FLOWS FROM INVESTING ACTIVITIES:
Interest received 192,461 7,482 - 73,046 272,989 -
Net cash flows from investing activities 192,461 7,482 - 73,046 272,989 -
CASH FLOWS FROM NON-CAPITAL FINANCING ACTIVITIES:
Transfer out to other funds - - - - - (130,000)
Contributions from developers and other sources - - 1,367,321 - 1,367,321 195,853
Net cash flows from (used by) non-capital financing
activities - - 1,367,321 - 1,367,321 65,853
CASH FLOWS FROM CAPITAL AND RELATED
FINANCING ACTIVITIES:
Principal payments - bonds (8,741,975) (500,000) - - (9,241,975) -
Proceeds from sale of general obligation bonds 1,700,000 - - - 1,700,000 -
Payments to bonds redeemed (2,857,610) - - - (2,857,610) -
Proceeds of bond refunding 2,765,000 - - - 2,765,000 -
Cost of refunding bonds 92,610 - - - 92,610 -
Bond premiums 151,932 - - - 151,932 -
Payment of principal on capital lease (29,631) - - - (29,631) (919,315)
Payment of interest on capital lease (4,781) - - - (4,781) (128,654)
Payment of VRA loan (12,910,836) - - - (12,910,836) -
Interest and other loan expenses paid (12,863,094) (129,401) - - (12,992,495) -
Purchases of property (18,376,289) - (2,318,656) - (20,694,945) (9,714,935)
Net cash flows from (used by) capital and related
financing activities (51,074,674) (629,401) (2,318,656) - (54,022,731) (7,404,269)
Net increase (decrease) in cash and cash equivalents (7,402,675) 1,267,898 (1,373,450) 1,625,073 (5,883,154) 422,533
Cash and cash equivalents at beginning of year 69,856,416 13,201,089 1,663,450 17,735,998 102,456,953 12,020,253
Cash and cash equivalents at end of year $62,453,741 $14,468,987 $290,000 $19,361,071 $96,573,799 $12,442,786
Reconciliation of operating income to net cash
flow from operations:
Operating Income $33,078,431 $601,310 $171,450 $859,394 $34,710,585 $62,652
Adjustments to reconcile operating income to
net cash provided by operating activities:
Depreciation and amortization 13,845,860 550,434 73,156 519,323 14,988,773 6,166,989
(Increase) Decrease in accounts receivable (3,054,099) 960 - - (3,053,139) (333,043)
(Increase) Decrease in inventories (60,526) - - - (60,526) 22,552
Increase (Decrease) in vouchers payable 1,057,189 (36,634) (626,968) 188,584 582,171 1,873,434
Increase (Decrease) in compensated absences (135,342) - (39,753) (15,274) (190,369) (31,635)
Increase (Decrease) in contract retainage (1,261,075) - - - (1,261,075) -
Increase (Decrease) in accrued rent liability - 773,747 - - 773,747 -
Increase (Decrease) in deferred revenue 9,100 - - - 9,100 -
Net cash flows from operations $43,479,538 $1,889,817 ($422,115) $1,552,027 $46,499,267 $7,760,949
Noncash investing, capital, and financing activities:
Contributions from developers and other sources $2,421,745 - - - $2,421,745 -
The notes to the financial statements are an integral part of this statement.
Business-type activities - Enterprise Funds
ARLINGTON COUNTY, VIRGINIA
STATEMENT OF CASH FLOWS
PROPRIETARY FUNDS
FOR THE YEAR ENDED JUNE 30, 2014
40

EXHIBIT 9
All Other
Pension OPEB Private Purpose Agency
Trust Fund Trust Fund Trust Funds Funds
ASSETS:
Equity in pooled cash and investments $48,957,591 $75,210,017 $2,165,335 $15,416,375
Contributions receivable:
Employer 2,309,178 - - -
Employee 491,263 - - -
Accrued interest and other receivables 968,676 - 581,231 -
Capital assets, net - - 24,047,544 -
Receivable from other government - - - 443,709
Investments, at fair value
Foreign, Municipal and U.S. Government
Obligations, including Fixed
Instruments in Pooled Funds 48,126,230 - - -
Corporate Fixed Income Obligations 156,725,323 - - -
Domestic and Foreign Equities, including
Equities in Pooled Funds 498,009,244 - - -
Other investments 46,210,495 - - -
Real estate funds 15,909,978 - - -
Pooled Equity 680,009,227 - - -
Pooled Fixed Income 282,336,657 - - -
Convertible 201,508,930 - - -
Collateral on Loaned Securities (net of
Allowance for Unrealized Gain $0.00) 22,360,164 - - -
Total assets 2,003,922,956 75,210,017 26,794,110 15,860,084
Deferred Outflows
Loss on refunding bonds, net - - 248,664 -
Total assets and deferred outflows 2,003,922,956 75,210,017 27,042,774 15,860,084
LIABILITIES:
Accounts payable and
accrued liabilities 1,993,555 - 591,296 15,860,084
Bonds payable - - 27,275,000 -
Obligations under security lending program 20,580,828 - - -
Total liabilities 22,574,383 - 27,866,296 15,860,084
NET POSITION (DEFICIT) $1,981,348,573 $75,210,017 ($823,522) $-
The notes to the financial statements are an integral part of this statement.
ARLINGTON COUNTY, VIRGINIA
STATEMENT OF FIDUCIARY NET POSITION
FIDUCIARY FUNDS
JUNE 30, 2014
41

EXHIBIT 10
All Other
Pension OPEB Private Purpose
Trust Fund Trust Fund Trust Funds
ADDITIONS:
Contributions and Revenues:
Employer contributions $53,718,087 $7,024,633 $-
Employee contributions 11,665,908 - -
Other contributions 204,465 66,546 -
Shared revenues - - 2,552,637
Private donations - - 59,268
Total contributions 65,588,460 7,091,179 2,611,905
Investment earnings:
Interest and other 42,021,035 4,127,906 459
Gross income from securities lending 190,665 - -
Bank fees and expenses from securities lending (48,568) - -
Commissions recapture, gross 942 - -
Net change in fair value of investments 270,414,540 5,908,921 -
Total investment earnings 312,578,614 10,036,827 459
Less investment expenses 5,929,040 - 1,412,492
Net investment earnings 306,649,574 10,036,827 (1,412,033)
Total additions 372,238,034 17,128,006 1,199,872
DEDUCTIONS:
Administrative expenses 1,405,980 20,352 1,014,752
Contributions to developers and other sources - - 100,000
Retirees pension expense 86,312,742 - -
Total deductions 87,718,722 20,352 1,114,752
Change in net position 284,519,312 17,107,654 85,120
Net position - Beginning of the year 1,696,829,261 58,102,363 (908,642)
Net position - End of the year $1,981,348,573 $75,210,017 ($823,522)
The notes to the financial statements are an integral part of this statement.
ARLINGTON COUNTY, VIRGINIA
STATEMENT OF CHANGES IN FIDUCIARY NET POSITION
FIDUCIARY FUNDS
FOR THE YEAR ENDED JUNE 30, 2014
42

ARLINGTON COUNTY, VIRGINIA
NOTES TO FINANCIAL STATEMENTS
JUNE 30, 2014
NOTE 1. Summary of Significant Accounting Policies The accompanying financial statements are prepared in accordance with generally accepted accounting principles ("GAAP") as applied to government units. The Governmental Accounting Standards Board ("GASB") is the accepted standard-setting body for establishing governmental accounting and financial reporting principles. The government's significant accounting policies are described below. I. Accounting Policies
A. The Financial Reporting Entity
Arlington County, Virginia (the "County") is a jurisdiction of the Commonwealth of Virginia and is governed by a five-member County Board. As required by GAAP, these financial statements present the County (primary government) and its component units, the Arlington County Public Schools (the “Schools”), and the AHC Limited Partnership-10/AHC Limited Partnership-11 (“the Gates Partnership”), entities for which the primary government is considered to be financially accountable. As discretely presented component units, the Schools, and Gates Partnership are reported in separate columns in the combined financial statements, to emphasize that they are legally separate from the County.
Discretely Presented Component Units Arlington County Public Schools (the "Schools") is a legally separate entity that provides educational services to
citizens of the County. It is administered by a five-member School Board that is elected by the citizens. The Schools is fiscally dependent on the County since it is not legally authorized to raise taxes or issue debt. The Auditor of Public Accounts of the Commonwealth of Virginia ("APA") is responsible for all financial reporting by jurisdictions within the Commonwealth. APA has determined that the Schools must be displayed as a discretely presented component unit in all the comprehensive annual financial reports of primary governments in the Commonwealth, which have responsibility for school systems. The Schools does not issue separate component unit financial statements and has a June 30 year-end.
AHC Limited Partnership-10 (AHC-10) and AHC Limited Partnership-11 (AHC-11) (collectively “the Gates Partnership”) are legally separate Virginia limited partnerships. AHC-10 is comprised of a managing general partner, the New Gates Corporation; a housing credit limited partner, Wachovia Guaranteed Tax Credit Fund, and a master tenant limited partner AHC-11. AHC-11 is comprised of a managing general partner Gates Housing Corporation and an investor limited partner Wachovia Affordable Housing Community Development Corporation.
Debt (Series 2006) was issued by the Industrial Development Authority of Arlington County, Virginia and the proceeds loaned to the Gates Partnership in order to acquire, rehabilitate, and equip a 464-unit multifamily apartment complex for rental to individuals and families of low-income known as the Gates of Ballston (the Project). The debt is projected to be repaid from the revenues generated by the Project. AHC-10 owns the Project, is the borrower on the debt, and leases the Project to AHC-11 under a master lease agreement; AHC-11 rents the Project units to subtenants, pays all operating expenses, and is responsible for making monthly lease payments to AHC-10. The Gates Partnership also has a mortgage note with the Virginia Housing Development Authority and a promissory note with the County. Subject to appropriation, the County will only be responsible for reimbursement of the debt service payments to the extent that the debt service reserve of the Gates Partnership is insufficient to make the required debt service payments. The County does not hold the corporate powers of the Gates Partnership, does not appoint the principals of the Gates Partnership, and does not have the ability to remove principals at will. Under certain conditions, it does have the ability to modify or approve the Gates Partnership’s budget, modify or approve rate or fee changes, and influence decisions about management or operations. It can also approve issuance of bonded debt and govern the Gates Partnership’s use of revenues, if these acts would adversely affect the ability of the Gates Partnership to make debt service payments. The criteria of imposition of will and fiscal dependency mandate the inclusion as a discrete component unit.
Complete financial statements of AHC Limited Partnership-10 and AHC Limited Partnership-11 may be obtained from Arlington Housing Corporation, 2300 Ninth Street, Suite 200, Arlington, Virginia 22204.
43

ARLINGTON COUNTY, VIRGINIA
NOTES TO FINANCIAL STATEMENTS
JUNE 30, 2014
B. Government-wide and Fund Financial Statements
The government-wide financial statements (i.e., the statement of net position and the statement of changes in net position)
report information on all of the non-fiduciary activities of the primary government and its component units. For the most part, the effect of interfund activity has been removed from these statements. Governmental activities are reported separately from business-type activities, which rely to a significant extent on fees and charges for support. Likewise, the primary government is reported separately from the legally separate component units for which the primary government is financially accountable.
The statement of activities demonstrates the degree to which the direct expenses of a given function or segment is offset
by program revenues. Direct expenses are those that are clearly identifiable with a specific function or segment. Program revenues include 1) charges to customers or applicants who purchase, use or directly benefit from goods, services, or privileges provided by a given function or segment and 2) grants and contributions that are restricted to meeting the operational or capital requirements of a particular function or segment. Taxes and other items not properly included among program revenues are reported instead as general revenues.
Separate financial statements are provided for governmental funds, proprietary funds, and fiduciary funds, even though
the latter are excluded from the government-wide financial statements. Major individual governmental funds and major individual enterprise funds are reported as separate columns in the fund financial statements.
C. Measurement Focus, Basis of Accounting, and Financial Statement Presentation
Governmental Accounting Standards Board Statement No. 34 “Basic Financial Statements and Management’s Discussion and Analysis for State and Local Governments (“GASB 34”) established that the basic financial statements and required supplementary information should consist of the following sections:
Management’s Discussion and Analysis (MD&A).
- MD&A will introduce the basic financial statements and provide an analytical overview of the government’s financial activities.
Basic financial statements. The basic financial statements include: - Government-wide financial statements, consisting of a statement of net position and a statement of
activities. - Fund financial statements consisting of a series of statements that focus on information about the
government’s major governmental and enterprise funds, including its blended component units. Fund financial statements also should report information about the government’s fiduciary funds and component units that are fiduciary in nature.
- Notes to the financial statements consisting of notes that provide information that is essential to a user’s understanding of the basic financial statements.
Required supplementary information (RSI). In addition to MD&A, this Statement requires budgetary comparison schedules to be presented as RSI along with other types of data as required by previous GASB pronouncements.
The County has followed the guidance of the Government Finance Officers Association of the United States and Canada (“GFOA”) and included the required budgetary comparison for the major governmental fund as Exhibit 5 in the Basic Financial Statements section. It has included the other data required by previous GASB statements in the Notes to the Financial Statements in the Basic Financial Statements. Therefore, the CAFR does not include a separate RSI section. The government-wide financial statements are reported using the economic resources measurement focus and the accrual basis of accounting, as are the proprietary fund and fiduciary fund financial statements with the exception of agency funds which have no measurement focus. Revenues are recorded when earned and expenses are recorded when a liability is incurred, regardless of the timing of related cash flows. Property taxes are recognized as revenues in the year for which they are levied. Grants and similar items are recognized as revenue as soon as all eligibility requirements imposed by the provider have been met.
44

ARLINGTON COUNTY, VIRGINIA
NOTES TO FINANCIAL STATEMENTS
JUNE 30, 2014
Governmental fund financial statements are reported using the current financial resources measurement focus and the
modified accrual basis of accounting. Revenues are recognized as soon as they are measurable and available. Revenues are considered to be available when they are collectible within the current period or soon enough thereafter to pay liabilities of the current period. For this purpose, the government considers revenues to be available if they are collected within 45 days of the end of the current fiscal period. Expenditures generally are recorded when a liability is incurred, as under accrual accounting. However, debt service expenditures, as well as expenditures related to compensated absences and claims and judgments, are recorded only when payment is due.
Property taxes, licenses, and interest associated with the current fiscal period are all considered to be susceptible to accrual
and so have been recognized as revenues of the current fiscal period. Only the portion of special assessments receivable due within the current fiscal period is considered to be susceptible to accrual revenue of the current period. All other revenue items are considered to be measurable and available only when cash is received by the government.
D. Funds
The Funds used by the County and its component units are organized under the following broad categories.
Governmental Fund Types: Governmental Funds are those which are used to account for most general governmental
functions of the County and the Schools. The acquisition, use and balances of the County and Schools' expendable financial resources and the related liabilities (except those accounted for in Proprietary Funds) are included in these Funds. The measurement focus of these Funds is based upon determination of, and changes in, financial position rather than upon net income determination. The following are the County's and the Schools' Governmental Fund Types.
The General Fund is the government’s major governmental fund. It accounts for all financial resources of the general
government, except those required to be accounted for in another fund. Revenues derived primarily from property and other local taxes, State and Federal distributions, licenses, permits, charges for services, and interest income are accounted for in this Fund. A significant part of the Fund's revenue is transferred to the Schools to finance their operations, pay-as-you-go capital projects, and debt service requirements.
The Special Revenue Funds are used to account for the proceeds of specific revenue sources that are legally restricted to
expenditure for specified purposes. The Funds used for the Schools include the school operating, school cafeteria, school special grants, school debt service, school community activities, and school comprehensive services funds. County travel and tourism promotion, the Rosslyn, Ballston, and Crystal City business improvement districts, community development block grants, and Section 8 housing grants are also accounted for in these funds.
The Capital Projects Funds are used to account for financial resources to be used for the acquisition or construction of major capital facilities (other than those financed by Proprietary Funds). Major capital projects include Transportation Infrastructure, Capital Asset Preservation Program (CAPP), Information Technology CAPP, Parks & Recreation CAPP, Neighborhood Conservation (NC) Program, Neighborhood Traffic Calming (NTC) Programs and Stormwater Drainage Infrastructure. Transportation Capital Funds provide funding for County’s Transportation Capital Improvement Program and Metro Matters capital program. Crystal City Tax Increment Financing will provide funding for Crystal City Sector Plan and infrastructure. The IDA Bond Funds provide funding for the Emergency Communications Center, the Trade Center, the George Mason Center, the Enterprise Resource Planning (ERP), Arlington Mill, and Buckingham Park.
Proprietary Fund Types: Proprietary Funds are used to account for County operations which are similar to those often
found in the private sector. The measurement focus of these Funds is the determination of net income through matching revenues earned with the expenses incurred to generate such revenues. The operations of such Funds are generally intended to be self-supporting. The following are the County’s Proprietary Fund Types.
The Enterprise Funds account for the financing of services to the general public where the operating expenses involved are usually recovered in the form of charges to users of such activities. Enterprise Funds consist of the Utilities (water and sewer), the Ballston Public Parking Garage, the Eighth-Level Ballston Public Parking Garage Funds, and the Community Planning Housing Development (CPHD) Development Fund.
45

ARLINGTON COUNTY, VIRGINIA
NOTES TO FINANCIAL STATEMENTS
JUNE 30, 2014
The government reports the following major proprietary funds:
The Utilities Fund accounts for the activities of the water pollution control plant and the water distribution system. The Ballston Public Parking Garage Fund accounts for the activities of the parking garage operation. The Ballston 8th Level Parking Garage Fund accounts for the activities of the 8th floor of the parking garage operation. The CPHD Development Fund accounts for fee-supported operations of CPHD inspection services and planning
divisions.
Additionally, the government reports the following fund types: Internal Service Funds account for fleet management and printing services provided to other departments or agencies of
the government, or to other governments, on a cost reimbursement basis. Fiduciary Fund Types: The Fiduciary Funds account for the assets received and disbursed by the County government
acting in a trustee capacity or as an agent for individuals, private organizations, other governments and/or other funds. The County reports the following fiduciary fund types:
The Private-purpose Trust Funds are used to account for resources legally held in trust to provide for costs to oversee the
operation of the waste-to-energy plant and other related expenses, resources used for the construction of the IDA Skating facility on the eighth level of the Ballston Public Parking Garage, and funds set aside for various social service programs.
The Pension Trust Fund accounts for the activities of the Arlington County Employees’ Retirement System, which
accumulates resources for pension benefit payments to qualified employees.
The Other Post-Employment Benefits (OPEB) – County Trust Fund accounts for the assets held in trust by the County and beneficiaries of its OPEB plan.
The Agency Funds account for assets held by the County as an agent for individuals, private organizations, other
governmental units and/or funds. The assets included in Agency funds are for Special Welfare Programs in the Department of Human Services, Friends of Library donations, Parks and Recreations donations, and Commission Funds reserved for Canteen and Inmates.
Proprietary funds distinguish operating revenues and expenses from non-operating items. Operating revenues and
expenses generally result from providing services and producing and delivering goods in connection with a proprietary fund’s principal ongoing operations. The principal operating revenues of the Utilities Fund, of the Ballston Public Parking Garage Fund, the Eighth-Level Ballston Public Parking Garage Fund, CPHD Development Fund and of the government’s Internal Service Funds are charges to customers for sales and services. The Utilities Fund also recognizes as operating revenue the portion of tap fees intended to recover the cost of connecting new customers to the system. Operating expenses for enterprise funds and internal service funds include the cost of sales and services, administrative expenses, and depreciation on capital assets. All revenues and expenses not meeting this definition are reported as non-operating revenues and expenses.
E. Budgets
Budgets are adopted on the modified accrual basis. Annual appropriated budgets are adopted for the General and Special Revenue Funds. All appropriations are legally controlled at the departmental level. The School Board prepares a separate operations budget for approval by the County Board. The proposed budget includes a recommended program of County and School capital expenditures to be financed from current operations. The County Manager biennially submits a ten year Capital Improvement Plan (CIP) to the County Board. Starting with the FY 2013 – FY 2022, this CIP presented a ten year planning period instead of six years presented previously. This shift to a longer planning horizon has many benefits including facilitating better planning and financing of major multi-year transportation and
46

ARLINGTON COUNTY, VIRGINIA
NOTES TO FINANCIAL STATEMENTS
JUNE 30, 2014
utility projects, and analyzing operating budget impacts. The Budget presentation displayed in Exhibit 5 is formatted differently than the governmental fund statements, but the overall ending balance is identical.
F. Equity in Pooled Cash and Investments
The Treasurer’s Office pools substantially all cash and investments for County and School purposes (County funds) in pooled and separate cash and investment accounts. Separate accounts correspond with specific contractual and/or legal restrictions. Each Fund's equity share of the total pooled cash and investments is included on the accompanying balance sheet under the caption "Equity in Pooled Cash and Investments." The Treasurer conducts banking and investment activities as authorized by The Code of Virginia, Chapter 44 – Security for Public Deposits Act; Chapter 45 – Investment of Public Funds Act; Chapter 46 – Local Government Investment Pool Act; and Chapter 47 – Government Non-Arbitrage Investment Act. The Code of Virginia delineates additional authority and obligations of the Treasurer in 58.1-3123 through 3172.1. In addition, the County Treasurer has a formal, written investment policy which further governs the types of allowable investments and procedures for investing the county’s operating funds. The Investment Policy was last updated on June 1, 2009. The Investment Policy received a Certification of Excellence from the Association of Public Treasurers of the United States and Canada in August 2007. The County established a Finance Board pursuant to Code of Virginia Sections 58.1-3151 et. seq. The Treasurer’s investment policy sets forth a number of investment parameters such as investment objectives, asset allocations and maximum maturities. The stated investment objectives, in priority order, are: preservation of principal, liquidity and yield. Pursuant to this policy, the Treasurer does not invest County operating funds and bond proceeds in “derivative” securities, securities lending, or invest in mortgage backed securities guaranteed by the Government National Mortgage Association (GNMA). Further, the Treasurer does not invest in reverse repurchase agreements. The Treasurer’s general intent is to place and manage all bond proceeds with and through the State Non-Arbitrage Program (SNAP). The Pension Trust Fund is also authorized to make investments as deemed appropriate by its Board of Trustees and in compliance with the U.S. Department of Labor regulations. It is required by County ordinance to maintain at least twenty percent of its portfolio in fixed income investments. Investments in the Pension Trust Fund consist of investment instruments, domestic and international stocks and bonds, U.S. Treasury notes and bonds, and real estate and real estate notes, which are held in the County’s name by the Fund’s Trustee who serves as the Pension System’s agent. Temporary investment funds on deposit with financial institutions were fully insured by the Federal Deposit Insurance Corporation up to $250,000 for each Retirement System participant. Investments are recorded at fair value based on quoted closing market prices except for real estate funds reported in the Pension Trust Fund. For alternative investments, which include real estate investments, where no readily ascertainable market value exists, management in consultation with the general partner and investment advisors, has determined the fair values for individual investments based upon the partnership’s most recent available financial information. Under authorization of the Retirement Board, the Pension Trust Fund engages in a securities lending program through its custodian. In accordance with its adopted investment policy, the Retirement System is authorized to invest in foreign currency forward contracts, which are valued at fair market value, as a risk management tool. All interest earned on cash and investments pooled by the County is recorded in the County’s General Fund as legally allowed, except for separate cash and investments accounts or funds legally entitled to interest earned.
G. Receivables and Payables
Activity between funds that are representative of lending/borrowing arrangements outstanding at the end of the fiscal year are referred to as either “due to/from primary government”, “due to/from component unit” or “due to/from other funds” (i.e., the current portion of interfund loans to the schools or primary government) or “advances to/from other funds” (i.e., the non-current portion of the interfund loans). All other outstanding balances between funds are reported as “due to/from other funds.” Any residual balances outstanding between the governmental activities and business-type activities are reported in the government-wide financial statements as “internal balances.”
47

ARLINGTON COUNTY, VIRGINIA
NOTES TO FINANCIAL STATEMENTS
JUNE 30, 2014
Advances between funds, as reported in the fund financial statements, are offset by a fund balance reserve account in applicable governmental funds to indicate that they are not available for appropriation and are not expendable available financial resources. “Accounts receivable, net” for the Utilities Fund includes water and sewer services used by customers, but not yet billed. Unbilled revenues are estimated based on the billing cycles of each customer. All taxes, assessments, service charges and other receivables are shown net of an allowance for uncollectibles. The County's allowance for uncollectible receivables is based upon historic non-collection percentages.
H. Inventories and Prepaid Items
Inventories are valued at cost, which approximates market, using the first-in first-out method for inventories in the Utilities
and Schools Funds. Inventories acquired by the Utilities Fund and the Automotive Equipment Fund are accounted for using the consumption method. Under this method, inventories are expensed as they are consumed as operating supplies and spare parts in the period to which they apply. Inventories in the School Cafeteria Fund are accounted for using the purchase method. Under this method, the cost is recorded as an expenditure at the time individual items are purchased. Certain payments to vendors reflect costs applicable to future accounting periods and are recorded as prepaid items in both government-wide and fund financial statements.
I. Capital Assets
Capital assets, which include property, plant, equipment, and infrastructure assets (e.g. roads, bridges, sidewalks, and similar items), are reported in the applicable governmental or business-type activities columns in the government-wide financial statements. Capital assets for both primary government and component unit Schools are defined by the government as assets with an initial, individual cost of more than $5,000 (amount not rounded) and an estimated useful life in excess of three years. Such assets are recorded at historical cost or estimated historical cost if purchased or constructed. Donated capital assets are recorded at estimated fair market value at the date of donation. The cost of normal maintenance and repairs that do not add to the value of the asset or materially extend assets lives are not capitalized. For infrastructure capital assets, this maintenance is carried in the General Capital Projects (Pay-Go) Fund. Additions to infrastructure capital assets are provided by capital outlays from the Street and Highway bond funds. Major outlays for capital assets and improvements are capitalized as projects are constructed. Interest incurred during the construction phase of capital assets of business-type activities is included as part of the capitalized value of the assets constructed. Property, plant, and equipment assets of the primary government, as well as of the component unit Schools is depreciated using the straight line method over the following estimated useful lives:
Assets Years Water/sewer system 75 Parking garage 45 Infrastructure 40 Building/improvements 40 Furniture and fixtures 10 Other capital assets 3-20
Intangible assets, which include computer software purchased or internally generated, are reported in the applicable governmental or business-type activities columns in the government-wide financial statements. Intangible assets for both primary government and component unit Schools are defined by the government as assets with an initial, individual cost of more than $50,000 (amount not rounded) and an estimated useful life in excess of one year. Subsequent additions, modifications or upgrades to computer software are capitalized only to the extent that they allow the software to perform a task it previously did not perform. Software maintenance and training costs are expensed in the period in which they are incurred. Interest incurred during the development of intangible assets of business-type activities is included as part of the capitalized value of the assets developed. Capitalized computer software costs are amortized using the straight line method over a period of 5 years.
48

ARLINGTON COUNTY, VIRGINIA
NOTES TO FINANCIAL STATEMENTS
JUNE 30, 2014
J. Compensated Absences
County employees are granted vacation leave based upon length of employment; a total of 35 days of vacation may be carried
over from one year to the next. Teachers do not earn vacation leave. Compensatory leave is granted to some County employees for overtime work on an hour-to-hour basis; no more than 80 hours of compensatory leave may be carried over from one year to the next. The County and the Schools do not place a maximum limitation on the accumulation of sick leave, which may be carried over from one year to the next. Compensatory leave is vested, while sick leave vests under certain limited circumstances.
Accumulated vested unpaid compensated absences for the County and the Schools in both the government-wide and the
Proprietary Funds are recorded as an expense and liability of General Fund, Internal Service Funds, Utilities Fund, CPHD Development Fund, and Schools as the benefits accrue to employees.
K. Arbitrage Rebate Liability
The U.S. Treasury has issued regulations on calculating the rebate due the Federal government on arbitrage profits and
determining compliance with the arbitrage rebate provisions of the Tax Reform Act of 1986. Arbitrage profits arise when the County temporarily invests the proceeds of tax exempt debt in securities with higher yields. The County treats the estimated rebate payable as a reduction of available financial resources in the fund that earned the arbitrage profit. Accordingly, interest earnings are reduced by the amount of the increase in the estimated rebate payable and a liability is reported in the appropriate fund. At June 30, 2014, the County had no arbitrage rebate liability.
L. Long-Term Obligations
In the government-wide financial statements, and proprietary fund types in the fund financial statements, long-term debt and
other long-term obligations are reported as liabilities in the applicable governmental activities, business-type activities, or proprietary fund type statement of net position. Bond premiums and discounts are deferred and amortized over the life of the bonds using the straight line method. Bonds payable are reported net of the applicable bond premium or discount.
In the fund financial statements, governmental fund types recognize bond premiums and discounts, as well as bond issuance
costs, during the current period. The face amount of debt issued is reported as other financing sources. Premiums received on debt issuances are reported as other financing sources while discounts on debt issuances are reported as other financing uses. Issuance costs, whether or not withheld from the actual debt proceeds received, are reported as debt service expenditures.
M. Fund Equity
In accordance with Government Accounting Standards Board statement No. 54, Fund Balance Reporting and Governmental Fund Type Definitions, the County classifies governmental fund balances as follows: Non-spendable – includes fund balance amounts that cannot be spent either because it is not in spendable form or because of legal or contractual constraints, such as inventory and prepaid expenses. Restricted – includes fund balance amounts that are constrained for specific purposes which are externally imposed by providers, such as creditors (such as through debt covenants), grantors, or amounts constrained due to constitutional provisions or enabling legislation. Committed – includes fund balance amounts that are constrained for specific purposes that are internally imposed by the government through formal action by the County Board and does not lapse at year-end. Committed amounts cannot be used for any other purpose unless the County Board removes or changes the specified use by taking the same type of action it employed to previously commit those amounts. Assigned – includes fund balance amounts that are intended to be used for specific purposes that are neither considered restricted or committed. Fund Balance may be assigned by the County Manager. The County Board will review the recommendations at the November Board meeting. If approved by a resolution of the County board, the assigned funds
49

ARLINGTON COUNTY, VIRGINIA
NOTES TO FINANCIAL STATEMENTS
JUNE 30, 2014
become committed. Amendments must follow guidance described in Note 1.I.E. By State law, funds cannot be spent unless appropriated by the County Board. Unassigned – includes fund balance within the General Fund which has not been classified within the above mentioned categories and negative fund balances in other governmental funds. The Unassigned Fund Balance can only be appropriated by a resolution of the County Board. The County considers restricted balances to be expended first in cases where both restricted and unrestricted amounts are available. When utilizing unrestricted balances, committed balances are applied first, followed by assigned than unassigned balances.
N. Comparative data/reclassifications
Comparative total data for the prior year have been presented in the accompanying combining other supplemental information of the financial statements in order to provide an understanding of changes in the government’s financial position and operations. However, comparative data have not been presented in all statements because their inclusion would make certain statements unduly complex and difficult to understand. Certain FY 2013 amounts have been reclassified to conform to the FY 2014 presentation. These reclassifications did not affect the FY 2013 net position, fund balances or changes therein.
O. Cash and Cash Equivalents
For Statement of Cash Flows reporting purposes, cash and cash equivalents include cash on hand, demand deposits, equity in highly liquid cash and investments pools, certificates of deposit, repurchase agreements and commercial paper with maturities at time of purchase of three months or less.
P. Use of Estimates
The preparation of financial statements in conformity with generally accepted accounting principles requires management to make estimates and assumptions that affect the amounts reported in the financial statements and related notes. Actual results could differ from those estimates.
Q. Deferred Outflows A deferred outflow of resources represents a consumption of net position that applies to a future period and so will not be recognized as an outflow of the resources (expenditure) until a future period.
R. Deferred Inflows A deferred inflow of resources represents an acquisition of net position that applies to a future period and will not be recognized as an inflow of resources (revenue) until that time. For government-mandated and voluntary non-exchange transactions, a deferred inflow is reported when resources are received before time requirements are met.
S. Implementation of New GASB Pronouncements
In March 2012, the Governmental Accounting Standard Board (“GASB”) issued GASB Statement No. 65 (“GASB 65”) Items Previously Reported as Assets and Liaibilities. This Statement establishes accounting and financial reporting standards that reclassify, as deferred outflows of resources or deferred inflows of resources, certain items that were previously reported as assets and liabilities and recognizes, as outflows of resources or inflows of resources, certain items that were previously reported as assets and liabilities. The requirements of the new Statement became effective for fiscal periods after December 15, 2012. The County adopted GASB 65 during the year ended June 30, 2014. Several account balances were reclassified as of and for the year ended june 30, 2013, as previously reported. These reclassifications, which did not require a restatement of net position or fund balance, were required for comparability to the financial statements as of and for the year ended June 30, 2013. Although comparative statements for 2013 are not
50

ARLINGTON COUNTY, VIRGINIA
NOTES TO FINANCIAL STATEMENTS
JUNE 30, 2014
presented here, these reclassifications must be considered when comparing the financial statements of this report with those of prior reports. Statement No. 68, Accounting and Financial Reporting for Pensions - The objective of this Statement is to improve accounting and financial reporting by state and local government employers for the pension in which they are involved. This Statement will become effective for the reporting period ending June 30, 2015. The County is currently evaluating the effect of the implementation of this Statement
II. Reconciliation of Government-wide and Fund Financial Statements A. Explanation of certain differences between the governmental fund balance sheet and the government-wide statement
of net position
The governmental fund balance sheet includes reconciliation between fund balance – total governmental funds and net position – governmental activities as reported in the government-wide statement of net position. One element of that reconciliation explains that “long-term liabilities, including bonds payable, are not due and payable in the current period and therefore are not reported in the funds.” The details of this $(1,005,865,063) difference are as follows: General obligation bonds - general government ($210,005,034)Refunding bonds - general government (189,982,668)General obligation bonds - Schools (214,657,732)Refunding bonds - Schools (164,809,055)Compensated absences - general government (33,406,745)Worker’s compensation - general government (3,363,121)Capital leases - general government (14,315,564)Deferred amount on refunding, net 863,997Bond premium to be amortized – County (31,167,146)Bond premium to be amortized – Schools (28,521,995)IDA – Metro and Buckingham Village 1 (36,565,000)IDA Revenue Bonds - 2011 (10,565,000)IDA Revenue Bonds - 2013 (69,370,000)
Net adjustment to reduce fund balance - total governmental funds to arrive at net assets of governmental activities ($1,005,865,063)
B. Explanation of certain differences between the governmental fund statement of revenues, expenditures, and
changes in fund balances and the government-wide statement of activities
The governmental fund statement of revenues, expenditures, and changes in fund balances includes reconciliation between net changes in fund balances – total governmental funds and changes in net position of governmental activities as reported in the government-wide statement of activities. One element of that reconciliation explains that “Governmental funds report capital outlays as expenditures while governmental activities report depreciation expense to allocate those expenditures over the life of the assets.” The details of this $(45,265,014) difference are as follows: Capital acquisitions $77,111,546 Depreciation expense (31,846,532)Net adjustment to increase net changes in fund balances - total governmental funds to arrive at changes in net position of governmental activities $45,265,014
Another element of the reconciliation states that “Revenues in the Statement of Activities that do not provide current financial resources are not reported as revenues in the funds”. The details of this difference are as follows:
51

ARLINGTON COUNTY, VIRGINIA
NOTES TO FINANCIAL STATEMENTS
JUNE 30, 2014
Unearned property tax revenue 6/30/13 ($332,376,575)Unearned property tax revenue 6/30/14 (347,808,282)Net adjustment to increase net changes in fund balances – total governmental funds arrive at changes in net position of governmental activities $15,431,707
Another element of that reconciliation states that “Bond proceeds provide current financial resources to governmental funds, but issuing debt increases long-term liabilities in the statement of net position. Repayment of bond principal is an expenditure in the governmental funds, but the repayment reduces long-term liabilities in the statement of net position”. The details of this $1,474,041 difference are as follows: Debt issued or incurred: Issuance of general obligation bonds – County ($26,750,000) Issuance of general obligation bonds - Schools (36,460,000) Issuance of refunding bonds - County (17,965,000) Issuance of refunding bonds - Schools (19,725,000) Capital leases (5,459,004)
Capital financing – General Government (106,359,004)
Principal repayments: General obligation debt – County 30,540,630 General obligation debt – Schools 28,977,395 Payment to refunded bonds - County 18,533,770 Payment to refunded bonds - Schools 20,328,620 Payment to IDA – Metro and Buckingham Village 1 1,215,000 Payment to IDA Revenue Bonds - 2011 625,000 Payment to IDA Revenue Bonds - 2013 6,945,000 Capital leases 4,318,450
Total principal repayments 111,483,865
Bond premium to be amortized (2,301,246) Other charges (1,349,574)
Net adjustment to increase net changes in fund balances - total governmental funds to arrive at changes in net position of governmental activities $1,474,041
Another element of that reconciliation states that “some expenses reported in the Statement of Activities do not require the use of current financial resources and therefore are not reported as expenditures in governmental funds such as compensated absences and worker’s compensation”. The detail of this $(586,062) difference is as follows:
Compensated absences ($970,783)Worker’s compensation 384,721
Net adjustment to decrease net changes in fund balances – total governmentalfunds to arrive at changes in net position of government activities ($586,062)
Another element of that reconciliation states that “OPEB expenses reported inthe Statement of Activities do not require the use of current financial resourcesand therefore are not reported as expenditures in governmental funds” $1,056,772
52

ARLINGTON COUNTY, VIRGINIA
NOTES TO FINANCIAL STATEMENTS
JUNE 30, 2014
Another element of that reconciliation states that “Internal service funds are used by management to charge the costs of certain services to individual funds. The net revenue (expense) of the internal service funds is reported by governmental activities.”
Additional expenses – internal service funds $446,810 Net operating income – internal service funds 62,654Net adjustment to increase net changes in fund balances – total governmental funds to arrive at changes in net position of governmental activities $509,464
NOTE 2. Legal Compliance The County Manager's proposed budget for the following fiscal year is presented to the County Board in February. Public hearings on the proposed budget and tax rates are held in early spring and are followed by a series of work sessions of the County Board, during which preliminary funding decisions regarding proposed operating and capital programs are reached. Final County Board decisions are incorporated into the appropriation, tax, and budget resolutions for the fiscal year. These resolutions are generally approved by the County Board in April and a separate Adopted Budget document is issued subsequent to the Board approval. Under Virginia law, the County Board must adopt the School Board budget no later than May 1 of the current fiscal year. Supplemental appropriations may be approved by the County Board subsequent to the adoption of the original budget. In FY 2014 such appropriation amendments totaled $127,460,382 and are reflected in the amounts presented in the financial statements. In addition, the County Board can approve transfers of appropriations between County departments and the County Manager can approve budget transfers within a department's appropriation. The level of budgetary control in the County is at the department level. Expenditures exceeded the level of control in FY 2014 for the County Manager’s Office due to leave payouts for employees, for Sherriff’s Department due to overtime costs, Treasurer’s Office due to increased mailing and printing costs and not achieving vacancy savings, Fire primarily due to overtime and callback costs, and for County Attorney due to increased legal costs and expenses related to lawsuits and other transactions the County was involved in during FY 2014. The Ballston Parking Garage (an Enterprise Fund) commenced operations in 1986 and has generated sufficient positive cash flow since inception to meet its operating and revenue bond debt service requirements. However, when considering limited liabilities (deferred ground rent and a deferred mortgage payable) and depreciation, the garage has negative net position of $24,019,860 at June 30, 2014. The deferred ground rent and deferred mortgage payable are limited liabilities and are only payable under certain net operating income circumstances. The deficiency has been caused by slower than anticipated commercial development of the areas adjacent to the garage and limitations on parking rates. Under its agreement with The Federated Department Stores Inc., the County was precluded from initially increasing some key parking rates. Management of the County believes that the most recent rate increases and subsequent rate increases in future fiscal years coupled with the completion of adjacent development projects will result in the eventual achievement of a positive equity position. The Printing Fund (an Internal Service Fund), incurred a decrease in net position of ($45,475) in FY 2014, resulting in ending net deficit of ($247,667). Management will evaluate measures to reduce the deficit in FY2015. NOTE 3. Cash and Investments I. County Cash and Investments
The County maintains a cash and investment pool in which each County and Schools fund participates on a dollar equivalent and daily transaction basis. Bank deposits and investments of the Pension Trust are held separately from those of the County.
A. Custodial Credit Risk Deposits
At year end, the carrying amount of the County and School deposits was $167,938,558 and the bank balance was $175,102,984. Of the bank balance, $8,050,127 was covered by Federal depository insurance. The bank balances exceeding those covered by Federal insurance are protected under the provisions of the Virginia Security for Public Deposits Act ("the Act").
53
ARLINGTON COUNTY, VIRGINIA
NOTES TO FINANCIAL STATEMENTS
JUNE 30, 2014
B. Custodial Credit Risk
Custodial risk is the risk that in the event of a failure by a counter party, the County will not be able to recover the value of its investments or collateral securities that are in the possession of an outside party. The treasurer’s investment policy requires that all securities be clearly held in the name of Arlington County and held in safekeeping by a third party in compliance with Section 2.2-4515 of the Code of Virginia. As a result the County has no custodial credit risk.
C. Investment Policy
In accordance with the Code of Virginia, the Treasurer’s investment policy permits investment in obligations of the United States or agencies thereof, obligations of State and municipal governments as well as agencies thereof, commercial paper, bankers' acceptances, repurchase agreements, corporate notes, mutual funds, Virginia Investment Program (VIP) and the Virginia Local Government Investment Pool (LGIP), a 2a-7 like pool. Depository accounts and certificates may also be used. Unexpended bond proceeds are invested in the Virginia State Non-Arbitrage program (Virginia SNAP).
D. Credit Risk
The Code of Virginia authorizes the investment in various instruments as described above. The County will only invest in securities with “prime quality” credit ratings by at least one nationally recognized rating agency.
E. Concentrations of Credit Risk
The County's policy defines limits on the amounts that may be invested in various investments. The portfolio is in compliance with each of the stated limits as of June 30, 2014.
F. Interest Rate Risk
As a means of limiting exposure to fair value losses resulting from increasing interest rates, the Treasurer’s investment policy states that the maturities in the portfolio are to be reviewed frequently to mitigate the effects of market fluctuations. In no case, however, shall investments be purchased with maturities greater than five years.
At June 30, 2014, the County had the following investments and maturities:
54

ARLINGTON COUNTY, VIRGINIA
NOTES TO FINANCIAL STATEMENTS
JUNE 30, 2014
Fair Value Less than 1 year
1-3 years 3-5 years Greater than 5 years
Corporate Notes $99,707,569 $11,609,170 $- $88,098,399 $-Commercial Paper 169,621,415 169,621,415 - - -Government Agency Bonds
91,890,157 - 2,225,940 89,664,217 -Municipal Obligations* 28,568,300 1,272,643 2,398,091 24,797,565 100,000Total $389,787,441 $182,503,228 $4,624,031 $202,560,181 $100,000
Virginia LGIP $219,120Virginia VIP 40,063,602Virginia State Non-Arbitrage Program 252,006,370Total 292,289,092
Total Investments $682,076,533
Investment not subject to Interest Rate Risk:
* Maturity date on Variable Rate Demand Note investments (total of $100,000) is 8/1/24, with a weekly put.
Investment Maturity (in years)
US Bank, as trustee for holders of bonds for the Ballston Parking Garage, is authorized to invest in all investment instruments for the County. As of June 30, 2014, the Trustee Bank had $17,676,815 in a U.S. government money market fund consisting of securities approved for direct investment. First Virginia Community Bank is the Trustee for Alexandria/Arlington Waste to Energy- Monitoring Group Trust Fund. Investments in the amount of $55,173 at fair value were held by First Virginia Community Bank at June 30, 2014. U.S. Bank Trust National Association, as the trustee for the Industrial Development Authority (IDA) Lease Revenue Bonds, is granted and assigned a security interest in the investment instruments by the IDA Authority of Arlington County. As of June 30, 2014, the US Bank Trust National Association had $806,012; the Bank of New York. Mellon Bank (BNYM) had $1,276,372 in the Trustee Banks. Bank of New York Mellon Bank (BNYM), as the trustee for the Industrial Development Authority (IDA) of Arlington County, Virginia, is authorized to invest in all investments for the IDA Taxable Economic Development Revenue Bonds (Skating Facility Project). As of June 30, 2014, the Trustee Banks had $2,184,327 in the Bank of New York Mellon Bank (BNYM). The County has invested bond proceeds subject to rebate of arbitrage earnings in the Virginia State Non-Arbitrage Program (“SNAP”). SNAP is designed to assist local governments in complying with the arbitrage rebate requirements of the Tax Reform Act of 1986. These programs provide comprehensive investment management, accounting and arbitrage rebate calculation services for proceeds of general obligation and revenue tax-exempt financing of Virginia counties, cities and towns. As of June 30, 2014, the County had $252,006,370 in the SNAP short term investment.
II. Arlington County Employee’s Retirement System (“System”) Cash and Investments
A. Legal Provisions and Investment Policy The System is authorized by the Code of Virginia §51.1-803 to invest funds of the System in conformance with the prudent person rule. Arlington County Code §21-23, §35-21, and §46-22 require that assets of the System be invested with care, skill, prudence, and diligence under circumstances then prevailing that a prudent person acting in a like capacity and familiar with such matters would use in the conduct of an enterprise of a like character and with like aims. Arlington
55

ARLINGTON COUNTY, VIRGINIA
NOTES TO FINANCIAL STATEMENTS
JUNE 30, 2014
County Code §21-24, §35-22, and §46-23 require that investments be diversified to minimize the risk of large losses unless under the circumstances it is clearly not prudent to do so. The System’s written investment policy provides for investment in all major sectors of the capital markets in order to diversify and minimize total investment program risk. Such sectors include, but are not limited to:
Convertible securities
Cash, money market funds and other short term investment funds
Common stocks, preferred stocks, warrants and similar rights of U.S. and non-U.S. companies.
Private equity. The System invests in private equity via a fund-of-funds and direct approach to maximize diversification by vintage year and investment type.
Open and closed end pooled real estate funds and real estate investment trust securities
Fixed income obligations of the U.S. government and its agencies, mortgage-backed securities, corporate bonds, and asset backed securities. In addition, fixed income obligations of non-U.S.
Governments, companies and supernational organizations, in bother developed and emerging markets. Limits on concentration, credit quality and duration are governed by each investment manager’s contract.
Since the Fund does not utilize a target allocation approach, the following table shows the Fund’s ten year average allocation:
Asset Class10 Year Average
Allocation
Domestic Equity 46.4%International Equity 18.4%Fixed Income 28.0%Cash/Shor Term 2.2%Non-Traditional 5.0%
Total 100%
While the above asset allocation is not a restrictive target (see investment restrictions below), it is representative of the nature and mix of current and expected System investments.
B. Expected Rate of Return
The long-term expected rate of return on pension plan investments was determined using a building block method in which best estimate ranges of expected future real rates of return (expected returns, net of investment expense and inflation) are developed for each major asset class. These ranges are combined to produce the long term expected rate of return by weighting the expected future real rates of return by an asset allocation percentage which is based on the nature and mix of current and expected pension plan investments, and by adding expected inflation. Best estimates of geometric real rates of return for each major asset class included in the pension plan’s expected asset allocation as of June 30, 2014 (see the discussion of the pension plan’s investment policy) are summarized in the following table:
Long Term Expected RealAsset Class Rate of Return
Domestic Equity 5.7%International Equity 5.7%Fixed Income 2.0%Cash/Shor Term 0.0%Non-Traditional 8.7%
56

ARLINGTON COUNTY, VIRGINIA
NOTES TO FINANCIAL STATEMENTS
JUNE 30, 2014
C. Investment Restrictions
The following summarizes the primary investment restrictions included in the System’s investment policy statement. Individual investment manager contracts typically include additional guidelines and limitations.
Fixed income investments must be at least 20% of the Fund’s assets at market value. The Fund must be rebalanced if the market weight of fixed income investments falls below 20%, unless the Board, acting on the recommendation of staff or the investment consultant to defer rebalancing, determines that it would not be consistent with the Board’s fiduciary responsibility to rebalance (increase fixed income) at that time. No new commitment to illiquid investments can be made which causes the allocation to illiquid investments, including existing market value and commitments, to exceed 15% of the System’s market value.
Unless the Board grants prior authorization, the investment managers may not:
Invest more than 10% of the market value of each portfolio in the securities of any one issuer, with the exception of the U.S. government and its agencies
Hold more than 5% of the outstanding shares of a single company in each portfolio
Hold unlisted equity securities that exceed 20% of the portfolio, exclusive of holdings in banks, utilities, and insurance companies
Use leverage of any sort for any purpose beyond prudent industry standards
Effect short sales of securities
Purchase non-registered securities, such as private placements
Pledge, mortgage or hypothecate securities, except in approved security lending programs Investment managers are prohibited from:
Making investments prohibited by county, state or federal law
Investing in collectibles
Making loans, including mortgage loans, to individuals Derivatives are allowed only in cases where their use reduces the cost of a desired transaction and/or improves the risk characteristics of the portfolio. The Board may, however, approve the use of derivatives to implement investment processes intended to add value in specifically-designated, risk-controlled applications, such as currency management. Any such value-added investment program shall be approved only where:
The potential exposures have been well defined by the Board and provide for a downside risk range for the Fund within established limits
The value of the designated Fund assets subject to risk due to the program does not exceed 15% of the Fund’s assets
In any program where an active overlay strategy combining derivatives with underlying portfolio assets is to be used, the gross amount of any long and short exposures taken on by the overlay shall not exceed the value of the designated Funds assets being overlaid
The System’s Investment Policy provides external investment managers with discretion to take actions, within approved guidelines, regarding each portfolio’s foreign currency exposures using forward currency contracts. These contracts are agreements to exchange one currency for another currency at an agreed upon price and date. Investment managers use such contracts primarily to settle pending trades at a future date. Key risks include counter party non-performance and currency fluctuations. As of June 30, 2014, the System had $26,413 in open net forward currency contracts.
57

ARLINGTON COUNTY, VIRGINIA
NOTES TO FINANCIAL STATEMENTS
JUNE 30, 2014
D. Cash and Cash Equivalents
At June 30, 2014, the System had cash and cash equivalents of $48,957,591. Cash deposits in bank accounts totaled $424,614. This amount was insured by the Federal Deposit Insurance Corporation up to $250,000 for each System participant. Cash totaling $48,532,979 is invested in the custodian’s Short-Term Investment Fund. This account is uninsured and uncollateralized.
E. Investments and Risk
The System’s investments are recorded at fair value based on the methodology described in Note 4. Summary of Significant Accounting Policies, Investments, of Arlington County Employees’ Retirement System Comprehensive Annual Financial Report. The following table presents the fair value of investments by type at June 30, 2014:
Investment TypeFair Value (in $000s)
Common Stock $490,798Convertible Equity 13,565Preferred Stock 1,938Government and Government Agency Debt 45,647Government State and Local Debt 2,937Corporate Bonds 145,397Corporate Convertible Bonds 188,705Commercial Mortgaged Backed Securities 1,575Collateralized Mortgage Obligations 559Asset Backed Securities 5,885Bank Loans 5,589Pooled Equity Funds 680,753Pooled Bond Funds 282,622Cash and Short Term 48,112REITs 4,855Private Equity 46,210Real Estate 15,939Other (3,115)
Total (1) $1,977,971
(1) Investment related accruals are reflected in the respective asset category; further, data on the Statement of Fiduciary Net position (Exhibit 9) includes disbursement account cash and operating accruals not reflected in the data above.
Interest Rate Risk
Interest rate risk is driven by changes in general interest rate levels. The price of a fixed income security generally moves in the opposite direction of the change in interest rates. Securities with long maturities are highly sensitive to interest rate changes. The System has interest rate exposure on $396.3 million of directly owned fixed income securities and on $282.6 million invested in three pooled US fixed income funds. The System’s directly owned fixed income investments and maturities at June 30, 2014 are:
58

ARLINGTON COUNTY, VIRGINIA
NOTES TO FINANCIAL STATEMENTS
JUNE 30, 2014
Fair Value
Investment Type: ($000s) Under 1 1-5 6-10 Over-10Asset backed Securities $5,885 $- $1,226 $501 $4,158Bank Loans 5,589 - 1,316 4,273 -Commercial Mortgage-Backed 1,575 - - - 1,575Corporate Bonds 145,397 - 28,664 48,316 68,417Corporate Convertible Bonds 188,705 4,693 100,852 53,836 29,324Government & Government Agencies 45,647 6,236 29,668 4,616 5,127Government State & Local Debt 2,937 - - - 2,937Collateralized Mortgage Obligations 559 - - - 559Total $396,294 $10,929 $161,726 $111,542 $112,097
Investment Maturities (years)
Interest rate sensitivity of a fixed income portfolio is best measured by effective duration which reflects the average percentage change in portfolio value due to a 1% change in interest rates. The effective duration for the System’s directly held fixed income portfolio at June 30, 2014 is shown below:
Investment Type Effective(in $ 000s) Fair Value Duration (Yrs)
Mortgage Backed Govt Pass Through $- -Asset backed Securities 5,885 3.01 Bank Loans 5,589 -Commercial Mortgage-Backed 1,575 3.05 Corporate Loans 145,397 4.72 Corporate Convertible Bonds 188,705 4.55 Government & Government Agencies 45,647 2.61 Government State & Local Debt 2,937 4.77 Collateralized Mortgage Obligations 559 1.21 Total $396,294 4.39
Custodial Credit Risk
In the event of counter-party failure, the System may not be able to recover the value of its investment or collateral securities that are in the possession of an outside party. Investment securities are exposed to custodial credit risk if the securities held by the counterparty, or counterparty’s trust department, are uninsured and are not registered in the name of the System. The System requires that all investments be clearly marked as to ownership, and to the extent possible, be registered in the name of the System.
Credit Risk
Per the System’s investment policy, only U.S. Government and U.S. Government Agency obligations may exceed 5% of System assets. As of June 30, 2014, the System does not have investments in any one organization that exceed 5%. The System’s credit quality distribution for the System’s directly held fixed income investments of $396.3 million at June 30, 2014 is shown below:
59

ARLINGTON COUNTY, VIRGINIA
NOTES TO FINANCIAL STATEMENTS
JUNE 30, 2014
Investment Type(in $ 000s) AAA AA A BBB BB B Below B Unrated
Mortgage Backed Govt Pass Through $- $- $- $- $- $- $- $-Asset backed Securities 115 759 1,843 2,466 - - - 702 Bank Loans - - - - - 2,468 1,198 1,922 Commercial Mortgage-Backed 218 1,235 - 122 - - - - Corporate Bonds - 6,494 14,014 44,360 49,080 16,600 9,834 5,016 Corporate Convertible Bonds - - 9,951 8,579 23,172 20,022 702 126,279 Government & Government Agencies 33,649 - 6,766 5,232 - - - - Government State & Local Debt - - - - - 2,937 - - Collateralized Mortgage Obligations - 559 - - - - - - Total $33,982 $9,047 $32,574 $60,759 $72,252 $42,027 $11,734 $133,919
Fixed Income Credit Quality Distribution
Credit Quality
Note: Ratings based on S&P Quality Ratings with the exception of Mortgage Backed Government Pass Through which has been assigned by the Bank of New York Mellon
Foreign Currency Risk
Foreign investments include equity and fixed income securities, including convertible securities and cash. The Board has authorized specific investment managers to invest in non-dollar denominated securities. These managers have the ability to hedge a portion of their portfolio’s foreign currency exposure. The System’s exposure to foreign currency risk at June 30, 2014 was as follows:
Currency (in $ 000s) EquityFixed Income & Convertible Cash Total
Australian Dollar $4,415 $6,098 $- $10,513Brazilian Real 1,735 1,428 - 3,163 British Pound 12,917 5,757 11 18,685 Canadian Dollar 1,483 18,828 26 20,337 Danish Krone 3,403 - - 3,403 Euro 15,454 34,450 459 50,363 Hong Kong Dollar 15,423 4,762 36 20,221 Indonesian Rupiah 3,219 - - 3,219 Japanese Yen 1,176 10,490 46 11,712 Malaysian Ringgit 842 - - 842 Mexican Peso 654 5,833 31 6,518 New Zealand Dollar - 8,565 - 8,565 Nigerian Naira 819 - - 819 Philippines Peso 3,630 - - 3,630 Singapore Dollar 1,634 1,441 9 3,084 South African Rand 1,199 - - 1,199 South Korean Won 229 1,001 - 1,230 Swedish Krona 4,835 755 3 5,593 Swiss Franc 3,649 905 2 4,556 Thailand Baht 799 - - 799 Turkish Lira 1,969 - - 1,969 Total $79,484 $100,313 $623 $180,420
F. Securities Lending
Under authorization of the Board, the System engaged in a securities lending program through its custodian, Northern Trust, for securities held in separate accounts. In accordance with the contract, Northern Trust may lend any securities held in custody. Only obligations issued by the US Government are accepted as collateral investment. By not accepting cash collateral, the program relies on the demand of the loaned securities as the driver on income and is not subject to collateral reinvestment risk. Minimum collateralization levels for all loans is 102% of the market value of the borrowed securities or 105% if the borrowed securities are not denominated in dollars. Loans and collateral are marked to market
60

ARLINGTON COUNTY, VIRGINIA
NOTES TO FINANCIAL STATEMENTS
JUNE 30, 2014
on a daily basis. The collateral is maintained by Northern Trust and all securities on loan are callable at any time. The System does not have the ability to pledge or sell the collateral. All securities on loan are carried at fair value and the collateral received for securities on loan is listed in the financial statements as an asset of the System, offset by an accompanying security lending obligation. In the event the borrower becomes insolvent and fails to return the securities, Northern Trust indemnifies the System by agreeing to purchase replacement securities, or to remit the collateral held. There were no such failures by any borrower during the fiscal year nor were there any losses during the year resulting from a borrower or lending agent default. The program increased from $264 thousand at the beginning of the year to $20.7 million at June 30, 2014. This was the result of a planned change in custodial banks after the prior fiscal year-end. The following table details the net income from securities lending for the fiscal year ended June 30, 2014:
Gross Income from Securities Lending $190,665 Less: Bank Management Fees (48,568)Net Income from Securities Lending $142,097
The following table presents the fair value of underlying securities and the value of the collateral pledged at June 30, 2014:
Type of Securities Lent (in $ 000s)
Fair ValueValue of Collateral
US Corporate Fixed Income $12,166,902 $12,399,447US Equities 3,993,337 4,069,650Global Corporate Fixed Income 4,492,500 5,914,769Total $20,652,739 $22,383,866
None of the System’s pooled fund investments have material realized or unrealized securities lending related losses.
G. Commission Recapture Program
The System participates in a commission recapture program with the Frank Russell Company. This program allows the System to recapture a portion of the commissions paid to broker/dealers by investment managers who participate in the program. All trades are placed subject to the requirement for best execution. Earnings credited to commission recapture income for the fiscal year ended June 30, 2014 were $942.
NOTE 4. Receivables and Unearned Revenues Receivables at June 30, 2014 are summarized below:
Governmental Business-type Activities Activities
Real estate taxes $350,705,993 $-Personal property taxes 4,543,513 -Business license taxes 3,441,253 -Meal tax 1,404,874 -Accounts receivable 45,792,751 19,265,863 Interest 621,032 - Total 406,509,416 19,265,863 Less: Allowance for uncollectible accounts (1,712,480) (447,160)
Net receivables $404,796,936 $18,818,703
61
ARLINGTON COUNTY, VIRGINIA
NOTES TO FINANCIAL STATEMENTS
JUNE 30, 2014
Real Estate assessments are based on 100% of the fair market value of land and improvements as of January 1 of each year; January 1 has also been established as the lien date for real property by state law. The County Board establishes the tax rates on or about April 1 of each year, at which time the County has the legal right to request payment. Real Estate taxes are due in two equal installments on June 5 and October 5. Included in real estate taxes receivable is the unbilled October 5 installment. This October due amount, totaling $347,808,282, has also been recorded as unearned revenue since these revenues are not considered to be available to finance current year expenditures. Personal property tax assessments, relating principally to motor vehicles and tangible property belonging to businesses, are based on 100% of the fair market value of the property as of January 1. Personal property taxes are due on October 5. The County's allowance for uncollectible taxes and service fees for water and sewer services is based upon historic non-collection percentages. Governmental funds report unearned revenues in connection with receivable for revenues not considered available to liquidate liabilities of the current period. Special revenues funds and Capital project fund also report unearned revenues recognition in connection with resources that have been received, but not yet earned. At June 30, 2014, the revenues components of unearned revenues reported were as follows: Governmental Funds Unearned Revenue
General Fund Housing development loans $15,097,400Household Credits 162,412Rental Income 49,411
Capital Project FundMaster lease 2,441,957Developer's contributions 4,806,931
$22,558,111
Deferred Outflows/Inflows General Fund Special Revenue Funds Total
Taxes $3,329,488 $3,957,513 $7,287,001Grants 1,789,630 1,540,086 3,329,716Housing development loans - 8,455,625 8,455,625
$5,119,118 $13,953,224 $19,072,342
*Deferred outflows/inflows in Government funds include $347,808,282 October installment of Real Estate taxes. NOTE 5. Capital Assets and Intangible Assets Capital asset activity for the year ended June 30, 2014:
62

ARLINGTON COUNTY, VIRGINIA
NOTES TO FINANCIAL STATEMENTS
JUNE 30, 2014
Primary Government
Beginning Ending Balance Increases Decreases Balance
Governmental and Internal Service activities:Capital assets, not being depreciated:Land $160,998,177 $3,480,052 $- $164,478,229Construction in progress 232,067,880 67,155,317 78,725,304 220,497,893 Total capital assets, not being depreciated 393,066,057 70,635,369 78,725,304 384,976,122
Capital assets, being depreciated:Infrastructure 495,503,178 44,231,635 - 539,734,813 Buildings 321,239,039 18,165,654 - 339,404,693 Furniture, fixtures and equipment 221,525,087 31,150,131 3,370,872 249,304,346 Intangible 2,577,117 1,565,417 - 4,142,534 Total capital assets being depreciated 1,040,844,421 95,112,837 3,370,872 1,132,586,386
Less accumulated depreciation for:Infrastructure 290,811,552 10,090,602 - 300,902,154 Buildings 96,093,894 9,115,457 - 105,209,351 Furniture, fixtures and equipment 93,812,282 18,217,816 2,825,641 109,204,457 Intangible 1,178,031 589,646 - 1,767,677 Total accumulated depreciation 481,895,759 38,013,521 2,825,641 517,083,639
Total capital assets, being depreciated, net 558,948,662 57,099,316 545,231 615,502,747
Governmental and Internal Service activities capital assets, net $952,014,719 $127,734,685 $79,270,535 $1,000,478,869
Business-type ActivitiesBeginning Ending
Balance Increases Decreases Balance
Capital assets, not being depreciated Land $6,161,255 $- $- $6,161,255Construction in progress 123,631,989 20,386,296 18,018,336 125,999,949 Total capital assets, not being depreciated 129,793,244 20,386,296 18,018,336 132,161,204
Capital assets, being depreciated:Sewer system 347,236,362 6,986,638 - 354,223,000 Water system 683,394,204 9,941,973 - 693,336,177 Building 22,315,887 3,511,471 - 25,827,358 Furniture, Equipments 5,320,788 308,648 - 5,629,436 Intangible 1,149,969 - - 1,149,969 Total capital assets being depreciated 1,059,417,210 20,748,730 - 1,080,165,940
Less accumulated depreciation for:Sewer system 99,344,350 1,787,584 - 101,131,934 Water system 49,061,880 12,348,951 - 61,410,831 Building 12,632,211 569,064 - 13,201,275 Furniture, fixtures and equipment 2,779,873 419,899 - 3,199,772 Intangible 531,259 223,727 - 754,986 Total accumulated depreciation 164,349,573 15,349,225 - 179,698,798 Total capital assets, being depreciated, net 895,067,637 5,399,505 - 900,467,142
Business-type activities capital assets, net $1,024,860,881 $25,785,801 $18,018,336 $1,032,628,346
63

ARLINGTON COUNTY, VIRGINIA
NOTES TO FINANCIAL STATEMENTS
JUNE 30, 2014
Discretely presented component units Schools:
Beginning
Balance Increases Decreases
Ending
Balance
Capital assets, not being depreciatedLand $4,697,946 $- $- $4,697,946
Capital assets, being depreciated:Buildings 654,977,367 29,515,273 - 684,492,640 Furniture, fixtures, and equipment 77,245,237 5,383,215 - 82,628,452 Total capital assets being depreciated 732,222,604 34,898,488 - 767,121,092
Less accumulated depreciation for:Buildings 160,742,852 16,374,434 - 177,117,286 Furniture, Equipments 50,885,781 3,937,395 - 54,823,176 Total accumulated depreciation 211,628,633 20,311,829 - 231,940,462 Total capital assets, being depreciated, net 520,593,971 14,586,659 - 535,180,630
Schools activities capital assets, net $525,291,917 $14,586,659 $- $539,878,576
Depreciation expense was charged to functions of the County and Schools as follows: Depreciation
Function and Activity Expense
Primary government:
Government activities: General Government $13,964,333 Public Safety 2,632,110 Public works, including depreciation of infrastructure assets 10,067,279 Health and welfare 376,776 Libraries 308,550 Parks, recreation and culture 3,247,446 Planning and community development 1,250,038
Total Depreciation Expense - Government Activities 31,846,532
Internal Services 6,166,989
Total Depreciation Expense - Governmental & Internal Services $38,013,521
Business-type activities:
Utilities $14,240,740Ballston Public Parking Garage 516,0078th level Ballston Public Parking Garage 73,155CPHD Development Fund 519,323
Total Depreciation Expense - Business-type Activities $15,349,225
Component unitSchools $20,311,829
Total Depreciation Expense - Component units $20,311,82964

ARLINGTON COUNTY, VIRGINIA
NOTES TO FINANCIAL STATEMENTS
JUNE 30, 2014
NOTE 6. Risk Management The County is exposed to various risks of loss relative to property, liability, revenue and personnel. The systematic identification and analysis of exposures to risk, implementation of risk control and loss mitigation techniques, and utilization of appropriate risk financing alternatives encompasses the management of these risks. It is the general philosophy of the County to retain risks internally up to economically prudent retention levels and account for necessary claim settlements in the General Fund. For excess exposure levels, specialized exposures and where commercial insurance is available at cost-effective premiums, the County will transfer some risk to commercial insurance carriers through the purchase of insurance policies, while maintaining the integrity of the County’s strategic self-insurance objectives. The major self-insurance programs are workers’ compensation, employees’ health insurance, and the self-insured retention portion of general, automobile, and public officials’ liability. For each major self-insurance program the County uses the professional services of a third-party administrator to adjudicate claims and recommend appropriate reserves for outstanding claims. Claims expenditures and liabilities are reported when it is probable that a loss has occurred and the amount of the loss can be reasonably estimated. These losses include an estimate of claims that have been incurred but not reported. The amount of settlement did not exceed the insurance coverage for each of the last three years. At June 30, 2014 the current portion of these liabilities was $6.96 million which represent an estimate of health insurance claims that have been incurred but not reported of $6.63 million, and are included in the accrued payroll liabilities and the current portion of workers’ compensation of $.33 million. The non-current portion was $3.03 million which represent an estimate of workers’ compensation claims which are included in the long-term liabilities based on a history of such claims. These liabilities are the County's best estimate based on available information. Changes in the reported liabilities since July 1, 2012 resulted from the following:
Beginning of Fiscal
Year Liability
Current Year Claims and Changes in
Estimates
Claim Payments
Balance at Fiscal
Year-End 2012 – 2013 Current $6,327,851 $50,031,946 $49,772,216 $6,587,851 Long Term $3,665,634 $2,365,801 $2,658,377 $3,373,058 2013 – 2014 Current $6,587,851 $54,847,327 $52,473,377 $6,961,531 Long Term $3,373,058 $2,104,563 $2,450,812 $3,026,809
In addition, the County has committed a General Fund balance self-insurance reserve of $5,000,000 as of June 30, 2014. The County maintains a General Fund operating reserve that totaled $54,575,340 as of June 30, 2014. Since its establishment in FY 1986, this operating reserve has not been used, but has been increased steadily. By adopted County Board policy, the operating reserve, set at two percent of the General Fund budget for a number of years, is now at least five percent. NOTE 7. Operating Leases The County leases office space and equipment under various long-term lease agreements. The building lease agreements are subject to various adjustments during the terms of the leases. Future minimum rental payments for each of the following years ending June 30, are as follows:
Fiscal Year Amount
2015 $17,207,8142016 17,656,7222017 18,159,6332018 18,578,8442019 11,302,913
2020-2024 30,514,589
$113,420,515
65

ARLINGTON COUNTY, VIRGINIA
NOTES TO FINANCIAL STATEMENTS
JUNE 30, 2014
In FY 2003, the County renewed and amended the operating lease agreement of the Court House Plaza to include the ninth floor premises. Total square feet of office space under the new 15 year agreement is 208,433. As part of the Court House Plaza lease agreement, the County receives 50% of the net cash flow generated by office and residential buildings located in the Court House area, subject to a minimum of $150,000 annually. During the fiscal year ended June 30, 2014, the County received $2,363,351 under these lease agreements. The County entered into a 75 year lease agreement with Arlington Hotel Associates LLC (LLC) on June 20, 2005 for the construction and operation of a hotel. The lease agreement required the LLC to make a one time lump-sum payment of $150,000 upon receipt of the first certificate of occupancy and to pay rent in the amount equal to 2% of annual gross revenues thereafter. The total payments received from the LLC during FY 2014 were $205,601. The County has also entered into a 45-year lease agreement for approximately 4.41 acres of land for the construction and operation of the Ballston Public Parking Garage. Cumulative lease payments are payable only when the garage attains certain cash flow targets which have not occurred since the inception of the lease. As of June 30, 2014, the lease liability $11,395,640 has been accrued in the Ballston Public Parking Garage Fund. NOTE 8. Capital Leases The County has financed the acquisitions of capital assets, including eight Arlington Transit (ART) buses, equipment for Fairlington Community Center, energy performance upgrade for the Arlington County Justice Center, breathing apparatus for the Fire Department, Voice over Internet Protocol (VoIP) voice communication system, a rock crusher, computers, and equipment. Arlington Public Schools has financed the acquisition of computers. Assets acquired and capital leases at June 30, 2014 are summarized below:
PrimaryGovernment Schools
Building $1,395,842 $-Equipment 34,780,920 11,396,678 Equipment CIP 267,703 -Auto 2,802,688 -Total Assets, at cost 39,247,153 11,396,678 Accumulated depreciation (10,967,500) (3,857,240) Total Assets, net $28,279,653 $7,539,438
66

ARLINGTON COUNTY, VIRGINIA
NOTES TO FINANCIAL STATEMENTS
JUNE 30, 2014
The annual future minimum lease payments as of June 30, 2014 are as follows: General Government:
Technology Environmental Total General Year Ending June 30, Services Services Fire Sheriff Government
2015 2,431,386 952,992 447,915 1,314,720 5,147,013 2016 1,566,083 952,992 447,915 690,665 3,657,655 2017 1,343,102 952,992 447,914 450,218 3,194,226 2018 1,111,720 727,122 337,353 236,048 2,412,243 2019 697,087 484,045 113,396 92,143 1,386,671 2020 - 466,840 - - 466,840 2021 - 466,840 - - 466,840 2022 - 466,840 - - 466,840 2023 - 466,839 - - 466,839 2024 - 466,839 - - 466,839
$7,149,378 $6,404,341 $1,794,493 $2,783,794 $18,132,006
(248,633) (938,539) (117,482) (69,831) (1,374,485)
Amount deferred (1,705,390) - - (736,567) (2,441,957)
$5,195,355 $5,465,802 $1,677,011 $1,977,396 $14,315,564
Total Minimum Lease payments
Less Imputed Interest
Present Value of Minimum Payments
Internal Service Fund:
Year Ending June 30,Auto
Equipment
2015 $1,292,0292016 1,292,0242017 1,068,8392018 845,6512019 845,6502020 385,2822021 385,282
Total Minimum Lease Payments 6,114,757Less: Imputed Interest (446,600)
Present Value of Minimum Payments $5,668,157
67

ARLINGTON COUNTY, VIRGINIA
NOTES TO FINANCIAL STATEMENTS
JUNE 30, 2014
Enterprise Fund:
Year Ending June 30, Utilities
2015 $34,4112016 34,411 2017 34,411 2018 34,412 2019 17,206
Total Minimum Lease Payments 154,851 Less Imputed Interest (10,550)
Present Value of Minimum Payments $144,301
Component Unit – Schools:
Year Ending June 30, Schools
2015 2,175,661 2016 1,699,129 2017 843,163
Total Minimum Lease Payments 4,717,953 Less Imputed Interest (154,936)
Present Value of Minimum Payments $4,563,017
NOTE 9. Long-Term Debt A. General Obligation Bonds
All outstanding bonds, except revenue bonds, constitute legally binding obligations of the County. The County Board is authorized and required by law to levy ad valorem taxes, without limitation as to rate or amount, on all taxable property within the County to pay the principal and any interest on the bonds. There is no overlapping debt for the County and no legal debt limit for counties in Virginia. There is, however, a requirement that general obligation bonds be approved by the voters at referendum before authorization for sale and issuance. Maturities of general obligation bonds currently outstanding, including interest, excluding premiums, are as follows:
68

ARLINGTON COUNTY, VIRGINIA
NOTES TO FINANCIAL STATEMENTS
JUNE 30, 2014
FiscalYear Principal Interest Principal Interest Principal Interest Principal Interest Principal Interest Total2015 $32,263,105 $14,936,830 $30,008,443 $14,516,715 $8,163,451 $4,706,109 $70,434,999 $34,159,654 $9,645,000 $4,617,487 $14,262,4872016 35,058,151 14,126,885 28,673,592 14,193,474 8,273,257 4,354,005 72,005,000 32,674,364 4,930,000 4,387,806 9,317,8062017 34,267,575 12,708,882 28,383,637 13,087,976 8,188,789 3,909,997 70,840,001 29,706,855 4,945,000 4,287,479 9,232,4792018 30,701,928 11,161,251 27,664,907 11,647,237 7,878,165 3,884,882 66,245,000 26,693,370 4,960,000 4,169,275 9,129,2752019 29,044,590 10,016,750 26,937,632 10,720,064 7,842,778 3,294,269 63,825,000 24,031,083 5,005,000 4,018,259 9,023,2592020 26,988,185 8,955,180 24,186,714 9,818,509 7,340,101 2,957,454 58,515,000 21,731,143 5,055,000 3,838,130 8,893,1302021 26,626,034 7,933,239 23,763,751 8,852,781 7,615,216 2,674,303 58,005,001 19,460,323 5,110,000 3,648,546 8,758,5462022 24,150,208 6,939,322 21,734,246 7,944,994 7,210,546 2,286,824 53,095,000 17,171,140 5,170,000 3,448,715 8,618,7152023 22,874,501 5,923,698 20,505,499 7,021,098 7,500,000 1,971,697 50,880,000 14,916,493 5,235,000 3,239,199 8,474,1992024 21,224,350 4,939,448 20,352,441 6,100,769 7,603,208 1,617,409 49,179,999 12,657,626 5,295,000 3,022,555 8,317,5552025 19,465,000 4,082,672 20,300,000 5,208,572 7,960,000 1,266,679 47,725,000 10,557,923 5,370,000 2,797,157 8,167,1572026 16,675,000 3,358,498 18,055,000 4,384,654 7,980,000 924,724 42,710,000 8,667,876 4,310,000 2,585,787 6,895,7872027 16,397,725 2,719,461 20,622,275 3,558,481 6,135,000 638,601 43,155,000 6,916,543 4,410,000 2,387,120 6,797,1202028 13,642,725 2,124,880 15,562,275 2,592,967 4,285,000 432,883 33,490,000 5,150,730 4,510,000 2,178,525 6,688,5252029 11,552,725 1,623,813 11,967,275 1,993,330 2,220,000 302,951 25,740,000 3,920,094 4,620,000 1,963,675 6,583,6752030 11,547,725 1,209,705 11,967,275 1,512,870 2,220,000 219,020 25,735,000 2,941,595 4,730,000 1,735,950 6,465,9502031 10,777,725 802,387 10,752,275 1,043,058 2,220,000 134,450 23,750,000 1,979,895 4,860,000 1,494,195 6,354,1952032 9,512,725 413,871 9,217,275 615,196 1,260,000 63,292 19,990,000 1,092,359 4,370,000 1,243,338 5,613,3382033 5,827,725 92,113 6,992,275 256,232 650,000 19,600 13,470,000 367,945 4,505,000 1,016,251 5,521,2512034 1,390,000 1,820,000 68,250 85,000 3,188 3,295,000 71,438 3,585,000 802,896 4,387,8962035 3,730,000 602,391 4,332,3912036 1,310,000 472,904 1,782,9042037 1,365,000 417,880 1,782,8802038 1,420,000 360,592 1,780,5922039 1,480,000 300,939 1,780,9392040 1,545,000 238,715 1,783,7152041 1,610,000 173,817 1,783,8172042 1,675,000 106,244 1,781,2442043 1,745,000 35,892 1,780,892
$399,987,702 $114,068,885 $379,466,787 $125,137,227 $112,630,511 $35,662,337 $892,085,000 $274,868,449 $116,500,000 $59,591,719 $176,091,719
ARLINGTON COUNTY, VIRGINIA
GENERAL OBLIGATION (GO) BONDS IDA BONDSGENERAL FUND SCHOOL FUND UTILITY FUND TOTAL GO BOND
69

ARLINGTON COUNTY, VIRGINIA
NOTES TO FINANCIAL STATEMENTS
JUNE 30, 2014 B. Advance Refunding
On June 11, 2014 the County issued $40,455,000 in Refunding Bonds (2013B) with an average interest rate of 5.0 percent. The bonds were issued to advance refund $41,720,000 of outstanding 2011 Series, 2012 Series, and 2013 Series (“Old Bonds”) with an average rate of 5.0 percent. The net proceeds, of $50,137,270, including the premium of $9,922,106 were used to purchase U.S Government securities which were deposited with an agent in an irrevocable escrow account to provide for the resources to redeem the Old Bonds. As a result, the Old Bonds are considered to be defeased and the liabilities for those bonds have been removed from the Statement of Net Position. The advance refunding resulted in a difference between the reacquisition price and the net carrying amount of the old debt of $1,265,000. The difference reported in the accompanying financial statements as a deduction from bonds payable is being charged to operations through year 2034 using the straight line method. The County completed the advance refunding to reduce its total debt service payments over the next 20 years by $2,570,150 and to obtain an economic gain (difference between the present value of the old and new debt service payments) of $2,254,701. Refunding Bonds
Total Refunding Percent of Savings from PV of SavingsBonds Allocations Refunding from Refunding
2014B RefundingGeneral Government $17,965,000 44.41% $1,141,336 $1,001,253Schools 19,725,000 48.76% 1,253,151 1,099,344 Total 37,690,000 93.17% 2,394,487 2,100,598
Utilities 2,765,000 6.83% 175,663 154,103
Grand total $40,455,000 100.00% $2,570,150 $2,254,701
C. Revenue Bonds – Ballston Public Parking Garage
Revenue Bonds of $22,300,000 were issued by the County in 1984 to provide for the acquisition and construction of a public parking garage facility. The bonds were issued in the form of Variable Rate Revenue Bonds to mature on August 1, 2017, and are subject to redemption as a whole or in part, at any time, at the principal amount thereof, plus accrued interest at the County's discretion. The bonds are not general obligations of the County and are payable solely from gross revenues arising from the operations of the garage facilities, an irrevocable direct pay letter of credit in the initial principal amount of $25,648,055 and other funds which may be available to the project. As “credit support” for the project, the County has agreed to consider appropriating funds should a shortfall in revenues affect the payments to the bondholders. Debt service payments on the bonds are further secured by a deed of trust on the garage facilities and related assets. As of June 30, 2014, $8,900,000 is outstanding under these revenue bonds. The interest rate on the bonds is determined weekly, using a Variable Interest Index, calculated under the terms of the bond issuance agreements. The rate may be converted to a fixed interest rate at the discretion of the County during the term of the bonds. The initial interest rate was 6.9%, at no time can exceed 15%. The weekly interest averaged approximately 0.0642% in FY 2014. Interest is payable quarterly prior to conversion to a fixed interest rate, and on June 1 and December 1 of each year thereafter until maturity, purchase or earlier redemption. The direct pay letter of credit is substantially collateralized by the assignment of the land lease and other agreements. On September 22, 2011, a three-year Letter of Credit (LOC) was issued by PNC Bank, N.A. This letter of credit will expire on September 6, 2014. On September 22, 2011, a three-year Letter of Credit (LOC) was issued by PNC Bank, N.A. This letter of credit will expire on September 6, 2014. On August 5, 2014, subsequent to the end of FY 2013, the LOC was signed to extend the expiration date to August 6, 2017. Using a usual and customary direct-pay letter of credit mechanism, during FY 2014, the County drew from the letter of credit $5,481 to pay bondholders for the interest accrued on the revenue bonds. The letter of credit drawdowns were
70

ARLINGTON COUNTY, VIRGINIA
NOTES TO FINANCIAL STATEMENTS
JUNE 30, 2014
immediately repaid by the County from garage revenues held in trust at the time of the drawdowns. The fees associated with the letter of credit were $95,453 in FY 2014. Also in FY 2014, $500,000 of bond principal was repaid from garage revenues in accordance with the terms of the letter of credit agreement.
D. Mortgage and Ground Lease Debt
The County entered into an agreement (the "Agreement") dated August 1, 1984, for the purchase of an existing parking garage facility at a total purchase price of $3,929,679. An initial payment of $500,000 was made on October 22, 1986, with the remaining balance of $3,429,679 payable annually with 8% interest per annum beginning in FY 1988. Principal and interest are payable solely from revenues derived from garage operations, at $275,000 and $375,000 for the first 10 years and the next 17 years, respectively. In any year that there is not sufficient cash flow, payments under the note shall be deferred; however, the note shall be due and payable in full, 45 years from the date of the note. The short-term portion of mortgage and ground lease interest payable was$24,220,962 . As of June 30, 2014, all payments have been deferred.
E. Virginia Resources Authority Note Payable
VRA Bonds were issued in June 2004 in the amount of $100,000,000. The proceeds from those bonds were received by the County prior to fiscal year 2012. The interest rate on these bonds is 3.10 percent. The principal outstanding on these bonds at June 30, 2014 was $67,177,770. In June 2007, the County entered into a Financing Agreement with the Virginia Resources Authority (VRA). VRA agreed to issue $4,000,000 (Series 2007 A) and $76,000,000 (2007 Series B) in Wastewater System Revenue Bonds (VRA Bonds) and lend the proceeds to the County for improvements to the County’s water pollution control plant and wastewater system. Interest was charged at a rate of 3.00 percent. The proceeds from those bonds were received by the County prior to fiscal year 2012. The principal outstanding on these bonds at June 30, 2014 was $3,095,800 on Series A bonds and $58,791,372 on Series B bonds. In October 2008, the County entered into a Financing Agreement with VRA. VRA agreed to issue $50,000,000 in Wastewater System Revenue Bonds, Series 2008 and lend the proceeds to the County to continue the improvements to the water pollution control plant. The interest rate on these bonds is 3.55 percent. The proceeds from those bonds were received by the County prior to fiscal year 2012. The principal outstanding on these bonds at June 30, 2014 was $42,336,456. In June 2009, the County entered into a Financing Agreement with VRA. VRA agreed to issue $35,000,000 in Wastewater System Revenue Bonds, Series 2009 and lend the proceeds to the County to continue the improvements to the water pollution control plant. The interest rate on these bonds is 3.35 percent. The proceeds from those bonds were received by the County prior to fiscal year 2011. On June 30, 2014, principal outstanding on these bonds was $30,975,312 . In May 2010, the County entered into a Financing Agreement with VRA. VRA agreed to issue $1,856,428, $16,795,849, and $16,347,723 in Wastewater System Revenue Bonds, Series 2008, 2009, and 2010 respectively, and lend the proceeds to the County to continue the improvements to the water pollution control plant. At June 2014, VRA had provided a loan of VRA bond proceeds in the amounts of $1,856,428, $16,795,849, and $16,347,723 respectively. The principal outstanding on these bonds at June 30, 2014 was $ 1,646,823 on Series 2008 bonds, $14,864,476 on Series 2009 bonds and $14,394,926 on Series 2010 bonds. All current and prior bonds are secured by a pledge of County sewer revenues.
F. IDA Lease Revenue Bonds (Various County Government Projects)
On August 1, 2004, the Industrial Development Authority of Arlington County, Virginia (the “Authority”) and U.S. Bank Trust National Association, (the “Trustee”), made an agreement to finance the acquisition, construction, improvement, furnishing and equipping of various capital projects, including the Emergency Communication Center, the Trade Center Project, the George Mason Center Project, and the Enterprise Resource Planning Project. The Authority
71

ARLINGTON COUNTY, VIRGINIA
NOTES TO FINANCIAL STATEMENTS
JUNE 30, 2014
issued 20 year Lease Revenue Bonds in the amount of $60,540,000 to finance these projects. These lease revenue bonds were refunded by the Lease Revenue Bonds issued on May 9, 2013.
G. IDA Revenue Notes (Buckingham Village 3 Acquisition)
On March 23, 2009, the Industrial Development Authority of Arlington County, Virginia (the “Authority”) and Sun Trust Bank made an agreement to finance the acquisition of Buckingham Village 3. The County leased the property to a developer, a partnership of Telesis and National Housing Trust (NHT), which immediately began to manage the property and will undertake renovations of the property within 12-24 months. The Authority refinanced its note on May 27, 2010 with the issuance of its $9,666,099 Taxable Variable Rate Note, Series 2010A and $26,000,000 Taxable Fixed Rate Note, Series 2010B (the "Buckingham Village 3 Notes"). The County and the Authority entered into a Support Agreement under which the County, subject to annual appropriation, will make debt service payments on the Buckingham Village 3 Notes. Debt service payments have been budgeted in the County's affordable housing investment fund (AHIF). These notes were refunded by the Lease Revenue Bonds issued on May 9, 2013.
H. IDA Revenue Bonds (Various County Projects)
On August 13, 2009, the Industrial Development Authority of Arlington County, Virginia (the "Authority") issued $41,280,000 in Revenue Bonds for the benefit of Arlington County (the "2009 IDA Bonds"). The 2009 IDA Bonds were for the funding of the County's Metro Matters obligation and for the acquisition of property for a park and streets in Buckingham Village 1. $31,435,000 of the issuance was in the form of taxable Build America Bonds (BABs). Interest on these bonds is subject to a 35% rebate from the IRS. The County has agreed under a Cooperation Agreement between the County and the Authority that subject to appropriation by the County Board, the County will deliver to the Authority sufficient funds to make payments with respect to the 2009 IDA Bonds. Debt service on $10,800,000 is expected to come from the Transportation Investment Fund revenues which come from a 12.5 cent tax per $100 of assessed value on commercial real estate. The principal outstanding on these notes at June 30, 2014 was $36,565,000. On January 27, 2011, the Industrial Development Authority of Arlington County, Virginia (the "Authority") issued $11,940,000 in Revenue Bonds for the benefit of Arlington County (the "2011 IDA Bonds"). The 2011 IDA Bonds were for the funding of the County's construction of Fire Station #3, park space at Buckingham Village I, and construction of Arlington Mill Community Center. The County has agreed under a Cooperation Agreement between the County and the Authority that subject to appropriation by the County Board, the County will deliver to the Authority sufficient funds to make payments with respect to the 2011 IDA Bonds. As of June 30, 2014, $10,565,000 remains outstanding. On May 9, 2013, the Industrial Development Authority of Arlington County, Virginia (the "Authority") issued $76,315,000 in Revenue Bonds for the benefit of Arlington County (the "2013 IDA Bonds"). The 2013 IDA Bonds were for the funding of the County's acquisition and improvements to land and property located at 2020 14th Street North, advance refunding of the 2004 IDA Lease Revenue Bonds and refunding of IDA Revenue Notes. The County has agreed under a Cooperation Agreement between the County and the Authority that subject to appropriation by the County Board, the County will deliver to the Authority sufficient funds to make payments with respect to the 2013 IDA Bonds. As of June 30, 2014, $69,370,000 remains outstanding.
I. Changes in Long-Term Liabilities
During the year ended June 30, 2014, the following changes occurred in liabilities reported in the County and Schools Long-term Obligations:
72

ARLINGTON COUNTY, VIRGINIA
NOTES TO FINANCIAL STATEMENTS
JUNE 30, 2014
Balance Balance Due in oneJuly 1 Additions Reductions June 30 Year
General Government:Compensated absences* $32,435,962 $30,252,517 ($29,281,734) $33,406,745 $3,340,675Workers compensation 3,747,842 2,338,403 (2,723,124) 3,363,121 336,312 GO Bonds - County 213,795,664 26,750,000 (30,540,630) 210,005,034 19,767,081 Refunding Bonds - County 190,551,438 17,965,000 (18,533,770) 189,982,668 12,496,025 GO Bonds - Schools 207,175,127 36,460,000 (28,977,395) 214,657,732 14,987,000 Refunding Bonds - Schools 165,412,675 19,725,000 (20,328,620) 164,809,055 15,021,444 IDA - Metro and Buckingham Village 1 37,780,000 - (1,215,000) 36,565,000 1,240,000 IDA Revenue Bonds - 2011 11,190,000 - (625,000) 10,565,000 625,000 IDA Revenue Bonds - 2013 76,315,000 - (6,945,000) 69,370,000 7,780,000 Capital leases 13,175,010 5,459,004 (4,318,450) 14,315,564 4,760,784 Bond premiums - County 30,591,345 2,442,072 (1,866,271) 31,167,146 1,988,374 Bond premiums - Schools 26,796,550 3,260,794 (1,535,349) 28,521,995 1,698,389 Deferred cost on refunding bonds - County ** (1,233,147) 568,769 63,520 (600,858) (35,081) Deferred cost on refunding bonds - Schools ** (980,424) 603,620 113,665 (263,139) (83,484)
Totals General Government 1,006,753,042 145,825,179 (146,713,158) 1,005,865,063 $83,922,519
Internal service:
Compensated Absence 558,829 531,108 (562,743) 527,194 52,719Capital lease 4,087,260 2,500,213 (919,315) 5,668,158 1,143,236
Total Governmental Activities 1,011,399,131 148,856,500 (148,195,216) 1,012,060,415 85,118,474
Component Unit-Schools:
Compensated absences 34,974,869 - (1,574,982) 33,399,887 3,339,989Capital lease 5,008,839 1,199,435 (1,645,256) 4,563,018 2,081,774
39,983,708 1,199,435 (3,220,238) 37,962,905 5,421,763
Business-Type Activities
Compensated absences-Utilities 1,436,340 1,658,594 (1,793,936) 1,300,998 130,100Compensated absences-CPHD 597,455 700,662 (715,936) 582,181 58,218GO Bonds - Utilities 54,959,209 1,700,000 (8,741,975) 47,917,234 6,804,000Refunding Bonds - Utilities 64,805,887 2,765,000 (2,857,610) 64,713,277 1,359,451Revenue Bonds - Ballston 9,400,000 - (500,000) 8,900,000 500,000Mortgage Payable - Ballston 3,429,679 - - 3,429,679 3,429,679Mortgage and Interest Payable - Ballston 22,844,807 1,630,151 - 24,474,958 24,474,958VRA Loan Payable 246,193,772 - (12,910,837) 233,282,935 13,347,499Bond and mortgage interest payable - Utilities 4,036,465 4,006,023 (4,036,465) 4,006,023 4,006,023Capital Leases 173,932 - (29,631) 144,301 30,487Bond Premium - Utilities 4,977,984 151,932 (299,163) 4,830,753 306,759Deferred Cost of Refunding 1,736,464 92,610 (95,717) 1,733,357 100,347
Total business-type activities $414,591,994 $12,704,972 ($31,981,270) $395,315,696 $54,547,521
* The General, School & Utility Funds have been used in prior years to liquidate compensated absences.** The par value of the refunding bonds in series 2013B and 2013C were higher than the par value of the refunded bonds causing a negative balance of deferred cost on refunding bonds at June 30, 2013. The additional par was deposited to fulfill the escrow requirements for advance refunding of the old debt.
73

ARLINGTON COUNTY, VIRGINIA
NOTES TO FINANCIAL STATEMENTS
JUNE 30, 2014 NOTE 10. Net Investments in Capital Assets – Component unit - Schools Virginia state law provides that a school board is a separate legal entity and school boards hold title to all school assets. However, whether separately elected or appointed by the governing body, Virginia’s local school boards do not have the power to levy and collect taxes or issue debt. Purchases of school equipment, buildings or improvements (capital assets) to be funded by debt financing require the local government to issue the debt. Accordingly, in the government-wide financial statements, the “school debt” is reflected in Exhibit 1 “Statement of Net Position” in the governmental activities column of the primary government. The net effect of this on the entries to the Exhibit 1 governmental activities for “Non-current liabilities” and “Net investment in capital assets” is $407,725,643 for the Primary Government and the Schools. The effect on the Statement of Activities includes $9,321,715 which represents the net of school bond proceeds less principal payments on school bonds. This election has no effect on the combined total of the overall government. NOTE 11. Interfund Receivables and Payables The County has numerous transactions among Funds and Component Units to finance operations, provide services, and construct assets. Activity between funds that are representative of lending/ borrowing arrangements outstanding at the end of the fiscal year are referred to as either “due to/from other funds” (i.e., the current portion of interfund loans). The amounts of such transactions not received or paid at June 30, 2014 are reflected in current due to/from accounts of each Fund/Component Unit, as summarized below: Due to/ from other funds
Receivables Payables
General Fund $182,600 $-Urban Area Security Initiative - 182,600
$182,600 $182,600
Due to/from primary government and component unit
Receivables Entity
Payables Entity
General Fund ($294,029) $85,941,674School Funds:Operating Primary Government 68,311,417 -Community Activities Primary Government 1,010,746 -Pay-As-You-Go Primary Government 16,619,511 -CSA Other School Funds - (294,029)
$85,647,645 $85,647,645
The primary purpose of interfund transfers is to provide funding for operations and capital projects. Interfund transfers for the year ended June 30, 2014 are as follows:
74

ARLINGTON COUNTY, VIRGINIA
NOTES TO FINANCIAL STATEMENTS
JUNE 30, 2014
Transfer General Fund Capital
Projects Fund Internal
Service Fund Total
Transfers Out
General Fund $- $29,553,643 $195,853 $29,749,496Capital Projects Fund - - - - Special Revenue Fund 75,400 - - 75,400 Non-major Capital Projects Fund 162,689 - - 162,689 Internal Service Fund 130,000 - - 130,000
Total Transfers In $368,089 $29,553,643 $195,853 $30,117,585
NOTE 12. Fund Balance Certain portions of fund balances have been reserved or committed by the County Board for specific purposes and are therefore not available for general appropriation as summarized below. Future disbursements relating to these reserved and designated fund balances are accounted for as expenditures in the year in which incurred. The non-spendable fund balance is comprised of the following amounts reported in non-spendable form such as prepaid:
$1,288,591 Section 8 Housing
4,275 Neighbour Conservation Bond Fund
The County committed the following General Fund balance types by a resolution of the County Board:
$5,000,000 Self-insurance reserve 4,860,024 Subsequent year’s budget – County 14,831,642 Capital projects 54,575,340 Operating reserve 3,000,000 Economic Stabilization Reserve 412,220 Incomplete Projects 45,631,924 Affordable Housing Investment Fund
46,735,944 Subsequent year’s budget – Schools
The County has committed a General Fund balance self-insurance reserve of $5,000,000 as of June 30, 2014. The County maintains a General Fund operating reserve that totaled $54,575,340 as of June 30, 2014. Since its establishment in FY 1986, this operating reserve has not been used, but has been increased steadily. By adopted County Board policy, the operating reserve, will be maintained at no less than three percent of the General Fund budget, with a goal of increasing the reserve to five percent. The County uses restricted/committed amounts to be spent first when both restricted and unrestricted fund balance is available unless there are legal documents/contracts that prohibit doing this, such as a grant agreement requiring dollar for dollar spending. Additionally, the County would first use committed, then assigned and lastly unassigned amounts of unrestricted fund balance when expenditures are made. Fund balance must be appropriated by the County Board prior to spending. The purpose of each special revenue fund and revenue source is listed below:
Special Revenue Fund Revenue Source Ballston Business Improvement Distric Real Estate Taxes Rosslyn Business Improvement District Real Estate Taxes Crystal City Business Improvement District Real Estate Taxes Community Development Grants Federal Grants Section 8 Housing Program Federal Grants
75

ARLINGTON COUNTY, VIRGINIA
NOTES TO FINANCIAL STATEMENTS
JUNE 30, 2014 NOTE 13. Commitments and Contingencies
A. Washington Metropolitan Area Transit Authority
In October 2004, the County and other WMATA contributing jurisdictions signed to the Metro Matters Funding Agreement (MMFA) with WMATA for fiscal year 2006-2010 for $3.3 billion. The MMFA described funding priorities for system renewal and enhancement projects for Metrorail and Metrobus, and presented a financial plan to implement more than $3 billion in projects over the six year period of the Agreement which ended in June, 2010. In July 2010, the Metro Matters Program was succeeded by the WMATA Capital Funding Agreement (the “Agreement”). This Agreement covered $5.0 billion in capital funding needs throughout fiscal years 2011 – 2016 and served as a master agreement to support future capital needs presented in annually updated Capital Improvement Programs (CIP’s). The current FY 2013 – 2018 Capital Improvement Program (CIP) is a 6 year forecast that lays out the specific projects to be funded, along with the sources of funds, in accordance with the Agreement. The CIP may include any capital project or purchase eligible for capital funding and may include projects in such categories as: vehicles and vehicle parts, rail system infrastructure rehabilitation, maintenance facilities, systems and technology, tracks and structures, passenger facilities, maintenance equipment, other facilities, project management, safety and security projects, and preventative maintenance. Arlington County’s contribution of $840.7 million in funding over the six-year period of this Agreement is subject to annual appropriation of funds, and other limitations on expenditures or obligations under the applicable law. Arlington County is planning to use General Obligation Bonds and state grants to cover its share of the Capital Funding Agreement needs. In addition, the County shares the operating costs for WMATA's combined bus and rail system. State aid and Northern Virginia Transportation Commission funds have been utilized to help finance these costs. During FY 2014, the County paid $28.2 milliion from its General Fund to subsidize WMATA's Metrobus, Metrorail and MetroAccess operating costs.
B. Construction Commitments
As of June 30, 2014 contractual commitments were outstanding in the following funds for the amounts indicated:
Capital Project Funds $51,091,802Utilities Funds 18,682,141
$69,773,943
These projects include the Transportation Infrastructure Maintenance Capital, Utility Water Distribution System Improvements, Sanitary Sewer System Improvements, Wastewater Treatment Plant Improvements, and Water & Sewer System Maintenance Capital Programs.
C. Waste-to-Energy Facility
Arlington Solid Waste Authority The Arlington Solid Waste Authority (the “ASWA”) was created in 1984 and is responsible for oversight of the waste-to-energy facility (“the Facility”). The ASWA consists of the five elected members of the Arlington County Board, the County Manager, who is appointed by the County Board, and the County Comptroller, who reports (as a trustee of the Trust Fund) to the County Manager. The boards of the County and the ASWA have the same membership.
On December 1, 1984, an inter-local joint enterprise agreement was entered into between the Alexandria Sanitation Authority and the Arlington Solid Waste Authority (the “Authorities”). The Joint Enterprise, referred to as the Alexandria/Arlington Resource Recovery Corporation, was formed to design, construct, equip, test, and operate a solid waste disposal facility having an installed capacity of 975 tons per day of mixed municipal solid waste. The facility is
76

ARLINGTON COUNTY, VIRGINIA
NOTES TO FINANCIAL STATEMENTS
JUNE 30, 2014
located at 5301 Eisenhower Avenue, Alexandria, Virginia. Revenue bonds were issued by the Alexandria Industrial Development Authority and proceeds were lent to the Authorities to construct the facility.
On October 22, 1985, the Facility was sold by the Authorities to a private company (“the Corporation”) pursuant to a Conditional Sale and Security Agreement. The sale involved the transfer of construction-in-progress together with marketable securities and other assets. The Corporation assumed the obligation to provide funds adequate to pay the current liabilities and the outstanding revenue bonds payable as of October 22, 1985. This Agreement requires the Authorities to transfer full title to the Facility only when principal and interest on the outstanding revenue bonds or any subsequent refinancing revenue bonds have been paid in full. The Agreement also entitles the Authorities to repossess the Facility if revenue bond debt service payments are not made.
In connection with this transaction, the Corporation entered into a Facility Agreement dated as of October 1, 1986, obligating it to construct the Facility and to provide waste disposal services to the City of Alexandria, Arlington County, and the Authorities for 20 years. Under the Facility Agreement, the County has a guaranteed annual tonnage of acceptable waste commitment to the Facility. The commitment is based on a percent of solid waste the County expects to collect. The Facility charges a fee on each ton based on defined costs, and the County has met its maximum requirement for annual tonnage each year. In July 1998, the Authorities advance refunded $55,025,000 of the outstanding revenue bonds (Series 1998 A bonds) for the Facility to take advantage of lower interest rates. In November 1998, the Arlington Industrial Development Authority issued $48,550,000 in new retrofit revenue bonds (Series 1998 B bonds) to cover the cost of new pollution abatement equipment at the Facility required by federal law. The proceeds of the Series 1998 B bonds were lent to Authorities to construct the equipment. A promissory note was issued by the ASWA in the amount of $27,651,000 as part of this construction financing. The Series 1998 A bonds matured in January 2008, and the plant was sold to Covanta for $10.00 per bill of sale which was dated February 28, 2008.
Because the ASWA Board is essentially the same as the Arlington County Board and the financing agreements require the capital assets built with the Series 1998 B bonds to belong to the ASWA (60% ownership), the County had to record these assets in its financial statements for FY 1999 and FY 2000. Cash, capital assets (construction-in-progress), and the promissory note signed by the ASWA were displayed with the County’s Enterprise Funds. The retrofitting of the Facility’s boiler units with certain air pollution control equipment was made necessary by the EPA regulations adopted pursuant to the 1990 Clean Air Act Amendments which imposed more stringent emission limitations on waste-to-energy facilities. The Corporation has agreed to design, construct, start-up, and test the equipment so that it passes the Acceptance tests.
Since Acceptance testing on each unit was completed in November 2000, the Operating Lease agreement between the ASWA and the Corporation took effect in January 2001. Since in essence the lease is a capital lease, the capital assets completed and covered by the lease and the promissory note are removed from the County records and are now considered a part of the plant.
D. Alexandria/Arlington Waste To Energy Facility Monitoring Group Trust Fund “WTE-FMG”
On December 31, 2012 Arlington County and the City of Alexandria entered into a new Inter-local agreement and established the Waste To Energy Facility Monitoring Group Trust “WTE-FMG” and terminated the Alexandria/Arlington Waste Disposal Trust fund. The new trust oversees the operation of the facility and it has been used to pay consulting fees to the engineering firm for operations and mainenance audits of the facility, professional association fees and other payments related to the WTE facility. The Trust drives its revenue mainly from contrubutions by both jursductions and interest on invested funds. The funds are invested by Arlington County in First Virginia Community Bank, the carrying value of the funds and the bank balance totaled $55,173 at June 30, 2014. During FY 2014 the Fund had $170,604 as revenues and project-related expenditures of $258,177.
E. Industrial Development Authority Ice Skating Facility The County is committed to encouraging continuing economic development, including the area around Ballston, inducing the relocation to the County of private businesses to strengthen the business climate, and to making sports and recreation facilities available to the citizens of the County. To further these ends, on December 14, 2004, the County
77

ARLINGTON COUNTY, VIRGINIA
NOTES TO FINANCIAL STATEMENTS
JUNE 30, 2014
Board approved a resolution to assist the Washington Capitals Hockey Club (the "Capitals"), a professional team of the National Hockey League, in the development and construction of a skating facility and related improvements (the “Skating Facility”). The Skating Facility was built on the eighth (top) level of the existing Ballston Public Parking Garage (the “Garage”), which is owned by the County, adjacent to the Ballston Commons Mall. In 1984, the County had assisted in the development of Ballston Commons Mall, by constructing the existing seven-level parking garage. Under the current arrangements, the County leases the land on which the Garage is built and owns certain rights in the Garage pursuant to a ground lease between the Federated Department Stores, Inc.(FDS), as lessor, and the County, as lessee. The Skating Facility contains approximately 95,000 square feet of constructed space and houses, among other amenities, two ice sheets suitable for National Hockey League use, one of which is convertible to host sports and events that do not require the ice surface; locker rooms and other training facilities for the Capitals; changing rooms for youth and adult hockey teams and figure skaters; a pro shop; rooms for public use; and corporate office space for the Capitals. The development also includes public parking (the “Parking Facilities”). As part of the agreement, the County agreed to construct an eighth level slab (the "Eighth Level Slab") on top of the Garage, to lease the Eighth Level Slab to the Industrial Development Authority of Arlington County, Virginia (the “IDA”), and to acquire the rights necessary to assist the development and construction of the project on the Garage pursuant to a Skating Facility Agreement (the "Skating Facility Agreement"), among the County, FDS, and certain other parties. The County has also constructed public parking (the “Parking Facilities”) on the Eighth Level Slab. The IDA agreed to acquire the rights necessary to undertake development and construction of the Skating Facility pursuant to the Deed of Lease and Grant of Air Rights, and, as third party beneficiary, under the Skating Facility Agreement. The County is currently leasing the Eighth Level Slab to the IDA and the IDA is leasing back to the County a portion of the Eighth Level Slab on which the County is operating the Parking Facilities. In 2005, the IDA negotiated with the Capitals a Development Agreement under which the IDA developed and constructed the Skating Facility. The IDA issued $35,700,000 Series 2005 IDA Skating Facility Taxable Revenue Bonds (the “Bonds”) to provide financing for the Skating Facility and, if necessary, the Parking Facilities. On April 22, 2010 the IDA issued $30,120,000 Series 2010 IDA Taxable Revenue Refunding Bonds (“Refunding Bonds”) with an average interest rate of 5.37% to refund $35,200,000 of outstanding Bonds. The net proceeds of $29,781,467 (after payment of $338,533 in underwriting fees, insurance, and other issuance costs) plus an additional $5,418,533 debt service reserve fund and debt service fund monies were used as payment on the Bonds. The 2005 Bonds were issued as a floating rate obligation, with interest payable monthly based off of a spread to the London Interbank Offered Rate (LIBOR). The Bonds were redeemed in full at par on May 3, 2010 without penalty and there would not be any Net Present Value (NPV) savings given that the Bonds were floating rate obligation callable at any time. A Cooperation Agreement between the County and the IDA states that, subject to appropriation of funds by the County Board, the County will deliver to the IDA sufficient funds so that the IDA can, among other things, make payments with respect to the Bonds and otherwise carry out its obligations under the Development Agreement if necessary. To further secure its obligations to make payments with respect to the Bonds, the IDA will, if required, grant a lien on and security interest in all of its right, title and interest in the Project, including its leasehold interest in the Eighth Level Slab, under a Leasehold Deed of Trust and Security Agreement between the IDA and certain individual trustees for the benefit of the trustee for the Bonds. The IDA owns the Skating Facility and is currently leasing it to the Capitals, or an affiliate, pursuant to a Deed of Lease (the "Capitals Lease"), between the IDA and the Capitals, under which the Capitals have furnished, equip and operate the Skating Facility. Under the Capitals Lease, the Capitals will make payments of rent that are equal to debt service on the Bonds. Under the Cooperation Agreement, the IDA will agree to remit to the County all revenues received from the leasing of the Skating Facility, including those derived under the Capitals Lease. In FY 2014, $2.4 million was received from the Capitals. Construction on the project started in April of 2005 and the ice rinks opened to the public and the Capitals on November 10, 2006.
78

ARLINGTON COUNTY, VIRGINIA
NOTES TO FINANCIAL STATEMENTS
JUNE 30, 2014 F. Industrial Development Authority Affordable Housing Project
AHC Limited Partnership-10 (“AHC-10”) and AHC Limited Partnership-11 (“AHC-11”) (collectively the “Gates Partnership”) Debt (Series 2006) was issued by the Industrial Authority of Arlington County, Virginia and the proceeds loaned to the Gates Partnership in order to acquire, rehabilitate, and equip a 464-unit multifamily apartment complex for rental to individuals and families of low-income known as the Gates of Ballston (the Project). The debt is projected to be repaid from the revenues generated by the Project. AHC-10 owns the Project, is the borrower on the debt, and leases the Project to AHC-11 under a master lease agreement; AHC-11 rents the Project units to subtenants, pays all operating expenses, and is responsible for making monthly lease payments to AHC-10. The Gates Partnership also has a mortgage note with the Virginia Housing Development Authority and a promissory note with the County. Subject to appropriation, the County will only be responsible for reimbursement of the debt service payments to the extent that the debt service reserve of the Gates Partnership is insufficient to make the required debt service payments.
G. Closure Care Costs – Department of Human Services (DHS) Laboratory
State and federal laws and regulations require the County to pay for the closure and processing/removal of any medical waste on site at the DHS laboratory when it stops accepting waste to be processed by the steam sterilizer at the laboratory. Although closure costs will be paid only near or after the date that the laboratory is closed, the County reports a portion of the closure costs as an operating expense in each period based on a formula provided by the Virginia Department of Environmental Quality. The County has chosen the use of the annual operating budget as the method for funding the closure cost. Because the County satisfies the requirements of section 9VAC20-70-210 of the Virginia General Assembly legislative Information System administrative code, the reported liability for the closure at June 30, 2014 is $1.
H. Litigation
The County is a defendant in lawsuits concerning various matters; in the opinion of the County Attorney, the resulting liability from these lawsuits is not expected to be material.
NOTE 14. Joint Ventures
A. Northern Virginia Criminal Justice Academy
The County participates in a joint venture with Loudoun County and the Cities of Alexandria, Fairfax, Falls Church, Manassas, and Manassas Park to provide training for sworn law enforcement and correctional officers to satisfy requirements mandated by the Commonwealth of Virginia. The Industrial Development Authority of Loudoun County, Virginia issued $6,585,000 Northern Virginia Criminal Justice Academy Lease Revenue Bonds, Series 1993, to finance the acquisition, renovation, and equipment of the Academy Training Center. The County, the City of Alexandria, and Loudoun County have entered into a capital lease with the Industrial Development Authority of Loudoun County. The County maintains an equity interest only in the land and building of the Academy, which is reflected in the County's General Capital Leases. The County does not maintain an equity interest in the Academy's operations. In addition, the County pays the Northern Virginia Criminal Justice Academy for operating costs based on the pro-rata share of officers trained. In FY 2014, the County paid $532,160 for capital and operating costs. Financial statements for the Academy may be obtained from the Northern Virginia Criminal Justice Academy, 45299 Research Place, Ashburn, Virginia, 22011-2600.
B. Peumansend Creek Regional Jail Authority
In 1992, the County entered into an agreement with the Counties of Caroline, Prince William and Loudoun, and the Cities of Alexandria and Richmond to form an Authority to construct and operate a regional jail in Caroline County. The regional jail is used primarily to hold prisoners from each member jurisdiction. The Authority is composed of two representatives, the Chief Administrative Officer and the Sheriff, from each participating jurisdiction. The City of Richmond, which was not party to the original agreement, is now a part of the project.
79

ARLINGTON COUNTY, VIRGINIA
NOTES TO FINANCIAL STATEMENTS
JUNE 30, 2014
The regional jail is currently designed with the capacity for 336 prisoners. The County is guaranteed a minimum of 60 beds. Current cost projections anticipate a total project cost of approximately $27 million with 50% of the eligible construction cost ($23.8 million) to be reimbursed by the Commonwealth. The Authority issued $10.22 million in revenue bonds and $12 million in grant anticipation notes in March 1997. The County has no equity in the jail and is not responsible for repayment of the bonds or notes. The County's portion of the project costs includes approximately $3.8 million over the 20-year period of debt (1997-2017). In FY 2014, the County paid $625,615 for capital and operating costs. Financial statements may be obtained from the Peumansend Creek Regional Jail Authority, P. O. Box 1460, Bowling Green, Virginia, 22427.
NOTE 15. Deferred Compensation Plan The County offers its employees a deferred compensation plan created in accordance with Internal Revenue Code Section 457. The plan, available to all County employees, excluding School Board employees, permits them to defer a portion of their salary until future years. The deferred compensation is not available to employees until termination, retirement, death or unforeseeable emergency. All amounts of compensation under the plans, all property and rights purchased with those amounts, and all income attributable to those amounts, property or rights are solely the property and rights of the plan participants and their beneficiaries. Participants' rights under the plan are in an amount equal to the fair market value of the deferred account for each participant. Investments in the plan are valued at market. All defined contribution plan assets are invested as directed by the individual employee and the plan is administered by Voya. NOTE 16. Employee Retirement Systems
The County maintains a single-employer, defined benefit pension plan, the Arlington County Employees’ Retirement System ("System"), which covers substantially all employees of the County Board. The County also participates in the Virginia Retirement System ("VRS") that covers most School Board employees and some County employees associated with state agencies. The System was established under Chapters 46, 35, and 21 of the Arlington County Code. The pension plan financial statements are reported using the economic resources measurement focus and the accrual basis of accounting. Plan member contributions are recognized in the period in which the contributions are due. The County’s contributions are recognized when due and a formal commitment to provide the contributions has been made. Benefits and refunds are recognized when due and payable in accordance with the terms of the system. All plan investments are reported at fair value. Securities traded on a national exchange are valued at the last reported sales price on the County’s balance sheet date. Securities without an established market are reported at estimated fair value. Complete financial statements of the system may be obtained from the Arlington County Employee Retirement System, 2100 Clarendon Boulevard, Suite 511, Arlington, Virginia, 22201. Complete financial statements of the VRS may be obtained from the Virginia Retirement System, Attn: William Sullivan, P. O. Box 2500, Richmond, Virginia, 23218. A. Arlington County Employees' Retirement System
Plan Description The Arlington County Employees' Retirement System (the System) is a pension trust fund of the Arlington County, Virginia (the County) financial reporting entity and is included in the County’s comprehensive annual financial report. The accompanying financial statements present information on the operations of the System in conformity with generally accepted accounting principles. The System is a single employer public employee defined benefit pension plan covering substantially all employees of the County.
80

ARLINGTON COUNTY, VIRGINIA
NOTES TO FINANCIAL STATEMENTS
JUNE 30, 2014
Plan Administration On November 16, 2004, amendments to Arlington County Chapters 21, 35 and 46 were made to transfer the System’s administrative responsibilities to the County Manager while leaving investment responsibility with the Board of Trustees (the Retirement Board). The Retirement Board consists of seven voting and three substitute trustees as follows:
Three appointed by the County Board One appointed by the County Manager One trustee and one substitute trustee elected by general employees One trustee and one substitute trustee elected by police officers, firefighters, and deputy sheriffs (uniform) One trustee and one substitute trustee elected by retired employees
If no eligible person is nominated for an elected position, the County Manager appoints an eligible person to serve as trustee. In December 2007, the Arlington County Code was modified to require that the trustees elected by active employees be active employees and that the trustees elected by retired employees currently be receiving retirement benefits from the System. The trustees annually elect a President, Vice-President and Secretary from among their members, and appoint a Treasurer and Assistant Treasurer, who may or may not be a member of the Retirement Board. The trustees annually approve a Retirement Board Investment Office administrative budget. Administrative expenses are funded from System assets. Plan Membership
At June 30, 2014, System membership consisted of the following:
General Uniformed School TotalActive Employees: Vested 1,768 654 34 2,456 Non-vested 907 192 - 1,099 Total Active Employees 2,675 846 34 3,555 Vested Deferred 376 53 70 499 Retirees and Beneficiaries 1,995 748 1,031 3,774
Benefits Provided The System provides retirement benefits as well as survivor and disability benefits. The table on the following page describes the benefits and how they are calculated. All plan members are eligible for disability benefits after two years of service and qualify for Social Security disability retirement. Disability retirement benefits are determined in the same manner as retirement benefits with no reduction for early retirement. All normal retirement benefits vest after five years of credited service. If an employee leaves covered employment before five years of credited service, accumulated employee contributions plus interest are refunded to the employee or designated beneficiary. A summary of member contribution rates, normal service retirement and average final compensation for the employees covered under the various Chapters of the Arlington County Code for the period ending June 30, 2014 is provided on the following page.
81

ARLINGTON COUNTY, VIRGINIA
NOTES TO FINANCIAL STATEMENTS
JUNE 30, 2014
Benefit terms provide for annual cost of living adjustments to each member’s retirement allowance subsequent to the member’s retirement date. The annual adjustments are 100% of the CPI-U increase up to a maximum of 3% plus one half of the CPI-U increase for the next 9%. This equates to a maximum of 7.5% increase for a 12% increase in the CPI-U. The System also provides a DROP (Deferred Retirement Option Plan) for employees eligible for retirement. Retirement benefits are paid into an employee directed 401a program for DROP participants. Member Contributions and Retirement Benefits
Participants Covered Under Chapter
21 35 46 Covers Employees Hired: Before 2/8/81 Before 2/8/81 2/8/81 or After
Contribution Rates:
General Employees 4% N/A 4%
School Board Employees (Covered by VRS)
0% 0% 0%
Uniformed Employees: - Management 5.62% N/A 5% through 1/3/09, - Non-Management 6.62% N/A 5% through 1/3/09,
Normal Retirement Age: General County Employees School Board Employees
60 60
N/A 62
62 62
Uniformed Employees 50 N/A 52
“Rule of 80” Applies Yes No Yes Retirement Benefit:
Percentage of Average Final Salary (AFS) times years of creditable service subject to a 30 year maximum. AFS is generally the average of the three highest compensation years, including overtime. For Chapter 46 employees retiring on or after 1/4/09, the New AFS definition excludes overtime and most premium pays.
2.5% for each of the first 20 years plus 2% for each of the next 10 years
2.125% reduced by the VRS benefits under Formula A
Retiring on/prior to 1/3/09 General: 1.5% Uniform: 2.0% until Social Security Eligible then 1.5%, 1.7% & 2.0% for each 10 year increment Retiring on/after 1/4/09 General: 1.7% New AFS OR 1.5% Prior AFS through 1/3/09 plus 1.7% New AFS thereafter Uniform: 2.5% through 1/3/09 plus 2.7% thereafter on New AFS OR 2.0% Prior AFS through 1/3/09 plus 2.7% New AFS thereafter until Social Security Eligible then 1.5%, 1.7% & 2.0% for each 10 year increment prior to 1/3/09
Employee contribution refund upon leaving County
Contributions plus interest N/A Contributions plus interest
82

ARLINGTON COUNTY, VIRGINIA
NOTES TO FINANCIAL STATEMENTS
JUNE 30, 2014
Contributions
Chapters 21, 35 and 46 of the Arlington County Code establish the Plan and provide the basis for determining the contribution rates. The County Board may amend the Plan at any time. Based on an annual actuarial valuation prepared by an actuary selected by the Retirement Board of Trustees, a contribution rate is recommended to the County Board for adoption. The actuarially determined rate results in contributions to the Plan which, along with member contributions, are anticipated to be sufficient to fund the value of benefits expected to be earned by plan members during the year, plus an amount to amortize any unfunded actuarial liability. For the year ended June 30, 2014, the active member contribution rate was 4% of pay for general employees and 7.5% of pay for uniformed employees. The County’s blended contribution rate was 22.6% of annual covered payroll.
Rate of Return
For the year ending June 30, 2014, the annual money-weighted rate of return on pension plan investments, net of pension plan investment expense, was 18.1%. The money-weighted rate of return expresses investment performance, net of investment expense, adjusted for the changing amounts actually invested. Pension Liability The components of the net pension liability of the County at June 30, 2014, were as follows:
($ in million)
Total Pension Liability $1,888.1 Plan Fiduciary Net Position 1,979.60 Total Active Employees ($91.5) Plan Fiduciary Net as a percentage of the total Pension Liability
104.9%
Actuarial Assumptions
The total pension liability was determined by an actuarial valuation as of June 30, 2014, using the following actuarial assumptions:
Investment rate of return 7.25% Assumed inflation rate 3.75% Projected salary increases 3.75%
Mortality rates were based on the RP 2000 Employee Mortality projected with scale AA to 2010.
The actuarial assumptions used in the June 30, 2014 valuation were based on the results of an actuarial experience study for the period July 1, 2009 to June 30, 2014. Discount Rate
The discount rate used to measure the total pension liability was 7.25%. The projection of cash flows used to determine the discount rate assumed that contributions from plan members will be made at the current contribution rate and that employer contributions will be made at rates determined by the Retirement Board, actuarially determined. Based on those assumptions, the pension plan’s fiduciary net position was projected to be available to make all projected future benefit payments of current plan members. Therefore, the actuarial assumed rate of return on pension plan investments
83

ARLINGTON COUNTY, VIRGINIA
NOTES TO FINANCIAL STATEMENTS
JUNE 30, 2014
was applied to all periods of projected benefit payments to determine the total pension liability. The discount rate was decreased from 7.5% as of June 30, 2014.
Sensitivity of the Net Pension Liability to Changes in the Discount Rate
The following presents the net pension liability of the Plan, calculated using the discount rate of 7.25%, as well as what the Plan’s net position liability would be if it were calculated using a discount rate that is 1 percentage point lower (6.25%) or 1 percentage point higher (8.25%) than the current rate:
1% Decrease
Current Discount Rate 1% Increase
6.25% 7.25% 8.25%Plan's net pension liability $166.6 ($91.5) ($303.8)
($in million)
B. Virginia Retirement System (VRS)
Plan Description All full-time, salaried permanent (professional) employees of public school divisions and employees of participating employers are automatically covered by VRS upon employment. Members earn one month of service credit for each month they are employed and they and their employer are paying contributions to VRS. Members are eligible to purchase prior public service, active duty military service, certain periods of leave and previously refunded VRS service as service credit in their plan. Within the VRS Plan, the System administers three different benefit plans for local government employees – Plan 1, Plan 2, and, Hybrid. Each plan has a different eligibility and benefit structure. The system issues a publicly available comprehensive annual financial report (CAFR) that includes financial statements and required supplementary information for the plans administered by VRS. A copy of the most recent report may be obtained from the VRS website at http://www.varetire.org/Pdf/Publications/2013-annual-report.pdf, or by writing to the System’s Chief Financial Officer at P.O. Box 2500, Richmond, VA, 23218-2500. Annual Pension Cost For the fiscal year ended June 30, 2014, the Arlington Public Schools annual pension cost of $46,807,786 for VRS was equal to the required and actual contributions. For the years ended June 30, 2014, 2013 and 2012 the Arlington Public Schools (non-professional employees) annual pension costs for VRS were as follows:
Fiscal Year EndedAnnual Pension
Cost (APC)Percentage of APC
ContributedNet Pension Obligation
06/30/2012 $29,288,946 100.00% $-
06/30/2013 $36,448,642 100.00% -
06/30/2014 $46,807,786 100.00% -
The FY 2014 required contribution was determined as part of the June 30, 2011 actuarial valuation using the entry age actuarial cost method. The actuarial assumptions at June 30, 2011 included (a) an investment rate of return (net of administrative expenses) of 7.00%, (b) projected salary increases ranging from 3.75% to 5.60% per year for local general government employees, 3.75% to 6.20% per year for teachers, and 3.50% to 4.75% per year for employees eligible for enhanced benefits available to law enforcement officers, firefighters, and sheriffs, and (c) a cost- of-living adjustment of 2.50% per year for Plan 1 employees and 2.25% for Plan 2 employees. Both the investment rate of return and the projected salary increases also include an inflation component of 2.50%. The actuarial value of the Arlington County Public Schools assets is equal to the modified market value of assets. This method uses techniques that smooth the effects of short- term volatility in the market value of assets over a
84

ARLINGTON COUNTY, VIRGINIA
NOTES TO FINANCIAL STATEMENTS
JUNE 30, 2014
five-year period. Arlington County Public Schools unfunded actuarial accrued liability is being amortized as level percentage of projected payroll on a closed basis. The remaining amortization period at June 30, 2013 for the Unfunded Actuarial Accrued liability (UAAL) was 30 years. Funded Status and Funding Progress As of June 30, 2013, the most recent actuarial valuation date, the plan was 80.09% funded. The actuarial accrued liability for benefits was $31,887,034, and the actuarial value of assets was $25,538,159, resulting in an unfunded actuarial accrued liability (UAAL) of $6,348,875. The covered payroll (annual payroll of active employees covered by the plan) was $17,327,513, and the ratio of the UAAL to the covered payroll was 36.64%. The schedule of funding progress, presented as required supplemental information (RSI), presents multiyear trend information about whether the actuarial value of the plan assets is increasing or decreasing over time relative to the actuarial accrued liability (AAL) for benefits.
Actuarial Valuation Date
Actuarial Value of
Assets (a)
Actuarial Accrued
Liability (b)
Unfunded Accrued Liability
(UAAL) (b-a)Funded
RatioCovered Payroll
UAAL as a % of Covered
Payroll
06/30/2013 $25,538,159 $31,887,034 $6,348,875 80.09% $17,327,513 36.64%06/30/2012 $22,749,839 $29,917,100 $7,167,261 76.04% $16,493,823 43.45%06/30/2011 $21,127,628 $27,648,268 $6,520,640 76.42% $15,192,068 42.92%
Schedule of Funding Progress for Arlington Public Schools (non-professional employees)
NOTE 17. Other Post-Employment Benefits (OPEB) A. County OPEB
Plan Description In addition to the pension benefits described in Note 16, the County administers a single-employer defined benefit healthcare plan. The plan provides post-employment health care benefits to all eligible permanent employees who meet the requirements under the County's pension plans. The plan does not issue a publicly available financial report. Funding Policy The contribution requirements of plan members are established and may be amended by the County Board. Funding for these benefits is currently made on a pay-as-you-go basis; however, the County intends to fund the annual required contribution (ARC) in future years. For full career employees, the County currently contributes between 16% and 80% towards the cost of medical and dental health premiums and 100% of premiums for a fixed coverage for life and accidental death insurance. For FY 2014 the County contributed $13,391,613 and $525,800 towards health and life plans respectively. Plan members receiving benefits contributed $3,251,660 and $345,335 towards health and life plans respectively. The County contributed an additional $7,024,633 in pre-funding contributions towards health and life plans for retirees. Annual OPEB Cost and Net OPEB Obligation The County’s annual OPEB cost (expense) is calculated based on the ARC of the employer, by using the Entry Age Actuarial Cost Method, an amount actuarially determined in accordance with the parameters of GASB Statement 45. Under this method, the normal cost rate is the percentage of pay contribution which would be sufficient to fund the plan benefits if it were paid from each member’s entry into the plan until termination or retirement. The ARC represents a level of funding that, if paid on an ongoing basis, is projected to cover normal cost each year. Management has chosen to amortize any unfunded actuarial liabilities (or funding excess) over a period not to exceed thirty years. The following table shows the components to the plan, and changes in the County’s net OPEB obligations:
85

ARLINGTON COUNTY, VIRGINIA
NOTES TO FINANCIAL STATEMENTS
JUNE 30, 2014
Annual required contribution $19,871,609Interest on net OPEB obligation 52,821Adjustment to annual required contribution (39,156)Annual OPEB cost (expense) 19,885,274Contributions made 20,942,046Increase in net OPEB obligation (1,056,772)Net OPEB obligation-beginning of year 704,276Net OPEB asset- end of year ($352,496)
The County’s annual OPEB cost, the percentage of annual OPEB cost contributions to the plan, and the net OPEB obligations for the years ended June 30, 2014, 2013 and 2012 were as follows:
Year EndedAnnual OPEB
CostPercentage of Annual
OPEB Cost ContributedNet OPEB
Obligation/(Asset) 06/30/2012 $18,344,193 103.7% $559,151 06/30/2013 $20,024,328 99.3% $704,276 06/30/2014 $19,885,274 105.3% ($352,496)
Funded Status and Funding Progress As of June 30, 2014, the most recent actuarial valuation date, the actuarial accrued liability for benefits was $263.9 million and the actuarial value of assets was $58.1 million, resulting in an unfunded actuarial accrued liability of $205.7 million. Actuarial valuations of an ongoing plan involve estimates of the value of reported amounts and assumptions about the probability of occurrence of events far into the future. Examples include assumptions about future employment, mortality, and the healthcare cost trend. Amounts determined regarding the funded status of the plan and the annual required contributions of the employer are subject to continual revision as actual results are compared with past expectations and new estimates are made about the future. Actuarial Methods and Assumptions Projections of benefits for financial reporting purposes are based on the substantive plan (the plan as understood by the employer and the plan members) and include the types of benefits provided at the time of each valuation and the historical pattern of sharing of benefit costs between the employer and plan members to that point. The actuarial methods and assumptions used techniques that are designed to reduce the effects of short-term volatility in actuarial accrued liabilities and the actuarial value of assets, consistent with the long-term perspective of the calculations. In the June 30, 2014, actuarial valuation, the entry age normal actuarial cost method was used. The actuarial assumptions included salary increases of 4.0 percent for general salary inflation as well as additional increases for merit and seniority:
Service General Uniform 0 4.15% 6.50% 5 3.65% 5.12%
10 2.75% 4.07% 15 2.45% 3.18%
20+ 2.00% 2.80% The annual healthcare cost trend rate is 8.0 percent, grading to 5.0 percent by 2025. The annual dental trend rates have been updated from an initial trend of 6.87% grading down to 5.5% over 13 years to a constant 5.0%. Retiree contributions are assumed to increase with health care trend rates. The unfunded actuarial accrued liability is being amortized as a level percentage of projected payroll on an open basis. The remaining amortization period as of June 30, 2014 is thirty years.
86

ARLINGTON COUNTY, VIRGINIA
NOTES TO FINANCIAL STATEMENTS
JUNE 30, 2014
Three year information about the plan is presented below as required supplementary information. This information is intended to help users assess whether the actuarial value of plan assets is increasing or decreasing over time relative to the actuarial accrued liabilities for benefits.
Actuarial Valuation Date
Actuarial Value of Assets (a)
Actuarial Accrued
Liability (b)
Unfunded Accrued Liability
(UAAL) (b-a)Funded
RatioCovered Payroll
UAAL as a % of Covered
Payroll
07/01/2011 $35.07 $241.57 $206.50 14.5% $247.63 83.5%07/01/2012 $43.45 $268.29 $224.84 16.2% $257.54 87.3%07/01/2013 $58.15 $263.87 $205.72 22.0% N/A N/A
Schedule of Funding Progress ($ in millions)
B. Schools OPEB
Plan Description In addition to the pension benefits described in Note 16, the Schools administer a single-employer defined benefit healthcare plan. The plan provides post-employment health care benefits to all eligible permanent employees who meet the requirements under the Schools’ pension plans. The plan does not issue a publicly available financial report. Funding Policy The contribution requirements of plan members are established and may be amended by the School Board. Funding for these benefits is currently made on a pay-as-you-go basis; however, the School Board intends to fund the annual required contribution (ARC) in future years. For full career employees, the Schools currently contributes between 10% and 77%, based on coverage selected, towards the cost of medical premiums. Dental insurance for retirees is paid 100% by the retiree. Life insurance for retirees is covered by the Virginia Retirement System. For FY 2014 the Schools’ contributed $4,567,259 and an additional $3,343,470 in pre-funding contributions towards health plans for retirees. Plan members receiving benefits contributed $1,305,474 towards health plans. Annual OPEB Cost and Net OPEB Obligation The Schools’ annual OPEB cost (expense) is calculated based on the ARC of the employer, by using the Entry Age Actuarial Cost Method, an amount actuarially determined in accordance with the parameters of GASB Statement 45. Under this method, the normal cost rate is the percentage of pay contribution which would be sufficient to fund the plan benefits if it were paid from each member’s entry into the plan until termination or retirement. The ARC represents a level of funding that, if paid on an ongoing basis, is projected to cover normal cost each year. Management has chosen to amortize any unfunded actuarial liabilities (or funding excess) over a period not to exceed thirty years. The following table shows the components to the plan, and changes in the School’s net OPEB obligations:
Annual required contribution $7,631,362 Interest on net OPEB obligation 1,098,442 Adjustment to annual required contribution (838,068)Annual OPEB cost (expense) 7,891,736 Contributions made (7,910,729)Decrease in net OPEB obligation (18,993)Net OPEB asset-beginning of year 14,645,888 Net OPEB asset- end of year $14,626,895
The Schools’ annual OPEB cost, the percentage of annual OPEB cost contributions to the plan, and the net OPEB obligations for the fiscal years ended June 30, 2014, 2013 and 2012 were as follows:
87

ARLINGTON COUNTY, VIRGINIA
NOTES TO FINANCIAL STATEMENTS
JUNE 30, 2014
Year EndedAnnual OPEB
CostPercentage of Annual
OPEB Cost ContributedNet OPEB
Obligation/ (Asset)06/30/2012 $9,641,691 106.8% $15,559,178 06/30/2013 $8,439,680 110.8% $14,645,888 06/30/2014 $7,891,736 100.2% $14,626,895
Funded Status and Funding Progress As of June 30, 2014, the most recent actuarial valuation date, the actuarial accrued liability for benefits was $107.8 million, of which $26.6 million was funded. The covered payroll (annual payroll of active employees covered by the plan) was $204.3 million, and the ratio of the unfunded actuarial accrued liability to the covered payroll was 39.8 percent. The Schools contributed an additional $3.3 million into the Retiree Welfare Benefit Trust during FY 2014. Actuarial valuations of an ongoing plan involve estimates of the value of reported amounts and assumptions about the probability of occurrence of events far into the future. Examples include assumptions about future employment, mortality, and the healthcare cost trend. Amounts determined regarding the funded status of the plan and the annual required contributions of the employer are subject to continual revision as actual results are compared with past expectations and new estimates are made about the future. Actuarial Methods and Assumptions Projections of benefits for financial reporting purposes are based on the substantive plan (the plan as understood by the employer and the plan members) and include the types of benefits provided at the time of each valuation and the historical pattern of sharing of benefit costs between the employer and plan members to that point. The actuarial methods and assumptions used techniques that are designed to reduce the effects of short-term volatility in actuarial accrued liabilities and the actuarial value of assets, consistent with the long-term perspective of the calculations. In the 2013/2014 actuarial valuation, the entry age normal actuarial cost method was used. The actuarial assumptions included an 7.5 percent investment return, salary increases of 3.75 percent, and an annual healthcare cost trend rate of 8.50 percent initially, grading to 5.0 percent over fifteen years. The unfunded actuarial accrued liability is being amortized as a level percentage of projected payroll on an open basis. The remaining amortization period as of June 30, 2014 is thirty years. Three year information about the plan is presented below as required supplementary information. This information is intended to help users assess whether the actuarial value of plan assets is increasing or decreasing over time relative to the actuarial accrued liabilities for benefits.
Actuarial Valuation Date
Actuarial Value of Assets (a)
Actuarial Accrued
Liability (b)
Unfunded Accrued Liability
(UAAL) (b-a)Funded
RatioCovered Payroll
UAAL as a % of Covered
Payroll
07/01/2011 $14.50 $118.30 $103.80 12.30% $255.70 40.60%07/01/2012 $20.00 $104.25 $84.27 19.20% $267.19 31.50%07/01/2013 $26.59 $107.78 $81.19 24.70% $204.26 39.80%
Schedule of Funding Progress ($ in millions)
NOTE 18. Subsequent Events A. Ballston Public Parking Garage
On September 22, 2011, a three-year Letter of Credit (LOC) was issued by PNC Bank, N.A. This letter of credit expired on September 6, 2014. On August 5, 2014, subsequent to the end of FY 2014, the LOC was signed to extend the expiration date to August 6, 2017.
88

OTHER SUPPLEMENTARY INFORMATION The supplemental schedules are presented to reflect finance-related legal and contractual compliance, details of data summarized in the preceding financial statements and other information deemed useful for financial statements users in the analysis of the County’s financial activities.
89

Combined Financial Statements - Overview The combined financial statements provide a summary level of reporting for the operating results and financial position of the County’s various fund types. These “general purpose financial statements” provide a broad financial overview for users requiring less detailed information than is presented in the individual statements for each separate fund.
90

EXHIBIT X
Ballston Rosslyn Crystal City TotalTravel & Business Business Business Community Section 8 Street and Neighborhood Government Public Fire Transportation Non-MajorTourism Improvement Improvement Improvement Development Housing Highway Conservation Facility Stormwater Recreation Station Library Capital Crystal City IDA Governmental
ASSETS Promotion District District District Grants Program Bond Fund Bond Fund Bond Fund Bond Fund Bond Fund Bond Fund Funds TIF Bond Fund Funds
Equity in pooled cash and investments $141,051 $828,930 $2,042,072 $1,344,553 $1,319,996 $779,118 $16,911,022 $11,149,879 $19,887,746 $20,232,875 $27,569,401 $4,625 $44 $122,154,299 $6,835,107 $491,488 $231,692,206Receivables, net - - - - 20,322,069 - - - - 99,920 - - - 2,233,230 - 452 22,655,671 Receivables from other governments - - - - 460,780 39,280 - - - - - - - - - - $500,060Prepaid - - - - - 1,288,591 - 4,275 - - - - - - - - 1,292,866
Total assets $141,051 $828,930 $2,042,072 $1,344,553 $22,102,845 $2,106,989 $16,911,022 $11,154,154 $19,887,746 $20,332,795 $27,569,401 $4,625 $44 $124,387,529 $6,835,107 $491,940 $256,140,803
LIABILITIES AND DEFERRED INFLOWS
LIABILITIES
Accounts Payable $141,051 $- $- $- $240,690 $74,341 $1,790,314 $442,823 $959,093 $258,630 $517,637 $- $- $2,888,315 $6,413 $237,375 $7,556,682Other liabilities - - - - 11,866,444 - - 3,200 11,604 - 82,799 - - 90,337 - 118,881 12,173,265
Total liabilities 141,051 - - - 12,107,134 74,341 1,790,314 446,023 970,697 258,630 600,436 - - 2,978,652 6,413 356,256 19,729,947
Deferred Inflows - 782,401 1,863,116 1,311,996 9,995,711 - - - - - - - - - - - 13,953,224
Total Liabilities and Deferred Inflows 141,051 782,401 1,863,116 1,311,996 22,102,845 74,341 1,790,314 446,023 970,697 258,630 600,436 - - 2,978,652 6,413 356,256 33,683,171
FUND BALANCES
Nonspendable - - - - - 1,288,591 - 4,275 - - - - - - - - 1,292,866Restricted - 46,529 178,956 32,557 - 744,057 - - - - - - - 29,790,565 - - 30,792,664Committed - - - - - - 15,120,708 10,703,856 18,917,049 20,074,165 26,968,965 4,625 44 91,618,312 6,828,694 135,684 190,372,102
Total fund balances - 46,529 178,956 32,557 - 2,032,648 15,120,708 10,708,131 18,917,049 20,074,165 26,968,965 4,625 44 121,408,877 6,828,694 135,684 222,457,632
Total liabilities and fund balances $141,051 $828,930 $2,042,072 $1,344,553 $22,102,845 $2,106,989 $16,911,022 $11,154,154 $19,887,746 $20,332,795 $27,569,401 $4,625 $44 $124,387,529 $6,835,107 $491,940 $256,140,803
SPECIAL REVENUE FUNDS CAPITAL PROJECTS FUNDS
ARLINGTON COUNTY, VIRGINIACOMBINING BALANCE SHEET
NON-MAJOR GOVERNMENTAL FUNDSJUNE 30, 2014
91

EXHIBIT Y
Ballston Rosslyn Crystal City TotalBusiness Business Business Community Section 8 Street and Neighborhood Government Public Fire Transportation IDA Non-Major
Improvement Improvement Improvement Development Housing Highway Conservation Facility Stormwater Recreation Station Library Capital Crystal City Bond Fund Governmental REVENUES: District District District Grants Program Bond Fund Bond Fund Bond Fund Fund Bond Fund Bond Fund Bond Fund Funds TIF Funds
Other local taxes $1,494,123 $3,523,214 $2,522,688 $- $- $- $- $- $- $- $- $- $- $27,599 $- $7,567,624Real estate taxes - - - - - - - - 8,331,275 - - - 25,734,105 2,975,380 - 37,040,760Intergovernmental - - - 2,794,376 17,139,411 - - - 157,606 - - - 12,277,678 - - 32,369,071Interest income 611 864 474 - - 28,956 15,938 25,363 - 49,875 6 40 26,160 - 16,351 164,638Miscellaneous revenue - - - - - - - - 3,050 - - - - - - 3,050
Total revenues 1,494,734 3,524,078 2,523,162 2,794,376 17,139,411 28,956 15,938 25,363 8,491,931 49,875 6 40 38,037,943 3,002,979 16,351 77,145,143
EXPENDITURES:
Planning and community development 1,485,415 3,472,886 2,501,090 2,794,376 17,412,988 - - - - - - - - - - 27,666,755Intergovernmental: Community development - - - - - - - - 5,327,535 - - - 11,072,842 315,712 - 16,716,089Debt Service
Principal - - - - - - - - - - - - 321,460 - - 321,460Interest - - - - - - - - - - - - 351,957 - - 351,957
Capital outlay - - - - - 7,367,722 4,559,603 3,121,927 540,295 8,823,667 - 3,398 16,285,904 102,414 3,895,830 44,700,760
Total expenditures 1,485,415 3,472,886 2,501,090 2,794,376 17,412,988 7,367,722 4,559,603 3,121,927 5,867,830 8,823,667 - 3,398 28,032,163 418,126 3,895,830 89,757,021
Revenues over (under) expenditures 9,319 51,192 22,072 - (273,577) (7,338,766) (4,543,665) (3,096,564) 2,624,101 (8,773,792) 6 (3,358) 10,005,780 2,584,853 (3,879,479) (12,611,878)
OTHER FINANCING SOURCES(USES):Proceeds from sale of bonds - - - - - 7,405,000 5,000,000 5,705,000 - 3,640,000 - - 5,000,000 - - 26,750,000Payments to refunded bond escrow agent - - - - - (3,278,517) (1,685,527) (2,400,120) - (7,658,093) - - 3,403,750 - - (11,618,507)Proceeds from sale of refunding bonds - - - - - 3,177,905 1,633,800 2,326,465 - 7,423,080 - - (3,511,513) - - 11,049,737Deferred cost of refunding - - - - - 100,612 51,727 73,655 - 235,013 - - 107,763 - - 568,770Transfers out (14,941) (35,232) (25,227) - - (28,956) (15,938) (25,363) - (49,875) (6) (40) (26,160) - (16,351) (238,089)
Total Other financing sources (uses) (14,941) (35,232) (25,227) - - 7,376,044 4,984,062 5,679,637 - 3,590,125 (6) (40) 4,973,840 - (16,351) 26,511,911
Net change in fund balances (5,622) 15,960 (3,155) - (273,577) 37,278 440,397 2,583,073 2,624,101 (5,183,667) - (3,398) 14,979,620 2,584,853 (3,895,830) 13,900,033
FUND BALANCE, beginning of year 52,151 162,996 35,712 - 2,306,225 15,083,430 10,267,734 16,333,976 17,450,064 32,152,632 4,625 3,442 106,429,257 4,243,841 4,031,514 208,557,599
FUND BALANCE, end of year $46,529 $178,956 $32,557 $- $2,032,648 $15,120,708 $10,708,131 $18,917,049 $20,074,165 $26,968,965 $4,625 $44 $121,408,877 $6,828,694 $135,684 $222,457,632
CAPITAL PROJECTS FUNDSSPECIAL REVENUE FUNDS
ARLINGTON COUNTY, VIRGINIACOMBINING STATEMENT OF REVENUES, EXPENDITURES, AND CHANGES IN FUND BALANCES
NON-MAJOR GOVERNMENTAL FUNDSFOR THE YEAR ENDED JUNE 30, 2014
92

General Fund The General Fund is the primary operating fund of the County and is used to account for the majority of current operating expenditures of the general government. Financing is also provided for the operations of other funds, which include the County’s public school system. Debt service expenditures for the payments of principal and interest on the County’s general long-term debt (bond and other long-term debt not serviced by the Utilities Operating or School Debt Service Funds) are included in this fund. The major sources of revenue include property taxes, other local taxes, licenses, permits, fees and other miscellaneous charges. Revenues and expenditures under a variety of State and Federal grant programs are also accounted for in this fund.
93

EXHIBIT A-1
ARLINGTON COUNTY, VIRGINIA
GENERAL FUND
BALANCE SHEET
JUNE 30, 2014
(WITH SUMMARIZED COMPARATIVE TOTALS FOR 2013)
2014 2013
ASSETS
Equity in pooled cash and investments $319,574,683 $277,937,767
Petty cash 1,950 1,950
Cash with fiscal agents 272,176 271,394
Receivables(net, where applicable,
of allowance for uncollectibles):
Taxes 358,383,154 343,994,518
Accounts 18,653,465 16,700,936
Accrued interest 621,032 1,007,071
Due from other governments 5,070,454 4,940,186
Temporary loan to fund 182,600 33,616
Due from component unit 294,029 422,225
Other assets 15,197,337 15,197,041
Total Assets $718,250,880 $660,506,704
LIABILITIES AND DEFERRED INFLOWS
LIABILITIES:
Accrued payroll liabilities $21,890,610 $19,473,509
Vouchers payable 7,403,093 5,903,813
Current maturities of interest payable 267,305 267,306
Other current liabilities 1,457,638 2,256,489
Unearned revenue 15,309,223 15,366,962
Due to component unit 85,941,674 75,969,684
Total Liabilities 132,269,543 119,237,763
Deferred Inflows 352,927,400 341,670,014
Total Liabilities and Deferred Inflows 485,196,943 460,907,777
FUND BALANCE:
Restricted for:
Seized assets 2,522,979 2,272,448
Committed to:
Self insurance reserve 5,000,000 5,000,000
Subsequent years' County budget 4,860,024 5,208,794
Capital projects 14,831,642 8,403,862
Operating reserve 54,575,340 52,605,487
Economic & revenue stabilization contingent 3,000,000 3,000,000
Incomplete projects 412,220 130,223
Affordable Housing Investment Fund 45,631,924 21,838,549
Subsequent years' School's budget 46,735,944 26,269,900
Assigned to:
Subsequent years' County budgets 15,593,759 19,649,922
Subsequent years' County capital projects 11,782,428 12,162,577
Economic stabilization reserve - 5,000,000
Operating reserve 2,810,020 1,969,853
Fresh AIRE program 1,480,249 1,224,867
Incomplete projects 3,772,275 5,215,352
Affordable Housing Investment Fund 20,045,133 29,647,093
Total Fund Balance 233,053,937 199,598,927
Total Liabilities, Deferred Inflows and Fund Balance $718,250,880 $660,506,704
94

EXHIBIT A-2
2014
VARIANCEPOSITIVE 2013
BUDGET ACTUAL (NEGATIVE) ACTUALSREVENUES: Taxes $905,228,449 $937,038,604 $31,810,155 $901,222,811 Licenses and permits 10,411,637 12,396,844 1,985,207 10,502,137 From the Commonwealth of Virginia 69,777,014 67,984,661 (1,792,353) 64,473,930 From the federal government 18,844,633 18,015,289 (829,344) 15,595,756 Charges for services 52,386,128 53,136,621 750,493 51,656,429 Fines and forfeitures 9,605,548 8,113,863 (1,491,685) 8,468,253 Use of money and property 5,866,760 6,414,252 547,492 3,998,537 Miscellaneous revenues 19,028,152 28,445,244 9,417,092 21,518,373
Total Revenues 1,091,148,321 1,131,545,378 40,397,057 1,077,436,226
EXPENDITURES: Current: General government 56,091,690 53,607,424 2,484,266 51,971,892 Judicial administration 52,325,043 52,096,187 228,856 50,057,156 Public safety 127,706,798 124,205,497 3,501,301 119,744,336 Environmental services 82,274,902 80,533,785 1,741,117 77,419,666 Health and welfare 127,728,332 117,358,298 10,370,034 113,479,716 Parks and recreation 37,268,040 34,273,106 2,994,934 32,468,756 Libraries 12,744,549 12,493,400 251,149 12,395,463 Planning and community development 22,338,519 21,206,309 1,132,210 19,726,276 Non-departmental 136,547,562 76,452,328 60,095,234 43,851,605 Contributions to regional agencies 36,184,495 36,048,224 136,271 33,827,183 Debt service: Principal 37,005,960 38,279,170 (1,273,210) 35,526,687 Interest on serial bonds 23,394,040 17,598,928 5,795,112 18,676,454 Other costs 200,000 7,676 192,324 5,551
Total Expenditures 751,809,930 664,160,332 87,649,598 609,150,741
Revenues over Expenditures 339,338,391 467,385,046 128,046,655 468,285,485
OTHER FINANCING SOURCES(USES): Transfers in 2,973,070 766,944 (2,206,126) 1,319,254 Transfers from component unit - 72,867 72,867 140,846 Transfers out (29,749,496) (29,816,042) (66,546) (31,441,368) Transfers to component unit (437,407,759) (407,395,877) 30,011,882 (441,758,486) Premium on sales of bonds - 2,442,072 2,442,072 11,594,033
Total Other Financing Sources(Uses) (464,184,185) (433,930,036) 30,254,149 (460,145,721)
Revenues Over (Under) Expenditures and Other Sources(Uses) (124,845,794) 33,455,010 158,300,804 8,139,764FUND BALANCE, beginning of year (180,725,663) 199,598,927 380,324,590 191,459,163
FUND BALANCE, end of year ($305,571,457) $233,053,937 $538,625,394 $199,598,927
FOR THE YEAR ENDED JUNE 30, 2014(WITH SUMMARIZED COMPARATIVE TOTALS FOR 2013)
ARLINGTON COUNTY, VIRGINIAGENERAL FUND
SCHEDULE OF REVENUES, EXPENDITURES AND CHANGES IN FUND BALANCE BUDGET (GAAP BASIS) AND ACTUAL
95

Special Revenue Funds Travel and Tourism Promotion – to account for the operations of various programs to promote tourism and business travel in the County. Rosslyn Business Improvement District – to account for the operations of a service district in the downtown Rosslyn area created to collect and disperse local tax revenue for supplemental services to those already provided by county government. Ballston Business Improvement District – to account for the operations of a service district in the Ballston area created to collect and disperse local tax revenue for supplemental services to those already provided by county government. Crystal City Business Improvement District – to account for the operations of a service district in the downtown Crystal City area created to collect and disperse local tax revenue for supplemental services to those already provided by county government. Community Development Grants – to account for the operations of various community development programs which are financed by block grant and other grant assistance by the U.S. Department of Housing and Urban Development. Section 8 Housing Program – to account for the operations of various housing programs which are financed by grant assistance from the U.S. Department of Housing and Urban Development.
96

EXHIBIT B-1
ARLINGTON COUNTY, VIRGINIA
SPECIAL REVENUE FUNDS
COMBINING BALANCE SHEET
AS OF JUNE 30, 2014
(WITH SUMMARIZED COMPARATIVE TOTALS FOR 2013)
Crystal City
Travel & Ballston Business Rosslyn Business Business Section 8
Tourism Improvement Improvement Improvement Community Housing June 30, June 30,
Promotion District District District Dev. Grants Program 2014 2013
ASSETS
Equity in pooled cash and investments $141,051 $828,930 $2,042,072 $1,344,553 $1,319,996 $779,118 $6,455,720 $7,396,014
Receivable from other government - - - - 460,780 39,280 500,060 417,282 Long-term receivables - - - - 20,322,069 - 20,322,069 21,293,160 Prepaid expenses - - - - - 1,288,591 1,288,591 1,299,658
Total Assets $141,051 $828,930 $2,042,072 $1,344,553 $22,102,845 $2,106,989 $28,566,440 $30,406,114
LIABILITIES AND DEFERRED INFLOWS
LIABILITIES
Vouchers payable $141,051 $- $- $- $240,690 $74,341 $456,082 $563,196
Long-term liabilities - - - - 11,866,444 - 11,866,444 12,201,717
Total Liabilities 141,051 - - - 12,107,134 74,341 12,322,526 12,764,913
Deferred Inflows - 782,401 1,863,116 1,311,996 9,995,711 - 13,953,224 15,084,117
Total Liabilities and Deferred Inflows 141,051 782,401 1,863,116 1,311,996 22,102,845 74,341 26,275,750 27,849,030
FUND BALANCES
- Nonspendable - - - - - 1,288,591 1,288,591 1,299,658
- Restricted - 46,529 178,956 32,557 - 744,057 1,002,099 1,257,426
Total Fund Balances - 46,529 178,956 32,557 - 2,032,648 2,290,690 2,557,084
Total Liabilities and
Fund Balances $141,051 $828,930 $2,042,072 $1,344,553 $22,102,845 $2,106,989 $28,566,440 $30,406,114
Totals
97

EXHIBIT B-2
SPECIAL REVENUE FUNDS
COMBINING STATEMENT OF REVENUES, EXPENDITURES AND CHANGES IN FUND BALANCES
FOR THE YEAR ENDED JUNE 30, 2014
(WITH SUMMARIZED COMPARATIVE TOTALS FOR 2013)
Totals
Crystal City
Ballston Business Rosslyn Business Business Section 8
Improvement Improvement Improvement Community Housing June 30, June 30,
REVENUES: District District District Dev. Grants Program 2014 2013
Other local taxes $1,494,123 $3,523,214 $2,522,688 $- $- $7,540,025 $7,526,120
From the federal government - - - 2,794,376 17,139,411 19,933,787 20,940,137
Total revenues 1,494,123 3,523,214 2,522,688 2,794,376 17,139,411 27,473,812 28,466,257
EXPENDITURES:
Current -
Community development 1,485,415 3,472,886 2,501,090 2,794,376 - 10,253,767 11,393,882
Housing program - - - - 17,412,988 17,412,988 17,733,833
Travel and tourism - - - - - - 251,711
Total expenditures 1,485,415 3,472,886 2,501,090 2,794,376 17,412,988 27,666,755 29,379,426
Revenues over (under)
expenditures 8,708 50,328 21,598 - (273,577) (192,943) (913,169)
OTHER FINANCING SOURCES(USES):
Interest 611 864 474 - - 1,949 2,810
Transfers out (14,941) (35,232) (25,227) - - (75,400) (574,958)
Total other financing sources(uses) (14,330) (34,368) (24,753) - - (73,451) (572,148)
Revenues and other financing sources (uses)
over expenditures (5,622) 15,960 (3,155) - (273,577) (266,394) (1,485,317)
FUND BALANCES, beginning of year 52,151 162,996 35,712 - 2,306,225 2,557,084 4,042,401
FUND BALANCES, end of year $46,529 $178,956 $32,557 $- $2,032,648 $2,290,690 $2,557,084
ARLINGTON COUNTY, VIRGINIA
98

EXHIBIT B-3
ARLINGTON COUNTY, VIRGINIA
SPECIAL REVENUE FUNDS
BALLSTON BUSINESS IMPROVEMENT DISTRICT
SCHEDULE OF REVENUES, EXPENDITURES AND CHANGES IN FUND BALANCE
BUDGET (GAAP BASIS) AND ACTUAL
FOR THE YEAR ENDED JUNE 30, 2014
Variance -
Budget Actual Positive (Negative)
REVENUES:
Other local taxes $1,524,736 $1,494,123 ($30,613)
Total revenue 1,524,736 1,494,123 (30,613)
EXPENDITURES:
Special real estate tax assessments 1,509,489 1,485,415 24,074
Revenues over(under) expenditures 15,247 8,708 (6,539)
OTHER FINANCING SOURCES(USES):
Interest - 611 611
Transfers out (15,247) (14,941) 306
Total other financing sources(uses) (15,247) (14,330) 917
Revenues and other financing sources(uses)
over (under) expenditures - (5,622) (5,622)
FUND BALANCE, beginning of year 52,151 52,151 -
FUND BALANCE, end of year $52,151 $46,529 ($5,622)
99

EXHIBIT B-4
ARLINGTON COUNTY, VIRGINIA
SPECIAL REVENUE FUNDS
ROSSLYN BUSINESS IMPROVEMENT DISTRICT
SCHEDULE OF REVENUES, EXPENDITURES AND CHANGES IN FUND BALANCE
BUDGET (GAAP BASIS) AND ACTUAL
FOR THE YEAR ENDED JUNE 30, 2014
Variance -
Budget Actual Positive (Negative)
REVENUES:
Other local taxes $3,630,847 $3,523,214 ($107,633)
Total revenue 3,630,847 3,523,214 (107,633)
EXPENDITURES:
Special real estate tax assessments 3,574,556 3,472,886 101,670
Revenues over(under) expenditures 56,291 50,328 (5,963)
OTHER FINANCING SOURCES(USES):
Interest - 864 864
Transfers out (36,308) (35,232) 1,076
Total other financing sources(uses) (36,308) (34,368) 1,940
Revenues and other financing sources(uses)
over (under) expenditures 19,983 15,960 (4,023)
FUND BALANCE, beginning of year 162,996 162,996 -
FUND BALANCE, end of year $182,979 $178,956 ($4,023)
100

EXHIBIT B-5
Variance -
Budget Actual Positive (Negative)
REVENUES:
Other local taxes $2,591,803 $2,522,688 ($69,115)
Total revenue 2,591,803 2,522,688 (69,115)
EXPENDITURES:
Special real estate tax assessments 2,565,885 2,501,090 64,795
Revenues over(under) expenditures 25,918 21,598 (4,320)
OTHER FINANCING SOURCES(USES):
Interest - 474 474
Transfers out (25,918) (25,227) 691
Total other financing sources(uses) (25,918) (24,753) 1,165
Revenues and other financing sources(uses)
over (under) expenditures - (3,155) (3,155)
FUND BALANCE, beginning of year 35,712 35,712 -
FUND BALANCE, end of year $35,712 $32,557 ($3,155)
FOR THE YEAR ENDED JUNE 30, 2014
ARLINGTON COUNTY, VIRGINIA
SPECIAL REVENUE FUNDS
CRYSTAL CITY BUSINESS IMPROVEMENT DISTRICT
SCHEDULE OF REVENUES, EXPENDITURES AND CHANGES IN FUND BALANCE
BUDGET (GAAP BASIS) AND ACTUAL
101

EXHIBIT B-6
COMMUNITY DEVELOPMENT GRANTS FUND
SCHEDULE OF REVENUES, EXPENDITURES AND CHANGES IN FUND BALANCE
BUDGET (GAAP BASIS) AND ACTUAL
FOR THE YEAR ENDED JUNE 30, 2014
Variance -
Budget Actual Positive (Negative)
REVENUES:
From the federal government $4,268,085 $2,794,376 ($1,473,709)
Total Revenues 4,268,085 2,794,376 (1,473,709)
EXPENDITURES:
Community development 4,268,085 2,794,376 1,473,709
Revenues over (under) expenditures - - -
OTHER FINANCING SOURCES
Transfers Out - - -
FUND BALANCE, beginning of year - - -
FUND BALANCE, end of year $- $- $-
SPECIAL REVENUE FUNDS
ARLINGTON COUNTY, VIRGINIA
102

EXHIBIT B-7
Variance -
Budget Actual Positive (Negative)
REVENUES:
From the federal government $18,469,071 $17,139,411 ($1,329,660)
EXPENDITURES:
Housing program 18,240,094 17,412,988 827,106
Revenues over (under) expenditures 228,977 (273,577) (502,554)
FUND BALANCE, beginning of year 2,306,225 2,306,225 -
FUND BALANCE, end of year $2,535,202 $2,032,648 ($502,554)
FOR THE YEAR ENDED JUNE 30, 2014
ARLINGTON COUNTY, VIRGINIA
SPECIAL REVENUE FUNDS
SECTION 8 HOUSING PROGRAM
SCHEDULE OF REVENUES, EXPENDITURE AND CHANGES IN FUND BALANCE
BUDGET(GAAP BASIS) AND ACTUAL
103

Capital Projects Funds The Capital Projects Funds are used to account for the purchase and/or construction of major capital facilities, including buildings, roads and other long-lived improvements, which are not financed by proprietary funds. Financing is provided primarily by bond issues, State and Federal grants, and General Fund transfers. The capital projects for general government functions which are financed under the County’s pay-as-you-go capital programs are accounted for in the General Capital Projects Funds. As required by law, separate funds are used to account for the capital project expenditures financed by the proceeds of general obligation bonds, IDA revenue bonds and revenues from real estate assessments. .
104

EXHIBIT C-1
GeneralCapital Street and Neighborhood Government Public Fire Transportation IDA
Projects Highway Conservation Facility Stormwater Recreation Station Library Capital Crystal City Bond June 30, June 30,Fund Bond Fund Bond Fund Bond Fund Bond Fund Bond FundBond Fund Funds TIF Fund 2014 2013
ASSETS:
Equity in pooled cash and investments $91,294,484 $16,911,022 $11,149,879 $19,887,746 $20,232,875 $27,569,401 $4,625 $44 $122,154,299 $6,835,107 $491,488 $316,530,970 $283,864,504Receivables 2,143,969 - - - 99,920 - - - 2,233,230 - 452 4,477,571 5,052,500Prepaid expenses - - 4,275 - - - - - - - - 4,275 4,275
Total Assets $93,438,453 $16,911,022 $11,154,154 $19,887,746 $20,332,795 $27,569,401 $4,625 $44 $124,387,529 $6,835,107 $491,940 $321,012,816 $288,921,279
LIABILITIES AND FUND BALANCES
LIABILITIES:
Vouchers payable $4,055,051 $1,790,314 $442,823 $959,093 $258,630 $517,637 $- $- $2,888,315 $6,413 $237,375 $11,155,651 $13,618,130 Contracts payable-retainage 580,419 - - 11,604 - 82,799 - - 90,337 - 118,881 884,040 2,325,103 Unearned revenue 7,248,888 - - - - - - - - - - 7,248,888 7,399,801 Other liabilities 853,473 - 3,200 - - - - - - - - 856,673 819,414
Total Liabilities 12,737,831 1,790,314 446,023 970,697 258,630 600,436 - - 2,978,652 6,413 356,256 20,145,252 24,162,448
FUND BALANCES:Non-spendable
Prepaid - - 4,275 - - - - - - - - 4,275 4,275Restricted:
Debt service - - - - - - - - 29,790,565 - - 29,790,565 35,790,356 Committed to:
Capital projects 80,700,622 15,120,708 10,703,856 18,917,049 20,074,165 26,968,965 4,625 44 91,618,312 6,828,694 135,684 271,072,724 228,964,200
Total Fund Balances 80,700,622 15,120,708 10,708,131 18,917,049 20,074,165 26,968,965 4,625 44 121,408,877 6,828,694 135,684 300,867,564 264,758,831
Total Liabilities and Fund Balances $93,438,453 $16,911,022 $11,154,154 $19,887,746 $20,332,795 $27,569,401 $4,625 $44 $124,387,529 $6,835,107 $491,940 $321,012,816 $288,921,279
Totals
ARLINGTON COUNTY, VIRGINIACAPITAL PROJECTS FUNDS
COMBINING BALANCE SHEETJUNE 30, 2014
(WITH SUMMARIZED COMPARATIVE TOTALS FOR 2013)
105

EXHIBIT C-2
General TotalsCapital Street and Neighborhood Government Public Fire Transportation IDAProjects Highway Conservation Facility Stormwater Recreation Station Library Capital Crystal City Bond June 30, June 30,
Fund Bond Fund Bond Fund Bond Fund Bond Fund Bond Fund Bond Fund Funds TIF Fund 2014 2013
REVENUES: From the Commonwealth of Virginia $17,279,102 $- $- $- $89,606 $- $- $- $11,466,545 $27,599 $- $28,862,852 $19,754,712 From the federal government - - - - 60,000 - - - - - - 60,000 - Charges for services 4,393,070 - - - 8,000 - - - 811,133 - - 5,212,203 589,317 Real estate taxes - - - - 8,331,275 - - - 25,734,105 2,975,380 - 37,040,760 35,890,299 Interest - 28,956 15,938 25,363 49,875 6 40 26,160 - 16,351 162,689 285,997 Miscellaneous revenue 2,473,616 - - - 3,050 - - - - - - 2,476,666 1,342,805
Total Revenues 24,145,788 28,956 15,938 25,363 8,491,931 49,875 6 40 38,037,943 3,002,979 16,351 73,815,170 57,863,130
EXPENDITURES: Inter Governmental:
Community development 1,214,210 - - - - - - - 10,290,000 - - 11,504,210 10,052,960Current operating:
General Government 645,155 - - - 5,327,535 - - - 782,842 315,712 - 7,071,244 5,102,268Planning and Community Development 124,008 - - - - - - - - - - 124,008 8,891Parks, recreation and Cultural Developm 2,515 - - - - - - - - - - 2,515 9,452Public Safety 109,220 - - - - - - - - - - 109,220 511,790
Debt service:Principal - - - - - - - - 321,460 - - 321,460 995,054Interest - - - - - - - - 351,957 - - 351,957 353,646
Capital outlay 31,153,074 7,367,722 4,559,603 3,121,927 540,295 8,823,667 - 3,398 16,285,904 102,414 3,895,830 75,853,834 142,007,161
Total Expenditures 33,248,182 7,367,722 4,559,603 3,121,927 5,867,830 8,823,667 - 3,398 28,032,163 418,126 3,895,830 95,338,448 159,041,222
Revenues Over/(Under) Expenditures (9,102,394) (7,338,766) (4,543,665) (3,096,564) 2,624,101 (8,773,792) 6 (3,358) 10,005,780 2,584,853 (3,879,479) (21,523,278) (101,178,092)
OTHER FINANCING SOURCES/(USES):Proceeds from lease purchase 5,459,005 - - - - - - - - - - 5,459,005 4,473,803Proceeds from sale of general obligation b - 7,405,000 5,000,000 5,705,000 - 3,640,000 - - 5,000,000 - - 26,750,000 72,245,000Proceeds from sale of refunding bonds - 3,177,905 1,633,800 2,326,465 - 7,423,080 - - 3,403,750 - - 17,965,000 82,002,545Payments to refunded bond escrow agent - (3,278,517) (1,685,527) (2,400,120) - (7,658,093) - - (3,511,513) - - (18,533,770) (77,247,178)Cost of refunding bonds - 100,612 51,727 73,655 - 235,013 - - 107,763 - - 568,770 (4,755,367)Transfers in 29,553,643 - - - - - - - - - - 29,553,643 36,136,616Transfers out (3,967,948) (28,956) (15,938) (25,363) - (49,875) (6) (40) (26,160) - (16,351) (4,130,637) (1,510,857)
Total Other Financing Sources/(Uses) 31,044,700 7,376,044 4,984,062 5,679,637 - 3,590,125 (6) (40) 4,973,840 - (16,351) 57,632,011 111,344,562
Revenues and Other Financing Sources (Uses) Over/(Under) Expenditures 21,942,306 37,278 440,397 2,583,073 2,624,101 (5,183,667) - (3,398) 14,979,620 2,584,853 (3,895,830) 36,108,733 10,166,470
FUND BALANCE, beginning of year 58,758,316 15,083,430 10,267,734 16,333,976 17,450,064 32,152,632 4,625 3,442 106,429,257 4,243,841 4,031,514 264,758,831 254,592,361
FUND BALANCE, end of year $80,700,622 $15,120,708 $10,708,131 $18,917,049 $20,074,165 $26,968,965 $4,625 $44 $121,408,877 $6,828,694 $135,684 $300,867,564 $264,758,831
ARLINGTON COUNTY, VIRGINIACAPITAL PROJECT FUNDS
COMBINING STATEMENT OF REVENUES, EXPENDITURES AND CHANGES IN FUND BALANCESFOR THE YEAR ENDED JUNE 30, 2014
(WITH SUMMARIZED COMPARATIVE TOTALS FOR 2013)
106

Enterprise Funds Utilities Fund – to account for the operations, maintenance and construction of the County’s water and sanitary sewer system and for the capital asset improvements in the water pollution control plant. Revenues of this fund consist principally of charges for services to County residents. Debt service on the general obligation bonds issued to finance the construction of plant facilities is also accounted for in this fund. Ballston Public Parking Garage Fund – to account for the financing of services to the general public where all or most of the operating expenses involved are recovered in the form of charges to users of such services. Eighth Level Ballston Public Parking Garage Fund- to account for financing of services to the general public where all or most of the operating expenses involved are recovered in the form of charges to users of such services. CPHD Development Fund – to account for financing of the fee-supported units of the Inspection Services Division and Planning Division. Operating expenses involved are recovered in the form of charges to users of such services.
107

EXHIBIT D -1
Page 1 of 2
A S S E T S
Totals
Ballston 8th Level CPHD
Public Ballston Public Development June 30, June 30,
Utilities Parking Garage Parking Garage Fund 2014 2013
CURRENT ASSETS:
Equity in pooled cash and investments $62,453,741 $14,468,987 $290,000 $19,361,071 $96,573,799 $102,456,953
Cash with fiscal agents 25,221 - - - 25,221 25,221
Accounts receivable:
Water-sewer charges 5,905,982 - - - 5,905,982 3,418,651
Estimated unbilled service charges 9,981,257 - - - 9,981,257 9,371,901
Other 2,930,294 1,170 - - 2,931,464 2,975,012
Prepaid expenses 2,447,864 187,880 - - 2,635,744 2,635,744
Inventories 1,365,393 - - - 1,365,393 1,304,867
Total current assets 85,109,752 14,658,037 290,000 19,361,071 119,418,860 122,188,349
CAPITAL ASSETS:
Land 6,161,255 - - - 6,161,255 6,161,255
Sewer system 354,223,000 - - - 354,223,000 347,236,362
Water system 693,336,177 - - - 693,336,177 683,394,204
Equipment 2,493,661 213,440 - 2,922,335 5,629,436 5,320,788
Building - 22,315,887 3,511,471 - 25,827,358 22,315,887
Intangible assets 33,000 - - 1,116,969 1,149,969 1,149,969
Construction in progress 125,971,069 28,880 - - 125,999,949 123,631,989
Less accumulated depreciation-Intangible (1,111) - - (753,875) (754,986) (531,259)
Less accumulated depreciation (164,285,431) (13,196,384) (73,156) (1,388,841) (178,943,812) (163,818,314)
Total capital assets (net of 1,017,931,620 9,361,823 3,438,315 1,896,588 1,032,628,346 1,024,860,881
accumulated depreciation)
Deferred bond issuance costs - - - - - 55,664
Total noncurrent assets 1,017,931,620 9,361,823 3,438,315 1,896,588 1,032,628,346 1,024,916,545
Total assets $1,103,041,372 $24,019,860 $3,728,315 $21,257,659 $1,152,047,206 $1,147,104,894
ARLINGTON COUNTY, VIRGINIA
ENTERPRISE FUNDS
COMBINING BALANCE SHEET
JUNE 30, 2014
(WITH SUMMARIZED COMPARATIVE TOTALS FOR 2013)
108

EXHIBIT D - 1
Page 2 of 2
(WITH SUMMARIZED COMPARATIVE TOTALS FOR 2013)
LIABILITIES AND EQUITY
Totals
Ballston 8th Level CPHD
Public Ballston Public Development June 30, June 30,
Utilities Parking Garage Parking Garage Fund 2014 2013
CURRENT LIABILITIES:
Payable from current assets:
General obligation bonds payable $8,163,453 $- $- $- $8,163,453 $9,136,857
VRA loan payable 13,347,499 - - - 13,347,499 12,882,014
Interest payable 4,006,023 24,220,962 - - 28,226,985 26,881,272
Vouchers payable 9,771,387 372,971 - 475,450 10,619,808 10,157,586
Contracts payable - retainage 188,407 - - - 188,407 1,489,235
Revenue bonds payable-current - 500,000 - - 500,000 500,000
Mortgage /notes payable - 3,429,679 - - 3,429,679 3,429,679
Capital leases 30,487 - - - 30,487 29,631
Other accrued liabilities 229,085 11,395,640 - 119,947 11,744,672 10,841,878
Compensated absences 130,100 - - 58,218 188,318 203,380
Total current liabilities 35,866,441 39,919,252 - 653,615 76,439,308 75,551,532
LONG-TERM LIABILITIES:
Compensated absences 1,170,899 - - 523,963 1,694,862 1,830,415
Revenue bonds payable - 8,400,000 - - 8,400,000 8,900,000
Capital leases 113,814 - - - 113,814 144,301
VRA Loan payable 219,935,436 - - - 219,935,436 233,311,758
Mortgage payable - - - - - -
General obligation bonds payable 111,031,167 - - - 111,031,167 117,342,686
Total long-term liabilities 332,251,316 8,400,000 - 523,963 341,175,279 361,529,160
Total liabilities 368,117,757 48,319,252 - 1,177,578 417,614,587 437,080,692
NET POSITION:
Net investment in capital assets 665,309,764 (2,967,856) 3,438,315 1,896,588 667,676,811 648,350,443
Unrestricted (Deficit) 69,613,851 (21,331,536) 290,000 18,183,493 66,755,808 61,673,759
Total net position 734,923,615 (24,299,392) 3,728,315 20,080,081 734,432,619 710,024,202
Total liabilities and net position $1,103,041,372 $24,019,860 $3,728,315 $21,257,659 $1,152,047,206 $1,147,104,894
ENTERPRISE FUNDS
COMBINING BALANCE SHEET
JUNE 30, 2014
ARLINGTON COUNTY, VIRGINIA
109

EXHIBIT D-2
Totals
Ballston 8th Level CPHD
Public Ballston Public Development June 30, June 30,
Utilities Parking Garage Parking Garage Fund 2014 2013
OPERATING REVENUES:
Water-sewer service charges $88,880,766 $- $- $- $88,880,766 $86,768,619
Water-service hook-up charges 5,499,780 - - - 5,499,780 5,672,805
Water-service connection charges 1,412,500 - - - 1,412,500 1,363,865
Sewage treatment service charges 6,553,790 - - - 6,553,790 7,624,590
Permits and fees - - - 14,621,512 14,621,512 14,433,080
Other 3,321,315 - - - 3,321,315 6,023,755
Parking charges - 4,411,414 328,547 - 4,739,961 5,148,830
Total Operating Revenues 105,668,151 4,411,414 328,547 14,621,512 125,029,624 127,035,544
OPERATING EXPENSES:
Personnel services 13,841,929 - 5,229 5,918,129 19,765,287 19,605,560
Fringe benefits 4,987,709 - - 2,300,119 7,287,828 6,846,256
Contractual services 12,842,119 2,187,273 45,902 2,607,889 17,683,183 17,739,231
Purchases of water 8,032,924 - - - 8,032,924 8,060,019
Materials and supplies 9,028,776 298,650 32,810 364,255 9,724,491 12,315,140
Deferred rent - 773,747 - - 773,747 904,992
Depreciation 13,845,860 516,007 73,156 519,323 14,954,346 21,558,825
Amortization - 34,427 - - 34,427 5,297
Equipment (Construction Contracts) 4,438,816 - - 294,031 4,732,847 1,902,348
Internal Services - - - 1,758,372 1,758,372 1,767,103
Miscellaneous 5,571,587 - - - 5,571,587 5,422,182
Total Operating Expenses 72,589,720 3,810,104 157,097 13,762,118 90,319,039 96,126,953
Operating Income (loss) 33,078,431 601,310 171,450 859,394 34,710,585 30,908,591
NON-OPERATING REVENUES(EXPENSES):
Interest income and other income 192,461 7,482 - 73,046 272,989 39,733
Interest expense and fiscal charges (12,955,913) (1,505,556) - - (14,461,469) (14,838,998)
Interest payment on capital lease (4,781) - - - (4,781) (5,906)
Total non-operating revenues (expenses) (12,768,233) (1,498,074) - 73,046 (14,193,261) (14,805,171)
Net Income before contributions and transfers 20,310,198 (896,764) 171,450 932,440 20,517,324 16,103,420
CONTRIBUTIONS AND NET TRANSFERS
Contributions from developers and other sources 2,421,745 - 1,367,321 - 3,789,066 2,612,398
Federal & State grant - - - - - 3,710,025
Total contributions and net transfers 2,421,745 - 1,367,321 - 3,789,066 6,322,423
TRANSFERS IN(OUT):
Transfers in 102,027 - - - 102,027 (569,960)
Change in net position 22,833,970 (896,764) 1,538,771 932,440 24,408,417 21,855,883
Net position, beginning of year 712,089,645 (23,402,628) 2,189,544 19,147,641 710,024,202 688,168,319
Net position, end of year $734,923,615 ($24,299,392) $3,728,315 $20,080,081 $734,432,619 $710,024,202
ARLINGTON COUNTY, VIRGINIA
ENTERPRISE FUNDS
COMBINING STATEMENT OF REVENUES, EXPENSES AND CHANGES IN FUND NET POSITION
FOR THE YEAR ENDED JUNE 30, 2014
(WITH SUMMARIZED COMPARATIVE TOTALS FOR 2013)
110

EXHIBIT D-3
Totals
Ballston 8th Level CPHD
Public Ballston Public Development June 30 June 30
Utilities Parking Garage Parking Garage Fund 2014 2013
CASH FLOWS FROM OPERATING ACTIVITIES:
Cash received from customers $102,623,153 $4,412,374 ($497,820) $14,621,512 $121,159,219 $130,460,312
Cash paid to suppliers (40,178,635) (2,522,557) 75,705 (4,835,963) (47,461,450) (48,130,569)
Cash paid to employees (18,964,980) - - (8,233,522) (27,198,502) (26,306,669)
Net cash flows from operating activities 43,479,538 1,889,817 (422,115) 1,552,027 46,499,267 56,023,074
CASH FLOWS FROM INVESTING ACTIVITIES:
Interest received 192,461 7,482 - 73,046 272,989 39,733
Net cash flows from investing activities 192,461 7,482 - 73,046 272,989 39,733
CASH FLOWS FROM NON-CAPITAL FINANCING ACTIVITIES:
Contributions from developers and other sources - - 1,367,321 - 1,367,321 826,368
Net cash flows from non-capital financing
activities - - 1,367,321 - 1,367,321 826,368
CASH FLOWS FROM CAPITAL AND RELATED
FINANCING ACTIVITIES:
State grant - - - - - 3,710,025
Principal payments - bonds (8,741,975) (500,000) - - (9,241,975) (9,723,845)
Proceeds from sale of general obligation bonds 1,700,000 - - - 1,700,000 3,600,000
Payments to bonds redeemed (2,857,610) - - - (2,857,610) (11,023,650)
Proceeds from sale of refunding bonds 2,765,000 - - - 2,765,000 11,195,000
Cost of refunding bonds 92,610 - - - 92,610 (171,350)
Bond premium 151,932 - - - 151,932 593,030
Principal payments - capital lease (29,631) - - - (29,631) (44,461)
Interest payments - capital lease (4,781) - - - (4,781) (5,906)
Payment of VRA loan (12,910,836) - - - (12,910,836) (12,482,371)
Proceeds of VRA loan - - - - - 5,471,152
Interest and other loan expenses (12,863,094) (129,401) - - (12,992,495) (14,247,365)
Purchases of property (18,376,289) - (2,318,656) - (20,694,945) (44,756,524)
Net cash flows from capital and related
financing activities (51,074,674) (629,401) (2,318,656) - (54,022,731) (67,886,265)
Net increase(decrease) in cash and cash equivalents (7,402,675) 1,267,898 (1,373,450) 1,625,073 (5,883,154) (10,997,090)
Cash and cash equivalents at beginning of year 69,856,416 13,201,089 1,663,450 17,735,998 102,456,953 113,454,043
Cash and cash equivalents at end of year $62,453,741 $14,468,987 $290,000 $19,361,071 $96,573,799 $102,456,953
Reconciliation of operating income to net cash
flow from operations:
Operating Income $33,078,431 $601,310 $171,450 $859,394 $34,710,585 $30,908,591
Adjustments to reconcile operating income to
net cash provided by operating activities:
Depreciation and amortization 13,845,860 550,434 73,156 519,323 14,988,773 21,564,122
(Increase)Decrease in accounts receivable (3,054,099) 960 - - (3,053,139) 3,528,910
(Increase)Decrease in inventories (60,526) - - - (60,526) 186,174
Increase(Decrease) in vouchers payable 1,057,189 (36,634) (626,968) 188,584 582,171 (1,233,973)
Increase(Decrease) in compensated absences (135,342) - - (15,274) (150,616) 145,147
Increase(Decrease) in contract retainage (1,261,075) - (39,753) - (1,300,828) 123,253
Increase(Decrease) in accrued rent liability - 773,747 - - 773,747 904,992
Increase(Decrease) in unearned revenue 9,100 - - - 9,100 (104,142)
Net cash flows from operations $43,479,538 $1,889,817 ($422,115) $1,552,027 $46,499,267 $56,023,074
Noncash investing, capital, and financing activities:
Contributions from developers and other sources $2,421,745 - - - $2,421,745 $1,786,030
ARLINGTON COUNTY, VIRGINIA
ENTERPRISE FUNDS
COMBINING STATEMENT OF CASH FLOWS
FOR THE YEAR ENDED JUNE 30, 2014
(WITH SUMMARIZED COMPARATIVE TOTALS FOR 2013)
111

Internal Service Funds Automotive Equipment Fund – to account for the costs related to the operation and maintenance of automotive equipment used by County departments and agencies. The acquisition and replacement of automotive equipment is accounted for in this fund. Revenue is derived primarily from user charges to recover actual costs which include depreciation of equipment. Printing Fund – to account for the costs of operating a central print shop which provides printing and duplicating services to County departments and agencies. Revenue is derived principally from user charges and specific services.
112

EXHIBIT E-1
ARLINGTON COUNTY, VIRGINIA
INTERNAL SERVICE FUNDS
COMBINING BALANCE SHEET
JUNE 30, 2014
(WITH SUMMARIZED COMPARATIVE TOTALS FOR 2013)
Totals
Automotive June 30, June 30,
Equipment Printing 2014 2013
ASSETS
CURRENT ASSETS:
Equity in pooled cash and investments $12,417,369 $25,417 $12,442,786 $12,020,253
Accounts receivable 2,114,013 43,032 2,157,045 1,824,002
Inventories 591,803 33,386 625,189 647,741
Total Current Assets 15,123,185 101,835 15,225,020 14,491,996
CAPITAL ASSETS:
Equipment and other capital assets 71,480,445 16,008 71,496,453 64,955,970
Less-allowance for depreciation (34,134,621) - (34,134,621) (30,793,273)
Net Capital Assets 37,345,824 16,008 37,361,832 34,162,697
Total Assets $52,469,009 $117,843 $52,586,852 $48,654,693
LIABILITIES AND NET POSITION:
CURRENT LIABILITIES:
Vouchers payable $1,374,450 $107,660 $1,482,110 $1,246,444
Compensated absences 41,361 11,358 52,719 55,882
Obligations under capital lease 1,143,236 - 1,143,236 919,315
Accounts payable 1,711,190 144,271 1,855,461 217,693
Total Current Liabilities 4,270,237 263,289 4,533,526 2,439,334
LONG-TERM LIABILITIES
Compensated absences 372,254 102,221 474,475 502,947
Obligations under capital lease 4,524,922 - 4,524,922 3,167,945
Total Long-Term Liabilities 4,897,176 102,221 4,999,397 3,670,892
Total liabilities 9,167,413 365,510 9,532,923 6,110,226
NET POSITION:
Net investment in capital assets 31,677,666 16,008 31,693,674 30,075,437
Unrestricted 11,623,930 (263,675) 11,360,255 12,469,030
Total net position 43,301,596 (247,667) 43,053,929 42,544,467
Total Liabilities and Net Position $52,469,009 $117,843 $52,586,852 $48,654,693
113

EXHIBIT E-2
ARLINGTON COUNTY, VIRGINIA
INTERNAL SERVICE FUNDS
COMBINING STATEMENT OF REVENUES, EXPENSES AND CHANGES IN NET POSITION
FOR THE YEAR ENDED JUNE 30, 2014
(WITH SUMMARIZED COMPARATIVE TOTALS FOR 2013)
Totals
Automotive June 30, June 30,
Equipment Printing 2014 2013
OPERATING REVENUES:
Charges for services $21,284,999 $2,476,796 $23,761,795 $22,026,918
OPERATING EXPENSES:
Cost of store issuances 5,312,835 368,191 5,681,026 6,297,628
Personnel services 3,718,281 457,634 4,175,915 4,301,891
Fringe benefits 1,546,510 234,823 1,781,333 1,709,324
Material and supplies 102,079 226,808 328,887 353,068
Utilities 195,957 6,324 202,281 234,166
Operating equipment 12,899 - 12,899 30,291
Outside services 3,925,469 1,424,344 5,349,813 2,645,763
Depreciation 6,166,989 - 6,166,989 5,701,910
Total Operating Expenses 20,981,019 2,718,124 23,699,143 21,274,041
Operating Income (Loss) 303,980 (241,328) 62,652 752,877
NON-OPERATING REVENUES (EXPENSES):
Interest payment on capital lease (128,654) - (128,654) (165,282)
Gain/(Loss)on disposal of assets 509,611 - 509,611 610,326
Total Non-operating Revenues
(Expenses) 380,957 - 380,957 445,044
Income (Loss) Before Transfers 684,937 (241,328) 443,609 1,197,921
CONTRIBUTIONS AND NET TRANSFERS
Transfers in - 195,853 195,853 844,683
Transfers out (130,000) - (130,000) (130,000)
Total Operating Transfers (130,000) 195,853 65,853 714,683
Change in Net Position 554,937 (45,475) 509,462 1,912,604
Net Position, beginning of year 42,746,659 (202,192) 42,544,467 40,631,863
Net Position, end of year $43,301,596 ($247,667) $43,053,929 $42,544,467
114

EXHIBIT E-3
Automotive June 30, June 30,
Equipment Printing 2014 2013
CASH FLOWS FROM OPERATING ACTIVITIES
Cash received from customers $20,994,988 $2,433,764 $23,428,752 $22,369,052
Cash received from interfund charges - - - 9,635
Cash paid to suppliers (7,715,412) (1,963,508) (9,678,920) (9,655,637)
Cash paid to employees (5,295,092) (693,791) (5,988,883) (5,982,323)
Net cash provided (used) by operating activities 7,984,484 (223,535) 7,760,949 6,740,727
CASH FLOWS FROM NON-CAPITAL FINANCING ACTIVITIES:
Operating transfers in - 195,853 195,853 844,683
Operating transfers out (130,000) - (130,000) (130,000)
Net cash provided by non-capital financing
activities (130,000) 195,853 65,853 714,683
CASH FLOWS FROM CAPITAL AND RELATED
FINANCING ACTIVITIES:
Proceeds from capital lease 2,500,213 - 2,500,213 -
Principal payment on capital lease (919,315) - (919,315) (1,023,911)
Payment of interest on capital lease (128,654) - (128,654) (165,282)
Purchases of equipment (9,698,927) (16,008) (9,714,935) (7,092,901)
Proceeds from sale of equipment 858,422 - 858,422 1,391,173
Net cash used by capital and related
financing activities (7,388,261) (16,008) (7,404,269) (6,890,921)
Net increase (decrease) in cash and
cash equivalents 466,223 (43,690) 422,533 564,489
Cash and cash equivalents at beginning
of year 11,951,146 69,107 12,020,253 11,455,764
Cash and cash equivalents at end of
period $12,417,369 $25,417 $12,442,786 $12,020,253
Reconciliation of operating income to net cash
provided (used) by operating activities
Operating income (loss) $303,980 ($241,328) $62,652 $752,877
Adjustments to reconcile operating income to
net cash provided (used) by operating activities:
Depreciation 6,166,989 - 6,166,989 5,701,910
(Increase)Decrease in accounts receivable (290,011) (43,032) (333,043) 351,769
(Increase)Decrease in inventories 43,039 (20,487) 22,552 2,327
(Increase)Decrease in prepaid expenses - - - 39,302
Increase(Decrease) in vouchers payable 1,790,788 82,646 1,873,434 (136,350)
Increase(Decrease) in compensated absences (30,301) (1,334) (31,635) 28,892
Net cash provided (used) by operating activities $7,984,484 ($223,535) $7,760,949 $6,740,727
ARLINGTON COUNTY, VIRGINIA
Totals
INTERNAL SERVICE FUNDS
COMBINING STATEMENT OF CASH FLOWS
FOR THE YEAR ENDED JUNE 30, 2014
(WITH SUMMARIZED COMPARATIVE TOTALS FOR 2013)
115

Fiduciary Funds
Fiduciary funds are used to account for the assets received and disbursed by the County government acting in a trustee capacity or as an agent for individuals, private organizations, other governments, and/or other funds. Pension Trust Fund – to account for the operations of the Arlington Employee’s Supplemental Retirement System. Other Post-employment Benefits (OPEB) Fund – to account for the assets held in trust by the County for the employees / beneficiaries of its OPEB plan. Private Purpose Trust Funds: Alexandria/Arlington Waste To Energy –Facility Monitoring Group “WTE-FMG” Trust Fund – to account for the WTE-FMG Trust Fund set up by the County and the City of Alexandria for supervision and oversight of the Waste To Energy facility. IDA- Ballston Skating Facility Fund – to account for the Ballston Skating Facility which is funded and owned by the Arlington Industrial Development Authority. Other Private Purpose Trust Funds – to account for contributions from private donors and other miscellaneous sources which are restricted for various recreational and other community service programs. Agency Funds: Commonwealth of Virginia Fund – to account for the collection and remittance of State taxes and fees by the County as an agency for the Commonwealth of Virginia. Urban Area Security Initiative Fund – to account for funding provided by the U.S. Department of Homeland Security to develop and implement plans for terrorism prevention, preparedness, response and/or recovery. Other Agency Funds – to account for contributions from private donors and other miscellaneous sources which are restricted for various recreational and other community service programs.
116

EXHIBIT F-1
Alex/Arlington Other Private Total
Pension OPEB Facility Monitoring Group IDA - Ballston Purpose Private Purpose
Trust Trust Trust Skating Facility Trusts Trust
ASSETS
Equity in pooled cash and investments $48,957,591 $75,210,017 $55,173 $2,084,327 $25,835 $2,165,335
Contributions Receivable:
Employer 2,309,178 - - - - -
Employee 491,263 - - - - -
Accrued Interest and Other Receivables 968,676 - - 581,231 - 581,231
Capital Assets, net - - - 24,047,544 - 24,047,544
Investments, at fair value
Foreign, Municipal and U.S. Government
Obligations, including Fixed
Instruments in Pooled Funds 48,126,230 - - - - -
Corporate Fixed Income Obligations 156,725,323 - - - - -
Domestic and Foreign Equities, including
Equities in Pooled Funds 498,009,244 - - - - -
Other Investments 46,210,495 - - - - -
Real Estate Funds 15,909,978 - - - - -
Pooled Equity 680,009,227 - - - - -
Pooled Fixed Income 282,336,657 - - - - -
Convertibles 201,508,930 - - - - -
Collateral on Loaned Securities (net of
Allowance for Unrealized Gain $1,779,336) 22,360,164 - - - - -
Total assets 2,003,922,956 75,210,017 55,173 26,713,102 25,835 26,794,110
DEFERRED OUTFLOWS RESOURCES
Loss on refunding bonds, net - - - 248,664 - 248,664
Total assets and deferred outflows of resources 2,003,922,956 75,210,017 55,173 26,961,766 25,835 27,042,774
LIABILITIES
Accounts payable and
accrued liabilities 1,993,555 - 5,065 586,231 - 591,296
Bonds Payable - - - 27,275,000 - 27,275,000
Obligations under Security Lending Program 20,580,828 - - - - -
Total liabilities 22,574,383 - 5,065 27,861,231 - 27,866,296
NET POSITION $1,981,348,573 $75,210,017 $50,108 ($899,465) $25,835 ($823,522)
JUNE 30, 2014
TRUST FUNDS
COMBINING STATEMENT OF NET POSITION
ARLINGTON COUNTY, VIRGINIA
Private Purpose Trust
117
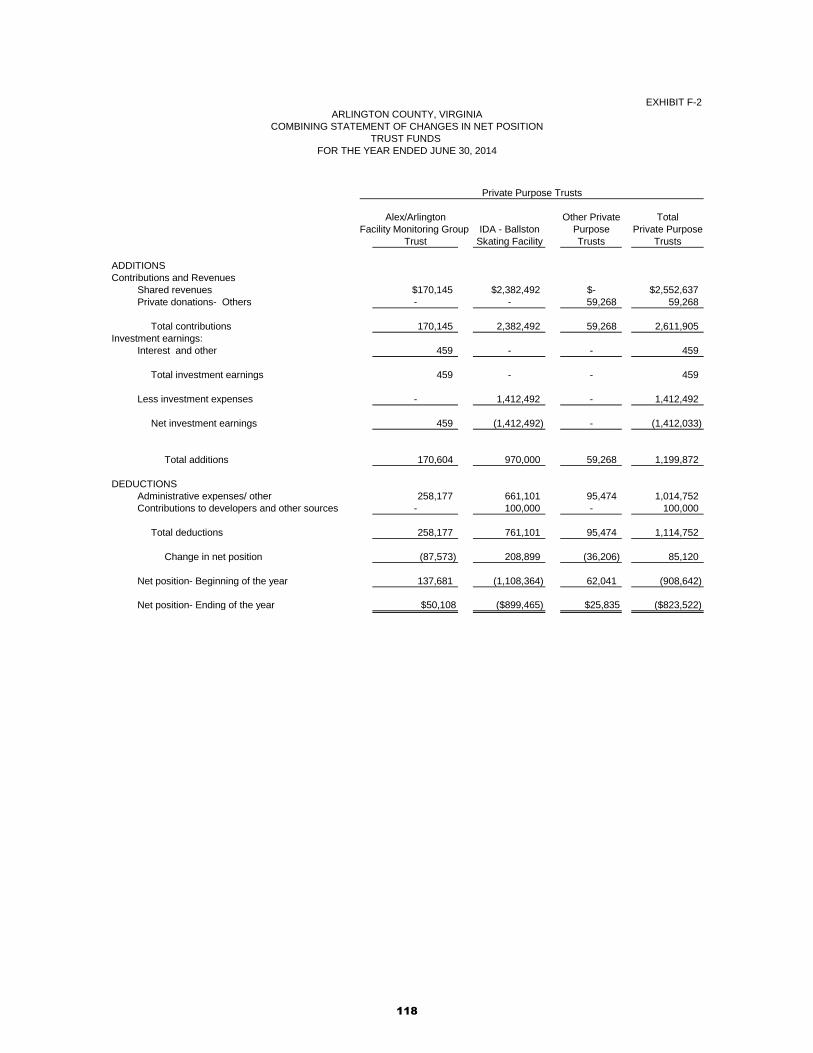
EXHIBIT F-2
Alex/Arlington Other Private TotalFacility Monitoring Group IDA - Ballston Purpose Private Purpose
Trust Skating Facility Trusts Trusts
ADDITIONSContributions and Revenues
Shared revenues $170,145 $2,382,492 $- $2,552,637Private donations- Others - - 59,268 59,268
Total contributions 170,145 2,382,492 59,268 2,611,905 Investment earnings:
Interest and other 459 - - 459
Total investment earnings 459 - - 459
Less investment expenses - 1,412,492 - 1,412,492
Net investment earnings 459 (1,412,492) - (1,412,033)
Total additions 170,604 970,000 59,268 1,199,872
DEDUCTIONS Administrative expenses/ other 258,177 661,101 95,474 1,014,752
Contributions to developers and other sources - 100,000 - 100,000
Total deductions 258,177 761,101 95,474 1,114,752
Change in net position (87,573) 208,899 (36,206) 85,120
Net position- Beginning of the year 137,681 (1,108,364) 62,041 (908,642)
Net position- Ending of the year $50,108 ($899,465) $25,835 ($823,522)
Private Purpose Trusts
COMBINING STATEMENT OF CHANGES IN NET POSITIONARLINGTON COUNTY, VIRGINIA
TRUST FUNDS FOR THE YEAR ENDED JUNE 30, 2014
118

EXHIBIT F-3
ARLINGTON COUNTY, VIRGINIA
PENSION AND OPEB TRUST FUNDS
STATEMENT OF CHANGES IN PLAN NET POSITION
FOR THE YEAR ENDED JUNE 30, 2014
Pension OPEB June 30, June 30,
Trust Trust 2014 2013
ADDITIONS:
Employer contributions $53,718,087 $7,024,633 $60,742,720 $48,002,951
Member contributions 11,665,908 - 11,665,908 19,608,434
Other contributions 204,465 66,546 271,011 20,415
Investment income:
Interest and dividends 42,021,035 4,127,906 46,148,941 41,180,867
Net appreciation ( depreciation) in fair value 270,414,540 5,908,921 276,323,461 174,041,236
Commission recapture 942 - 942 13,972
Gross income from securities lending 190,665 - 190,665 161,462
Bank fees and income/expenses from securities lending (48,568) - (48,568) (47,601)
Investment expense (5,929,040) - (5,929,040) (5,277,099)
Total Additions 372,238,034 17,128,006 389,366,040 277,704,637
DEDUCTIONS:
Members' benefits 85,308,562 - 85,308,562 81,523,163
Refund of members' contributions 1,004,180 - 1,004,180 963,766
Administrative expenses 681,430 - 681,430 580,729
Other consulting expenses 724,550 20,352 744,902 395,039
Total Deductions 87,718,722 20,352 87,739,074 83,462,697
Net Increase/(Decrease) 284,519,312 17,107,654 301,626,966 194,241,940
Net Position Held in Trust for Plan Benefits, beginning
of year 1,696,829,261 58,102,363 1,754,931,624 1,560,689,684
Net Position Held in Trust for Plan Benefits, end of
year:
Undesignated $1,981,348,573 $75,210,017 $2,056,558,590 $1,754,931,624
(WITH SUMMARIZED COMPARATIVE TOTALS FOR 2013)
119

EXHIBIT F-4
ARLINGTON COUNTY, VIRGINIA
COMBINING STATEMENT OF NET POSITION
AGENCY FUNDS
JUNE 30, 2014
Commonwealth Other Total
of Urban Area Agency Agency
Virginia Security Initiative Funds Funds
ASSETS
Equity in pooled cash and investments $47,681 $- $15,368,694 $15,416,375
Receivable from other government 12,720 430,989 - 443,709
Total assets 60,401 430,989 15,368,694 15,860,084
LIABILITIES
Accounts payable and accrued liabilities 60,401 430,989 15,368,694 15,860,084
Total liabilities 60,401 430,989 15,368,694 15,860,084
NET POSITION $- $- $- $-
120

EXHIBIT F-5
Balance Balance
July 1, 2013 Additions Deductions June 30, 2014
Commonwealth of Virginia
ASSETS:
Cash $56,683 $- $9,002 $47,681
Receivable from other government - 12,720 - 12,720
Total Assets $56,683 $12,720 $9,002 $60,401
LIABILITIES:
Accounts payable and accrued liabilities $56,683 $3,718 $- $60,401
Total Liabilities $56,683 $3,718 $- $60,401
Urban Area Security Initiative
ASSETS:
Cash & cash equivalents $- $1,367,608 $1,367,608 $-
Receivable from other government 115,126 430,989 115,126 430,989
Total Assets $115,126 $1,798,597 $1,482,734 $430,989
LIABILITIES:
Accounts payable and accrued liabilities $115,126 $315,863 $- $430,989
Total Liabilities $115,126 $315,863 $- $430,989
Other Agency Fund
ASSETS:
Cash & cash equivalents $14,731,644 $2,290,767 $1,653,717 $15,368,694
Receivable from other government 18,879 - 18,879 -
Total Assets $14,750,523 $2,290,767 $1,672,596 $15,368,694
LIABILITIES:
Accounts payable and accrued liabilities $14,750,523 $4,789,972 $4,171,801 $15,368,694
Total Liabilities $14,750,523 $4,789,972 $4,171,801 $15,368,694
Total All Agency Funds
ASSETS:
Cash $14,788,327 $3,658,375 $3,030,327 $15,416,375
Receivable from other government 134,005 443,709 134,005 443,709
Total Assets $14,922,332 $4,102,084 $3,164,332 $15,860,084
LIABILITIES:
Vouchers payable $14,922,332 $5,109,553 $4,171,801 $15,860,084
Total Liabilities $14,922,332 $5,109,553 $4,171,801 $15,860,084
AGENCY FUNDS
COMBINING STATEMENT OF CHANGES IN ASSETS AND LIABILITIES
FOR THE YEAR ENDED JUNE 30, 2014
ARLINGTON COUNTY, VIRGINIA
121

Discretely Presented Component Unit – Schools
School Operating Fund – to account for the general operations of the County’s public school system. Financing is provided primarily by transfers from the General Fund and from State and Federal grants to be used only for education programs. School Food and Nutrition Services Fund – to account for the operations of the School food services programs for student meals. Revenue is provided by fees, State financing and other miscellaneous sources to be used for School food service operations. School Community Activities Fund – to account for the operations of various community service programs, which include aquatic centers and day care facilities. Financing is provided primarily by General Fund transfers and fees collected for specific activities. School Special Grant/ Debt Service Funds - to account for the operations of various special school programs, which are financed by limited term grants under State and Federal aid programs. Debt Service expenditures for the payment of principal and interest on school bonds are also accounted for in these funds. School Capital Project Funds – to account for purchase and /or construction of major capital facilities for the schools. The capital projects which are financed under the County’s Pay-As-You-go Capital Programs are accounted for in the School Capital Projects Pay-As-You-Go Fund. As required by law, a separate fund, the School Capital Projects Bond Fund, is used to account for the capital project expenditures financed by the proceeds of general obligation bonds. School Comprehensive Services Act Fund – to account for expenditures for at-risk youth by the Department of Human Services- Foster Care, Juvenile and Domestic Relations District Court and the Schools. The State reimburses 55% of these expenditures. Arlington County School Board Retiree Welfare Benefit Plan Trust – to account for the assets held in trust by the School Board for the employees / beneficiaries of its OPEB plan.
122

EXHIBIT G-1
ARLINGTON COUNTY, VIRGINIA
COMBINING BALANCE SHEET
DISCRETELY PRESENTED COMPONENT UNIT - SCHOOL BOARD
JUNE 30, 2014
(WITH SUMMARIZED COMPARATIVE TOTALS FOR 2013)
Governmental Funds Totals
School School School School School School
School School Community Special Capital Capital Projects Debt Comprehensive
Operating Food & Nutrition Activities Grants Projects (Pay-as-you Service Services June 30, June 30,
Fund Service Fund Fund Fund Bond Fund go Fund) Fund Act 2014 2013
ASSETS
Equity in pooled cash and investments $30,320,414 $1,427,224 $- $695,891 $65,263,168 $6,090,714 $- $- $103,797,411 $110,228,322
Petty cash 200 240 375 - - - - - 815 815
Accounts receivable 165,658 318,645 45,055 3,161,648 - 455,055 - 296,148 4,442,209 5,562,392
Due from other funds - 93 - - - - - - 93 863,622
Due from primary government 68,311,417 - 1,010,746 - - 16,619,511 - - 85,941,674 75,969,684
Inventories 119,611 46,682 - - - - - - 166,293 127,864
Total Assets $98,917,300 $1,792,884 $1,056,176 $3,857,539 $65,263,168 $23,165,280 $- $296,148 $194,348,495 $192,752,699
LIABILITIES AND FUND BALANCES
LIABILITIES
Accrued salaries payable $53,285,902 $393,384 $781,433 $1,268,187 $1,574 $4,726 $- $- $55,735,206 $52,419,177
Vouchers payable 4,489,438 182,143 236,687 150,156 1,954,792 2,688,219 - 2,119 9,703,554 10,675,949
Contracts payable - retainage - - - - 5,004,359 - - - 5,004,359 5,946,246
Other liabilities 5,478,895 - - - - - - - 5,478,895 5,496,084
Deferred revenue 620,709 - 61,083 - - - - - 681,792 648,060
Due to other funds 93 - - - - - - - 93 863,622
Due to primary government - - - - - - - 294,029 294,029 422,225
Total Liabilities 63,875,037 575,527 1,079,203 1,418,343 6,960,725 2,692,945 - 296,148 76,897,928 76,471,363
FUND EQUITY AND OTHER CREDITS
Restricted for:
Capital projects - - - - 51,886,597 6,090,714 - - 57,977,311 54,583,825
Grants - - - 2,439,196 - - - - 2,439,196 2,009,337
Committed to:
Incomplete projects 4,721,849 8,786 (23,027) - 6,415,846 14,381,621 - - 25,505,075 26,082,805
Next years' School budget 15,121,892 - - - - - - - 15,121,892 16,749,704
Assigned to:
Operating reserve 2,000,000 1,208,571 - - - - - - 3,208,571 2,843,426
Unfunded liabilities 2,000,000 - - - - - - - 2,000,000 2,000,000
Subsequent years' debt service 3,360,000 - - - - - - - 3,360,000 3,625,000
Health insurance reserve 1,000,000 - - - - - - - 1,000,000 1,000,000
General reserve 1,201,283 - - - - - - - 1,201,283 -
VRS reserve 5,637,239 - - - - - - - 5,637,239 7,387,239
Total Fund Equity and Other Credits 35,042,263 1,217,357 (23,027) 2,439,196 58,302,443 20,472,335 - - 117,450,567 116,281,336
Total Liabilities, Fund Equity
and Other Credits $98,917,300 $1,792,884 $1,056,176 $3,857,539 $65,263,168 $23,165,280 $- $296,148 $194,348,495 $192,752,699
123

EXHIBIT G1(A)
Total-component unit-Schools fund balances $117,450,567
Amounts reported for governmental activities in the Statement of Net Position are
different because:
Capital assets used in governmental activities
are not financial resources and are not reported in the funds 539,878,576
OPEB liabilities are not due and payable in the
current period and are not reported in the funds (14,626,895)
Long-term liabilities, including capital leases, are (37,962,905)
not due and payable in the current period
and are not reported in the funds
Net position of component unit - Schools $604,739,343
JUNE 30, 2014
ARLINGTON COUNTY, VIRGINIA
RECONCILIATION OF THE FUND BALANCES OF COMPONENT UNIT - SCHOOLS TO
NET POSITION OF COMPONENT UNIT - SCHOOLS
124
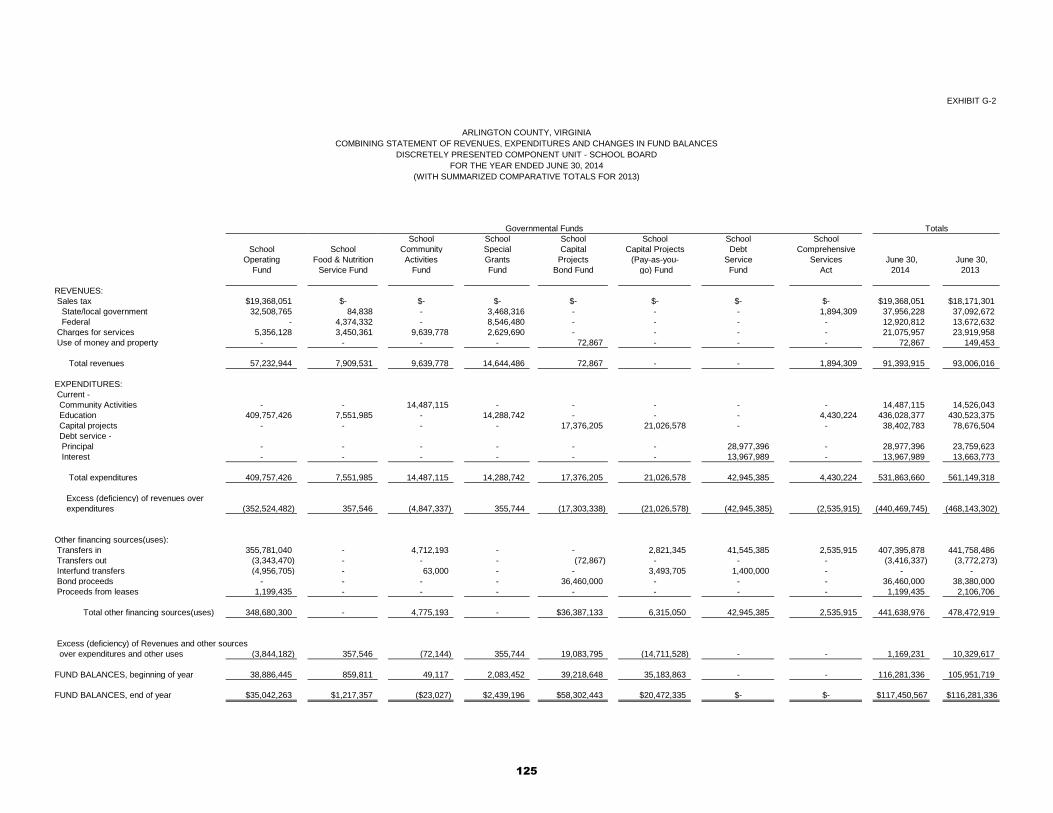
EXHIBIT G-2
ARLINGTON COUNTY, VIRGINIA
COMBINING STATEMENT OF REVENUES, EXPENDITURES AND CHANGES IN FUND BALANCES
DISCRETELY PRESENTED COMPONENT UNIT - SCHOOL BOARD
FOR THE YEAR ENDED JUNE 30, 2014
(WITH SUMMARIZED COMPARATIVE TOTALS FOR 2013)
Governmental Funds Totals
School School School School School School
School School Community Special Capital Capital Projects Debt Comprehensive
Operating Food & Nutrition Activities Grants Projects (Pay-as-you- Service Services June 30, June 30,
Fund Service Fund Fund Fund Bond Fund go) Fund Fund Act 2014 2013
REVENUES:
Sales tax $19,368,051 $- $- $- $- $- $- $- $19,368,051 $18,171,301
State/local government 32,508,765 84,838 - 3,468,316 - - - 1,894,309 37,956,228 37,092,672
Federal - 4,374,332 - 8,546,480 - - - - 12,920,812 13,672,632
Charges for services 5,356,128 3,450,361 9,639,778 2,629,690 - - - - 21,075,957 23,919,958
Use of money and property - - - - 72,867 - - - 72,867 149,453
Total revenues 57,232,944 7,909,531 9,639,778 14,644,486 72,867 - - 1,894,309 91,393,915 93,006,016
EXPENDITURES:
Current -
Community Activities - - 14,487,115 - - - - - 14,487,115 14,526,043
Education 409,757,426 7,551,985 - 14,288,742 - - - 4,430,224 436,028,377 430,523,375
Capital projects - - - - 17,376,205 21,026,578 - - 38,402,783 78,676,504
Debt service -
Principal - - - - - - 28,977,396 - 28,977,396 23,759,623
Interest - - - - - - 13,967,989 - 13,967,989 13,663,773
Total expenditures 409,757,426 7,551,985 14,487,115 14,288,742 17,376,205 21,026,578 42,945,385 4,430,224 531,863,660 561,149,318
Excess (deficiency) of revenues over
expenditures (352,524,482) 357,546 (4,847,337) 355,744 (17,303,338) (21,026,578) (42,945,385) (2,535,915) (440,469,745) (468,143,302)
Other financing sources(uses):
Transfers in 355,781,040 - 4,712,193 - - 2,821,345 41,545,385 2,535,915 407,395,878 441,758,486
Transfers out (3,343,470) - - - (72,867) - - - (3,416,337) (3,772,273)
Interfund transfers (4,956,705) - 63,000 - - 3,493,705 1,400,000 - - -
Bond proceeds - - - - 36,460,000 - - - 36,460,000 38,380,000
Proceeds from leases 1,199,435 - - - - - - - 1,199,435 2,106,706
Total other financing sources(uses) 348,680,300 - 4,775,193 - $36,387,133 6,315,050 42,945,385 2,535,915 441,638,976 478,472,919
Excess (deficiency) of Revenues and other sources
over expenditures and other uses (3,844,182) 357,546 (72,144) 355,744 19,083,795 (14,711,528) - - 1,169,231 10,329,617
FUND BALANCES, beginning of year 38,886,445 859,811 49,117 2,083,452 39,218,648 35,183,863 - - 116,281,336 105,951,719
FUND BALANCES, end of year $35,042,263 $1,217,357 ($23,027) $2,439,196 $58,302,443 $20,472,335 $- $- $117,450,567 $116,281,336
125

EXHIBIT G2(A)
Net change in fund balances - component unit-Schools $1,169,231
Amounts reported for governmental activities in the Statement
of Activities are different because:
Governmental funds report capital outlays as expenditures
while governmental activities report depreciation expense
to allocate those expenditures over the life of the assets.
Add: Capital acquisitions 34,898,488
Less Depreciation expense (20,311,829) 14,586,659
Lease proceeds provide current financial resources to the
governmental funds, but capital leases increases long-term
liabilities in the Statement of Net Assets. Repayment of
capital leases is an expenditure in the governmental funds,
but the repayment reduces long term liabilities in the
Statement of Net Position.
Add: Repayment of capital leases 1,645,256
Less Proceeds from capital leases (1,199,435) 445,821
OPEB expenses reported in the Statement of Activities do not
require the use of current financial resources and
are not reported as expenditures in governmental funds 18,993
Some expenses reported in the Statement of Activities do not
require the use of current financial resources and
are not reported as expenditures in governmental funds
such as compensated absences and workers compensation 1,574,982
Change in net position of component unit-Schools $17,795,686
ARLINGTON COUNTY, VIRGINIA
RECONCILIATION OF THE STATEMENT OF REVENUES, EXPENDITURES,
AND CHANGES IN FUND BALANCES - COMPONENT UNIT-SCHOOLS
FOR THE YEAR ENDED JUNE 30, 2014
TO STATEMENT OF ACTIVITIES - COMPONENT UNIT SCHOOLS
126

EXHIBIT G-3
Page 1 of 3
COMBINING STATEMENT OF REVENUES, EXPENDITURES AND CHANGES COMBINING STATEMENT OF REVENUES, EXPENDITURES AND CHANGES
IN FUND BALANCES- BUDGET(GAAP BASIS) AND ACTUAL IN FUND BALANCES- BUDGET(GAAP BASIS) AND ACTUAL
DISCRETELY PRESENTED COMPONENT UNIT - SCHOOL BOARD DISCRETELY PRESENTED COMPONENT UNIT - SCHOOL BOARD
FOR THE YEAR ENDED JUNE 30, 2014 FOR THE YEAR ENDED JUNE 30, 2014
School Operating Fund School Food & Nutrition Service Fund School Community Activities Fund
Variance- Variance- Variance-
Positive Positive Positive
Budget Actual (Negative) Budget Actual (Negative) Budget Actual (Negative)
REVENUES:
Sales tax $20,179,702 $19,368,051 ($811,651) $- $- $- $- $- $-
Intergovernmental
State 31,842,908 32,508,765 665,857 82,046 84,838 2,792 - - -
Federal - - - 3,927,460 4,374,332 446,872 - - -
Charges for services 2,584,492 5,356,128 2,771,636 3,469,177 3,450,361 (18,816) 8,581,600 9,639,778 1,058,178
Use of money and property - - - - - - - - -
Total revenues 54,607,102 57,232,944 2,625,842 7,478,683 7,909,531 430,848 8,581,600 9,639,778 1,058,178
EXPENDITURES:
Education 446,244,859 409,757,426 36,487,433 7,495,068 7,551,985 (56,917) - - -
Community Activities - - - - - - 16,423,801 14,487,115 1,936,686
Capital projects - - - - - - - - -
Debt service:
Principal retirement - - - - - - - - -
Interest and fiscal charges - - - - - - - - -
Total expenditures 446,244,859 409,757,426 36,487,433 7,495,068 7,551,985 (56,917) 16,423,801 14,487,115 1,936,686
Excess (deficiency) of revenues over
expenditures (391,637,757) (352,524,482) 39,113,275 (16,385) 357,546 373,931 (7,842,201) (4,847,337) 2,994,864
Other financing sources(uses):
Transfers in 373,720,256 355,781,040 (17,939,216) - - - 7,730,084 4,712,193 (3,017,891)
Transfers out - (3,343,470) (3,343,470) - - - - - -
Interfund transfers (4,956,705) (4,956,705) - - - - 63,000 63,000 -
Proceeds from sale of bonds - - - - - - - - -
Proceeds from capital leases - 1,199,435 1,199,435 - - - - - -
Total other financing sources(uses) 368,763,551 348,680,300 (20,083,251) - - - 7,793,084 4,775,193 (3,017,891)
Excess (deficiency) of Revenues and other
sources over expenditures and other uses (22,874,206) (3,844,182) 19,030,024 (16,385) 357,546 373,931 (49,117) (72,144) (23,027)
FUND BALANCES, beginning of year 38,886,445 38,886,445 - 859,811 859,811 - 49,117 49,117 -
FUND BALANCES, end of year $16,012,239 $35,042,263 $19,030,024 $843,426 $1,217,357 $373,931 $- ($23,027) ($23,027)
ARLINGTON COUNTY, VIRGINIA
127
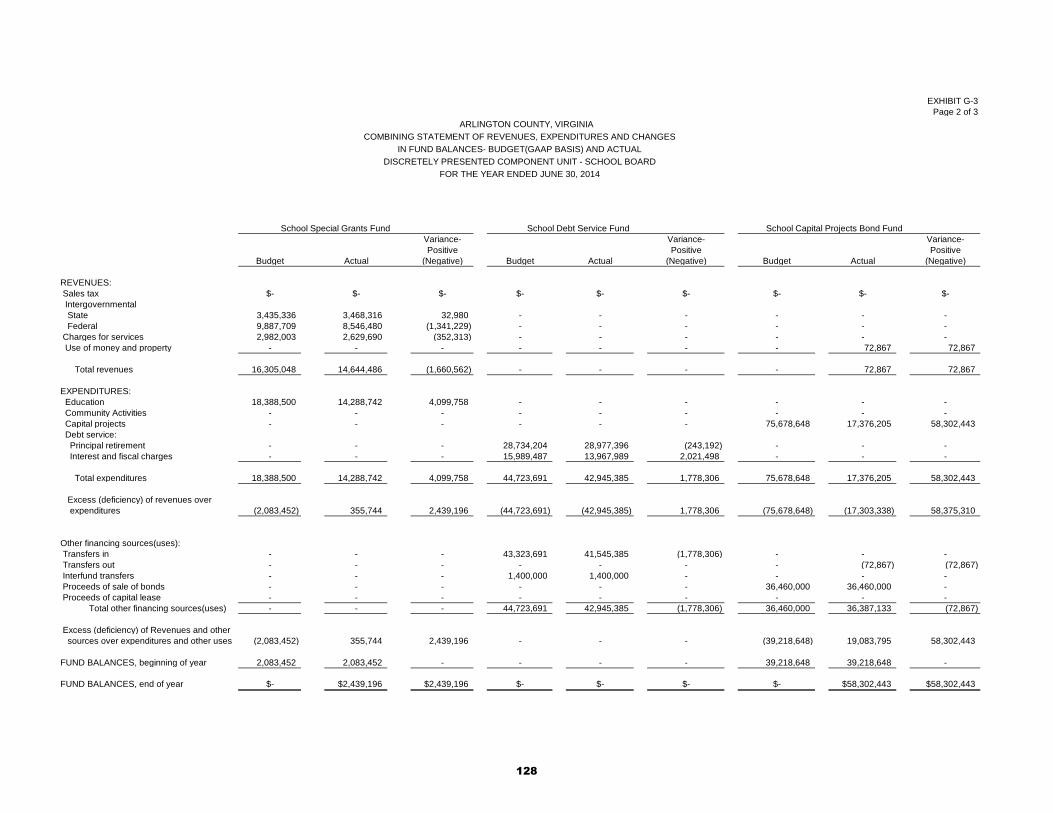
EXHIBIT G-3
Page 2 of 3
COMBINING STATEMENT OF REVENUES, EXPENDITURES AND CHANGES COMBINING STATEMENT OF REVENUES, EXPENDITURES AND CHANGES
IN FUND BALANCES- BUDGET(GAAP BASIS) AND ACTUAL IN FUND BALANCES- BUDGET(GAAP BASIS) AND ACTUAL
DISCRETELY PRESENTED COMPONENT UNIT - SCHOOL BOARD DISCRETELY PRESENTED COMPONENT UNIT - SCHOOL BOARD
FOR THE YEAR ENDED JUNE 30, 2014 FOR THE YEAR ENDED JUNE 30, 2014
School Special Grants Fund School Debt Service Fund School Capital Projects Bond Fund
Variance- Variance- Variance-
Positive Positive Positive
Budget Actual (Negative) Budget Actual (Negative) Budget Actual (Negative)
REVENUES:
Sales tax $- $- $- $- $- $- $- $- $-
Intergovernmental
State 3,435,336 3,468,316 32,980 - - - - - -
Federal 9,887,709 8,546,480 (1,341,229) - - - - - -
Charges for services 2,982,003 2,629,690 (352,313) - - - - - -
Use of money and property - - - - - - - 72,867 72,867
Total revenues 16,305,048 14,644,486 (1,660,562) - - - - 72,867 72,867
EXPENDITURES:
Education 18,388,500 14,288,742 4,099,758 - - - - - -
Community Activities - - - - - - - - -
Capital projects - - - - - - 75,678,648 17,376,205 58,302,443
Debt service:
Principal retirement - - - 28,734,204 28,977,396 (243,192) - - -
Interest and fiscal charges - - - 15,989,487 13,967,989 2,021,498 - - -
Total expenditures 18,388,500 14,288,742 4,099,758 44,723,691 42,945,385 1,778,306 75,678,648 17,376,205 58,302,443
Excess (deficiency) of revenues over
expenditures (2,083,452) 355,744 2,439,196 (44,723,691) (42,945,385) 1,778,306 (75,678,648) (17,303,338) 58,375,310
Other financing sources(uses):
Transfers in - - - 43,323,691 41,545,385 (1,778,306) - - -
Transfers out - - - - - - - (72,867) (72,867)
Interfund transfers - - - 1,400,000 1,400,000 - - - -
Proceeds of sale of bonds - - - - - - 36,460,000 36,460,000 -
Proceeds of capital lease - - - - - - - - -
Total other financing sources(uses) - - - 44,723,691 42,945,385 (1,778,306) 36,460,000 36,387,133 (72,867)
Excess (deficiency) of Revenues and other
sources over expenditures and other uses (2,083,452) 355,744 2,439,196 - - - (39,218,648) 19,083,795 58,302,443
FUND BALANCES, beginning of year 2,083,452 2,083,452 - - - - 39,218,648 39,218,648 -
FUND BALANCES, end of year $- $2,439,196 $2,439,196 $- $- $- $- $58,302,443 $58,302,443
ARLINGTON COUNTY, VIRGINIA
128

EXHIBIT G-3
Page 3 of 3
COMBINING STATEMENT OF REVENUES, EXPENDITURES AND CHANGES
IN FUND BALANCES- BUDGET(GAAP BASIS) AND ACTUAL
DISCRETELY PRESENTED COMPONENT UNIT - SCHOOL BOARD
FOR THE YEAR ENDED JUNE 30, 2014
School Capital Projects (Pay-as-you-go) Fund School Comprehensive Services Act Totals
Variance Variance Variance-
Positive Positive Positive
Budget Actual (Negative) Budget Actual (Negative) Budget Actual (Negative)
REVENUES:
Sales tax $- $- $- $- $- $- $20,179,702 $19,368,051 ($811,651)
Intergovernmental
State - - - 1,992,500 1,894,309 (98,191) 37,352,790 37,956,228 603,438
Federal - - - - - - 13,815,169 12,920,812 (894,357)
Charges for services - - - - - - 17,617,272 21,075,957 3,458,685
Use of money and property - - - - - - - 72,867 72,867
Total revenues - - - 1,992,500 1,894,309 (98,191) 88,964,933 91,393,915 2,428,982
EXPENDITURES:
Education - - - 4,520,000 4,430,224 89,776 476,648,427 436,028,377 40,620,050
Community Activities - - - - - - 16,423,801 14,487,115 1,936,686
Capital projects 52,283,796 21,026,578 31,257,218 - - - 127,962,444 38,402,783 89,559,661
Debt service:
Principal retirement - - - - - - 28,734,204 28,977,396 (243,192)
Interest and fiscal charges - - - - - - 15,989,487 13,967,989 2,021,498
Total expenditures 52,283,796 21,026,578 31,257,218 4,520,000 4,430,224 89,776 665,758,363 531,863,660 133,894,703
Excess (deficiency) of revenues over
expenditures (52,283,796) (21,026,578) 31,257,218 (2,527,500) (2,535,915) (8,415) (576,793,430) (440,469,745) 136,323,685
Other financing sources(uses):
Transfers in 13,606,228 2,821,345 (10,784,883) 2,527,500 2,535,915 8,415 440,907,759 407,395,878 (33,511,881)
Transfers out - - - - - - - (3,416,337) (3,416,337)
Interfund transfers 3,493,705 3,493,705 - - - - - - -
Proceeds of sale of bonds - - - - - - $36,460,000 36,460,000 -
Proceeds from capital lease - - - - - - - 1,199,435 1,199,435
Total other financing sources(uses) 17,099,933 6,315,050 (10,784,883) 2,527,500 2,535,915 8,415 477,367,759 441,638,976 (35,728,783)
Excess (deficiency) of Revenues and other
sources over expenditures and other uses (35,183,863) (14,711,528) 20,472,335 - - - (99,425,671) 1,169,231 100,594,902
FUND BALANCES, beginning of year 35,183,863 35,183,863 - - - - 116,281,336 116,281,336 -
FUND BALANCES, end of year $- $20,472,335 $20,472,335 $- $- $- $16,855,665 $117,450,567 $100,594,902
ARLINGTON COUNTY, VIRGINIA
129

EXHIBIT G-4
2014 2013
ASSETS
Cash and Investments $34,546,134 $26,586,157
Total Assets 34,546,134 26,586,157
LIABILITIES - -
NET POSITION $34,546,134 $26,586,157
(WITH COMPARATIVE TOTALS FOR 2013)
ARLINGTON COUNTY, VIRGINIA
OPEB TRUST FUND - SCHOOLS
BALANCE SHEET
JUNE 30, 2014
130

EXHIBIT G-5
2014 2013
ADDITIONS:
Employer contributions $3,343,470 $3,631,427
Investment Income:
Interest and dividends 1,907,604 899,211
Net Appreciation (depreciation) in fair value 2,708,903 2,074,747
Total Additions 7,959,977 6,605,385
DEDUCTIONS: - -
Net Increase 7,959,977 6,605,385
Net Position Held in Trust for Plan Benefits,
beginning of year 26,586,157 19,980,772
Net Position Held in Trust for Plan Benefits,
end of year:
Undesignated $34,546,134 $26,586,157
(WITH COMPARATIVE TOTALS FOR 2013)
ARLINGTON COUNTY, VIRGINIA
OPEB TRUST FUND - SCHOOLS
STATEMENT OF CHANGES IN PLAN NET POSITION
FOR THE YEAR ENDED JUNE 30, 2014
131

Supplemental Schedules The supplemental schedules are presented to reflect finance-related legal and contractual compliance, details of data summarized in the preceding financial statements and other information deemed useful for financial statement users in the analysis of the County’s financial activities.
132

EXHIBIT S-1
Page 1 of 3
SCHEDULE OF TREASURER'S ACCOUNTABILITY TO THE COUNTY- ALL FUNDSFOR THE YEAR ENDED JUNE 30, 2014
Governmental Funds Proprietary Funds Fiduciary ComponentFund Units
TrustSpecial Capital Internal and Total
General Revenue Projects Enterprise Service Agency Schools (Memorandum Only)
BALANCE, beginning of year $277,937,767 $7,396,014 $283,864,504 $102,456,953 $12,020,253 $17,186,386 $110,228,322 $811,090,199
Receipts (net): Taxes 937,038,604 7,540,025 37,040,760 - - - 19,368,051 1,000,987,440 Licenses and permits 12,396,844 - - - - - - 12,396,844 Fines and forfeitures 8,113,863 - - - - - - 8,113,863 Revenue from use of money and property 6,414,252 1,949 162,689 272,989 - - 72,867 6,924,746 Charges for services 53,136,621 - 5,212,203 125,029,624 23,761,795 113,012 21,075,957 228,329,212 Miscellaneous 28,445,244 - 2,476,666 3,789,066 - 2,001,496 - 36,712,472 Intergovernmental 85,999,950 19,933,787 28,922,852 - - 1,837,567 50,877,040 187,571,196 Proceeds from indebtedness - - 50,174,005 4,465,000 - - - 54,639,005 Proceeds from sale of assets - - - - 858,422 - 1,199,435 2,057,857
______________ ______________ _____________ _____________ ____________ ____________ _____________ _______________ Total Receipts 1,131,545,378 27,475,761 123,989,175 133,556,679 24,620,217 3,952,075 92,593,350 1,537,732,635
______________ ______________ _____________ _____________ ____________ ____________ _____________ _______________ Total Receipts and Balance 1,409,483,145 34,871,775 407,853,679 236,013,632 36,640,470 21,138,461 202,821,672 2,348,822,834
______________ ______________ _____________ _____________ ____________ ____________ _____________ _______________
Disbursements (net): Warrants(checks)issued 597,650,580 28,340,655 98,780,715 102,335,684 23,215,568 3,713,950 460,058,417 1,314,095,569 Retirement of indebtedness 38,279,170 - - 25,040,052 919,315 - 28,977,396 93,215,933 Interest and other debt costs 17,606,604 - 17,965,000 12,992,495 128,654 - 13,967,989 62,660,742
______________ ______________ _____________ _____________ ____________ ____________ _____________ _______________ Total Disbursements 653,536,354 28,340,655 116,745,715 140,368,231 24,263,537 3,713,950 503,003,802 1,469,972,244
______________ ______________ _____________ _____________ ____________ ____________ _____________ _______________
Interfund Transfers: Transfers in 839,811 - 29,553,643 102,027 195,853 - 407,395,878 438,087,212 Transfers out (437,211,919) (75,400) (4,130,637) - (130,000) - (3,416,337) (444,964,293)
______________ ______________ _____________ _____________ ____________ ____________ _____________ _______________BALANCE, end of year $319,574,683 $6,455,720 $316,530,970 $95,747,428 $12,442,786 $17,424,511 $103,797,411 $871,973,509
ARLINGTON COUNTY, VIRGINIA
133

EXHIBIT S-1Page 2 of 3
Assets held by the Treasurer Cash on hand $15,000
Cash in banks: Checking
First Virginia Community Bank 3,156 John Marshall 16,415 Wells Fargo 101,248,919 SunTrust 120,977 Citibank (219,216) Bank of America 3,874,152 United Bank 888,315 PNC Bank 33,530 Burke and Herbert Bank 117,808 Total Checking Account 106,084,056
Savings :
Wells Fargo 2,101,249 Total Savings Account 2,101,249
Certificates of Deposit :John Marshall 27,454,214 Total Certificates of Deposit 27,454,214
Held with Trustee :Corporate Notes 99,707,569 Commercial Paper 169,621,415 Federal Agency Bonds/ Notes 91,890,157 Municipal Investments 28,568,300 Total Held with Trustee 389,787,441
State Treasurer's Local Government Investment Pool 219,120 Chain Bridge Money Market 1,007,701 John Marshall Money Market 6,357,488 Bank of Georgetown Money Market 14,722,881 First Virginia Community Bank Money Market 10,019,902 United Bank Money Market 19,009 Virginia Investment Pool 40,063,602 State Non Arbitrage Investment Program (SNAP) 252,006,369
Total Cash and Investments held by the Treasurer 849,858,032
Cash and Investments with Trustees : US Bank, Ballston Garage Accounts 17,676,815 SunTrust, Ballston Parking Garage 109,880 LGIP Solid Waste Mellon- IDA Ballston Skating Facility 2,184,327 First Virginia Community Bank 55,173 U.S. Bank-IDA Lease Revenue Bonds (County) 806,012Arlington Mill Garage 6,898Mellon- IDA Lease Revenue Bonds (Capital) 1,276,372
Total Cash and Investments with Trustee 22,115,477
Total Cash & Investment Balances, June 30, 2014 $871,973,509
ARLINGTON COUNTY, VIRGINIASCHEDULE OF TREASURER'S ACCOUNTABILITY
ADJUSTED CASH IN BANKSJUNE 30, 2014
134

EXHIBIT S-1Page 3 of 3
Assets Held by the Treasurer Cash on Hand $15,000
Cash in Banks: Checking
First Virginia Community Bank 3,156John Marshall 16,415Wells Fargo 108,456,679SunTrust 120,977Citibank (219,216)Bank of America 3,874,152United Bank 875,228PNC Bank 33,530Burke and Herbert Bank 117,808
Total Checking Account 113,278,729
Savings:Wells Fargo 2,101,238
Total Savings Account 2,101,238
Certificates of Deposit:John Marshall 27,454,214
Total Certificates of Deposit 27,454,214
Held with Trustee:Corporate Notes 99,707,569Commercial Paper 169,621,415Federal Agency Bonds/ Notes 91,890,157Municipal Investments 28,568,300
Total Held with Trustee 389,787,441
State Treasurer's Local Government Investment Pool 219,120 Chain Bridge Money Market 1,007,701 John Marshall Money Market 6,357,489 Bank of Georgetown Money Market 14,722,881 First Virginia Community Bank Money Market 10,019,902 United Bank Money Market 19,009 Virginia Investment Pool 40,063,602 State Non Arbitrage Investment Program (SNAP) 252,006,370
Total Cash and Investments held by the Treasurer 857,052,695.80
Cash and Investments with Trustees: US Bank, Ballston Garage Accounts 17,676,815 SunTrust, (Ballston Parking Garage) 79,644LGIP Solid WasteMellon- IDA Ballston Skating Facility 2,184,327First Virginia Community Bank 55,173U.S. Bank - IDA Lease Revenue Bonds (County) 806,012Mellon- IDA Lease Revenue Bonds (Capital) 1,276,372
Total Cash and Investments with Trustee 22,078,343
Total Cash & Investment Balances, June 30, 2014 $879,131,039
ARLINGTON COUNTY, VIRGINIASCHEDULE OF TREASURER'S ACCOUNTABILITY
JUNE 30, 2014CASH IN BANKS
135

EXHIBIT S-2
1 of 4
Interest Maturity Market Rate Date Value
Certificate of Deposit
JOHN MARSHALL BANK 0.45% 08/28/2014 $1,006,001
JOHN MARSHALL BANK 0.50% 12/11/2014 2,099,238
JOHN MARSHALL BANK 0.40% 10/23/2014 3,055,246
JOHN MARSHALL BANK 0.75% 10/01/2014 5,028,118
JOHN MARSHALL BANK 0.75% 10/25/2014 2,022,508
JOHN MARSHALL BANK 0.75% 12/14/2014 2,024,496
JOHN MARSHALL BANK 0.95% 04/02/2015 5,035,640
JOHN MARSHALL BANK 1.00% 02/08/2015 2,028,200
JOHN MARSHALL BANK 1.05% 10/01/2015 5,154,767
Total Certificates of Deposits 27,454,214
Corporate Notes
CREDIT SUISSE NEW YORK 0.520% 01/23/2015 4,005,720
AGRICULTURAL BK CHINA NY 0.810% 03/09/2015 5,017,450
PFIZER INC NOTE CALL MAKE WHOLE 5.350% 03/15/2015 2,586,000
ROYAL BK OF CDA MTN 0.475% 07/31/2017 497,300
ROYAL BK OF CDA MTN 0.475% 07/31/2017 6,962,200
MICROSOFT CORP NT 0.875% 11/15/2017 4,940,814
MICROSOFT CORP NT 0.875% 11/15/2017 49,626
CANADIAN IMPERIAL BANK 0.375% 11/16/2017 6,326,385
CANADIAN IMPERIAL BANK 0.375% 11/16/2017 4,866,450
CANADIAN IMPERIAL BANK 0.375% 11/16/2017 2,919,870
ROYAL BK OF CDA 0.387% 01/22/2018 4,907,450
INTL BK RECON & DEVELOP 0.800% 01/30/2018 5,000,000
DNB BOLIGKREDITT AS BOND 144A 1.450% 03/21/2018 4,976,400
GENERAL ELEC CAP CORP MTN BE 1.625% 04/02/2018 9,014,760
APPLE INC 1.000% 05/03/2018 4,889,800
ROYAL BK OF CDA BD CDS 1.000% 12/05/2018 1,682,558
CISCO SYSTEMS INC BOND 2.125% 03/01/2019 1,511,655
INTL FINANCE CORP GMTN 1.125% 03/15/2019 8,570,420
INTL FINANCE CORP MTN 1.125% 05/15/2019 2,981,670
PRICOA GLBL FDG I MTN 144A 2.200% 05/16/2019 2,003,680
WESTPAC BKG CORP 144A 2.000% 05/21/2019 999,560
WESTPAC BKG CORP 144A 2.000% 05/21/2019 4,997,800
COMMONWEALTH BANK AUSTRALIA 1.000% 06/10/2019 10,000,000
Total Corporate Notes 99,707,568
Commercial Paper
BANK OF CHINA/HONG KONG 0.00% 07/07/2014 4,997,828
BANK OF CHINA/HONG KONG 0.00% 07/07/2014 4,997,828
INSTIT SECD FNDG LLC 0.00% 07/18/2014 1,999,153
INSTIT SECD FNDG LLC 0.00% 07/18/2014 4,997,882
INSTIT SECD FNDG LLC 0.00% 07/18/2014 4,997,882
INSTIT SECD FNDG LLC 0.00% 07/18/2014 4,997,882
BANK OF CHINA/HONG KONG 0.00% 07/28/2014 4,996,814
INSTIT SECD FNDG LLC 0.00% 08/12/2014 4,997,201
INSTIT SECD FNDG LLC 0.00% 08/12/2014 4,997,201
ARLINGTON COUNTY, VIRGINIACOMBINED SCHEDULE OF INVESTMENTS-ALL FUNDS
JUNE 30, 2014
136

EXHIBIT S-2
2 of 4
Interest Maturity Market Rate Date Value
ARLINGTON COUNTY, VIRGINIACOMBINED SCHEDULE OF INVESTMENTS-ALL FUNDS
JUNE 30, 2014
INSTIT SECD FNDG LLC 0.00% 08/20/2014 4,996,694
INSTIT SECD FNDG LLC 0.00% 08/20/2014 4,996,694
ANGLESEA FUNDING LLC 0.00% 10/31/2014 4,993,208
SINOPEC CENTURY BRIGHT 0.00% 10/31/2014 4,991,389
BANK OF CHINA/HONG KONG 0.00% 11/10/2014 4,985,583
CNPC FINANCE HK LTD 0.00% 11/14/2014 4,991,767
CREDIT AGRI NORTH AMERICA 0.00% 11/17/2014 4,993,817
SUNCORP METWAY LTD 0.00% 11/25/2014 4,992,500
SHINHAN BANK NEW YORK 0.00% 11/26/2014 1,995,988
SHINHAN BANK NEW YORK 0.00% 11/26/2014 4,989,971
BANK OF CHINA/HONG KONG 0.00% 11/28/2014 4,984,750
NATIXIS US FINANCE CO 0.00% 11/28/2014 4,992,164
PIPER JAFFRAY & CO 0.00% 12/05/2014 4,960,771
SINOPEC CENTURY BRIGHT C 0.00% 12/18/2014 4,988,896
PIPER JAFFRAY & CO 0.00% 12/19/2014 5,959,400
CNPC FINANCE HK LTD 0.00% 12/26/2014 4,985,054
ANGELSEA FUNDING LLC 0.00% 01/02/2015 4,990,489
PIPER JAFFRAY & CO 0.00% 01/02/2015 4,964,555
SINOPEC CENTURY BRIGHT 0.00% 01/29/2015 4,982,986
CENTRAL AMERICAN BANK 0.00% 02/03/2015 4,988,140
CENTRAL AMERICAN BANK 0.00% 02/03/2015 4,988,140
BANK OF CHINA/HONG KONG 0.00% 02/13/2015 4,976,167
BPCE 0.00% 02/20/2015 9,976,622
CREDIT SUISSE NEW YORK 0.00% 02/24/2015 4,988,375
FORTIS FUNDING LLC 0.00% 02/24/2015 4,987,625
Total Commercial Paper 169,621,416
Government Agency Bonds
FEDERAL AGRICULTURAL MTG CORP 5.13% 04/19/2017 2,225,940
FEDERAL FARM CREDIT BANK 0.70% 08/09/2017 3,473,995
FEDERAL NATIONAL MTG ASSN 0.70% 12/26/2017 2,597,686
FEDERAL HOME LOAN MTG CORP 0.90% 12/28/2017 4,948,350
FEDERAL HOME LOAN MTG CORP 0.88% 01/03/2018 986,910
FEDERAL HOME LOAN MTG CORP 1.00% 01/30/2018 493,085
FEDERAL NATIONAL MTG ASSN 0.70% 01/30/2018 2,972,461
FEDERAL NATIONAL MTG ASSN 0.70% 01/30/2018 1,745,572
FEDERAL NATIONAL MTG ASSN 0.70% 01/30/2018 1,989,180
FEDERAL NATIONAL MTG ASSN 0.70% 01/30/2018 1,989,180
FEDERAL NATIONAL MTG ASSN 0.70% 02/13/2018 1,554,883
FEDERAL NATIONAL MTG ASSN 0.70% 02/13/2018 4,983,600
FEDERAL NATIONAL MTG ASSN 0.70% 02/28/2018 1,991,200
FEDERAL FARM CREDIT BANK 1.03% 03/12/2018 2,984,460
FEDERAL HOME LN MTG CORP 1.05% 04/25/2018 983,080
FEDERAL HOME LOAN MTG CORP 1.02% 04/30/2018 5,906,760
FEDERAL FARM CREDIT BANK 0.95% 05/08/2018 495,050
FEDERAL NATL MTG ASSN 1.00% 05/21/2018 320,313
FEDERAL NATL MTG ASSN 1.00% 05/21/2018 182,332
FEDERAL NATIONAL MTG ASSN 1.05% 05/25/2018 1,977,700
FEDERAL FARM CREDIT BANK 1.88% 10/02/2018 903,276
FEDERAL HOME LN MTG CORP 1.14% 10/15/2018 196,574
137

EXHIBIT S-2
3 of 4
Interest Maturity Market Rate Date Value
ARLINGTON COUNTY, VIRGINIACOMBINED SCHEDULE OF INVESTMENTS-ALL FUNDS
JUNE 30, 2014
FEDERAL HOME LN MTG CORP 1.14% 10/15/2018 294,861
FEDERAL NATIONAL MTG ASSN 1.25% 10/17/2018 983,360
FEDERAL NATIONAL MTG ASSN 1.25% 10/17/2018 983,360
FEDERAL FARM CREDIT BANK 1.97% 10/23/2018 1,005,280
FEDERAL FARM CR BKS CONS BD 1.24% 11/13/2018 177,583
FEDERAL HOME LOAN MTG CORP 1.38% 12/18/2018 3,005,250
FEDERAL NATIONAL MTG ASSN 0.75% 12/27/2018 617,513
FEDERAL NATL MTG ASSN 1.93% 01/30/2019 2,003,020
FEDERAL NATL MTG ASSN PRIN ST 0.00% 02/01/2019 2,259,124
FEDERAL NATL MTG ASSN PRIN ST 0.00% 02/01/2019 329,832
FEDERAL NATL MTG ASSN PRIN ST 0.00% 02/01/2019 1,355,474
FEDERAL NATL MTG ASSN PRIN ST 0.00% 02/01/2019 722,920
FEDERAL NATL MTG ASSN PRIN ST 0.00% 02/01/2019 497,007
FEDERAL NATL MTG ASSN PRIN ST 0.00% 02/01/2019 664,182
FEDERAL NATL MTG ASSN PRIN ST 0.00% 02/01/2019 384,051
FEDERAL HOME LOAN MTG CORP 1.50% 02/28/2019 465,916
FEDERAL HOME LOAN MTG CORP 1.00% 05/28/2019 3,482,535
FEDERAL HOME LOAN MTG CORP 0.50% 05/28/2019 1,999,300
FEDERAL HOME LOAN MTG CORP 1.00% 05/28/2019 5,971,140
FEDERAL HOME LOAN MTG CORP 0.50% 06/05/2019 1,999,680
FEDERAL HOME LOAN MTG CORP 1.55% 06/17/2019 1,546,140
FEDERAL HOME LOAN MTG CORP 0.50% 06/19/2019 2,995,530
FEDERAL HOME LOAN MTG CORP 1.00% 06/19/2019 478,786
FEDERAL FARM CREDIT BANK 1.00% 06/26/2019 2,602,314
FEDERAL FARM CREDIT BANK 1.00% 06/26/2019 2,502,225
FEDERAL FARM CREDIT BANK 1.00% 06/26/2019 2,302,047
FEDERAL HOME LOAN MTG CORP 2.00% 06/26/2019 1,356,277
FEDERAL HOME LOAN MTG CORP 1.25% 06/26/2019 999,780
FEDERAL HOME LOAN MTG CORP 1.38% 06/26/2019 2,004,080
Total Government Agency Bonds 91,890,154
Municipal Obligations
VIRGINIA BEACH VA 2.00% 07/15/2014 100,063
MISSISSIPPI ST TAXABLE LOC GOVT CAP IMPT 5.50% 12/01/2014 40,840
VA ST CLG BLDG AUTH EDUCATNL FACS REV 3.00% 02/01/2015 228,267
VIRGINIA ST HSG DEV AUTH RENTAL HSG BDS 4.61% 03/01/2015 128,166
MAINE TOWN N Y VAR PURP BANS SER. 2014 1.25% 05/01/2015 775,307
VIRGINIA ST HSG DEV AUTH RENTAL HSG BDS 5.39% 07/01/2015 25,900
VIRGINIA ST HSG DEV AUTH RENTAL HSG BDS 5.17% 08/01/2015 103,652
FAIRFAX CNTY VA PUB IMPT 3.10% 10/01/2015 51,712
ROANOKE TXBL 1.00% 04/01/2016 352,730
VIRGINIA POLYTECH INST & UNV REVENUE 5.00% 06/01/2016 101,355
RICHMOND VA 5.00% 07/15/2016 156,980
ROANOKE VA PUB IMPT REF BDS SER. 2013B 0.83% 07/15/2016 130,176
LOUDOUN CNTY VA TXBL REF SER B 0.90% 12/01/2016 250,440
ROANOKE VA 5.00% 02/01/2017 107,557
VIRGINIA ST CLG BLDG AUTH EDUCTNL FACS REVENUE2.70% 02/01/2017 517,520
VIRGINIA ST CLG BLDG AUTH EDUCTNL FACS REVENUE2.70% 02/01/2017 305,337
VIRGINIA ST TAXABLE GO 3.45% 06/01/2017 294,734
ALEXANDRIA VA GO CAPIMPT BDS SER. 2009A 4.00% 07/01/2017 165,213
138
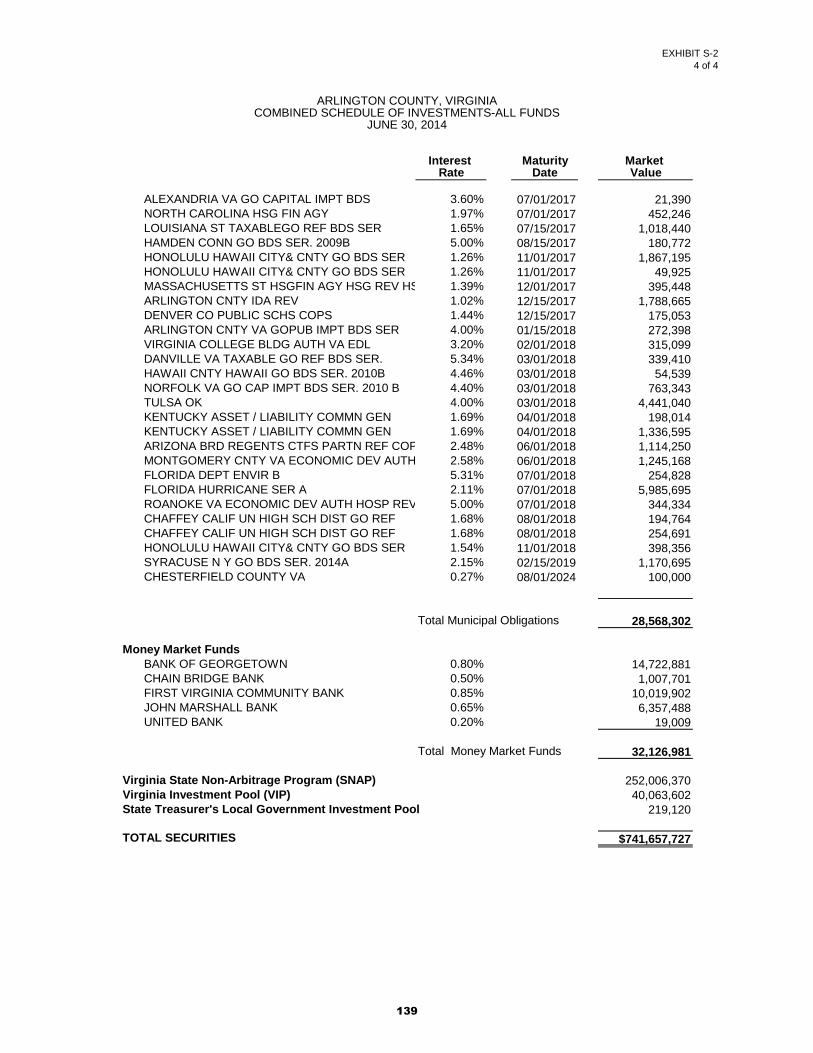
EXHIBIT S-2
4 of 4
Interest Maturity Market Rate Date Value
ARLINGTON COUNTY, VIRGINIACOMBINED SCHEDULE OF INVESTMENTS-ALL FUNDS
JUNE 30, 2014
ALEXANDRIA VA GO CAPITAL IMPT BDS 3.60% 07/01/2017 21,390
NORTH CAROLINA HSG FIN AGY 1.97% 07/01/2017 452,246
LOUISIANA ST TAXABLEGO REF BDS SER 1.65% 07/15/2017 1,018,440
HAMDEN CONN GO BDS SER. 2009B 5.00% 08/15/2017 180,772
HONOLULU HAWAII CITY& CNTY GO BDS SER 1.26% 11/01/2017 1,867,195
HONOLULU HAWAII CITY& CNTY GO BDS SER 1.26% 11/01/2017 49,925
MASSACHUSETTS ST HSGFIN AGY HSG REV HSG 1.39% 12/01/2017 395,448
ARLINGTON CNTY IDA REV 1.02% 12/15/2017 1,788,665
DENVER CO PUBLIC SCHS COPS 1.44% 12/15/2017 175,053
ARLINGTON CNTY VA GOPUB IMPT BDS SER 4.00% 01/15/2018 272,398
VIRGINIA COLLEGE BLDG AUTH VA EDL 3.20% 02/01/2018 315,099
DANVILLE VA TAXABLE GO REF BDS SER. 5.34% 03/01/2018 339,410
HAWAII CNTY HAWAII GO BDS SER. 2010B 4.46% 03/01/2018 54,539
NORFOLK VA GO CAP IMPT BDS SER. 2010 B 4.40% 03/01/2018 763,343
TULSA OK 4.00% 03/01/2018 4,441,040
KENTUCKY ASSET / LIABILITY COMMN GEN 1.69% 04/01/2018 198,014
KENTUCKY ASSET / LIABILITY COMMN GEN 1.69% 04/01/2018 1,336,595
ARIZONA BRD REGENTS CTFS PARTN REF COPS 2.48% 06/01/2018 1,114,250
MONTGOMERY CNTY VA ECONOMIC DEV AUTH 2.58% 06/01/2018 1,245,168
FLORIDA DEPT ENVIR B 5.31% 07/01/2018 254,828
FLORIDA HURRICANE SER A 2.11% 07/01/2018 5,985,695
ROANOKE VA ECONOMIC DEV AUTH HOSP REV 5.00% 07/01/2018 344,334
CHAFFEY CALIF UN HIGH SCH DIST GO REF 1.68% 08/01/2018 194,764
CHAFFEY CALIF UN HIGH SCH DIST GO REF 1.68% 08/01/2018 254,691
HONOLULU HAWAII CITY& CNTY GO BDS SER 1.54% 11/01/2018 398,356
SYRACUSE N Y GO BDS SER. 2014A 2.15% 02/15/2019 1,170,695
CHESTERFIELD COUNTY VA 0.27% 08/01/2024 100,000
Total Municipal Obligations 28,568,302
Money Market Funds
BANK OF GEORGETOWN 0.80% 14,722,881
CHAIN BRIDGE BANK 0.50% 1,007,701
FIRST VIRGINIA COMMUNITY BANK 0.85% 10,019,902
JOHN MARSHALL BANK 0.65% 6,357,488
UNITED BANK 0.20% 19,009
Total Money Market Funds 32,126,981
Virginia State Non-Arbitrage Program (SNAP) 252,006,370
Virginia Investment Pool (VIP) 40,063,602
State Treasurer's Local Government Investment Pool 219,120
TOTAL SECURITIES $741,657,727
139

ARLINGTON COUNTY, VIRGINIA
COMBINED SCHEDULE OF LONG-TERM OBLIGATIONS
JUNE 30, 2014
EXHIBIT S-3
1 of 13
Amount Date of Interest Annual Maturity
Outstanding* Bonds Rate - % Payments* Amount Date
General Obligation Debt:
Serviced by General Fund:
G.O. Public Improvement Refunding ($81,005,000) 5/15/04
Street & Highway $14,619,000 5.00 5,278,940 5,278,940 11/1/14
Neighborhood Conservation 9,027,730
Libraries 1,056,200 $5,278,940
Fire Station 282,150
Higher Education 113,500
Parks and Recreation 15,694,000
Metrorail 3,696,802
$44,489,382
G.O. Public Improvement ($94,525,000) 05/19/05
Parks and Recreation $29,810,850 5.00 2,730,000 2,730,000 5/15/15
Neighborhood Conservation 13,030,962
Higher Education 1,000,000 $2,730,000
Fire Station 2,935,000
Metrorail 5,518,188
$52,295,000
G.O. Public Improvement ($61,335,000) 3/21/06
Street & Highway $9,251,218 5.00 9,160,000 2,290,000 8/1/14-17
Parks and Recreation 13,600,000
Neighborhood Conservation 5,690,578 $9,160,000
Fire Station 6,690,455
Metrorail 8,602,749
$43,835,000
G.O. Public Improvement Refunding ($89,970,000) 3/21/06
Street & Highway $6,167,233 5.00 3,419,214 3,419,214 08/01/14
Neighborhood Conservation 4,964,155 5.00 5,112,625 5,112,625 08/01/15
Parks and Recreation 17,209,390 5.00 5,119,615 5,119,615 08/01/16
Libraries 1,920,866 5.00 3,050,565 3,050,565 08/01/17
Higher Education 2,028,391
Fire Station 2,638,292 $16,702,019
Metrorail 12,758,305
$47,686,632
G.O. Public Improvement ($117,360,000) 6/6/07
Street & Highway $12,530,000 5.00 3,460,000 1,730,000 3/15/15-16
Neighborhood Conservation 4,000,000
Government Facility Bond 2,200,000 $3,460,000
Parks and Recreation 14,500,000
$33,230,000
G.O. Public Improvement ($111,185,000) 6/18/08
Street & Highway $9,000,572 5.00 5,112,000 1,704,000 01/15/15-17
Neighborhood Conservation 2,019,854
Parks and Recreation 6,700,000 $5,112,000
Library 6,000,000
Metro 8,980,574
$32,701,000
G.O. Public Improvement ($39,217,322) 8/15/10
Neighborhood Conservation $4,817,322 2.25 775,000 775,000 08/15/14
Parks and Recreation 2,050,000 5.00 775,000 775,000 08/15/15
Metro 8,000,000 4.00 775,000 775,000 08/15/16
$14,867,322 5.00 775,000 775,000 08/15/17
3.00 595,312 595,312 08/15/18
3.125 775,000 775,000 08/15/20
3.625 475,000 775,000 08/15/24
4.00 770,000 770,000 08/15/28
4.00 770,000 770,000 08/15/29
$6,485,312
140

ARLINGTON COUNTY, VIRGINIA
COMBINED SCHEDULE OF LONG-TERM OBLIGATIONS
JUNE 30, 2014
EXHIBIT S-3
2 of 13
Amount Date of Interest Annual Maturity
Outstanding* Bonds Rate - % Payments* Amount Date
G.O. Public Improvement Refunding ($41,262,678) 8/15/09
Street & Highway $9,122,919 2.25 1,597,871 1,597,871 08/15/14
Neighborhood Conservation 2,195,414 4.00 2,797,477 2,797,477 08/15/16
Parks and Recreation 10,465,543 5.00 2,794,665 2,794,665 08/15/17
Fire 1,575,576 3.00 2,783,419 2,783,419 08/15/18
Library 145,744
Metro 4,401,924 $9,973,432
$27,907,120
G.O. Public Improvement ($65,650,000) 8/15/09
Street & Highway $5,519,144 4.00 2,863,081 2,863,081 08/01/14
Neighborhood Conservation 2,769,159 4.00 4,240,576 4,240,576 08/01/15
Government Facility Bond 653,173 5.00 1,514,633 1,514,633 08/01/16
Parks and Recreation 10,466,863 5.00 3,480,479 3,480,479 08/01/17
Fire 1,686,726 5.00 4,666,617 4,666,617 08/01/18
Library 1,130,373 5.00 1,694,502 1,694,502 08/01/19
Metro 4,934,823 5.00 1,695,615 1,695,615 08/01/20
$27,160,261
$20,155,503
G.O. Public Improvement ($73,415,000) 7/27/10
Street & Highway $7,150,000 4.00 1,270,000 1,270,000 08/15/14
Neighborhood Conservation 6,900,000 5.00 3,810,000 1,270,000 08/15/15-17
Government Facility Bond 1,270,000 2.00 1,270,000 1,270,000 08/15/18
Parks and Recreation 1,500,000 2.125 1,270,000 1,270,000 08/15/19
Metro 7,542,000 3.693 1,270,000 1,270,000 08/15/20
$24,362,000 3.993 1,270,000 1,270,000 08/15/21
4.193 1,270,000 1,270,000 08/15/22
4.393 1,270,000 1,270,000 08/15/23
4.593 1,270,000 1,270,000 08/15/24
4.693 1,270,000 1,270,000 08/15/25
5.301 6,325,000 1,265,000 08/15/26-30
$21,565,000
G.O. Public Improvement Refunding (65,870,000) 7/27/10
Street & Highway $5,661,131 4.00 1,667,350 1,667,350 08/15/16
Neighborhood Conservation 2,906,731 4.00 4,732,544 4,732,544 08/15/17
Government Facility Bond 1,167,608 5.00 3,596,516 3,596,516 08/15/18
Parks and Recreation 11,120,617 4.00 2,405,957 2,405,957 08/15/19
Fire 1,486,736 5.00 7,087,694 7,087,694 08/15/20
Library 2,204,188 5.00 6,995,352 6,995,352 08/15/21
Metro 3,577,903 3.00 1,639,501 1,639,501 08/15/22
$28,124,914
$28,124,914
G.O. Public Improvement ($127,000,000) 6/28/11
Street & Highway $10,669,428 4.00 3,685,000 3,685,000 08/15/14
Neighborhood Conservation 6,400,000 2.00/4.00 3,685,000 3,685,000 08/15/15
Government Facility Bond 4,675,000 4.00 3,685,000 3,685,000 08/15/16
Parks and Recreation 39,005,572 4.00/5.00 3,685,000 3,685,000 08/15/17
Metro 10,000,000 4.00 3,685,000 3,685,000 08/15/18
$70,750,000 5.00 3,685,000 3,685,000 08/15/19
3.00/5.00 3,685,000 3,685,000 08/15/20
4.00/5.00 1,632,130 1,632,130 08/15/21
4.00/5.00 3,614,352 3,614,352 08/15/23
3.00/3.25 3,685,000 3,685,000 08/15/24
3.40 3,685,000 3,685,000 08/15/25
3.55 3,685,000 3,685,000 08/15/26
4.00 11,055,000 3,685,000 08/15/28-30
4.00/3.875/5.00 3,685,000 3,685,000 08/15/31
$56,836,482
141

ARLINGTON COUNTY, VIRGINIA
COMBINED SCHEDULE OF LONG-TERM OBLIGATIONS
JUNE 30, 2014
EXHIBIT S-3
3 of 13
Amount Date of Interest Annual Maturity
Outstanding* Bonds Rate - % Payments* Amount Date
G.O. Public Improvement Refunding ($106,445,000) 2/22/12
Street & Highway $6,073,372 4.00/3.00 5,760,000 5,760,000 08/01/19
Neighborhood Conservation 4,851,013 4.00/3.00 3,165,000 3,165,000 08/01/21
Government Facility Bond 959,373 5.00 11,955,000 11,955,000 08/01/22
Parks and Recreation 15,124,026 5.00 9,240,000 9,240,000 08/15/23
Fire Station 1,349,591 5.00 7,175,000 7,175,000 08/15/24
Library 1,152,494 5.00 2,280,000 2,280,000 08/15/25
Metro 10,065,131
$39,575,000 $39,575,000
G.O. Public Improvement Refunding ($4,535,000) 2/22/12
Street & Highway $521,221 0.50 1,120,000 1,120,000 01/15/15
Neighborhood Conservation 436,906
Parks and Recreation 1,221,550 $1,120,000
Fire Station 68,750
Library 60,527
Metro 1,046
$2,310,000
G.O. Public Improvement Refunding ($108,140,000) 6/20/12
Street & Highway $6,150,000 5.00 355,950 355,950 08/15/15
Neighborhood Conservation 4,000,000 5.00 3,559,500 3,559,500 08/15/16
Government Facility Bond 4,435,000 5.00 2,313,675 2,313,675 08/15/17
Parks and Recreation 11,010,000 5.00 7,830,900 1,957,725 08/15/18-21
Metro 10,000,000 5.00 1,957,725 1,957,725 08/15/26
$35,595,000 4.00 7,830,900 1,957,725 08/15/27-30
5.00 3,915,450 1,957,725 08/15/31-32
$27,764,100
G.O. Public Improvement ($93,975,000) 5/9/13
Street & Highway $11,190,000 3.00 2,165,000 2,165,000 08/01/14
Neighborhood Conservation 4,000,000 4.00 6,545,000 6,545,000 08/01/15
Government Facility Bond 11,395,000 4.00 2,485,000 2,485,000 08/01/16
Parks and Recreation 15,410,000 5.00 14,910,000 2,485,000 08/01/17-22
Metro 10,000,000 5.00 7,440,000 2,480,000 08/01/25-27
$51,995,000 4.00 12,400,000 2,480,000 08/01/28-32
$45,945,000
G.O. Public Improvement Refunding ($30,320,000) 5/9/13
Street & Highway $2,411,674 4.00 230,000 230,000 08/01/24
Neighborhood Conservation 982,015 5.00 2,830,000 2,830,000 08/01//25
Government Facility Bond 380,957 5.00 4,980,000 4,980,000 08/01/26
Parks and Recreation 3,618,568 4.00 3,000,000 3,000,000 08/01/27
Fire station 164,926
Library 457,644 $11,040,000
Metro 3,024,216
$11,040,000
G.O. Public Improvement Refunding ($81,255,000) 5/9/13
Street & Highway $10,194,261 0.320 1,080,000 1,080,000 08/01/14
Neighborhood Conservation 6,878,456 0.450 6,235,000 6,235,000 08/01/15
Parks and Recreation 15,956,083 0.606 6,005,000 6,005,000 08/01/16
Fire station 1,564,102 0.776 2,430,000 2,430,000 08/01/17
Library 1,591,281 1.076 6,610,000 6,610,000 08/01/18
Metro 8,060,817 1.339 6,335,000 6,335,000 08/01/19
$44,245,000 1.659 6,275,000 6,275,000 08/01/20
1.925 3,310,000 3,310,000 08/01/21
2.075 2,245,000 2,245,000 08/01/22
2.225 1,345,000 1,345,000 08/01/23
2.320 880,000 880,000 08/01/24
2.470 860,000 860,000 08/01/25
2.620 635,000 635,000 08/01/26
$44,245,000
142

ARLINGTON COUNTY, VIRGINIA
COMBINED SCHEDULE OF LONG-TERM OBLIGATIONS
JUNE 30, 2014
EXHIBIT S-3
4 of 13
Amount Date of Interest Annual Maturity
Outstanding* Bonds Rate - % Payments* Amount Date
G.O. Public Improvement ($64,910,000) 5/28/14
Street & Highway $7,405,000 5.000 555,000 555,000 02/15/15
Neighborhood Conservation 5,000,000 5.000 1,115,000 1,115,000 02/15/16
Parks and Recreation 3,640,000 5.000 9,765,000 1,395,000 02/15/2017-23
Government Facility Bond 5,705,000 3.000 1,395,000 1,395,000 02/15/24
Metro 5,000,000 3.000 1,390,000 1,390,000 02/15/25
$26,750,000 3.000 2,790,000 1,395,000 02/15/2026-27
4.000 1,395,000 1,395,000 02/15/28
3.000 1,395,000 1,395,000 02/15/29
3.750 6,950,000 1,390,000 02/15/2030-34
$26,750,000
G.O. Public Improvement Refunding ($40,455,000) 5/28/14
Street & Highway $7,405,000 5.000 1,940,000 1,940,000 02/15/21
Neighborhood Conservation 5,000,000 5.000 1,885,000 1,885,000 02/15/22
Parks and Recreation 3,640,000 5.000 8,720,000 4,360,000 02/15/2023-24
Government Facility Bond 5,705,000 5.000 1,875,000 1,875,000 02/15/25
Metro 5,000,000 5.000 3,545,000 3,545,000 02/15/27
$26,750,000
$17,965,000
SUBTOTAL: 399,987,702$
FY 2004 Bond Premium/Cost of Refunding to be amortized 1,106,170
FY 2005 Bond Premium/Cost of Refunding to be amortized 2,365,119
FY 2006 Bond Premium/Cost of Refunding to be amortized 233,383
FY 2007 Bond Premium/Cost of Refunding to be amortized 292,820
FY 2008 Bond Premium/Cost of Refunding to be amortized 1,044,051
FY 2010 Bond Premium/Cost of Refunding to be amortized 2,095,786
FY 2011 Bond Premium/Cost of Refunding to be amortized 5,974,309
FY 2012 Bond Premium/Cost of Refunding to be amortized 8,032,087
FY 2013 Bond Premium/Cost of Refunding to be amortized 6,411,721
FY 2014 Bond Premium/Cost of Refunding to be amortized $3,010,842
Total GO Bonds Serviced by General Fund: $430,553,990
IDA Revenue Bond ($41,280,000) 12/15/10
Metro Matters $26,000,000 2.00 1,240,000 1,240,000 12/15/14
Buckingham Village I 15,280,000 2.50 1,265,000 1,265,000 12/15/15
$41,280,000 2.75 1,295,000 1,295,000 12/15/16
4.70 1,330,000 1,330,000 12/15/17
4.90 1,370,000 1,370,000 12/15/18
5.00 1,415,000 1,415,000 12/15/19
5.10 1,460,000 1,460,000 12/15/20
5.20 1,510,000 1,510,000 12/15/21
5.30 1,560,000 1,560,000 12/15/22
5.40 1,615,000 1,615,000 12/15/23
6.00 1,670,000 1,670,000 12/15/24
6.00 1,735,000 1,735,000 12/15/25
6.00 1,805,000 1,805,000 12/15/26
6.00 1,875,000 1,875,000 12/15/27
6.00 1,950,000 1,950,000 12/15/28
6.00 2,025,000 2,025,000 12/15/29
6.20 2,110,000 2,110,000 12/15/30
6.20 2,195,000 2,195,000 12/15/31
6.20 2,285,000 2,285,000 12/15/32
6.20 2,380,000 2,380,000 12/15/33
6.20 2,475,000 2,475,000 12/15/34
$36,565,000
143

ARLINGTON COUNTY, VIRGINIA
COMBINED SCHEDULE OF LONG-TERM OBLIGATIONS
JUNE 30, 2014
EXHIBIT S-3
5 of 13
Amount Date of Interest Annual Maturity
Outstanding* Bonds Rate - % Payments* Amount Date
IDA Revenue Bond ($11,940,000) 12/15/10
FS #3, Arlington Mill and Buckingham Park $11,940,000 3.00 2,500,000 625,000 2/15/15-18
4.00 625,000 625,000 2/15/19
4.00 2,480,000 620,000 2/15/20-23
4.125 620,000 620,000 2/15/24
4.375 620,000 620,000 2/15/25
4.50 620,000 620,000 2/15/26
4.625 620,000 620,000 2/15/27
4.75 620,000 620,000 2/15/28
5.00 1,860,000 620,000 2/15/29-31
$10,565,000
IDA Revenue Bond ($76,315,000) 6/3/13
Refunding 2004 IDA $23,930,000 5.00/.50 7,780,000 7,780,000 12/15/14
$2,020 20,250,000 3.00/.75 3,040,000 3,040,000 12/15/15
Buckingham Village 3 $32,135,000 3.00/.832 3,025,000 3,025,000 12/15/16
$76,315,000 5.00/1.02 3,005,000 3,005,000 12/15/17
5.00/1.37 3,010,000 3,010,000 12/15/18
5.00/1.74 3,020,000 3,020,000 12/15/19
5.00/1.99 3,030,000 3,030,000 12/15/20
5.00/2.43 3,040,000 3,040,000 12/15/21
5.00/2.58 3,055,000 3,055,000 12/15/22
5.00/2.73 3,060,000 3,060,000 12/15/23
5.00/2.93 3,080,000 3,080,000 12/15/24
3.08 1,955,000 1,955,000 12/15/25
3.48 1,985,000 1,985,000 12/15/26
3.48 2,015,000 2,015,000 12/15/27
3.48 2,050,000 2,050,000 12/15/28
4.01 2,085,000 2,085,000 12/15/29
4.01 2,130,000 2,130,000 12/15/30
4.01 2,175,000 2,175,000 12/15/31
4.01 2,220,000 2,220,000 12/15/32
4.11 1,205,000 1,205,000 12/15/33
4.11 1,255,000 1,255,000 12/15/34
4.11 1,310,000 1,310,000 12/15/35
4.11 1,365,000 1,365,000 12/15/36
4.11 1,420,000 1,420,000 12/15/37
4.11 1,480,000 1,480,000 12/15/38
4.11 1,545,000 1,545,000 12/15/39
4.11 1,610,000 1,610,000 12/15/40
4.11 1,675,000 1,675,000 12/15/41
4.11 1,745,000 1,745,000 12/15/42
$69,370,000
Total IDA Revenue Bonds Serviced by General Fund $116,500,000
Compensated Absences 33,406,745
Estimated Liability for Workers' Comp Claims & Other Judgments 3,363,121
Capital Leases 14,315,564
Total Long Term Obligations Serviced by General Fund: $598,139,420
Long Term Obligations:
Due in one year $52,299,170
Due in more than one year $545,840,250
144

ARLINGTON COUNTY, VIRGINIA
COMBINED SCHEDULE OF LONG-TERM OBLIGATIONS
JUNE 30, 2014
EXHIBIT S-3
6 of 13
Amount Date of Interest Annual Maturity
Outstanding* Bonds Rate - % Payments* Amount Date
Serviced by School Operating Fund:
G.O. Public Improvement Refunding ($81,005,000) 08/19/04
School Improvements $33,598,820 5.00 4,082,829 4,082,829 11/01/14
$4,082,829
G.O. Public Improvement ($94,525,000) 06/01/05
School Improvements $36,230,000 5.00 $1,810,000 1,810,000 5/15/15
$1,810,000
G.O. Public Improvement ($61,335,000) 3/21/06
School Improvements $17,500,000 5.00 3,500,000 875,000 8/1/14-17
$3,500,000
G.O. Public Improvement Refunding ($89,970,000) 3/21/06
School Improvements $39,169,607 5.00 2,798,007 2,798,007 08/01/14
5.00 4,002,279 4,002,279 08/01/15
5.00 4,007,190 4,007,190 08/01/16
5.00 2,482,380 2,482,380 08/01/17
$13,289,856
G.O. Public Improvement ($117,360,000) 6/6/07
School Improvements $16,630,000 5.00 1,660,000 830,000 3/15/15-16
$1,660,000
G.O. Public Improvement ($111,185,000) 6/18/08
School Improvements $51,076,000 5.00 2,552,000 2,552,000 01/15/15
5.00 5,110,000 2,555,000 01/15/2016-17
$7,662,000
G.O. Public Improvement ($39,217,322) 8/15/09
School Improvements $24,350,000 2.25 1,220,000 1,220,000 08/15/14
5.00 1,220,000 1,220,000 08/15/15
4.00 1,220,000 1,220,000 08/15/16
5.00 1,220,000 1,220,000 08/15/17
3.00 939,688 939,688 08/15/18
3.125 1,215,000 1,215,000 08/15/20
3.625 745,000 1,215,000 08/15/24
4.00 1,215,000 1,215,000 08/15/28
4.00 1,215,000 1,215,000 08/15/29
$10,209,688
G.O. Public Improvement Refunding ($41,262,678) 8/15/09
School Improvements $11,455,110 2.25 192,415 192,415 08/15/14
4.00 1,854,737 1,854,737 08/15/16
5.00 1,852,873 1,852,873 08/15/17
3.00 1,845,418 1,845,418 08/15/18
$5,745,443
G.O. Public Improvement Refunding ($65,650,000) 8/15/09
School Improvements $27,608,536 4.00 2,763,193 2,763,193 08/15/14
4.00 3,412,263 3,412,263 08/15/15
5.00 1,471,266 1,471,266 08/15/16
5.00 2,651,482 2,651,482 08/15/17
5.00 4,631,381 4,631,381 08/15/18
5.00 2,540,397 2,540,397 08/15/19
5.00 2,544,916 2,544,916 08/15/20
$20,014,898
145

ARLINGTON COUNTY, VIRGINIA
COMBINED SCHEDULE OF LONG-TERM OBLIGATIONS
JUNE 30, 2014
EXHIBIT S-3
7 of 13
Amount Date of Interest Annual Maturity
Outstanding* Bonds Rate - % Payments* Amount Date
Schools- QSCB ($3,390,000) 07/06/10
School Improvements $3,390,000 5.31 2,600,000 200,000 08/01/14-27
$2,600,000
G.O. Public Improvement ($73,415,000) 7/27/10
School Improvements $30,703,000 4.00 1,535,000 1,535,000 08/15/14
5.00 4,605,000 1,535,000 08/15/15-17
2.00 1,535,000 1,535,000 08/15/18
2.125 1,535,000 1,535,000 08/15/19
3.693 1,535,000 1,535,000 08/15/20
3.993 1,535,000 1,535,000 08/15/21
4.193 1,535,000 1,535,000 08/15/22
4.393 1,535,000 1,535,000 08/15/23
4.593 1,535,000 1,535,000 08/15/24
4.693 1,535,000 1,535,000 08/15/25
5.301 7,675,000 1,535,000 08/15/26-30
$26,095,000
G.O. Public Improvement Refunding ($65,870,000) 7/27/10
School Improvements $25,408,254 4.00 799,942 799,942 08/15/16
4.00 4,991,847 4,991,847 08/15/17
5.00 2,713,871 2,713,871 08/15/18
4.00 2,734,043 2,734,043 08/15/19
5.00 5,201,560 5,201,560 08/15/20
5.00 6,061,492 6,061,492 08/15/21
3.00 1,550,499 1,550,499 08/15/22
3.125 1,355,000 1,355,000 08/15/23
$25,408,254
G.O. Public Improvement ($127,000,000) 6/28/11
School Improvements $44,450,000 4.00 2,225,000 2,225,000 08/15/14
2.00/4.00 2,225,000 2,225,000 08/15/15
4.00 2,225,000 2,225,000 08/15/16
4.00/5.00 2,225,000 2,225,000 08/15/17
4.00 2,225,000 2,225,000 08/15/18
5.00 2,225,000 2,225,000 08/15/19
3.00/5.00 2,225,000 2,225,000 08/15/20
4.00/5.00 985,479 985,479 08/15/21
4.00/5.00 2,177,440 2,177,440 08/15/23
3.00/3.25 2,220,000 2,220,000 08/15/24
3.40 2,220,000 2,220,000 08/15/25
3.55 2,220,000 2,220,000 08/15/26
4.00 6,660,000 2,220,000 08/15/28-30
4.00/3.875/5.00 2,220,000 2,220,000 08/15/31
$34,277,919
G.O. Public Improvement Refunding ($106,445,000) 2/22/12
School Improvements $39,255,000 4.00/3.00 3,065,000 3,065,000 08/01/19
4.00/3.00 3,125,000 3,125,000 08/01/21
5.00 9,015,000 9,015,000 08/01/22
5.00 7,650,000 7,650,000 08/15/23
5.00 7,525,000 7,525,000 08/15/24
5.00 3,365,000 3,365,000 08/15/25
3,770,000 3,770,000 08/15/26
1,740,000 1,740,000 08/15/27
$39,255,000
G.O. Public Improvement Refunding ($4,535,000) 2/22/12
School Improvements $2,225,000 0.50 1,095,000 1,095,000 01/15/15
$1,095,000
146

ARLINGTON COUNTY, VIRGINIA
COMBINED SCHEDULE OF LONG-TERM OBLIGATIONS
JUNE 30, 2014
EXHIBIT S-3
8 of 13
Amount Date of Interest Annual Maturity
Outstanding* Bonds Rate - % Payments* Amount Date
G.O. Public Improvement Refunding ($108,140,000) 6/20/12
School Improvements $65,145,000 5.00 3,255,000 3,255,000 08/15/14
5.00 3,259,050 3,259,050 08/15/15
5.00 3,255,500 3,255,500 08/15/16
5.00 3,256,325 3,256,325 08/15/17
5.00 13,029,100 3,257,275 08/15/18-21
5.00 3,257,275 3,257,275 08/15/26
4.00 13,029,100 3,257,275 08/15/27-30
5.00 6,514,550 3,257,275 08/15/31-32
$48,855,900
G.O. Public Improvement ($93,975,000) 5/9/13
School Improvements $38,380,000 3.00 1,920,000 1,920,000 08/01/14
4.00 3,830,000 1,915,000 08/01/15-16
5.00 9,600,000 1,920,000 08/01/17-21
5.00 7,680,000 1,920,000 08/01/24-27
4.00 7,680,000 1,920,000 08/01/28-31
4.00 1,915,000 1,915,000 08/01/32
$32,625,000
G.O. Public Improvement Refunding ($30,320,000) 5/9/13
School Improvements $11,590,000 4.00 240,000 240,000 08/01/24
5.00 2,975,000 2,975,000 08/01//25
5.00 5,225,000 5,225,000 08/01/26
4.00 3,150,000 3,150,000 08/01/27
$11,590,000
G.O. Public Improvement Refunding ($81,255,000) 5/9/13
School Improvements $33,505,000 0.320 835,000 835,000 08/01/14
0.450 4,825,000 4,825,000 08/01/15
0.606 4,645,000 4,645,000 08/01/16
0.776 2,630,000 2,630,000 08/01/17
1.076 5,845,000 5,845,000 08/01/18
1.339 4,885,000 4,885,000 08/01/19
1.659 3,840,000 3,840,000 08/01/20
1.925 1,655,000 1,655,000 08/01/21
2.075 1,325,000 1,325,000 08/01/22
2.225 525,000 525,000 08/01/23
2.320 925,000 925,000 08/01/24
2.470 900,000 900,000 08/01/25
2.620 670,000 670,000 08/01/26
$33,505,000
G.O. Public Improvement ($64,910,000) 5/28/14
School Improvements $36,460,000 5.000 1,820,000 1,820,000 02/15/15
5.000 1,820,000 1,820,000 02/15/16
5.000 12,775,000 1,825,000 02/15/2017-23
3.000 1,825,000 1,825,000 02/15/24
3.000 1,825,000 1,825,000 02/15/25
3.000 3,650,000 1,825,000 02/15/2026-27
4.000 1,825,000 1,825,000 02/15/28
3.000 1,820,000 1,820,000 02/15/29
3.750 9,100,000 1,820,000 02/15/2030-34
$36,460,000
147

ARLINGTON COUNTY, VIRGINIA
COMBINED SCHEDULE OF LONG-TERM OBLIGATIONS
JUNE 30, 2014
EXHIBIT S-3
9 of 13
Amount Date of Interest Annual Maturity
Outstanding* Bonds Rate - % Payments* Amount Date
G.O. Public Improvement Refunding ($40,455,000) 5/28/14
School Improvements $19,725,000 5.000 1,170,000 1,170,000 02/15/21
5.000 3,135,000 3,135,000 02/15/22
5.000 10,170,000 5,085,000 02/15/2023-24
5.000 3,115,000 3,115,000 02/15/25
5.000 2,135,000 2,135,000 02/15/27
$19,725,000
SUB TOTAL $379,466,787
FY 2004 Bond Premium/Cost of Refunding to be amortized 726,188
FY 2005 Bond Premium/Cost of Refunding to be amortized 1,113,495
FY 2006 Bond Premium/Cost of Refunding to be amortized 257,312
FY 2007 Bond Premium/Cost of Refunding to be amortized 167,177
FY 2008 Bond Premium/Cost of Refunding to be amortized 1,685,490
FY 2010 Bond Premium/Cost of Refunding to be amortized 656,063
FY 2011 Bond Premium/Cost of Refunding to be amortized 4,383,419
FY 2012 Bond Premium/Cost of Refunding to be amortized 12,874,685
FY 2013 Bond Premium/Cost of Refunding to be amortized 2,530,613
FY 2014 Bond Premium/Cost of Refunding to be amortized 3,864,414
Total Serial Bonds Serviced by School Operating Fund: 407,725,643
Compensated Absences 33,399,887
Capital Leases 4,563,018
Total Long Term Obligations Serviced by School Operating Fund: $445,688,548
Long Term Obligations - Schools:
Due in one year $37,045,112
Due in more than one year $408,643,436
Total Long Term Obligations Serviced by General Fund and School Operating Fund: $954,483,686
148

ARLINGTON COUNTY, VIRGINIA
COMBINED SCHEDULE OF LONG-TERM OBLIGATIONS
JUNE 30, 2014
EXHIBIT S-3
10 of 13
Amount Date of Interest Annual Maturity
Outstanding* Bonds Rate - % Payments* Amount Date
Serviced by Utilities Fund:
G.O. Public Improvement Refunding ($81,005,000) 08/19/04
Water/sewer share $2,916,798 5.00 298,231 298,231 11/01/14
$298,231
G.O. Public Improvement ($94,525,000) 06/01/05
Water share $6,000,000 5.00 $315,000 315,000 5/15/15
$315,000
G.O. Public Improvement Refunding ($89,970,000) 3/21/06
Water share $1,211,244 5.00 377,779 377,779 08/01/14
Sewer share 487,761 5.00 435,096 435,096 08/01/15
Advanced Water Treatment 1,414,755 5.00 433,194 433,194 08/01/16
$3,113,760 5.00 222,055 222,055 08/01/17
$1,468,124
G.O. Public Improvement ($117,360,000) 6/6/07
Water share $9,000,000 5.00 7,030,000 3,515,000 3/15/15-16
Sewer share 10,000,000
Advanced Water Treatment 48,500,000 $7,030,000
$67,500,000
G.O. Public Improvement ($111,185,000) 6/18/08
Advanced Water Treatment $27,408,000 5.00 1,134,000 1,134,000 01/15/15
5.00 1,191,000 1,191,000 01/15/16
5.00 1,251,000 1,251,000 01/15/17
$3,576,000
G.O. Public Improvement Refunding ($41,262,678) 8/15/09
Water share $1,327,147 2.25 39,714 39,714 08/15/14
Advanced Water Treatment 573,301 4.00 322,786 322,786 08/15/16
$1,900,448 5.00 322,461 322,461 08/15/17
3.00 321,164 321,164 08/15/18
$1,006,125
G.O. Public Improvement Refunding ($65,650,000) 8/15/09
Water share $1,765,156 2.25 273,727 273,727 08/01/14
Sewer share 953,197 5.00 557,161 557,161 08/01/15
Advanced Water Treatment 8,162,851 4.00 234,101 234,101 08/01/16
$10,881,204 5.00 3,343,039 3,343,039 08/01/17
3.00 1,502,001 1,502,001 08/01/18
4.00 1,430,101 1,430,101 08/01/19
3.125 1,499,469 1,499,469 08/01/20
$8,839,599
G.O. Public Improvement ($73,415,000) 7/27/10
Water share $4,000,000 4.00 960,000 960,000 08/15/14
Advanced Water Treatment 14,350,000 5.00 2,865,000 955,000 08/15/15-17
$18,350,000 2.00 960,000 960,000 08/15/18
2.125 955,000 955,000 08/15/19
3.693 955,000 955,000 08/15/20
3.993 955,000 955,000 08/15/21
4.193 955,000 955,000 08/15/22
4.393 955,000 955,000 08/15/23
4.593 955,000 955,000 08/15/24
4.693 955,000 955,000 08/15/25
5.301 4,775,000 955,000 08/15/26-30
$16,245,000
149

ARLINGTON COUNTY, VIRGINIA
COMBINED SCHEDULE OF LONG-TERM OBLIGATIONS
JUNE 30, 2014
EXHIBIT S-3
11 of 13
Amount Date of Interest Annual Maturity
Outstanding* Bonds Rate - % Payments* Amount Date
G.O. Public Improvement Refunding ($65,870,000) 7/27/10
Water share $1,211,039 4.00 3,387,708 3,387,708 08/15/16
Sewer share 1,243,833 4.00 1,505,609 1,505,609 08/15/17
Advanced Water Treatment 9,881,960 5.00 3,449,613 3,449,613 08/15/18
$12,336,832 5.00 3,685,746 3,685,746 08/15/20
5.00 308,156 308,156 08/15/21
$12,336,832
G.O. Public Improvement ($127,000,000) 6/28/11
Advanced Water Treatment $11,800,000 4.00 615,000 615,000 08/15/14
2.00/4.00 615,000 615,000 08/15/15
4.00 615,000 615,000 08/15/16
4.00/5.00 615,000 615,000 08/15/17
4.00 615,000 615,000 08/15/18
5.00 615,000 615,000 08/15/19
3.00/5.00 615,000 615,000 08/15/20
4.00/5.00 272,391 272,391 08/15/21
4.00/5.00 603,209 603,209 08/15/23
3.00/3.25 615,000 615,000 08/15/24
3.40 615,000 615,000 08/15/25
3.55 615,000 615,000 08/15/26
4.00 1,845,000 615,000 08/15/28-30
4.00/3.875/5.00 610,000 610,000 08/15/31
$9,480,600
G.O. Public Improvement Refunding ($106,445,000) 2/22/12
Water share $2,696,098 4.00/3.00 3,440,000 3,440,000 08/01/19
Sewer share 2,944,245 4.00/3.00 4,700,000 4,700,000 08/01/21
Advanced Water Treatment 21,974,657 5.00 5,910,000 5,910,000 08/01/22
$27,615,000 5.00 5,390,000 5,390,000 08/15/23
5.00 4,975,000 4,975,000 08/15/24
5.00 3,200,000 3,200,000 08/15/25
$27,615,000
G.O. Public Improvement Refunding ($108,140,000) 6/20/12
Advanced Water Treatment $7,400,000 5.00 310,000 310,000 08/15/14
5.00 2,695,000 385,000 08/15/2015-21
5.00 385,000 385,000 08/15/26
4.00 1,540,000 385,000 08/15/27-30
5.00 770,000 385,000 08/15/31-32
$5,700,000
G.O. Public Improvement ($93,975,000) 5/9/13
Water share $3,600,000 3.00 180,000 180,000 08/01/14
4.00 360,000 180,000 08/01/15-16
5.00 1,080,000 180,000 08/01/17-22
5.00 540,000 180,000 08/01/25-27
4.00 900,000 180,000 08/01/28-32
$3,060,000
G.O. Public Improvement Refunding ($30,320,000) 5/9/13
Water share $380,262 4.00 160,000 160,000 08/01/24
Sewer share 422,514 5.00 1,975,000 1,975,000 08/01//25
Advanced Water Treatment 6,887,224 5.00 3,465,000 3,465,000 08/01/26
$7,690,000 4.00 2,090,000 2,090,000 08/01/27
$7,690,000
150

ARLINGTON COUNTY, VIRGINIA
COMBINED SCHEDULE OF LONG-TERM OBLIGATIONS
JUNE 30, 2014
EXHIBIT S-3
12 of 13
Amount Date of Interest Annual Maturity
Outstanding* Bonds Rate - % Payments* Amount Date
G.O. Public Improvement Refunding ($81,255,000) 5/9/13
Water share $697,476 0.320 60,000 60,000 08/01/14
Sewer share 1,641,858 0.450 355,000 355,000 08/01/15
Advanced Water Treatment 1,165,666 0.606 340,000 340,000 08/01/16
$3,505,000 0.776 265,000 265,000 08/01/17
1.076 345,000 345,000 08/01/18
1.339 250,000 250,000 08/01/19
1.659 210,000 210,000 08/01/20
2.225 15,000 15,000 08/01/23
2.320 615,000 615,000 08/01/24
2.470 600,000 600,000 08/01/25
2.620 450,000 450,000 08/01/26
$3,505,000
G.O. Public Improvement ($64,910,000) 5/28/14
Water share $1,700,000 5.000 85,000 85,000 02/15/15
5.000 85,000 85,000 02/15/16
5.000 595,000 85,000 02/15/2017-23
3.000 85,000 85,000 02/15/24
3.000 85,000 85,000 02/15/25
3.000 170,000 85,000 02/15/2026-27
4.000 85,000 85,000 02/15/28
3.000 85,000 85,000 02/15/29
3.750 425,000 85,000 02/15/2030-34
$1,700,000
G.O. Public Improvement Refunding ($40,455,000) 5/28/14
Water share $2,765,000 5.000 325,000 325,000 02/15/21
5.000 370,000 370,000 02/15/22
5.000 1,110,000 555,000 02/15/2023-24
5.000 370,000 370,000 02/15/25
5.000 590,000 590,000 02/15/27
$2,765,000
SUBTOTAL: $112,630,511
FY 2005 Bond Premium/Cost of Refunding to be amortized 237,395
FY 2006 Bond Premium/Cost of Refunding to be amortized 506,513
FY 2007 Bond Premium/Cost of Refunding to be amortized 594,269
FY 2008 Bond Premium/Cost of Refunding to be amortized 769,454
FY 2010 Bond Premium/Cost of Refunding to be amortized (664,156)
FY 2011 Bond Premium/Cost of Refunding to be amortized 1,539,111
FY 2012 Bond Premium/Cost of Refunding to be amortized 2,936,385
FY 2013 Bond Premium/Cost of Refunding to be amortized 400,597
FY 2014 Bond Premium/Cost of Refunding to be amortized 244,542
Total Serial Bonds Serviced by Utilities Fund: 119,194,621
151

ARLINGTON COUNTY, VIRGINIA
COMBINED SCHEDULE OF LONG-TERM OBLIGATIONS
JUNE 30, 2014
EXHIBIT S-3
13 of 13
Amount Date of Interest Annual Maturity
Outstanding* Bonds Rate - % Payments* Amount Date
Compensated Absences - Utilities Fund 1,300,998
Bond and VRA interest payable - Utilities Fund 4,006,023
Capital Leases serviced by Utilities Fund 144,301
VRA Loans payable 233,282,935
Total Long Term Obligations Serviced by Utilities Fund: $357,928,878
Compensated Absences - Internal Service funds 527,194
Compensated Absences - CPHD Development Fund 582,181
Capital Leases serviced by Auto Equipment Fund 5,668,158
Revenue Bonds - Serviced by Ballston Public Garage Fund 8,900,000
Bond and mortgage interest payable 24,474,958
Mortgage Payable - Ballston Public Garage Fund 3,429,679
Total Long Term Obligations for Business-type Activities: $401,511,048
Long Term Obligations - Business-type Activities:
Due in one year $55,743,476
Due in more than on year $345,767,572
TOTAL LONG TERM OBLIGATIONS:
Due in one year 145,087,758
Due in more than one year 1,300,251,258$1,445,339,016
*Bonds Outstanding: Total amount authorized and sold minus the principal payments to date.
*Payments: Principal payments scheduled until maturity
152

EXHIBIT S-4
FISCAL REAL PERSONAL
YEAR ESTATE PROPERTY TOTAL
2014 $94,835 $848,812 $943,647
2013 94,312 453,897 548,209
2012 24,817 393,677 418,494
2011 3,034 330,197 333,231
2010 303 378,507 378,810
2009 238 - 238
2008 742 - 742
2007 203 - 203
2006 64 - 64
2005 - - -
2004 115 - 115
2003 115 - 115
TOTAL $218,778 $2,405,090 $2,623,868
NOTES:
The delinquent personal property taxes for the fiscal year consist of all taxes
which were levied for the prior calendar year, and for the four years
preceding, which remain uncollected as of the close of the fiscal year.
The amounts of delinquent taxes include the original levy and subsequent
adjustment for penalties. The penalty balances for real and personal property
taxes totaled $16,940 and $525,607 respectively.
ARLINGTON COUNTY, VIRGINIA
SCHEDULE OF DELINQUENT PROPERTY TAXES RECEIVABLE
JUNE 30, 2014
The amounts of delinquent real and personal property taxes receivable at
June 30, 2014 are presented on the basis of the County's fiscal years during
which such taxes became due.
The delinquent real estate taxes for the fiscal year consist of all taxes which
were levied for the prior calendar year, and for the nineteen years preceding,
which remain uncollected as of the close of the fiscal year.
153

EXHIBIT S-5
Total Outstanding
Total Current Current Percent Collection of Total Collections Write-Offs Outstanding Delinquent
Fiscal Current Taxes Not Taxes of Levy Prior Year's Taxes Taxes As % of and Deferred Delinquent Taxes as %
Year Tax Levy Collected Collected Collected In Current Year Collected Current Levy Adjustments Taxes Taxes of Total Levy
2005 435,567,836 2,953,943 432,613,894 99.32% 3,139,508 435,753,402 100.04% 1,003,191 874,009 5,413,308 1.24%
2006 479,686,828 3,152,135 476,534,693 99.34% 3,077,161 479,611,854 99.98% 1,176,489 882,123 5,472,146 1.14%
2007 528,570,144 2,707,065 525,863,079 99.49% 3,264,676 529,127,755 100.11% 1,045,194 1,069,831 4,861,433 0.92%
2008 577,353,341 2,881,468 574,471,873 99.50% 3,285,410 577,757,283 100.07% 829,482 1,259,192 4,645,017 0.80%
2009 620,724,099 3,508,418 617,215,681 99.43% 3,555,509 620,771,190 100.01% 885,868 1,476,023 4,445,528 0.72%
2010 631,481,234 2,753,079 628,728,155 99.56% 2,965,008 631,693,163 100.03% 1,074,788 1,450,150 4,107,640 0.65%
2011 653,198,268 2,147,274 651,050,994 99.67% 3,259,661 654,310,655 100.17% 924,343 1,391,658 3,596,781 0.55%
2012 701,019,137 1,585,301 699,433,836 99.77% 3,158,923 702,592,759 100.22% 1,016,583 1,362,159 3,358,566 0.48%
2013 754,569,203 4,983,622 749,585,581 99.34% 2,803,775 752,389,356 99.71% 1,016,583 1,362,159 3,107,347 0.41%
2014 787,485,043 2,623,869 786,541,395 99.88% 1,427,125 787,968,521 100.06% 822,356 2,496,535 2,623,869 0.33%
NOTES:
"Total Current Tax Levy" reflects current and delinquent taxes assessed in the current period less changes in the amount of deferred Real Estate taxes,
plus penalties assessed for the current and prior years.
"Current Taxes Not Collected" consists of delinquent taxes plus first installment real estate taxes receivable.
"Current Taxes Collected" reflects the amount of a fiscal year's tax levy collected during each fiscal year.
"Total Taxes Collected" reflects "Current Taxes Collected" plus collection of prior year's taxes and penalties in the current year plus reimbursements from the
Commonwealth for the Personal Property Tax Relief Act.
Delinquent personal property taxes are collectible for 5 years, delinquent real estate taxes for 20 years.
Source: Arlington County Treasurer's Office
ARLINGTON COUNTY, VIRGINIA
REAL ESTATE AND PERSONAL PROPERTY TAX LEVIES AND COLLECTIONS
LAST TEN FISCAL YEARS
154

EXHIBIT S-6
Governmental Funds
Governmental funds capital assets:
Land $164,478,229
Infrastructure 539,734,813
Buildings 339,404,693
Furniture, fixtures and equipment 177,807,893
Construction in Progress 220,497,892
Intangibles 4,142,534
Total governmental funds capital assets $1,446,066,054
Investments in governmental funds capital assets by source:
General fund $234,816,192
Special revenue funds 135,506
Capital projects funds 1,203,584,261
State literary loans 1,680,040
Donated assets 5,850,055
Total Investment in General Capital Assets $1,446,066,054
ARLINGTON COUNTY, VIRGINIA
CAPITAL ASSETS USED IN THE OPERATION OF GOVERNMENTAL FUNDS
SCHEDULE BY SOURCE (1)
JUNE 30, 2014
(1) This schedule presents only the capital asset balances related to governmental funds.
Accordingly, the capital assets report in internal service funds are excluded from the
above amounts. The capital assets of internal service funds are included as
governmental activities in the statement of net position.
155

EXHIBIT S-7
FY 2014 06/30/2014
FUNCTION AND ACTIVITY: Beginning Balance Additions Deletions Ending Balance
Primary Government:
General Government $295,537,526 $8,205,033 $5,260 $303,737,299
Public Safety 98,879,938 1,626,731 - 100,506,669
Environmental Services 685,486,343 46,934,048 132,624 732,287,767
Health and Public Welfare 33,468,701 299,098 - 33,767,799
Libraries 30,412,906 7,235 - 30,420,141
Parks and Recreation 183,801,541 15,745,850 - 199,547,391
Planning and Community Development 41,367,553 4,431,435 - 45,798,988
Total primary government 1,368,954,508 77,249,430 137,884 1,446,066,054
Internal Services Fund
Auto Equipment Fund 64,955,970 9,773,471 3,232,988 71,496,453
Total Internal Services Fund 64,955,970 9,773,471 3,232,988 71,496,453
Component Unit: School Board
Schools 736,920,550 34,898,488 - 771,819,038
Total Capital Assets $2,170,831,028 $121,921,389 $3,370,872 $2,289,381,545
ARLINGTON COUNTY, VIRGINIA
SCHEDULE OF CHANGES IN GENERAL CAPITAL ASSETS- BY FUNCTION AND ACTIVITY
FOR THE YEAR ENDED JUNE 30, 2014
General Capital Assets
156

EXHIBIT S-8
FUNCTION AND ACTIVITY: Total Land Infrastructure Buildings Equipment Intangibles CIP
General Government:
Control-
Legislative $114,522 $- $- $- $114,522 $- $-
Executive 492,215 - - - 492,215 -
Judicial 5,334,523 - - - 4,657,082 677,441 -
Total Control 5,941,260 - - - $5,263,819 677,441 -
Staff Agencies-
Elections 1,129,595 - - - 1,129,595 - -
Management and Finance 1,610,532 - - - 1,610,532 - -
Human Resources 414,403 - - - 331,135 83,268 -
Office of County Attorney 966,128 - - - 966,128 - -
Commissioner of the Revenue 595,054 - - - 595,054 - -
Treasurer 65,114 - - - 33,028 32,086 -
Department of Technology Services 29,114,164 - 421,153 991,860 23,639,351 1,103,715 2,958,085
General government 263,901,049 139,119,088 80,822,505 25,877,382 10,697,391 1,001,390 6,383,293
Total Staff Agencies 297,796,039 139,119,088 81,243,658 26,869,242 39,002,214 2,220,459 9,341,378
Total General Government 303,737,299 139,119,088 81,243,658 26,869,242 44,266,033 2,897,900 9,341,378
Public Safety:
Police 15,273,434 - 648,580 9,087,613 5,142,653 - 394,588
Fire 79,368,941 5,499,264 32,569,290 7,125,394 34,174,993 - -
Emergency management 5,864,294 - - - 4,990,976 - 873,318
Total Public Safety 100,506,669 5,499,264 33,217,870 16,213,007 44,308,622 - 1,267,906
Community Services:
Environmental Services 732,287,767 4,699,300 341,293,454 184,725,425 64,646,867 717,825 136,204,896
Health and Public Welfare 33,767,799 - - 14,127,700 19,061,625 160,205 418,269
Libraries 30,420,141 - 11,857,686 18,349,791 212,664 - -
Recreation 199,547,391 13,763,289 51,797,020 63,880,751 4,909,982 - 65,196,349
Community Development 45,798,988 1,397,288 20,325,125 15,238,778 402,099 366,604 8,069,094
Total Community Service 1,041,822,086 19,859,877 425,273,285 296,322,445 89,233,237 1,244,634 209,888,608
Total General Capital Assets 1,446,066,054 164,478,229 539,734,813 339,404,694 177,807,892 4,142,534 220,497,892
Internal Services Fund:
Auto Equipment Fund 71,496,453 - - - 71,496,453 - -
Total Internal Services Fund 71,496,453 - - - 71,496,453 - -
Component Unit: School Board Schools 771,819,038 4,697,946 - 684,492,640 82,628,452 - -
GRAND TOTALS $2,289,381,545 $169,176,175 $539,734,813 $1,023,897,334 $331,932,797 $4,142,534 $220,497,892
ARLINGTON COUNTY, VIRGINIA
SCHEDULE OF GENERAL CAPITAL ASSETS - BY FUNCTION AND ACTIVITY
JUNE 30, 2014
157

EXHIBIT S-9
Page 1of2
2014
Variance - 2013
Budget Actual Positive (Negative) Actuals
GENERAL FUND
General property taxes:
Real estate $603,033,449 $631,515,416 $28,481,967 $596,819,122
Personal 106,500,000 110,688,939 4,188,939 106,957,213
Total general property taxes 709,533,449 742,204,355 32,670,906 703,776,335
Other local taxes:
Business, professional and occupational license (BPOL) tax 60,520,000 62,752,491 2,232,491 61,341,154
Sales tax 40,900,000 39,046,328 (1,853,672) 39,447,636
Meals tax 34,700,000 34,951,030 251,030 34,707,200
Transient tax 21,800,000 20,784,241 (1,015,759) 22,270,627
Utility tax 11,700,000 12,095,016 395,016 11,815,946
Recordation, car rental and other local taxes 26,075,000 25,205,143 (869,857) 27,863,913
Total other local taxes 195,695,000 194,834,249 (860,751) 197,446,476
Total taxes 905,228,449 937,038,604 31,810,155 901,222,811
License, permits and fees 10,411,637 12,396,844 1,985,207 10,502,137
Fines and forfeitures 9,605,548 8,113,863 (1,491,685) 8,468,253
Charges for services 52,386,128 53,136,621 750,493 51,656,429
Grants:
State grants 69,777,014 67,984,661 (1,792,353) 64,473,930
Federal grants 18,844,633 18,015,289 (829,344) 15,595,756
Total grants 88,621,647 85,999,950 (2,621,697) 80,069,686
Use of money and property 5,866,760 6,414,252 547,492 3,998,537
Bond premiums - 2,442,072 - 11,594,033
Miscellaneous revenue 19,028,152 28,445,244 9,417,092 21,518,373
GRAND TOTALS FOR GENERAL FUND $1,091,148,321 $1,133,987,450 $40,397,057 $1,089,030,259
GENERAL FUND TRANSFERS FROM OTHER FUNDS:
Rosslyn Business Improvement District $35,719 $35,232 ($487) $34,919
Crystal City Business Improvement District 26,324 25,227 (1,097) 25,310
Community Development Block Grant Fund - - - 500,000
Automotive Equipment Fund 130,000 130,000 - 130,000
Street & Highway Bond Fund - 28,956 28,956 40,067
Neighborhood Conservation Bond Fund - 15,938 15,938 27,792
Government Facility Bond - 25,363 25,363 -
Ballston Business Improvement District 14,975 14,941 (34) 14,729
Public Recreation Bond Fund - 49,875 49,875 119,701
Fire Facilities Bond Fund - 6 6 5,017
Library Bond Fund - 40 40 894
Transit Facilities Bond Fund - 26,160 26,160 41,644
IDA Bond Funds - 9,773 9,773 29,761
IDA Skating Facility 2,400,000 - (2,400,000) -
Emergency Community Center - 6,578 6,578 18,294
School Capital Improvement Bond Fund - 72,867 72,867 140,846
Trust & Agency Fund 366,052 398,855 32,803 331,126
Total transfers $2,973,070 $839,811 ($2,133,259) $1,460,100
GRAND TOTALS $1,094,121,391 $1,134,827,261 $38,263,798 $1,090,490,359
ARLINGTON COUNTY, VIRGINIA
GENERAL AND SPECIAL REVENUE FUNDS - DETAIL SCHEDULE OF REVENUES - BUDGET (GAAP BASIS) AND ACTUAL
FOR THE YEAR ENDED JUNE 30, 2014
158

EXHIBIT S-9
Page 2of2
2014
Variance - 2013
Budget Actual Positive (Negative) Actuals
ARLINGTON COUNTY, VIRGINIA
GENERAL AND SPECIAL REVENUE FUNDS - DETAIL SCHEDULE OF REVENUES - BUDGET (GAAP BASIS) AND ACTUAL
FOR THE YEAR ENDED JUNE 30, 2014
SPECIAL REVENUE FUNDS:
Ballston BID 1,524,736 1,494,734 (30,002) 1,473,351
Rosslyn BID 3,630,847 3,524,078 (106,769) 3,523,816
Crystal City BID 2,591,803 2,523,162 (68,641) 2,531,764
Community Development Block Grant Fund 4,268,085 2,794,376 (1,473,709) 4,492,167
Section 8 Housing 18,469,071 17,139,411 (1,329,660) 16,447,901
Total Special Revenue Funds $30,484,542 $27,475,761 ($3,008,781) $28,468,999
BREAKDOWN OF REVENUE BY FUNCTION:
Charges for services Operating grants/Contributions Capital Grants
Includes licenses & fees State Federal Contributions
General government $20,009,810 $28,293,671 $1,605,885 $-
Public safety 11,590,616 10,567,728 1,002,433 -
Environmental services 26,811,532 9,809,437 - -
Health & welfare 3,167,690 18,758,657 15,127,035 -
Libraries 533,958 176,293 - -
Economic development 1,051,827 355,000 - -
Planning & community development 1,327,629 - 214,468 -
Parks & recreation 9,154,266 23,875 65,468 -
Total General Fund $73,647,328 $67,984,661 $18,015,289 $-
159

EXHIBIT S-10Page 1 of 2
2014
Variance - 2013Budget Actual Positive (Negative) Actuals
General Government Administration:
County Board $1,149,412 $1,078,257 $71,155 $1,032,905 County Manager 5,160,483 5,191,702 (31,219) 5,199,180 Financial Management 6,792,326 6,018,001 774,325 5,797,208 Human Resources 8,742,437 7,908,723 833,714 7,818,477 Technology Services 18,879,880 18,319,387 560,493 16,908,318 County Attorney 2,570,719 2,653,243 (82,524) 3,015,985 Commissioner of Revenue 5,266,409 4,994,779 271,630 4,959,817 Treasurer 6,215,675 6,423,281 (207,606) 6,067,685 Electoral Board 1,314,349 1,020,051 294,298 1,172,317
Total General Government 56,091,690 53,607,424 2,484,266 51,971,892
Judicial Administration:
Circuit Court Judiciary - 579,570 (579,570) - Circuit Court 3,843,762 2,871,158 972,604 3,667,342 District Court 373,176 364,869 8,307 261,084 Juvenile & Domestic Relations Court 6,105,051 5,731,030 374,021 5,570,161 Commonwealth Attorney 4,174,814 3,981,380 193,434 3,790,505 Sheriff & Jail 37,784,494 38,526,817 (742,323) 36,727,925 Magistrate's Office 43,746 41,363 2,383 40,139
Total Judicial Administration 52,325,043 52,096,187 228,856 50,057,156
Public Safety:
Police 64,789,260 60,965,129 3,824,131 59,295,645 Office of Emergency Management 11,254,353 10,966,169 288,184 11,070,721 Fire 51,663,185 52,274,199 (611,014) 49,377,970
Total Public Safety 127,706,798 124,205,497 3,501,301 119,744,336
Department of Environmental Services: DES-Environmental Services 82,274,902 80,533,785 1,741,117 77,419,666
Health & Welfare: Human Services 127,728,332 117,358,298 10,370,034 113,479,716
Libraries: 12,744,549 12,493,400 251,149 12,395,463
Planning & Community Development: Economic Development 11,144,190 10,829,236 314,954 9,817,779 Community Planning Housing & Development 11,194,329 10,377,073 817,256 9,908,497
Total Planning & Community Development 22,338,519 21,206,309 1,132,210 19,726,276
Parks & Recreation: 37,268,040 34,273,106 2,994,934 32,468,756
Non-Departmental: Non-Departmental 136,547,562 76,452,328 60,095,234 43,851,605 Debt Service Principal payment 37,005,960 38,279,170 (1,273,210) 35,526,687 Interest payment 23,394,040 17,598,928 5,795,112 18,676,454 Other costs 200,000 7,676 192,324 5,551 Regionals/Contributions 7,990,495 7,854,224 136,271 8,352,183 METRO 28,194,000 28,194,000 - 25,475,000
Total Non-Departmental 233,332,057 168,386,326 64,945,731 131,887,480
Total Expenditures before transfers-out 751,809,930 664,160,332 87,649,598 609,150,741
ARLINGTON COUNTY, VIRGINIAGENERAL AND SPECIAL REVENUE FUNDS - DETAIL SCHEDULE OF EXPENDITURES - BUDGET(GAAP BASIS) AND ACTUAL
FOR THE YEAR ENDED JUNE 30, 2014
160

EXHIBIT S-10Page 2 of 2
2014
Variance - 2013Budget Actual Positive (Negative) Actuals
ARLINGTON COUNTY, VIRGINIAGENERAL AND SPECIAL REVENUE FUNDS - DETAIL SCHEDULE OF EXPENDITURES - BUDGET(GAAP BASIS) AND ACTUAL
FOR THE YEAR ENDED JUNE 30, 2014
Transfers -Out
Auto Equipment Fund - - - 102,520 Printing Fund 195,853 195,853 - 172,203 General Capital Projects Fund 29,553,643 29,553,643 - 31,166,645 OPEB Trust Projects Fund - 66,546 ($66,546) - Schools General Operating 379,317,994 355,781,040 23,536,954 357,365,958 Community Activities/Cable TV 7,730,084 4,712,193 3,017,891 5,438,115 Pay-As-You-Go 4,508,490 2,821,344 1,687,146 40,972,045 Debt Service 43,323,691 41,545,385 1,778,306 35,448,396 Comprehensive Services Act 2,527,500 2,535,915 (8,415) 2,533,972
Total Transfers-Out 467,157,255 437,211,919 29,945,336 473,199,854
GRAND TOTALS EXPENDITURES $1,218,967,185 $1,101,372,251 $117,594,934 $1,082,350,595
SPECIAL REVENUE FUNDS:
Travel & Tourism Promotion - - - $251,711 Ballston BID 1,509,489 1,485,415 24,074 1,430,740
Rosslyn Business Improvement District 3,596,131 3,472,886 123,245 3,455,788 Crystal City Business Improvement District 2,565,885 2,501,090 64,795 2,515,118 Community Development Block Grant 4,268,085 2,794,376 1,473,709 3,992,236 Section 8 Housing 18,240,094 17,412,988 827,106 17,733,833
Total Special Revenue Funds $30,179,684 $27,666,755 $2,512,929 $29,379,426
TOTAL GENERAL AND SPECIAL REVENUE FUNDS $1,249,146,869 $1,129,039,006 $120,107,863 $1,111,730,021
161

EXHIBIT S-11
FUND AND FUNCTION AMOUNT
GENERAL FUND:
Capital Outlays:
General Government 132,248
Public Safety 604,812
Public Works 379,212
Health & Public Welfare 49,127
Libraries 7,235
Parks & Recreation 78,326
Planning & Community development 6,755
Total General Fund $1,257,715
CAPITAL PROJECTS FUNDS:
General Capital Projects Fund:
Public Works:
Transportation Projects 1,458,507
Government Facilities 21,414,439
Cultural & Recreation - Community Affairs:
Government Facilities 1,553,237
Parks 6,726,891
Total General Capital Projects Funds 31,153,074
Street & Highway Bond Fund:
Capital Projects - Public Works/Transportation/
Street & Highway Improvements 7,367,722
Neighborhood Conservation Bond Fund:
Neighborhood Capital Projects 4,559,602
Government Facility Bond 3,121,927
Stormwater Fund 540,294
Public Recreation Bond Fund:
Public Recreation 8,823,666
Fire Station Bond Fund:
Fire Station Facilities -
Library Bond Fund:
Public Library Facilities 3,398
NVTA
NOVA Transportation Authority 16,285,904
IDA Bond Fund: 3,998,244
TOTAL ALL OTHER GOVERNMENTAL FUNDS 44,700,757
GRAND TOTAL $77,111,546
ARLINGTON COUNTY, VIRGINIA
SCHEDULE OF CAPITAL OUTLAYS AND CAPITAL PROJECTS
GOVERNMENTAL FUND TYPES
FOR THE YEAR ENDED JUNE 30, 2014
162

STATISTICAL (Unaudited)
This part of the Arlington County Comprehensive Annual Financial Report (“CAFR”) presents detailed information as a context for understanding what the information in the financial statements, note disclosures, and required supplementary information says about the County’s overall financial health. Financial Trends These schedules contain trend information to help the reader understand how the County’s financial performance and well-being have changed over time (Table A, Table B, Table C, Table D, Table E and Table F.). Revenue Capacity These schedules contain information to help the reader assess the County’s most significant local revenue source, the property tax (Table G, and Table H). Debt Capacity These schedules present information to help the reader assess the affordability of the County’s current levels of outstanding debt and its ability to issue additional debt in the future ( Table I , Table J1 and Table J2 ). Demographic and Economic Information These schedules offer demographic and economic indicators to help the reader understand the environment within which the County’s financial activities take place (Table K and Table L). Operating Information These schedules contain service and infrastructure data to help the reader understand how the information in the County’s CAFR relates to the services the County provides and the activities it performs (Table M, Table N, and Table O). Other These schedules contain information needed for NRMSIRs and other disclosures (Tables P-W).
163

TABLE A
Restated
2006 2007 2008 2009 2010 2011 2012 2013 2014
Governmental Activities
Invested in capital assets,
net of related debt $62,305,816 $95,993,859 $97,725,017 $184,914,106 $225,913,383 $296,199,550 $359,395,370 $476,442,158 $527,691,722
Restricted for:
Capital projects 143,283,542 142,422,852 160,104,290 118,951,943 148,562,047 219,717,828 254,592,361 264,758,831 300,867,564
Other projects 2,982,755 9,194,531 8,110,583 5,515,684 5,286,376 5,571,153 4,042,402 2,557,084 2,290,690
Unrestricted 27,283,211 58,999,714 60,938,963 104,877,377 92,808,577 30,665,301 43,956,309 8,472,514 53,828,896
Total governmental activities net position $235,855,324 $306,610,956 $326,878,853 $414,259,110 $472,570,383 $552,153,832 $661,986,442 $752,230,587 $884,678,872
Business-Type Activities
Invested in capital assets,
net of related debt $285,517,682 $274,619,788 $354,626,738 $445,068,277 $531,409,247 $551,956,062 $610,182,040 $648,350,443 $667,676,811
Restricted for:
Capital projects 22,473,812 10,222,745 12,307,036 6,945,927 3,432,530 - - - -
Other projects - - - - - - - - -
Unrestricted 46,211,348 117,190,291 106,413,059 102,414,562 76,769,776 98,645,535 77,986,278 61,673,759 66,755,808
Total business-type activities net position $354,202,842 $402,032,824 $473,346,833 $554,428,766 $611,611,553 $650,601,597 $688,168,318 $710,024,202 $734,432,619
Primary government
Invested in capital assets,
net of related debt $347,823,498 $370,613,647 $452,905,637 $370,322,979 $757,322,630 $848,155,612 $969,577,410 $1,124,792,601 $1,195,368,533
Restricted for:
Capital projects 165,757,354 152,645,597 172,411,326 125,897,870 151,994,577 219,717,828 254,592,361 264,758,831 300,867,564
Other projects 2,982,755 9,194,531 8,110,583 5,515,684 5,286,376 5,571,153 4,042,402 2,557,084 2,290,690
Unrestricted 73,494,559 175,739,518 159,492,990 466,951,343 169,578,353 129,310,836 121,942,587 70,146,273 120,584,704
Total primary government activities net position $590,058,166 $708,193,293 $792,920,536 $968,687,876 $1,084,181,936 $1,202,755,429 $1,350,154,760 $1,462,254,789 $1,619,111,491
School Component Unit
Invested in capital assets,
net of related debt $280,567,468 $313,005,332 $332,700,082 $356,757,290 $386,599,276 $404,050,823 $464,751,903 $520,283,078 $535,315,558
Restricted for:
Capital projects 5,968,595 21,143,761 53,652,410 15,008,543 4,549,397 52,726,465 47,055,029 54,583,825 57,977,311
Other projects - - - - - 3,180,528 10,954,607 12,076,754 11,446,474
Unrestricted 30,823,237 (6,369,784) (21,749,122) (29,729,500) (32,814,262) - - - -
Total schools component unit activities net position $317,359,300 $327,779,309 $364,603,370 $342,036,333 $358,334,411 $459,957,816 $522,761,539 $586,943,657 $604,739,343
Other Component Units
Invested in capital assets,
net of related debt ($5,634,995) $20,624,884 $29,344,880 $29,978,738 $27,878,594 $27,962,471 $26,577,683 $24,576,817 $23,811,868
Restricted for:
Capital projects - - - - - - - - -
Other projects - - - - - - - - -
Unrestricted 32,025,503 8,123,376 (4,918,215) (5,578,810) (554,073) (982,778) 428,056 2,476,291 3,361,665
Total other component units activities net position $26,390,508 $28,748,260 $24,426,665 $24,399,928 $27,324,521 $26,979,693 $27,005,739 $27,053,108 $27,173,533
Notes:
(1) GASB Statement No. 44 requires presentation of full accrual financial information, including the presentation of net
assets. This statement was implemented in fiscal year 2006; therefore, there are only nine years of data presented in this table.
ARLINGTON COUNTY, VIRGINIA
NET POSITION BY COMPONENT
LAST NINE FISCAL YEARS (1)
(Accrual Basis of Accounting)
164

TABLE B Page 1 of 2
ARLINGTON COUNTY, VIRGINIACHANGES IN NET POSITION
LAST NINE FISCAL YEARS (1)(Accrual Basis of Accounting)
Fiscal YearExpenses RestatedPrimary government: 2006 2007 2008 2009 2010 2011 2012 2013 2014Governmental activities: General government $144,413,158 $170,050,920 $183,532,881 $157,913,828 $195,846,347 $180,060,339 $212,776,822 $197,890,282 $238,920,444 Public safety 94,152,505 105,294,735 114,536,445 101,207,180 110,207,376 116,211,459 118,391,330 120,977,618 126,239,238 Environmental services 66,712,584 69,902,804 73,697,836 74,059,602 76,327,661 76,871,992 80,272,770 84,444,970 89,774,303 Health & welfare 104,638,605 100,775,893 109,949,551 100,667,830 108,035,699 109,078,189 115,139,323 113,901,082 117,588,487 Libraries 13,002,989 13,167,711 14,426,350 12,828,135 11,946,021 11,313,749 12,134,689 12,464,589 12,784,342 Parks, recreation & culture 34,366,540 35,953,363 38,592,964 35,355,942 37,291,412 36,866,666 34,180,696 36,105,159 37,416,330 Planning & community development 35,865,238 40,556,577 46,279,307 67,595,397 46,833,700 42,986,854 54,626,473 60,359,027 61,703,864 Education 310,810,349 338,962,527 390,921,262 341,109,269 343,067,722 417,655,490 411,415,097 462,562,274 418,066,409 Interest and other charges 18,031,216 18,098,073 18,430,756 18,429,947 18,531,609 18,551,212 18,282,330 28,131,683 16,786,171 Total governmental activities expenses 821,993,184 892,762,603 990,367,352 909,167,130 948,087,547 1,009,595,950 1,057,219,530 1,116,836,685 1,119,279,588
Business-type activities: Utilities 47,321,964 51,515,377 57,904,261 59,052,176 64,616,867 68,006,236 76,050,327 93,564,517 85,448,387 Ballston Public Parking Garage 5,732,832 5,937,745 9,517,231 5,626,403 5,577,545 5,234,038 6,062,024 5,750,518 5,315,660 IDA Revenue Bond Fund - 34,170 1,519,061 1,695,732 1,701,967 - - - - 8th Level Ballston Public Parking Garage - 28,927 35,947 52,808 88,383 132,027 50,496 53,085 157,097 CPHD Development Fund - - - 9,554,317 9,824,617 10,556,125 11,598,557 12,173,696 13,762,118 Total business-type activities expenses 53,054,796 57,516,219 68,976,500 75,981,436 81,809,379 83,928,426 93,761,404 111,541,816 104,683,262
Total primary government expenses $875,047,980 $950,278,822 $1,059,343,852 $985,148,566 $1,029,896,926 $1,093,524,376 $1,150,980,934 $1,228,378,501 $1,223,962,850
Component units: Schools 352,921,809 388,148,161 412,953,520 422,055,027 412,450,899 407,401,980 431,308,198 485,061,915 488,403,844 Other 2,446,253 6,199,663 7,777,236 8,189,092 7,702,100 7,505,677 7,317,002 7,375,441 7,468,573 Total component units activities expenses $355,368,062 $394,347,824 $420,730,756 $430,244,119 $420,152,999 $414,907,657 $438,625,200 $492,437,356 $495,872,417
Program Revenues Primary government:Governmental activities: Charges for services General government $21,333,168 $20,079,042 $18,106,488 $20,158,108 $17,968,134 $19,911,198 $20,870,357 $20,219,252 $20,009,810 Environmental services 14,997,675 16,550,927 19,684,727 20,133,391 20,973,628 26,728,203 28,408,484 26,049,002 26,811,532 Public safety 9,281,843 7,676,160 5,049,238 6,365,373 8,581,235 10,204,341 9,949,039 10,793,294 11,590,616 Other activities 16,851,289 17,950,390 21,509,731 12,111,147 10,665,194 13,056,130 16,750,057 14,154,588 20,447,573 Operating grants and contributions 110,686,562 118,055,710 105,661,179 102,379,382 106,770,638 113,012,048 136,827,855 120,764,535 134,856,589 Capital grants and contributions 1,809,521 1,810,516 1,811,566 1,812,817 1,807,735 1,822,203 1,818,130 - -Total governmental activities program revenues 174,960,058 182,122,745 171,822,929 162,960,218 166,766,564 184,734,123 214,623,922 191,980,671 213,716,120
Business-type activities: Charges for services Water-sewer service charges 52,362,162 56,850,491 67,434,401 72,457,575 77,806,563 81,641,099 86,840,829 86,768,619 88,880,766 Water-service hook-up charges 6,468,463 3,345,476 4,810,598 4,627,014 2,390,390 3,165,075 4,419,474 5,672,805 5,499,780 Other activities 9,800,525 20,369,401 33,946,120 46,804,145 41,260,025 34,258,022 35,828,391 34,594,120 30,649,078 Operating grants and contributions - - - - - - - - - Capital grants and contributions 1,190,249 21,162,994 28,033,520 26,845,784 16,319,975 5,626,019 3,317,976 6,322,423 3,789,066 Total business-type activities program revenues 69,821,399 101,728,362 134,224,639 150,734,518 137,776,953 124,690,215 130,406,670 133,357,967 128,818,690
Total primary government program revenues $244,781,457 $283,851,107 $306,047,568 $313,694,736 $304,543,517 $309,424,338 $345,030,592 $325,338,638 $342,534,810
Component units: Charges for services $15,122,958 $16,849,867 $20,328,889 $20,561,183 $26,743,790 $27,358,213 $23,945,689 $31,354,968 $28,565,024 Operating grants and contributions 332,115,611 365,255,205 417,046,873 368,136,757 395,178,524 471,380,848 459,514,609 507,003,321 465,682,654 Capital grants and contributions - - 1,428,953 500,000 586,833 - - - -Total component units program revenues $347,238,569 $382,105,072 $438,804,715 $389,197,940 $422,509,147 $498,739,061 $483,460,298 $538,358,289 $494,247,678
165

TABLE B
Page 2 of 2
ARLINGTON COUNTY, VIRGINIA
CHANGES IN NET POSITION
LAST NINE FISCAL YEARS (1)
(Accrual Basis of Accounting)
Fiscal Year
Restated
Net (Expense) Revenue 2006 2007 2008 2009 2010 2011 2012 2013 2014
Primary government:
Governmental activities ($647,033,126) ($710,639,858) ($818,544,423) ($746,206,912) ($781,320,983) ($824,851,827) ($842,595,608) ($924,856,014) ($905,563,468)
Business-type activities 16,766,603 44,212,143 65,248,139 74,753,082 55,967,574 40,761,789 36,645,266 21,816,151 24,135,428
Total primary government net expense ($630,266,523) ($666,427,715) ($753,296,284) ($671,453,830) ($725,353,409) ($784,090,038) ($805,950,342) ($903,039,863) ($881,428,040)
Component units:
Component unit activities ($8,129,493) ($12,242,752) $17,798,673 ($41,046,179) $2,356,148 $83,831,404 $44,835,098 $45,920,933 ($1,624,739)
Total component units net expense ($8,129,493) ($12,242,752) $17,798,673 ($41,046,179) $2,356,148 $83,831,404 $44,835,098 $45,920,933 ($1,624,739)
General Revenues and Changes in Net Position
Governmental activities:
Property taxes:
Real estate property taxes $412,474,942 $441,047,242 $509,933,075 $523,725,497 $527,562,107 $572,591,637 $619,748,841 $648,659,020 $683,987,883
Personal property taxes 81,498,687 100,682,324 93,870,189 99,844,289 93,046,854 95,246,129 100,928,065 106,957,213 110,688,939
Other local taxes:
Business, professional occupancy license taxes 52,568,059 50,898,687 57,266,956 57,272,629 58,611,239 60,460,108 61,939,212 61,341,154 62,752,491
Other local taxes 109,293,301 118,628,548 128,615,218 130,617,472 129,262,316 135,568,319 139,639,610 143,631,442 139,621,783
Investment and interest earnings 11,792,758 16,927,475 17,282,845 11,505,984 10,149,713 8,328,982 5,443,855 4,287,344 6,578,889
Miscellaneous 27,701,527 33,453,869 23,985,005 18,480,331 21,000,027 11,505,318 27,112,773 50,223,986 34,381,768
Total governmental activities $695,329,274 $761,638,145 $830,953,288 $841,446,202 $839,632,256 $883,700,493 $954,812,356 $1,015,100,159 $1,038,011,753
Business-type activities:
Investment and interest earnings $4,581,344 $3,617,839 $6,065,870 $3,447,340 $1,215,213 $691,356 $747,823 $39,733 $272,989
Total business-type activities $4,581,344 $3,617,839 $6,065,870 $3,447,340 $1,215,213 $691,356 $747,823 $39,733 $272,989
Total primary government $699,910,618 $765,255,984 $837,019,158 $844,893,542 $840,847,469 $884,391,849 $955,560,179 $1,015,139,892 $1,038,284,742
Component units activities:
Other local taxes
Other local taxes $16,479,189 $18,242,576 $16,906,350 $16,163,026 $16,332,840 $17,134,732 $17,782,467 $18,171,301 $19,368,052
Investment and interest earnings/Miscellaneous 2,250,409 3,063,000 681,544 1,319,336 533,684 312,440 212,204 137,253 172,798
Total primary government $18,729,598 $21,305,576 $17,587,894 $17,482,362 $16,866,524 $17,447,172 $17,994,671 $18,308,554 $19,540,850
Changes in Net Position
Primary government:
Governmental activities $48,296,148 $50,998,287 $12,408,864 $95,239,289 $58,311,273 $58,848,666 $112,216,748 $90,244,145 $132,448,285
Business-type activities 21,347,947 47,829,982 71,314,009 78,200,422 57,182,787 41,453,145 37,393,089 21,855,884 24,408,417
Total primary government net expense $69,644,095 $98,828,269 $83,722,873 $173,439,711 $115,494,060 $100,301,811 $149,609,837 $112,100,029 $156,856,702
Component units:
Component units activities $10,600,105 $9,062,823 $35,386,567 ($23,563,817) $19,222,672 $101,278,576 $62,829,769 64,229,487 $17,916,111
Total component units net expense $10,600,105 $9,062,823 $35,386,567 ($23,563,817) $19,222,672 $101,278,576 $62,829,769 64,229,487 $17,916,111
Notes:
(1) GASB Statement No. 44 requires presentation of full accrual financial information, including the presentation of changes in net
assets. This statement was implemented in fiscal year 2006; therefore, there are only nine years of data presented in
this table.
166

TABLE C
Page 1 of 2
ARLINGTON COUNTY, VIRGINIA
FUND BALANCES, GOVERNMENTAL FUNDS AND OTHER COMPONENT UNIT
LAST TEN FISCAL YEARS
(Modified Accrual Basis of Accounting)
2005 2006 2007 2008 2009
General Fund Balance:
Reserved for
Encumbrances $4,293,596 $4,087,643 $4,570,757 $2,517,374 $270,619
Four Mile Run 500,000 500,000 500,000 500,000 -
Unreserved
Designated for Self Insurance 3,500,000 3,500,000 3,500,000 3,500,000 5,000,000
Designated for Operating Reserve 15,200,000 16,600,000 17,800,000 28,262,153 30,769,734
Designated for Subsequent Years Budget 29,109,808 34,575,639 36,691,920 29,928,475 44,666,386
Designated for Incomplete Projects 16,466,535 41,251,262 52,428,554 49,107,897 57,713,108
Designated for Retirement - - - 3,880,000 -
Total General Fund Balance 69,069,939 100,514,544 115,491,231 117,695,899 138,419,847
General Fund Balance as Percent
of General Fund Expenditures
and Other Financing Uses 9.41% 12.88% 13.49% 12.93% 14.98%
All Other Governmental Funds
Special revenue funds
Reserved - - - 53,706 -
Unreserved - 3,516,894 9,919,740 8,526,238 6,121,704 (1)
Capital Project funds
Reserved - 32,427,146 32,282,131 26,259,487 23,836,818 (1)
Unreserved - 110,856,397 110,140,721 133,844,803 95,115,125 (1)
Total all other governmental funds - 146,800,437 152,342,592 168,684,234 125,073,647 (1)
Component unit - Schools:
Reserved - 58,709,912 35,019,015 65,672,036 28,788,084 (1)
Unreserved - 4,916,017 6,589,059 7,799,312 7,155,183 (1)
Total component unit - Schools - 63,625,929 41,608,074 73,471,348 35,943,267 (1)
(1) Required by Implementation of GASB44 in Fiscal Year 2006.
167

TABLE C
Page 2 of 2
2010 2011 2012 2013 2014
General Fund
Restricted for:
Seized assets $3,032,049 $2,385,573 $2,436,464 $2,272,448 $2,522,979
Grants 45,206 - - - -
Committed to:
Self insurance reserve 5,000,000 5,000,000 5,000,000 5,000,000 5,000,000
Subsequent years' County budget 17,061,007 11,151,929 10,488,080 5,208,794 4,860,024
Capital projects - 4,946,013 1,902,323 8,403,862 14,831,642
Operating reserve 32,377,943 40,192,725 50,240,906 52,605,487 54,575,340
Economic & revenue stabilization contingent - - - 3,000,000 3,000,000
Incomplete projects 150,176 230,734 171,861 130,223 412,220
Affordable Housing Investment Fund 17,656,893 19,163,965 7,050,422 21,838,549 45,631,924
Subsequent years' school budgets 33,218,860 32,481,838 64,669,485 26,269,900 46,735,944
Assigned to:
Subsequent years' operating budgets - 10,913,573 12,565,023 19,649,922 15,593,759
Subsequent years' capital projects 13,942,559 6,135,259 18,978,462 12,162,577 11,782,428
Economic Stabilization reserve - - 3,000,000 5,000,000 -
Employee furlough day restoration 1,012,911 - - - -
Operating reserve 2,672,083 10,048,181 2,364,581 1,969,853 2,810,020
Fresh AIRE program 663,804 354,877 1,244,577 1,224,867 1,480,249
Incomplete projects 6,610,975 933,856 2,416,189 5,215,352 3,772,275
Affordable Housing Investment Fund 3,564,742 3,717,920 8,930,790 29,647,093 20,045,133
Total General Fund Balance $137,009,208 $160,754,645 $191,459,163 $199,598,927 $233,053,937
General Fund Balance as Percent
of General Fund Expenditures
and Other Financing Uses 14.40% 16.62% 19.02% 18.44% 21.16%
All Other Governmental Funds
Special Revenue funds
Nonspendable:
Prepaid $1,223,394 $1,252,930 $1,286,469 $1,299,658 $1,288,591
Restricted for:
Grants 4,673,397 4,318,223 2,755,933 1,257,426 1,002,099
Capital Project funds
Nonspendable:
Prepaid - - - 4,275 4,275
Restricted for:
Grants 1,423,044 1,380,184 - - -
Debt Service 5,735,926 18,383,560 20,743,558 35,790,356 29,790,565
Committed to:
Capital Projects 155,615,078 199,954,084 233,848,803 228,964,200 271,072,724
Total all other governmental funds $168,670,839 $225,288,981 $258,634,763 $267,315,915 $303,158,254
Component unit - Schools
Restricted for:
Capital projects $4,549,397 $52,726,465 $47,055,029 $54,583,825 $57,977,311
Grants - 2,077,853 2,109,001 2,009,337 2,439,196
Committed to:
Incomplete projects 14,294,085 18,077,449 26,987,189 26,082,805 25,505,075
Subsequent years' School budget - 6,545,000 7,975,000 16,749,704 15,121,892
Assigned to:
Operating reserve 4,235,289 2,363,770 2,413,261 2,843,426 3,208,571
Unfunded liabilities - 2,000,000 2,000,000 2,000,000 2,000,000
Subsequent years' debt service - 7,000,000 5,025,000 3,625,000 3,360,000
OPEB reserve 695,565 - - - -
Health insurance reserve - - 1,000,000 1,000,000 1,000,000
General reserve - 3,000,000 4,000,000 - 1,201,283
VRS reserve - 11,587,239 7,387,239 7,387,239 5,637,239
Total component unit - Schools $23,774,336 $105,377,776 $105,951,719 $116,281,336 $117,450,567
(1) Required by Implementation of GASB54 in Fiscal Year 2011.
ARLINGTON COUNTY, VIRGINIA
FUND BALANCES, GOVERNMENTAL FUNDS AND OTHER COMPONENT UNIT (1)
LAST TEN FISCAL YEARS
(Modified Accrual Basis of Accounting)
168

TABLE D
2006 2007 2008 2009 2010 2011 2012 2013 2014
REVENUES:
General property taxes:
Real Estate property taxes $391,213,244 $425,982,688 $473,501,869 $514,518,691 $528,220,762 $548,838,350 $592,363,670 $632,709,421 $668,556,176
Personal property taxes 81,498,687 100,682,324 93,870,189 99,844,289 93,046,854 95,246,129 100,928,065 106,957,213 110,688,939
Other Local taxes:
BPOL 52,568,059 50,898,687 57,266,956 57,272,629 58,611,239 60,460,108 61,939,212 61,341,154 62,752,491
Other local taxes 109,293,301 118,628,548 128,615,218 130,617,472 129,262,316 135,568,319 139,639,610 143,631,442 139,621,783
Fines and forfeitures 8,900,948 8,338,582 8,049,910 8,720,950 7,851,193 9,590,928 10,641,659 8,468,253 8,113,863
Licenses, permits and fees 14,692,442 13,687,394 17,022,701 7,768,974 7,362,947 9,929,105 10,606,117 10,502,137 12,396,844
Intergovernmental 112,496,082 119,866,226 107,472,746 104,192,200 108,578,373 114,834,250 138,645,985 124,506,820 130,888,641
Charges for services 38,870,586 40,230,543 39,277,573 42,278,095 42,974,051 50,379,839 52,346,023 52,245,746 58,348,824
Interest and rent 11,792,758 16,927,475 17,282,845 11,505,984 10,149,713 8,328,982 5,443,855 4,287,344 6,578,890
Miscellaneous revenues 10,891,786 15,414,677 6,938,710 16,378,642 25,950,164 12,891,977 19,008,738 23,192,304 31,320,765
Total revenues 832,217,893 910,657,144 949,298,717 993,097,926 1,012,007,612 1,046,067,987 1,131,562,934 1,167,841,834 1,229,267,216
EXPENDITURES:
Current operating:
General government 130,380,468 155,765,913 162,318,710 155,243,762 182,074,416 168,558,845 200,088,702 184,333,469 225,143,159
Public safety 88,875,217 100,650,601 105,760,328 102,791,792 109,550,701 112,925,159 117,033,171 118,725,350 123,709,905
Environmental services 55,122,531 58,491,391 62,420,185 64,803,607 72,315,850 71,924,393 74,921,125 76,672,481 80,154,573
Health and welfare 98,926,206 96,536,913 101,695,722 102,804,509 107,892,357 109,509,790 115,330,415 113,418,239 117,309,171
Libraries 12,034,671 12,339,879 13,062,000 12,855,344 11,630,740 11,074,270 11,880,873 12,366,401 12,486,165
Parks, recreation and culture 32,012,711 33,512,601 35,000,210 34,801,755 35,871,582 35,652,708 32,849,180 32,686,242 34,197,295
Planning and community development 33,914,712 38,835,189 42,796,892 35,308,979 36,252,223 36,154,777 45,056,535 48,773,039 48,990,317
Debt service
Principal 26,480,421 27,595,301 28,950,071 33,046,404 33,813,374 36,310,305 36,160,046 35,841,532 38,600,630
Interest and other charges 18,031,216 18,098,073 18,430,756 18,429,947 18,531,609 18,551,212 18,282,330 19,715,860 17,958,561
Bond issuance costs - - - - 358,995 273,649 - 8,415,823 (1,172,390)
Community development - - - 32,985,081 10,190,869 6,372,169 8,804,947 10,052,960 11,504,210
Education 310,810,349 338,962,527 390,921,262 341,109,269 343,067,722 364,633,453 423,610,118 479,997,640 443,783,010
Capital outlay 72,029,442 61,004,743 60,137,617 113,133,467 86,792,008 111,378,633 92,185,904 144,985,816 77,111,549
Total expenditures 880,027,129 941,793,131 1,021,493,753 1,047,313,916 1,048,342,446 1,083,319,363 1,176,203,346 1,285,984,852 1,229,776,155
Excess(deficiency) of revenues over
expenditures (47,809,236) (31,135,987) (72,195,036) (54,215,990) (36,334,834) (37,251,376) (44,640,412) (118,143,018) (508,939)
OTHER FINANCING SOURCES(USES):
Transfers in 15,423,635 21,171,707 29,370,998 22,225,678 22,028,499 26,716,715 30,385,999 33,382,459 29,921,732
Transfers out (15,812,365) (20,941,333) (29,663,941) (40,383,849) (22,133,809) (26,794,414) (30,582,672) (33,527,183) (30,054,131)
Capital leases 5,776,901 975,020 5,704,728 13,524,783 7,418,179 4,287,958 1,435,230 4,473,803 5,459,005
Proceeds from refunding of note - - - - 35,666,099 - - - -
Payment on refunded note - - - - (35,962,739) - - - -
Refunding bonds issued 86,856,240 - - - 55,067,382 53,533,168 41,885,000 127,097,545 37,690,000
Payments to refunded bond escrow agent (85,447,055) - - - (56,747,745) (54,922,067) (44,350,490) (118,681,722) (38,862,390)
Deferred cost of refunding - - - - 1,680,363 1,388,899 2,465,490 - -
Premium from sale of bonds 1,644,345 650,489 1,491,507 - 1,145,925 6,458,775 6,712,155 11,594,033 2,442,072
Issuance of revenue bonds - - - - 41,280,000 11,940,000 - - -
Issuance of debt 61,335,000 49,860,000 83,777,000 35,962,739 14,867,322 173,655,000 100,740,000 110,625,000 63,210,000
Bond proceeds Schools - - - - - (78,543,000) - - -
Total other financing sources and uses 69,776,701 51,715,883 90,680,292 31,329,351 64,309,476 117,721,034 108,690,712 134,963,935 69,806,288
Net change in fund balances $21,967,465 $20,579,896 $18,485,256 ($22,886,639) $27,974,642 $80,469,658 $64,050,300 $16,820,917 $69,297,349
Debt service as a percentage of noncapital
expenditures 5.5% 5.2% 4.9% 5.5% 5.4% 5.6% 5.0% 4.9% 4.9%
Notes:
(1) GASB Statement No. 44 requires presentation of modified accrual financial information, including the changes in fund
balances of governmental funds. This statement was implemented in fiscal year 2006; therefore, there are only nine years of
data presented in this table.
ARLINGTON COUNTY, VIRGINIA
CHANGES IN FUND BALANCES OF GOVERNMENTAL FUNDS
LAST NINE FISCAL YEARS (1)
(Modified Accrual Basis of Accounting)
169

TABLE D-1
Public Works/ Culture/ Non-
Fiscal General Public Environmental Health & Recreation Depart- Debt
Year Government Safety Services Welfare (2) Education mental Service(3) Transit Other Total
2005 73,554,551 82,055,248 51,312,988 91,439,050 84,606,670 295,791,800 35,591,400 60,459,248 11,800,000 6,795,865 793,406,820
2006 82,177,157 88,875,217 55,122,531 98,926,206 89,452,484 313,487,397 27,998,534 71,349,683 13,000,000 7,204,777 847,593,986
2007 86,449,237 100,650,601 58,491,391 96,536,913 97,241,733 346,674,412 46,959,849 72,664,483 14,700,000 7,656,827 928,025,446
2008 91,871,133 105,760,328 62,420,185 101,695,722 84,965,631 356,461,219 45,179,813 76,238,801 17,400,000 7,867,764 949,860,596
2009 92,272,385 106,701,887 67,845,515 103,057,795 96,883,233 370,854,547 37,354,073 83,573,363 18,394,223 8,117,301 985,054,322
2010 93,880,098 110,184,753 73,187,350 108,138,231 97,922,803 365,864,891 60,696,417 83,776,203 20,518,770 8,062,884 1,022,232,400
2011 95,464,852 112,696,379 72,721,915 109,677,751 96,741,115 363,204,699 43,769,131 88,099,570 21,473,703 8,149,062 1,011,998,177
2012 98,637,205 119,356,254 75,750,178 115,347,313 103,765,797 393,832,257 68,114,014 89,268,683 24,510,207 8,186,444 1,096,768,352
2013 102,029,048 119,744,336 77,419,666 113,479,716 108,495,964 430,523,375 43,851,605 92,980,788 25,475,000 8,352,183 1,122,351,681
2014 105,703,611 124,205,497 80,533,785 117,358,298 110,126,685 436,028,377 76,452,328 99,504,576 28,194,000 7,854,224 1,185,961,381
NOTES:
(1) Includes expenditures of the General and Special Revenue Funds of the County and School Board.
(2) Includes the specific functions of Libraries, Parks and Recreation, Planning and Development, Community Grants, Housing Grants, and Travel & Tourism Promotion
and School Community Activities.
(3) Includes all debt service for the General and Special Revenue Funds of the County and School Board.
Regional Agencies
ARLINGTON COUNTY, VIRGINIA
GENERAL GOVERNMENTAL EXPENDITURES BY FUNCTIONS (1)
LAST TEN FISCAL YEARS
Contributions to
170

TABLE D-2
Licenses Inter Charges Fines
Fiscal and Governmental for and Miscellaneous
Year Taxes Permits Revenue Services Forfeitures Revenues Total
(2)
2005 590,957,911 12,504,677 141,477,699 47,937,824 8,427,464 18,844,857 820,150,432
2006 651,052,481 14,692,442 148,945,331 50,482,470 8,900,948 22,087,157 896,160,829
2007 714,434,824 13,687,394 158,249,103 50,359,269 8,338,582 18,455,600 963,524,772
2008 756,859,824 17,022,701 131,541,624 53,645,287 8,049,910 19,554,790 986,674,136
2009 792,159,244 7,768,974 150,311,253 55,115,142 8,720,950 24,892,171 1,038,967,734
2010 798,707,195 7,362,947 152,874,209 59,634,597 7,851,193 28,463,122 1,054,893,263
2011 828,985,623 9,929,105 159,329,241 70,094,896 9,590,928 23,152,911 1,101,082,704
2012 879,404,041 10,606,117 154,376,886 67,754,260 10,641,659 29,126,756 1,151,909,719
2013 926,920,232 10,502,137 151,775,127 75,576,387 8,468,253 37,260,396 1,210,502,532
2014 963,946,680 12,396,844 156,810,777 74,212,578 8,113,863 37,374,435 1,252,855,177
NOTES:
(1) Includes revenues of the General, Special Revenue Funds, and School Board.
ARLINGTON COUNTY, VIRGINIA
GENERAL GOVERNMENTAL REVENUES BY SOURCE (1)
LAST TEN FISCAL YEARS
(2) Business, Professional and Occupational License (BPOL) Reclassed from Licenses and Permits to Taxes FY 2007
and thereafter.
171
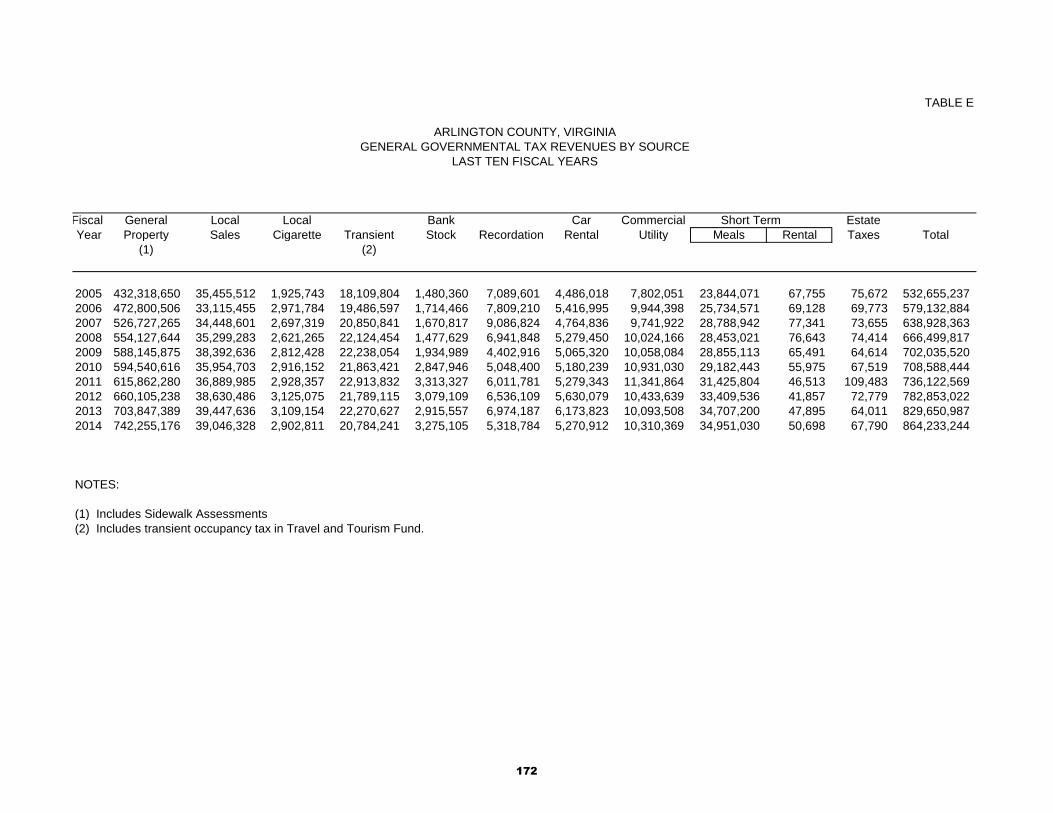
TABLE E
Fiscal General Local Local Bank Car Commercial Short Term Estate
Year Property Sales Cigarette Transient Stock Recordation Rental Utility Meals Rental Taxes Total
(1) (2)
2005 432,318,650 35,455,512 1,925,743 18,109,804 1,480,360 7,089,601 4,486,018 7,802,051 23,844,071 67,755 75,672 532,655,237
2006 472,800,506 33,115,455 2,971,784 19,486,597 1,714,466 7,809,210 5,416,995 9,944,398 25,734,571 69,128 69,773 579,132,884
2007 526,727,265 34,448,601 2,697,319 20,850,841 1,670,817 9,086,824 4,764,836 9,741,922 28,788,942 77,341 73,655 638,928,363
2008 554,127,644 35,299,283 2,621,265 22,124,454 1,477,629 6,941,848 5,279,450 10,024,166 28,453,021 76,643 74,414 666,499,817
2009 588,145,875 38,392,636 2,812,428 22,238,054 1,934,989 4,402,916 5,065,320 10,058,084 28,855,113 65,491 64,614 702,035,520
2010 594,540,616 35,954,703 2,916,152 21,863,421 2,847,946 5,048,400 5,180,239 10,931,030 29,182,443 55,975 67,519 708,588,444
2011 615,862,280 36,889,985 2,928,357 22,913,832 3,313,327 6,011,781 5,279,343 11,341,864 31,425,804 46,513 109,483 736,122,569
2012 660,105,238 38,630,486 3,125,075 21,789,115 3,079,109 6,536,109 5,630,079 10,433,639 33,409,536 41,857 72,779 782,853,022
2013 703,847,389 39,447,636 3,109,154 22,270,627 2,915,557 6,974,187 6,173,823 10,093,508 34,707,200 47,895 64,011 829,650,987
2014 742,255,176 39,046,328 2,902,811 20,784,241 3,275,105 5,318,784 5,270,912 10,310,369 34,951,030 50,698 67,790 864,233,244
NOTES:
(1) Includes Sidewalk Assessments
(2) Includes transient occupancy tax in Travel and Tourism Fund.
ARLINGTON COUNTY, VIRGINIA
GENERAL GOVERNMENTAL TAX REVENUES BY SOURCE
LAST TEN FISCAL YEARS
172

TABLE F
Real Property Personal Property Public Property Total
Real Personal
Fiscal Assessed Assessed Assessed Assessed Property Property
Year Value Actual Value Value Actual Value Value Actual Value Value Actual Value Tax Rate Tax Rate
(2)(3)
2005 42,275,421,900 42,275,421,900 1,759,391,742 1,759,391,742 682,583,199 682,583,199 44,717,396,841 44,717,396,841 .958/.878 4.40
2006 50,632,673,900 50,632,673,900 1,833,540,112 1,833,540,112 724,577,345 724,577,345 53,190,791,357 53,190,791,357 .878/.818 4.40
2007 54,292,837,200 54,292,837,200 1,926,492,868 1,926,492,868 939,132,732 939,132,732 57,158,462,800 57,158,462,800 .818/.818 5.00
2008 57,469,500,000 57,469,500,000 1,931,899,776 1,931,899,776 884,773,303 884,773,303 60,286,173,079 60,286,173,079 .818/.848 5.00
2009 57,781,547,100 57,781,547,100 2,014,144,083 2,014,144,083 718,898,384 718,898,384 60,514,589,567 60,514,589,567 .848/.875 5.00
2010 53,985,515,000 53,985,515,000 1,916,920,257 1,916,920,257 716,299,020 716,299,020 56,618,734,277 56,618,734,277 .875/.958 5.00
2011 57,459,163,400 57,459,163,400 1,892,908,108 1,892,908,108 709,218,039 709,218,039 60,061,289,547 60,061,289,547 .958/.958 5.00
2012 61,672,361,900 61,672,361,900 1,947,478,083 1,947,478,083 774,586,506 774,586,506 64,394,426,489 64,394,426,489 .958/.971 5.00
2013 62,891,330,300 62,891,330,300 2,134,754,992 2,134,754,992 758,819,988 758,819,988 65,784,905,280 65,784,905,280 .971/1.006 5.00
2014 66,399,525,600 66,399,525,600 2,222,369,095 2,222,369,095 801,404,536 801,404,536 69,423,299,231 69,423,299,231 1.006/.996 5.00
NOTES:
(1) The amounts shown for assessed and estimated actual value of taxable property represent valuations for County tax years which end December 31st.
Property in the County assessed each year at actual value. Therefore, the assessed values are equal to the actual value. Rates are per $100 of assessed valuation.
(2) Rate is established each calendar year; the first rate represents second half of the previous calendar year, and the second rate represents first half of the calendar year.
(3) Rate from calendar year 2008 forward include sanitary district tax for stormwater management initiatives.
ARLINGTON COUNTY, VIRGINIA
ASSESSED AND ACTUAL VALUE OF TAXABLE PROPERTY (1)
LAST TEN FISCAL YEARS
173

TABLE G
2014 2005
Percentage Percentage
of Total of Total
Assessed Assessed Assessed Assessed
Taxpayer/ Type of Business Valuation Rank Valuation Taxpayer/ Type of Business Valuation Rank Valuation
Vornado Realty Trust 3,809,718,900 1 5.73% Charles E. Smith Interests 3,448,069,900 1 8.16%
Office buildings, aparts, hotel, land Office buildings, aparts, hotel, land
Arland Towers Company 1,339,922,600 2 2.02% Cafritz Interests 711,867,900 2 1.68%
Office buildings, land Apartments, warehouses, land
Albrittain Interests 1,323,430,600 3 2.01% Arland Towers Company 563,183,400 3 1.33%
Apartments, general commercial Office buildings, land
JBG Companies 1,306,480,500 4 1.99% Crystal Holdings 515,966,100 4 1.22%
Office building, land, aprts, retail,res Mixed use retail, hotel
Paradigm Managed Properties 1,128,927,700 5 1.70% Albrittain Interests 501,266,100 5 1.19%
Apartments , general commercial Apartments, general commercial
Beacon Capital 808,470,600 6 1.28% Fashion Centre Associates 448,300,600 6 1.06%
Office buildings, land Mixed use retail, hotel
Caruthers Interests 806,201,000 7 1.22% Paradigm Management 374,206,700 7 0.89%
Retail, office building, aprts, hotel Apartments
Shirley Park Leasing 797,629,900 8 1.20% Caruthers Interests 229,670,100 8 0.54%
Office Building, apartment Retail, office building, aprts, hotel
Street Retail Inc 752,930,200 9 1.13% Avalon Properties 226,441,600 9 0.54%
Office buildings, hotel, land Apartments, land
Fashion Centre Associates 734,212,100 10 1.11% 2111 & 2039 Wilson BLVD INC 196,957,900 10 0.47%
Mixed use retail Office buildings, land
Total $12,807,924,100 19.39% $7,215,930,300 17.08%
NOTES:
(1) Source - County Department of Management & Finance - Real Estate Assessments
ARLINGTON COUNTY, VIRGINIA
PRINCIPAL TAXPAYERS (1)
CURRENT YEAR AND NINE YEARS AGO
174

TABLE H
Real Estate and Personal Property Tax Combined
Percentage of Collected in Percentage
Total Tax Levy (1) Amount Levy Subsequent Years Amount of levy
2005 435,567,836 432,613,894 99.32% 2,488,691 435,102,584 99.89%
2006 479,686,828 476,534,693 99.34% 2,524,904 479,059,597 99.87%
2007 528,571,009 525,863,079 99.49% 2,437,194 528,300,273 99.95%
2008 577,382,256 574,471,873 99.50% 2,512,124 576,983,997 99.93%
2009 620,931,850 617,215,681 99.40% 3,175,374 620,391,055 99.91%
2010 632,051,320 628,272,902 99.40% 3,399,608 631,672,510 99.94%
2011 655,041,999 650,965,303 99.38% 3,743,465 654,708,767 99.95%
2012 696,205,109 697,633,240 100.21% (1,846,625) 695,786,615 99.94%
2013 752,789,368 748,656,079 99.45% 3,585,080 752,241,159 99.93%
2014 800,980,672 800,037,025 99.88% - 800,037,025 99.88%
Real Estate Taxes
Percentage of Collected in Percentage
Total Tax Levy (1) Amount Levy Subsequent Years Amount of Levy
2005 357,486,603 356,091,522 99.61% 1,395,081 357,486,603 100.00%
2006 397,011,521 395,632,942 99.65% 1,378,515 397,011,457 100.00%
2007 432,985,758 431,396,444 99.63% 1,589,111 432,985,555 100.00%
2008 481,450,541 479,931,389 99.68% 1,518,410 481,449,799 100.00%
2009 522,711,162 521,181,642 99.71% 1,529,281 522,710,924 100.00%
2010 535,604,264 533,974,360 99.70% 1,629,601 535,603,961 100.00%
2011 556,659,348 554,896,565 99.68% 1,759,749 556,656,314 100.00%
2012 596,237,335 599,088,319 100.48% (2,875,801) 596,212,519 100.00%
2013 644,486,211 642,101,576 99.63% 2,290,323 644,391,899 99.99%
2014 682,995,140 682,900,304 99.99% - 682,900,304 99.99%
NOTE: Large tax refunds for FY2012 collections were processed during FY2013 resulting in negative collections
Personal Property Taxes
Percentage of Collected in Percentage
Total Tax Levy (1) Amount Levy Subsequent Years Amount of Levy
2005 78,081,233 76,522,371 98.00% 1,093,610 77,615,981 99.40%
2006 82,675,307 80,901,751 97.85% 1,146,389 82,048,140 99.24%
2007 95,585,251 94,466,635 98.83% 848,083 95,314,718 99.72%
2008 95,931,716 94,540,484 98.55% 993,714 95,534,198 99.59%
2009 98,220,688 96,034,039 97.77% 1,646,093 97,680,132 99.45%
2010 96,447,056 94,298,542 97.77% 1,770,007 96,068,549 99.61%
2011 98,382,650 96,068,738 97.65% 1,983,715 98,052,453 99.66%
2012 99,967,774 98,544,921 98.58% 1,029,176 99,574,097 99.61%
2013 108,303,157 106,554,504 98.39% 1,294,756 107,849,260 99.58%
2014 117,985,532 117,136,721 99.28% - 117,136,721 99.28%
(1) Total Tax Levy reflects current and delinquent taxes assessed in the current period less the amount of deferred Real Estate taxes,
plus penalties assessed for the current and prior years.
Source: Arlington County Treasurer's Office
Collected in Fiscal Year of Levy Total Collections to date
Total Collections to Date
ARLINGTON COUNTY, VIRGINIA
PROPERTY TAX LEVIES AND COLLECTIONS
LAST TEN FISCAL YEARS
Collected in Fiscal Year of Levy Total Collections to date
Collected in Fiscal Year of Levy
175

TABLE I
Pct. Of Debt Per
General IDA IDA IDA Utilities General BPPG BPPG VRA Capital Total Primary Personal Capita (1)
Fiscal Obligation Revenue Lease Revenue Note s Capital Obligation Revenue Note Bonds (4) Leases Government Income (1)
Year Bonds (2) Bonds (3) Bonds (2) Payable (3) Leases Bonds (4) Bonds (4) Payable
2005 554,185,294 - 60,540,000 - 7,261,658 37,379,715 14,800,000 3,429,679 24,933,850 3,218,066 705,748,262 6.03% 3,560
2006 576,904,155 - 58,085,000 - 9,547,302 33,460,851 14,300,000 3,429,679 32,298,455 4,890,754 732,916,196 6.04% 3,660
2007 585,786,533 - 55,215,000 - 6,760,154 97,473,471 13,800,000 3,429,679 61,164,960 4,000,715 827,630,512 6.36% 4,041
2008 625,498,345 - 52,180,000 - 8,636,047 119,701,657 13,300,000 3,429,679 146,074,542 3,045,844 971,866,114 6.92% 4,672
2009 576,842,463 - 47,120,000 35,962,739 18,436,505 112,617,553 12,800,000 3,429,679 216,152,600 2,120,767 1,025,482,306 6.91% 4,900
2010 566,435,124 41,280,000 41,900,000 35,666,099 20,556,593 105,459,880 12,300,000 3,429,679 256,458,344 3,450,321 1,086,936,040 7.14% 5,122
2011 687,933,174 40,135,000 48,455,000 35,016,099 18,933,209 127,396,828 11,800,000 3,429,679 263,158,039 3,119,963 1,239,376,991 7.89% 5,894
2012 730,532,411 38,970,000 42,635,000 35,016,099 14,368,663 124,517,591 10,600,000 3,429,679 253,204,991 2,467,919 1,255,742,353 7.27% 5,814
2013 776,934,905 125,285,000 - - 13,175,010 119,765,096 9,400,000 3,429,679 246,193,772 4,261,192 1,298,444,654 7.12% 5,874
2014 779,454,489 116,500,000 - - 14,315,564 112,630,511 8,900,000 3,429,679 233,282,935 5,812,459 1,274,325,637 6.99% 5,765
NOTES:
(1) Population and personal Income estimates are from Arlington County Planning Division estimates presented in Table K.
(2) Amounts for bonds are reported gross, excluding premiums and/or discounts and deferred amounts on refundings.
(3) These amounts are IDA Revenue notes and bonds issued as subject to appropriation obligations of the County.
(4) Business type amounts are self supporting debt obligations that are repaid by user fees or tenant income, not by General Fund Revenues.
ARLINGTON COUNTY, VIRGINIA
RATIOS OF OUTSTANDING DEBT BY TYPE
LAST TEN FISCAL YEARS
Governmental Activities Business-type activities
176

TABLE I-1
Pct. Of Actual Debt Per
General IDA IDA IDA Total Primary Taxable Value of Capita
Fiscal Assessed Obligation Bonds Revenue Lease Revenue Notes Government Real Property
Year Population (1) Value (2) Debt (3) Bonds (4) Bonds (4) Payable (4)
2005 198,267 44,717,396,841 554,185,294 - 60,540,000 - 614,725,294 1.37% 3,100
2006 200,226 53,190,791,357 576,904,155 - 58,085,000 - 634,989,155 1.19% 3,171
2007 204,800 56,369,131,443 585,786,533 - 55,215,000 - 641,001,533 1.14% 3,130
2008 208,000 60,286,173,079 625,498,345 - 52,180,000 - 677,678,345 1.12% 3,258
2009 209,300 60,514,589,567 576,842,463 - 47,120,000 35,962,739 659,925,202 1.09% 3,153
2010 212,200 56,618,734,277 566,435,124 41,280,000 41,900,000 35,666,099 685,281,223 1.21% 3,229
2011 210,280 60,061,289,547 687,933,174 40,135,000 42,635,000 35,016,099 805,719,273 1.34% 3,832
2012 216,004 64,394,426,489 730,532,413 50,660,000 30,945,000 35,016,099 847,153,512 1.32% 3,922
2013 221,045 65,627,006,417 776,934,905 125,285,000 - - 902,219,905 1.37% 4,082
2014 215,000 69,423,299,231 779,454,489 116,500,000 - - 895,954,489 1.29% 4,167
NOTES:
(1) Population estimates are from Arlington County Planning Division estimates.
(2) The assessed value figures are based on County tax years which end December 31st.
(3) Amounts for bonds are reported gross, excluding premiums and/or discounts and deferred amounts on refundings. Amounts do not include revenue bonds.
(4) These amounts are IDA Revenue notes and bonds issued as subject to appropriation obligations of the County.
ARLINGTON COUNTY, VIRGINIA
PRIMARY GOVERNMENT RATIOS OF GENERAL BONDED DEBT OUTSTANDING
LAST TEN FISCAL YEARS
General Bonded Debt
177

TABLE J-1
Fiscal
Year
Gross
Revenue
Total
Expenses (1)
Less Capital
Exp
Less
Deferred
Rent
Cash Basis
Direct
Operating
Expenses
Net Revenue
Available for
Debt Service
Total Debt
Service Coverage
2005 3,926,304 3,583,873 (1,215,163) (405,000) 1,963,710 1,962,594 910,044 2.16
2006 4,070,368 3,618,455 (488,994) (654,996) 2,474,465 1,595,903 1,018,955 1.57
2007 4,368,809 3,659,703 (319,997) (654,996) 2,684,710 1,684,099 1,118,158 1.51
2008 4,318,862 7,268,910 (3,695,305) (654,996) 2,918,609 1,400,253 1,021,719 1.37
2009 3,770,271 3,551,444 (176,871) (654,996) 2,719,577 1,050,694 794,264 1.32
2010 3,963,512 3,510,857 (201,882) (654,996) 2,653,979 1,309,533 724,316 1.81
2011 4,318,389 3,117,191 - (654,996) 2,462,195 1,856,194 707,210 2.62
2012 4,528,050 3,401,220 (67,000) (904,992) 2,429,228 2,098,822 1,413,109 1.49
2013 4,811,697 3,476,857 (53,216) (904,992) 2,518,649 2,293,048 1,368,601 1.68
2014 4,411,414 3,259,670 - (773,747) 2,485,923 1,925,491 629,401 3.06
(1) Excludes depreciation and amortization
ARLINGTON COUNTY, VIRGINIA
PLEDGED - REVENUE COVERAGE
LAST TEN FISCAL YEARS
BALLSTON PUBLIC PARKING GARAGE
178

TABLE J-2
Direct Net Revenue Debt Service Requirement
Fiscal Gross Operating Available for
Year Revenue (1) Expenses (2) Debt Service Principal Interest Total Coverage
2005 59,114,705 41,817,417 17,297,289 3,130,952 2,033,402 5,164,354 3.35
2006 65,044,344 39,453,764 25,590,580 3,074,680 2,585,276 5,659,956 4.52
2007 76,874,765 41,373,056 35,501,709 3,487,382 2,670,385 6,157,767 5.77
2008 102,270,725 42,983,162 59,287,563 5,179,814 6,142,614 11,322,428 5.24
2009 106,771,787 42,908,573 63,863,214 7,084,109 9,634,224 16,718,333 3.82
2010 105,141,066 45,960,228 59,180,838 7,987,869 11,897,384 19,885,253 2.98
2011 101,182,400 47,186,908 53,995,492 7,956,950 14,055,589 22,012,539 2.45
2012 105,787,143 52,382,893 53,404,250 8,295,238 14,030,986 22,326,224 2.39
2013 107,453,634 59,471,356 47,982,278 8,523,845 14,061,159 22,585,004 2.12
2014 105,668,151 58,743,860 46,924,291 8,741,975 12,863,094 21,605,069 2.17
NOTES:
(1) The bonds issued to finance construction of the County's water and sewer system are recorded as a liability of the County's Utilities Fund
(Exhibit D-1). The debt service on these bonds is financed by the operation of the Utilities Fund while these bonds are also classified
as a general obligation of the County.
(2) Excludes depreciation.
ARLINGTON COUNTY, VIRGINIA
UTILITIES BOND COVERAGE
LAST TEN FISCAL YEARS
PLEDGED - REVENUE COVERAGE
179

TABLE K
Fiscal Personal Per Capita School Unemployment
Year Population (1) Income Income (2) Enrollment (3) Rate (4)
(thousands of dollars)
2005 198,267 11,699,736 59,010 18,744 2.5%
2006 200,226 12,132,694 60,595 18,411 2.3%
2007 204,800 13,004,800 63,500 18,451 2.3%
2008 208,000 14,040,000 67,500 18,684 2.6%
2009 209,300 14,841,044 70,908 19,534 4.7%
2010 212,200 15,217,499 71,713 20,233 4.3%
2011 210,280 15,707,916 74,700 21,168 3.9%
2012 216,004 17,273,192 79,967 21,853 3.5%
2013 221,045 18,234,223 82,491 22,763 4.0%
2014 215,000 18,554,500 86,300 23,612 3.5%
NOTES:
1) The 2011-2013 population figures are estimates from the US Census Bureau.
The 2004-2010, & 2014 population figures are estimates from the Arlington County Planning Division.
(2) Source - 2014 & 2005 estimates from the Arlington County Planning Division. 2013-2006 figures reported by U.S. Dept of Commerce
(3) Source - Arlington County School Board, Office of Planning, Management and Budget. Data is for pre K-12 only.
All figures are as of June 30.
(4) Source Figures for 2014-U.S. Bureau of Labor Statistics, Figures 2005-2013 Virginia Employment Commission
ARLINGTON COUNTY, VIRGINIA
DEMOGRAPHIC STATISTICS
LAST TEN FISCAL YEARS
180

TABLE L
2014*
Percentage Percentage
of Total County of Total County
Employers Employees Rank Employment Employers Employees Rank Employment
Department of Defense* 24,000 1 10.88% Department of Defense 40,947 1 20.98%
Arlington County Government & Schools 7,555 2 3.42% Arlington County Government & Schools7,280 2 3.73%
Department of Homeland Security* 7,300 3 3.31% State Department 4,138 3 2.12%
Deloitte* 7,000 4 3.17% Drug Enforcement Administration 2,090 4 1.07%
Department of Justice* 5,300 5 2.40% National Science Foundation 1,996 5 1.02%
State Department* 5,200 6 2.36% Virginia Hospital Center 1,991 6 1.02%
Accenture 4,500 7 2.04% Verizon 1,850 7 0.95%
FDIC* 2,900 8 1.31% Transportation Security Administration1,719 8 0.88%
Virginia Hospital Center 2,698 9 1.22% SAIC 1,689 9 0.87%
SAIC/Leidos* 2,300 10 1.04% Marriott International Inc. 1,680 10 0.86%
National Science Foundation 2,200 11 1.00% US Airways 1,466 11 0.75%
Lockheed Martin Corp 2,187 12 0.99% Environmental Protection Agency 1,397 12 0.72%
Environmental Protection Agency* 2,100 13 0.95% Lockheed Martin Group 1,300 13 0.67%
General Services Administration* 1,970 14 0.89% CACI 1,085 14 0.56%
Marriott International, Inc.* 1,950 15 0.88% US Marshalls Service 1,080 15 0.55%
Booz Allen Hamilton* 1,400 16 0.63% Hecht Company 1,027 16 0.53%
Corporate Executive Board 1,279 17 0.58% SRA International Inc. 910 17 0.47%
BNA Bloomberg 1,015 18 0.46% Federal Supply Service 905 18 0.46%
CACI 813 19 0.37% United States Postal Service - OIG 876 19 0.45%
Marymount University 726 20 0.33% Booz Allen Hamilton 870 20 0.45%
Total 84,393 38.26% 76,296 39.09%
Total At-Place Employment 220,600 195,205
Source: Arlington County Planning Division; Arlington Economic Development
* 1st Quarter Estimates
PRINCIPAL EMPLOYERS
CURRENT YEAR AND NINE YEARS AGO
ARLINGTON COUNTY, VIRGINIA
2005
181

TABLE M
ARLINGTON COUNTY, VIRGINIA
FULL-TIME EQUIVALENT GOVERNMENT EMPLOYEES BY FUNCTION
LAST TEN FISCAL YEARS
Department 2005 2006 2007 2008 2009 2010 2011 2012 2013 2014
County Board 8.0 8.0 8.0 8.0 8.0 7.8 7.8 8.0 8.0 7.8
County Manager 32.0 32.0 35.0 35.0 34.5 37.9 36.9 36.9 37.1 35.9
Management and Finance 54.0 55.0 55.0 55.0 57.0 50.0 54.0 55.0 55.0 55.5
Technology Services 61.7 65.7 65.7 67.8 67.8 70.0 71.0 72.0 74.0 73.0
Human Resources 47.0 49.5 49.5 50.5 51.5 53.5 50.0 51.0 52.0 52.0
Civil Service Commission 0.4 0.4 0.4 0.4 0.0 0.0 0.0 0.0 0.0 0.0
County Attorney 11.0 11.0 11.0 11.0 14.0 14.0 14.0 14.0 14.0 14.0
Circuit Court 33.8 33.8 33.8 34.4 35.8 33.8 32.3 32.3 32.3 32.3
General District Court 1.5 1.5 1.5 1.5 1.5 1.5 1.5 1.5 1.5 1.5
Juvenile and Domestic Relations Court 56.5 56.5 57.5 57.5 57.5 56.3 55.8 55.8 55.8 55.8
Commonwealth's Attorney 39.0 40.0 40.0 40.0 39.0 35.5 34.0 35.0 35.0 35.0
Sheriff 276.3 276.3 277.8 277.8 277.8 268.4 266.0 267.0 271.0 271.0
Commissioner of Revenue 56.0 56.0 56.0 56.0 56.0 54.0 53.0 53.0 52.0 52.0
Treasurer 63.2 63.2 63.2 63.2 63.2 61.8 60.8 60.8 59.8 61.8
Electoral Board 7.4 8.4 8.4 8.4 8.4 8.4 8.4 8.4 8.4 8.4
Office of Emergency Management 55.5 59.5 66.5 66.5 72.5 72.5 71.5 71.5 79.5 76.5
Police 472.0 473.0 475.0 476.0 476.0 475.0 465.0 466.0 466.0 466.0
Fire 305.7 304.7 314.7 314.7 321.3 317.3 316.0 317.0 320.0 321.0
Public Works/Environmental Services 673.3 670.2 670.2 676.7 699.7 688.7 694.7 700.2 721.2 730.2
Human Services 715.1 717.5 718.5 703.5 712.2 703.3 694.7 699.7 685.8 680.5
Libraries 155.8 157.3 157.3 157.8 157.8 142.4 125.1 127.6 135.6 133.9
Economic Development 30.8 30.8 32.8 32.8 31.8 28.8 28.8 28.8 61.6 61.6
Community Planning, Housing & Development 145.4 146.5 156.5 156.5 181.1 179.0 176.0 177.0 197.1 198.6
Parks, Recreation & Cultural Resources 413.0 412.4 412.4 411.3 400.5 378.2 355.8 360.3 345.9 365.9
Total County Positions 3,714.4 3,729.2 3,766.7 3,762.1 3,824.8 3,737.8 3,672.9 3,698.7 3,768.6 3,790.0
Total School Positions 3,620.7 3,577.1 3,588.3 3,613.7 3,676.6 3,770.3 3,787.5 3,937.4 4,047.1 4,109.0 TOTAL POSITIONS 7,335.1 7,306.3 7,355.0 7,375.8 7,501.4 7,508.1 7,460.4 7,636.1 7,815.7 7,898.9
Sources: Arlington County FY2014 Adopted Budget and Arlington County School Board's Adopted Budget FY 2014.
182

TABLE N
ARLINGTON COUNTY, VIRGINIA
OPERATING INDICATORS BY FUNCTION-PROGRAM
JUNE 30, 2014
Form of Government
Date of Adoption January 1, 1932 2005 2006 2007 2008 2009 2010 2011 2012 2013 2014
Area (square miles) 26 26 26 26 26 26 26 26 26 26
Lane Miles 961 961 961 961 961 961 974 974 974 974
Number of Street Lights 15,306 14,753 14,873 14,620 14,657 16,580 16,723 17,267 17,796 18,708
Fire Protection:
Number of Stations 10 10 10 10 10 10 10 10 10 10
Training Academy 1 1 1 1 1 1 1 1 1 1
Education:
Attendance Centers 34 34 34 34 35 37 37 37 37 37
Number of Classrooms 1,720 1,720 1,720 1,720 1,720 1,720 1,720 1,720 1,740 1,760
Number of Teachers 1,981 1,946 1,980 1,962 2,046 2,096 2,105 2,241 2,295 2,406
Number of Students 18,400 18,411 18,451 18,684 19,420 20,233 21,168 21,853 22,763 23,612
County Water System:
Number of consumer service locations 36,567 36,603 36,758 36,828 36,877 37,228 37,574 37,151 37,189 37,343
Average daily consumption (gallons) 26,600,000 26,900,000 24,800,000 24,066,000 23,498,000 23,217,000 23,217,000 22,500,000 22,220,000 22,010,000
Miles of water mains 525 525 525 525 525 525 525 525 525 525
County Sewer System:
Miles of sanitary sewers 470 470 470 470 470 470 470 470 470 470
Average gallons per day treated 26,800,000 25,600,000 24,900,000 24,700,000 24,620,000 26,470,000 26,470,000 22,000,000 20,273,507 23,139,205
System capacity under construction (gallons per day) 10,000,000 10,000,000 10,000,000 10,000,000 10,000,000 10,000,000 10,000,000 10,000,000 0 0
Building Permits:
Construction Permits 4,114 3,948 3,629 3,289 2,473 2,543 2,939 3,074 3,019 3,035
Plumbing, Electrical & Mechanical Permits 7,807 7,806 6,967 7,132 7,232 6,531 7,834 7,907 8,264 8,338
Fire Permits 1,096 1,058 1,022 974 842 804 982 1,052 953 997
Elevator Permits 96 88 127 103 75 116 72 77 99 95
Recreation and Culture:
Number of Parks and Playgrounds 128 212 212 212 212 212 212 219 236 236
Number of Libraries 7 7 8 8 8 8 8 8 8 8
Number of Items (Print and Audiovisual) 554,953 579,729 579,729 629,808 635,284 643,950 662,757 632,517 653,092 633,127
Number of Community Centers 14 14 14 14 14 14 14 14 14 14
Number of Nature Centers 2 2 2 2 2 2 2 2 2 2
Number of Historical Districts 2 29 29 30 30 31 31 32 34 34
183

TABLE O
Primary Government
FUNCTION AND ACTIVITY: 2005 2006 2007 2008 2009 2010 2011 2012 2013 2014
General Government:
Control-
Legislative $51,208 $51,208 $62,401 $58,579 $81,144 $92,430 $114,522 $114,522 $114,522 $114,522
Executive 214,926 214,926 261,906 245,864 340,573 387,942 480,663 480,663 480,663 492,215
Judicial 1,130,274 1,130,274 1,377,339 1,292,973 1,791,038 2,107,374 2,594,988 3,934,611 4,700,614 5,334,523
Total Control 1,396,408 1,396,408 1,701,646 1,597,416 2,212,755 2,587,746 3,190,173 4,529,796 5,295,799 5,941,260
Staff Agencies-
Elections 120,906 120,906 147,335 138,310 191,588 218,235 270,396 270,396 270,396 1,129,595
Management and Finance 209,227 209,227 254,962 239,344 331,542 377,655 467,918 1,077,827 1,588,298 1,610,532
Human Resources 146,253 146,253 178,222 167,306 231,753 347,256 410,350 414,403 414,403 414,403
Office of County Attorney 34,067 34,067 41,514 38,971 53,983 61,491 876,188 923,699 953,687 966,128
Commissioner of the Revenue 42,503 42,503 51,794 48,621 67,350 76,718 595,054 595,054 595,054 595,054
Treasurer 696,245 730,199 889,812 835,309 1,157,077 1,350,098 65,114 65,114 65,114 65,114
Department of Technology Services10,279,481 14,598,718 17,789,831 16,700,152 23,133,198 17,200,391 11,344,264 14,597,576 18,195,395 29,114,164
General government buildings 15,845,252 29,586,427 33,694,735 43,796,601 33,686,400 135,952,812 327,020,186 327,020,186 327,604,012 263,901,049
Total Staff Agencies 27,373,934 45,468,300 53,048,205 61,964,614 58,852,891 155,584,656 341,049,470 344,964,255 349,686,359 297,796,039
Total General Government 28,770,342 46,864,708 54,749,851 63,562,030 61,065,646 158,172,402 344,239,643 349,494,051 354,982,158 303,737,299
Public Safety:
Police 15,625,622 16,082,026 18,439,574 24,163,161 21,722,625 23,703,421 10,138,856 13,102,757 15,073,584 15,273,434
Fire 6,451,228 5,809,121 6,375,013 6,594,563 6,977,207 18,234,142 83,442,395 85,337,968 85,829,937 79,368,941
Emergency management 37,578 806,623 982,942 922,734 1,278,179 1,455,957 4,086,134 5,405,411 5,681,058 5,864,294
Total Public Safety 22,114,428 22,697,770 25,797,529 31,680,458 29,978,011 43,393,520 97,667,385 103,846,136 106,584,579 100,506,669
Environmental Services 381,468,410 392,682,485 407,523,922 414,461,104 497,345,576 434,334,394 474,009,827 526,053,112 632,215,203 732,287,767
Health and Public Welfare 29,242,352 29,392,413 29,891,822 31,394,364 33,758,494 31,765,248 33,069,717 33,105,155 33,322,630 33,767,799
Libraries 9,731,968 9,781,888 10,585,807 12,159,862 11,184,328 18,162,154 29,731,690 30,413,627 30,442,689 30,420,141
Recreation 65,139,947 80,924,974 83,531,614 88,774,344 86,420,777 98,111,470 120,041,977 143,004,838 168,516,013 199,547,391
Community Development 13,584,695 14,359,122 15,431,139 14,644,784 52,373,433 32,837,780 33,022,546 38,051,773 42,891,236 45,798,988
Total General Capital Assets $644,969,188 $692,311,308 $729,384,655 $764,951,857 $878,085,322 $964,877,331 $1,131,782,785 $1,223,968,692 $1,368,954,508 $1,446,066,054
Internal Services Fund
Auto Equipment Fund $39,350,707 $42,409,799 $45,153,446 $45,696,573 $47,569,216 $51,981,340 $56,525,607 $63,781,962 $64,955,970 $71,496,453
Printing Fund 276,061 276,061 276,061 - - - - - - -
Total Internal Services Fund $39,626,768 $42,685,860 $45,429,507 $45,696,573 $47,569,216 $51,981,340 $56,525,607 $63,781,962 $64,955,970 $71,496,453
Component Unit: School Board
Schools $375,199,698 $401,017,012 $448,837,358 $470,609,847 $511,265,426 $556,680,225 $587,053,184 $663,053,770 $736,920,550 $771,819,038
GRAND TOTALS $1,059,795,654 $1,136,014,180 $1,223,651,520 $1,281,258,277 $1,436,919,964 $1,573,538,896 $1,775,361,576 $1,950,804,424 $2,170,831,028 $2,289,381,545
ARLINGTON COUNTY, VIRGINIA
CAPITAL ASSET STATISTICS BY FUNCTION/ PROGRAM
JUNE 30, 2014
184

TABLE P
Percentage of
Total Total Debt Service to
Fiscal Debt General Total General
Year Principal Interest Service (1) Expenditures (2) Expenditures
2005 37,354,049 23,105,199 60,459,248 793,406,820 7.62%
2006 42,802,784 28,546,899 71,349,683 847,593,986 8.42%
2007 43,847,619 28,816,864 72,664,483 963,524,772 7.54%
2008 47,100,186 29,138,615 76,238,801 949,860,596 8.03%
2009 53,715,890 29,857,473 83,573,363 985,054,322 8.48%
2010 53,827,131 29,949,072 83,776,203 1,022,232,400 8.20%
2011 57,645,110 29,848,250 87,493,360 1,011,998,177 8.65%
2012 59,289,762 29,978,921 89,268,683 1,096,768,352 8.14%
2013 60,281,364 32,699,424 92,980,788 1,122,351,681 8.28%
2014 67,578,026 31,926,550 99,504,576 1,185,961,381 8.39%
NOTES:
(1) Excludes debt service on general obligation bonds payable from the Enterprises Fund and all paying agent charges.
(2) Includes all categories of expenditures as presented in Table I
LAST TEN FISCAL YEARS
ARLINGTON COUNTY, VIRGINIA
PERCENTAGE OF ANNUAL DEBT SERVICE EXPENDITURES FOR GENERAL OBLIGATION BONDED DEBT TO
TOTAL GENERAL GOVERNMENTAL EXPENDITURES
185

TABLE Q1 of 4
Type of Coverage & Insurance Company Policy Number Period From Period To Summary of Coverage & Liability Limits Premium Costs
Property All Risk Package Policy coverage on real $441,958.00VACorp through Travelers Insurance VA-AR-006-14 07/01/13 07/01/14 and personal property, valuable papers
and records, Inland Marine equipment,extra expense and business interruptions,Theatrical Equipment Floater, Fine Arts, Includes TRIA
Property Floater, EDP, Voting Machines andoff premises power failures & boiler &
machinery. $50,000 deductible. TIV $636 million subject 1 program limits of $ 500million. Incl. earthquake, flood, boiler & mach.
Garagekeeper's Liab., Physical Damage on County vehicles while garaged
Crime PolicyZurich American Ins. Co. VA-AR-006-14 07/01/13 07/01/14 Public Employee Dishonesty , Forgery or Alteration, $8,785.00
Theft, Disappearance and Destruction and computer Excludes TRIAFraud. Faithful performance of duty a covered cause
of loss. Volunteer workers included as employees2 Limit: $1 million,
Deductible: $25,000
Fine Arts Policy Museum Collection and Temporary Loans $0.00VACorp through Travelers Insurance VA-AR-006-14 07/01/13 07/01/14 Policy-- Limits of $ 1,000,000 on AC premises
Now part of blanket property policy $ 250,000 any other location Now part of property 3 $ 1,000 Deductible/ $ 2,500 per outdoor sculpture policy
Legal Liability -- $ 250,000 any one loss
Performing Arts Package Ins. Policy for Performing Arts Group Package PolicyPackage Business Policy AIP 0000544711303 07/01/13 07/01/14 DBA Rosslyn TheaterLexington Insurance Co. Incl.$ 1/2 million GL $11,148.00
4 $ 850,000 Property
General Liability, Public Officials Liab.Law Enforcement Liab, Auto Liability Self Insured for Liability Exposures.
Covers Arlington County employees County Board Resolution Continuous Continuous AL, POL, LEL, GL - Primary $1,000,000and Officials conducting County
business5
Umbrella Excess Liability Policy Excess Public Entity Liability Policy $320,000.00VACo/Genesis VA-AR-006-14 07/01/13 07/01/14 Excess of $ 1,000,000 self-insured retention
6 $ 10 million limits excess of SIR
ARLINGTON COUNTY, VIRGINIASCHEDULE OF INSURANCE
JULY 1, 2013 - JUNE 30, 2014
186

TABLE Q2 of 4
Type of Coverage & Insurance Company Policy Number Period From Period To Summary of Coverage & Liability Limits Premium Costs
ARLINGTON COUNTY, VIRGINIASCHEDULE OF INSURANCE
JULY 1, 2013 - JUNE 30, 2014
Constitutional Officers Covers Owned, Hired and Non-owned Liability, Uninsured Motorists & Medica $30,408.00Business Auto VA-AR-006-14 07/01/13 07/01/14 Payments. $1,000,000 each occurance for Package Policy Liability, $1,000 for medical payments.
VACorp Const. Officers and Volunteer General Liability $ 2 million per occurrence7
HIDTA Task Force $1,376.00Commercial Package Policy 14UUNNN5448 07/01/13 07/01/14 Liability coverage--$ 1million/2million
Twin City Fire Insurance Company Business Personal Property--Ded. $500 (includes TRIA)8
Medical Prof.Liability $211,573.00Arch Speciality Insurance FLP002233605 07/01/13 07/01/14
Limits: $ 2/6 million9 $ 25,000 DED. Each claim
Group Accident Coverage Coverage coordinated with pers. CoverageNational Union Fire Ins. SRG 0009105405 07/01/13 07/01/14 AD&D for volunteers $14,234.00National Union Fire Ins. SRG 0009105406 07/01/13 07/01/14 AD&D for Campers $9,920.00National Union Fire Ins. SRG 0009105403 07/01/13 07/01/14 AD& D for Recreational Sports $8,649.00
MARKEL INS. 4102aH396738 07/01/13 07/01/14 AD&D for Community Service Program $795.00ACE American Ins. Co. PTP N 04830052 07/01/13 07/01/14 AD&D for Auxiliary Police $784.00
10TOTAL PREMIUM $34,382.00
County Board Surety Bond M. Hynes ContinuousL. Garvey until Bond limit $ 2,500 3 yr. policyJ. Fisette Cancelled
J. Vihstadt11 W. Tejada
VDOT Permit Bond Virginia highways permit bond for facilities located on the VDOT right-of-wayTravelers 53 S 101062299 Continuous Limit $ 100,000 $0
12
Professional Liability Insurance Employed and Contracted Physicians, Clinic Staff and EMS
187

TABLE Q3 of 4
Type of Coverage & Insurance Company Policy Number Period From Period To Summary of Coverage & Liability Limits Premium Costs
ARLINGTON COUNTY, VIRGINIASCHEDULE OF INSURANCE
JULY 1, 2013 - JUNE 30, 2014
Excess Liability Ballston Garage Excess liability coverage required by May Co. regarding ice rink at Ballston Garage. ARCH Ins. Group UFP0034489-03 07/01/13 07/01/14
Travelers QY01225601 07/01/13 07/01/14 $45,000.00$29,000.00
13
Fiduciary Liability Policy Fiduciary Liab. To $ 10millionEmployee's Suppl. Retirement Sys 2 PLS 2672194 ERISA Fidelity bond Premium not
National Union/Alton Agency D&O, Trustees liab. To $ 3million incl. in totalThese p[olicies handled by the Retirement Board
14 Risk Management is not involved in the purchase of these policies
Constitutional Officers' Liability PlanRisk Coverage
Commonwealth of Virginia (SIR)
Clerk of Court Virginia Risk Continuous Limits: $1 million per loss, $1 million aggregate
Sheriff Virginia Risk Continuous Limits: $1 million per loss, $1 million aggregate
Commissioner of Revenue Virginia Risk Continuous Limits: $1 million per loss, $1 million aggregate
Commonwealth's Attorney Virginia Risk Continuous Limits: $1 million per loss, $1 million aggregate
Registrar of Voters Virginia Risk Continuous Limits: $1 million per loss, $1 million aggregate
Arlington County Treasurer Virginia Risk Continuous Limits: $1 million per loss, $1 million aggregate15
Fire and Rescue Auto Physical Damage CM1054007-06 07/01/13 07/01/14 $81,635.00VFIS/ American Alternative Insurance Incl. TRIA
16 $ 1,000 Ded. Per unit
Police Command Vehicle Inland Marine policy covering portable Police equipment and Command Vehic $7,222.00Incl. TRIA
Hartford Fire Insurance Company 42 MS UG3055 07/01/13 07/01/1417
Provides comprehensive and collision coverage on vehicles owned or operated by ACFD
Combined Program for CGL/POL & LEL covers Public Officials & Employees by reason of any wrongful Act, rendered in the discharge of
188

TABLE Q4 of 4
Type of Coverage & Insurance Company Policy Number Period From Period To Summary of Coverage & Liability Limits Premium Costs
ARLINGTON COUNTY, VIRGINIASCHEDULE OF INSURANCE
JULY 1, 2013 - JUNE 30, 2014
Portable Equipment-Fire Command Vehicle Inland Marine policy covering ACFD equipment & Command Veh. $9,954.00VFIS American Alternative Insurance TR-2056525-06 07/01/13 07/01/14
18
Blanket Volunteer Liability Covers Liability of Volunteers $4,760.00VaCorp VA-AR-006-14 07/01/13 07/01/14
19
TOTAL $1,237,201.00
189

TABLE R
Residential Commercial Miscellaneous
Construction (1) Construction (1) Construction (1)
Fiscal
Year Permits Valuation Permits Valuation Permits Valuation Residential Commercial Non-Taxable
2005 245 65,578,000 58 471,549,000 12,810 410,999,470 24,807,985,800 17,467,436,100 5,254,797,800
2006 309 116,622,000 28 170,648,000 12,570 731,419,504 30,490,616,900 20,142,057,000 6,446,120,900
2007 154 42,199,000 54 279,540,000 11,537 787,764,529 31,217,514,500 23,075,322,700 7,211,250,200
2008 132 32,778,000 76 295,231,000 11,331 646,663,518 31,511,540,600 25,957,959,400 7,208,720,200
2009 160 43,325,775 84 409,257,463 11,526 372,491,217 31,176,590,200 26,604,956,900 7,489,437,300
2010 172 45,497,100 50 165,948,125 12,454 363,788,580 30,395,184,100 23,590,330,900 7,079,999,000
2011 204 59,770,300 60 372,020,336 12,690 367,577,766 30,826,414,200 26,435,423,200 7,155,902,000
2012 158 49,734,782 86 487,803,163 12,003 443,979,014 31,308,133,600 30,363,228,300 7,313,610,400
2013 179 61,926,017 98 406,183,727 13,219 538,830,401 36,869,425,300 26,021,905,000 7,410,523,300
2014 188 93,344,705 83 179,141,259 15,338 466,745,648 39,564,853,200 26,835,092,400 7,936,267,300
NOTES:
(1) Department of Community Planning, Housing and Development, Planning Division-- Inspection Services
(2) Estimated actual value. Excludes public service corporations.
ARLINGTON COUNTY, VIRGINIA
CONSTRUCTION ACTIVITY AND REAL PROPERTY VALUE
LAST TEN FISCAL YEARS
Real Property Value (2)
190

TABLE S
Fiscal Year Revenues Percent Change
2003 43,206,157 -5.38%
2005 45,699,044 1.35%
2006 52,568,059 15.23%
2007 50,898,687 -3.28%
2008 57,266,956 11.12%
2009 57,272,629 0.01%
2010 58,611,239 2.34%
2011 60,460,108 3.23%
2012 61,939,212 5.81%
2013 61,341,154 4.77%
2014 62,752,491 2.30%
ARLINGTON COUNTY, VIRGINIA
BUSINESS AND PROFESSIONAL LICENSE TAX REVENUES
LAST TEN FISCAL YEARS
191

192

TABLE U
WATER Monthly Average Consumption SEWER Monthly Average Consumption
Customer / Type of Business In Thousands of Gallons Customer / Type of Business In Thousands of Gallons
Ft. Myer 11,023 Ft. Myer 11,023
Military Military
Archstone Communities - 1600 S. Eads 5,144 Reagan National Airport 11,062
Residential Aviation
Vornado - 1400 S. Joyce Street 3,258 Pentagon 10,552
Apartments Military
Vornado - 1600 S. Joyce Street 2,923 Archstone Communities - 1600 S. Eads 5,144
Retail Residential
Vornado - 1111 S. Army Navy Drive 2,553 Vornado - 1400 S. Joyce Street 3,258
Apartments Apartments
Pentagon City Mall 2,493 Vornado - 1600 S. Joyce Street 2,923
Retail Retail
Marriott Crystal City 2,465 Vornado - 1111 S. Army Navy Drive 2,553
Hotel Apartments
Archstone Communities - 320 S. 23rd Street 2,355 Pentagon City Mall 2,493
Residential Retail
Carlton Condominiums- 4600 S. Four Mile Run 2,274 Marriott Crystal City 2,465
Residential Hotel
Washington Golf & Country Club 2,215 Archstone Communities - 320 S. 23rd Street 2,355
Recreation Residential
NOTE:
(1) Source - County Department of Environmental Services - Utilities Services Office
ARLINGTON COUNTY, VIRGINIA
LARGEST USERS OF THE WATER & SEWER SYSTEM
FOR THE TWELVE MONTHS ENDING JUNE 30, 2014
193

TABLE V
Wastewater System
Description of System
Plant Upgrade & Expansion
Major Customers
In April 2001, County staff and an external engineering team were assembled to update the 1988 Master Plan toaddress wet weather external bypasses, new and foreseen regulations, aging infrastructure and capacity requirementswith respect to the Wastewater System. The result of this effort is the Master Plan Update 2001 (“MP01”). The MP01provides for the goal of minimization of wet weather external bypasses, increased redundancy, expansion of capacityto handle flows to approximately 2020 + and a positive environmental impact for Four Mile Run, the Potomac River,and the Chesapeake Bay. The MP01 features a two phase design process and three construction contracts as wellas program management and engineering services. Major facilities included in the MP01 include two new aerationtanks, two new equalization tanks, a new biofilter facility, and three new secondary clarifiers.
The total cost of all phases of the MP01 is estimated to be $568 million. County ratepayer’s share is estimated to be82 percent; Inter-Jurisdictional Partners’ share is 18 percent. Financing to date for the County’s share has beenprovided by several sources. There have been eight Wastewater System & Water System Revenue bonds totaling$300 million issued to the Virginia Water Facilities Revolving Loan Fund Program (the “VWFRF”) which isadministered by the Virginia Resources Authority (“VRA”). General Obligation bonds of the County were issued in2007 for $48.5 million, 2008 for $27.4 million, and 2009 for $11.7 million. Grant funds from the Water QualityImprovement Fund under the Department of Environmental Quality Chesapeake Bay Program for approximately $96million were authorized in February 2007.
The County’s wastewater system serves residents and businesses in the County. A list of the top ten retailwastewater customers is included in Table U of the Statistical Section. On a wholesale basis, the County’swastewater system serves Alexandria Sanitation Authority; the City of Alexandria, Virginia; the City of Falls Church,Virginia; and Fairfax County, Virginia (together, the “Inter-Jurisdictional Partners” or “IJ Partners”). Arlington hascontractual agreements for wastewater conveyance and treatment with the IJ Partners that set forth the terms of theserelationships, including the calculation of both operating and capital charges. A summary of each IJ Partner contract isincluded in the table below; additional information on the contracts can be requested from the County’s Department ofEnvironmental Services, Utilities Service Office at (703) 228-3601.
The County’s system presently consists of 465 miles of gravity sewer lines, eleven pumping stations, three ejectorstations, two meter stations and the Plant. The Plant has a rated capacity of 40 million gallons per day (MGD).Current flows average 23.1 MGD.
ARLINGTON COUNTY, VIRGINIADESCRIPTION OF THE WASTEWATER & WATER SYSTEM & WASTEWATER & WATER RATES
JUNE 30, 2014
The County began its pollution abatement program in 1933 with the approval of a bond referendum for a county-widesewage system to include 100 miles of sanitary sewers and a water pollution control plant (the “Plant”) providingprimary treatment. The Plant was placed in service in 1937. In response to continued growth, the Plant has beenrepeatedly expanded, with upgrades providing for advanced treatment, new preliminary treatment, a new dewateringbuilding, and a new equalization tank to minimize fluctuation of flow to the Plant.
194

IJ Partner Share of Plant Capacity Agreement Expiration Date3.0 MGD June 30, 2004Peak flow capacity reservation of6.6 MGD
Fairfax provided written notification that contractwill be honored until new agreement is negotiated
3.0 MGD June 30, 1987Maximum daily flow capacityreservation of 7.5 MGD
Agreement provides that it is binding untilArlington system is not in existence and as longas either party is not in default. ASA providedwritten notification that contract will be honoreduntil new agreement is negotiated.ASA provided written notification that contract willbe honored until new agreement is negotiated
0.8 MGD September 9, 2012Peak flow capacity of 2.0 MGD
Water Distribution System
Description of System
Washington Aqueduct Agreement
Wastewater & Water Rates
Arlington County purchases water on a wholesale basis from the Washington Aqueduct, a branch of the U.S. ArmyCorps of Engineers. The water system was established in 1927 after an Act of Congress, approved April 14, 1926,authorized Arlington County to receive water from a water supply pumping station at the Dalecarlia Reservoir WaterTreatment Plant in northwest Washington, D.C. Average daily production for the entire Washington Aqueduct system,which includes two water treatment plants in the District of Columbia, Dalecarlia and McMillan, is 140 MGD.
The County’s water distribution system presently consists of approximately 500 miles of pipes with diameters of up to48 inches, five pumping stations, and 32 million gallons of finished storage. Current daily average flow is 22.01 MGDto approximately 37,350 service accounts. The system serves residents and businesses in the County but does notprovide water to the Pentagon or Reagan National Airport except under emergency situations, during construction, orother unusual circumstances.
The County entered into an agreement dated as of July 17, 1997 (the “Water Sales Agreement”) with the UnitedStates of America acting through the Secretary of the Army providing for the sale and furnishing of water to the Countyfrom the Washington Aqueduct. The County has pledged the revenues derived from the ownership and operation ofits water system to secure its pro rata share of Aqueduct operating costs, including operations and maintenance, thecost of any water purchases for resale, and debt service on certain loans made by the Secretary of the Treasury to theDistrict of Columbia and the Secretary of the Army and debt service on certain bonds previously issued by the Districtof Columbia., all of which were incurred to finance improvements to the Secretary of the Army’s water system.Additional information on the Water Sales Agreement can be requested from the County’s Department ofEnvironmental Services, Utilities Service Office at (703) 228-3601.
Retail rates for fiscal years 2010 through 2015 are shown in the following table. The typical residential customer pays$76.08 per month, assuming annual consumption of 70,000 gallons. Historically, rate increases have been effectiveon May 1 prior to the start of the fiscal year.
Fairfax County
City of Alexandria & Alexandria Sanitation Authority (ASA)
City of Falls Church
195

Outstanding Debt
Other Financial & Legal Information
Additional financial information on the Utilities Fund can be found in Exhibits D-1, D-2, and D-3 and the accompanyingNotes to the Financial Statements, including a statement regarding significant litigation, if any. Information oninsurance coverage can be found in Table Q of the Statistical Section. Required certificates from the County and itsindependent engineer can be found in Tables T and W of the Statistical Section. Information on management of theCounty and the Department of Environmental Services and the Department of Management and Finance can be foundin the Introductory Section.
FY 2010 – FY 2015 Wastewater & Water RatesPer 1,000 Gallons of Metered Water Usage
The County also charges a variety of other water and wastewater fees to its retail customers, including infrastructureavailability fees, connection fees, pretreatment fees, late charges, and new account fees, among others.
As of June 30, 2014, general obligation debt outstanding attributable to the Utilities Fund totaled $112,630,512. As ofJune 30, 2014, outstanding debt for Wastewater System and Water System Revenue Bonds issued through theVWFRF to the VRA totaled $233,282,936. The following table shows future debt service on these obligations.
Historical debt service coverage can be found in Table J-2 of the Statistical Section, and additional information on debtattributable to the Utilities Fund can be found in Exhibit S-3, the Combined Schedule of Long-Term Obligations.
Fiscal Year Water Wastewater Total
Percent Change
2010 $3.42 $7.78 $11.20 6% 2011 $3.50 $8.24 $11.74 5% 2012 $3.68 $8.51 $12.19 4%
2013 $3.98 $8.63 $12.61 3% 2014 $3.98 $8.63 $12.61 0% 2015 $4.10 $8.94 $13.04 3%
Fiscal Year VRA Bonds TotalEnded June 30 Principal Interest Total Principal Interest Total Principal Interest Total
2015 8,163,451 4,706,109 12,869,560 13,347,499 7,219,539 20,567,038 21,510,950 11,925,648 33,436,598 2016 8,273,257 4,354,005 12,627,262 13,766,712 6,800,327 20,567,039 22,039,969 11,154,332 33,194,301 2017 8,188,789 3,909,997 12,098,786 14,199,191 6,367,848 20,567,039 22,387,980 10,277,845 32,665,825 2018 7,878,165 3,884,882 11,763,047 14,645,359 5,921,679 20,567,038 22,523,524 9,806,561 32,330,085 2019 7,842,778 3,294,269 11,137,047 15,105,654 5,461,385 20,567,039 22,948,432 8,755,654 31,704,086 2020 7,340,101 2,957,454 10,297,555 15,580,525 4,986,514 20,567,039 22,920,626 7,943,968 30,864,594 2021 7,615,216 2,674,303 10,289,519 16,070,438 4,496,601 20,567,039 23,685,654 7,170,904 30,856,558 2022 7,210,546 2,286,824 9,497,370 16,575,872 3,991,166 20,567,038 23,786,418 6,277,990 30,064,408 2023 7,500,000 1,971,697 9,471,697 17,097,325 3,469,714 20,567,039 24,597,325 5,441,411 30,038,736 2024 7,603,208 1,617,409 9,220,617 17,635,305 2,931,733 20,567,038 25,238,513 4,549,142 29,787,655 2025 7,960,000 1,266,679 9,226,679 18,190,343 2,376,696 20,567,039 26,150,343 3,643,375 29,793,718 2026 7,980,000 924,724 8,904,724 18,762,982 1,804,057 20,567,039 26,742,982 2,728,781 29,471,763 2027 6,135,000 638,601 6,773,601 12,554,903 1,265,540 13,820,443 18,689,903 1,904,141 20,594,044 2028 4,285,000 432,883 4,717,883 12,952,052 868,392 13,820,444 17,237,052 1,301,275 18,538,327 2029 2,220,000 302,951 2,522,951 7,957,350 495,860 8,453,210 10,177,350 798,811 10,976,161 2030 2,220,000 219,020 2,439,020 6,441,442 224,267 6,665,709 8,661,442 443,287 9,104,729 2031 2,220,000 134,450 2,354,450 2,399,984 39,120 2,439,104 4,619,984 173,570 4,793,554 2032 1,260,000 63,292 1,323,292 1,260,000 63,292 1,323,292 2033 650,000 19,600 669,600 650,000 19,600 669,600 2034 85,000 3,188 88,188 85,000 3,188 88,188
112,630,511 35,662,337 148,292,848 233,282,936 58,720,438 292,003,374 345,913,447 94,382,775 440,296,222
Total Existing GO Debt Service
196

TABLE W
197

FEDERALLY ASSISTED PROGRAMS In June 1996, the U.S. Office of Management and Budget revised OMB Circular A-133, “Audits of States, Local Governments, and Non-profit Organizations.” The underlying concept of this circular is to establish uniform audit requirements for state, local government, and non-profit organizations that receive federal awards. Contained in this section are the following independent Auditor’s Reports on: Schedule of Expenditures of Federal Awards; Compliance and on Internal Control over Financial
Reporting; and Compliance with requirements applicable to each major
program and internal control over compliance in accordance with OMB Circular A-133
198

CliftonLarsonAllen LLP www.CLAconnect.com
INDEPENDENT AUDITORS’ REPORT ON INTERNAL CONTROL OVER FINANCIAL REPORTING AND ON COMPLIANCE AND OTHER MATTERS
BASED ON AN AUDIT OF FINANCIAL STATEMENTS PERFORMED IN ACCORDANCE WITH GOVERNMENT AUDITING STANDARDS
The Honorable Members of the County Board Arlington County, Virginia We have audited, in accordance with the auditing standards generally accepted in the United States of America and the standards applicable to financial audits contained in Government Auditing Standards issued by the Comptroller General of the United States,the accompanying financial statements of the governmental activities, the business-type activities and aggregate discretely presented component units, each major fund, the budgetary comparison for the General Fund, and the aggregate remaining fund of Arlington County, Virginia, as of and for the year ended June 30, 2014, and the related notes to the financial statements, which collectively comprise the County’s basic financial statements, and have issued our report thereon dated October 31, 2014. Our report included a reference to other auditors who audited the financial statements of Gates Partnership as described in our report on the County’s financial statements. This report does not include the results of the other auditors’ testing of internal control over financial reporting on compliance and other matters that are reviewed separately by those auditors. Internal Control Over Financial Reporting
In planning and performing our audit of the financial statements, we considered the County's internal control over financial reporting (internal control) to determine the audit procedures that are appropriate in the circumstances for the purpose of expressing our opinion on the financial statements, but not for the purpose of expressing an opinion on the effectiveness of the County’s internal control. Accordingly, we do not express an opinion on the effectiveness of the County’s internal control. A deficiency in internal control exists when the design or operation of a control does not allow management or employees, in the normal course of performing their assigned functions, to prevent, or detect and correct, misstatements on a timely basis. A material weakness is a deficiency, or a combination of deficiencies, in internal control, such that there is a reasonable possibility that a material misstatement of the entity’s financial statements will not be prevented, or detected and corrected on a timely basis. A significant deficiency is a deficiency, or a combination of deficiencies, in internal control that is less severe than a material weakness, yet important enough to merit attention by those charged with governance. Our consideration of internal control was for the limited purpose described in the first paragraph of this section and was not designed to identify all deficiencies in internal control that might be material weaknesses or significant deficiencies. Given these limitations, during our audit we did not identify any deficiencies in internal control that we consider to be material weaknesses. However, material weaknesses may exist that have not been identified.
An independent member of Nexia International199

Compliance and Other Matters
As part of obtaining reasonable assurance about whether the County's financial statements are free from material misstatement, we performed tests of its compliance with certain provisions of laws, regulations, contracts, and grant agreements, noncompliance with which could have a direct and material effect on the determination of financial statement amounts. However, providing an opinion on compliance with those provisions was not an objective of our audit, and accordingly, we do not express such an opinion. The results of our tests disclosed no instances of noncompliance or other matters that are required to be reported under Government Auditing Standards.
Purpose of this Report
The purpose of this report is solely to describe the scope of our testing of internal control and compliance and the result of that testing, and not to provide an opinion on the effectiveness of the County’s internal control or on compliance. This report is an integral part of an audit performed in accordance with Government Auditing Standards in considering the County’s internal control and compliance. Accordingly, this communication is not suitable for any other purpose.
a Arlington, Virginia October 31, 2014
200

CliftonLarsonAllen LLP www.CLAconnect.com
INDEPENDENT AUDITORS’ REPORT ON COMPLIANCE WITH REQUIREMENTS THAT COULD HAVE A DIRECT AND MATERIAL EFFECT ON
EACH MAJOR FEDERAL PROGRAM, ON INTERNAL CONTROL OVER COMPLIANCE, AND ON THE SCHEDULE OF EXPENDITURES OF FEDERAL AWARDS IN
ACCORDANCE WITH OMB CIRCULAR A-133
The Honorable Members of the County Board Arlington County, Virginia Report on Compliance for Each Major Federal Program
We have audited Arlington County, Virginia’s (the County) compliance with the types of compliance requirements described in the OMB Circular A-133 Compliance Supplement that could have a direct and material effect on each of the County’s major federal programs for the year ended June 30, 2014. The County’s major federal programs are identified in the summary of auditors’ results section of the accompanying schedule of findings and questioned costs. The County’s basic financial statements include the operations of the Gates Partnership, which is not included in the schedule for the year ended June 30, 2014. Our audit, described below, did not include the operations of Gates Partnership. Management’s Responsibility
Management is responsible for compliance with the requirements of laws, regulations, contracts, and grants applicable to its federal programs. Auditors’ Responsibility
Our responsibility is to express an opinion on compliance for each of the County’s major federal programs based on our audit of the types of compliance requirements referred to above. We conducted our audit of compliance in accordance with auditing standards generally accepted in the United States of America; the standards applicable to financial audits contained in Government Auditing Standards, issued by the Comptroller General of the United States; and OMB Circular A-133, Audits of States, Local Governments, and Non-Profit Organizations. Those standards and OMB Circular A-133 require that we plan and perform the audit to obtain reasonable assurance about whether noncompliance with the types of compliance requirements referred to above that could have a direct and material effect on a major federal program occurred. An audit includes examining, on a test basis, evidence about the County’s compliance with those requirements and performing such other procedures as we considered necessary in the circumstances. We believe that our audit provides a reasonable basis for our opinion on compliance for each major federal program. However, our audit does not provide a legal determination of the County’s compliance. Opinion on Each Major Federal Program
In our opinion, the County complied, in all material respects, with the types of compliance requirements referred to above that could have a direct and material effect on each of its major federal programs for the year ended June 30, 2014.
An independent member of Nexia International201

Report on Internal Control Over Compliance
Management of the County is responsible for establishing and maintaining effective internal control over compliance with the types of compliance requirements referred to above. In planning and performing our audit of compliance, we considered the County’s internal control over compliance with the types of requirements that could have a direct and material effect on each major federal program to determine the auditing procedures that are appropriate in the circumstances for the purpose of expressing an opinion on compliance for each major federal program and to test and report on internal control over compliance in accordance with OMB Circular A-133, but not for the purpose of expressing an opinion on the effectiveness of internal control over compliance. Accordingly, we do not express an opinion on the effectiveness of the County’s internal control over compliance. A deficiency in internal control over compliance exists when the design or operation of a control over compliance does not allow management or employees, in the normal course of performing their assigned functions, to prevent, or detect and correct, noncompliance with a type of compliance requirement of a federal program on a timely basis. A material weakness in internal control over compliance is a deficiency, or combination of deficiencies, in internal control over compliance, such that there is a reasonable possibility that material noncompliance with a type of compliance requirement of a federal program will not be prevented, or detected and corrected, on a timely basis. A significant deficiency in internal control over compliance is a deficiency, or a combination of deficiencies, in internal control over compliance with a type of compliance requirement of a federal program that is less severe than a material weakness in internal control over compliance, yet important enough to merit attention by those charged with governance. Our consideration of internal control over compliance was for the limited purpose described in the first paragraph of this section and was not designed to identify all deficiencies in internal control over compliance that might be material weaknesses or significant deficiencies. We did not identify any deficiencies in internal control over compliance that we consider to be material weaknesses. However, material weaknesses may exist that have not been identified. The purpose of this report on internal control over compliance is solely to describe the scope of our testing of internal control over compliance and the result of that testing based on the requirements of OMB Circular A-133. Accordingly, this report is not suitable for any other purpose.
Report on Schedule of Expenditures of Federal Awards Required by OMB Circular A-133
We have audited the accompanying financial statements of the governmental activities, the business-type activities and aggregate discretely presented component units, each major fund, the budgetary comparison for the General Fund, and the aggregate remaining fund of Arlington County, Virginia, as of and for the year ended June 30, 2014, and the related notes to the financial statements, which collectively comprise the County’s basic financial statements. We issued our report thereon dated October 31, 2014, which contained unmodified opinions on those financial statements. Our audit was conducted for the purpose of forming opinions on the financial statements that collectively comprise the basic financial statements. The accompanying schedule of expenditures of federal awards is presented for purposes of additional analysis as required by OMB Circular A-133 and is not a required part of the basic financial statements. Such information is the responsibility of management and was derived from and relates directly to the underlying accounting and other records used to prepare the basic financial statements. The information
202

has been subjected to the auditing procedures applied in the audit of the financial statements and certain additional procedures, including comparing and reconciling such information directly to the underlying accounting and other records used to prepare the basic financial statements or to the basic financial statements themselves, and other additional procedures in accordance with auditing standards generally accepted in the United States of America. In our opinion, the schedule of expenditure of federal awards is fairly stated, in all material respects, in relation to the basic financial statements as a whole.
a Arlington, Virginia October 31, 2014
203

Page 1 of 6
Federal
Catalogue
Number Expenditures
DEPARTMENT OF FEDERAL PROGRAM
Department of Health and Human Services
Pass Through Payments:
Department of Social Services:
Refugee Programs - Indo-Chinese Refugee Relief
(765/452-04) 93.566 $50,212
Social Services Block GrantSocial Services Block Grant
(Purchased Services) (765/453-01) 93.667 892,487
(Medical Assistance) 93.778 2,046,901
(Child Care Purchased Services) 93.596 187,414
(View Purchased Services) 93.558 1,326,594
Child Care Development Block Grant (102-586) 93.575 -
FAMIS Outreach Grant 93.767 73,399
ILP Education & Training Vouchers 93.599 6,226
Family Preservation 93.556 24,609
Independent Living 93.674 27,561
Foster Care & Adoptions (765/453-01)
Foster Care 93.658 893,315
Adoption 93.659 581,390
Admin Title IV-B1 93.645 9,245
Fuel Assistance Program(765/452-06) 93.568 113,587
Total Department of Social Services 6,232,941
Department of Health Services:
Immunization Grant 93.268 113,629
Family Planning Grant 93.217 114,459
Maternal and Child Health Grant 93.994 88,386
TB Outreach Grant 93.116 189,450
Total Department of Health Services 505,923
Department of Mental Health and Mental Retardation
Alcohol and Drug Abuse and Mental Health Services
Block Grant(790/445-01/455-02)
Homeless-Mental Path 93.150 75,307
Integrated Behavioral - Primary Care 93.243 332,467
Mental Health -Seriously mentally III 93.958 32,290
SA Treatment FBG 93.959 373,650
SA SARPOS FBG 93.959 94,197
SA FBG Co-Occurring 93.959 19,286
SA FBG Women 93.959 76,137
Early Intervention Funds (PIE-PART C) 84.181 367,027
Total Mental Health Mental Retardation and Substance Abuse 1,370,361
Department for the Aging
Older Americans Act
Title III-B-Area Plan 93.044 230,362
Title III-C-Nutrition 93.045 122,354
Title III-E- National Family Caregiver Support 93.052 56,928
Title VII-Elder Abuse Prevention 93.041 2,222
Senior Medicare Patrol Project 93.048 4,034
Door Through Door 93.048 45,138
Health Insurance Counseling & Assistance 93.779 34,985
Total Department for the Aging - OAA 496,023
TOTAL DEPARTMENT OF HEALTH AND HUMAN SERVICES $8,605,248
See accompanying notes to Schedule of Federal Awards.
SCHEDULE OF EXPENDITURES OF FEDERAL AWARDS
FOR THE YEAR ENDED JUNE 30, 2014
ARLINGTON COUNTY, VIRGINIA
204

Page 2 of 6
Federal
Catalogue
Number Expenditures
DEPARTMENT OF HOUSING AND URBAN DEVELOPMENT
Direct Federal Payments
Community Development Grants
Twenty-seventh Entitlement(B01UC51002) 14.218 $71,876
Twenty-ninth Entitlement(B03UC51002) 14.218 20,793
Thirty-third Entitlement(B07UC51002) 14.218 12,180
Thirty-sixth Entitlement(B10UC51002) 14.218 17,020
Thirty-seventh Entitlement(B11UC51002) 14.218 48,007
Thirty-eighth Entitlement(B12UC51002) 14.218 35,373
Thirty-ninth Entitlement(B13UC51002) 14.218 1,028,999
Sub-Community Development Block Grants 1,234,248
CDBG Program income spent 14.218 1,538,830
HOME Administration Grant 14.239 21,297
1,560,127
Sub- total Community Development Grants 2,794,375
Community Service Block Grant 93.569 106,074
Total Community Development Grants 2,900,449
Section 8 Housing Assistance
Voucher Program (VAO28VO015-023) 14.871 14,939,047
Voucher Program - Administrative Expense 14.872 1,446,361
HUD-Shelter Plus Care-Rental Assistance 14.240 255,940
HUD-Shelter Plus Care-Administrative Exp. 14.240 2,358
HUD-HOPWA-Rental Assistance 14.241 58,547
HUD-Family Unification Program 14.880 709,926
Total Section 8 Housing Assistance 17,412,179
HUD-Federal Emergency Shelter Grant 14.231 127,960
HUD-Supportive Housing Program- Administrative Exp. 14.235 5,239
HUD-Adopt a Family Grant 14.235 329,201
Total HUD Grant 462,400
TOTAL DEPARTMENT OF HOUSING AND URBAN DEVELOPMENT $20,775,028
See accompanying notes to Schedule of Federal Awards.
ARLINGTON COUNTY, VIRGINIA
SCHEDULE OF EXPENDITURES OF FEDERAL AWARDS
FOR THE YEAR ENDED JUNE 30, 2014
205

Page 3 of 6
Federal
Catalogue
Number Expenditures
DEPARTMENT OF EDUCATION
Pass Through Payments:
Department of Education
Elementary and Secondary Education Act-
Title I (197/171/01) 84.010 $2,421,099
Title I Reading Recovery - Sub grantee (Shippensburg State) 84.377 50,012
Title I Part A 1003 G School Improvement 84.377 64,006
ARRA 1003g School Improvement 84.388 70,220
21st Century Community Learning Centers 84.287 35,563
IDEA Part B Section 611 (197/171-02) 84.027 3,736,859
Learning and Library Resources-
Pre-School Incentive 84.173 77,838
Title III, Part A (NCLB) Emergency Immigration
(197/171-06) 84.365 558,566
Vocational Education Act - Carl D Perkins PL-101-392 84.048 261,570
Education for Homeless Children & Youth (Stuart B McKinney) 84.196 46,570
Title II, Part A Improving Teacher Quality 84.367 594,696
Project Discovery (College Access Challenge Grant) 84.378 13,555
Total State Pass Through Payments 7,930,554
Total Department of Education $7,930,554
ARLINGTON COUNTY, VIRGINIA
SCHEDULE OF EXPENDITURES OF FEDERAL AWARDS
FOR THE YEAR ENDED JUNE 30, 2014
See accompanying notes to Schedule of Federal Awards.
206

Page 4 of 6
Federal
Catalogue
Number Expenditures
DEPARTMENT OF LABOR
Pass Through Payments:
Department of Social Services
Work Investment Act
WIA-Admin.. Adult 17.258 $14,025
WIA-Admin. Youth 17.259 21,318
WIA-Dislocated 17.278 45,969
WIA-Adult 17.258 225,831
WIA-Youth 17259 199,022
WIA-Dislocated with added Rapid Response 17.278 251,055
WIA-Statewide Dislocated/Rapid Response 17.278 279,029
WIA-Adult-Incentive Awards-Culinary Skills Train. 17.258 16,185
WIA-Youth-Incentive Awards-Culinary Skills Train. 17.259 17,301
WIA-Dislocated-Incentive Awards-Culinary Skills -
Training 17.278 22,324
Total Department of Social Services 1,092,059
Disability Employment Initiative 17.207 100,265
Total Department of Labor $1,192,324
See accompanying notes to Schedule of Federal Awards.
ARLINGTON COUNTY, VIRGINIA
SCHEDULE OF EXPENDITURES OF FEDERAL AWARDS
FOR THE YEAR ENDED JUNE 30, 2014
207

Page 5 of 6
Federal
Catalogue
Number Expenditures
DEPARTMENT OF AGRICULTURE
Pass Through Payments:
Department of Education-
National School Lunch Program
(197/457-02) 10.555 $3,186,035
National School Breakfast Program 10.553 705,704
Parent/Teen Infant 10.558 19,502
Sub total 3,911,241
Dept. Agriculture and Consumer Services
USDA Donated Commodities 10.555 466,593
USDA - Team Nutrition Grants 10.574 16,000
WIC Grant 10.577 722,071
WIC Grant--Breastfeeding Peer Counselors 10.577 23,123
FSET - Transportation & POS 10.561 6,593
Administrative Matching Grants for Food Stamps 10.561 2,335,469
Sub total 3,569,849
Department for the Aging
Older Americans Act Title III USDA 10.570 43,222
Sub total 43,222
Total Department of Agriculture $7,524,312
DEPARTMENT OF JUSTICE
Direct Federal Payments:
ODJ- Seized Assets 16.922 $176,703
Treasury- Seized Assets 21.000 93,356
Joint Terrorism Task Force 16.579 11,584
High Intensity Drug Trafficking Area (HIDTA) 16.000 244,435
High Intensity Drug Trafficking Area (HIDTA) 95.001 221,812
DEA Task Force 16.579 56,806
Metropolitan Area Fraud Task Force 16.579 6,708
Electronic Crimes Task Force 16.579 1,292
Organized Crime Drug Enforcement Task Force 16.579 8,310
State Criminals Alien Assistance Service 16.606 140,721
HIDTA Task Force 95.001 39,104
DMV Highway Safety Program Enforcement 20.600 20,525
DMV Highway Safety Program-Enforce- Alcohol 20.607 21,422
DMV Highway Safety Program-Enforcement 20.616 5,804
Justice Assistance Grant 13.738 21,044
Regional Gang Tsk Force 16.738 33,120
FY 13 Adult Drug Court Discretionary Grant 16.585 56,197
Arlington Gang Initiative Grant 16.544 10,162
Total Direct Federal 1,169,105
Total Department of Justice $1,169,105
See accompanying notes to Schedule of Federal Awards.
ARLINGTON COUNTY, VIRGINIA
SCHEDULE OF EXPENDITURES OF FEDERAL AWARDS
FOR THE YEAR ENDED JUNE 30, 2014
208
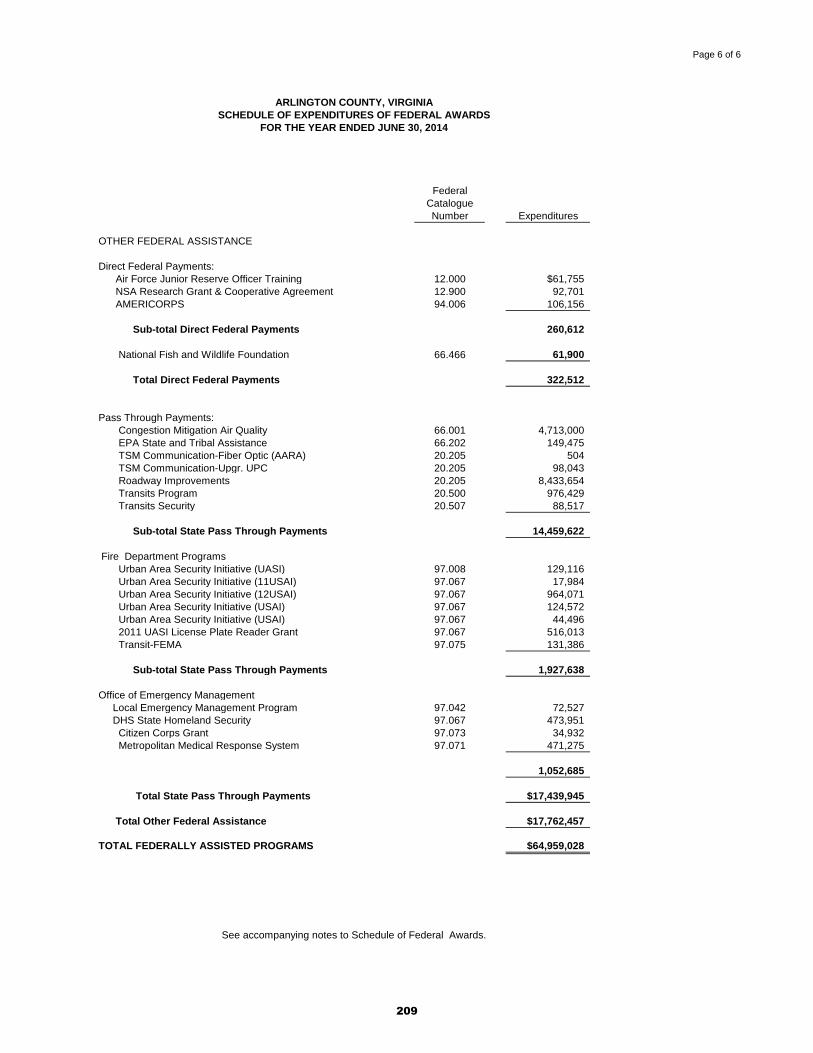
Page 6 of 6
Federal
Catalogue
Number Expenditures
OTHER FEDERAL ASSISTANCE
Direct Federal Payments:
Air Force Junior Reserve Officer Training 12.000 $61,755
NSA Research Grant & Cooperative Agreement 12.900 92,701
AMERICORPS 94.006 106,156
Sub-total Direct Federal Payments 260,612
National Fish and Wildlife Foundation 66.466 61,900
Total Direct Federal Payments 322,512
Pass Through Payments:
Congestion Mitigation Air Quality 66.001 4,713,000
EPA State and Tribal Assistance 66.202 149,475
TSM Communication-Fiber Optic (AARA) 20.205 504
TSM Communication-Upgr. UPC 20.205 98,043
Roadway Improvements 20.205 8,433,654
Transits Program 20.500 976,429
Transits Security 20.507 88,517
Sub-total State Pass Through Payments 14,459,622
Fire Department Programs
Urban Area Security Initiative (UASI) 97.008 129,116
Urban Area Security Initiative (11USAI) 97.067 17,984
Urban Area Security Initiative (12USAI) 97.067 964,071
Urban Area Security Initiative (USAI) 97.067 124,572
Urban Area Security Initiative (USAI) 97.067 44,496
2011 UASI License Plate Reader Grant 97.067 516,013
Transit-FEMA 97.075 131,386
Sub-total State Pass Through Payments 1,927,638
Office of Emergency Management
Local Emergency Management Program 97.042 72,527
DHS State Homeland Security 97.067 473,951
Citizen Corps Grant 97.073 34,932
Metropolitan Medical Response System 97.071 471,275
1,052,685
Total State Pass Through Payments $17,439,945
Total Other Federal Assistance $17,762,457
TOTAL FEDERALLY ASSISTED PROGRAMS $64,959,028
ARLINGTON COUNTY, VIRGINIA
SCHEDULE OF EXPENDITURES OF FEDERAL AWARDS
FOR THE YEAR ENDED JUNE 30, 2014
See accompanying notes to Schedule of Federal Awards.
209

ARLINGTON COUNTY, VIRGINIA NOTES TO SCHEDULE OF EXPENDITURES OF FEDERAL AWARDS
JUNE 30, 2014 NOTE 1. BASIS OF PRESENTION The schedule of Expenditures of Federal Awards is presented on the modified accrual basis of accounting in all material respects and includes all expenditures of federal awards administered by the County. Several programs are funded jointly by the Commonwealth of Virginia and the County in accordance with matching requirements of the various federal grants. Costs incurred for such programs are applied to Federal grant funds in accordance with the terms of the related Federal grants with the remainder applied to funds provided by the Commonwealth of Virginia and the County. All costs charged to Federal Awards are determined based on the applicable Federal grants and OMB Circular A-87, Costs Principles Applicable to Grants and Contracts with State and Local Governments. The County’s Federal grants are also managed in accordance with the requirements of OBM Circular A-102, Uniform Administrative Requirements for Grants-in-Aid to State and Local Governments. NOTE 2. FEDERAL COGNIZANT AGENCY The Federal cognizant agency for the County is the U.S. Department of Health and Human Services.
210

ARLINGTON COUNTY, VIRGINIA SCHEDULE OF FINDINGS AND QUESTIONED COSTS
June 30, 2014
I. Summary of Independent Auditor’s Results
Financial Statements Type of auditor’s report issued: Unmodified
Internal control over financial reporting:
Material weakness(es) identified? Yes X No Significant deficiency(ies) identified that are not
considered to be material weaknesses? Yes X None reported
Noncompliance material to financial statements noted? Yes X No
Federal Awards
Internal control over major programs:
Material weakness(es) identified? Yes X No Significant deficiency(ies) identified that are not
considered to be material weaknesses? Yes X None reported
Type of auditor’s report issued on compliance for major programs: Unqualified
Any audit findings disclosed that are required to be reported in accordance with Section 510(a) of Circular A-133? Yes X No
Identification of Major Programs
Name of Federal Program or Cluster CFDA Number(s)
Aging Cluster
93.044, 93.045
Community Development Block Grants 14.218 Section 8 Housing Choice Vouchers Cluster 14.871, 14.880 Highway Planning and Construction- ARRA 20.205 Federal Transit Cluster 20.500/20.507 Medical Assistance 93.778 Title I 84.010
Dollar threshold used to distinguish between type A and type B programs $1,946,817
Auditee qualified as low-risk auditee? Yes X No
211

ARLINGTON COUNTY, VIRGINIA SCHEDULE OF FINDINGS AND QUESTIONED COSTS
June 30, 2014
II. Financial Statement Findings
None noted
III. Federal Award Findings and Questioned Costs
None noted
212

ARLINGTON COUNTY, VIRGINIA SCHEDULE OF PRIOR YEAR FINDINGS AND QUESTIONED COSTS
June 30, 2014
Finding No 2013-001: Federal Transit Cluster Not Included on the Schedule of Federal Awards
Finding Type: Internal control and compliance, Reporting - Material Weakness
Federal Program: Federal Transit Cluster, CFDA# 20.500/20.507
Condition: The County’s Schedule of Federal Awards (SEFA) did not accurately report all federal programs and related expenditures as required by OMB Circular A-133 (.310)(b). The County failed to report the federal expenditures of the federal transit cluster (CFDA# 20.500/20.507).
Current Status: Resolved, At year-end all County departments are contacted and asked about
federal expenditures. The SEFA is complied based on the responses from the department. We tested the completeness of the SEFA as part of the current year’s single audit.
Finding No 2012-02, 2013-002: Documentation of Time and Effort
Finding Type: Internal control over compliance finding
Federal Program: Aging Cluster, CFDA 93.044, 93.045
Condition: Employees’ time and effort certification was not completed.
Current Status: Resolved, program tested as major for current year audit
213

Arlington County Vision
“Arlington will be a diverse and inclusive world-class urban community with secure, attractive
residential and commercial neighborhoods where people unite to form a caring, learning, participating, sustainable community in which
each person is important.”
— Arlington County Board
Department of Management and Finance2100 Clarendon Boulevard
Suite 501Arlington, VA 22201
703.228.3415www.arlingtonva.us