comprehensive annual financial report · pdf fileunion sanitary district . union city,...
TRANSCRIPT

Union Sanitary District Union City, California
Comprehensive Annual
Financial Report Fiscal Year Ended June 30, 2014

Union Sanitary District Union City, California
Comprehensive Annual
Financial Report
Fiscal Year Ended June 30, 2014Prepared by Business Services Finance Department

Table of Contents
INTRODUCTORY SECTION Letter of Transmittal………………………………………………………………..... Mission Statement………………………..………………………………….……. District Board of Directors and Principal Officials…………………….……….. Organization Chart…………………………………………………………………… Service Area Location Map………………………………………………………. Certificate of Achievement for Excellence in Financial Reporting………….. District Operational Excellence Timeline…………………………………….. FINANCIAL SECTION Independent Auditor’s Report…………………………………………………....... Management’s Discussion and Analysis………………………………................ Basic Financial Statements: Statement of Net Position…………………………………………...…..….. Statement of Revenues, Expenses and Changes in Net Position………………………………………………..….. Statements of Cash Flows……………………………..…………......…… Notes to Basic Financial Statements…………………………….….…… Required Supplementary Information – Pension and Retiree Health…..…… Supplementary Information: Schedule of Components of Net Position………………………….…….. Schedule of Expenses before Depreciation……………………….......... Schedule of Insurance Coverage………………………………………… STATISTICAL SECTION Financial Trends……………………………………………..……… Revenue Capacity………………………………..…....................... Debt Capacity…………………………………………………..……. Demographic and Economic Information……………………… Operating Information…………………………………….………
i x
xii xiv xv xvi xvii
1 3
9
10 11 12 33
35 37 38
S-1 through S-4 S-5 through S-7 S-8 through S-9
S-10 through S-12
S-13 through S-22

i
Directors Manny Fernandez Tom Handley Pat Kite Anjali Lathi Jennifer Toy Officers Paul R. Eldredge General Manager/ District Engineer David M. O’Hara Attorney
November 15, 2014 Board of Directors Union Sanitary District Union City, California Subject: Comprehensive Annual Financial Report For the Year Ended June 30, 2014 I am pleased to present the Union Sanitary District’s Comprehensive Annual Financial Report (CAFR) for the fiscal year ended June 30, 2014. Responsibility for both the accuracy of presented data and the completeness and fairness of the presentation, including all disclosures, rests with the District. To the best of our knowledge and belief, the enclosed data are accurate in all material respects and are reported in a manner designed to present fairly the financial position and results of operations of the District. All disclosures necessary to enable the reader to gain the maximum understanding of the District’s financial activities have been included. The CAFR is presented in accordance with Generally Accepted Accounting Principles (GAAP) as set forth by the Governmental Accounting Standards Board (GASB).
District Profile
The Reporting Entity The Union Sanitary District (The District) is an independent Special District, and is accounted for as an enterprise fund type (proprietary fund category). A fund is an accounting entity with a self-balancing set of accounts established to record the financial position and results of operations of a specific governmental activity. The activities of enterprise funds closely resemble those of ongoing businesses in which the purpose is to conserve and add to basic resources while meeting operating expenses from current revenues. Enterprise funds account for operations that provide services on a continuous basis and are substantially financed by revenues derived from user charges. As an enterprise fund, the District uses the accrual basis of accounting. Revenues are recognized when earned and expenses are recognized as they are incurred, regardless of when cash is paid or received. The District has no component units.

ii
The District applies all applicable GASB pronouncements in accounting and reporting for proprietary operations. District policy requires that its financial statements be audited on an annual basis by an independent certified public accounting firm approved by the Board of Directors. The independent auditor’s report for the Fiscal Years ended June 30, 2014 and 2013 are presented in the Financial Section of this report. Please refer to the Management’s Discussion and Analysis immediately following the independent auditor’s report in the Financial Section for additional information about the financial statements.
District Formation and Organization The Union Sanitary District was formed in 1918 to serve Newark and the Centerville area of what is now Fremont. Between 1949 and 1962, Niles, Decoto, Irvington, and Alvarado Sanitary Districts joined the Union Sanitary District. The District now provides wastewater collection treatment and disposal services to the residents and businesses of the cities of Fremont, Newark, and Union City, commonly referred to as the Tri-City Area, with a combined population of 339,983. The cities are located along Interstates 680 and 880, between Oakland and San Jose in southern Alameda County. The District is governed by a five-member Board of Directors, which is independently and directly elected by voters to staggered four-year terms. USD, which employs 128 staff, operates in a Team-based environment and uses the Balanced Scorecard as a model for its strategic plan and performance measurement tool.
Local Economic Condition and Outlook Located at the northern end of Silicon Valley, the Tri-City area of Fremont, Newark and Union City has a diverse population, as well as a varied mix of employers including bio-tech, research and development, education, manufacturing and retail. Following are economic conditions in the Tri-City area and the District as a whole. The City of Fremont* Fremont is the 4th largest city in the Bay Area in population and 2nd largest in size with an area of 92 square miles. The majority of its 40 schools are considered high performing by the State. During FY 2014, Fremont was ranked 2nd on the “Best Run City in America” list by Twenty-Four Seven Wall Street (up from 5th last year). Fremont was the wealthiest large U.S. city last year. It not only had the highest median income, but also the lowest poverty rate. A typical Fremont household earned more than $100,000 in 2012, or nearly double the national income that year. Meanwhile, the poverty rate of 6.7% was less than half the national rate. Home values in the city didn’t escape the housing crisis unscathed, falling by nearly 12% between 2008 and 2012. Last year, however, a typical Fremont home was valued at $582,100, still more expensive than those in the vast majority of large cities. Sharing the San Francisco Bay area with Silicon Valley, Fremont is a hub for tech manufacturing — 17.5% of workers in the city are employed in manufacturing, one of the highest percentages in the nation.

iii
The City of Newark* Newark is 13 square miles in area. The City is recovering from the economic downturn. The passage of utility tax Measure U, has helped to maintain or restore services that were cut during the past several years. That measure sunsets in 2016. In the meantime, several major projects are underway, including the Newark Mall Revitalization/renovation, the Dumbarton Transit Oriented Development project including over 2,500 residential units, a walkable neighborhood, retail, parks, and business opportunities. Cherry Logistics Center, near Mowry Avenue and Interstate 880, will be the site of Amazon’s first Bay Area distribution center, with over 575,000 square feet of space, offering potentially over 200 jobs. The City of Union City* Union City is 18 square miles in area. It has many parks, sports fields, community facilities, and recreation programs for citizens of all ages. The City of Union City’s Measure AA, the 0.5% sales tax adjustment, which was set to expire in March 2015, has been extended for 10 more years. Both home values and sales taxes are increasing at modest rates. The City’s retirement costs have decreased due to recent labor agreements where employees will pick up the full share of employee PERS costs. Region-wide, the tri-city area is still in recovery mode but showing significant signs of improvement. Unemployment rates for the cities of Fremont, Newark and Union City as of June 2014 were 4.2%, 5.4%, and 5.5% respectively, compared with 5.6%, 7.2%, and 7.3% a year ago. *Source: Fremont and Newark State of the City addresses 2014; www.fremont.gov, www.newark.org, www.ci.union-city.ca.us, www.labormarketinfo.edd.ca.gov, www.247wallst.com.
Major Projects or Initiatives
During fiscal year 2014, the District completed or initiated a number of significant projects:
Local Limits Assessment Study – Includes a proposed update to the pretreatment ordinance with an ammonia local limit. There have been spikes in ammonia loadings from electronics industries which have impacted the plant. The ammonia local limit will help protect the District from future loadings that would not be in compliance with regulatory requirements.
Cogeneration Replacement Project – The majority of construction activities took place in FY14. The Cogen project is expected to yield a significant energy savings by utilizing biogas readily generated as part of our wastewater treatment process.
Computerized Maintenance Management System (CMMS) Upgrade – Implemented a new computerized maintenance management system to replace the current Hansen 7 system. This project includes interfaces with other District systems such as SCADA, Eden, and GIS.
Project Management Software – Projectmates is an online software package that will help streamline the management of documents of the annual 20+ CIP projects. The

iv
system will track project management tasks from project conception to completion, including budget and cost management, contract management, construction management, scheduling, communication, and overall records management. LED Lighting Conversion – Electrical staff will replace all standard incandescent and fluorescent lighting in the centrifuge building. Plant Ammonia Removal Pilot – The AnitaMox ammonia removal process was pilot-tested on the centrate side-stream from our biosolids dewatering operation. The test demonstrated that a significant amount of the ammonia in the centrate could reliably be removed using the AnitaMox process. The District is required, as part of the SWRCB Nutrient Watershed Permit, to evaluate treatment options for nutrient removal. Results from this pilot were used to confirm the space requirements and to produce a construction cost estimate for a full-scale installation. Electrical Safety – The electrical safety study was updated to comply with changes to the National Fire Protection 2014 National Electrical Code. Improved TV Inspections – Collections changed to National Association of Sewer Service Companies (NASSCO) Pipeline Assessment & Certification Program (PACP) standards to improve TV inspections and pipe conditions assessments. OPEB Actuarial Report – Completed the biennial OPEB actuarial study required by the CalPERS retiree medical trust. The study resulted in increased amounts for the annual required contribution (ARC).
Future Projects or Initiatives Odor and Corrosion Control Evaluation – The District is planning to evaluate the current practice of chemical addition for odor and corrosion control in the gravity sewers and influent forcemains. Although $100,000 in Special Project funds were budgeted to provide consultant services for this purpose, we now expect that the work will be done in-house. Ongoing costs for odor and corrosion prevention are approximately $800,000 annually.
Team Safety Strategies – Each team will look closely at their record and potential hazards, and develop strategies to maintain/improve their safety record. Dumbarton Transit Oriented Development (TOD) Project – Cooperatively work with the developer to evaluate the possible relocation or rehabilitation of the existing USD forcemains, to ensure reliable and continuous operation of these critical District assets. Aeration Membrane Cleaning Alternatives – Treatment & Disposal staff will investigate options for more efficient cleaning of the aeration membrane diffusers. The amount of energy required to diffuse oxygen into the aeration basins increases as the diffuser membranes become fouled. Conventional membrane cleaning requires the basins to be removed from services, dewatered, then high-pressure washed or scrubbed; this is very time-consuming and costly.

v
City of Fremont Urban Runoff Contract Renewal – The contract provides assistance to the City of Fremont in meeting their storm water NPDES requirements, primarily inspection, enforcement, and reporting activities. The contract expires in FY15. Sewer Service Charge Study – Finalize and present the results of this study that will include future requirements for revenue streams and a cost of service analysis of sewer service charges. Thickener Project – Successfully manage the largest CIP project currently under construction and meet the State Revolving Fund (SRF) loan and Single Audit requirements. Work anticipated to be completed in FY15 includes: construction of new Thickener Electrical Building, construction of new Electrical Room at Heat and Mixing Building No. 1, replacement of Scum Pumps at Pump Room Nos. 1 and 3, replacement of PLC-20 at Heat and Mixing Building No. 4, and installation of an extensive solids handling bypass system to facilitate the demolition of the existing Thickener Control Building. Job Competency Requirements (JCRs) – Continue training employees on new JCRs. Scheduled for this year are TV Inspection, Vactor, Skid Steer Loader, and Tractor Loader Backhoe. After training, assessments will be conducted to verify understanding of the training received. ECMS – The Environmental Compliance Team and IT will implement a new Environmental Compliance Management System to replace a legacy program. The new system will combine elements of industrial, urban run-off, dental, and groundwater databases into one application, improving efficiency and customer service. Uninterruptible Power Supply (UPS) Replacement Project – The plant, in various buildings, has back-up power units for our programmable logic controllers (PLCs). In the event of a power failure these back-up batteries supply power for a duration of time. The current UPSs have been in place for many years, and are due for replacement. Time Keeping System – Issue a request for proposals for a new time keeping system, select vendor and begin implementation. This system will replace the current legacy system which is not supportable in the future. Phase 4 LED Lighting Conversion – Electrical staff will continue their efforts of upgrading District facilities with LED lighting. This year the metal halide lamps located in the District’s main parking lot will be upgraded to LED. Alvarado Wastewater Treatment Plant Site Use Study – Conduct a study to develop the most logical site use plan that integrates both the District’s existing and planned facilities. Hayward Marsh Rehabilitation Evaluation – The District will assist the East Bay Regional Parks District by conducting a feasibility study to evaluate rehabilitation options for the Marsh due to sedimentation buildup that is adversely impacting the flow of water to the basin.

vi
New Permit for Wet Weather Outflow (Old Alameda Creek) – The District will determine requirements for the Old Alameda Creek intermittent wet weather NPDES permit renewal.
Financial Information Accounting System District financial records are maintained on the accrual basis of accounting as required by GASB Section 1600.125. Accrual basis accounting recognizes transactions, events, and circumstances when they occur, rather than when cash is received or paid.
Internal Controls While developing and evaluating the District’s accounting system, consideration is given to the adequacy of internal accounting controls. Internal controls are designed to give reasonable, but not absolute, assurance regarding: (1) the safeguarding of assets against loss from unauthorized use or disposition; and (2) the reliability of financial records for preparing financial statements and maintaining accountability for assets. The concept of reasonable assurance recognizes that: (1) the cost of a control should not exceed the benefits likely to be derived; and (2) the evaluation of costs and benefits requires estimates and judgments by management. All internal control evaluations occur within the above framework. We believe that the District’s internal accounting controls adequately safeguard assets and provide reasonable assurance of proper recording of financial transactions. The District’s internal controls include but are not limited to positive pay, fraud protection checks, timely bank reconciliations, segregation of duties wherever possible, dual approvals on wires and investment purchases, an anonymous fraud hotline, and financial system security.
Budgetary Controls Budgetary controls are maintained by the District to ensure compliance with the annual budget adopted by the Board of Directors. All financial activities for the fiscal year are included in the annual budget, along with a ten-year financial plan. Budgetary control is maintained at the Work Group level for administrative and operating budgets, and at the project level for capital improvements. Monthly budget reports are provided to the Executive Team and Board of Directors, and the Executive Team conducts a detailed quarterly review, as well.
Rate Structure The District receives its revenue from four primary sources: sewer service charges, capacity fees, other minor operating revenues such as permits, inspections and outside work that we perform in cooperation with other municipalities, and interest earnings on reserve funds.

vii
Sewer Service Charge The sewer service charge is collected on the annual property tax bill. The District prepares the budget and projections of needed revenue during the annual budget process, which is concluded by June 30th of each year. Sewer service charges to be collected are provided to the County of Alameda in August of each fiscal year. The District receives its primary payments of funds in December (50%) and April (45%), and the remainder around August, and receives all amounts billed as part of the County’s “Teeter” plan. The sewer service charge is divided into four primary categories of customers: residential, commercial and institutional, and industrial. The calculation of the sewer service charge for the various categories of customers is based upon their average flow, as well as contribution of their projected suspended solids (SS) and chemical oxygen demand (COD). The District does experience substantial variability in the type of effluent produced by industrial users, and the SS and COD can vary significantly. The District has a sampling program to periodically test the effluent from its industrial customers. Flow for industrial users is based on water use records from the Alameda County Water District. The annual residential fee for 2014 was $337.76 for a single family dwelling.
Capacity Fees The District charges a sewer connection fee of $5,329.20 for an equivalent dwelling unit (EDU). The charges for commercial, industrial, and office use are based on factors such as square footage, flow, COD, and suspended solids. Revenues from capacity fees are used to fund capital projects and upgrades that preserve or increase the system’s capacity. Thus, the collected revenues may be used to fund certain renewal and replacement CIP projects, but not operating costs.
Interest Income The District earns interest on its portfolio of investments, including the Local Agency Investment Fund (LAIF), and the California Asset Management Program (CAMP), which is allocated to the major funds (Capacity and Sewer Service) monthly by percentage of fund balance.
Other Information
Independent Financial Audit – California state statutes require an annual independent audit of the books of accounts and financial records of the District. The firm of Vavrinek, Trine, Day Inc. was contracted to conduct this year’s audit. The Board Audit Committee receives and reviews the audited financial statements. The audit opinion is included in the Financial Section of this report. Financial Policies – In fiscal year 2014, the District reviewed and/or updated the following finance-related policies: Investment, Exceptions to Ordinance Fees, Reimbursement & Travel, and Surplus Property Disposal. East Bay Dischargers Authority – USD is a member of the East Bay Dischargers Authority (EBDA). Founded in 1974, EBDA is a five-member Joint Powers Agency
viii
formed to plan, design, construct, and operate regional facilities to collect, transport and discharge treated effluent to deep waters of San Francisco Bay. Treated effluent from USD’s Alvarado Wastewater Treatment Plant is pumped to the EBDA System and discharged into the Bay southwest of Oakland International Airport. Frequent testing of the treated wastewater confirms compliance with regional permit requirements. The other member agencies are Castro Valley Sanitary District, Oro Loma Sanitary District, City of Hayward, and City of San Leandro. District Financing Authority – The District is a member of the Alameda County Water District Financing Authority. The Authority was organized to provide assistance to the water district in anticipation of financing capital projects over the next several years. USD has one Board member on the governing body of the Authority.
Awards & Acknowledgements
Awards/Recognition During the past year, the District received the following awards:
National Association of Clean Water Agencies (NACWA) – Peak Performance
Award National Institute for Government Purchasing (NIGP) – Achievement of
Excellence in Procurement
Government Finance Officers Association (GFOA) – Excellence in Financial Reporting The Government Finance Officers Association of the United States and Canada (GFOA) awarded a Certificate of Achievement for Excellence in Financial Reporting to Union Sanitary District for its comprehensive financial report for the fiscal year ended June 30, 2013. In order to be awarded a Certificate of Achievement, a government must publish an easily readable and efficiently organized comprehensive annual financial report. This report must satisfy both generally accepted accounting principles and applicable legal requirements. A Certificate of Achievement is valid for a period of one year only. We believe that our current comprehensive annual financial report continues to meet the Certificate of Achievement Program’s requirements and we are submitting it to the GFOA to determine its eligibility for another certificate.

ix
Acknowledgements
I would like to express sincere appreciation to The Executive Team, the Finance Department, and Customer Service Team other Work Groups for their assistance in completing this report. Respectfully submitted,
Maria Scott Maria Scott Principal Financial Analyst Business Services Department
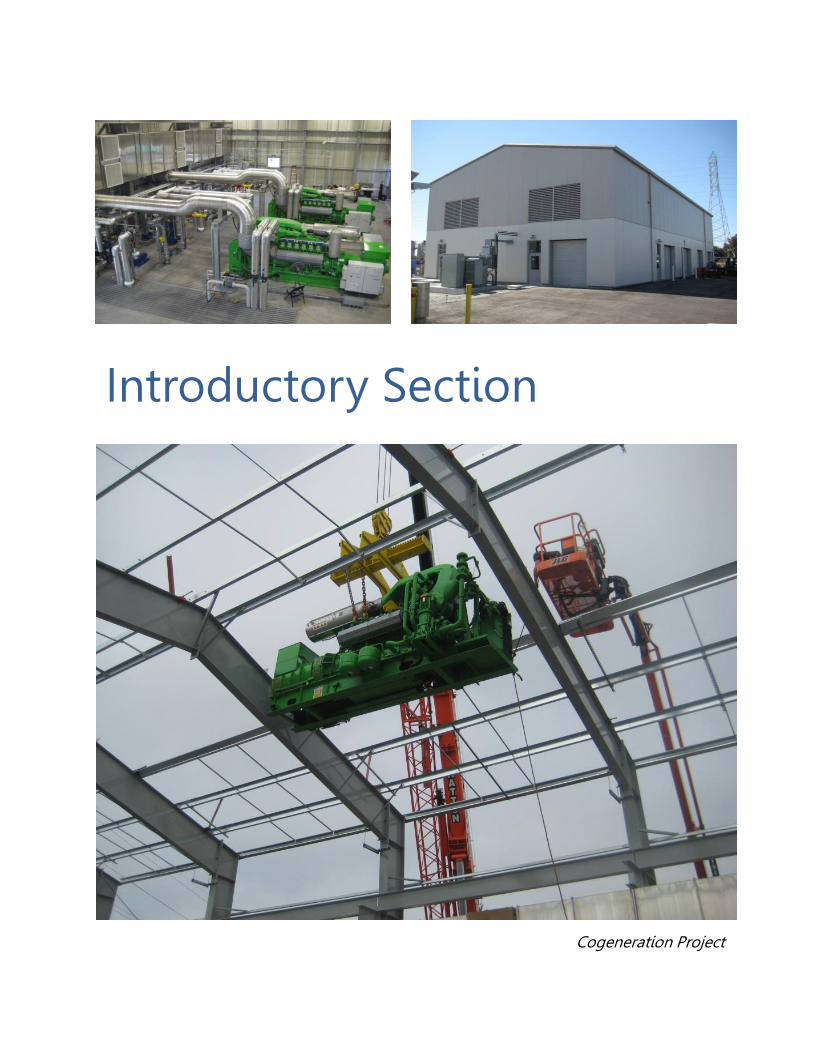
Introductory Section
Cogeneration Project

MISSION STATEMENT
To safely and responsibly collect and treat wastewater for the Tri-cities while protecting human health and improving the environment in a way
that benefits our customers, employees and the community. How we accomplish our Mission: We demonstrate our commitment to safety by:
• Having an effective safety program • Protecting employees and the community • Committing resources (equipment, training, staff) • Planning to work safely • Looking out for each other while we work
We demonstrate responsibility by:
• Being fiscally responsible • Being accountable for our actions and decisions • Anticipating and meeting future needs and demonstrating stewardship • Maintaining compliance with laws and regulations • Effectively managing our assets • Continuously improving our processes
We collect and treat wastewater, including:
• Maintaining our infrastructure • Providing capacity in the collection system and plant • Regulating connections • Disposing of treated wastewater and biosolids • Effectively using technology • Having effective pretreatment and pollution prevention programs • Testing for compliance
We protect human health by:
• Preventing sewer spills and back-ups • Reducing health risks through treatment of wastewater • Responding to emergencies
We improve the environment by:
• Enhancing the San Francisco Bay and Hayward Marsh ecosystems • Maintaining compliance with effluent and air quality regulations • Promoting pollution prevention • Recycling biosolids • Co-generating electric power
(Continued on next page)
x

MISSION STATEMENT, cont’d.
We benefit our customers by:
• Providing reliable service • Being fiscally responsible and cost effective, and providing value • Promptly responding to customers’ needs • Being professional and courteous • Proactively and creatively meeting customer needs • Supporting businesses through permitting, education and by providing
capacity We benefit our employees by:
• Providing competitive wages and benefits in a stable work environment • Providing a safe work environment • Demonstrating equality and fairness • Valuing employee input, and offering opportunities for involvement and
creativity • Recognizing employee contributions • Providing training and resources • Communicating and sharing information openly and honestly • Encouraging cooperation and collaboration
We benefit the community by:
• Protecting the environment and controlling odors • Communicating with the public and educating them on wastewater issues • Responding to emergencies and providing mutual aid • Participating in community outreach activities and charity events • Contributing to the wastewater treatment profession by participating in
professional associations, partnering with other agencies and organizations, and sharing best practices
• Working cooperatively with cities and other government agencies
xi
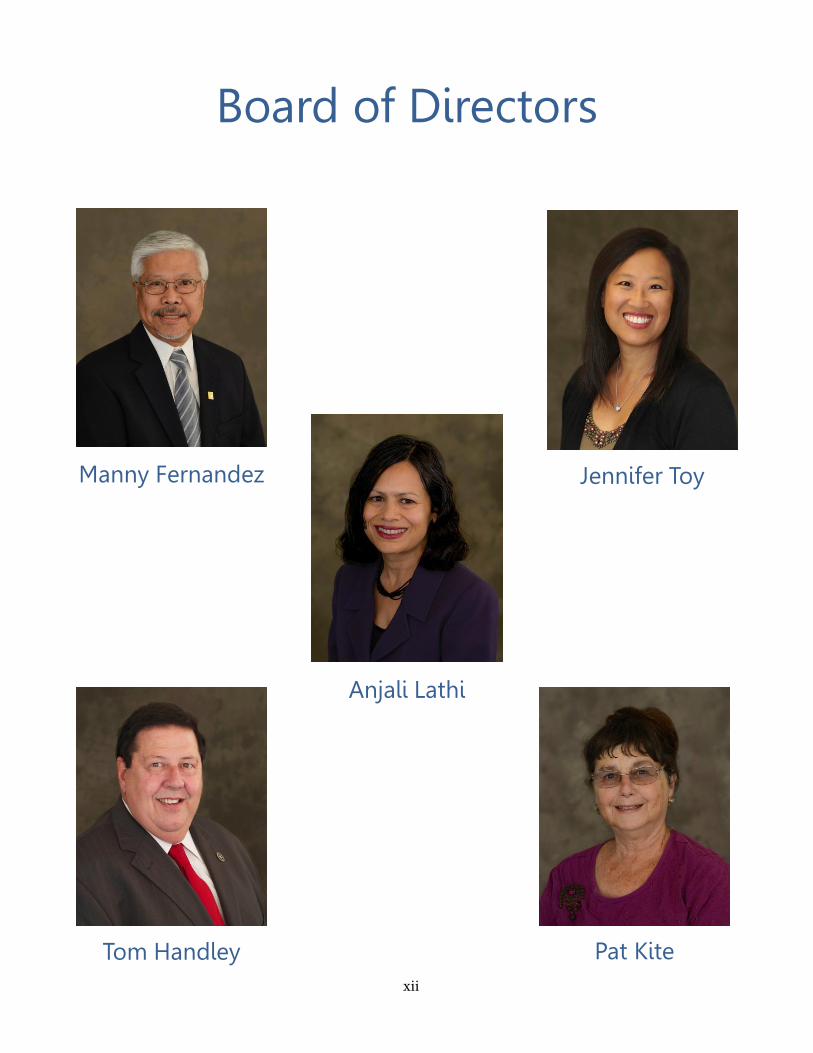
Board of Directors
Jennifer Toy
Anjali Lathi
Manny Fernandez
Tom Handley Pat Kite xii

Principal Officials
City
Represented
Year
Elected
Term
Expires
Anjali Lathi President Fremont
(Ward 3)
2002 2016
Manny Fernandez Vice President Union City
(Ward 1)
2011
(Appointed)
2016
Jennifer Toy Secretary Fremont
(Ward 3)
1998
2018
Tom Handley Board Member Fremont
(Ward 3)
2007 2018
Pat Kite Board Member Newark
(Ward 2)
1991
2016
Principal Officials
David M. O’Hara
General Counsel
Staff
Richard Currie
General Manager/District Engineer
Dave Livingston Treatment & Disposal Services Manager
Robert Simonich Fabrication Maintenance & Construction
Manager
Richard Cortes Business Services Manager/District
Administrative Officer
Sami Ghossain Technical Services Manager
Andy Morrison Collection Services Manager
xiii

Board of Directors (5)
Collection Services Manager
(30)
Technical Support & Customer Services
Manager
(34)
General Manager Steering Committee
Coach (Nights)
Coach (Days)
Coach Coach Coach Coach Coach
Environmental Compliance
Team
(11)
Customer Service Team
(10)
Capital Improvements
Projects Team
(8)
Materials Management
Team
(5)
Organizational Support Team
(6)
Information Technology
Team
(5)
Construction Team
(10)
Support Team
(8)
Maintenance/TV Team
(9)
Research &
Support Team
(5)
Fabrication Maintenance & Construction
Team (17)
Total Productive Operations
(15)
•Plant Operator I (1) •Plant Operator II (2) •Plant Operator III (8) •Plant Operator III Trainee (3) •Plant Operations Trainer (1)
•Instrument Technician/ Electrician (4) •Mechanic I (3) •Mechanic II (7) •Painter (1) •Sr. Planner/ Scheduler(1) •Utility Worker (1)
•Administrative Specialist II (1) •Chemist II (3) •Lab Director(1)
•Collection System Worker II (6) •Lead Collection System Worker (3)
•Administrative Specialist II (1) •Fleet Mechanic II (2) •Janitor (2) •Maintenance Assistant (1) •Mechanic II (1) •Planner /Scheduler II (1)
•Collection System Worker II (7) •Lead Collection System Worker (3)
•Administrative Specialist II (1) •Environmental Health & Safety Program Manager (1) •Human Resources Administrator (1) •Human Resources Analyst (1) •Quality Coordinator (1) •Technical Training Coordinator (1)
•Accounting Technical Specialist (3) •Principal Financial Analyst (1) •Sr. Accountant (1)
• Sr. GIS DBA(1) • IT Administrator (1) • Sr. Network
Administrator (1) • Sr. Developer/DBA (1) • Sr. IT Analyst (1)
•Administrative Specialist II (1) •Buyer II (1) •Purchasing Agent (1) •Stock Clerk (1) •Storekeeper II (1)
• Assistant to the General Manager(2)
•Associate Engineer (1) •Communication Coordinator (1) •Construction Inspector I (1) •Customer Service Fee Analyst (2) •Engineer Technician II (1) •Engineer Technician III (1) •Office Assistant II (1) •Office Assistant III (1)
•Administrative Specialist II (2) •EC Inspector II (4) •EC Inspector III (2) •EC Inspector IV (1) •Environmental Program Coordinator (1) •Environmental Outreach Representative (1)
UNIONSANITARYDISTRICT
Business Services Manager
(23)
Coach
Financial Internal Support Team
(5)
Coach
UNIONSANITARYDISTRICT
•Administrative Specialist II (1) •Assistant Engineer (2) •Associate Engineer (3) •Engineering Technician I (1) •Principal Engineer (1)
Coach Coach
Treatment & Disposal Services Manager
(24)
Fabrication, Maintenance,
and Construction Manager
(20)
Summary 5 Work Group Managers 12 Coaches 13 Teams 131 Total Positions
xiv

Hayward
Fremont
Newark
Milpitas
Union City
¬«238
¬«84
¬«92
¬«262
¬«84
¬«238¬«84
§̈¦880
§̈¦680
§̈¦680
MISSION
FREMONT
MOW
RY
CEDARBLACOW
CENT
RAL
DYER
DECO
TO
KATO
NILES
GRIM
MER
THORN
TON
CHERRY
WHIPPLE
UN
ION
CIT
Y
WALNUT
PASE
O P
ADR
E
STEV
ENSO
N
JARV
ISO
SGO
OD
ALVARADO NILES
WAR
M SPRING
S
LOW
RY
ALVARADO
PERALTA
BOYCEAUTO MALL
WASHINGTONDRIS
COLL
DURHAM
AUTOMALL
LAKE
SMITH
ARD
ENW
OO
D
WILLO
W
LOPES
GATEWAYWARREN
ISHERW
OOD
WHIPPLE
.
Union Sanitary DistrictService Area Location Map
District Administration & Alvarado WastewaterTreatmentPlant
San Francisco Bay

xvi

Operational Excellence Timeline Jul 2013 Jan 2014 Jul 2014 Jan 2015 Jul 2015 Jan 2016
TS/CS
Business Services T&D
Executive Team
FMC
Collections System
Stewardship
Fiscal Responsibility
IT Disaster Plan Assessment
External Web Improvements
SSC Fee Study SSC Rate
survey
SSC survey
Seismic Assessment Evaluation Phase I
Newsletter Newsletter
Jul 2016
Other Groups JLMC
Crisis Communication
Plan
Irvington Basin Master Plan
Lateral Pilot
Hansen Replacement Project
Asset Mgmt
Plant-Pump Station Communications
CoGen Replacement Project Construction
Seismic Assessment Evaluation Phase II
Emergency Coordinator Role
Service Emergency
Response
Evaluate ER/Haz Mat Position
Publicize CoGen Project
Newsletter
CS PM Schedule Review
Pipeline Assessment
PACP Standard Pump/Lift Station Master Plan
Asset Mgr
Thickener Control Bldg Improvements
PCAP Program Update
Forcemain Condition Assessment
FMC Building Design
Commercial Business Outreach
As Built SLA
TSCS/FMC/ TPO
PACP QA/QC
xvii

Operational Excellence Timeline Jul 2013 Jan 2014 Jul 2014 Jan 2015 Jul 2015 Jan 2016
Environmental
Prot
Lean Green TF (Determine future)
Ongoing: New regulations,
regional group participation
Coordination of regulatory compliance
TS/CS
Business Services T&D
Executive Team
FMC
Collections System
Other Groups JLMC
Jul 2016
Wet Weather Flow Study- Marsh Alternatives
Marsh Ammonia Removal Pilot
Long-term Staffing
Study
Planning
Mobile Technology Phase I
Efficiency
Mobile Technology Phase II
Mobile Technology Phase III
EC Mgmt System
CIP Mgmt System
Archive/Electronic Records Policy
Process Engineer
CIP Project Check-in/Workload Assessment December and February
Electronic Records Implementation/ Document
Management-Portal
Op/Data Mgmt System T&D/IT/FMC
Eden Landing Ecotome Study
Marsh Permit Renewal Prep
Plant Ammonia removal Study/Pilot
EBDA Permit Renewal Prep
Wet Weather Permit Renewal
Effluent Storage Project Wet Weather Flow Management
xviii

Operational Excellence Timeline Jul 2013 Jan 2014 Jul 2014 Jan 2015 Jul 2015 Jan 2016 Jul 2016
EE Safety Survey
Coach Safety Observations
Safety
TS/CS
Business Services T&D
Executive Team
FMC
Collections System
Other Groups JLMC
SIT Inspections: 4x a year
Safety Recognition Taskforce
Team Safety
Strategy Updates
SIT Inspections 4x/year SIT Inspections 4x/year
Coach Safety Observations Coach Safety Observations
Safety Summit- Collection
Services
Alt Comp Taskforce
BBQ BBQ
Employer of Choice
Long-term Staffing Recommendations
3-Deep Review
Sustaining Teams/Inter-Team
Communication
Critical Skills/Processes Project
GM Financial presentation
Ethics Training
Negotiations
Employees
GM/Leadership Transitions
Safety Strategy
Review
Team Safety
Strategy Updates
Regional Workforce
Development
Negotiation Prep
EE Safety Survey
BBQ
Team Safety
Strategy Updates
xix

Financial Section
Boyce Road Lift Station Replacement Project

1
5000 Hopyard Road, Suite 335 Pleasanton, CA 94588 Tel: 925.734.6600 Fax: 925.734.6611 www.vtdcpa.com
F R E S N O L A G U N A H I L L S P A L O A L T O P L E A S A N T O N R A N C H O C U C A M O N G A R I V E R S I D E S A C R A M E N T O
INDEPENDENT AUDITORS' REPORT
Board of DirectorsUnion Sanitary DistrictUnion City, California
Report on the Financial Statements
We have audited the accompanying financial statements of Union Sanitary District as of and for the years then ended June 30, 2014 and 2013, and the related notes to the financial statements, which collectively comprise Union Sanitary District's basic financial statements as listed in the table of contents.
Management's Responsibility for the Financial Statements
Management is responsible for the preparation and fair presentation of these financial statements in accordance with accounting principles generally accepted in the United States of America; this includes the design, implementation, and maintenance of internal control relevant to the preparation and fair presentation of financial statements that are free from material misstatement, whether due to fraud or error.
Auditors’ Responsibility
Our responsibility is to express an opinion on these financial statements based on our audit. We did not audit the equity investment in the East Bay Dischargers Authority which represents approximately 1.6 percent and 1.8 percent, respectively, of the assets and net position of the Union Sanitary District. The statements for which the equity investment is derived were audited by other auditors whose report has been furnished to us, and our opinion, insofar as it relates to the amount included for the equity investment, is based solely on the report of the other auditors. We conducted our audit in accordance with auditing standards generally accepted in the United States of America and the standards applicable to financial audits contained in Government Auditing Standards, issued by the Comptroller of the United States. Those standards require that we plan and perform the audit to obtain reasonable assurance about whether the financial statements are free from material misstatements.
An audit involves performing procedures to obtain audit evidence about the amounts and disclosures in the financial statements. The procedures selected depend on the auditor's judgment, including the assessment of the risks of material misstatement of the financial statements, whether due to fraud or error. In making those risk assessments, the auditor considers internal control relevant to the entity’s preparation and fair presentation of the financial statements in order to design audit procedures that are appropriate in the circumstances, but not for the purpose of expressing an opinion on the effectiveness of the entity’s internal control. Accordingly, we express no such opinion. An audit also includes evaluating the appropriateness of accounting policies used and the reasonableness of significant accounting estimates made by management, as well as evaluating the overall presentation of the financial statements.
We believe that the audit evidence we have obtained is sufficient and appropriate to provide a basis for our audit opinion.

2
Opinion
In our opinion, based on our audit and the report of other auditors, the financial statements referred to above present fairly, in all material respects, the financial position of Union Sanitary District as of June 30, 2014 and 2013, and the changes in financial position and cash flows thereof for the years then ended in accordance with accounting principles generally accepted in the United States of America, as well as accounting systems provided by the State Comptroller’s Office for Special Districts.
Other Matters
Required Supplementary Information
Accounting principles generally accepted in the United States of America require that the management’s discussion and analysis and the schedules of funding progress for pension and retiree health benefit plan, as listed in the table of contents, be presented to supplement the basic financial statements. Such information, although not a part of the basic financial statements, is required by the Governmental Accounting Standards Board, who considers it to be an essential part of financial reporting for placing the basic financial statements in an appropriate operational, economic, or historical context. We have applied certain limited procedures to the required supplementary information in accordance with auditing standards generally accepted in the United States of America, which consisted of inquiries of management about the methods of preparing the information and comparing the information for consistency with management’s responses to our inquiries, the basic financial statements, and other knowledge we obtained during our audit of the basic financial statements. We do not express an opinion or provide any assurance on the information because the limited procedures do not provide us with sufficient evidence to express an opinion or provide any assurance.
Other Information
Our audit was conducted for the purpose of forming opinions on the financial statements that collectively comprise the District’s basic financial statements. The financial information listed as supplementary information in the table of contents is presented for purposes of additional analysis and is not a required part of the basic financial statements.
The supplementary information is the responsibility of management and was derived from and relates directly to the underlying accounting and other records used to prepare the financial statements. Such information has been subjected to the auditing procedures applied in the audit of the basic financial statements and certain additional procedures, including comparing and reconciling such information directly to the underlying accounting and other records used to prepare the basic financial statements or to the basic financial statements themselves, and other additional procedures in accordance with auditing standards generally accepted in the United States of America. In our opinion, the information is fairly stated in all material respects in relation to the basic financial statements as a whole.
Other Reporting Required by Government Auditing Standards
In accordance with Government Auditing Standards, we have also issued our report dated October 21, 2014, on our consideration of the District’s internal control over financial reporting and our tests of its compliance with certain provisions of laws, regulations, contracts and grant agreements and other matters. The purpose of that report is to describe the scope of our testing of internal control over financial reporting and compliance and the results of that testing, and not to provide an opinion on the internal control over financial reporting or on compliance. That report is an integral part of an audit performed in accordance with Government Auditing Standards in considering the District's internal control over financial reporting and compliance.
Pleasanton, CaliforniaOctober 21, 2014

UNION SANITARY DISTRICT
MANAGEMENT’S DISCUSSION AND ANALYSISJUNE 30, 2014
3
This section of the District’s annual financial report presents an analysis of the District’s financial performance during the fiscal year ended June 30, 2014. This information is presented in conjunction with the audited financial statements, which follow this section.
The District, which was established in 1918 and subsequently reorganized in 1923, is empowered to own and operate wastewater facilities and the Board of Directors may prescribe, revise and collect fees or charges for services and facilities of the District in connection with its wastewater system.
FINANCIAL HIGH LIGHTS
The District’s total ending net position decreased by $1.2 million as a result of this year's operations. At June 30, 2014 net position totaled $349.7 million. That is, the District’s total assets exceeded liabilities by $349.7 million.
During the year, the District had expenses, including depreciation of $17.2 million, which exceeded sewer service charges, contributed capital, interest, and other operating revenues resulting in a reduction in net position of $1.2 million. This compares to last year when expenses exceeded revenues by $2.9million.
Long-term liabilities increased by $454,000 during the current fiscal year due to the addition of State Revolving Fund loan proceeds (debt).
The District placed $35.7 million in assets into service compared to $10 million last year.
USING THIS ANNUAL REPORT
This annual report consists of a series of financial statements. The District-wide financial statements include the Statement of Net Position and the Statement of Revenues, Expenses and Changes in Net Position. These provide information about the activities of the District as a whole and present a longer-term view of the District's property, debt obligations and other financial matters. They reflect the flow of total economic resources in a manner similar to the financial reports of a business enterprise.
The notes to the financial statements provide narrative explanations or additional data needed for full disclosure.
Statement of Net Position – Includes all District assets and liabilities and provides information about the nature and amounts of investments in resources (assets) and obligations to creditors (liabilities). It also provides the basis for computing rate of return; evaluating the capital structure of the District; and assessing the liquidity and financial flexibility of the District.
Statement of Revenues, Expenses and Changes in Net Position – All of the current year revenues and expenses are accounted for in the Statement of Revenues, Expenses and Changes in Net Position. This statement measures the success of District operations over the past year and can be used to determine whether the District has successfully recovered all its costs through its user fees and other charges, profitability, and credit worthiness.

UNION SANITARY DISTRICT
MANAGEMENT’S DISCUSSION AND ANALYSISJUNE 30, 2014
4
Statement of Cash Flows – The primary purpose of this statement is to provide information about District cash receipts, cash disbursements and net changes in cash resulting from operations, investments, and capital and non-capital financing activities. It illustrates the source of revenue, purposes for which it was used, and change in cash balance during the reporting period.
Reporting the District as a Whole
The Statement of Net Position and the Statement of Revenues, Expenses, and Changes in Net Position
DISTRICT-WIDE FINANCIAL ANALYSIS
Our analysis focuses on the net position (Table 1) and changes in net position (Table 2) of the District's activities.
Net position of the District's business-type activities decreased from $350.9 million to $349.7 million. Unrestricted net position - the part of net position that can be used to finance day-to-day operations without constraints established by debt covenants, enabling legislation, or other legal requirements - were $32.8 million at June 30, 2014. The decrease in total net position was the result of a decrease in current and other assets of $5.3million, mainly investments, an increase in capital assets of $3.7 million, due to increased completed construction projects placed into service and depreciation, a decrease in current liabilities of approximately $0.9 million, and an increase in long term liabilities of $454,000.
Table 1 – Condensed Statement of Net Position
Dollar PercentFiscal Year Fiscal Year Fiscal Year Change Change
2014 2013 2012 FY14 to FY13 FY14 to FY13
Current and other assets 57,495,214$ 62,855,452$ 63,661,824$ (5,360,238)$ -8.5%Capital assets 338,757,641 335,041,723 336,569,446 3,715,918 1.1%
Total assets 396,252,855 397,897,175 400,231,270 (1,644,320) -0.4%
Current liabilities 9,146,967 10,007,413 10,034,883 (860,446) -8.6%Long-term liabilities 37,360,355 36,906,040 36,329,139 454,315 1.2%
Total liabilities 46,507,322 46,913,453 46,364,022 (406,131) -0.9%
Net Position:Net investment in capital assets 299,269,526 294,393,392 296,939,157 4,876,134 1.7%Restricted 17,622,778 20,297,820 19,346,378 (2,675,042) -13.2%Unrestricted 32,853,229 36,292,510 37,581,713 (3,439,281) -9.5%
Total net position 349,745,533$ 350,983,722$ 353,867,248$ (1,238,189)$ -0.4%
In the prior year, FY 2013, net position decreased from $353.9 million to $350.9 million, due mainly to adecrease in current and other assets of $806,000, mainly cash, a decrease in capital assets of $1.5 million, due to increased construction in progress and depreciation, a decrease in current liabilities of approximately $27,000, and an increase in long term liabilities of $577,000.

UNION SANITARY DISTRICT
MANAGEMENT’S DISCUSSION AND ANALYSISJUNE 30, 2014
5
Table 2 – Condensed Statement of Revenues, Expenses, and Changes in Net Position
Dollar PercentFiscal Year Fiscal Year Fiscal Year Change Change
2014 2013 2012 FY14 to FY13 FY14 to FY13Operating Revenues:
Sewer service charges (SSC) 45,139,420$ 42,339,311$ 40,630,578$ 2,800,109$ 6.6%Other revenues 1,370,017 1,163,802 1,027,357 206,215 17.7%
Total operating revenues 46,509,437 43,503,113 41,657,935 3,006,324 6.9%
Operating Expenses:Depreciation 17,219,109 16,776,307 16,790,277 442,802 2.6%Sewage treatment 15,410,521 16,088,929 14,255,266 (678,408) -4.2%Sewage collection and engineering 10,869,755 11,954,345 9,712,645 (1,084,590) -9.1%General and administration 6,634,688 6,111,468 5,951,818 523,220 8.6%
Total operating expenses 50,134,073 50,931,049 46,710,006 (796,976) -1.6%
Nonoperating Revenues (Expenses)Connection fees 3,489,247 3,062,836 2,848,488 426,411 13.9%Contributed capital 712,683 4,009,985 1,538,284 (3,297,302) -82.2%Investment income and net gains 180,041 178,690 248,337 1,351 0.8%Loss on retirement of capital assets (796,735) (1,479,254) (127,430) 682,519 -46.1%Interest (1,106,609) (1,138,677) (858,162) 32,068 -2.8%
Total net non-operating revenues (expenses) 2,478,627 4,633,580 3,649,517 (2,187,021) -47.2%
Change in net position before special items (1,146,009) (2,794,356) (1,402,554) 1,616,279 -57.8%East Bay Dischargers Authority loss (92,180) (89,170) (100,827) (3,010) 3.4%
Change in Net Position (1,238,189) (2,883,526) (1,503,381) 1,645,337 -57.1%Beginning Net Position 350,983,722 353,867,248 355,370,629 (2,883,526) -0.8%Ending Net Position 349,745,533$ 350,983,722$ 353,867,248$ (1,238,189)$ -0.4%
The District's total operating revenues such as sewer service charges increased by $3.0 million, or 7.0 percent for the year ended June 30, 2014. This is due mainly to a 5.7 percent increase in the sewer service charge rate, and an increase in other fees. Contributed capital decreased by $3.3 million. The total operating expenses, including depreciation, was 1.6 percent lower than last year. Most major cost categories increased over 2013 costs except for non-capital project costs, repairs and maintenance, and office supplies.
In the prior year, FY 2013, total operating revenues such as sewer services charges increased by $1.8million. This was due mainly to a 5 percent increase in the sewer service charge rate. The total operating expenses, including depreciation, was 9 percent higher than FY 2012. Most major cost categories increased, including non-capital project expense, insurance, office supplies, repairs and maintenance, and operating supplies. The main increase was for non-capital project expenses of $3.8 million for Force Main Improvement Project, Inka Demolition, Facilities Condition Assessment, among others. For more information please see schedules of Operating Expenses before Depreciation on page 37.

UNION SANITARY DISTRICT
MANAGEMENT’S DISCUSSION AND ANALYSISJUNE 30, 2014
6
30%
22%11%
31%
2%3% Sewage
TreatmentCollection & Eng
Gen & Admin
Depreciation
Interest
Loss on Assets
FY 2013 Expenses
The District took actions this year to compensate for increases in costs, and to avoid the loss of revenue due to changes in the economy.
The District increased sewer service fees 5.7%.
The District increased capacity fees 10%.

UNION SANITARY DISTRICT
MANAGEMENT’S DISCUSSION AND ANALYSISJUNE 30, 2014
7
CAPITAL ASSET AND DEBT ADMINISTRATION
Capital Assets
At the end of 2014, the District had approximately $339 million invested in a broad range of capital assets, including facilities and equipment for the plant, collections, and administrative facilities. This amount represents a net increase of $3.7 million, or 1.1 percent, compared to last year. The main reason for this is the accumulated depreciation in FY 2014. Total assets placed into service were $37.0 million in FY 2014 vs. $10 million in FY 2013 and $3.8 in FY 2012. Additions to Construction in Progress were $19.9 million in FY 2014 vs. $11.9million in FY 2013 and $18.6 million in FY 2012.
Additions to Construction in Progress totaled $19.9 million. Major projects included:
Table 3 – Additions to Construction in ProgressCogeneration 10,060,704$ I-680 at Sabercat Road Sanitary Sewer Replacement 1,622,258 Headworks & Emergency Outfall Improvements 1,425,256 Lift Station #1 Improvements 1,258,729 MCC Replacement Phase 2 881,082 Boyce Road Lift Station 792,590 Thickener Control Building Interim Improvements 582,639 RAS Pump Station Improvements 504,938 Hansen 8 Upgrade 502,714 Thickener Control Building Improvements Phase 2 500,723 Cast Iron Lining Phase 2 415,040 Others 1,379,086 Total 19,925,759$
This year’s major additions (placed into service) included:
Table 4 – Total Assets Placed into ServicePrimary Clarifiers 1-4 9,582,127$ Boyce Road Lift Station 8,236,316 Headworks & Emergency Outfall Improvements 3,887,951 Irvington Pump Station Solar Panels 3,144,560 I-680 at Sabercat Road Sanitary Sewer Replacement 2,334,939 Thickeners #3 & 4 Rehabilitation 1,865,693 Lift Station #1 Improvements 1,270,019 MCC Replacement Phase 2 950,824 PLC Replacement Phase 1 901,879 Thickener Control Building Interim Improvements 851,721 RAS Pump Station Improvements 675,167 Niles Sewer Construction 622,992 Cast Iron Lining Phase 4 466,034 Others 923,352
35,713,574$
More detailed information about the District’s capital assets is presented in Note 2 to the financial statements.

UNION SANITARY DISTRICT
MANAGEMENT’S DISCUSSION AND ANALYSISJUNE 30, 2014
8
Debt Administration
At year-end, the District had $39.5 million in notes outstanding versus $40.6 million last year. This debt consists of nine State Revolving Fund loans.
Other obligations include accrued vacation pay and sick leave. More detailed information about the District's long-term liabilities is presented in Note 5 to the financial statements.
ECONOMIC AND OTHER FACTORS
The District's elected and appointed officials considered many factors when setting the fiscal year 2014 budget. One of those factors was the economy. Increased salary and benefit costs, as well as increased CIP projects, were taken into consideration. In addition, the Board considered increasing construction costs when reviewing the CIP. Sewer service charge rates increased 5.7% and Capacity fee rates increased 10%. The net Operating budget was increased 6%, using a projected staff vacancy factor of 2%.
The District's fiscal year 2014 capital budget called for expenditures of $19.4 million for I-680 at Sabercat Rd, Newark Backyard Relocation, Cogeneration, Headworks Conveyors and Screenings, RAS Pump Stations Pumps and Valve Replacement, and Thickener Control Building Improvements among others. The Engineering group prioritized and rescheduled CIP projects in order to help achieve our goal of positive fund balances. The CIPbudget has increased by $3.9 million from fiscal year 2013.
The District’s fiscal year 2015 budget includes a 1.5% increase in the operating budget with a 2% staff vacancy factor, and a capital budget which calls for expenditures of $14.9 million for Cogeneration, Newark Backyard Relocation, Upper Hetch Hetchy, Cogeneration, Digester 5 Rehabilitation, and Thickener Control Building Improvements projects. Sewer service charges will increase 5.7% and Capacity fee rates will increase 5%.
The District will use its revenues to finance current projects, although applications will continue to be submitted to the State Water Resources Control Board for State Revolving Fund loans for upcoming projects.
CONTACTING THE DISTRICT'S FINANCIAL MANAGEMENT
This financial report is designed to provide our citizens, taxpayers, customers, and investors and creditors with a general overview of the District's finances and to show the District's accountability for the money it receives. If you have questions about this report or need additional financial information, contact the District at (510) 477-7500.

UNION SANITARY DISTRICT STATEMENTS OF NET POSITIONJUNE 30, 2014 AND 2013
9
2014 2013
CURRENT ASSETS
Cash, cash equivalents 994,203$ 643,752$ Investments 44,648,195 50,804,062
Accounts receivable, net 3,260,774 2,771,607
Interest receivable 79,360 99,811
Inventory 657,399 596,396
Other 21,257 21,659
Total current assets 49,661,188 54,937,287
NONCURRENT ASSETSCapital Assets
Non depreciable capital assets:
Land and improvements 5,593,929 5,593,929
Construction in progress 16,012,340 31,800,155
Capacity permits and easements 6,217,872 6,043,632
Depreciable assets
Utility plant in service 643,759,521 609,293,880
Less: Accumulated depreciation (332,826,021) (317,689,873)Net capital assets 338,757,641 335,041,723
Other Assets
Restricted investments 10,000 10,000
Net OPEB asset 1,443,759 1,435,718
Investment in East Bay Dischargers Authority 6,380,267 6,472,447
Total other assets 7,834,026 7,918,165
Total non-current assets 346,591,667 342,959,888
TOTAL ASSETS 396,252,855 397,897,175
CURRENT LIABILITIES
Accounts payable and accrued expenses 4,097,356 3,738,900
Customer deposits 588,996 381,542
Accrued payroll and related expenses 861,253 671,896
Interest payable 573,706 557,503Current portion of compensated absences 897,896 915,281
Current portion of long-term debt 2,127,760 3,742,291
Total current liabilities 9,146,967 10,007,413
LONG-TERM LIABILITIES
Long-term debt, net of current portion 37,360,355 36,906,040
Total long-term liabilities 37,360,355 36,906,040
TOTAL LIABILITIES 46,507,322 46,913,453
NET POSITION
Net investment in capital assets 299,269,526 294,393,392
Restricted for:
Capacity purposes, expendable 14,165,399 16,093,405
SRF loan contingency reserve, non-expendable 3,457,379 4,204,415 Unrestricted 32,853,229 36,292,510
TOTAL NET POSITION 349,745,533$ 350,983,722$
The accompanying notes are an integral part of these financial statements.

UNION SANITARY DISTRICT STATEMENTS OF REVENUES, EXPENSES AND CHANGES IN NET POSITIONFOR THE YEARS ENDED JUNE 30, 2014 AND 2013
10
2014 2013
OPERATING REVENUES
Sewer service charges 45,139,420$ 42,339,311$
Other operating revenues 1,370,017 1,163,802
Total operating revenue 46,509,437 43,503,113
OPERATING EXPENSES
Sewage treatment 15,410,523 16,088,929
Sewage collection and engineering 10,869,755 11,954,345
General and administration 6,634,688 6,111,468
Total operating expenses before depreciation 32,914,966 34,154,742
DEPRECIATION 17,219,109 16,782,481
Total operating expenses 50,134,075 50,937,223
OPERATING LOSS (3,624,638) (7,434,110)
NON-OPERATING REVENUES (EXPENSES)
Net investment income and net realized gains and losses 180,041 178,690
Interest Expense (1,106,609) (1,138,677)
Loss on retirement of capital assets (796,735) (1,473,080)
Loss on equity investment in East Bay Dischargers Authority (92,180) (89,170)
Net non-operating revenue (expense) (1,815,483) (2,522,237)
LOSS BEFORE CONTRIBUTED CAPITAL (5,440,121) (9,956,347)
Connection fees and other contributed capital 4,201,932 7,072,821
CHANGE IN NET POSITION (1,238,189) (2,883,526)
NET POSITION, BEGINNING OF YEAR 350,983,722 353,867,248
NET POSITION, END OF YEAR 349,745,533$ 350,983,722$
The accompanying notes are an integral part of these financial statements.

UNION SANITARY DISTRICT STATEMENTS OF CASH FLOWSFOR THE YEARS ENDED JUNE 30, 2014 AND 2013
11
2014 2013
CASH FLOWS FROM OPERATING ACTIVITIES
Receipts from customers 46,020,270$ 43,693,132$
Payments to suppliers & service providers (11,512,817) (14,855,529)
Payments to employees (14,647,781) (13,983,330)
Payments for benefits on behalf of employees (5,829,730) (5,692,889)
Receipts for customer deposits 450,116 385,256
Returns of customer deposits (242,662) (266,735)
Payments related to postemployment benefits (462,852) (448,284)
Cash flows provided by operating activities 13,774,544 8,831,621
CASH FLOWS FROM CAPITAL AND RELATED FINANCIAL ACTIVITIES
Principal payments on long-term debt (3,742,293) (3,306,586)
Proceeds from state revolving loan funds 2,582,077 4,324,628
Interest paid on long-term debt (1,090,406) (986,604)
Acquisition and construction of capital assets (21,019,079) (12,717,853)
Connection fees and other related revenues from developers 3,489,249 3,062,836
Cash flows used in capital and related financing activities (19,780,452) (9,623,579)
CASH FLOWS FROM INVESTING ACTIVITIES
Interest received 200,492 271,737
Purchase of investments (62,639,133) (57,498,133)
Proceeds from sales and maturities of investments 68,795,000 57,040,000
Cash flows provided by investing activities 6,356,359 (186,396)
NET INCREASE IN CASH AND CASH EQUIVALENTS 350,451 (978,354)
CASH AND CASH EQUIVALENTS, BEGINNING OF YEAR 643,752 1,622,106
CASH AND CASH EQUIVALENTS, END OF YEAR 994,203$ 643,752$
RECONCILIATION OF OPERATING LOSS TO
NET CASH FROM OPERATING ACTIVITES
Operating loss (3,624,638)$ (7,434,110)$ Adjustments to reconcile operating loss to cash flows
provided by operating activities
Depreciation 17,219,109 16,782,481
(Increase) decrease in accounts receivable and other assets (489,167) 190,019
Increase (decrease) in accounts payable and accrued expenses 358,456 (827,495)
Decrease in inventory and other 103,330 2,205
Increase in customer deposits 207,454 118,521
Cash flows provided by operating activities 13,774,544$ 8,831,621$
NONCASH TRANSACTIONS
Contributions of capital assets 712,683$ 4,009,985$
Decrease in equity in East Bay Dischargers Authority 92,180 89,170
The accompanying notes are an integral part of these financial statements.

UNION SANITARY DISTRICT
NOTES TO THE FINANCIAL STATEMENTSJUNE 30, 2014 AND 2013
12
NOTE #1 – SUMMARY OF SIGNIFICANT ACCOUNTING POLICIES
The Organization
Union Sanitary District (the “District”) operates pursuant to Division 6 of the Health and Safety Code of the State of California (Sanitary District Act of 1923, as amended). The District, which was established in 1918 and subsequently reorganized in 1923, is empowered to own and operate wastewater facilities, and the Board of Directors may prescribe, revise and collect fees or charges for services and facilities of the District in connection with its wastewater system.
The District is governed by a five-member Board of Directors elected by wards for four-year overlapping terms. The election is at-large and non-partisan. The Board appoints the General Manager to manage and oversee the day-to-day operations.
The accounting policies of the District conform to accounting principles generally accepted in the United States of America as applicable to enterprise governments. The Governmental Accounting Standards Board (GASB) is the accepted standard-setting body for governmental accounting and financial reporting principles. The GASB establishes standards for external financial reporting for all state and local governmental entities, which require a management and discussion and analysis section, a statement of net position, a statement of revenues, expenses, and changes in net position, and a statement of cash flows. It requires the classification of net position into three components: invested in capital assets, restricted, and unrestricted.
The Financial Reporting Entity
For financial reporting purposes component units are defined as legally separate organizations for which the elected officials of the primary government are financially accountable, and other organizations for which the nature and significance of their relationship with a primary government are such that exclusion would cause the reporting entity’s financial statements to be misleading or incomplete. The District considered all potential component units in determining what organizations should be included in the financial statements. The District has determined that there are no component units that meet these criteria as of, and for the year ended June 30, 2014. The District includes all funds that are controlled by, or dependent upon the Board of Directors of the District.
In addition, the District’s share of a Joint Powers Authority (East Bay Dischargers Authority) is reflected based upon the District’s proportionate share of its investment in the discharge facilities in the Authority (see Note 4).
Measurement Focus and Basis of Accounting
The financial statements of the District are presented as those of an enterprise fund under the broad category of funds called proprietary funds, which also include internal service funds. All proprietary funds utilize the economic resources measurement focus and the accrual basis of accounting. Under the accrual basis of accounting, revenues are recognized when earned, and expenses are recorded when the liability is incurred or economic asset utilized.

UNION SANITARY DISTRICT
NOTES TO THE FINANCIAL STATEMENTSJUNE 30, 2014 AND 2013
13
NOTE #1 – SUMMARY OF SIGNIFICANT ACCOUNTING POLICIES - CONTINUED
Enterprise funds account for business-like activities provided to the general public. These activities are financed primarily by user charges, and the measurement of financial activity focuses on net income measurement similar to the private sector. The acquisition and capital improvement of the physical plant facilities requires that these goods and services be financed from existing cash resources, cash flow from operations, the issuance of debt, and contributed capital.
Certain amounts presented in the prior year data have been reclassified in order to be consistent with the current year’s presentation.
Cash and Cash Equivalents
The District considers all highly liquid investments, which are readily convertible into known amounts of cash and have a maturity of three months or less when acquired, to be cash equivalents. As of June 30, 2014 and 2013, cash equivalents consist of U.S. Treasury funds in a sweep account.
Certain cash and cash equivalents have been placed into escrow according to the requirements of ongoing construction contracts. Accordingly, such cash and cash equivalents have been classified as restricted in the accompanying financial statements.
Investments
Investments, which consist of short-term, fixed-income securities at June 30, 2014 and 2013, are recorded at fair value using quoted market prices. The related net realized and unrealized gains (losses) on investments are recognized in the accompanying statement of revenues expenses, and changes in net position.
Certain investments have been placed into escrow according to the requirements of ongoing construction contracts. Accordingly, such investments have been classified as restricted in the accompanying financial statements.
Inventory
Inventory is held for consumption and is recorded at cost using the first-in-first-out (FIFO) basis.
Capital Assets
Capital assets, including costs of addition to utility plant and major replacements of property, are capitalized and stated at cost. The District’s capitalization threshold is $10,000. Such capital costs include materials, direct labor, transportation, and such indirect costs as interest and contracted engineering. Contributed property is recorded as fair value as of the date of donation. Repairs, maintenance, and minor replacements of property are charges to expense.
UNION SANITARY DISTRICT
NOTES TO THE FINANCIAL STATEMENTSJUNE 30, 2014 AND 2013
14
NOTE #1 – SUMMARY OF SIGNIFICANT ACCOUNTING POLICIES - CONTINUED
Depreciation
The purpose of depreciation is to spread the cost of capital assets equitably among all customers over the life of those assets. The amount charged to depreciation expense each year represents that year’s pro rata share of capital asset costs.
Depreciation of all capital assets in service is charged as an expense against operations each year. Accumulated depreciation, the total amount of depreciation taken over the years, is reported on the statement of net position as a reduction in the gross value of the capital assets.
Depreciation of capital assets in service is calculated using the straight line method, dividing the cost of the asset by its expected useful life in years. The result is charged to expense each year until the asset is fully depreciated. It is the District’s policy to utilize the half-year convention when calculating depreciation. The District has assigned the following useful lives to capital assets:
Useful LivesWastewater collection facilities 50 – 115 yearsWastewater treatment facilities 10 – 50 yearsDistrict facilities 10 – 35 yearsGeneral equipment 3 – 35 years
The aggregate provision for depreciation was 3.07 percent and 2.99 percent of average depreciable plant during the years ended June 30, 2014 and 2013, respectively.
Compensated Absences
Vacation can be accumulated and is fairly vested. These compensated absences are recorded as an expense when earned and are carried as a liability until taken. The liability is computed using current employee pay rates.
Net Position
Net position is measured on the full accrual basis and is the excess of all the District’s assets over all itsliabilities. Net position is classified into the following components: net investment in capital assets, restricted and unrestricted. Restricted net position describes the portion of net position which is restricted as to use by the terms and conditions of agreement with outside parties, governmental regulations, laws, or other restrictions which the District cannot unilaterally alter. It is the District’s policy to apply restricted resources first when an expense is incurred for purposes for which both restricted and unrestricted resources are available.The following categories of restricted net position are described as follows:
Net Position Restricted for Capacity Purposes – restricted for activities related to increases in the capacity of the collection and/or treatment systems.
Net Position Restricted for Debt Purposes – the State requires a contingency reserve for State Revolving Fund loan balances.

UNION SANITARY DISTRICT
NOTES TO THE FINANCIAL STATEMENTSJUNE 30, 2014 AND 2013
15
NOTE #1 – SUMMARY OF SIGNIFICANT ACCOUNTING POLICIES - CONTINUED
Classification of Revenues and Expenses
Operating revenues consist primarily of sewer service charges to customers, which are billed and collected on behalf of the District by Alameda County (the County) as a separate component of semiannual property tax billings. Property taxes are levied on March 1 and are due in equal installments on November 1 and February 1. The County remits to the District those charges which are placed on the property tax roll and handles all delinquencies, retaining interest and penalties.
Nonoperating revenues consist of investment income and special charges that can be used for either operating or capital purposes.
Capital contributions consist of contributed capital assets, connection, and capacity fees that are legally restricted for capital expenditures by State law or by Board actions that established those charges. Connection and capacity fees represent a one-time contribution of resources to the District, imposed on contractors and developers for the purpose of financing capital improvements.
Operating expenses are those expenses that are essential to the primary operations of the District. Operating expenses include costs related to wastewater collection and treatment, as well as engineering and general and administrative expenses. Other expenses such as investment losses, interest expense, and loss on retirement of capital assets are reported as non-operating expenses.
Use of Estimates
The preparation of financial statements in conformity with generally accepted accounting principles (GAAP) requires management to make estimates and assumptions that affect the reported amounts of assets and liabilities and disclosure of contingent assets and liabilities at the date of the financial statements and the reported amounts of revenues and expenses during the reporting period. Actual results could differ from those estimates.
Subsequent Events
Management has considered subsequent events through October 21, 2014, the date which the financial statements were available to be issued.
Change in Accounting Principles
In March 2012, the GASB issued Statement No. 65, Items Previously Reported as Assets and Liabilities. This Statement establishes accounting and financial reporting standards that reclassify, as deferred outflows of resources or deferred inflows of resources, certain items that were previously reported as assets and liabilities and recognizes, as outflows of resources or inflows of resources, certain items that were previously reported as assets and liabilities.

UNION SANITARY DISTRICT
NOTES TO THE FINANCIAL STATEMENTSJUNE 30, 2014 AND 2013
16
NOTE #1 – SUMMARY OF SIGNIFICANT ACCOUNTING POLICIES - CONTINUED
Concepts Statement No. 4, Elements of Financial Statements, introduced and defined the elements included in financial statements, including deferred outflows of resources and deferred inflows of resources. In addition, Concepts Statement 4 provides that reporting a deferred outflow of resources or a deferred inflow of resources should be limited to those instances identified by the Board in authoritative pronouncements that are established after applicable due process. Prior to the issuance of this Statement, only two such pronouncements have been issued. Statement No. 53, Accounting and Financial Reporting for Derivative Instruments, requires the reporting of a deferred outflow of resources or a deferred inflow of resources for the changes in fair value of hedging derivative instruments, and Statement No. 60, Accounting and Financial Reporting for Service Concession Arrangements, requires a deferred inflow of resources to be reported by a transferor government in a qualifying service concession arrangement. This Statement amends the financial statement element classification of certain items previously reported as assets and liabilities to be consistent with the definitions in Concepts Statement 4. This Statement also provides other financial reporting guidance related to the impact of the financial statement elements deferred outflows of resources and deferred inflows of resources, such as changes in the determination of the major fund calculations and limiting the use of the term deferred in financial statement presentations. The District has implemented the provisions of this Statement for the year ended June 30, 2014 with no significant impact.
New Accounting Pronouncements
In June 2012, the GASB issued Statement No. 68, Accounting and Financial Reporting for Pensions—an amendment of GASB Statement No. 27. The primary objective of this Statement is to improve accounting and financial reporting by state and local governments for pensions. It also improves information provided by state and local governmental employers about financial support for pensions that is provided by other entities. This Statement results from a comprehensive review of the effectiveness of existing standards of accounting and financial reporting for pensions with regard to providing decision-useful information, supporting assessments of accountability and inter-period equity, and creating additional transparency.
In November 2013, the GASB issued Statement No. 71, Pension Transition for Contributions Made Subsequent To the Measurement Date, which amends Statement No. 68, Accounting and Financial Reporting for Pensions.As currently provided under Statement No. 68, an employer’s date for measuring its net pension liability (i.e., the “measurement date”) may be no earlier than the end of its prior fiscal year. In addition, if an employer makes contributions after the measurement date, but before the end of its current reporting period, the employer should recognize the contribution as a deferred outflow of resources.
However, in transitioning to the new accounting standards, GASB Statement No. 68 also required that the employer recognize deferred outflows of resources and deferred inflows of resources only if it is practical for the employer to determine all deferred outflows and deferred inflows. If it is not practical, the beginning balances of deferred outflows and deferred inflows should not be reported. However, in situations where the employer makes contributions after the measurement date, not recognizing the contributions in deferred outflows of resources could result in a substantial understatement of the employer’s beginning net position.
To prevent this understatement, GASB Statement No. 71 requires that, at transition, a government should recognize a beginning deferred outflow of resources for its pension contributions made after the measurement date of the beginning net pension liability. However, it continues to require that the beginning balances for otherdeferred outflows and deferred inflows be reported at transition only if it is practical to determine such amounts.

UNION SANITARY DISTRICT
NOTES TO THE FINANCIAL STATEMENTSJUNE 30, 2014 AND 2013
17
Both Statements No. 68 and 71 are effective simultaneously for fiscal years beginning after June 15, 2014. Early implementation is encouraged. Management is evaluating the impact the Statements will have on the financial statements.
NOTE #2 – CAPITAL ASSETS
Capital asset activity for the year ended June 30, 2014 is summarized as follows:
Balance Balance
June 30, 2013 Additions Deletions Transfers June 30, 2014
Capital assets, not being depreciated:
Land and improvements 5,593,929$ -$ -$ -$ 5,593,929$
Construction in progress 31,800,155 19,925,759 - (35,713,574) 16,012,340
Capacity permits and easements 6,043,632 174,240 - - 6,217,872
Total Capital assets, not being depreciated: 43,437,716 20,099,999 - (35,713,574) 27,824,141
Capital assets, being depreciated:
Sewage collection facilities 402,324,798 712,683 (1,158,187) (1,743,374) 400,135,920
Sewage treatment facilities 163,545,041 - (446,465) (5,536,447) 157,562,129
District facilities 39,177,008 - (951,232) 35,025,062 73,250,838
General equipment 4,247,033 46,824 (75,164) 2,341,583 6,560,276
Fleet - 800,820 (248,648) 5,698,186 6,250,358
Total Capital assets, being depreciated: 609,293,880 1,560,327 (2,879,696) 35,785,010 643,759,521
Less: Accumulated depreciation
Sewage collection facilities (209,490,165) (9,687,906) 613,807 3,806,911 (214,757,353)
Sewage treatment facilities (88,437,256) (4,584,708) 336,365 14,815,278 (77,870,321)
District facilities (16,676,712) (2,067,840) 813,088 (13,720,710) (31,652,174)
General equipment (3,085,740) (510,795) 75,164 (1,418,109) (4,939,480)
Fleet - (367,861) 244,538 (3,483,370) (3,606,693)
Total Accumulated depreciation: (317,689,873) (17,219,110) 2,082,962 - (332,826,021)
Total capital assets, being depreciated , net 291,604,007 (15,658,783) (796,734) 35,785,010 310,933,500
Total Capital Assets, net 335,041,723$ 4,441,216$ (796,734)$ 71,436$ 338,757,641$
Construction work in progress consists primarily of the direct construction costs associated with numerous District projects plus related construction overhead. The District has outstanding construction contract commitments on capital projects approximating $15.6 million at June 30, 2014.

UNION SANITARY DISTRICT
NOTES TO THE FINANCIAL STATEMENTSJUNE 30, 2014 AND 2013
18
NOTE #2 – CAPITAL ASSETS - CONTINUED
Capital asset activity for the year ended June 30, 2013 is summarized as follows:
Balance Balance
June 30, 2012 Additions Deletions Transfers June 30, 2013
Capital assets, not being depreciated:
Land and improvements 5,395,903$ 198,026$ -$ -$ 5,593,929$
Construction in progress 25,094,235 11,868,287 - (5,162,367) 31,800,155
Capacity permits and easements 6,043,632 - - - 6,043,632
Total Capital assets, not being depreciated: 36,533,770 12,066,313 - (5,162,367) 43,437,716
Capital assets, being depreciated:
Sewage collection facilities 397,641,506 4,009,985 (693,699) 1,367,006 402,324,798
Sewage treatment facilities 160,543,832 - (566,051) 3,567,260 163,545,041
District facilities 39,932,779 565,915 (1,473,622) 151,936 39,177,008
General equipment 5,969,586 85,625 (1,884,343) 76,165 4,247,033
Total Capital assets, being depreciated: 604,087,703 4,661,525 (4,617,715) 5,162,367 609,293,880
Less: Accumulated depreciation
Sewage collection facilities (200,014,215) (9,828,694) 352,744 - (209,490,165)
Sewage treatment facilities (84,045,740) (4,527,357) 135,841 - (88,437,256)
District facilities (15,761,064) (1,890,764) 975,116 - (16,676,712)
General equipment (4,231,008) (535,666) 1,680,934 - (3,085,740)
Total Accumulated depreciation: (304,052,027) (16,782,481) 3,144,635 - (317,689,873)
Total capital assets, being depreciated , net 300,035,676 (12,120,956) (1,473,080) 5,162,367 291,604,007
Total Capital Assets, net 336,569,446$ (54,643)$ (1,473,080)$ -$ 335,041,723$
NOTE #3 – CASH AND INVESTMENTS
A. Summary of Cash and Cash Equivalents and Investments
Cash and cash equivalents and investments at June 30 are detailed as follows:
2014 2013
Cash and cash equivalents 994,203$ 643,752$
Investments 44,648,195 50,804,062
Restricted investments 10,000 10,000
Total Cash and Cash Equivalents and Investments 45,652,398$ 51,457,814$

UNION SANITARY DISTRICT
NOTES TO THE FINANCIAL STATEMENTSJUNE 30, 2014 AND 2013
19
NOTE #3 – CASH AND INVESTMENTS - CONTINUED
B. Authorized Investments by the District
The District’s investment policy and the California Government Code allow the District to invest in the followinginvestments, with certain limiting provisions that address interest rate, risk, credit risk, and concentration of credit risk.
Maximum Minimum Maximum Maximum
Authorized Remaining Credit Percentage Investment
Investment Type Maturity Quality of Portfolio In One Issuer
U.S. Treasury Obligations 5 years N/A None None
U.S. Agency Obligations (a) 5 years N/A None None
Bankers Acceptance (b) 180 days A1/P1 (ST) 40% 10%
A (LT)
Certificates of Deposit 180 days N/A 30% 10%Negotiable Certificates of Deposit 5 years A1 (ST) 30% 10%
A (LT)
Repurchase Agreements (c) 90 days N/A 10% 10%
Commercial Paper 270 days "Prime" quality 25% 10%
Local Agency Investment Fund (LAIF) N/A N/A 70% None
Corporate Notes (d) 5 years A 30% 10%
Mortgage Pass-through and Asset Backed Securities N/A AAA or Aaa 20% 10%
Money Market Funds N/A AAA or Aaa 20% 10%
a) Securities issued by agencies sponsored by the federal government such as the Federal Farm Credit Bank (FFCB), the Federal Home Loan Bank (FHLB), the Federal National Mortgage Association (FNMA), and the Federal Home Loan Mortgage Corporation (FHLMC).
b) Bankers Acceptances issued by institutions the short term obligations of which are rated at a minimum of “P1” by Moody’s Investor Services (Moody’s) and A1 by Standard & Poor’s, Inc. (S&P); or if the short term obligations are unrated, the long-term obligations of which are rated a minimum of “A” by S&P.
c) Repurchase agreements must be collateralized with U.S. Treasury Obligation or U.S. Agency Securities, which must maintain a market value of at least 102% of the principal of the repurchase agreement.
d) Securities shall be issued by corporations rated a minimum of “A” by S&P.

UNION SANITARY DISTRICT
NOTES TO THE FINANCIAL STATEMENTSJUNE 30, 2014 AND 2013
20
NOTE #3 – CASH AND INVESTMENTS - CONTINUED
C. Interest Rate Risk
Interest rate risk is the risk that changes in market interest rates will adversely affect the fair value of an investment. Generally, the longer the maturity of an investment, the greater the sensitivity of its fair value to changes in market interest rates.
Information about the sensitivity of the fair values of the District’s investments to market interest rate fluctuations is provided by the following table that shows the distribution of the District’s investments by maturity as of June 30:
2014
12 months or less 12-24 months Total
U.S. Treasury Obligations 2,002,187$ 5,031,948$ 7,034,135$
U.S. Agency Obligations:
FHLB - 1,000,150 1,000,150
FNMA - 1,001,700 1,001,700
Corporate Notes 3,580,240 2,578,155 6,158,395
Certificates of Deposit 3,942,289 239,814 4,182,103
LAIF 25,271,923 - 25,271,923
Local Government Investment Pool (CAMP) 9,789 - 9,789
Total Investments 34,806,428 9,851,767 44,658,195
Cash in bank and money market funds 994,203 - 994,203 Total Cash and Investments 35,800,631$ 9,851,767$ 45,652,398$
2013
12 months or less 12-24 months Total
U.S. Treasury Obligations 2,014,140$ 2,004,063$ 4,018,203$
U.S. Agency Obligations:
FHLB 4,033,740 - 4,033,740
FNMA 931,956 1,997,300 2,929,256
Corporate Notes 4,264,164 1,576,605 5,840,769
Certificates of Deposit 1,228,401 720,316 1,948,717
LAIF 32,009,735 - 32,009,735
Local Government Investment Pool (CAMP) 33,642 - 33,642
Total Investments 44,515,778 6,298,284 50,814,062
Cash in bank and money market funds 643,752 - 643,752 Total Cash and Investments 45,159,530$ 6,298,284$ 51,457,814$
Maturities of
Maturities of

UNION SANITARY DISTRICT
NOTES TO THE FINANCIAL STATEMENTSJUNE 30, 2014 AND 2013
21
NOTE #3 – CASH AND INVESTMENTS - CONTINUED
D. LAIF Pool
The District is a voluntary participant in the Local Agency Investment Fund (LAIF). LAIF is regulated by California Government Code Section 16429 under the oversight of the Treasurer of the State of California. The District reports its investment in LAIF at the fair value amount provided by LAIF, which is the same as the value of the pool share. The balance is available for withdrawal on demand, and is based in the accounting records maintained by LAIF, which are recorded on an amortized cost basis. Included in LAIF’s investment portfolio are collateralized mortgage obligations, mortgage-backed securities, other asset-backed securities, loans to certain state funds, and floating rate securities issued by federal agencies, government-sponsored enterprises, United States Treasury Notes and Bills and corporations. The carrying value of LAIF approximates fair value. At June 30, 2014, these investments mature in an average of 232 days.
E. Credit Risk
Credit risk is the risk that an issuer of an investment will not fulfill its obligation to the holder of the investment. This is measured by the assignment of a rating by a nationally recognized statistical rating organization. Presented below is the actual rating as of June 30, 2014 for each investment type:
Aaa Aa3 A1 A3 A2 TotalU.S. Agency Obligations
FHLB 1,000,150$ -$ -$ -$ -$ 1,000,150$ FNMA 1,001,700 - - - - 1,001,700
Corporate Notes - 1,565,435 3,564,200 1,028,760 - 6,158,395
Local Government Investment Pool (CAMP) 9,789 - - - - 9,789 Totals 2,011,639$ 1,565,435$ 3,564,200$ 1,028,760$ -$ 8,170,034
Exempt from credit rate disclosureU.S. Treasury Obligations 7,034,135
Certificates of deposit 4,182,103 Not rated
California Local Agency Investment Fund 25,271,923
Cash and cash equivalents 994,203 Total Cash, Cash Equivalents and Investments 45,652,398$
Presented below is the actual rating as of June 30, 2013 for each investment type:
Aaa Aa3 A1 A3 A2 TotalU.S. Agency Obligations
FHLB 4,033,740$ -$ -$ -$ -$ 4,033,740$
FNMA 2,929,256 - - - - 2,929,256
Corporate Notes - 2,726,484 2,050,485 - 1,063,800 5,840,769 Local Government Investment Pool (CAMP) 33,642 - - - - 33,642
Totals 6,996,638$ 2,726,484$ 2,050,485$ -$ 1,063,800$ 12,837,407
Exempt from credit rate disclosureU.S. Treasury Obligations 4,018,203
Certificates of deposit 1,948,717
Not rated
California Local Agency Investment Fund 32,009,735 Cash and cash equivalents 643,752
Total Cash, Cash Equivalents and Investments 51,457,814$

UNION SANITARY DISTRICT
NOTES TO THE FINANCIAL STATEMENTSJUNE 30, 2014 AND 2013
22
NOTE #3 – CASH AND INVESTMENTS - CONTINUED
F. Concentration of Credit Risk
Concentration of credit risk is the risk of a loss attributed to the magnitude of a government’s investment in a single issuer.
As of fiscal year ended June 30, 2014, the District did not have investments held that are more than five percentof the District’s total investments.
G. Custodial Credit Risk
Deposits
This is the risk that in the event of a bank failure, the District’s deposits may not be returned to it. The District’s policy, as well as the California Government Code, requires that a financial institution secure deposits made by state or local governmental units by pledging securities in an undivided collateral pool held by a depository regulated under state law (unless so waived by the governmental unit). The market value of the pledged securities in the collateral pool must equal at least 110 percent of the total amount deposited by the public agencies. California law also allows financial institutions to secure public deposits by pledging first trust deed mortgage notes having a value of 150 percent of the secured public deposits and letters of credit issued by the Federal Home Loan Bank of San Francisco having a value of 105 percent of the secured deposits. As of June 30, 2014, the District’s total bank balance of $2,564,579 was either collateralized or insured by the Federal Deposit Insurance Corporation (FDIC).
Investments
This is the risk that, in the event of the failure of the counterparty, the District will not be able to recover the value of its investments or collateral securities that are in possession of an outside party. The California Government Code does not contain legal or policy requirements that would limit the exposure to custodial credit risk for investments. However, the District’s policy states that all security transactions entered into by the District shall be conducted on delivery-versus-payment (DVP) basis. All securities purchased or acquired shall be delivered to the District by book entry, physical delivery, or by third party custodial agreement as required by CGC Section 53601. The collateralization on repurchase and reverse repurchase agreements will adhere to the amount required under CGC Section 53601(i) (2).

UNION SANITARY DISTRICT
NOTES TO THE FINANCIAL STATEMENTSJUNE 30, 2014 AND 2013
23
NOTE #4 – JOINT VENTURES
Alameda County Water District Financing Authority
The Alameda County Water District Financing Authority, a Joint Powers Authority, was established through Joint Exercise of Powers Agreement between the Alameda County Water District (ACWD) and Union Sanitary District (USD) on November 14, 2011 for the purpose of assisting in the financing and refinancing of capital improvement projects of the ACWD and to finance working capital for the ACWD. The debts, liabilities, and obligations of the Authority do not constitute debts, liabilities, and obligations of Union Sanitary District. The Authority is administered by the Board, which consists of one member from Union Sanitary District and five members from the Alameda County Water District.
Investment in East Bay Dischargers Authority
The District has an 18.7 percent interest in East Bay Discharges Authority (EBDA), a Joint Powers Authority established under the Joint Exercise of Powers Act of the State of California. As a separate legal entity, EBDA exercises full power and authority within the scope of the related Joint Powers Agreement, including the preparation of annual budgets, accountability for all funds, the power to make and execute contracts and the right to sue and be sued. Obligations and liabilities of EBDA are not those of the District and the other participating entities.
EBDA is governed by a board of directors consisting of representatives from each member agency. The board controls the operations of EBDA, including selection of management and approval of operating budgets, independent of any influence by member agencies beyond their representation on the Board.
EBDA constructed and operates an export pumping facility through which all treated wastewater in the area is discharged. The other participants (and their ownership percentages) are the City of Hayward (33 percent), the City of San Leandro (18.6 percent), and the Oro Loma and Castro Valley Sanitary Districts (collectively, 29.7percent). The District has rights to 18.7 percent of EBDA’s capacity.
Because the District has the ability to exercise influence over operating and financial policies of the EBDA, the District’s proportionate share of EBDA’s net position, excluding sole use of facilities, and the District’s share of its undivided ownership (18.7 percent) in EBDA’s total net equity, have been recorded as an investment in EBDA accounted for under the equity method.
Summary financial information for EBDA, as of June 30, 2013 and 2012 and for the years then ended, the most recent audited information available, is as follows:
2013 2012
Total Assets 35,164,995$ 35,461,881$
Total liabilities 1,045,918 849,863 Net position value of EBDA 34,119,077$ 34,612,018$
District's share at 18.7% 6,380,267$ 6,472,447$
Net loss on equity investment in EBDA 92,180$ 89,170$
EBDA has no outstanding debt.

UNION SANITARY DISTRICT
NOTES TO THE FINANCIAL STATEMENTSJUNE 30, 2014 AND 2013
24
NOTE #4 – JOINT VENTURES – CONTINUED
During fiscal year ended June 30, 2014 and 2013, the District was charged $1,052,368 and $1,060,693, respectively, by EBDA primarily for operating costs. Such costs are included in the wastewater treatment expenses by the District for financial reporting purposes.
The financial statement for EBDA may be obtained from the EBDA, 2651 Grant Avenue, San Lorenzo, CA 94580-1841.
NOTE #5 - LONG-TERM OBLIGATIONS
Long-term obligations at June 30, 2014 are summarized as below:
Maturity Interest Balance Balance CurrentDate Rate 7/1/13 Additions Retirements 6/30/14 Portion
2003 State Revolving Fund Loan - Irvington 08/30/23 2.4% 8,689,163$ -$ 699,624$ 7,989,539$ 716,415$ 2008 State Revolving Fund Loan - Willow 11/16/27 2.4% 1,351,877 - 75,939 1,275,938 77,762 2008 State Revolving Fund Loan - Newark 01/26/30 2.7% 9,246,018 - 435,762 8,810,256 447,528 2008 State Revolving Fund Loan - Hetch Hetchy 11/17/28 2.7% 1,794,865 - 91,173 1,703,692 93,634 2009 State Revolving Fund Loan - Cedar Blvd. 02/26/30 2.5% 1,746,236 - 83,694 1,662,542 85,786 2011 State Revolving Fund Loan - Primary Cl. 01/15/33 2.7% 8,737,074 291,330 351,691 8,676,713 355,510 2011 State Revolving Fund Loan - Substation 1 02/28/32 2.6% 2,335,432 - 96,606 2,238,826 99,118 2011 State Revolving Fund Loan - Boyce Rd. Lift Station 03/31/33 2.6% 4,839,862 1,514,148 - 6,354,010 252,007
2014 State Revolving Fund Loan- Thickener Control Building 03/31/36 2.1% - 776,599 - 776,599 - Compensated absences n/a n/a 915,281 949,268 966,653 897,896 897,896
41,563,612$ 3,531,345$ 4,708,946$ 40,386,011$ 3,025,656$
A. 2003 State Revolving Fund Loan – Irvington
During 2003, the District entered into a loan agreement with the California State Water Resources Control Board in accordance with the State Revolving Fund Loan Program. As of March 26, 2004, $14,301,057, the maximum loan amount, had been drawn. The interest rate on the loan is 2.4 percent and is payable in twenty annual installments, beginning on year after initial loan disbursement. The purpose of this loan was to finance the Irvington Equalization Storage Facilities project.
B. 2008 State Revolving Fund Loan – Willow
During 2008, the District entered into a loan agreement with the California State Water Resources Control Board in accordance with the State Revolving Fund Loan Program. The interest rate on the loan is 2.4 percent and is payable in twenty annual installments, beginning one year after initial loan disbursement. The purpose of this loan was to finance the Willow/Central Avenue sanitary sewer rehabilitation project. The maximum amount of this agreement is $1,749,329 based upon projected costs to be incurred.

UNION SANITARY DISTRICT
NOTES TO THE FINANCIAL STATEMENTSJUNE 30, 2014 AND 2013
25
NOTE #5 - LONG-TERM OBLIGATIONS – CONTINUED
C. 2008 State Revolving Fund Loan – Newark Pump Station
During 2008, the District entered into a loan agreement with the California State Water Resources Control Board in accordance with the State Revolving Fund Loan Program. The interest rate on the loan is 2.7 percent and is payable in twenty annual installments, beginning in 2011. The purpose of this loan was to finance the Newark Pump Station project. The maximum amount of this agreement is $10,283,321 based upon projected costs to be incurred. As of June 30, 2014, $10,283,322, the maximum loan amount, has been advanced under this agreement.
D. 2008 State Revolving Fund Loan – Hetch Hetchy
During 2008, the District entered into a loan agreement with the California State Water Resources Control Board in accordance with the State Revolving Fund Loan Program. The interest rate on the loan is 2.7 percent and will be payable in twenty annual installments beginning one year after initial loan disbursements. The purpose of this loan is to finance the lower Hetch Hetchy sewer rehabilitation project. The maximum amount of this agreement is $2,212,432 based upon projected costs to be incurred. As of June 30, 2014, $2,113,379 has been advancedunder this agreement.
E. 2009 State Revolving Fund Loan – Cedar Boulevard
During 2009, the District entered into a loan agreement with the California State Water Resources Control Board in accordance with the State Revolving Fund Loan Program. The interest rate on the loan is 2.5 percent and will be payable in twenty annual installments beginning one year after the initial loan disbursements. The purpose of this loan is to finance the Cedar Boulevard Sanitary Sewer Rehabilitation Project. The maximum amount of this agreement is $2,052,841 based upon projected costs to be incurred. As of June 30, 2014, $1,998,384 has been advanced under this agreement.
F. 2011 State Revolving Fund Loan – Primary Clarifier
During 2011, the District entered into a loan agreement with the California State Water Resources Control Board in accordance with the State Revolving Fund Loan Program. The interest rate on the loan is 2.7 percent and will be payable in twenty annual installments beginning one year after the initial loan disbursements. The purpose of this loan is to finance the rehabilitation of primary clarifiers (Nos. 1 through 4) at the Alvarado Wastewater Treatment Plant. The maximum amount of this agreement is $8,821,860 based upon projected costs to be incurred. As of June 30, 2014, $8,821,860 has been advanced under this agreement.

UNION SANITARY DISTRICT
NOTES TO THE FINANCIAL STATEMENTSJUNE 30, 2014 AND 2013
26
NOTE #5 - LONG-TERM OBLIGATIONS – CONTINUED
G. 2011 State Revolving Fund Loan – Substation 1
During 2011, the District entered into a loan agreement with the California State Water Resources Control Board in accordance with the State Revolving Fund Loan Program. The interest rate on the loan is 2.6 percent and will be payable in twenty annual installments beginning one year after the initial loan disbursements. The purpose of this loan is to finance the replacement of Substation 1 to ensure its continual operation. The maximum amount of this agreement is $2,676,485 based upon projected costs to be incurred. As of June 30, 2014, $2,412,908 has been advanced under this agreement.
H. 2011 State Revolving Fund Loan – Boyce Rd. Lift Station
During 2011, the District entered into a loan agreement with the California State Water Resources Control Board in accordance with the State Revolving Fund Loan Program. The interest rate on the loan is 2.6 percent and will be payable in twenty annual installments beginning one year after the initial loan disbursements. The purpose of this loan is to finance the replacement of Boyce Road Lift Station to ensure its continual operation. The maximum amount of this agreement is $6,196,671 based upon projected costs to be incurred. As of June 30, 2014, $6,196,671 has been advanced under this agreement.
I. 2011 State Revolving Fund Loan –Thickener Control Building
During December 2013, the District entered into a loan agreement with the California State Water Resources Control Board in accordance with the State Revolving Fund Loan Program. The interest rate on the loan is 2.1percent and will be payable in nineteen annual installments beginning September 2017. The purpose of this loan is to finance the Thickener Control Building Improvements Project to ensure its continual operation. The maximum amount of this agreement is $12.2 million based upon projected costs to be incurred. As of June 30, 2014, $776,559 has been advanced under this agreement.
J. Debt Service Requirements
Future annual repayment requirements as of June 30, 2014 are as follows:
Year Ended June 30 Principal Interest Total
2015 2,127,761$ 889,657$ 3,017,418$ 2016 2,176,158 850,139 3,026,297
2017 2,231,944 803,445 3,035,389
2018 2,320,945 771,919 3,092,864
2019 2,380,304 722,101 3,102,405 2020-2024 12,846,603 2,816,870 15,663,473
2025-2029 9,704,009 1,493,092 11,197,101
2030-2034 5,563,279 376,693 5,939,972
2035-2038 137,112 7,362 144,474 Totals 39,488,115$ 8,731,278$ 48,219,393$
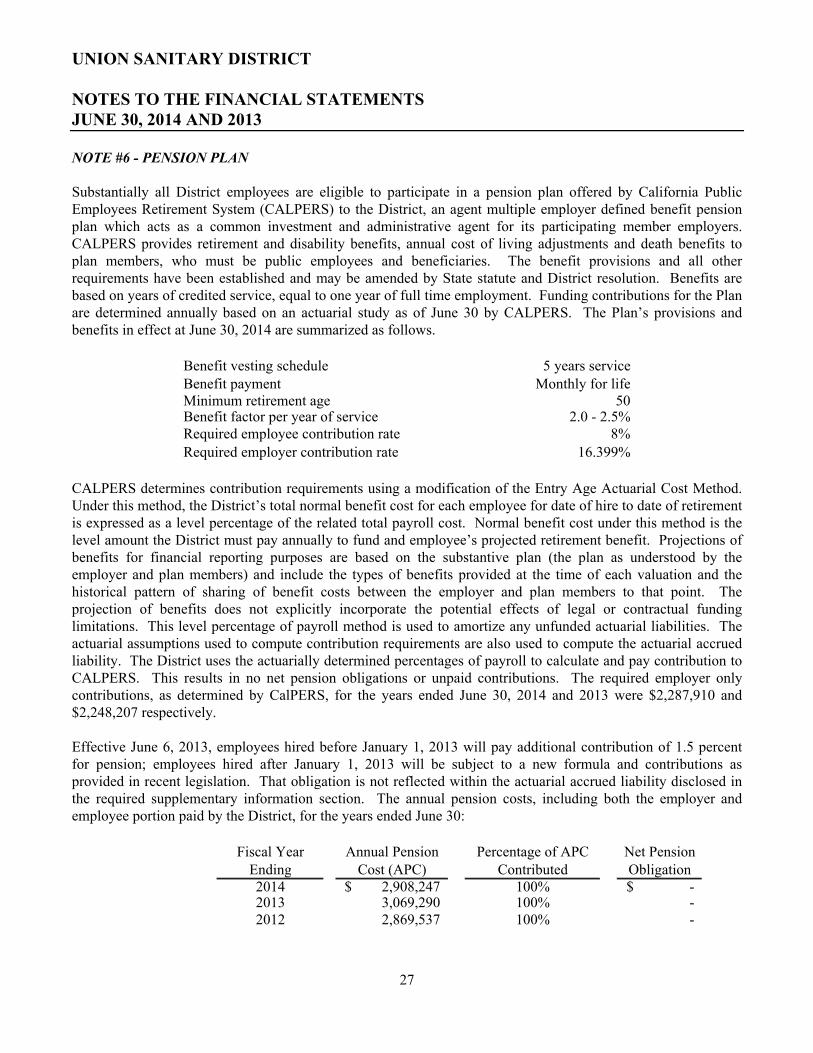
UNION SANITARY DISTRICT
NOTES TO THE FINANCIAL STATEMENTSJUNE 30, 2014 AND 2013
27
NOTE #6 - PENSION PLAN
Substantially all District employees are eligible to participate in a pension plan offered by California Public Employees Retirement System (CALPERS) to the District, an agent multiple employer defined benefit pension plan which acts as a common investment and administrative agent for its participating member employers. CALPERS provides retirement and disability benefits, annual cost of living adjustments and death benefits to plan members, who must be public employees and beneficiaries. The benefit provisions and all other requirements have been established and may be amended by State statute and District resolution. Benefits are based on years of credited service, equal to one year of full time employment. Funding contributions for the Plan are determined annually based on an actuarial study as of June 30 by CALPERS. The Plan’s provisions and benefits in effect at June 30, 2014 are summarized as follows.
Benefit vesting schedule 5 years serviceBenefit payment Monthly for lifeMinimum retirement age 50Benefit factor per year of service 2.0 - 2.5%Required employee contribution rate 8%
Required employer contribution rate 16.399%
CALPERS determines contribution requirements using a modification of the Entry Age Actuarial Cost Method. Under this method, the District’s total normal benefit cost for each employee for date of hire to date of retirement is expressed as a level percentage of the related total payroll cost. Normal benefit cost under this method is the level amount the District must pay annually to fund and employee’s projected retirement benefit. Projections of benefits for financial reporting purposes are based on the substantive plan (the plan as understood by the employer and plan members) and include the types of benefits provided at the time of each valuation and the historical pattern of sharing of benefit costs between the employer and plan members to that point. The projection of benefits does not explicitly incorporate the potential effects of legal or contractual funding limitations. This level percentage of payroll method is used to amortize any unfunded actuarial liabilities. The actuarial assumptions used to compute contribution requirements are also used to compute the actuarial accrued liability. The District uses the actuarially determined percentages of payroll to calculate and pay contribution to CALPERS. This results in no net pension obligations or unpaid contributions. The required employer onlycontributions, as determined by CalPERS, for the years ended June 30, 2014 and 2013 were $2,287,910 and $2,248,207 respectively.
Effective June 6, 2013, employees hired before January 1, 2013 will pay additional contribution of 1.5 percentfor pension; employees hired after January 1, 2013 will be subject to a new formula and contributions as provided in recent legislation. That obligation is not reflected within the actuarial accrued liability disclosed in the required supplementary information section. The annual pension costs, including both the employer and employee portion paid by the District, for the years ended June 30:
Fiscal Year Annual Pension Percentage of APC Net PensionEnding Cost (APC) Contributed Obligation2014 2,908,247$ 100% -$ 2013 3,069,290 100% - 2012 2,869,537 100% -

UNION SANITARY DISTRICT
NOTES TO THE FINANCIAL STATEMENTSJUNE 30, 2014 AND 2013
28
NOTE #6 - PENSION PLAN - CONTINUED
CALPERS uses the Entry Age Normal Cost Method to value Plan obligations and the market related value method of valuing the Plan’s assets. An investment rate of return of 7.5 percent is assumed, including inflation at 2.75 percent. Annual salary increases are assumed to vary by duration of service. Changes in liability due to plan amendments, changes in actuarial assumptions, or changes in actuarial methods are amortized as a level percentage of payroll on a closed basis over twenty years. Investment gains and losses are tracked and amortized over 30 years. Salaries are projected to increase from 3.30 percent to 14.20 percent depending on age, service, and type of employment.
Funded Status: The schedule of funded status of the plan as of June 30, 2012 was as follows:
Actuarial accrued liability (AAL) 98,458,686$
Actuarial value of plan assets 81,479,378 Unfunded actuarial accrued liability (UAAL) 16,979,308$
Funded ratio (actuarial value of plan assets/ AAL) 82.8%
Covered payroll (active plan members) 13,063,048$
UAAL as a percentage of covered payroll 130.0%
Audited annual financial statements are available from CALPERS at P.O. Box 942709, Sacramento, CA 94229-2709.
NOTE #7 - OTHER RETIREMENT BENEFITS
A. Postemployment Healthcare Plan (OPEB)
Plan Description. The District’s defined benefit postemployment healthcare plan provides medical benefits to employees who satisfy the requirements for retirement under CalPERS (attained age 50 with five years of service or satisfaction of the requirements for a disability retirement.) The amount of the retiree’s medical benefit is dependent upon both years of service with the District and the year the employee retires.
The District contracts with CalPERS to administer its retiree health benefit plan (an agent multiple-employer plan) and to provide an investment vehicle, the California Employers’ Retiree Benefit Trust Fund, to prefund future OPEB costs. A menu of benefit provisions as well as other requirements is established by State statute within the Public Employees’ Retirement Law. The District chooses among the menu of benefit provisions and adopts certain benefit provisions by Board resolution. CalPERS issues a separate Comprehensive Annual Financial Report. Copies of the CalPERS annual financial report may be obtained from the CalPERS Executive Office at 400 P Street, Sacramento, CA, 95814.
Funding Policy. The District’s annual required contribution of the employer (ARC) is an amount actuarially determined in accordance with the parameters of GASB Statement No. 45. The ARC represents a level of funding that, if paid on an ongoing basis, is projected to cover normal annual costs each year and amortize any unfunded actuarial liabilities (or funding excess) over a period not to exceed 30 years on a closed basis. The current ARC rate is 4% of the annual covered payroll, based on the most recent actuarial report dated July 1, 2013. The plan members receiving benefits currently do not make contributions.

UNION SANITARY DISTRICT
NOTES TO THE FINANCIAL STATEMENTSJUNE 30, 2014 AND 2013
29
NOTE #7 - OTHER RETIREMENT BENEFITS - CONTINUEDA. Postemployment Healthcare Plan (OPEB) - Continued
Annual OPEB Cost and Net OPEB Obligation. The following table shows the components of the District’s annual OPEB cost for the year, the amount actually contributed to the plan, and changes in the District’s net OPEB obligation.
Annual Required Contribution (ARC) 462,852$
Interest on net OPEB obligation (asset) (96,911)
Adjustment to ARC 88,870 Annual OPEB cost 454,811
Contributions made 462,852
Change in net OPEB obligation (asset) (8,041)
OPEB obligation (asset) - beginning of year (1,435,718) OPEB obligation (asset) - end of year (1,443,759)$
Trend Information. The District’s annual OPEB cost, the percentage of the annual OPEB cost contributed to the plan, and the net OPEB obligation (asset) is as follows:
Fiscal Year Annual OPEB Actual Employer Percentage Net OPEB
Ending Cost Contributions Contributed Obligation (Asset)
6/30/2014 454,811$ 462,852$ 102% (1,443,759)$ 6/30/2013 438,130 448,284 102% (1,435,718)
6/30/2012 346,615 363,108 105% (1,425,564)
Funded Status. The schedule of funded status of the plan as of July 1, 2013 was as follows:
Actuarial accrued liability (AAL) 7,568,777$
Actuarial value of plan assets 3,377,623 Unfunded actuarial accrued liability (UAAL) 4,191,154$
Funded ratio (actuarial value of plan assets/ AAL) 44.6%
Covered payroll (active plan members) 13,310,618$
UAAL as a percentage of covered payroll 31.5%
Actuarial valuations of an ongoing plan involve estimates of the value of reported amounts and assumptions about the probability of occurrence of events far into the future. Examples include assumptions about future employment, mortality, and the health care cost trend. Amounts determined regarding the funded status of the plan and the annual required contributions of the employer are subject to continual revision as actual results are compared with past expectations and new estimates are made about the future. The schedule of funding progress, presented as required supplementary information presents multiyear trend information that shows whether the actuarial value of plan assets is increasing or decreasing over time relative to the actuarial accrued liabilities for benefits.

UNION SANITARY DISTRICT
NOTES TO THE FINANCIAL STATEMENTSJUNE 30, 2014 AND 2013
30
NOTE #7 - OTHER RETIREMENT BENEFITS – CONTINUEDA. Postemployment Healthcare Plan (OPEB) - Continued
Actuarial Methods and Assumptions. Projections of benefits for financial reporting purposes are based on the substantive plan (the plan as understood by the employer and plan members) and include the types of benefits provided at the time of each valuation and the historical pattern of sharing of benefit costs between the employer and plan members to that point. The actuarial methods and assumptions used include techniques that are designed to reduce short-term volatility in actuarial accrued liabilities and the actuarial value of assets, consistent with the long-term perspective of the calculations.
The following is a summary of the actuarial assumptions and methods:
Valuation date July 1, 2013Actuarial cost method Entry age, Normal costAmortization method Level percentage of payrollAmortization period 30 yearsAsset valuation method Market value of assetsActuarial Assumptions:
Investment rate of return (funded) 6.75%Salary increase 3.25%Healthcare cost trend rate 8.5% initial; 4.5% ultimateInflation Rate 3.25%
B. 401(a) Plans
The District sponsors three internal Revenue Code Section 401(a) money purchase retirement plans for unclassified employees through the ICMA Retirement Corporation. The plans were established and can be amended by Board resolution and, for certain terms, by participant agreement. Eligibility for participation in a particular plan is dependent on job classification. Within each plan, participating employees contribute the same dollar amount, and the District makes matching contributions on their behalf. The District and the participants both contributed a total of $32,594 and $34,185 to the plans for the years ended June 30, 2014, and 2013, respectively.
C. Deferred Compensation Plan
District employees may defer a portion of their compensation under a District sponsored deferred compensation plan created in accordance with Internal Revenue Code Section 457. Under this plan, participants are not taxed on the deferred portion of their compensation until distribution. Distributions may be made only at termination, retirement, death, or, in an emergency, as defined by the plan.
The laws governing deferred compensation plan assets require plan assets to be held by a trust for the exclusive benefit of plan participants and their beneficiaries. Since the assets held under these plans are not the District assets and are not subject to District control, they have been excluded from these general purpose financial statements.

UNION SANITARY DISTRICT
NOTES TO THE FINANCIAL STATEMENTSJUNE 30, 2014 AND 2013
31
NOTE #8 - RISK MANAGEMENT
The District is a member of the California Sanitation Risk Management Authority (CSRMA). CSRMA covers general liability and workers’ compensation claims. In addition, commercial insurance is purchased for excess liability, property, and employee dishonesty coverage. The District has a $500,000 deductible for general liability coverage, and no deductible for workers’ compensation coverage.
Claims and judgments, including a provision for claims incurred but not reported, are recorded when a loss is deemed probable of assertion and the amount of the loss is reasonably determinable. As discussed above, the District has coverage for such claims, but it has retained the risk for the deductible or uninsured portion of these claims. The District’s liability for uninsured claims is limited to general liability claims, as discussed above. Settled claims have not exceeded coverage in any of the past three years.
NOTE #9 - COMMITMENTS AND CONTINGENT LIABILITIES
The District is contingently liable in connection with claims and contracts arising in the normal course of its activities. District management is of the opinion that the ultimate outcome of such matters will not have a significant effect on the financial position of the District.

REQUIRED SUPPLEMENTARY INFORMATION
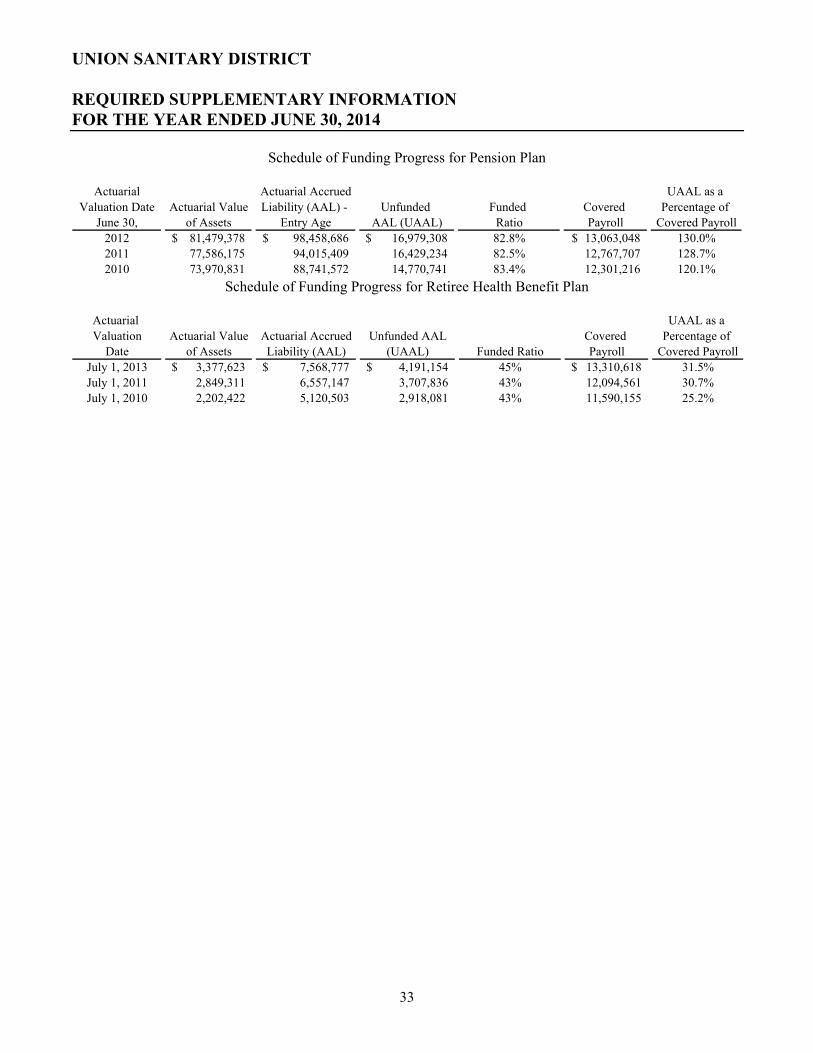
UNION SANITARY DISTRICT
REQUIRED SUPPLEMENTARY INFORMATIONFOR THE YEAR ENDED JUNE 30, 2014
33
Schedule of Funding Progress for Pension Plan
Actuarial Actuarial Accrued UAAL as a
Valuation Date Actuarial Value Liability (AAL) - Unfunded Funded Covered Percentage of
June 30, of Assets Entry Age AAL (UAAL) Ratio Payroll Covered Payroll
2012 81,479,378$ 98,458,686$ 16,979,308$ 82.8% 13,063,048$ 130.0%
2011 77,586,175 94,015,409 16,429,234 82.5% 12,767,707 128.7%
2010 73,970,831 88,741,572 14,770,741 83.4% 12,301,216 120.1%
Schedule of Funding Progress for Retiree Health Benefit Plan
Actuarial UAAL as a
Valuation Actuarial Value Actuarial Accrued Unfunded AAL Covered Percentage of
Date of Assets Liability (AAL) (UAAL) Funded Ratio Payroll Covered Payroll
July 1, 2013 3,377,623$ 7,568,777$ 4,191,154$ 45% 13,310,618$ 31.5%
July 1, 2011 2,849,311 6,557,147 3,707,836 43% 12,094,561 30.7%
July 1, 2010 2,202,422 5,120,503 2,918,081 43% 11,590,155 25.2%

SUPPLEMENTARY INFORMATION
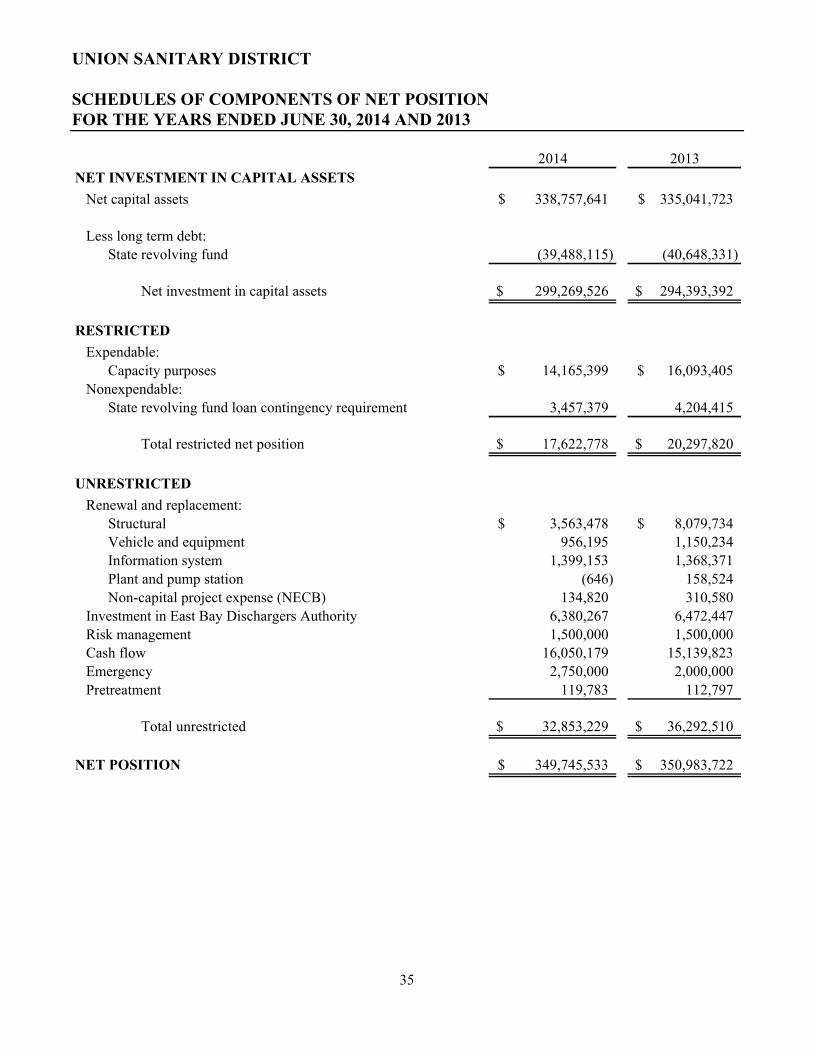
UNION SANITARY DISTRICT
SCHEDULES OF COMPONENTS OF NET POSITIONFOR THE YEARS ENDED JUNE 30, 2014 AND 2013
35
2014 2013
NET INVESTMENT IN CAPITAL ASSETS
Net capital assets 338,757,641$ 335,041,723$
Less long term debt:
State revolving fund (39,488,115) (40,648,331)
Net investment in capital assets 299,269,526$ 294,393,392$
RESTRICTED
Expendable:
Capacity purposes 14,165,399$ 16,093,405$
Nonexpendable:
State revolving fund loan contingency requirement 3,457,379 4,204,415
Total restricted net position 17,622,778$ 20,297,820$
UNRESTRICTED
Renewal and replacement:
Structural 3,563,478$ 8,079,734$
Vehicle and equipment 956,195 1,150,234
Information system 1,399,153 1,368,371
Plant and pump station (646) 158,524
Non-capital project expense (NECB) 134,820 310,580
Investment in East Bay Dischargers Authority 6,380,267 6,472,447
Risk management 1,500,000 1,500,000
Cash flow 16,050,179 15,139,823
Emergency 2,750,000 2,000,000
Pretreatment 119,783 112,797
Total unrestricted 32,853,229$ 36,292,510$
NET POSITION 349,745,533$ 350,983,722$

UNION SANITARY DISTRICT
SCHEDULES OF COMPONENTS OF NET POSITIONFOR THE YEARS ENDED JUNE 30, 2014 AND 2013
36
Note A – Restricted Components of Net Position
The amounts have legal restrictions as to their uses. Those amounts restricted for capacity purposes can be used only for acquisition of capacity related capital assets. Those amounts restricted as bond reserve can be used only for debt service.
Note B – Unrestricted Components of Net Position
These amounts have been designated by Board resolution for various purposes including renewal and replacement and a reserve for economic uncertainty.

UNION SANITARY DISTRICT
SCHEDULES OF OPERATING EXPENSES BEFORE DEPRECIATIONFOR THE YEARS ENDED JUNE 30, 2014 AND 2013
37
Sewage Sewage
Sewage Collection & General & Sewage Collection & General &
Treatment Engineering Administrative Total Treatment Engineering Administrative TotalSalaries and wages 5,100,118$ 6,359,678$ 3,357,034$ 14,816,830$ 4,800,376$ 6,282,578$ 2,981,252$ 14,064,206$Employee benefits 2,015,558 2,652,303 1,619,603 6,287,464 1,918,094 2,645,861 1,574,478 6,138,433 Recruitment and development 67,852 94,495 249,776 412,123 89,445 98,160 196,330 383,935 Temporary help 8,469 47,253 - 55,722 - 10,476 31,253 41,729 Repairs and maintenance 1,344,232 458,105 10,327 1,812,664 1,482,668 509,882 11,213 2,003,763 Operating supplies 1,805,454 230,157 - 2,035,611 1,674,605 232,206 - 1,906,811 Office and safety supplies 137,178 233,731 143,528 514,437 144,142 179,200 245,880 569,222 Insurance - - 225,722 225,722 - - 222,425 222,425 Contractual services 837,684 66,913 - 904,597 700,986 47,514 10,569 759,069 Professional services 224,802 74,190 644,345 943,337 168,316 35,027 534,404 737,747 Utilities 2,235,180 63,747 77,404 2,376,331 2,190,981 53,095 63,023 2,307,099 East Bay Dischargers Authority -
operating charges 1,052,368 - - 1,052,368 1,060,693 - - 1,060,693 Non-capital projects 524,295 524,295 271,763 1,320,353 1,805,985 1,805,985 200,084 3,812,054 Sewer Service charge
administrative fee 35,186 35,186 35,186 105,558 35,084 35,084 35,084 105,252 Rents/Leases 22,147 29,702 - 51,849 17,554 19,277 5,473 42,304
Total 15,410,523$ 10,869,755$ 6,634,688$ 32,914,966$ 16,088,929$ 11,954,345$ 6,111,468$ 34,154,742$
20132014

UNION SANITARY DISTRICT
SCHEDULE OF INSURANCE COVERAGEFOR THE YEAR ENDED JUNE 30, 2014
38
The District's insurance policies and coverages in effect at June 30, 2014 are as follows:
General liability (pooled liability program)Bodily injury, property damage, and personal injury 25,500,000$
Public entity errors and omissions and other related practices 25,500,000$
Employment related practices 25,500,000$
Insured ValueAuto physical damage (primary insurance program) 3,112,791$
Workers' Compensation 1,750,000$
Group Health and Life Contract
Employee Disability and Salary Continuance Contract
Property insurance, all property 250,928,297$
Accounts receivable No sublimit
Employee Dishonesty Bond Coverages:
Public Employee Dishonesty Bond 1,000,000$ Forgery and alteration 1,000,000$
Computer Fraud 1,000,000$

Statistical Section
Motor Control Center Replacement Projects

Union Sanitary District Statistical Section
This part of Union Sanitary District’s comprehensive annual financial report presents detailed information as a context for understanding what the information in the financial statements, note disclosures, and required supplementary information says about the District’s overall financial health.
Table of Contents Page Financial Trends These schedules contain trend information to help the reader understand how
the District’s financial performance and well-being have changed over time. Changes in Net Position and Statement of Net Position ……………….....…..……………S-1 Revenue by Type……………………………………………………………………………...S-2 Operating Expenses by Major Function………………………………………………….…S-3 Capital Project Expenditures………………………….……………………………………..S-4 Revenue Capacity These schedules contain information to help the reader asses the District’s most significant revenue sources.
Current and Historical Fees…………………………………………………………………..S-5 Principal Rate Payers…………………………………………………………………………S-6 Assessed Valuation of Service Area………………………………………………………...S-7
Debt Capacity These schedules contain information to help the reader assess the affordability of the District’s current levels of outstanding debt and the District’s ability to issue additional debt in the future. Outstanding Debt………………………………………………………………………………S-8 Revenue Coverage……………………………………………………………………………S-9 Demographic and Economic Information These schedules offer demographic and economic indicators to help the reader
understand the local environment within which the District’s financial activities take place.
Population of Service Area…………………………………………………………………..S-10 Income and Home Prices………………………..…………………………………………..S-11 Major Employers in Service Area…………………………………………………………...S-12 Operating Information These schedules contain service and infrastructure data to help the reader understand
how the information in the District’s financial report relates to the services the District provides and the activities it performs.
Full-time Equivalent Employees by Function………………………………………………S-13 Plant Flow……………………………………………………………………………………...S-14 Biosolids………………………………………………………………………………………..S-15 Balanced Scorecard Measures by Program/Function………………………………..……… Miscellaneous Statistics………………………………………………………………………….. Sources: Unless otherwise noted, the information in these schedules is derived from the comprehensive annual financial reports for the relevant year.
S-1 S-2 S-3 S-4
S-5 S-6 S-7
S-8 S-9
S-10 S-11 S-12
S-13 S-14 S-15 S-16 S-20

Source: USD Audited Financial Statements S-1
UNION SANITARY DISTRICT
Changes in Net Position and Statement of Net Position by Component Last Ten Years
Fiscal YearChanges in Net Position 2014 2013 2012 2011 2010 2009 2008 2007 2006 2005Operating Revenues Sewer Service Charges $45,139,420 $42,339,311 $40,630,578 $38,486,824 $37,217,073 $35,103,885 $32,851,938 $30,951,916 $29,257,270 $27,592,013 Other Operating Revenues 1,370,017 1,163,802 1,027,357 987,948 968,475 809,171 922,013 1,099,925 1,118,247 1,097,871
Total Operating Revenues 46,509,437 43,503,113 41,657,935 39,474,772 38,185,548 35,913,056 33,773,951 32,051,841 30,375,517 28,689,884
Operating Expenses Sewage Treatment 15,410,523 16,088,929 14,255,266 14,342,352 13,995,781 12,938,404 11,881,805 11,250,875 11,688,666 11,166,304 Sewage Collection and Engineering 10,869,755 11,954,345 9,712,645 10,532,692 9,338,919 8,658,679 7,998,961 8,160,123 7,188,088 6,719,421 General and Administration 6,634,688 6,111,468 5,951,818 5,574,251 5,322,085 5,200,792 4,757,630 4,442,638 4,223,584 3,958,644
Total Operating Expenses Before Depr. 32,914,966 34,154,742 29,919,729 30,449,295 28,656,785 26,797,875 24,638,396 23,853,636 23,100,338 21,844,369
Depreciation 17,219,109 16,776,307 16,790,277 16,323,858 16,243,535 16,380,510 15,829,000 17,127,661 16,093,787 27,669,976 *
Total Operating Expeneses 50,134,075 50,931,049 46,710,006 46,773,153 44,900,320 43,178,385 40,467,396 40,981,297 39,194,125 49,514,345
Operating Loss (3,624,638) (7,427,936) (5,052,071) (7,298,381) (6,714,772) (7,265,329) (6,693,445) (8,929,456) (8,818,608) (20,824,461)
Non-operating Revenues (Expenses) Investment Income 180,041 178,690 248,337 274,328 349,012 1,136,138 1,746,157 1,902,866 1,527,372 926,543 Interest Expense (1,106,609) (1,138,677) (858,162) (1,114,313) (867,781) (647,171) (775,179) (839,808) (897,698) (1,240,075) Loss on Retirement of Utility in Capital Asse (796,735) (1,479,254) *** (127,430) (751,601) (95,110) (134,787) (384,325) (97,969) (168,026) (2,077,193) Gain (loss) on Equity Investment in EBDA (92,180) (89,170) (100,827) (95,011) (76,498) (12,946) (46,886) (142,783) (150,303) (153,173) Other Non-operating Expenses 0 0 0 0 0 0 0 0 ** (1,098,450) (629,216) Net Non-operating Revenues (1,815,483) (2,528,411) (838,082) (1,686,597) (690,377) 341,234 539,767 822,306 (787,105) (3,173,114) Loss Before Contributions (5,440,121) (9,956,347) (5,890,153) (8,984,978) (7,405,149) (6,924,095) (6,153,678) (8,107,150) (9,605,713) (23,997,575) Connection Fees and Other Contrib. Capital 4,201,932 7,072,821 4,386,772 7,850,769 3,196,347 2,648,784 6,231,701 3,503,054 6,519,344 6,737,679
Change in Net Position (1,238,189) (2,883,526) (1,503,381) (1,134,209) (4,208,802) (4,275,311) 78,023 (4,604,096) (3,086,369) (17,259,896)Net Position, Beginning of Year 350,983,722 353,867,248 355,370,629 356,504,838 360,713,640 364,988,951 363,022,293 367,626,389 370,712,758 387,972,654Net Position, End of Year $349,745,533 $350,983,722 $353,867,248 $355,370,629 $356,504,838 $360,713,640 $363,100,316 $363,022,293 $367,626,389 $370,712,758
Statement of Net Position by ComponentNet investment in capital assets $299,269,526 $294,393,392 $296,939,157 $300,489,831 $302,407,235 $308,753,429 $312,722,057 $321,621,932 $328,262,088 $331,070,729Restricted 17,622,778 20,297,820 19,346,378 16,877,836 14,840,623 14,290,870 10,166,261 6,700,960 4,218,141 2,287,987Unrestricted 32,853,229 36,292,510 37,581,713 38,002,962 39,256,980 37,669,341 2,927,822 2,215,053 2,215,053 2,215,053Restricted-Retiree medical benefit plan 0 0 0 0 0 0 1,457,853 938,263 853,752 770,356Unrestricted 0 0 0 0 0 0 35,826,323 31,546,085 32,077,355 34,368,633
Total USD net position $349,745,533 $350,983,722 $353,867,248 $355,370,629 $356,504,838 $360,713,640 $363,100,316 $363,022,293 $367,626,389 $370,712,758
Additional years will be added until ten years' worth of information is available.
* Includes a correction to pre-1980 assets depreciated by a method other than straight-line.** Special Project Other Expenses are classified under Operating Expenses and restated for FY 2007 per auditor recommendation.*** Capital asset threshhold increased from $5,000 to $10,000

UNION SANITARY DISTRICT
District-Wide Revenues and Other Financing Sources
Sewer Service Capacity
Fiscal Year Charges Fees Interest Others * Total Revenues
2014 $45,139,420 $3,315,007 $180,071 $1,370,017 $50,004,515
2013 42,339,311 3,062,836 178,690 1,163,802 46,744,639
2012 40,630,578 2,848,488 248,337 1,027,357 44,754,760
2011 38,486,824 3,381,963 274,328 987,948 43,131,063
2010 37,217,073 2,467,083 349,012 968,475 41,001,643
2009 35,103,885 2,621,801 1,136,138 809,171 39,670,995
2008 32,851,938 3,746,046 1,746,157 922,013 39,266,154
2007 30,951,916 3,503,054 1,902,866 1,099,925 37,457,761
2006 29,257,270 3,819,854 1,527,372 1,118,247 35,722,743
2005 27,592,013 3,173,183 926,543 1,097,871 32,789,610
*Others includes Inspection Fees, Permits, External Work Orders, Discounts, and Misc.
The District's main source of revenue is Sewer Service Charges, which are collected
on behalf of the District by Alameda County, on the tax rolls as part of the Teeter Plan.
Total of Capacity Fees received is closely tied to economic conditions in the tri-city
area.
$0
$10,000,000
$20,000,000
$30,000,000
$40,000,000
$50,000,000
2014 2013 2012 2011 2010 2009 2008 2007 2006 2005
Others
Interest
Capacity Fees
SewerServiceCharges
Total Revenues
Source: USD Audited Financial Statements S-2

Source: USD Audited Financial Statements S-3
UNION SANITARY DISTRICT
Operating Expenses By Major Function
SewageSewage Collection General &
Fiscal Year Treatment & Engineering Administration Total Expenses
2014 $15,410,523 $10,869,755 $6,634,688 $32,914,9662013 16,088,929 11,954,345 6,111,468 34,154,7422012 14,255,266 9,712,645 5,951,818 29,919,7292011 14,342,352 10,532,692 5,574,251 30,449,2952010 13,995,781 9,338,919 5,322,085 28,656,7852009 12,938,404 8,658,679 5,200,792 26,797,8752008 11,881,805 7,998,961 4,757,630 24,638,3962007 11,250,875 8,160,123 4,442,638 23,853,6362006 11,688,666 7,188,088 4,223,584 23,100,3382005 11,166,304 6,719,421 3,958,644 21,844,369
Operating expenses are the day-to-day expenses to run the District, including labor, benefits, chemicals, utilities, parts and materials, and other supplies. Depreciation, a non-cash operating expense, is not included here. Capital expenditures are not included in operating expenses.
$0
$4,000,000
$8,000,000
$12,000,000
$16,000,000
$20,000,000
$24,000,000
$28,000,000
$32,000,000
2005 2006 2007 2008 2009 2010 2011 2012 2013 2014
Sewage Treatment Sewage Collection & Engineering General & Administration

Source: USD Finance Department S-4
UNION SANITARY DISTRICT
Capital Expenditures
New Renewal &Capacity Replacement Total Capital
Fiscal Year Projects Projects Expenditures
2014 $5,592,023 $14,195,068 $19,787,091
2013 2,673,173 8,663,485 11,336,658
2012 3,032,556 15,453,790 18,486,346
2011 1,030,689 8,099,110 9,129,799
2010 2,809,723 7,641,018 10,450,741
2009 4,134,515 10,861,404 14,995,919
2008 1,070,104 8,571,513 9,641,617
2007 333,087 6,765,850 7,098,937
2006 584,634 5,999,203 6,583,837
2005 5,981,158 11,800,550 17,781,708
Capacity projects provide new or expanded facilities (equipment, processes, buildings,pipelines, etc.) to accommodate increased wastewater flows or to provide reliability inthe collection, treatment and disposal systems.
Structural renewal & replacement projects provide rehabilitation, replacement, or upgrade of existing facilities to prolong the useful life of the assets and to maintain the current service level of the facilities.
$0
$2,000,000
$4,000,000
$6,000,000
$8,000,000
$10,000,000
$12,000,000
$14,000,000
$16,000,000
2014201320122011201020092008200720062005
New Capacity ProjectsRenewal & Replacement Projects

Source: USD Finance Department S-5
UNION SANITARY DISTRICT
Current and Historical Fees Last Ten Years
Sewer Service Charge Rates
Single Multi - SFDFamily Rate Family Rate %
Change2014 $337.76 $298.25 5.7%2013 319.55 282.17 5.0%2012 304.33 268.73 5.0%2011 289.84 255.93 5.0%2010 276.04 243.74 6.5%2009 259.18 228.86 6.5%2008 243.36 214.90 6.5%2007 228.52 201.78 6.0%2006 215.57 190.33 5.0%2005 205.30 181.27
The fees above are for residential units. A property with multiple housing units such as an apartment complex is charged $298.25 for each dwelling unit on the property.Fees for commercial and industrial customers are based on the volume and pollutantstrength of the wastewater being treated.
Capacity Fee Rates %
Change2014 $5,329.20 10.0%2013 4,844.73 10.0%2012 4,404.30 10.0%2011 4,003.91 5.0%2010 3,813.25 5.0%2009 3,631.67 5.0%2008 3,458.73 5.0%2007 3,294.03 5.0%2006 3,137.17 5.0%2005 2,987.78 0.0%
The capacity fees shown are per dwelling unit. Other categories such as restaurants,
$2,987.78
$3,137.17
$3,294.03
$3,458.73
$3,631.67
$3,813.25
$4,003.91
$4,404.30 $4,844.73
$5,329.20
$1,000$1,500$2,000$2,500$3,000$3,500$4,000$4,500$5,000$5,500$6,000
2005 2006 2007 2008 2009 2010 2011 2012 2013 2014
Capacity Fees
205.30 215.57
228.52 243.36
259.18 276.04
289.84 304.33
319.55 337.76
181.27 190.33
201.78 214.90
228.86 243.74
255.93 268.73
282.17 298.25
$100.00
$150.00
$200.00
$250.00
$300.00
$350.00
2005 2006 2007 2008 2009 2010 2011 2012 2013 2014
Single Family Rate Multi Family Rate

Source: USD Customer Service Team S-6
UNION SANITARY DISTRICT Ten Principal Industrial Rate Payers
June 30, 2014
2013-14 2012-13 2011-12 2010-11 2009-10 2008-09Total % of Total % of Total % of Total % of Total % of Total % of
Annual Total Annual Annual Total Annual Annual Total Annual Annual Total Annual Annual Total Annual Annual Total AnnualRate Payer Billing Rank Billings Billing Rank Billings Billing Rank Billings Billing Rank Billings Billing Rank Billings Billing Rank Billings
Western Digital $260,023 1 0.58% 216,919 1 0.51% 269,619 1 0.66% 215,190 2 0.56% 227,410 2 0.61% 273,113 2 0.78%Washington Hospital 148,743 2 0.33% 105,407 3 0.25% 112,361 5 0.28% 136,804 3 0.36% 128,056 4 0.34% 146,515 3 0.42%Seagate Technology 140,016 3 0.31% 114,131 2 0.27% --- --- --- 82,333 8 0.21% --- --- --- --- --- ---Tesla 137,788 4 0.31% --- --- --- --- --- --- --- --- --- --- --- --- --- --- ---Ranch 99 Warms Springs Shoppin 112,329 5 0.25% 90,954 5 0.21% --- --- --- --- --- --- --- --- --- --- --- ---Gateway Plaza 101,416 6 0.22% --- --- --- 81,681 9 0.20% --- --- --- --- --- --- --- --- ---Kaiser Hospital 99,174 7 0.22% --- --- --- --- --- --- --- --- --- --- --- --- --- --- ---Pacific Commons (Area 4) 99,159 8 0.22% 90,954 5 0.21% --- --- --- --- --- --- --- --- --- --- --- ---The Benton in Fremont 96,037 9 0.21% --- --- --- --- --- --- 109,681 6 0.28% 122,577 5 0.33% 75,086 6 0.21%Pacific Commons (Kohls/Old Navy 90,880 10 0.20% 83,879 10 0.20% 84,813 8 0.21% 78,993 9 0.21% --- --- --- 67,334 10 0.19%
Total annual billing largest ten: $1,285,565 2.85% $702,244 1.66% $548,474 1.35% $623,001 1.62% $478,043 1.28% $562,048 1.60%
Total ALL annual billings $45,139,420 $42,339,311 $40,630,578 $38,486,824 $37,217,073 $35,103,885
2007-08 2006-07 2005-06 2004-05Total % of Total % of Total % of Total % of
Annual Total Annual Annual Total Annual Annual Total Annual Annual Total AnnualBilling Rank Billings Billing Rank Billings Billing Rank Billings Billing Rank Billings
Western Digital 274,533 2 0.84% 233,804 2 0.76% 201,825 2 0.69% 216,040 3 0.78%Washington Hospital 139,089 3 0.42% 111,139 6 0.36% 78,911 7 0.27% 82,141 7 0.30%Seagate Technology --- --- --- --- --- --- --- --- --- 106,163 5 0.38%Tesla --- --- --- --- --- --- --- --- --- --- --- ---Ranch 99 Warms Springs Shoppin --- --- --- --- --- --- --- --- --- --- --- ---Gateway Plaza --- --- --- --- --- --- --- --- --- --- --- ---Kaiser Hospital --- --- --- --- --- --- --- --- --- --- --- ---Pacific Commons (Area 4) --- --- --- --- --- --- --- --- --- --- --- ---The Benton in Fremont 69,198 8 0.21% 64,973 10 0.21% --- --- --- --- --- ---Pacific Commons (Kohls/Old Navy --- --- --- --- --- --- --- --- --- --- --- ---
Total annual billing largest ten: $482,819 1.47% $409,916 1.32% $280,736 0.96% $404,345 1.47%
Total ALL annual billings $32,851,938 $30,951,916 $29,257,270 $27,592,013

Source: Alameda Count Office of the Auditor-Controller S-7
UNION SANITARY DISTRICT
Fiscal Year Assessed Valuation Valuation of taxable property within Union Sanitary District
% Change2013/14 $49,120,298,326 4.06%
2012/13 $47,205,182,529 1.95%
2011/12 $46,301,581,317 -1.22%
2010/11 $46,871,083,762 -0.54%
2009/10 $47,125,012,456 -1.57%
2008/09 $47,878,943,360 4.55%
2007/08 $45,796,626,625 6.56%
2006/07 $42,977,256,903 8.13%
2005/06 $39,744,688,309 7.26%
2004/05 $37,056,029,834
Includes property in Fremont, Newark, and Union City.
$0$5,000,000,000
$10,000,000,000$15,000,000,000$20,000,000,000$25,000,000,000$30,000,000,000$35,000,000,000$40,000,000,000$45,000,000,000$50,000,000,000
2004/05 2005/06 2006/07 2007/08 2008/09 2009/10 2010/11 2011/12 2012/13 2013/14

UNION SANITARY DISTRICT
Ratios of Outstanding Debt by Type
Last Ten Fiscal Years
Fiscal Use Loans Principal # of Total Debt/Year Permit (1) Payable (2) Total Ratepayers* #Ratepayers2014 $0 $39,488,115 $39,488,115 94,877 $416
2013 0 40,648,328 40,648,328 94,640 430
2012 0 39,630,289 39,630,289 94,351 420
2011 471,698 31,985,449 32,457,147 94,231 344
2010 916,696 33,594,457 34,511,153 93,962 367
2009 1,336,506 29,499,150 30,835,656 93,666 329
2008 1,732,553 25,367,381 27,099,934 92,427 293
2007 2,106,182 24,908,737 27,014,919 91,896 294
2006 2,458,662 27,085,423 29,544,085 91,315 324
2005 2,791,171 29,206,575 31,997,746 90,472 354* Based on parcels
Annual Outstanding
Maturity Total PrincipalPurpose Rate Date Payment Balance
(1) Use Permit Union City Use Permit - to increase 6.0% 6/1/2012 $0 $0capacity to maximum of 38 mg/d
(2) Loans Payable State Water Resources Control 2.7% 6/17/2014 $1,960,384 $0Board - Wastewater Treatment
Plant Upgrade Project
State Water Resources Control 2.4% 8/30/2023 $908,164 $7,989,539Board - Irvington Wastewater
Equalization Storage Facility
State Water Resources Control 2.4% 11/16/2027 $108,385 $1,275,938Board - Willow/Central Avenue
State Water Resources Control 2.7% 1/26/2030 $685,405 $8,810,256Board - Newark Pump Stat. Upgrade
State Water Resources Control 2.7% 11/17/2028 $139,634 $1,703,692Board - Lower Hetch Hetchy
State Water Resources Control 2.5% 2/26/2030 $127,349 $1,662,542Board - Cedar Blvd.
State Water Resources Control 2.7% 1/15/2033 $591,603 $8,676,713
Board - Primary Clarifier
State Water Resources Control 2.6% 2/28/2032 $175,842 $2,238,826
Board - Substation 1
State Water Resources Control 2.6% 3/31/2033 $411,064 $6,354,010
Board - Boyce Road
State Water Resources Control 2.1% 3/31/2036 $0 $776,599
Board - Thickener Control Building (still drawing proceeds)
Totals $5,107,829 $39,488,115
The District utilizes State Revolving Fund (SRF) loans as a cost-effective alternative to bondfinancing when the need arises for capital expenditure debt financing.
Source: USD internal accounting records S-8

Source: USD internal accounting records S-9
UNION SANITARY DISTRICT
Pledged-Revenue CoverageLast Ten Fiscal Years
Net Revenue DebtFiscal Gross Operating Available Debt Service CoverageYear Revenues Expenses (1) for Debt Service Requirements % (2)
2014 $50,004,485 $32,914,966 $17,089,519 $4,675,361 366%2013 46,744,639 34,154,742 12,589,897 4,086,647 308%2012 44,754,760 29,919,730 14,835,030 4,429,320 335%2011 43,131,063 30,449,295 12,681,768 4,429,320 286%2010 41,001,643 28,656,785 12,344,858 3,584,000 344%2009 39,670,995 26,797,875 12,873,120 3,476,933 370%2008 39,266,154 24,638,396 14,627,758 3,368,548 434%2007 37,457,761 23,853,636 13,604,125 3,368,548 404%2006 35,722,743 23,100,338 12,622,405 3,368,548 375%2005 32,789,610 21,844,369 10,945,241 3,368,548 325%
(1) Excludes depreciation; Operating Expenses do not include Capital Project Expenditures
(2) According to the District's Debt Management Policy, the targeted minimum debt service coverage ratio is 130%, which is higher than the standard 120% typically used to secure revenue bonds.

UNION SANITARY DISTRICT
Demographics
Population Served
2005 2006 2007 2008 2009 2010 2011 2012 2013 2014
Fremont 209,100 210,158 211,662 213,512 215,636 218,128 215,711 217,700 219,926 223,972
Newark 43,960 43,486 43,693 43,872 44,035 44,380 42,764 43,041 43,342 43,856
Union City 71,725 71,152 72,297 73,402 73,977 75,054 69,850 70,646 71,329 72,155
Total 324,785 324,796 327,652 330,786 333,648 337,562 328,325 331,387 334,597 339,983
Total % Change 0.47% 0.003% 0.88% 0.96% 0.87% 1.17% -2.74% 0.93% 0.97% 1.61%
0
50,000
100,000
150,000
200,000
250,000
300,000
350,000
400,000
2005 2006 2007 2008 2009 2010 2011 2012 2013 2014
Po
pu
lati
on
Union City
Newark
Fremont
(As of Jan. 1 of Fiscal Year)
Source: CA Dept. of Finance (www.dof.ca.gov) S-10
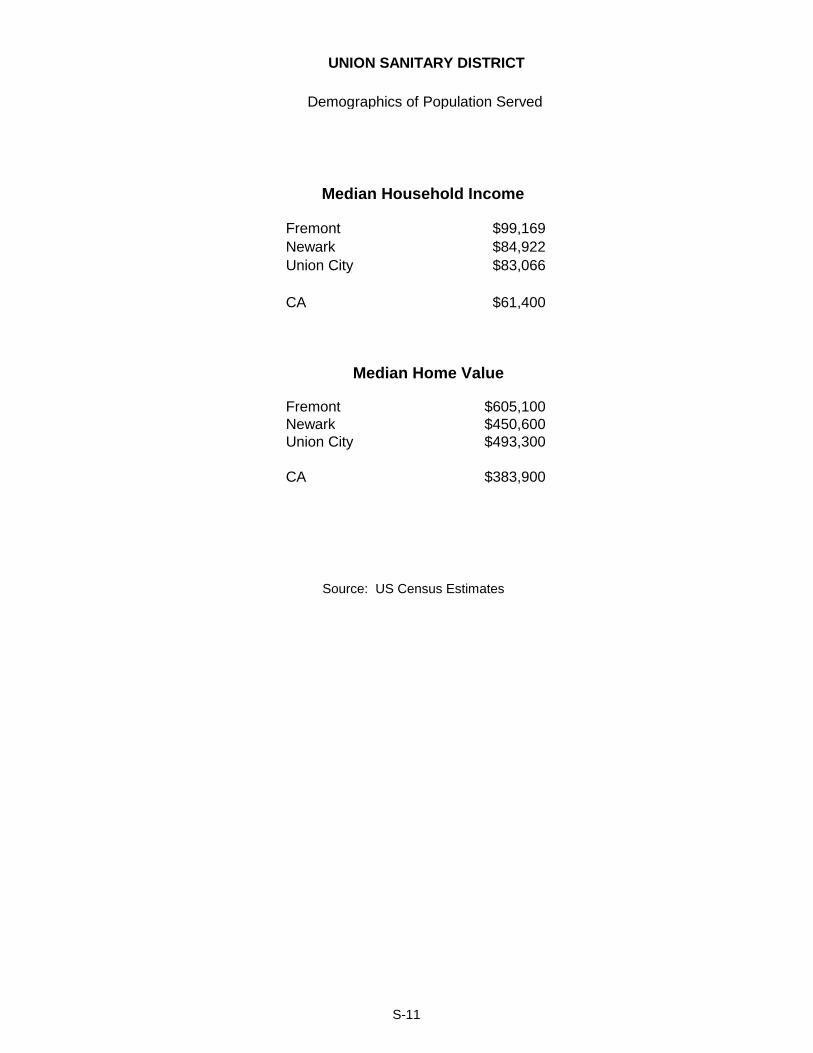
UNION SANITARY DISTRICT
Demographics of Population Served
Median Household Income
Fremont $99,169
Newark $84,922
Union City $83,066
CA $61,400
Median Home Value
Fremont $605,100
Newark $450,600
Union City $493,300
CA $383,900
Source: US Census Estimates
S-11

UNION SANITARY DISTRICT
Demographics
Major Employers in District Service Area
Number of Employees as of fiscal year ended June 30,*
% of
Total City Employment
Employer Name Type of Business 2014 2013 2012 2011 2010 2009 2008 2007 2006
Fremont
Fremont Unified School District Education 2.75% 2.81% 2.90% 3.27% 3.02% 1.52% 1.51% 1.57% N/A
Tesla Auto Manufacturer 2.75% 2.81% 1.45% N/A N/A N/A N/A N/A N/A
Washington Hospital Healthcare 2.75% 1.70% 1.76% 1.98% 1.81% 2.18% 2.16% 2.25% N/A
Lam Research Technology 2.75% 1.41% 1.45% 1.00% 0.96% 0.84% 1.14% 1.18% N/A
Western Digital Hard Drives and Electronics 2.75% 1.22% 1.26% 1.20% 1.81% 0.91% 1.05% 1.03% N/A
Newark
Newark Unified School District Education 3.20% 3.30% 3.40% 3.40% 3.40% 3.40% N/A N/A N/A
Logitech Computer Accessories 3.10% 3.20% 3.00% N/A N/A N/A N/A N/A N/A
WorldPac Auto Part Distribution 1.30% 1.30% 1.40% 1.40% 1.40% 1.40% N/A N/A N/A
Full Bloom Baking Company Baking Products 1.30% 1.30% 1.40% 1.40% 1.40% 1.40% N/A N/A N/A
Risk Management Solutions Catastrophe Risk Management 1.20% 1.30% 1.30% 1.30% 1.30% 1.30% N/A N/A N/A
Union City
Southern Wine & Spirits Beverages N/A 3.54% 3.71% 1.13% 1.16% 2.32% 2.22% 3.55% 3.59%
New Haven Unified School DistrictEducation N/A 3.07% 3.22% 3.69% 3.76% 3.70% 3.84% 4.18% 4.22%
Wal Mart Retailer N/A 2.40% 2.52% 1.62% 1.65% 1.86% 1.77% 2.41% 2.44%
Axygen Bioscience Biotechnology N/A 1.14% 1.19% 3.88% 3.96% N/A N/A 1.08% 1.09%
Abaxis Biotechnology N/A 1.02% 1.19% N/A N/A N/A N/A N/A 0.63%
More years and statistics will be added as the data becomes available.
* Some employers report as of December 31.
Source: CA Dept. of Finance website,
New Haven Unified School District
Cities of Fremont, Newark and Union City S-12

UNION SANITARY DISTRICT
Full-time Equivalent District Employees by Function/Program
Last 10 Fiscal Years
Fiscal Year
2014 2013 2012 2011 2010 2009 2008 2007 2006 2005
Function/Program
System operations and maintenace (CS Support, FMC, T&D, Warehouse) 50.45 51.45 51.45 50.45 51.45 51.00 51.23 49.23 49.23 48.00
Engineering and construction (CIP) 8.00 7.00 8.00 8.00 6.00 6.00 6.00 7.00 7.00 6.00
Collections System Maintenance (CS) 23.00 24.00 22.00 22.00 22.00 22.00 21.00 23.00 24.00 21.40
Office of the General Manager (GM) 1.00 2.00 3.00 2.00 2.00 2.00 2.00 2.00 2.00 2.00
Finance (FIST) 5.00 5.00 5.00 5.00 5.00 5.00 5.00 4.00 5.00 5.00
Information systems (IT) 5.00 5.00 5.00 4.00 5.00 5.00 5.00 5.00 5.00 5.00
Administration department (OA, Adm Specialist, MMT, non-HR OST) 14.00 15.00 14.00 16.00 15.00 15.50 15.50 16.00 15.40 17.55
Customer and community services (Rest of TS) 19.00 19.00 19.00 19.00 19.00 21.00 21.00 18.00 19.68 17.68
Human resources (HR) 3.00 3.00 3.00 3.00 3.00 3.00 3.00 3.00 3.00 2.00
Total # of Employees 128.45 131.45 130.45 129.45 128.45 130.50 129.73 127.23 130.31 124.63
Average years of service of employees as of 6/30/14: 12.61 11.70 12.25 11.89 11.46 10.71 10.06 9.80 10.70 11.61
CIP = Capital Improvements Projects Team
FMC = Fabrication, Maintenace and Construction
MMT = Materials Management Team
OST = Organizational Support Team
T&D = Treatment & Disposal Work Group
TS = Technical Services Work Group
Additional years will be added until ten years worth of information is available.
Source: USD Human Resources Dept. S-13

UNION SANITARY DISTRICT
Operating Indicators by Function/Program
Last Ten Calendar Years
Average Daily Flow
Plant Flow Data
Plant 12-month average
Flows have decreased mainly due to conservation efforts.
*Million gallons per day.
28.06 27.85 26.63
25.92 25.08
25.80 26.00 24.79 24.20
23.03
10.0
14.0
18.0
22.0
26.0
30.0
34.0
38.0
42.0
2005 2006 2007 2008 2009 2010 2011 2012 2013 2014
Flow, MGD*
Maximum Treatment Capacity 38
Permitted Treatment Capacity 33
Source: Union Sanitary District Treatment and Disposal Team S-14

Source: USD Treatment Disposal Work Group S-15
UNION SANITARY DISTRICT
Operating Indicators - BiosolidsLast Ten Calendar Years
2004 2005 2006 2007 2008 2009 2010 2011 2012 2013Function/Program
Biosolids
Total to Land Application 14,357 11,838 12,558 16,549 14,697 15,891 15,348 16,160 14,770 17,597Total to Landfill 5,679 6,893 4,447 748 491 0 0 571 1,187 501Total to Compost -- -- 461 1,096 4,523 2,291 3,751 2,585 4,501 1,642
Total (in Wet Tons) 20,035 18,731 17,466 18,393 19,712 18,182 19,099 19,315 20,458 19,741
0
5,000
10,000
15,000
20,000
25,000
30,000
2004 2005 2006 2007 2008 2009 2010 2011 2012 2013
Wet
Ton
s
Calendar Year
Biosolids Production

S-16
ObjectivesFY13 Collection Services BSC Measures FY 13 Target
Customer Perspective:• Minimize Overflows SSO’s · # of Category 1 SSOs 0 SSOs 0 SSO 0 SSOs 0 SSOs 0 SSOs • Zero Category 1 SSOs
· # of Category 2 SSOs 0 SSO 0 SSOs 0 SSOs 0 SSOs 0 SSOs ≤ 10 Category 2 SSOs
• Minimize Negative Impact on Environment
· Percent of spill recovery N/A Recovery N/A Recovery N/A Recovery 100% Recovery 100% Recovery • 50% Recovery
· SSO’s # of Repeats 0 SSO Repeats 0 Repeats 0 Repeats 0 SSO Repeats 0 SSO Repeats • Zero RepeatsManage and maintain assets and infrastructure
• Critical Asset Failures Sewer Main or MH Deficiency resulting in Category 1 SSO, sink hole, injury or resulting property damage > $2,000 due to one or more of the following:
0 Asset failure 0 Asset failure 0 Failures 0 Failures 0 Asset failure • Zero
– Break, collapse, offset or hole in pipe or – PMP not followed– Corrosion– Defect identified & corrective action
• Stoppage in > 12” diameter mainline 0 Stoppages 0 Stoppages 0 Stoppages 0 Stoppages 0 Stoppages • Zero• # of times building becomes dangerous or unsuitable for occupation.
0 Incidents 0 Incidents 0 Incidents 0 Incidents 0 Incidents • Zero
Critical asset failure with a negative impact on customers or the environment
0 Incidents 0 Incidents 0 Incidents 0 Incidents 0 Incidents Zero Incidents
• Provide Uninterrupted Service Response Time from notification thru initial contact includes dispatch time
98.3% w/i 1 hour 96.4% w/i 1 hour 98.8% w/i 1 hour 98.8% w/i 1 hour 98.1% w/i 1 hour ≥ 95% w/i 1 hr
• Reduce negative impacts of District Number of odor complaints attributable to sewer.
0 Odors 0 Odors 0 Odor 0 Odors 0 Odor ≤ 2
Financial Perspective:• Provide competitive service Cleaning – cost per ft/day/crew $0.98 Per ft $0.61 Per ft $0.53 Per ft $0.58 Per ft $0.61 Clean Per Ft Clean $.66 to $1.05 Cost per feet/day Televising – cost per ft/day/crew $1.20 Per ft $1.23 Per ft $0.92 Per ft $0.84 Per ft $1.01 TV Per Ft TV - $.80 to $1.40 • Minimize Claims & Fines Total Cost of Claims/Fines (from SSO's) $0 Total Claims $0 Total Claims $0 Total Claims $0 Total Claims $0 Total Claims Claims ≤$2000
$0 Total Fines $0 Total Fines $0 Total Fines $0 Total Fines $0 Total Fines Fines-$0 Average cost per claim/fine $0 Avg Claims $0 Avg Claims $0 Avg Claims $0 Avg Claims $0 Avg Claims Claims ≤$1000
$0 Avg Fines $0 Avg Fines $0 Avg Fines $0 Avg Fines $0 Avg Fines Fines-$0Internal Process Perspective:• Trouble Call & SSO response Response Time 98.3% w/i 1 hour 96.4% w/i 1 hour 98.8% w/i 1 hour 98.8% w/i 1 hour 98.1% w/i 1 hour ≥ 95% w/i 1 hr
• Pipe/Problem Assessment Number of Repeat Spills 0 Zero 0 Zero 0 Zero Zero per year Zero per year ≤ 2 per year
• Preventative Maint. Program 2 Yr Catch Up Plan % Complete 17.5% % Complete 12.8% % Complete 24.2% % Complete 27% % Complete 81.6% % Complete Annual Goal = 100%TV Goal Footage 177,669 TV Footage 130,120 TV Footage 245,122 TV Footage 273,660 Footage 826,571 YTD TV Ftg 1,012,946
• Cleaning (other cleaning omitted) Per Month Cleaning Footages 42,832 Avg Ft Per Mo 86,672 Avg Ft Per Mo 154,703 Avg Per Mo * 144,016 Avg Per Mo 107,056 Avg Mo125,801 Mo; 1,509,623 YE (w/o CI)
o Feet per crew day o Feet Per Crew/Day 2,519 Ft Per Crew/Day 4,334 Ft Per Crew/Day 6,446 Ft Per Crew/Day 6,647 Ft Per Crew/Day 4,987 Ft Per Crew/Day 2,500 to 4,000 Per Crew Dayo # of Crew Days o # of Crew Days 17 # of Crew Days 20 # of Crew Days 24 # of Crew Days 22.0 # of Crew Days 20.8 # of Crew Days 21 to 33 Crew Days
• Televising Per Month Televising Footages 59,218 Avg Ft Per Mo 43,352 Avg Ft Per Mo 81,680 Avg Per Mo 91,024 Avg Per Mo 68,819 Avg Mo 84,412 Avg Mo, 1,012,946 YEo Feet per crew day o Feet Per Crew/Day 3,352 Ft Per Crew/Day 3,025 Ft Per Crew/Day 3,552 Ft Per Crew/Day 4,791 Ft Per Crew/Day 3,680 Ft Per Crew/Day 2,000 to 3,500 Per Crew Dayo # of Crew Days o # of Crew Days 17.7 # of Crew Days 14.3 # of Crew Days 23 # of Crew Days 19 # of Crew Days 18.5 # of Crew Days 24 to 42 Crew Days
Days Per Mo 2 Hydrojets Not Available 0 Days 0 Days 0 Days 0 Days 0 Days < 3 DaysDays Per Mo 2 TV Vans Not Available 0 Days 0 Days 0 Days 0 Days 0 Days < 3 Days
Learning & Growth:# new modules completed 0 Module 0 Module 0 Modules 0 Modules 0 Modules 1 Modules
# of Training Modules w/instuction completed 0 Module 0 Module 0 Modules 2 Modules 2 Modules 1 Modules
# of individual Competency Assessments passed 0 Assessments 0 Assessments 0 Assessments 38 Assessments 38 Assessments 27 Assessments• Communicate Performance Data to Teams # of time info shared with Team 3 Min. per mo 3 Min. per mo 3 Min. per mo 3 Min. per mo 12 Min. per mo Min. 1 per/mo
• Maintain and increase employee skills
• Key Vehicles Available For Preventative Maintenance Program
Qtr 1 FY 13 To Date4th Qtr3rd Qtr2nd Qtr

S-17
ObjectivesFY14 Collection Services BSC Measures FY 14 Target
Customer Perspective:• Minimize Overflows SSO’s · # of Category 3 SSOs 0 SSOs 2 SSOs 1 SSOs 1 SSOs 4 SSOs • Category SSOs
· # of Category 2 SSOs 0 SSOs 0 SSOs 0 SSOs 0 SSOs 0 SSOs ≤ 10 Category 2 SSOs
· # of Category 1 SSOs 1 SSOs 0 SSOs 0 SSOs 0 SSOs 1 SSOs • Zero Category 1 SSOs
• Minimize Negative Impact on Environment
· Percent of spill recovery 100.0% Recovery 99.8% Recovery 100% Recovery 100% Recovery 99.96% Recovery • 50% Recovery
· SSO’s # of Repeats 0 SSO Repeats 0 Repeats 0 Repeats 0 SSO Repeats 0 SSO Repeats • Zero RepeatsManage and maintain assets and infrastructure
• Critical Asset Failures Sewer Main or MH Deficiency resulting in Category 1 SSO, sink hole, injury or resulting property damage > $2,000 due to one or more of the following:
0 Asset failure 0 Asset failure
0
Failures 0 Failures 0 Asset failure • Zero
– Break, collapse, offset or hole in pipe or – PMP not followed– Corrosion– Defect identified & corrective action
• Stoppage in > 12” diameter mainline 0 Stoppages 0 Stoppages 0 Stoppages 0 Stoppages 0 Stoppages • Zero• # of times building becomes dangerous or unsuitable for occupation.
0 Incidents 0 Incidents 0 Incidents 0 Incidents 0 Incidents • Zero
Critical asset failure with a negative impact on customers or the environment
0 Incidents 0 Incidents 0 Incidents 0 Incidents 0 Incidents Zero Incidents
• Provide Uninterrupted Service Response Time from notification thru initial contact includes dispatch time
96.0% w/i 1 hour 96.7% w/i 1 hour 97.1% w/i 1 hour 98.7% w/i 1 hour 97.1% w/i 1 hour ≥ 95% w/i 1 hr
• Reduce negative impacts of District Number of odor complaints attributable to sewer.
0 Odors 0 Odors 0 Odor 1 Odors 1 Odor ≤ 2
Financial Perspective:• Provide competitive service Cleaning – cost per ft/day/crew $0.45 Per ft $0.67 Per ft $0.87 Per ft $0.71 Per ft $0.68 Clean Per Ft Clean $.66 to $1.05 Cost per feet/day Televising – cost per ft/day/crew $0.82 Per ft $0.85 Per ft $1.00 Per ft $1.16 Per ft $0.96 TV Per Ft TV - $.80 to $1.40 • Minimize Claims & Fines Total Cost of Claims/Fines (from SSO's) $0 Total Claims $0 Total Claims $0 Total Claims $0 Total Claims $0 Total Claims Claims ≤$2000
$0 Total Fines $0 Total Fines $0 Total Fines $0 Total Fines $0 Total Fines Fines-$0 Average cost per claim/fine $0 Avg Claims $0 Avg Claims $0 Avg Claims $0 Avg Claims $0 Avg Claims Claims ≤$1000
$0 Avg Fines $0 Avg Fines $0 Avg Fines $0 Avg Fines $0 Avg Fines Fines-$0Internal Process Perspective:• Trouble Call & SSO response Response Time 96.0% w/i 1 hour 96.7% w/i 1 hour 97.1% w/i 1 hour 98.7% w/i 1 hour 97.1% w/i 1 hour ≥ 95% w/i 1 hr
• Pipe/Problem Assessment Number of Repeat Spills 0 Zero 0 Zero 0 Zero 0 Zero Zero per year ≤ 2 per year
• Preventative Maint. Program 2 Yr Catch Up Plan % Complete 22.5% % Complete 20.5% % Complete 14.5% % Complete 17.1% % Complete 74.7% % Complete Annual Goal = 100%TV Goal Footage 297,276 TV Footage 270,706 TV Footage 191,188 TV Footage 225,570 Footage 984,740 YTD TV Ftg 1,318,689
• Cleaning (other cleaning omitted) Per Month Cleaning Footages 131,049 Avg Ft Per Mo 88,285 Avg Ft Per Mo 113,850 Avg Per Mo 128,238 Avg Per Mo 115,356 Avg Mo129,121 Mo; 1,549,454 YE (w/o CI)
o Feet per crew day o Feet Per Crew/Day 6,445 Ft Per Crew/Day 4,489 Ft Per Crew/Day 5,337 Ft Per Crew/Day 5,829 Ft Per Crew/Day 5,525 Ft Per Crew/Day 2,500 to 4,000 Per Crew Dayo # of Crew Days o # of Crew Days 20.3 # of Crew Days 19.7 # of Crew Days 21.3 # of Crew Days 22.0 # of Crew Days 20.8 # of Crew Days 21 to 33 Crew Days
• Televising Per Month Televising Footages 99,046 Avg Ft Per Mo 90,235 Avg Ft Per Mo 63,367 Avg Per Mo 75,224 Avg Per Mo 81,968 Avg Mo 109,891 Avg Mo, 1,318,689 YEo Feet per crew day o Feet Per Crew/Day 4,793 Ft Per Crew/Day 4,588 Ft Per Crew/Day 3,395 Ft Per Crew/Day 3,319 Ft Per Crew/Day 4,024 Ft Per Crew/Day 2,000 to 3,500 Per Crew Dayo # of Crew Days o # of Crew Days 20.7 # of Crew Days 19.7 # of Crew Days 18.7 # of Crew Days 23 # of Crew Days 20.5 # of Crew Days 24 to 42 Crew Days
Days Per Mo 2 Hydrojets Not Available 0 Days 0 Days 0 Days 0 Days 0 Days < 3 DaysDays Per Mo 2 TV Vans Not Available 0 Days 0 Days 0 Days 0 Days 0 Days < 3 Days
Learning & Growth:# new modules completed 1 Module 0 Module 0 Modules 0 Modules 1 Modules 1 Modules
# of Training Modules w/instuction completed 0Module 1 Module 0 Modules 4 Modules 5 Modules 1 Modules
# of individual Competency Assessments passed 0 Assessments 20 Assessments 0 Assessments 2 Assessments 22 Assessments 27 Assessments• Communicate Performance Data to Teams # of time info shared with Team 3 Min. per mo 3 Min. per mo 3 Min. per mo 3 Min. per mo 12 Min. per mo Min. 1 per/mo
• Maintain and increase employee skills
• Key Vehicles not Available For Preventative Maintenance Program
Qtr 1 FY 14 To Date4th Qtr3rd Qtr2nd Qtr

H:\BusServ\CAFR\Original Files - CAFR 2014\S18-Plant Scorecard FY13 (Tab: Report) S-18
Objectives Measures TargetReporting Frequency
Number of adverse impacts (odor complaints, violations, spills, etc.)
0 Quarter Total 0 Quarter Total 0 Quarter Total 2 Quarter Total 2 Total 0 Quarterly
Number of priority 1 work orders 6 Ave per Month 7 Ave per Month 3 Ave per Month 3 Ave per Month 5 Ave per Month Ave < 10/month Monthly
Number of critical asset failures 0 Quarter Total 0 Quarter Total 0 Quarter Total 0 Quarter Total 0 Total 0 MonthlyNumber with negative impact on the environment
0 Quarter Total 0 Quarter Total 0 Quarter Total 0 Quarter Total 0 Total 0
Water Usage - Alvarado SiteGallons Used Per Day 22,865 Ave per Day 24,093 Ave per Day 31,555 Ave per Day 37,265 Ave per Day 28,944 Ave per Day ≤ 30,000 Monthly
Energy & Chemical Usage: Monthly
Average/Day Kwh/MG - Alvarado Site 2,182 Ave per Month 2,069 Ave per Month 2,149 Ave per Month 2,153 Ave per Month 2,138 Ave per Month < 2,100Average Kwh/Day - Irvington Pump Station 1,594 Ave Kwh/Day 2,175 Ave Kwh/Day 1280 Ave Kwh/Day 0 Ave Kwh/Day 1,377 Ave Kwh/Day TBDAverage Kwh/Day - Newark Pump Station 2,730 Ave Kwh/Day 2,982 Ave Kwh/Day 2822 Ave Kwh/Day 2749 Ave Kwh/Day 2,821 Ave Kwh/Day TBD
On-site Power Generation - kwh/day 9,634 Ave per Day 9,144 Ave per Day 9,265 Ave per Day 6,506 Ave per Day 8,637 Ave per Day 8,500On-site Power Generation - kwh/year 886,400 Quarter Total 842,331 Quarter Total 833,060 Quarter Total 595,141 Quarter Total 3,156,932 Total 3,300,000
Ferrous Chloride
H2S Control - gal/hour 32 Ave GPH 32 Ave GPH 32 Ave GPH 32 Ave GPH 32 Ave GPH ≤ 35H2S Control - gal/year 70,656 Quarter Total 70,656 Quarter Total 69,120 Quarter Total 69,888 Quarter Total 280,320 FY Total ≤ 300000
Hydrogen Peroxide
H2S Control - gal/hour 6.4 Ave GPH 5.9 Ave GPH 6.4 Ave GPH 6.9 Ave GPH 6.4 Ave GPH 8.5H2S Control - gal/year 14,088 Quarter Total 12,940 Quarter Total 13,921 Quarter Total 15,164 Quarter Total 56,113 FY Total ≤ 76,000
Hypochlorite
Disinfection - gal/hour 34.3 Ave GPH 35.6 Ave GPH 33.2 Ave GPH 34.5 Ave GPH 34.3 Ave GPH ≤ 43Disinfection - gal/year 75,230 Quarter Total 78,569 Quarter Total 72,468 Quarter Total 75,408 Quarter Total 301,675 FY Total ≤ 375,000
Polymer
GBT - lbs/dry ton 4.4 Ave lbs/dry ton 4.4 Ave per Day 3.3 Ave per Day 4.1 Ave per Day 4.4 Ave lbs/dry ton 5.5Dewatering - lbs/dry ton 34.6 Ave lbs/dry ton 33.5 Ave per Day 35.7 Ave per Day 35.8 Ave per Day 34.6 Ave lbs/dry ton 33
Plant & Pump Station Process ScorecardFiscal Year 2013
Fiscal Year-to-Date2nd Quarter 4th Quarter
Cus
tom
er
3rd QuarterO
pera
te a
nd
mai
ntai
n th
e Pl
ant i
n co
mpl
ianc
e 24
/365
.O
ptim
ize
oper
atin
g co
sts:
Min
imiz
e en
ergy
, wat
er,
and
chem
ical
use
.1st Quarter
Fina
ncia
l

H:\BusServ\CAFR\Original Files - CAFR 2014\S18-Plant Scorecard FY13 (Tab: Report) S-18
Objectives Measures TargetReporting Frequency
Plant & Pump Station Process ScorecardFiscal Year 2013
Fiscal Year-to-Date2nd Quarter 4th Quarter3rd Quarter1st QuarterOvertime as % of base payroll:
FMC 8.5% Ave per Month 9.6% Ave per Month 9.5% Ave per Month 10.3% Ave per Month 9.5% Ave per Month ≤ 7% MonthlyT&D 4.4% Ave per Month 2.7% Ave per Month 1.8% Ave per Month 2.4% Ave per Month 2.8% Ave per Month ≤ 5% Monthly
% Total hours worked spent on maintenance work - FMC
76.4% Ave per Month 74.3% Ave per Month 81.8% Ave per Month 82.1% Ave per Month 78.6% Ave per Month ≥ 80% Monthly
Time not charged 12.2% Ave per Month 12.7% Ave per Month 7.6% Ave per Month 5.8% Ave per Month 9.6% Ave per Month < 20%
Biosolids Class A DisposalPercent Disposed of as Class A 1% Ave per Month 63% Ave per Month 23% Ave per Month 5% Ave per Month 23% Ave per Month 25% by FY13 MonthlyNumber of Wet Tons Disposed Class A 49 Quarter Total 2945 Quarter Total 1132 Quarter Total 169 Quarter Total 4295 FY Total 4,800
Plant Operational Health Index MonthlyMonthly Index Value 80% Ave 77% Ave 78% Ave 82% Ave 79% Ave Ave ≥ 85Number of Days < 75% 29 Days Total 29 Days Total 25 Days Total 25 Days Total 108 Days Total Track & ReportMaximum # of Consecutive Days < 75% 3 Days 4 Days 3 Days 3 Days 4 Days ≤ 3
Percent of time spent on Planned vs. Unplanned maintenance activities (Best in Class 90%)
92.1% Ave per Month 98.5% Ave per Month 97.0% Ave per Month 98.8% Ave per Month 96.6% Ave per Month 75% - 90% Monthly
Percent preventative maintenance work orders completed within month scheduled
98.1% Ave per Month 97.1% Ave per Month 98.8% Ave per Month 96.5% Ave per Month 97.6% Ave per Month ≥ 95% Monthly
Number corrective work orders over 90 days 120 End of Quarter 143 End of Quarter 104 End of Quarter 96 End of Quarter 116 Ave per Quarter Track & Report Quarterly
Percent of Environmental Compliance Samples that Meet Turnaround Time (12 days)-R&S Lab
100% For Quarter 100% For Quarter 100% For Quarter 100% For Quarter 100% Ave per Quarter ≥ 95% Quarterly
Percent of Immediate Notifications to TPO for Analyses that Exceed Action Limits-R&S Lab
100% For Quarter 100% For Quarter 100% For Quarter 100% For Quarter 100% Ave per Quarter 95%
Percent passed, State Proficiency Test (DHS-ELAP)
N/A Areas Passed N/A Areas Passed N/A Areas Passed 100% Areas Passed 100% Areas Passed 85% Annually
TPO QuarterlyNo. of training modules updated 0 1 1 2 4 Total 2
No. of training modules with compentency assessment tools developed
0 0 0 3 3 Total 3
FMC QuarterlyNo. of training modules developed vs. goal
0 0 0 1 1 Total 1
Opt
imiz
e op
erat
ing
cost
s: Im
prov
e ut
iliza
tion
of la
bor.
Inte
rnal
Pro
cess
es
Prov
ide
effe
ctiv
e re
gula
tory
&
labo
rato
ry s
ervi
ces
to s
uppo
rt
com
plia
nce.
Environmental Protection - District-wide
Empl
oyee
sFi
nanc
ial (
cont
inue
d)
Enha
nce
empl
oyee
sk
ills.
Mai
ntai
n Pl
ant
proc
esse
s w
ithin
pa
ram
eter
s.
Impl
emen
t an
effe
ctiv
e pr
edic
tive
and
prev
enta
tive
mai
nten
ance
pro
gram
.

H:\BusServ\CAFR\Original Files - CAFR 2014\S19-TD Plant Scorecard FY14 (Tab: Report) S-19
Objectives Measures Target
Comments/ Progress Towards
TargetC
usto
mer Operate &
maintain the Plant in compliance
24/365.
Number of adverse impacts (odor complaints, violations, spills, etc.)
5 Quarter Total 1 Quarter Total 0 Quarter Total 0 Quarter Total 6 Total 0
Energy Usage:Average/Day Kwh/MG - Alvarado Site 2,167 Ave per Month 2,208 Ave per Month 2,318 Ave per Month 2,300 Ave per Month 2,248 Ave per Month < 2,100
Cogeneration - kwh/day 9,697 Ave per Day 9,773 Ave per Day 9,584 Ave per Day 8,560 Ave per Day 9,404 Ave per Day 8,500Cogeneration - kwh/year 892,232 Quarter Total 899,257 Quarter Total 862,542 Quarter Total 779,641 Quarter Total 3,433,672 Total 3,300,000
Solar Production - kwh/day 694 Ave per Day 419 Ave per Day 415 Ave per Day 841 Ave per Day 592 Ave per DaySolar Production - kwh/year 63,982 Quarter Total 38,620 Quarter Total 37,398 Quarter Total 76,579 Quarter Total 216,580 Total
Chemical Usage:
Ferrous ChlorideH2S Control - gal/hour 32 Ave GPH 32 Ave GPH 32 Ave GPH 32 Ave GPH 32 Ave GPH ≤ 35H2S Control - gal/year 70,656 Quarter Total 70,656 Quarter Total 69,120 Quarter Total 69,888 Quarter Total 280,320 FY Total ≤ 300000
Hydrogen PeroxideH2S Control - gal/hour 9.5 Ave GPH 8.8 Ave GPH 7.8 Ave GPH 7.8 Ave GPH 8.4 Ave GPH ≤ 8.5H2S Control - gal/year 20,882 Quarter Total 19,328 Quarter Total 16,775 Quarter Total 16,959 Quarter Total 73,944 FY Total ≤ 76,000
HypochloriteDisinfection - gal/hour 32.2 Ave GPH 31.5 Ave GPH 31.2 Ave GPH 32.1 Ave GPH 32.2 Ave GPH ≤ 43Disinfection - gal/year 75,163 Quarter Total 69,636 Quarter Total 68,244 Quarter Total 70,068 Quarter Total 283,111 FY Total ≤ 375,000
PolymerGBT - lbs/dry ton 4.9 Ave lbs/dry ton 5.2 Ave per Day 4.4 Ave per Day 5.1 Ave per Day 4.9 Ave lbs/dry ton ≤ 5.5Dewatering - lbs/dry ton 34.1 Ave lbs/dry ton 32.8 Ave per Day 34.3 Ave per Day 34.9 Ave per Day 34.1 Ave lbs/dry ton ≤ 33
Water Usage:Gallons Used Per Day 38,181 Ave per Day 24,376 Ave per Day 27,298 Ave per Day 27,386 Ave per Day 29,952 Ave per Day ≤ 30,000 Leak was identified
and repaired during 1st Quarter, FY14.
Biosolids Class A DisposalPercent Disposed of as Class A 0% Ave per Month 7% Ave per Month 6% Ave per Month 50% Ave per Month 19% Ave per Month 25% by FY13Number of Wet Tons Disposed Class A 0 Quarter Total 365 Quarter Total 319 Quarter Total 3125 Quarter Total 3809 FY Total 4,800
Plant Operational Health IndexMonthly Index Value 83% Ave 86% Ave 84% Ave 88% Ave 85% Ave Ave ≥ 85Number of Days < 75% 24 Days Total 24 Days Total 28 Days Total 22 Days Total 98 Days Total Track & ReportMaximum # of Consecutive Days < 75% 2 Days 2 Days 2 Days 2 Days 2 Days ≤ 3
Complete preventative maintenance.
Percent preventative maintenance work orders completed within month scheduled (TPO) 98% Ave per Month 97% Ave per Month 98.8% Ave per Month 95.9% Ave per Month 98% Ave per Month ≥ 95%
Percent of Environmental Compliance Samples that Meet Turnaround Time (12 days)-R&S Lab
100% For Quarter 100% For Quarter 100% For Quarter 100% For Quarter 100% Ave per Quarter ≥ 95%
Percent passed, State Proficiency Test (DHS-ELAP)
100% Areas Passed N/A Areas Passed N/A Areas Passed N/A Areas Passed 100% Areas Passed ≥ 85% Frequency of test is once per year.
TPONo. of training modules updated 4 0 0 3 7 Total 8No. of training modules with competency assessment tools developed
1 2 0 2 5 Total 5
Environmental Protection - District-wide
Maintain Plant processes within
parameters.
Enhance employee skills.
Empl
oyee
s
Provide effective regulatory & laboratory services to
support compliance.
Treatment & Disposal Plant Process ScorecardFiscal Year 2014
Fiscal Year-to-Date2nd Quarter 4th Quarter3rd Quarter1st Quarter
Inte
rnal
Pro
cess
esFi
nanc
ial
Optimize operating costs: Minimize energy,
chemical, and water use.
Track & Report

UNION SANITARY DISTRICT
Miscellaneous Statistics
6/30/2014
Governing Body: Elected 5-Member Board of Directors
Fremont - 3 Members
Newark - 1 Member
Union City - 1 Member
Governmental Structure: Established in 1918 and reorganized in 1923 under the Sanitary District Act
Staff: 128.45 full-time equivalent employees
CEO: General Manager
CFO: Business Services Manager
Authority: California Health and Safety Code Section 4700 et. Seq.
Services: Wastewater collection, treatment and disposal
Service Area: 123 square miles (Fremont, Newark and Union City)
Total Population Served: 339,983
Number of Connections 108,369 = Number living units
Operations: Total miles of pipeline - 784, including the force main and all gravity sewers
(including trunk mains)
Number of pumping stations - 7
Larger: Irvington, Newark, Alvarado
Smaller: Fremont, Boyce, Paseo Padre, Cherry Street
Permitted Plant Treatment
Capacity 33 mgd
Type of Treatment: Secondary
Sewer Service Charge: $337.76 annually per residential equivalent unit
USD Treatment Disposal, Collections Work Groups, CA Dept. of Finance S-20