comprehensive capacity development project for the
TRANSCRIPT

Comprehensive capacity development project for the Bangsamoro Sector Report 2-3: Air Transport
Comprehensive Capacity Development Project for the Bangsamoro
Development Plan for the Bangsamoro
Final Report
Sector Report 2-3: Air Transport

Comprehensive capacity development project for the Bangsamoro Sector Report 2-3: Air Transport

Comprehensive capacity development project for the Bangsamoro Sector Report 2-3: Air Transport
3-i
Table of Contents
Chapter 1 Introduction ...................................................................................................................... 3-1 1.1 Airports in Mindanao ............................................................................................................ 3-1 1.2 Classification of Airports in the Philippines ......................................................................... 3-1 1.3 Airports in Bangsamoro ........................................................................................................ 3-2 1.4 Overview of Airports in Bangsamoro ................................................................................... 3-2
1.4.1 Cotabato airport ............................................................................................................... 3-2 1.4.2 Jolo airport ....................................................................................................................... 3-3 1.4.3 Sanga-Sanga Airport ........................................................................................................ 3-3 1.4.4 Cagayan De Sulu airport .................................................................................................. 3-4 1.4.5 Malabang airport .............................................................................................................. 3-4 1.4.6 Wao airport ...................................................................................................................... 3-5
1.5 Relevant Organizations ......................................................................................................... 3-5 1.5.1 DOTC .............................................................................................................................. 3-5 1.5.2 CAAP ............................................................................................................................... 3-6 1.5.3 Airlines ............................................................................................................................ 3-6
1.6 Related Policies ..................................................................................................................... 3-6 1.6.1 Concerns on airport transport development in the Region .............................................. 3-6 1.6.2 Suggestions of regional spatial strategy for air transportation ......................................... 3-6
Chapter 2 Air Traffic Profile ............................................................................................................ 3-8 2.1 Scheduled Flights and Frequencies ....................................................................................... 3-8 2.2 Air Traffic Statistics .............................................................................................................. 3-8
2.2.1 Cotabato airport ............................................................................................................... 3-8 2.2.2 Jolo airport ..................................................................................................................... 3-11 2.2.3 Sanga-Sanga airport ....................................................................................................... 3-13 2.2.4 General aviation (GA) ................................................................................................... 3-15
2.3 Alternative Transportation Other than Aircraft ................................................................... 3-15 2.3.1 Road transportation service ........................................................................................... 3-16 2.3.2 Sea transportation service .............................................................................................. 3-16
2.4 Demand for Tourism ........................................................................................................... 3-16 2.4.1 Tourist arrivals in ARMM .............................................................................................. 3-16 2.4.2 Transfer demand ............................................................................................................ 3-18
2.5 Air Linkage Program of BIMP-EAGA ............................................................................... 3-20
Chapter 3 Existing Airport Facility Profile .................................................................................... 3-22 3.1 Cotabato Airport.................................................................................................................. 3-22 3.2 Jolo Airport ......................................................................................................................... 3-23 3.3 Sanga-Sanga Airport ........................................................................................................... 3-25 3.4 Cagayan De Sulu Airport .................................................................................................... 3-26 3.5 Malabang Airport ................................................................................................................ 3-27 3.6 Wao Airport ......................................................................................................................... 3-28
Chapter 4 Existing Airport Development Plan ............................................................................... 3-29 4.1 Airport Infrastructure Program ........................................................................................... 3-29 4.2 Cotabato Airport Development Plan ................................................................................... 3-30
4.2.1 Consolidated improvement plan .................................................................................... 3-30 4.2.2 Other proposed improvement plans ............................................................................... 3-32
4.3 Jolo Airport Development Plan ........................................................................................... 3-34 4.4 Sanga-Sanga Airport Development Plan ............................................................................. 3-34 4.5 Cagayan De Sulu Airport Development Plan ..................................................................... 3-36 4.6 National Airports Master Plan ............................................................................................ 3-36
Chapter 5 Initial Evaluation Of Terminal Building Facilities ........................................................ 3-37 5.1 Cotabato Airport.................................................................................................................. 3-37
5.1.1 Capacity of the existing terminal building facilities ...................................................... 3-37

Comprehensive capacity development project for the Bangsamoro Sector Report 2-3: Air Transport
3-ii
5.1.2 Capacity of the upgraded terminal building facilities .................................................... 3-37 5.2 Jolo Airport ......................................................................................................................... 3-38 5.3 Sanga-Sanga Airport ........................................................................................................... 3-38
Chapter 6 Review Of Flagship Projects On Bangsamoro Development Plan Phase I ................... 3-39 6.1 Flagship Programs for Air Transportation .......................................................................... 3-39 6.2 Cotabato Airport Improvement ........................................................................................... 3-40 6.3 Baloi Airport Improvement ................................................................................................. 3-42 6.4 Study on Creation of an International Airport in Bangsamoro ........................................... 3-42
Chapter 7 Air Traffic Demand Forecast ......................................................................................... 3-43 7.1 Cotabato Airport.................................................................................................................. 3-43 7.2 Jolo Airport ......................................................................................................................... 3-43 7.3 Sanga-Sanga Airport ........................................................................................................... 3-43
Chapter 8 Proposed Priority Projects ............................................................................................. 3-45 8.1 Cotabato Airport Development Project ............................................................................... 3-45 8.2 Jolo Airport Development Project ...................................................................................... 3-47 8.3 Sanga-Sanga Airport Development Project ........................................................................ 3-47 8.4 Other Viewpoints for Airport Development ........................................................................ 3-49
8.4.1 Airport network development project ............................................................................ 3-49 8.4.2 Bangsamoro corridor development project .................................................................... 3-50
Chapter 9 Project Cost Estimation ................................................................................................. 3-52 9.1 Cotabato Airport Development Project ............................................................................... 3-52 9.2 Jolo Airport Development Project ...................................................................................... 3-53 9.3 Sanga-Sanga Airport Development Project ........................................................................ 3-54

Comprehensive capacity development project for the Bangsamoro Sector Report 2-3: Air Transport
3-iii
List of Tables
Table 1.1 Airports in Mindanao by Category ....................................................................................... 3-1 Table 1.2 Airports in Bangsamoro by Category ................................................................................... 3-2 Table 1.3 Scheduled Flights and Frequencies of Services (as of March 2015) .................................... 3-8 Table 2.1 Air Traffic Movements at Cotabato Airport .......................................................................... 3-8 Table 2.2 Air Traffic Movements at Jolo Airport ............................................................................... 3-11 Table 2.3 Air Traffic Movements at Sanga-Sanga Airport ................................................................. 3-13 Table 2.4 Summary of Alternative Transportation Means .................................................................. 3-15 Table 2.5 Tourist Arrivals in ARMM (as of November 15, 2014)...................................................... 3-16 Table 3.1 Existing Facilities at Cotabato Airport ............................................................................... 3-22 Table 3.2 Existing Facilities at Jolo Airport ....................................................................................... 3-24 Table 3.3 Existing Facilities at Sanga-Sanga Airport ......................................................................... 3-25 Table 3.4 Existing Facilities at Cagayan De Sulu Airport .................................................................. 3-26 Table 3.5 Existing Facilities at Malabang Airport .............................................................................. 3-27 Table 3.6 Existing Facilities at Wao Airport ....................................................................................... 3-28 Table 4.1 Airport Infrastructure Program for Bangsamoro Airports .................................................. 3-29 Table 4.2 Update in Accordance with Previous JICA Study and Other Recommendations from
CAAP-CBO at Cotabato Airport ................................................................................... 3-32 Table 5.1 Proposed Terminal Facility Requirements for Cotabato Airport ........................................ 3-37 Table 5.2 Capacity of Existing Terminal Facilities at Cotabato Airport ............................................. 3-37 Table 5.3 Capacity of Terminal Facilities Upgraded by Consolidated Improvement Plan of
Cotabato Airport ............................................................................................................ 3-38 Table 5.4 Proposed Terminal Facility Requirements for Jolo Airport ................................................ 3-38 Table 5.5 Proposed Terminal Facility Requirements for Sanga-Sanga Airport .................................. 3-38 Table 6.1 BDP Flagship Programs for Air Transportation According to BDP I ................................. 3-39 Table 6.2 Bangsamoro Development Plan on Airport Infrastructure ................................................. 3-39 Table 7.1 Summary of Air Traffic Demand Forecast for Cotabato Airport (2015–30) ...................... 3-43 Table 7.2 Summary of Air Traffic Demand Forecast for Jolo Airport (2015–2030) .......................... 3-44 Table 7.3 Summary of Air Traffic Demand Forecast for Sanga-Sanga Airport (2015–2030) ............ 3-44 Table 8.1 Development Plan by Phase for Cotabato Airport (up to 2030) ......................................... 3-45 Table 8.2 Summary of Practical Development Targets for Cotabato Airport (up to 2030) ................ 3-46 Table 8.3 Development Plan by Phase for Jolo Airport (up to 2030) ................................................. 3-47 Table 8.4 Summary of Practical Development Targets for Jolo Airport (up to 2030) ........................ 3-48 Table 8.5 Development Plan by Phase for Sanga-Sanga Airport (up to 2030) ................................... 3-48 Table 8.6 Summary of Practical Development Targets for Sanga-Sanga Airport (up to 2030) .......... 3-49 Table 9.1 Summary of Cost Estimate for Bangsamoro Airport Development Projects (up to 2030) . 3-52 Table 9.2 Cost Estimation for Cotabato Airport Development Project (up to 2030) ......................... 3-52 Table 9.3 Cost Estimation for Jolo Airport Development Project (up to 2030) ................................. 3-53 Table 9.4 Cost Estimation for Sanga-Sanga Airport Development Project (up to 2030) ................... 3-54

Comprehensive capacity development project for the Bangsamoro Sector Report 2-3: Air Transport
3-iv
List of Figures
Figure 1.1 Locations of Airports in Mindanao ..................................................................................... 3-1 Figure 1.2 Locations of Airports in Bangsamoro ................................................................................. 3-2 Figure 1.3 Cotabato Airport (Satellite Photo) ....................................................................................... 3-3 Figure 1.4 Jolo Airport (Satellite Photo) .............................................................................................. 3-3 Figure 1.5 Sanga-Sanga Airport (Satellite Photo) ................................................................................ 3-4 Figure 1.6 Cagayan De Sulu Airport (Photo) ....................................................................................... 3-4 Figure 1.7 Malabang Airport (Photo) ................................................................................................... 3-5 Figure 1.8 Wao Airport (Photo) ............................................................................................................ 3-5 Figure 2.1 Air Passenger Movement at Cotabato Airport (2003–2013) ............................................... 3-9 Figure 2.2 Air Traffic Movement at Cotabato Airport (2003–2013) .................................................... 3-9 Figure 2.3 Air Cargo Movement at Cotabato Airport (2003–2013) ................................................... 3-10 Figure 2.4 Outbound Air Cargo Movement at Cotabato Airport (2003–2013) .................................. 3-10 Figure 2.5 Inbound Air Cargo Movement at Cotabato Airport (2003–2013) ..................................... 3-11 Figure 2.6 Air Passenger Movement at Jolo Airport (2007–2013) ..................................................... 3-12 Figure 2.7 Air Traffic Movement at Jolo Airport (2007–2013) .......................................................... 3-12 Figure 2.8 Air Cargo Movement at Jolo Airport (2007–2013) ........................................................... 3-13 Figure 2.9 Air Passenger Movement at Sanga-Sanga Airport (2011–2014) ....................................... 3-14 Figure 2.10 Air Traffic Movement at Sanga-Sanga Airport (2011–2014) .......................................... 3-14 Figure 2.11 Air Cargo Movement at Sanga-Sanga Airport (2011–2014) ........................................... 3-15 Figure 2.12 Domestic Tourist Arrivals in ARMM (2008–2014) ........................................................ 3-17 Figure 2.13 Foreign Tourist Arrivals in ARMM (2008–2014) ........................................................... 3-17 Figure 2.14 Total Tourist Arrivals in ARMM (2008 –2014) .............................................................. 3-17 Figure 2.15 Foreign Travelers Staying at Hotels (2012) .................................................................... 3-18 Figure 2.16 NAIA Airport Transfer Rate (2012) ................................................................................ 3-19 Figure 2.17 Mactan-Cebu Airport Transfer Rate (2012) .................................................................... 3-19 Figure 2.18 Davao Airport Transfer Rate (2012) ............................................................................... 3-20 Figure 2.19 Air and Sea Transport Linkage Program of BIMP-EAGA ............................................. 3-21 Figure 4.1 Cotabato Airport Consolidated Improvement Plan ........................................................... 3-31 Figure 4.2 Sanga-Sanga Airport Master Plan ..................................................................................... 3-35 Figure 6.1 Location of Airports Proposed for Flagship Projects ........................................................ 3-40 Figure 6.2 New Terminal Area Development Plan of Cotabato Airport ............................................ 3-41 Figure 6.3 Location of Existing VOR/DME Facility at Cotabato Airport ......................................... 3-42 Figure 8.1 Rating of International Roughness Index (IRI) ................................................................. 3-46 Figure 8.2 Example of Runway Calibration at Cotabato Airport ....................................................... 3-47 Figure 8.3 Airport Network Development in the Bangsamoro .......................................................... 3-50 Figure 8.4 Locations of Logistics Corridors and Some of Region’s Resources ................................. 3-51

Comprehensive capacity development project for the Bangsamoro Sector Report 2-3: Air Transport
3-v
Abbreviations, Unit of Measurement, and Currency
(Refer to Sector Report 2-1: Road Transport, pp. 1-v through 1-x.)

Comprehensive capacity development project for the Bangsamoro Sector Report 2-3: Air Transport
3-vi

Comprehensive capacity development project for the Bangsamoro Sector Report 2-3: Air Transport
3-1
CHAPTER 1 INTRODUCTION
1.1 Airports in Mindanao
Mindanao has three international airports located in Davao, General Santos and Zamboanga; five principal class I airports located in Cagayan De Oro (Laguindingan), Butuan, Pagadian, Dipolog and Awang (Cotabato); six principal class II airports located in Surigao, Siargao, Tandag, Camiguin, Jolo and Sanga-Sanga; and more than 10 community airports in each region (Figure 1.1).
Source: JICA Study Team.
Figure 1.1 Locations of Airports in Mindanao
1.2 Classification of Airports in the Philippines
International airports are airports capable of handling international flights. Airports in this category include airports that currently are serving or have previously served international destinations. Principal airports are airports that only serve domestic destinations. There are two types: Class 1 principal airports capable of serving jet aircraft with a capacity of at least 100 seats and Class 2 principal airports capable of serving propeller aircraft with a capacity of at least 19 seats. Community airports are airports that are used primarily for general aviation. Most feeder airports are in this category. Classification of airports in Mindanao is given in Table 1.1.
Table 1.1 Airports in Mindanao by Category
Category Airports International Davao, General Santos, Zamboanga Principal Class 1 Laguindingan (Cagayan De Oro), Butuan, Pagadian, Dipolog, and Awang (Cotabato) Principal Class 2 Surigao, Siargao, Camiguin, Tandag, and Jolo, Sanga-Sanga Community Bislig, Mati, Iligan, Ozamiz, Allah Valley, Liloy, Ipil, Siocon, Malabang, Cagayan De Sulu,
etc.
Source: CAAP.
General Santos

Comprehensive capacity development project for the Bangsamoro Sector Report 2-3: Air Transport
3-2
1.3 Airports in Bangsamoro
Bangsamoro has one principal class I airport located in Awang Datu Odin Sinsuat, Maguindanao; two principal class II airports located in Sanga-Sanga, Tawi-Tawi and Jolo, Sulu, and two community airports in Malabang in the province of Lanao del Sur, and Cagayan De Sulu (Mapun), Tawi-Tawi (Figure 1.2). There is a newly established feeder airport in the municipality of Wao which is now operational. Airports in Bangsamoro are classified as shown in Table 1.2 in accordance with the classification of CAAP.
Source: JICA Study Team.
Figure 1.2 Locations of Airports in Bangsamoro
Table 1.2 Airports in Bangsamoro by Category
Category Airports International n/a Principal Class 1 Awang (Cotabato) Principal Class 2 Jolo, Sanga-Sanga Community Cagayan De Sulu, Malabang, Wao
Source: CAAP.
1.4 Overview of Airports in Bangsamoro
1.4.1 Cotabato airport
The Cotabato airport is an airport serving the general area of Cotabato City, located in the province of Maguindanao in the Philippines (Figure 1.3). The airport is classified as a Class 1 principal (major domestic) airport by the Civil Aviation Authority of the Philippines (CAAP), a body of the Department of Transportation and Communications responsible for the operations not only of this airport but also of all other airports in the Philippines except the major international airports. While the airport services Cotabato City, the airport facilities are located in Barangay Awang in the neighboring municipality of Datu Odin Sinsuat, Maguindanao.
Awang (Cotabato)
Wao Malabang
Jolo
Cagayan De Sulu
Sanga‐Sanga

Comprehensive capacity development project for the Bangsamoro Sector Report 2-3: Air Transport
3-3
Source: Google Earth.
Figure 1.3 Cotabato Airport (Satellite Photo)
1.4.2 Jolo airport
The Jolo airport is the airport serving the general area of Jolo, located in the island province of Sulu in the Philippines (Figure 1.4). It is the only airport in the province of Sulu. The airport is classified as a Class 2 principal (minor domestic) airport by CAAP.
Source: Google Earth.
Figure 1.4 Jolo Airport (Satellite Photo)
1.4.3 Sanga-Sanga Airport
The Sanga-Sanga airport is an airport serving the general area of Bongao, the capital of the province of Tawi-Tawi in the Philippines (Figure 1.5). The airport is classified as a class 2 principal (domestic) airport by CAAP.

Comprehensive capacity development project for the Bangsamoro Sector Report 2-3: Air Transport
3-4
Source: Google Earth.
Figure 1.5 Sanga-Sanga Airport (Satellite Photo)
1.4.4 Cagayan De Sulu airport
The Cagayan de Sulu airport (Filipino: Paliparan ng Cagayan de Sulu, Cebuano: Tugpahanan sa Mapun) also known as the Mapun airport is a remote community airport located in the island and municipality of Mapun, Tawi-Tawi (Figure 1.6). It is classified as a community airport by CAAP. Presently, no airlines are serving this airport but this airport is utilized for military purposes.
Source: CAAP.
Figure 1.6 Cagayan De Sulu Airport (Photo)
1.4.5 Malabang airport
The Malabang airport is an airport of Malabang in the province of Lanao del Sur. It is the only airport in the province (Figure 1.7). This airport is classified as community airport or a minor commercial airport by CAAP. Presently, no airlines are serving this airport and mainly the runway is utilized for drying corns and coconuts.

Comprehensive capacity development project for the Bangsamoro Sector Report 2-3: Air Transport
3-5
Source: JICA Study Team.
Figure 1.7 Malabang Airport (Photo)
1.4.6 Wao airport
The Wao community airport is located in the province of Lanao del Sur. This airport has only a few flights for private purposes (Figure 1.8).
Source: JICA Study Team.
Figure 1.8 Wao Airport (Photo)
1.5 Relevant Organizations
The relevant organizations regarding air transportation are shown as follows.
1.5.1 DOTC
The Department of Transportation and Communications (DOTC) is the executive department of the Philippine Government responsible for the maintenance and expansion of viable, efficient, and dependable transportation and communications systems as effective instruments for national recovery and economic progress. The department is responsible for the Country's land, air, sea and

Comprehensive capacity development project for the Bangsamoro Sector Report 2-3: Air Transport
3-6
communications infrastructure.
1.5.2 CAAP
CAAP is the national aviation authority of the Philippines and is responsible for implementing policies on civil aviation to assure safe, economic and efficient air travel. The agency also investigates aviation accidents via its Aircraft Accident Investigation and Inquiry Board. Formerly the Air Transportation Office, it is a government-owned and controlled corporation attached to DOTC for the purpose of policy coordination.
1.5.3 Airlines
The Philippine Airlines (PAL) is the national flag carrier of the Philippines, and it is the first commercial airline in Asia. The Philippine Airlines remains as the Country’s biggest airline company, having the largest number of international flights to/from the Philippines as well as domestic flights.
PAL Express, formerly the Air Philippines or Airphil Express, is operating under the business name of Air Philippines Corporation. The PAL Express is Philippine Airlines' answer to Cebu Pacific Air's dominance on the low cost travel market in the Philippines. As a codeshare of the Philippine Airlines, PAL Express is operating as a full service carrier with low-cost management.
The Cebu Pacific Air is the low fare leader in the Country, and it is the Country's leading domestic airline. After offering low fares to domestic destinations, the Cebu Pacific launched its international operations in November 2001. The airline currently operates hubs in Manila, Cebu and Davao.
Other low-cost airlines in the Country includes AirAsia Zest, PAL Express, and Tigerair Philippines. These airlines serve routes to several tourist destinations in the Country at low prices.
1.6 Related Policies
The concerns and suggestions for the air transport in the ARMM Regional Development Plan Midterm Update [2013–2016] are summarized below.
1.6.1 Concerns on airport transport development in the Region
Improving air transportation in the ARMM area is consistent with the national policies and strategies for the transportation sector. Airports development in the ARMM area reflects the Government’s commitment to pursue its peace and development agenda for Mindanao and supportive to the peace agreement between the Government of the Republic of the Philippines and MILF. This will also establish transport and trade links to Philippines within the BIMP-EAGA.
The main challenges of the air transport services in the ARMM area are attributed to high oil prices and slow economic progress. Airlines traffic or routes in the ARMM area are focusing on efficiency and reasonable costs of air services operation. Evolving concerns that hamper the development on air transportation services are attributed to continued high fuel cost, regressive regional economy and inadequate infrastructure development, which must be given priority consideration to meet future demand.
1.6.2 Suggestions of regional spatial strategy for air transportation
Airports development shall focus on the Cotabato airport in Maguindanao which is an entry to Metro Cotabato and Sanga-Sanga airport in Tawi-Tawi for the island provinces. The Cotabato and Sanga-Sanga airports shall be developed to attain the CAAP quality standards and encourage more investors in these provinces.
The siege in Zamboanga City paralyzed the economy of the island provinces, hence, the Autonomous Regional Government of ARMM shall pursue air connectivity of Tawi-Tawi to Metro Manila and vice-versa as an alternate gateway to Zamboanga City. This will be complemented by the opening of the

Comprehensive capacity development project for the Bangsamoro Sector Report 2-3: Air Transport
3-7
Sabah, Malaysia to Tawi-Tawi route because of its proximity. This will formalize and enhance the barter trading activities in the province and will maximize the current cooperation under the BIMP – EAGA.
Another air connectivity being proposed is the Davao City to Tawi-Tawi route to facilitate and expedite the flow of goods and services. This development strategy, if materialized, will trigger economic growth of the province and the Region in general for this will increase revenue generation and employment opportunities in the area.

Comprehensive capacity development project for the Bangsamoro Sector Report 2-3: Air Transport
3-8
CHAPTER 2 AIR TRAFFIC PROFILE
2.1 Scheduled Flights and Frequencies
The scheduled flights and frequencies of services are shown in Table 1.3.
Table 1.3 Scheduled Flights and Frequencies of Services (as of March 2015)
Airports Destinations Aircraft Frequencies Cotabato (CBO) Manila (MNL) A320
[180]* Philippine Airlines operated by PAL Express (GAP): Arrival: 11:00, Departure: 11:40 (Daily)
Cebu Pacific Air (CEB): Arrival: 06:35, Departure: 07:20 (Daily)† Arrival: 12:10, Departure: 12:50 (Mo/Tu/Th/Sa/Su) Arrival: 12:45, Departure: 13:25 (We/Fr)
Jolo (JOL) Zamboanga (ZAM)
Q400 [76]*
Philippine Airlines operated by PAL Express (GAP): Arrival: 10:00, Departure: 10:20 (Mo/We/Fr)
Sanga Sanga (TWT) Zamboanga (ZAM)
A319 [156]*
Cebu Pacific Air (CEB): Arrival: 07:40, Departure: 08:20 (Daily)
*Seating capacity; †only a few times per month
Source: Airlines.
2.2 Air Traffic Statistics
Data on air traffic in Bangsamoro are shown in Tables 2.1 through 2.3 and Figures 2.1 through 2.11.
2.2.1 Cotabato airport
It is notable that the traffic movements at the Cotabato airport increased steadily due to the A320 scheduled flight operation by Cebu Pacific Air, which was commenced in 2009 (Table 1.4). The inbound cargo movements also increased steadily after 2009, but the outbound cargo movements consisting of eel, crab, fruits such as lanzones, and fighting cocks remained almost unchanged from the point of view of the total cargo volume. The outbound cargo movements can be promoted up to around three times at least than existing cargo capacity in consideration of the inbound cargo movements.
The other notable occurrences which might have adversely affected the air traffic movements at the Cotabato airport are as follows: outbreak of SARS, bombing at the terminal building in 2003, global financial crisis during 2007-2008, and runway maintenance in 2011.
Table 2.1 Air Traffic Movements at Cotabato Airport
Year Passenger (n) Aircraft (n) Cargo (ton)
In Out Total In Out Total In Out Total 2003 38,533 39,796 78,329 718 718 1,436 392 276 6682004 41,911 41,875 83,786 727 727 1,454 438 292 7302005 45,692 45,411 91,103 857 857 1,714 469 351 8202006 67,705 69,404 137,109 1,028 1,028 2,056 504 318 8222007 68,948 69,162 138,110 1,053 1,053 2,106 599 449 1,0482008 71,796 73,849 145,645 1,230 1,230 2,460 582 303 8862009 97,069 102,035 199,104 1,681 1,681 3,362 800 335 1,1352010 97,167 100,838 198,005 1,355 1,355 2,710 989 428 1,4172011 96,596 95,184 191,780 1,409 1,409 2,818 1,095 421 1,5162012 131,345 139,100 270,445 1,738 1,738 3,476 1,412 463 1,8742013 127,109 132,589 259,698 1,843 1,843 3,686 1,613 482 2,095
Source: CAAP-CBO.

Comprehensive capacity development project for the Bangsamoro Sector Report 2-3: Air Transport
3-9
Source: CAAP-CBO.
Figure 2.1 Air Passenger Movement at Cotabato Airport (2003–2013)
Source: CAAP-CBO.
Figure 2.2 Air Traffic Movement at Cotabato Airport (2003–2013)
0
50,000
100,000
150,000
200,000
250,000
300,000
2003 2004 2005 2006 2007 2008 2009 2010 2011 2012 2013
Passenger Movements [Number]
Year
Cotabato AirportPassenger Movements 2003 ‐ 2013
0
500
1,000
1,500
2,000
2,500
3,000
3,500
4,000
2003 2004 2005 2006 2007 2008 2009 2010 2011 2012 2013
Aircraft Movements [Number]
Year
Cotabato AirportAircraft Movements 2003 ‐ 2013

Comprehensive capacity development project for the Bangsamoro Sector Report 2-3: Air Transport
3-10
Source: CAAP-CBO.
Figure 2.3 Air Cargo Movement at Cotabato Airport (2003–2013)
Source: CAAP-CBO.
Figure 2.4 Outbound Air Cargo Movement at Cotabato Airport (2003–2013)
0
500
1,000
1,500
2,000
2,500
2003 2004 2005 2006 2007 2008 2009 2010 2011 2012 2013
Cargo
Movements [To
ns]
Year
Cotabato Airport [OUTBOUND+INBOOUND]Cargo Movements 2003 ‐ 2013
0
500
1,000
1,500
2,000
2,500
2003 2004 2005 2006 2007 2008 2009 2010 2011 2012 2013
Cargo
Movements [To
ns]
Year
Cotabato Airport [OUTBOUND]Cargo Movements 2003 ‐ 2013

Comprehensive capacity development project for the Bangsamoro Sector Report 2-3: Air Transport
3-11
Source: CAAP-CBO.
Figure 2.5 Inbound Air Cargo Movement at Cotabato Airport (2003–2013)
2.2.2 Jolo airport
The passenger movement at the Jolo airport remains almost unchanged since 2007 (Table 2.2). The aircraft movement decreased as the small aircraft with 17 seats was operated until 2008 but PAL and CEB started the flight to the airport by bigger aircrafts from 2009 until 2014. Then CEB finished the operation in 2014. Currently, only PAL operates the flight to the airport up to now. The cargo movement drastically increased by the operation of the courier companies from 2013.
According to PAL, they temporarily stopped operation in the middle of 2015. It is considered to be one of the causes that the high speed vessel service between Zamboanga and Sulu has been promoted much lower fare than before.
Table 2.2 Air Traffic Movements at Jolo Airport
Year Passenger (n) Aircraft (n) Cargo (ton)
In Out Total In Out Total In Out Total 2003 2004 2005 2006 2007 6,434 7,731 14,165 485 485 970 8 2 102008 6,079 6,158 12,237 454 454 908 7 5 132009 3,356 3,505 6,861 263 263 526 8 6 152010 4,890 5,016 9,906 243 243 486 12 8 202011 8,525 8,908 17,433 152 152 304 18 6 242012 8,381 8,239 16,620 154 154 308 34 5 392013 7,482 7,793 15,275 171 171 342 136 302 439
Source: CAAP-JOL.
0
500
1,000
1,500
2,000
2,500
2003 2004 2005 2006 2007 2008 2009 2010 2011 2012 2013
Cargo
Movements [To
ns]
Year
Cotabato Airport [INBOUND]Cargo Movements 2003 ‐ 2013

Comprehensive capacity development project for the Bangsamoro Sector Report 2-3: Air Transport
3-12
Source: CAAP-JOL.
Figure 2.6 Air Passenger Movement at Jolo Airport (2007–2013)
Source: CAAP-JOL.
Figure 2.7 Air Traffic Movement at Jolo Airport (2007–2013)
0
50,000
100,000
150,000
200,000
250,000
300,000
2003 2004 2005 2006 2007 2008 2009 2010 2011 2012 2013
Passenger Movements [Number]
Year
Jolo AirportPassenger Movements 2007 ‐ 2013
0
500
1,000
1,500
2,000
2,500
3,000
3,500
4,000
2003 2004 2005 2006 2007 2008 2009 2010 2011 2012 2013
Aircraft Movements [Number]
Year
Jolo AirportAircraft Movements 2007 ‐ 2013

Comprehensive capacity development project for the Bangsamoro Sector Report 2-3: Air Transport
3-13
Source: CAAP-JOL.
Figure 2.8 Air Cargo Movement at Jolo Airport (2007–2013)
2.2.3 Sanga-Sanga airport
CEB started operation at the Sanga-Sanga airport in October 2011 utilizing Airbus 319. PAL stopped operation in April 2014 utilizing Bombardier DHC-8-402. Due to these changes in commercial operation and the lack of major part of the statistical data in 2013, it is difficult to make reference to the trends (Table 2.3).
Table 2.3 Air Traffic Movements at Sanga-Sanga Airport
Year Passenger (n) Aircraft (n) Cargo (ton)
In Out Total In Out Total In Out Total 2003 2004 2005 2006 2007 2008 2009 2010 2011 22,275 23,697 45,972 341 341 682 49 32 812012 58,539 59,797 118,336 591 591 1,182 180 412 5922013 15,046 15,696 30,742 147 147 294 45 97 1422014 48,548 49,821 98,369 403 403 806 171 464 635
Source: CAAP-ZAM.
0
500
1,000
1,500
2,000
2,500
2003 2004 2005 2006 2007 2008 2009 2010 2011 2012 2013
Cargo
Movements [To
ns]
Year
Jolo AirportCargo Movements 2007 ‐ 2013

Comprehensive capacity development project for the Bangsamoro Sector Report 2-3: Air Transport
3-14
Source: CAAP-ZAM.
Figure 2.9 Air Passenger Movement at Sanga-Sanga Airport (2011–2014)
Source: CAAP-ZAM.
Figure 2.10 Air Traffic Movement at Sanga-Sanga Airport (2011–2014)
0
50,000
100,000
150,000
200,000
250,000
300,000
2003 2004 2005 2006 2007 2008 2009 2010 2011 2012 2013 2014
Passenger Movements [Number]
Year
Sanga‐Sanga AirportPassenger Movements 2011 ‐ 2014
0
500
1,000
1,500
2,000
2,500
3,000
3,500
4,000
2003 2004 2005 2006 2007 2008 2009 2010 2011 2012 2013 2014
Aircraft Movements [Number]
Year
Sanga‐Sanga AirportAircraft Movements 2011 ‐ 2014

Comprehensive capacity development project for the Bangsamoro Sector Report 2-3: Air Transport
3-15
Source: CAAP-ZAM.
Figure 2.11 Air Cargo Movement at Sanga-Sanga Airport (2011–2014)
2.2.4 General aviation (GA)
Currently, there is no operation by the General Aviation which departs Bangsamoro airports as the origin. There are only a few flights from other airports in Mindanao to Bangsamoro airports.
2.3 Alternative Transportation Other than Aircraft
Alternative transportation means between Cotabato City and the other major cities in Mindanao, and between Zamboanga City and the other major islands in the Sulu archipelago are summarized in Table 2.4. These transportation services are widely utilized as an affordable transportation for the citizens.
Table 2.4 Summary of Alternative Transportation Means
Mode Route
SeatsFare
(PHP) Time
(hours)Frequency Note
Origin Destination Bus Cotabato Davao 45 350 6 Daily
Gen. San. 45 322 5 Daily Cgyn. De Oro 45 400 8 Daily Via KabacanZamboanga - - - - *
Van Cotabato Davao 12 270–350 4 Daily Gen. San. 12 220 3 Daily
Cgyn. De Oro 12 250 6 Daily Via MarawiZamboanga 12 1,500 10 We/Th/Fr/Sn
Ro-Ro vessel
Zamboanga Sulu 200 1,000 10 Daily Tawi-Tawi 200 1,500 17 Every other
day
Cgyn. De Sulu - - - - * High speed vessel
Zamboanga Sulu 200 800 4 Daily † Tawi-Tawi 200 2,500 8 Daily ‡
Cgyn. De Sulu - - - - * *No regular service; †Fare as of August 2015 (higher in March 2015); ‡Out of service due to vessel malfunction.
Source: JICA Study Team.
0
500
1,000
1,500
2,000
2,500
2003 2004 2005 2006 2007 2008 2009 2010 2011 2012 2013 2014
Cargo
Movements [To
ns]
Year
Sanga‐Sanga AirportCargo Movements 2011 ‐ 2014

Comprehensive capacity development project for the Bangsamoro Sector Report 2-3: Air Transport
3-16
2.3.1 Road transportation service
The bus service is regularly operated at an every 30 minutes interval from 5AM to 3PM. The van service is regularly operated once the passenger reaches the capacity.
2.3.2 Sea transportation service
Vessel service is regularly operated daily or every other day. It takes relatively longer than air transport but its cost is considerably lower. Also, it is second to none on the frequency of operation.
2.4 Demand for Tourism
2.4.1 Tourist arrivals in ARMM
Changes in tourist arrivals in ARMM from 2008 to 2014 are presented in Table 2.5 and Figures 2.12 through 2.14, referring to the statistical data obtained from the Department of Tourism (DOT)-ARMM.
The tourist arrival data were collated with the documents furnished by LGU Provincial Tourism Offices in the ARMM, and hotel/hostel/inns records. Marawi City tourism arrival data are included in Lanao del Sur province.
The incident of Maguindanao massacre in 2009 is considered to be related to the decreases during 2008 to 2010. Tourist arrivals in Lanao del Sur, Maguindanao and Tawi-Tawi tend to increase in recent years. On the other hand, the numbers in Basilan and Sulu trend to decrease or remain unchanged. The ratio of the foreign tourists to the total tourists still remains around only 1% although increased drastically in Maguindanao.
Table 2.5 Tourist Arrivals in ARMM (as of November 15, 2014)
Particulars Province
ARMM (n) Tawi-Tawi
(n) Basilan
(n) Sulu (n)
Maguinda-nao (n)
Lanao del Sur (n)
Domestic 2008 45,840 18,570 16,900 39,970 65,210 186,4902009 31,500 18,300 16,200 20,600 53,830 140,4302010 33,755 20,130 13,763 14,720 38,240 120,6082011 37,067 19,019 15,636 25,117 45,693 142,5322012 36,025 19,799 14,067 24,663 44,700 139,2542013 38,244 20,117 14,690 25,014 47,619 145,6842014 47,805 22,330 13,515 29,517 53,333 166,500
Foreign 2008 15 20 14 34 2,343 2,4262009 10 4 3 18 14 492010 215 21 11 280 14 5412011 280 16 8 110 27 4412012 380 17 14 233 32 6762013 185 25 17 1,091 35 1,3532014 384 28 16 1,189 61 1,678
Total 2008 45,855 18,590 16,914 40,004 67,553 188,9162009 31,510 18,304 16,203 20,618 53,844 140,4792010 33,970 20,151 13,774 15,000 38,254 121,1492011 37,347 19,035 15,644 25,227 45,720 142,9732012 36,405 19,816 14,081 24,896 44,732 139,9232013 38,429 20,142 14,707 26,105 47,654 147,0372014 48,189 22,358 13,531 41,506 53,394 168,178
Source: DOT.

Comprehensive capacity development project for the Bangsamoro Sector Report 2-3: Air Transport
3-17
Source: DOT-ARMM.
Figure 2.12 Domestic Tourist Arrivals in ARMM (2008–2014)
(Unit: Person)
Source: DOT-ARMM.
Figure 2.13 Foreign Tourist Arrivals in ARMM (2008–2014)
(Unit: Person)
Source: DOT-ARMM.
Figure 2.14 Total Tourist Arrivals in ARMM (2008–2014)
0
10,000
20,000
30,000
40,000
50,000
60,000
70,000
80,000
2008 2009 2010 2011 2012 2013 2014
TAWI‐TAWI
BASILAN
SULU
MAGUINDANAO
LANAO DEL SUR
0
500
1000
1500
2000
2500
3000
2008 2009 2010 2011 2012 2013 2014
TAWI‐TAWI
BASILAN
SULU
MAGUINDANAO
LANAO DEL SUR
0
10,000
20,000
30,000
40,000
50,000
60,000
70,000
80,000
2008 2009 2010 2011 2012 2013 2014
TAWI‐TAWI
BASILAN
SULU
MAGUINDANAO
LANAO DEL SUR

Comprehensive capacity development project for the Bangsamoro Sector Report 2-3: Air Transport
3-18
2.4.2 Transfer demand
In general, it is assumed that foreign travelers enter the Philippines through international flights, and then transit to other regions through domestic flights. Figure 2.15 based on the data by region on accommodations used by foreign travelers, collected by DOT, describes the registration status of foreigners traveling in each region. The statistics suggest that the potential for internationalization of the Cotabato airport currently still remains low.
(1) Location to stay in the Philippines
About 30.7% of foreign tourists tend to stay in Manila, followed by Mactan-Cebu with 19.1%, Naga with 10.4% and Caticlan with 9.8%. With regard to Mindanao, only 1.8% tends to stay in Davao, followed by Zamboanga with 1.6%, Laguindingan with 1.1%, Butuan with 0.3% and General Santos with 0.2%.
Source: KOICA Master Plan Study Report (Data from DOT).
Figure 2.15 Foreign Travelers Staying at Hotels (2012)
(2) Transfer at NAIA
Areas traveled by tourists were reviewed to predict a travel path from major international airports using domestic flights. Of the international passengers coming through NAIA, 71.6% stay in Manila while 28.4% connect to domestic flights bound for other regions (Figure 2.16). In the case of NAIA, the transfer demand is the highest for the domestic flights bound for the Puerto Princesa airport, followed by Caticlan and Bacolod airports. When the Puerto Princesa international airport opens as scheduled in 2017, much of the transfer demand via NAIA is expected to fall greatly. With regard to Mindanao, only 2.2% transfers to Zamboanga, followed by Laguindingan with 1.5%, Davao with 0.9%, Cotabato with less than 0.1%.

Comprehensive capacity development project for the Bangsamoro Sector Report 2-3: Air Transport
3-19
Source: KOICA Master Plan Study Report (Data from DOT).
Figure 2.16 NAIA Airport Transfer Rate (2012)
(3) Transfer at Mactan-Cebu airport
Of passengers entering the Mactan-Cebu airport, 64.1% stay in Cebu while 35.9% of them are presumed to transfer to domestic flights bound for other regions (Figure 2.17). Of the total transfers, there are most transits made to the NAIA airport, followed by Puerto Princesa, Caticlan and Bacolod airports in this order. In Mindanao, only 2.4% transfers to Zamboanga, followed by Laguindingan with 1.7%, Davao with 1.4%, Cotabato with 0.1%.
Source: KOICA Master Plan Study Report (Data from DOT).
Figure 2.17 Mactan-Cebu Airport Transfer Rate (2012)
(4) Transfer at Davao airport
An analysis shows that the Davao airport has relatively less pulling power than the airports situated in Manila and Cebu, and thus the transfer rate to adjacent regions is thought to be slightly high at 78.7% (Figure 2.18). The NAIA received most of the transfers made.

Comprehensive capacity development project for the Bangsamoro Sector Report 2-3: Air Transport
3-20
Source: KOICA Master Plan Study Report (Data from DOT).
Figure 2.18 Davao Airport Transfer Rate (2012)
2.5 Air Linkage Program of BIMP-EAGA
Currently, there is no operation for the BIMP-EAGA air linkage from/to Bangsamoro airports, although the Sanga-Sanga airport is part of the air linkage program for possible international flights. There is an only air linkage between Davao and Manado, Indonesia by charter flights operated by Sriwijaya Air of Indonesian airline.
According to the Mindanao Development Authority (MinDA), a multi-stakeholder group from Mindanao and Indonesia is poised to revive the air connectivity between Mindanao and North Sulawesi starting off with a market development strategy for the Davao-Manado route. In a meeting recently convened by MinDA, key players from tourism, trade, academe, and government line agencies agreed to take more proactive and aggressive steps in re-establishing the connectivity between the two BIMP-EAGA cities (Figure 2.19).
Reviving air links between the Philippines and its EAGA counterparts is currently one of the priorities of MinDA in order to maximize the travel tax exemption approved by the Philippine Government for travelers from Mindanao and Palawan heading to any of the BIMP-EAGA destinations. MinDA serves as the Philippine National Secretariat for BIMP-EAGA and coordinates with DOT and the Manado Transport and Tourism Ministry in developing the market for the Davao-Manado linkages.
Among the strategies to be pursued to promote the Davao-Manado route are the development of tour packages, business matching, trade sessions, and student exchange programs. The direct flight from Davao to Manado offers a shorter route for travelers and will allow the faster movement of goods and products. Currently, passengers bound for Manado take the circuitous and costly Davao-Manila-Jakarta-Manado route.

Comprehensive capacity development project for the Bangsamoro Sector Report 2-3: Air Transport
3-21
Source: MinDA.
Figure 2.19 Air and Sea Transport Linkage Program of BIMP-EAGA

Comprehensive capacity development project for the Bangsamoro Sector Report 2-3: Air Transport
3-22
CHAPTER 3 EXISTING AIRPORT FACILITY PROFILE
The existing airport facilities and the operational status in the Bangsamoro airports are shown in Tables 3.1 through 3.6. The data are initially compiled from the Philippine Airport Profile provided by CAAP-HQ and updated to the latest conditions through the site survey by the JICA Study Team.
3.1 Cotabato Airport
Existing facilities at the Cotabato airport are summarized in Table 3.1.
Table 3.1 Existing Facilities at Cotabato Airport
Classification Item Airport facilities Status* 1 Technical
Information Name of airport Cotabato (Awang) Airport Airport codes ICAO Code: RPMC
IATA Code: CBO Location Town/City, Province: Awang, Datu
odin Sinsuat, Cotabato City
Region: ARMM XI Aerodrome Area Cluster: XI
Classification Principal Class 1 Land area 36.1 ha Threshold 10 Latitude: 07° 10’ 0.2496” N
Longitude: 124° 12’ 6.89217” E Elevation: 54.6027 m
Threshold 28 Latitude: 07° 09’ 45.84695” N Longitude: 124° 13’ 7.57687” E Elevation: 46.9204 m
Airport reference point Latitude: 07° 09’ 53.0483’ N Longitude: 124° 12’ 37.2345 E
Runway designation no. 10/28 Runway elevation 54.6027 m AMSL Runway efficient grade 0.406% downhill towards threshold
28
Runway pavement strength
PCN 44 R/A/W/u
True bearing THR10-THR28: 103° 21’ 58.0” THR28-THR10: 283° 22’ 05.6”
2 Aircraft Movement Area
Runway 1,913 m x 45 m (paved w/ concrete, overlaid w/ asphalt)
Apron 256 m x 100 m (concrete) Taxiway 2–18 m x 83 m (asphalt overlay) Stopway 43.9 m x 45.3 m/44.7 m x 44.3 m Clearway 60 m x 45 m both ends Runway shoulder Macadam Strip 2,100 m x 130 m
3 Airport Facility PTB 72.00 m x 16.00 m Staff house 10.00 m x 8.00 m (proposed) Fire station building 22.00 m x 13.00 m Administration building 19.00 m x 16.00 m Parking area 72 m x 110 m
4 Airport Equipment Service vehicle L-300 Not in use (repairs needed)
Tractor mower Runway sweeper None Airlines in service Philippine Airlines, Cebu Pacific Critical aircraft A 320

Comprehensive capacity development project for the Bangsamoro Sector Report 2-3: Air Transport
3-23
Classification Item Airport facilities Status* Airport category Actual CAT. 4, required CAT. 6
5 Aerodrome Rescue and Firefighting (ARFF)
Actual capacity Water (L): 4,300; AFFF (L): 420; DCP (kg): -
Minimum ICAO requirements
Water (L): 7,900; AFFF (L): 474; DCP (kg): 225
Existing workforce 11 firefighters (9 permanent, 0 casual, 2 on job order)
Required 22 firefighters 6 ANS and ATS
Facilities Radio NAVAID equipment
VOR (conventional, Wilcox 585B) N (both systems) DME (ASI 1119 ) Sys #1: Y
Sys #2: N Communications equipment
VHF AM transmitter (main), 123.3 freq.: Aerocom 310
N
VHF AM transmitter (standby), 123.3 freq.: Aerocom 310
N
VHF AM receiver (main), 123.3 freq.; Aerocom 320
N
VHF AM receiver (standby), 123.3 freq.: Aerocom 320
N
VHF AM transceiver, 118.7 freq.: PAE T6TR, 50W
Y
VHF AM transceiver, 123.3 freq.: Mentor MB, 50W
Y
VHF AM transceiver, 123.3 freq.: PAE T6M, 10W
Y
VHF AM transceiver, 121.5 freq.: PAE 1660, 10W
Y
HF transceiver (M), 6.795 freq.: Yaesu FT-180A
Y
Voice logging system (VLS): Stancil E-Series
Deck #1: N Deck #2: Y
Integrated communication Switching System (ICSS): Denro ICSS-466
N
CADAS: Comsoft Y Meteorological equipment WSI, WDI, and PTH: Vaisala Y Airfield lighting equipment
PAPI 10 (pilot side) Y PAPI 28 (pilot side) Y Wind cones 10 (WDIL) Y Wind cones 28 (WDIL) Y RTIL 10 Y RTIL 28 Y TWY edge light Y RWY edge light Y Threshold light 10 (elevated type) Y Threshold light 28 (inset type) Y Rotating beacon Y
*Y = operational; N = non-operational
Source: CAAP, updated by JICA Study Team.
3.2 Jolo Airport
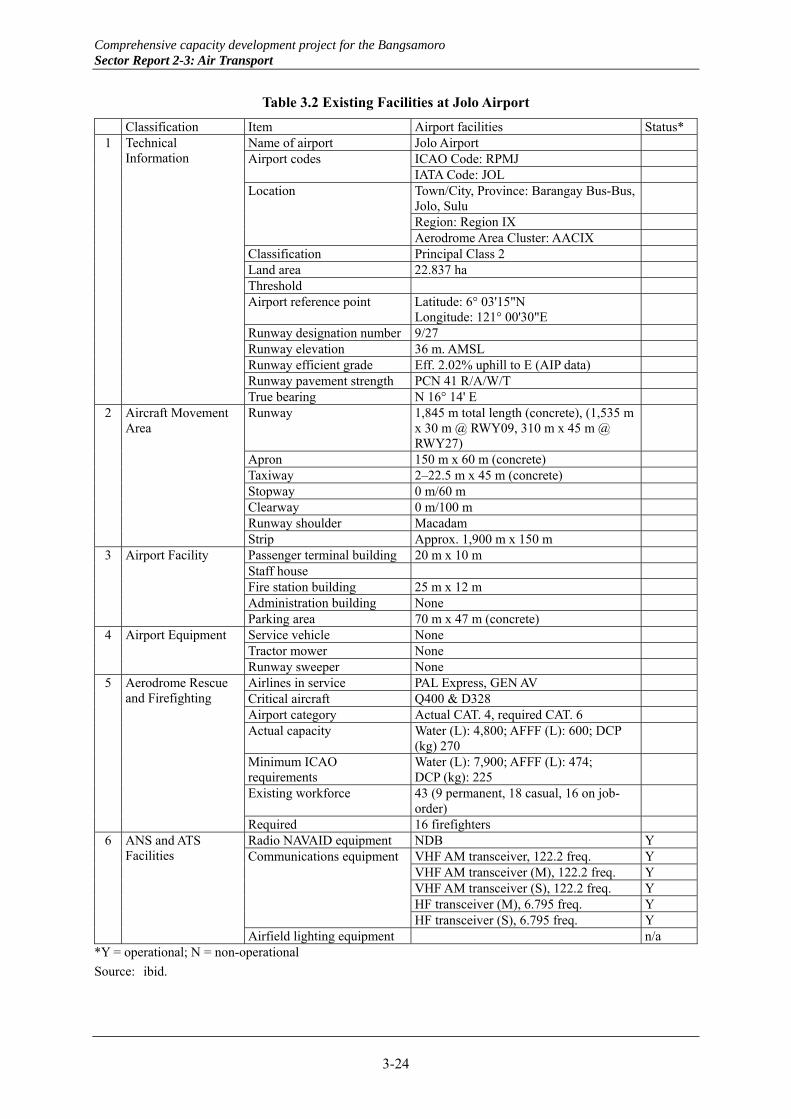
Existing facilities at the Jolo airport are summarized in Table 3.2.
Comprehensive capacity development project for the Bangsamoro Sector Report 2-3: Air Transport
3-24
Table 3.2 Existing Facilities at Jolo Airport
Classification Item Airport facilities Status* 1 Technical
Information Name of airport Jolo Airport Airport codes ICAO Code: RPMJ
IATA Code: JOL Location Town/City, Province: Barangay Bus-Bus,
Jolo, Sulu
Region: Region IX Aerodrome Area Cluster: AACIX
Classification Principal Class 2 Land area 22.837 ha Threshold Airport reference point Latitude: 6° 03'15"N
Longitude: 121° 00'30"E
Runway designation number 9/27 Runway elevation 36 m. AMSL Runway efficient grade Eff. 2.02% uphill to E (AIP data) Runway pavement strength PCN 41 R/A/W/T True bearing N 16° 14' E
2 Aircraft Movement Area
Runway 1,845 m total length (concrete), (1,535 m x 30 m @ RWY09, 310 m x 45 m @ RWY27)
Apron 150 m x 60 m (concrete) Taxiway 2–22.5 m x 45 m (concrete) Stopway 0 m/60 m Clearway 0 m/100 m Runway shoulder Macadam Strip Approx. 1,900 m x 150 m
3 Airport Facility Passenger terminal building 20 m x 10 m Staff house Fire station building 25 m x 12 m Administration building None Parking area 70 m x 47 m (concrete)
4 Airport Equipment Service vehicle None Tractor mower None Runway sweeper None
5 Aerodrome Rescue and Firefighting
Airlines in service PAL Express, GEN AV Critical aircraft Q400 & D328 Airport category Actual CAT. 4, required CAT. 6 Actual capacity Water (L): 4,800; AFFF (L): 600; DCP
(kg) 270
Minimum ICAO requirements
Water (L): 7,900; AFFF (L): 474; DCP (kg): 225
Existing workforce 43 (9 permanent, 18 casual, 16 on job-order)
Required 16 firefighters 6 ANS and ATS
Facilities Radio NAVAID equipment NDB Y Communications equipment VHF AM transceiver, 122.2 freq. Y
VHF AM transceiver (M), 122.2 freq. Y VHF AM transceiver (S), 122.2 freq. Y HF transceiver (M), 6.795 freq. Y HF transceiver (S), 6.795 freq. Y
Airfield lighting equipment n/a *Y = operational; N = non-operational
Source: ibid.

Comprehensive capacity development project for the Bangsamoro Sector Report 2-3: Air Transport
3-25
3.3 Sanga-Sanga Airport
Existing facilities at the Sanga-Sanga airport are summarized in Table 3.3.
Table 3.3 Existing Facilities at Sanga-Sanga Airport
Classification Item Airport facilities Status* 1 Technical
Information Name of airport Sanga-Sanga Airport Airport codes ICAO Code: RPMN
IATA Code: SGS Location Town/City/Province: Tubig Sallang, Bongao,
Tawi-Tawi, Sulu
Region: ARMM Aerodrome Area Cluster: IX
Classification Principal Class 2 Land area 32 ha Threshold 02 Latitude: 5° 02' 26.48129"
Longitude: 119° 44' 27.26439" Elevation: 4.545 m
Threshold 20 Latitude: 5° 03'23.94805" Longitude: 119° 44'46.29439" 6.635 m
Airport reference point Latitude: 5° 02' 55.21467" Longitude: 119° 44' 36.77939"
Runway designation number
02/20
Runway elevation 8.536 m AMSL Runway efficient grade 0.442% uphill towards threshold 20 Runway pavement strength PCN 39 R/A/W/T True bearing THR02-THR20: 18° 22' 9.5"
THR20-THR02: 198° 22' 10.3" 2 Aircraft Movement
Area Runway 1,920 m x 30 m w/ turnaround pad @ rwy 20
(Concrete)
Apron 156m x 50m (Concrete) Taxiway None Stopway 0/60m x 30m Clearway 0/60m x 30m Runway shoulder (7.50 m min. both sides, macadam) Strip 2,395 m x 200 m
3 Airport Facility PTB 10 m x 30 m Staff house Fire station building 11.00 m x 20.00 m Administration building None Parking area Under construction by DOTC
4 Airport Equipment Service vehicle None Tractor mower None Runway sweeper None
5 Aerodrome Rescue and Firefighting
Airlines in service Cebu Pacific Critical aircraft A319 Airport category Actual CAT. 4, required CAT. 6 Actual capacity Water (L): 2,400; AFFF (L): 300; DCP (kg):
360
Minimum ICAO requirements
Water (L): 7,900; AFFF (L): 474; DCP (kg): 225
Existing workforce 8 firefighters Required 8 firefighters
6 ANS and ATS Facilities
Radio NAVAID equipment n/a Communications equipment
VHF AM transceiver (M), 122.1 freq. N VHF AM transceiver, 122.1 freq. Y

Comprehensive capacity development project for the Bangsamoro Sector Report 2-3: Air Transport
3-26
Classification Item Airport facilities Status* HF transceiver, 6.795 freq. Y
Airfield lighting equipment n/a *Y = operational; N = non-operational
Source: ibid.
3.4 Cagayan De Sulu Airport
Existing facilities at the Cagayan de Sulu airport are summarized in Table 3.4.
Table 3.4 Existing Facilities at Cagayan De Sulu Airport
Classification Item Airport facilities 1 Technical Information Name of airport Cagayan de Sulu (Mapun) Airport
Airport codes ICAO Code: RPMU IATA Code: CDY
Location Town/City/Province: Mapun, Cagayan de Sulu, Zamboanga del Sur Region: IX Aerodrome Area Cluster: IX
Classification Community Land area No data Threshold Airport reference point Latitude: 7° 00' 45"
Longitude: 118° 29' 43" Runway designation number 13/31 Runway elevation 30 m. AMSL Runway efficient grade Nil Runway pavement strength 17,010 kg/0.50 MPa True bearing N 134° 00' E
2 Aircraft Movement Area
Runway 1,300 m x 30 m (macadam) Apron 60 m x 50 m (macadam) Taxiway None Stopway None Clearway None Runway shoulder Macadam Strip 1,410 m x 100 m
3 Airport Facility PTB Repair needed: terminal shed (not std.) Staff house None Fire station building None Administration building None Parking area None
4 Airport Equipment Service vehicle None Tractor mower None Runway sweeper None
5 Aerodrome Rescue and Firefighting
Airlines in service GEN. AV Critical aircraft Cessna & Islander Airport category Actual CAT. 2, required CAT. 2 Actual capacity Minimum ICAO requirements DCP (kg): 90 Existing workforce 8 firefighters Required 8 firefighters
6 ANS and ATS Facilities Radio NAVAID equipment None Communications equipment None Airfield lighting equipment None
Source: ibid.

Comprehensive capacity development project for the Bangsamoro Sector Report 2-3: Air Transport
3-27
3.5 Malabang Airport
Existing facilities at the Malabang airport are summarized in Table 3.5.
Table 3.5 Existing Facilities at Malabang Airport
Classification Item Airport facilities 1 Technical Information Name of airport Malabang Airport
Airport codes ICAO Code: RPMN IATA Code: MLP
Location Town/City/Province: Malabang, Lanao del SurRegion: Region X-ARMM Aerodrome Area Cluster: X
Classification Community Land area 16.05 ha Threshold Airport reference point Latitude: 7° 37' 6.83"
Longitude: 124° 3' 15.51" Runway designation number 06/24 Runway elevation 3.23 m AMSL (AIP data) Runway efficient grade -/+0.578 %l Runway pavement strength PCN 11 F/C/ZT True bearing THR06-THR24: 061° 06' GEO, 061° 11'
MAG THR24-THR06: 241° 06' GEO, 241° 11'
MAG 2 Aircraft Movement
Area Runway 1,360 m x 18 m (concrete) Apron 100.00 m x 150.00 m (asphalt) Taxiway None Stopway 100 m/35 m (macadam) Clearway 100 m/35 m (macadam) Runway shoulder Macadam Strip 1,662 m x 100 m
3 Airport Facility PTB 8.00 m x 30.00 m (old) Staff house None Fire station building None Administration building None Parking area None
4 Airport Equipment Service vehicle None Tractor mower None Runway sweeper None
5 Aerodrome Rescue and Fire Fighting
Airlines in service GEN. AV Critical aircraft Cessna & Islander Airport category Actual CAT. 2, required CAT. 2 Actual capacity Minimum ICAO requirements DCP (kg): 90 Existing workforce Required
6 ANS and ATS Facilities Radio NAVAID equipment None Communications equipment None Airfield lighting equipment None
Source: ibid.
3.6 Wao Airport
Existing facilities at the Wao airport are summarized in Table 3.6.

Comprehensive capacity development project for the Bangsamoro Sector Report 2-3: Air Transport
3-28
Table 3.6 Existing Facilities at Wao Airport
Classification Item Airport facilities 1 Technical Information Name of airport Wao Airport
Airport Codes ICAO Code: None IATA Code: WAO
Location Town/City/Province: Wao, Lanao del Sur Region: X-ARMM Aerodrome Area Cluster: AAC X
Classification Community Land area To be verified Threshold Airport reference point Latitude: 7° 38' 19" N
Longitude: 124° 43' 57" E Runway designation number 18/36 Runway elevation 536 m. AMSL Runway efficient grade -/+ 0.70 % Runway pavement strength To be verified True bearing To be verified
2 Aircraft Movement Area
Runway 1,000.00 m x 30.00 m (macadam) Apron 80.00 m x 50.00 m (macadam) Taxiway None Stopway 50.00 m/50.00 m (macadam) Clearway 50.00 m/50.00 m Runway shoulder Macadam Strip To be verified
3 Airport Facility PTB To be verified (Nipa Hut) Staff house None Fire station building None Administration building None Parking area None
4 Airport Equipment Service vehicle None Tractor mower None Runway sweeper None
5 Aerodrome Rescue and Firefighting
Airlines in service GEN. AV Critical aircraft Cessna & Islander Airport category Actual CAT. 2, required CAT. 2 Actual capacity Minimum ICAO requirements DCP (kg): 90 Existing workforce Required
6 ANS and ATS Facilities Radio NAVAID equipment None Communications equipment None Airfield lighting equipment None
Source: ibid.

Comprehensive capacity development project for the Bangsamoro Sector Report 2-3: Air Transport
3-29
CHAPTER 4 EXISTING AIRPORT DEVELOPMENT PLAN
4.1 Airport Infrastructure Program
Airport Infrastructure Programs from 2015 to 2018 are supposed to be undertaken by the Philippine national budget as shown in Table 4.1. The budget for the 2015 program was already approved by the Government in 2014. The budget for the 2016 program is still in process to finalize for submission for the approval procedures as of October 2015. The budget for CY 2017 and CY 2018 will be revised depending on the progress of the other programs by the previous years. These programs may be taken as priority projects, but particular attention shall be paid to other interventions by other donors and investors.
Table 4.1 Airport Infrastructure Program for Bangsamoro Airports (Unit: PHP 1,000)
Airport Project Program
2015 2016 2017 2018 Approved Proposed Proposed Proposed
Total 263,250 826,600 281,005 20,000Cotabato 5,000 51,540 0 0
1 Rehabilitation of terminal bldg. 5,000 2 Expansion of terminal bldg. from 1,150 to
2,870 m2 (1,718 m2) 51,540
Jolo 0 36,250 20,000 01 Payment of lot rental 19,600 2 Runway strip grade correction 10,000 3 Construction of VPA1 (650m2) 1,650 4 Construction of temporary terminal shed
(700m2) 5,000
5 Site development at land side area 20,000 Sanga-Sanga 248,250 648,760 261,005 20,000
1 Site acquisition of runway extension, strip width correction, land side area and provision of RESA2
62,250
2 Removal of trees/ structures/ improvement at the affected site
32,000
3 Widening of runway from 30 m to 45 m (1,920m x 7.5m, both ends) including runway shoulder
154,000
4 Provision of filling/embankment materials, slope protection for runway extension, apron, taxiway and land side area
371,700
5 Asphalt overlay of existing runway 181,440 6 Construction of CHB3 perimeter fence 44,000 7 Runway strip grade correction 21,650 8 Runway extension to 2,100m (180m x 45m) 28,350 9 Construction of stopway (60m x 45m) 1,620
10 Construction of new apron (240m x 125m) 105,000 11 Construction of new 2-taxiways (105m x 23m) 16,905 12 Construction of new PTB4 including utilities
(2,100m2) 80,000
13 Construction of fire station bldg. 14,400 14 Construction of administration bldg. (350m2) 10,500 15 Construction of control tower bldg. 25,000 16 Construction of vehicle parking area (3,675m2) 9,200 17 Replacement of military camps/facilities 18 Site development at land side area 20,000
Cagayan de Sulu 10,000 90,050 0 0

Comprehensive capacity development project for the Bangsamoro Sector Report 2-3: Air Transport
3-30
Airport Project Program
2015 2016 2017 2018 Approved Proposed Proposed Proposed
1 Construction of perimeter fence 3,020m with 1,208 bays of barbed wire with concrete posts
10,000
2 Completion of construction of perimeter fence 9,000 3 Concrete paving of existing runway (1,300m x
18m) with runway shoulder and clearing of runway strip
75,600
4 Rehabilitation of terminal bldg. (280m2) including airport utilities
5,000
5 Payment of old obligation (improvement on public land)
450
1vehicle parking area; 2 concrete hollow block; 3 runway end safety area; 4 passenger terminal building
Source: DOTC.
4.2 Cotabato Airport Development Plan
4.2.1 Consolidated improvement plan
According to the document of the Airport Infrastructure programs mentioned above, the expansion of the passenger terminal building (PTB) at the Cotabato airport is requested by the Airport Manager through Executive Secretary, the Office of Regional Governor, ARMM in August 2014. The PTB expansion will improve the capacity of the airport to serve passengers and airlines operations. In relation with the development, the JICA Study Team obtained the drawing of the Cotabato Airport Consolidated Improvement Plan from CAAP-CBO. The layout of the proposed plan is shown in Figure 4.1.
The proposed plan includes:
(1) Improvement of existing terminal building, (2) Improvement of security fence, (3) Provision of cargo building and airlines offices, (4) Provision of airport security office and quarters, (5) Provision of CAAP guest/staff house, (6) Provision of deep well with elevated water tank, (7) Provision of access road center island, (8) Provision of standby generation set/power house, (9) Repair and improvement of drainage system, and (10) Landscaping, ground improvement and beautification.
Especially, it can be expected that the conditions of the PTB will be improved since the cargo building and airlines offices will be newly established and the activities will be undertaken in the new building instead of the existing passenger building. The evaluation regarding the facility requirements are discussed in the following section.
4.2.2 Other proposed improvement plans
Improvement programs were proposed for the Cotabato airport in the previous JICA study of the Master Plan Study on the Strategy for the Improvement of National Airports in the Republic of the Philippines, 2006. The JICA Study Team has clarified the status of the update on the programs with CAA-CBO and also summarized its recommendations, which can be proposed as a priority project in this study. The summary of the update is presented in Table 4.2.

Com
prehensive capacity development project for the B
angsamoro
Sector R
eport 2-3: Air T
ransport
3-31
S
ource: C
AA
P-C
BO
.
Figu
re 4.1 Cotab
ato Airp
ort Con
solidated
Imp
rovemen
t Plan

Comprehensive capacity development project for the Bangsamoro Sector Report 2-3: Air Transport
3-32
Table 4.2 Update on Cotabato Airport Improvement in Accordance with Previous JICA Study and Other Recommendations from CAAP-CBO
Classifica-tion
Item Airport facilities Operation status*
Proposed development plan by previous JICA study
Update in ac-cordance with previous study
Recommendations from CAAP-CBO
Aircraft movement area
Runway 1,913 m x 45 m Widening of the runway to 45 m to comply with ICAO Code C
Completed.
Extension of the run-way by 135 m to the east and at the same time shifting the run-way some 80 m to the east (1,970 m x 45 m), which requires exten-sive embankment in the western end
Not carried out.
Runway rehabilitation and overlay on the exit-ing part of the runway
Not carried out.
Apron 256 m x 100 m (con-crete)
Taxiway 2 - 18 m x 83 m (as-phalt overlay)
Stopway 43.9 m x 45.3 m / 44.7 m x 44.3 m
Provision of paved blast pads in the extension of runway ends
Not completed.
Clearway 60m x 45m both ends
Construction of runway end safety area (RESA)
Not completed.
Runway shoulder
Macadam
Strip 2,100 m x 130 m Provision of a 2,090 x 150 m runway strip, in-cluding grading and landscaping
Not completed.
Perimeter fencing along the airside/landside bor-der
Not completed. (On going)
Airport fa-cility
PTB 72.00 m x 16.00 m Refurbishment of the existing passenger ter-minal (for traffic in 2029)
To be improved by the above mentioned reno-vation plan (still waiting budget alloca-tion)
X-ray machines and metal detectors
Already installed
Staff house 10.00 m x 8.00 m (proposed)
Fire station building
22.00 m x 13.00 m
Administra-tion building
19.00 m x 16.00 m
VPA 72 m x 110 m Airport equipment
Service ve-hicle
L-300 (not-in-use; need of repair)
1 utility vehicle Already installed but not in use any more
Recommendations: provision 1 unit service ve-hicle for ANS use
1 tractor Already installed Tractor mower
1 lawn mower Already installed
Runway sweeper
None
Airline oper-ator
Philippine Airlines, Cebu Pacific
Critical air-craft
A 320
Airport cate-gory
Actual CAT. 4, required CAT. 6
Aero-drome res-cue and fire-fighting
Actual ca-pacity
Water (L): 4,300 AFFF (L): 420 DCP (kg): -
1 new main fire vehicle Already installed
Minimum Water (L): 7,900 AFFF (L): 474

Comprehensive capacity development project for the Bangsamoro Sector Report 2-3: Air Transport
3-33
Classifica-tion
Item Airport facilities Operation status*
Proposed development plan by previous JICA study
Update in ac-cordance with previous study
Recommendations from CAAP-CBO
ICAO re-quirements
DCP (kg): 225
Existing workforce
11 firefighters
Required 22 firefighters ANS and ATS facili-ties
Radio NAVAID equipment
VOR (conventional; Wilcox 585B)
N (both systems)
Recommendations: Installation of new VOR/DME equipment stip-ulated on the Manual of Standards (MOS); Doppler type VOR
DME (ASI 1119) Sys #1: Y Sys #2: N
Communica-tions equip-ment
VHF AM transmitter (main) – 123.3 freq.: AEROCOM 310
N Communication system including VHF, Digital voice recording system, HF, etc.
To be improved based on ap-proved CAAP APP† 2015
Recommendations: Installation of 6 new units of 50 W VHF transceiver with new antenna system; provision of test instru-ments for communication equipment; installation of new communication con-sole.
VHF AM transmitter (standby) – 123.3 freq.: AEROCOM 310
N
VHF AM receiver (main) – 123.3 freq.: AEROCOM 320
N
VHF AM receiver (standby) – 123.3 freq.: AEROCOM 320
N
VHF AM trans-ceiver – 118.7 freq.: PAE T6TR; 50W
N
VHF AM trans-ceiver – 123.3 freq.: Mentor MB, 50W
Y
VHF AM trans-ceiver – 123.3 freq.: PAE T6M, 10W
Y
VHF AM trans-ceiver – 121.5 freq.: PAE 1660, 10W
Y
HF transceiver (M) – 6.795 freq.: Yaesu FT-180A
Y
Voice logging sys-tem (VLS): Stancil E-Series
Deck #1: N Deck #2: Y
Recommendations: Installation of new voice recording system
Integrated communi-cation switching system (ICSS): Denro ICSS-466
N
CADAS: Comsoft Y Meteorolog-ical equip-ment
WSI, WDI, and PTH: Vaisala
Y Meteorological equip-ment including meteor-ological stations
Already installed Recommendations: Relocation of existing MET equipment on site
Airfield lighting equipment
PAPI 10 (pilot side) Y PAPI lights Already installed PAPI 28 (pilot side) Y Wind cones 10 (WDIL)
Y
Wind cones 28 (WDIL)
Y
RTIL 10 Y Threshold identity lights
Already installed
RTIL 28 Y Ditto Already installed TWY edge light Y Taxiway and apron
edge lights Already installed
RWY edge light Y Runway edge lights Already installed Threshold light 10 (elevated type)
Y Runway threshold lights Already installed
Threshold light 28 (inset type)
Y Ditto Already installed
Rotating beacon Y Apron flood lighting Not yet installed. Obstacle lights for all Not yet installed.

Comprehensive capacity development project for the Bangsamoro Sector Report 2-3: Air Transport
3-34
Classifica-tion
Item Airport facilities Operation status*
Proposed development plan by previous JICA study
Update in ac-cordance with previous study
Recommendations from CAAP-CBO
relevant obstacles not removed
Simple approach light-ing system (SALS) for both runway approaches
Not yet installed.
Control tower
Refurbishment of the existing control tower, and other buildings
To be rehabili-tated based on the approved CAAP APP* 2014
Recommendations: Relocation of control tower building; provision of multi-function building for ANS/ATS technical person-nel; provision of 1 unit ser-vice vehicle for ANS use
*Y=operational, N=non-operational; †Annual Procurement Plan
Source: CAAP-CBO.
4.3 Jolo Airport Development Plan
Recently, the runway improvement project was implemented for the Jolo airport with assistance from the Growth with Equity in Mindanao (GEM) Program by USAID (United States Agency for International Development). The runway upgrade is a partnership project of DOTC, CAAP, and USAID’s GEM Program, through its Regional Impact Project component. GEM is implemented under the oversight of the Mindanao Economic Development Council.
According to the site survey, civilians often intrude the runway since the perimeter fencing has not completed yet in the airport. Currently, the clearance of the runway when the aircraft take-off and landing is secured by military guards. Accordingly, the fence shall be established as high priority to ensure the security and safety of the airport in addition to the above mentioned national budget programs. Furthermore, X-ray baggage screening equipment shall be installed along with metal detector to ensure the security in accordance with the relevant regulations since the passenger baggage is currently screened one by one by manually in the airport.
4.4 Sanga-Sanga Airport Development Plan
Currently, the airport runway is being extended to 1,930 m at the Sanga-Sanga airport through partnerships between DOTC, CAAP, USAID, the ARMM government, and the Tawi-Tawi provincial government. The Sanga-Sanga airport is part of the BIMP-EAGA linkage program for possible international flights.
The JICA Study Team obtained the drawing of Sanga-Sanga Airport Master Plan from DOTC. The proposed plan is shown in Figure 4.2. Same as the Jolo airport, X-ray baggage screening equipment shall be installed along with metal detector to ensure the security in accordance with the relevant regulations in addition to the above mentioned national budget programs since the passenger baggage is screened one by one by manually in the airport.
According to the site survey, the land acquisition for the runway extension to the eastern side is still ongoing under negotiation with the land owners. It can be expected that the negotiation will be settled without any trouble relatively since the land owners are willing to sell the land where it cannot be utilized for the farm or the other purposes effectively.

Com
prehensive capacity development project for the B
angsamoro
Sector R
eport 2-3: Air T
ransport
3-35
Source:
DO
TC
.
Figu
re 4.2 Sanga-S
anga Airp
ort Master P
lan

Comprehensive capacity development project for the Bangsamoro Sector Report 2-3: Air Transport
3-36
4.5 Cagayan De Sulu Airport Development Plan
The perimeter fencing is the first priority development for the Cagayan de Sulu airport to ensure the safety and security. Then the runway shall be paved to accommodate scheduled commercial aircrafts safely.
4.6 National Airports Master Plan
In 2006, JICA conducted the Master Plan Study on the Strategy for the Improvement of National Airports (hereinafter referred to as the JICA Master Plan Study), presenting various action plans to deliver rational improvements for the Philippines’ aviation industry. However, much time has passed since then and now a new master plan for airport development is needed that suits the changes in the aviation market home and abroad, as well as economic situations.
To this end, the Philippine Government sent a request to the Korean Government to establish a new master plan in line with changed conditions based on which the Korea International Cooperation Agency (KOICA), on behalf of the Korean government, has commenced the Master Plan Study on the Strategy for the Development of National Airports (hereinafter referred to as the KOICA Master Plan Study) since December 2013 and completed in May 2015. The KOICA Master Plan Study carried out a review of the existing master plan, air traffic demand forecast, requirements analysis for future airport facilities, and establishment of airport development plan by stage (Short-Term by 2020, Mid-Term by 2025 and Long-Term by 2030).
With regard to priority of expanding nighttime operation at regional airports, among the airports where airlines have raised the need for nighttime flights, those with a non-instrument runway (Butuan, Basco, Catarman, Masbate, Clabayog, and Dumaguete) will be suggested to provide aeronautical lighting to enable nighttime flights. In addition, improvement plans are deemed necessary for the existing aeronautical lighting system under operation in consideration of its operation period after the installation.

Comprehensive capacity development project for the Bangsamoro Sector Report 2-3: Air Transport
3-37
CHAPTER 5 INITIAL EVALUATION OF TERMINAL BUILDING FACILITIES
5.1 Cotabato Airport
Currently, the Cotabato (Awang) airport has sufficient runway capacity to accommodate A320 aircraft as the maximum aircraft size. Although the airport still maintains essential capacity of terminal facilities to accommodate a single A320 aircraft at a time, it is desirable to improve the facilities. The capacity of the airport terminal facilities are evaluated, based on the Federal Aviation Administration’s advisory circular, FAA AC 1505360-9 - Planning and Design of Airport Terminal Facilities at Non-Hub Locations (Table 5.1).
5.1.1 Capacity of the existing terminal building facilities
The capacity of the existing airport terminal facilities is evaluated based on the advisory circular mentioned above as shown in Table 5.2. According to the evaluation, the conditions of the lobby and waiting area and the arrival area (e.g., baggage claim public space and baggage claim counter lengths) are suitable for the existing passenger movements. On the other hand, the conditions of public automobile parking spaces, concession space and the departure area (e.g., ticket counter queuing space, airline ticket counter lengths, airline office, and operational space) are not suitable for the existing passenger movements.
Table 5.1 Proposed Terminal Facility Requirements for Cotabato Airport
No. Item Unit Recommendation 1 Public parking spaces n 200–270 2 Lobby and waiting area m2 190–240 3 Ticket counter queuing space m2 130–150 4 Airline ticket counter lengths m 19–22 5 Airline office and operational space m2 550–650 6 Baggage claim public space m2 100–115 7 Baggage claim counter lengths m 10–13 8 Concession space m2 170–230
Source: JICA Study Team.
Table 5.2 Capacity of Existing Terminal Facilities at Cotabato Airport
No. Item Unit Value Evaluation 1 Public parking spaces n 150 Insufficient 2 Lobby and waiting area m2 400 Sufficient 3 Ticket counter queuing space m2 100 Insufficient 4 Airline ticket counter lengths m 15 Insufficient 5 Airline office and operational space m2 170 Insufficient 6 Baggage claim public space m2 100 Fair 7 Baggage claim counter lengths m 19 Sufficient 8 Concession space m2 80 Insufficient
Source: ibid.
5.1.2 Capacity of the upgraded terminal building facilities
The capacity of the airport terminal facilities upgraded by the consolidated improvement plan of the airport, presented in Section 4 is shown in Table 5.3. According to the evaluation, the conditions of the ticket counter queuing space, airline office and operation space will be improved by the renovation plan although the conditions of the public automobile parking spaces and concession space still remain unimproved.
Besides, the arrival area (e.g., baggage claim public space and baggage claim counter lengths) still remains the existing capacity which can accommodate only one A320 aircraft arrival at one time. It

Comprehensive capacity development project for the Bangsamoro Sector Report 2-3: Air Transport
3-38
should be expanded to the adequate capacity to accommodate at least two A320 aircraft arrivals simultaneously to deal with the various styles of the scheduled flight operation in a flexibly manner in the future.
Table 5.3 Capacity of Terminal Facilities Upgraded by Consolidated Improvement Plan of Cotabato Airport
No. Item Unit Value Evaluation 1 Public parking spaces n 150 Insufficient 2 Lobby and waiting area m2 400 Sufficient 3 Ticket counter queuing space m2 160* Sufficient 4 Airline ticket counter lengths m 20* Fair 5 Airline office and operational space m2 700* Sufficient 6 Baggage claim public space m2 100 Fair 7 Baggage claim counter lengths m 19 Sufficient 8 Concession space m2 80 Insufficient
*Assumed value
Source: ibid.
5.2 Jolo Airport
According to the advisory circular, the proposed terminal facility requirements in accordance with the current traffic movement at the Jolo airport are recommended as shown in Table 5.4. It can be evaluated in detail once the detail of the terminal development layout drawing is confirmed.
Table 5.4 Proposed Terminal Facility Requirements for Jolo Airport
No. Item Unit Recommendation 1 Public parking spaces n 50 2 Lobby and waiting area m2 100–140 3 Ticket counter queuing space m2 40–50 4 Airline ticket counter lengths m 5–7 5 Airline office and operational space m2 200–250 6 Baggage claim public space m2 70–80 7 Baggage claim counter lengths m 7–9 8 Concession space m2 100–130
Source: ibid.
5.3 Sanga-Sanga Airport
According to the advisory circular, the proposed terminal facility requirements in accordance with the current traffic movement at the airport are recommended as shown in Table 5.5. It can be evaluated in detail once detail of the terminal development layout drawing is confirmed.
Table 5.5 Proposed Terminal Facility Requirements for Sanga-Sanga Airport
No. Item Unit Recommendation 1 Public parking spaces n 75–100 2 Lobby and waiting area m2 200–240 3 Ticket counter queuing space m2 70–80 4 Airline ticket counter lengths m 10–13 5 Airline office and operational space m2 320–380 6 Baggage claim public space m2 100–110 7 Baggage claim counter lengths m 10–13 8 Concession space m2 170–230
Source: ibid.

Comprehensive capacity development project for the Bangsamoro Sector Report 2-3: Air Transport
3-39
CHAPTER 6 REVIEW OF FLAGSHIP PROJECTS ON BANGSAMORO
DEVELOPMENT PLAN PHASE I
6.1 Flagship Programs for Air Transportation
According to the Bangsamoro Development Plan Phase I, the flagship programs are proposed for the airport development in Bangsamoro as shown in Table 6.1 and Figure 6.1.
Table 6.1 BDP Flagship Programs for Air Transportation According to BDP I
Projects Cost (PHP million) Airport Improvement: Cotabato Airport 95 Airport Improvement: Baloi Airport 48 Study on the creation of an international airport in the Bangsamoro 50
Total 193
Source: BDP1 (draft).
Table 6.2 was presented at the meeting of Bangsamoro Development Plan - Infrastructure Cluster on 3rd of December 2014 at DOF with relevant authorities. The budget is supposed to be allocated for the programs which are undertaken by DOTC but not for the programs which are undertaken by ARMM. The remaining costs are indicated as a financing gap. The flagship programs in Table 6.1 are considered to be quoted from the programs undertaken by ARMM shown in Table 6.2.
Table 6.2 Bangsamoro Development Plan on Airport Infrastructure
Project Agency
Total cost of BDA
proposed projects
2014 2015 2016 Total Cost of NG & ARMM projects
Financing gap Funded Funded Funded
1. Airport improve-ment: Cotabato Air-port
ARMM 100.0 - 5.0 - 5.0 95.0
2. Airport improve-ment: Sanga-Sanga Airport
DOTC 248.3 - 248.3 - 248.3 -
3. Airport improve-ment: Jolo Airport
DOTC 54.7 54.7 - - 54.7 -
4. Airport improve-ment: Baloi Airport
ARMM 48.0 - - - - 48.0
5. Study on the crea-tion of international airport in Bang-samoro
ARMM 50.0 - - - - 50.0
6. Cagayan de Sulu Airport
DOTC 10.0 - 10.0 - 10.0 -
Subtotal 511.0 54.7 263.3 - 318.0 193.0
Source: DOF.

Comprehensive capacity development project for the Bangsamoro Sector Report 2-3: Air Transport
3-40
Source: JICA Study Team.
Figure 6.1 Location of Airports Proposed for Flagship Projects
6.2 Cotabato Airport Improvement
A feasibility study on the Cotabato airport was undertaken by ADB in 2006, which proposed to establish the new terminal area at the opposite side of the existing terminal area. The development plan presented above was proposed including the proposal of previous JICA study, the Master Plan Study on the Strategy for the Improvement of National Airports in the Republic of the Philippines, 2006.
The proposed plan includes the following:
[1] Airside facilities and works
• Runway strip widening and grading works • Rehabilitation of existing runway • Widening of existing runway from 30 m to 45 m • Runway shoulders, turning eave and blast pads at both ends • Taxiway and apron • Runway extension of 110 m • Airside roads (rescue and firefighting, apron, maintenance, and air service roads) • Perimeter fence and roads • Demolition of various obstacles
[2] Landside facilities and works
• New PTB • New cargo terminal building • Other new buildings (administration and operations, rescue and firefighting, power house, solid
waste disposal, chiller pump house, and control tower.) • New landside roads, security fence and parking facilities • Drainage (runway strip, apron, road, and parking)
Awang (Cotabato)
Baloi (Iligan)
[ ]Study for
New International Airport for Bangsamoro

Comprehensive capacity development project for the Bangsamoro Sector Report 2-3: Air Transport
3-41
[3] Equipment
• Navigational aid (DVOR, DME, remote control, and power supply) • Air traffic control (ATC) and communications (VHF system, voice switch control system,
recording equipment, and UPS) • Airfield ground lighting (high-intensity simple approach lighting system for RWY 30 and 12,
high-intensity runway edge lighting, high-intensity runway end lighting, high-intensity runway threshold lighting, medium-intensity taxiway edge lighting, apron flood lighting, obstacle lighting, and illuminated wind cones)
• Airfield maintenance (tractor, grass mower, and utility vehicle) • One firefighting vehicle
The layout of the proposed master plan for new terminal area development is shown in Figure 6.2.
Source: ADB.
Figure 6.2 New Terminal Area Development Plan of Cotabato Airport
The outstanding issues for the Cotabato airport development are presented as follows.
[1] Land acquisition
The formal compensation procedure had already been done properly but the settlement with unjustified claimers still remains. The development plan shall be commenced after completion of the settlement.
[2] Visibility of control tower
Currently both of the runway edges are not visible from the control tower, which violates the relevant regulations due to the obstacles by the military facilities. The inappropriate condition shall be improved in accordance with the relevant regulations.
[3] Constraints on runway expansion
The eastern edge of the existing runway is adjacent to the arterial road. Therefore, it is difficult to extend the runway in that direction. The western edge of the runway is located on the top side of the cliff. Therefore the massive embankment is required for the extension on this side. The development shall be undertaken including the alternatives of new airport development.
[4] Relocation of the existing VOR/DME facility
The existing VOR/DME facility is located in the proposed new terminal area (Figure 6.3). Therefore, the facility shall be relocated to the proper area in compliance with the relevant regulations as necessary.
ProposedNew Terminal Area
Existing Terminal Area

Comprehensive capacity development project for the Bangsamoro Sector Report 2-3: Air Transport
3-42
Source: CAAP-CBO.
Figure 6.3 Location of Existing VOR/DME Facility at Cotabato Airport
6.3 Baloi Airport Improvement
The Baloi airport also known as the Iligan (Maria Christina) airport is an airport serving the general area of Iligan City, located in the province of Lanao del Norte. It is the only airport in the province.
The airport is classified by CAAP as a secondary airport, or a minor commercial domestic airport. Located some 400 m above the sea level, the Baloi airport has the distinction of being the highest airport in Mindanao and the second-highest in the Philippines, next to the Loakan airport in Baguio City.
The outstanding issues for the Baloi airport development are presented as follows.
The Laguindingan airport was constructed in Barangay Moog, Laguindingan, Misamis Oriental, and is located 46 km away from Cagayan de Oro City, Misamis Oriental. The airport is located only 65 km away or at most 35 to 40 minutes away from Iligan City. With the construction of the Laguindingan airport, designed to serve the Cagayan de Oro-Iligan corridor (CIC), the Baloi airport could be replaced by the new airport along with the Lumbia airport in Cagayan de Oro City. The Lumbia airport now serves as a military base for the Philippine Air Force (PAF). In consideration of the situation of the airport development in this region, it is necessary to examine how to ensure and expand the air traffic demand at the Baloi airport.
6.4 Study on Creation of an International Airport in Bangsamoro
The outstanding issues for the study on the creation of an international airport in the Bangsamoro are presented as follows.
The Cotabato airport still has sufficient capacity on runway to accommodate A320 aircraft as maximum size aircraft. Furthermore, the airport also still has essential capacity on terminal facilities for accommodating a single A320 aircraft at one time. It is considered, however, that increasing the frequency of flights between Manila and Cotabato is not easy to due to the congested slot coordination at the NAIA even if the traffic demand increases in the future. Given the situation, careful examination is necessary to ensure the viability of a new airport in advance starting from the discussion regarding the candidate sites.

Comprehensive capacity development project for the Bangsamoro Sector Report 2-3: Air Transport
3-43
CHAPTER 7 AIR TRAFFIC DEMAND FORECAST
Air traffic demand forecasts until 2030 of the Cotabato, Jolo and Sanga-Sanga airport were carried out in the KOICA Master Plan Study in consideration of socio-economic development projected for population, gross domestic product (GDP), and gross regional domestic product (GDRP). The results for each airport are summarized as shown in Tables 7.1 through 7.3, respectively.
7.1 Cotabato Airport
The demand forecast for the airport is summarized as shown Table 7.1. For the domestic passenger movement, the ratio of demand in 2030 to that in 2012 is 2.78 times with the compound annual growth rate (CAGR) in 2012-30 at 5.8%. For the domestic cargo movement, the ratio of demand in 2030 to that in 2012 is 2.48 times with the CAGR in 2012-30 at 5.2%.
7.2 Jolo Airport
The demand forecast of the airport is summarized as shown in Table 7.2. For the domestic passenger movement, the ratio of demand in 2030 to that in 2012 is 1.36 times with the CAGR in 2012–30 at 1.7%. For the domestic cargo movement, the ratio of demand in 2030 to that in 2012 is 1.41 times with the CAGR) in 2012–30 at 1.9%.
7.3 Sanga-Sanga Airport
The demand forecast of the airport is summarized as shown in Table 7.3. For the domestic passenger movement, the ratio of demand in 2030 to that in 2012 is 2.79 times with the CAGR in 2012–30 at 5.9%. For the domestic cargo movement, the ratio of demand in 2030 to that in 2012 and the CAGR in 20120–30 are not set due to the lack of cargo data in 2012 as the base year.
Table 7.1 Summary of Air Traffic Demand Forecast for Cotabato Airport (2015–30)
Item Year
2012 (actual) 2015 2020 2025 2030 1. Passenger
International - - - -Domestic 240,484 329,158 442,920 556,216 669,139
General aviation 2,336 2,504 2,684 2,878Subtotal 331,494 445,424 558,900 672,017
2. Cargo (ton) International - - - -
Domestic 1,748 2,276 2,960 3,645 4,329General aviation - - - - -
Subtotal 1,748 2,276 2,960 3,645 4,3293. ATM* International 4. ATM* Domestic
Large jet - - - -Medium size jet - - - -
Small jet 2,004 2,082 3,048 3,827 4,604Turboprop - 694 1,016 1,276 1,535
Short takeoff and landing - - - -Subtotal 2,004 2,777 4,064 5,103 6,139
5. ATM* GA 405 417 446 479 513Total 2,409 3,194 4,510 5,582 6,652
*ATM = air traffic movement
Source: KOICA Master Plan Study Report.

Comprehensive capacity development project for the Bangsamoro Sector Report 2-3: Air Transport
3-44
Table 7.2 Summary of Air Traffic Demand Forecast for Jolo Airport (2015–2030)
Item Year
2012 (actual) 2015 2020 2025 2030 1. Passenger
International - - - -Domestic 16,912 18,259 20,009 21,605 23,077
General aviation - - - -Subtotal 16,912 18,259 20,009 21,605 23,077
2. Cargo (ton) International - - - -
Domestic 40 30 38 47 56General aviation - - - - -
Subtotal 40 30 38 47 563. ATM International 4. ATM Domestic
Large jet - - - -Medium size jet - - - -
Small jet - - - -Turboprop 304 332 378 408 444
Short takeoff and landing - - - - -Subtotal 304 332 378 408 444
5. ATM GA - - - - -Total 304 332 378 408 444
Source: ibid.
Table 7.3 Summary of Air Traffic Demand Forecast for Sanga-Sanga Airport (2015–2030)
Item Year
2012 (actual) 2015 2020 2025 2030 1. Passenger
International - - - -Domestic 16,295 23,550 31,193 38,460 45,427
General aviation - - - -Subtotal 16,295 23,550 31,193 38,460 45,427
2. Cargo (ton) International - - - -
Domestic - 31 41 50 59General aviation - - - - -
Subtotal - 31 41 50 593. ATM International 4. ATM Domestic - - - - -
Large jet Medium size jet - - - - -
Small jet - - - - -Turboprop - 453 600 740 874
Short takeoff and landing - - - - -Subtotal - 453 600 740 874
5. ATM GA - - - - -Total - 453 600 740 874
Source: ibid.

Comprehensive capacity development project for the Bangsamoro Sector Report 2-3: Air Transport
3-45
CHAPTER 8 PROPOSED PRIORITY PROJECTS
The airport development plan by phase up to 2030 for the Cotabato, Jolo and Sanga-Sanga airports were prepared in the KOICA Master Plan Study based on the demand forecast mentioned above. The JICA Study Team has revised the plan in consideration of the latest information gathered through site survey (Table 8.1).
Table 8.1 Development Plan by Phase for Cotabato Airport (up to 2030)
Phase Contents Scale Short-term plan (2016–20) Securing width of runway strip New stub taxiway (110 m x 23 m x 2) 5,060 m2 New apron 8,000 m2 Upgrading of aeronautical lighting facilities to Grade C Expansion of rescue and firefighting station 170 m2 New PTB 5,500 m2 New vehicle parking area 8,960 m2 Installation of radio navigational aid (VOR/DME) Installation of aeronautical information service (VHF) Runway overlay (1,913 m x 45 m) 86,085 m2 Completion of fence connection 500 m New control tower Medium-term plan (2021–25) None Long-term plan (2026–30) Expansion of PTB 1,600 m2
Source: KOICA Master Plan Study report (revised by JICA Study Team).
8.1 Cotabato Airport Development Project
The Cotabato airport is expected to be upgraded to a local leading airport after 2020, where more than 500,000 passengers are expected to be handled. The facility expansion is required in accordance with the expected air traffic demand. The expected demand in 2025 will exceed 500,000 passengers, and the runway approach category shall be upgraded from non-instrument to non-precision in accordance with facility requirements. The airport needs to ensure that its facilities meet safety standards while installing and operating approach light system and radio navigational aids.
In addition, the top priority in non-precision approach operation is securing of runway strip. The current 130 m wide runway strip shall be expanded to 300 m. Distance between runway and apron taxiway shall follow international standards for 4C, which is the airport classification category of A320 aircraft currently under operation. This calls for the expansion in the depth of the apron, which is impossible under the current situation as the apron is surrounded by PTB, vehicle parking area (VPA) and other buildings. Therefore, the apron should be relocated to the opposite side of the existing landside area. Such relocation will be accompanied by the construction of the passenger terminal, VPA, and access roads, and this needs to be reflected in the short-term plan.
The Cotabato airport has limited expandability since there is a significant height difference or faulting between both ends of the runway and surrounding areas. Accordingly, the conditions are unfavorable not only for securing 2,600 m runway required to service A321 planes in 2025 but also for meeting the facility requirement of 2,200 m runway to service A320. However, it is possible to service A320 aircraft flying domestic routes within Manila without separate load limit owing to the already secured stop-way and clear-way in both directions by 45 m and 60 m, respectively. Therefore, it seems feasible to operate A320 planes until 2030 without additional expansion. Realistically, however, it is challenging to secure a runway end safety area (RESA). Furthermore, additional widening was found to be unnecessary since there is a runway widening project by DOTC underway covering runway parts that are 30 m wide. Still, runway overlay has been included in the short-term plan in consideration of the asphalt pavement’s service life of 20 years and of the growing air traffic demand.

Comprehensive capacity development project for the Bangsamoro Sector Report 2-3: Air Transport
3-46
Table 8.2 Summary of Practical Development Targets for Cotabato Airport (up to 2030)
Demand/Main facility UnitCurrent Future Requirements
Note 2015 2020 2025 2030
Traffic Demand Annual passengers Pax. - 445,424 558,900 672,017
Annual AC movements - 4,064 5,103 6,139 Peak-hour passengers Pax. - 436 436 545
Peak-hour AC movements 2 4 4 5 Design Aircraft A320 SJ SJ SJ Approach Category Non-instrument Non-precision Non-precision Non-precision Airside Facility
Runway length m 1,913 1,913 1,913 1,913 Runway width m 45 45 45 45
Runway strip width m 130 300 300 300 Taxiway system Stub Stub Stub Stub New construction
Apron area m2 25,600 8,000 8,000 8,000 New construction Airfield lighting B C C C RFF (category) 6 6 6 6
RESA length m 0/0 0/0 0/0 0/0 Landslide Facility
Passenger terminal area m2 1,152 6,600 6,600 8,200 New construction Cargo terminal area m2 n/a
Vehicle parking area m2 7,920 8,960 8,960 8,960 New construction R/W-T/W separation m 86.6 168 168 168
CNS/ATM RNA Non-instrument Non-precision Non-precision Non-precision AIS CH 2/3/4 6/3/4 6/3/4 6/3/4 VHF/TRSC/HF
MET Set 1/0/0 1/0/0 1/0/0 1/0/0 WIND/RVR/CCLM Other Improvement
Runway overlay Overlay 1,913 m x 45 m* Perimeter fences Incomplete Complete 500 m (250 bays)
Abbreviations: AC = aircraft, RFF = rescue and firefighting, RESA = runway end safety area, R/W = runway, T/W = taxiway, CNS/ATM = communication navigation and surveillance/air traffic management, RNA = radio navigational aid, AIS = aeronautical information service, VHF = very high frequency, TRSC = multi-transceiver, HF = high frequency, MET = meteorological facilities, WIND = anemometer, RVR = runway visual range, CCLM = COSMO climate limited-area model *In the road condition survey using DRIMS, the Cotabato airport runway was calibrated in advance through real measurement of roads in Bangsamoro. The results indicated that the roughness of the existing runway pavement exceeds the international roughness index (IRI) for airport runways (Figure 8.1 and Figure 8.2).
Source: ibid.
It is suggested to include key facilities by a non-precision approach in the short-term plan such as runway strip securing, VOR/DME installation, and aeronautical lighting facility upgraded from B to C since the relocation of landside facilities should be carried out in the short-term plan. A new rescue and firefighting vehicle has already been installed but currently yet to be utilized due to the lack of personnel to operate it. The station shall be expanded in accordance with the number of vehicles.
Source: World Bank.
Figure 8.1 Rating of International Roughness Index (IRI)
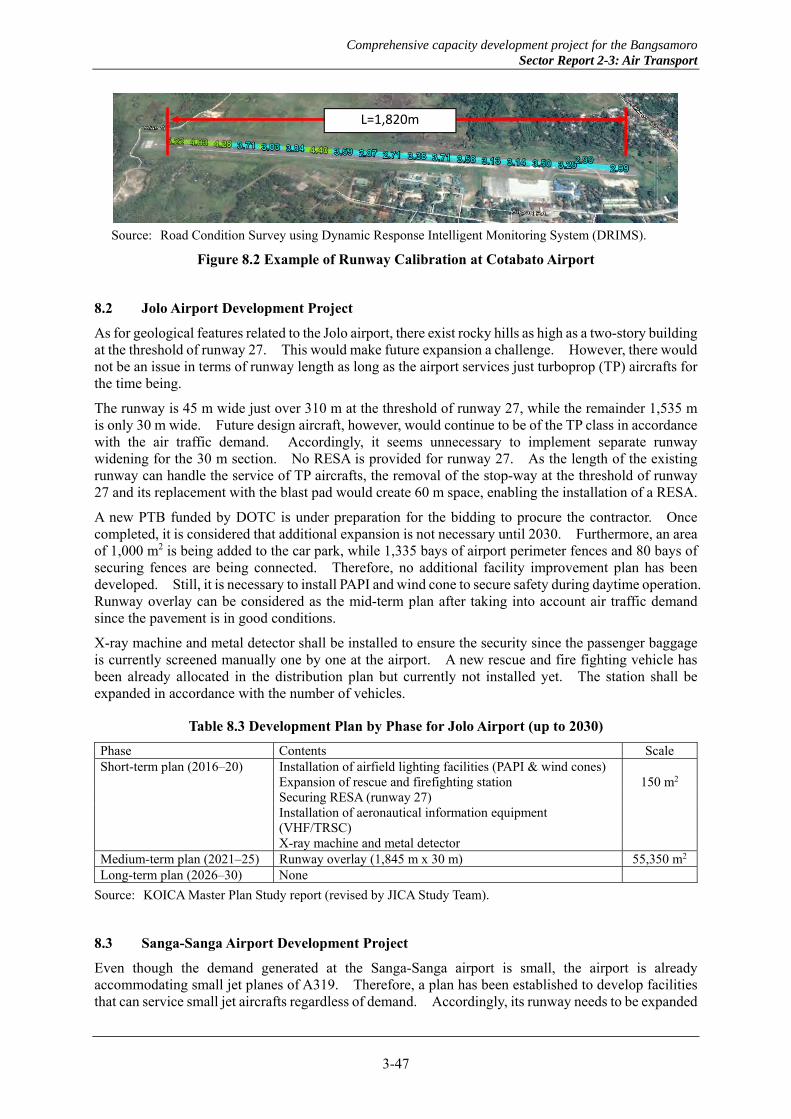
Comprehensive capacity development project for the Bangsamoro Sector Report 2-3: Air Transport
3-47
Source: Road Condition Survey using Dynamic Response Intelligent Monitoring System (DRIMS).
Figure 8.2 Example of Runway Calibration at Cotabato Airport
8.2 Jolo Airport Development Project
As for geological features related to the Jolo airport, there exist rocky hills as high as a two-story building at the threshold of runway 27. This would make future expansion a challenge. However, there would not be an issue in terms of runway length as long as the airport services just turboprop (TP) aircrafts for the time being.
The runway is 45 m wide just over 310 m at the threshold of runway 27, while the remainder 1,535 m is only 30 m wide. Future design aircraft, however, would continue to be of the TP class in accordance with the air traffic demand. Accordingly, it seems unnecessary to implement separate runway widening for the 30 m section. No RESA is provided for runway 27. As the length of the existing runway can handle the service of TP aircrafts, the removal of the stop-way at the threshold of runway 27 and its replacement with the blast pad would create 60 m space, enabling the installation of a RESA.
A new PTB funded by DOTC is under preparation for the bidding to procure the contractor. Once completed, it is considered that additional expansion is not necessary until 2030. Furthermore, an area of 1,000 m2 is being added to the car park, while 1,335 bays of airport perimeter fences and 80 bays of securing fences are being connected. Therefore, no additional facility improvement plan has been developed. Still, it is necessary to install PAPI and wind cone to secure safety during daytime operation. Runway overlay can be considered as the mid-term plan after taking into account air traffic demand since the pavement is in good conditions.
X-ray machine and metal detector shall be installed to ensure the security since the passenger baggage is currently screened manually one by one at the airport. A new rescue and fire fighting vehicle has been already allocated in the distribution plan but currently not installed yet. The station shall be expanded in accordance with the number of vehicles.
Table 8.3 Development Plan by Phase for Jolo Airport (up to 2030)
Phase Contents Scale Short-term plan (2016–20) Installation of airfield lighting facilities (PAPI & wind cones) Expansion of rescue and firefighting station 150 m2 Securing RESA (runway 27)
Installation of aeronautical information equipment (VHF/TRSC)
X-ray machine and metal detector Medium-term plan (2021–25) Runway overlay (1,845 m x 30 m) 55,350 m2
Long-term plan (2026–30) None
Source: KOICA Master Plan Study report (revised by JICA Study Team).
8.3 Sanga-Sanga Airport Development Project
Even though the demand generated at the Sanga-Sanga airport is small, the airport is already accommodating small jet planes of A319. Therefore, a plan has been established to develop facilities that can service small jet aircrafts regardless of demand. Accordingly, its runway needs to be expanded
L=1,820m

Comprehensive capacity development project for the Bangsamoro Sector Report 2-3: Air Transport
3-48
since it falls somewhat short of the standard runway length to service small jet aircrafts. Also, it is suggested to widen its runway to 45 m.
There is a plan to relocate the apron along with the PTB and VPA, and this should be reflected in the short-term plan. Furthermore, it is recommended that at least PAPI and wind cone be installed for daytime operation since there are no aeronautical lighting facilities at the moment.
Table 8.4 Summary of Practical Development Targets for Jolo Airport (up to 2030)
Demand/Main facility Unit Current Future Requirements
Note 2015 2020 2025 2030
Traffic Demand Annual passengers Pax. - 20,009 21,605 23,077
Annual AC movements - 378 408 444 Peak-hour passengers Pax. - 104 104 104
Peak-hour AC movements 2 2 2 2 Design Aircraft Q400 TP TP TP Approach Category Non-instrument Non-instrument Non-instrument Non-instrument Airside Facility
Runway length m 1,845 1,845 1,845 1,845 Runway width m 30 30 30 30
Runway strip width m 150 150 150 150 Taxiway system Stub Stub Stub Stub
Apron area m2 9,000 9,000 9,000 9,000 Airfield lighting None A A A RFF (category) 4 6 6 6
RESA length m 90/0 90/90 90/90 90/90 Landslide Facilities
Passenger terminal area m2 200 960 960 960 Ongoing Cargo terminal area m2 N/A - - -
Vehicle parking area m2 3,290 4,290 4,290 4,290 Ongoing R/W-T/W separation m 71.5 71.5 71.5 71.5
CNS/ATM RNA Non-instrument Non-instrument Non-instrument Non-instrument AIS CH 1/0/2 6/2/2 6/2/2 6/2/2 VHF/TRSC/HF
MET Set 1/0/0 1/0/0 1/0/0 1/0/0 WIND/RVR/CCLM Other Improvement
Runway overlay Overlay 1,845 m x 30 m Perimeter fences Complete Completed
Abbreviations: Same as Table 8.2
Source: ibid.
If the pavement conditions are found to be without any significant deficiency, runway overlay would be implemented as part of the long-term plan. X-ray machine and metal detector shall be installed to ensure the security since the passenger baggage is currently screened manually one by one at the airport. A new rescue and fire fighting vehicle has already been allocated in the distribution plan but currently not installed yet. The station shall be expanded in accordance with the number of vehicles.
Table 8.5 Development Plan by Phase for Sanga-Sanga Airport (up to 2030)
Phase Contents Scale Short-term plan Runway extension (250 m x 45 m) 11,250 m2
(2016–2020) Runway widening (1,860 m x 15 m) 11,250 m2
New apron 8,000 m2 New stub taxiway Installation of airfield lighting facilities (PAPI & wind cone) Expansion of rescue and firefighting station 230 m2 Securing RESA (both sides) New PTB 1,110 m2 New vehicle parking area 5,100 m2 Installation of aeronautical information equipment (VHF) Runway overlay (1,860 m x 30 m) 55,800 m2
Completion of fence connection New control tower X-ray machine and metal detector

Comprehensive capacity development project for the Bangsamoro Sector Report 2-3: Air Transport
3-49
Phase Contents Scale Medium-term plan Expansion of PTB 1,500 m2 (2021–2025) Long-term plan None (2026–2030)
Source: ibid.
Table 8.6 Summary of Practical Development Targets for Sanga-Sanga Airport (up to 2030)
Demand/Main facility Unit Current Future Requirements
Note 2015 2020 2025 2030
Traffic Demand Annual passengers Pax. - 31,193 38,460 45,427
Annual AC movements - 287 353 417 Peak-hour passengers Pax. - 218 218 218
Peak-hour AC movements 2 2 2 2 Design Aircraft A319 SJ SJ SJ Approach Category Non-instrument Non-instrument Non-instrument Non-instrument Airside Facility
Runway length m 1,860 2,110 2,110 2,110 Runway width m 30 45 45 45
Runway strip width m 200 200 200 200 Taxiway system Stub Stub Stub Stub New construction
Apron area m2 5,500 8,000 8,000 8,000 New construction Airfield lighting N/A A A A RFF (category) 4 6 6 6
RESA length m 0/0 90/90 90/90 90/90 Landslide Facilities
Passenger terminal area m2 240 1,110 2,600 2,600 New construction Cargo terminal area m2 N/A - - -
Vehicle parking area m2 N/A 5,100 5,100 5,100 New construction R/W-T/W separation m 26.5 93 93 93
CNS/ATM RNA Non-instrument Non-instrument Non-instrument Non-instrument AIS CH 0/0/0 6/2/2 6/2/2 6/2/2 VHF/TRSC/HF
MET Set 1/0/0 1/0/0 1/0/0 1/0/0 WIND/RVR/CCLM Other Improvement
Runway overlay Overlay 1,860m x 30m Perimeter fences Incomplete Complete
Abbreviations: Same as Table 8.2
Source: ibid.
8.4 Other Viewpoints for Airport Development
8.4.1 Airport network development project
The existing air network is linked only between the Zamboanga airport and islands airports in BaSulTa such as the Jolo and Sanga-Sanga airports (Figure 8.3). There is no air connection between the Cotabato airport and islands airports. The direct air transportation between Cotabato and BaSulTa shall be established to promote comprehensive and integrative development of Bangsamoro although historically regional economy in BaSulTa has a strong tie with Zamboanga City. Such direct air connections can be expected once Cotabato City is expanded economically comparable to Zamboanga City.
Tourist related demand for air transport is expected in Tawi-Tawi not only from other parts of the Philippines but also from neighboring countries such as Brunei, Indonesia and Malaysia since Tawi-Tawi has enormous tourism potential with beautiful scenery, majestic nature and a variety of culture. Therefore customs, immigration and quarantine (CIQ) facilities shall be equipped at the Sanga-Sanga airport in Tawi-Tawi in the future to accommodate international passengers from these and other countries. Besides, Tawi-Tawi shall be properly considered as a safe region apart from the other islands in BaSulTa.

Comprehensive capacity development project for the Bangsamoro Sector Report 2-3: Air Transport
3-50
Legend: Yellow line = Existing route; Red line = Desired future route
Source: JICA Study Team.
Figure 8.3 Airport Network Development in the Bangsamoro
8.4.2 Bangsamoro corridor development project
Regarding air logistics along the Bangsamoro corridors (Figure 8.4), it is important to utilize not only airports located in the Bangsamoro area but also airports outside the Bangsamoro area. The direct and indirect air logistics routes mentioned above which support efficient export of locally grown products to urban areas such as Metro Manila or overseas will improve the profitability of economic activities in Bangsamoro.
(1) Northern corridor
While enhancing direct air logistics routes through the Cotabato airport located in the Bangsamoro area, it is also desirable to enhance indirect air logistics routes through the Laguindingan airport outside the Bangsamoro area to revitalize the northern corridor. Agricultural products mainly from Lanao del Sur shall be considered as the prospective products for this corridor.
(2) Central corridor
While enhancing direct air logistics routes through the Cotabato airport located in the Bangsamoro area, it is also desirable to enhance indirect air logistics routes through the Davao international airport outside the Bangsamoro area to revitalize the central corridor. Agricultural products mainly from Maguindanao shall be considered as the prospective products for this corridor.
(3) Southern corridor
While enhancing direct air logistics routes through the Cotabato airport in the Bangsamoro area, it is also desirable to enhance indirect air logistics routes through the General Santos international airport outside the Bangsamoro area to revitalize the southern corridor. Marine products such as tuna caught in coastal areas of Moro Gulf shall be considered as the prospective products for this corridor.

Comprehensive capacity development project for the Bangsamoro Sector Report 2-3: Air Transport
3-51
Source: JICA Study Team.
Figure 8.4 Locations of Logistics Corridors and Some of Region’s Resources
General Santos
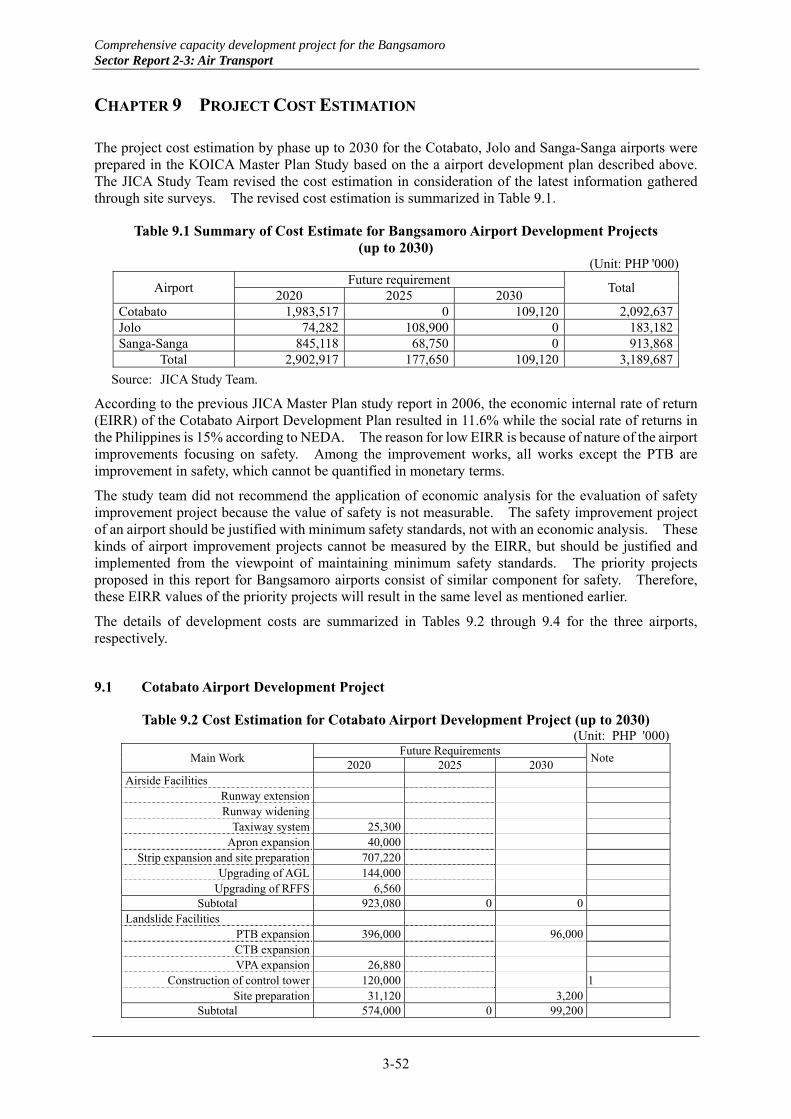
Comprehensive capacity development project for the Bangsamoro Sector Report 2-3: Air Transport
3-52
CHAPTER 9 PROJECT COST ESTIMATION
The project cost estimation by phase up to 2030 for the Cotabato, Jolo and Sanga-Sanga airports were prepared in the KOICA Master Plan Study based on the a airport development plan described above. The JICA Study Team revised the cost estimation in consideration of the latest information gathered through site surveys. The revised cost estimation is summarized in Table 9.1.
Table 9.1 Summary of Cost Estimate for Bangsamoro Airport Development Projects (up to 2030)
(Unit: PHP '000)
Airport Future requirement
Total 2020 2025 2030
Cotabato 1,983,517 0 109,120 2,092,637Jolo 74,282 108,900 0 183,182Sanga-Sanga 845,118 68,750 0 913,868
Total 2,902,917 177,650 109,120 3,189,687
Source: JICA Study Team.
According to the previous JICA Master Plan study report in 2006, the economic internal rate of return (EIRR) of the Cotabato Airport Development Plan resulted in 11.6% while the social rate of returns in the Philippines is 15% according to NEDA. The reason for low EIRR is because of nature of the airport improvements focusing on safety. Among the improvement works, all works except the PTB are improvement in safety, which cannot be quantified in monetary terms.
The study team did not recommend the application of economic analysis for the evaluation of safety improvement project because the value of safety is not measurable. The safety improvement project of an airport should be justified with minimum safety standards, not with an economic analysis. These kinds of airport improvement projects cannot be measured by the EIRR, but should be justified and implemented from the viewpoint of maintaining minimum safety standards. The priority projects proposed in this report for Bangsamoro airports consist of similar component for safety. Therefore, these EIRR values of the priority projects will result in the same level as mentioned earlier.
The details of development costs are summarized in Tables 9.2 through 9.4 for the three airports, respectively.
9.1 Cotabato Airport Development Project
Table 9.2 Cost Estimation for Cotabato Airport Development Project (up to 2030) (Unit: PHP '000)
Main Work Future Requirements
Note 2020 2025 2030
Airside Facilities Runway extension Runway widening
Taxiway system 25,300 Apron expansion 40,000
Strip expansion and site preparation 707,220 Upgrading of AGL 144,000
Upgrading of RFFS 6,560 Subtotal 923,080 0 0
Landslide Facilities PTB expansion 396,000 96,000 CTB expansion VPA expansion 26,880
Construction of control tower 120,000 1 Site preparation 31,120 3,200
Subtotal 574,000 0 99,200

Comprehensive capacity development project for the Bangsamoro Sector Report 2-3: Air Transport
3-53
Main Work Future Requirements
Note 2020 2025 2030
CNS/ATM RNA 128,082 AIS 34,247
MET Subtotal 162,329 0 0
Other Improvements Runway overlay 139,788
Completion of fences 4,000 X-ray machine and metal detector
Subtotal 143,788 0 0 Contingency (10%) 180,320 0 9,920
Total Construction Cost 1,983,517 0 109,120 Abbreviations: AGL = aeronautical ground lighting, RFFS = rescue and firefighting station, PTB = passenger terminal building, CTB = cargo terminal building, VPA = vehicle parking area, CNS/ATM = communication navigation and surveillance/air traffic management, RNA = radio navigational aid, AIS = aeronautical information service, MET = meteorological facilities 1To be carried out by Airport Infrastructure Program of DOTC
Source: KOICA Master Plan Study report (revised by JICA Study Team).
9.2 Jolo Airport Development Project
Table 9.3 Cost Estimation for Jolo Airport Development Project (up to 2030) (Unit: '000 PHP)
Main Work Future Requirements
Note 2020 2025 2030
Airside Facilities Runway extension Runway widening
Taxiway system Apron expansion
Strip expansion and site preparation 10,000 1 Upgrading of AGL 4,000
Upgrading of RFFS 6,000 Subtotal 20,000 0 0
Landslide Facilities PTB expansion 5,000 1 CTB expansion VPA expansion 1,650 1
Construction of control tower Site preparation
Subtotal 6,650 0 0 CNS/ATM
RNA AIS 36,879
MET Subtotal 36,879 0 0
Other Improvements Runway overlay 99,000
Completion of fences X-ray machine and metal detector 4,000 2
Subtotal 4,000 99,000 0 Contingency (10%) 6,753 9,900 0
Total Construction Cost 74,282 108,900 0 Abbreviations: Same as Table 9.2 1To be carried out by Airport Infrastructure Program of DOTC; 2Cost estimated from similar projects in the Philippines
Source: ibid.

Comprehensive capacity development project for the Bangsamoro Sector Report 2-3: Air Transport
3-54
9.3 Sanga-Sanga Airport Development Project
Table 9.4 Cost Estimation for Sanga-Sanga Airport Development Project (up to 2030) (Unit: '000 PHP)
Main Work Future Requirements
Note 2020 2025 2030
Airside Facilities Runway extension 56,250 Runway widening 111,600 1
Taxiway system 10,000 1 Apron expansion 32,000 1
Strip expansion and site preparation 93,020 1 Upgrading of AGL 16,625
Upgrading of RFFS 9,200 Subtotal 328,695 0 0
Landslide Facilities PTB expansion 91,250 59,600 1 (2020) CTB expansion VPA expansion 30,000 1
Construction of control tower 25,000 2 Site preparation 12,420 2,900
Subtotal 158,670 62,500 0 CNS/ATM
RNA AIS 48,784
MET Subtotal 48,784 0 0
Other Improvements Runway overlay 184,140
Completion of fences 44,000 2 X-ray machine and metal detector 4,000 3
Subtotal 232,140 0 0 Contingency (10%) 76,829 6,250 0
Total Construction Cost 845,118 68,750 0 Abbreviations: Same as Table 9.2. 1To be carried out by Airport Infrastructure Program in 2015 of DOTC; 2Based on the proposed Airport Infrastructure Program of DOTC; 3Based on a similar project in the Philippines
Source: ibid.

Comprehensive capacity development project for the Bangsamoro Sector Report 2-4: River and Flood Control
Comprehensive Capacity Development Project for the Bangsamoro
Development Plan for the Bangsamoro
Final Report
Sector Report 2-4: River and Flood Control

Comprehensive capacity development project for the Bangsamoro Sector Report 2-4: River and Flood Control
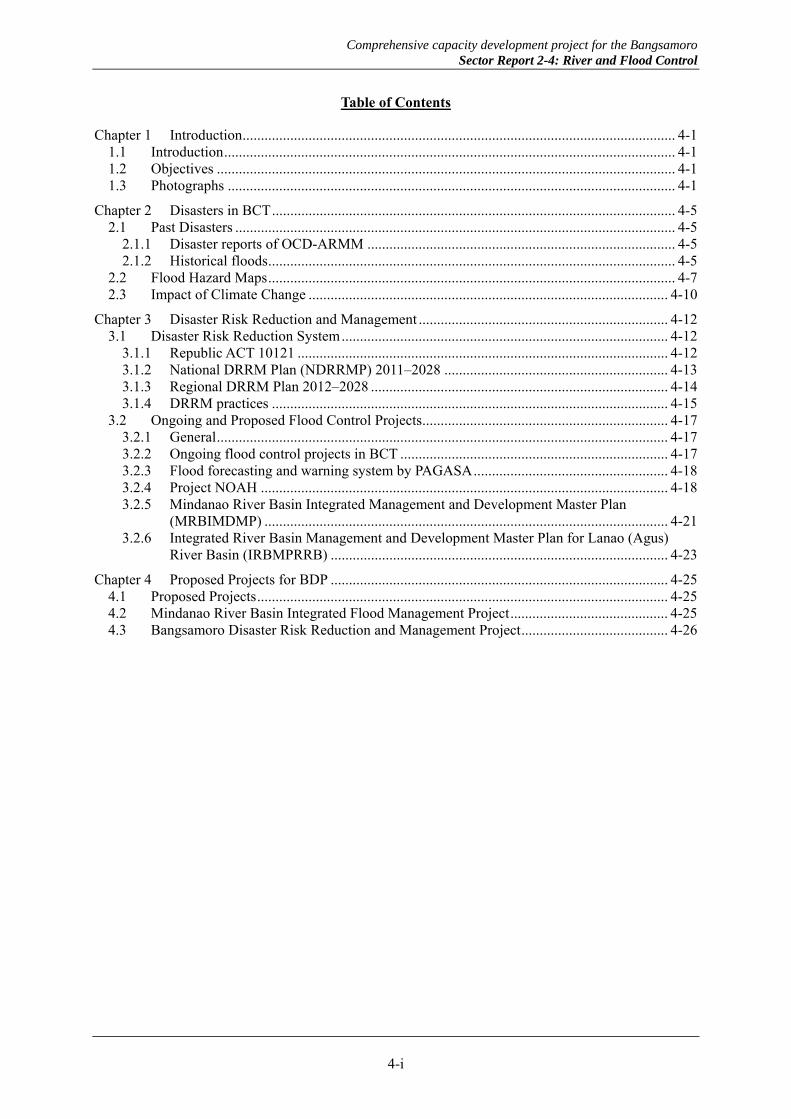
Comprehensive capacity development project for the Bangsamoro Sector Report 2-4: River and Flood Control
4-i
Table of Contents
Chapter 1 Introduction ...................................................................................................................... 4-1 1.1 Introduction ........................................................................................................................... 4-1 1.2 Objectives ............................................................................................................................. 4-1 1.3 Photographs .......................................................................................................................... 4-1
Chapter 2 Disasters in BCT .............................................................................................................. 4-5 2.1 Past Disasters ........................................................................................................................ 4-5
2.1.1 Disaster reports of OCD-ARMM .................................................................................... 4-5 2.1.2 Historical floods ............................................................................................................... 4-5
2.2 Flood Hazard Maps ............................................................................................................... 4-7 2.3 Impact of Climate Change .................................................................................................. 4-10
Chapter 3 Disaster Risk Reduction and Management .................................................................... 4-12 3.1 Disaster Risk Reduction System ......................................................................................... 4-12
3.1.1 Republic ACT 10121 ..................................................................................................... 4-12 3.1.2 National DRRM Plan (NDRRMP) 2011–2028 ............................................................. 4-13 3.1.3 Regional DRRM Plan 2012–2028 ................................................................................. 4-14 3.1.4 DRRM practices ............................................................................................................ 4-15
3.2 Ongoing and Proposed Flood Control Projects ................................................................... 4-17 3.2.1 General ........................................................................................................................... 4-17 3.2.2 Ongoing flood control projects in BCT ......................................................................... 4-17 3.2.3 Flood forecasting and warning system by PAGASA ..................................................... 4-18 3.2.4 Project NOAH ............................................................................................................... 4-18 3.2.5 Mindanao River Basin Integrated Management and Development Master Plan
(MRBIMDMP) .............................................................................................................. 4-21 3.2.6 Integrated River Basin Management and Development Master Plan for Lanao (Agus)
River Basin (IRBMPRRB) ............................................................................................ 4-23
Chapter 4 Proposed Projects for BDP ............................................................................................ 4-25 4.1 Proposed Projects ................................................................................................................ 4-25 4.2 Mindanao River Basin Integrated Flood Management Project ........................................... 4-25 4.3 Bangsamoro Disaster Risk Reduction and Management Project ........................................ 4-26

Comprehensive capacity development project for the Bangsamoro Sector Report 2-4: River and Flood Control
4-ii
List of Tables
Table 2.1 Summary of Disaster Reports of OCD-ARMM for Three Flood Events ............................. 4-5 Table 2.2 Flood Damages in ARMM and Cotabato City by Typhoon Frank in 2008 .......................... 4-6 Table 2.3 Natural Disaster Damages in ARMM, 2010–2011 ............................................................... 4-7 Table 2.4 Flood Hazard Maps .............................................................................................................. 4-7 Table 2.5 Susceptibility of Municipalities/Cities in MRB to Various Disasters ................................... 4-8 Table 2.6 Possible Causes of Floods in Mindanao River Basin (MRB) ............................................... 4-9 Table 3.1 Lead Agency, Outcome and Key Result Areas of Each Area of DRRM System ............... 4-14 Table 3.2 ARMM Regional DRRM Plan ........................................................................................... 4-15 Table 3.3 Summary of Checklist of Selected LGUs in MRB ............................................................. 4-16 Table 3.4 Major Flood Control Projects for BDP Phase 1 ................................................................. 4-17 Table 3.5 Proposed Flood Forecasting and Warning System ............................................................. 4-18 Table 3.6 Progress of Project NOAH for BCT as of February 2015 .................................................. 4-20 Table 3.7 MRBIMDMP Development Matrix for Flood and Disaster Risk Management ................. 4-21 Table 3.8 Proposed Projects for Disaster Risk Reduction and Climate Change Adaptation Program 4-24 Table 4.1 Eight Sub-Projects of Mindanao River Basin Integrated Flood Management ................... 4-25 Table 4.2 Features of Bangsamoro Disaster Risk Reduction and Management Project..................... 4-26

Comprehensive capacity development project for the Bangsamoro Sector Report 2-4: River and Flood Control
4-iii
List of Figures
Figure 2.1 Flood Areas around Cotabato City Caused by Typhoon Frank in 2008 .............................. 4-6 Figure 2.2 Flood and Landslide Susceptibility Map by MGB ............................................................. 4-8 Figure 2.3 Flood Area Map by MRBIMDMP (100-year Return Period) ............................................. 4-9 Figure 2.4 River Course Change of Allah River ................................................................................ 4-10 Figure 3.1 Organizational Chart of National DRRM Council ............................................................ 4-12 Figure 3.2 Organizational Structure of Regional and Local DRRM Councils ................................... 4-13 Figure 3.3 Four Thematic Areas of Philippine DRRM System .......................................................... 4-13 Figure 3.4 NOAH Website ................................................................................................................. 4-19 Figure 3.5 Mindanao River Basin ...................................................................................................... 4-21 Figure 3.6 Lanao (Agus) River Basin ................................................................................................ 4-24

Comprehensive capacity development project for the Bangsamoro Sector Report 2-4: River and Flood Control
4-iv
Abbreviations, Unit of Measurement, and Currency
(Refer to Sector Report 2-1: Road Transport, pp. 1-v through 1-x.)

Comprehensive capacity development project for the Bangsamoro Sector Report 2-4: River and Flood Control
4-1
CHAPTER 1 INTRODUCTION
1.1 Introduction
The Bangsamoro Core Territory (BCT) is susceptible to various disasters, such as flood, landslide, storm surge, earthquake, volcanic eruption, tsunami, and drought. Particularly, flood and landslide are perennial disasters that have hampered the development of the region. The river and flood control sector is to first clarify the present situation and then to propose strategies for the enhancement of disaster risk reduction and management (DRRM) for the region.
1.2 Objectives
The objectives of the survey on river and flood control sector are as follows:
- To identify the existing flood conditions; - To identify the existing capacity of the BCT for DRRM, especially for flood control; and based
on the above - To propose strategies for developing the DRRM capacity of the BCT.
1.3 Photographs
Photographs taken during the field surveys are presented below to show key features of Bangsamoro related to rivers and flood control.
Rio Grande de Mindanao upstream of Delta Bridge (May 30, 2015)
Rio Grande de Mindanao downstream of Delta Bridge (May 30, 2015)
Tamontaka River upstream of Tamontaka Bridge (January 27, 2015)
Tamontaka River downstream of Tamontaka Bridge (January 27, 2015)
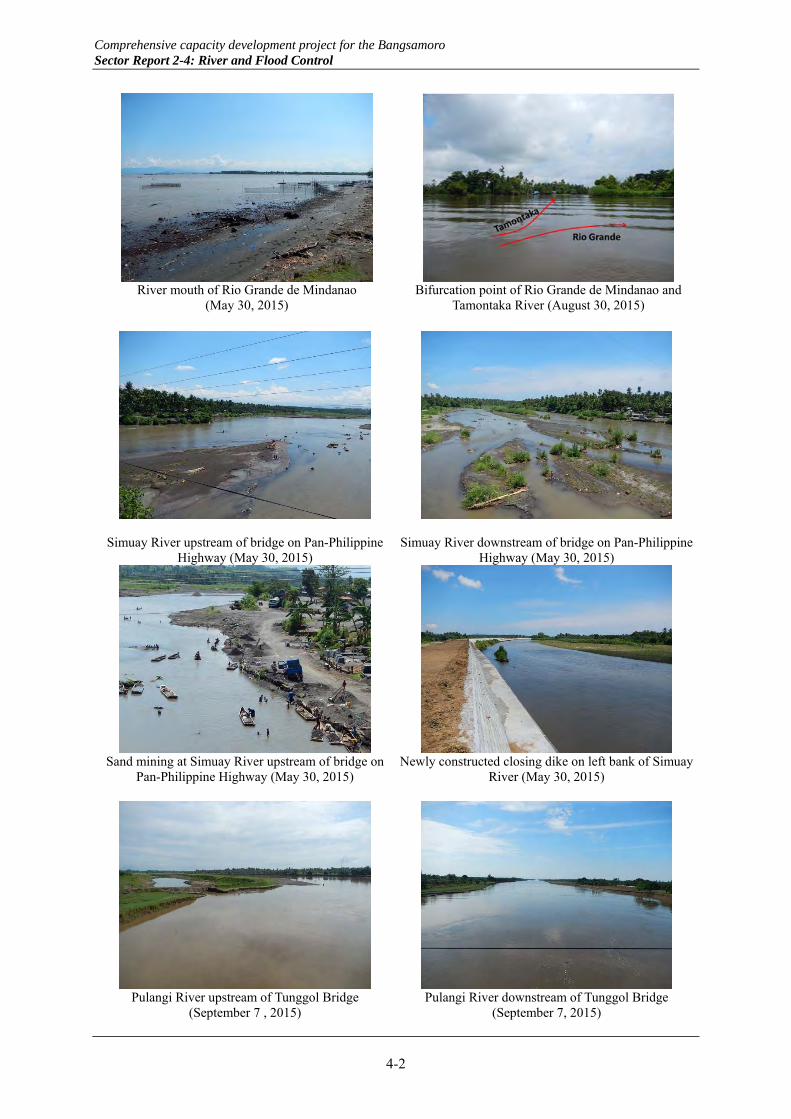
Comprehensive capacity development project for the Bangsamoro Sector Report 2-4: River and Flood Control
4-2
River mouth of Rio Grande de Mindanao (May 30, 2015)
Bifurcation point of Rio Grande de Mindanao and Tamontaka River (August 30, 2015)
Simuay River upstream of bridge on Pan-Philippine
Highway (May 30, 2015) Simuay River downstream of bridge on Pan-Philippine
Highway (May 30, 2015)
Sand mining at Simuay River upstream of bridge on Pan-Philippine Highway (May 30, 2015)
Newly constructed closing dike on left bank of Simuay River (May 30, 2015)
Pulangi River upstream of Tunggol Bridge (September 7 , 2015)
Pulangi River downstream of Tunggol Bridge (September 7, 2015)

Comprehensive capacity development project for the Bangsamoro Sector Report 2-4: River and Flood Control
4-3
Telemetered water-level and rainfall censors of Project NOAH on Tunggol Bridge (September 7, 2015)
Tentative protection work of left abutment of Tunggol Bridge (September 7, 2015)
Buluan River upstream of bridge on Isulan–Tacurong City Road (September 7, 2015)
Buluan River downstream of bridge on Isulan–Tacurong City Road (September 7, 2015)
Lake Buluan (September 7, 2015) Water hyacinth on Lake Buluan (September 7, 2015)
Destroyed Pan-Philippine Highway near Lambayong by course change on Ala River (September 7, 2015)

Comprehensive capacity development project for the Bangsamoro Sector Report 2-4: River and Flood Control
4-4
Banga River upstream of Kapingkong Bridge (September 7, 2015)
Banga River downstream of Kapingkong Bridge (September 7, 2015)
Ala River upstream of bridge on Isulan–Shariff Aguak Road (September 7, 2015)
Ala River downstream of bridge on Isulan–Shariff Aguak Road (September 7, 2015)

Comprehensive capacity development project for the Bangsamoro Sector Report 2-4: River and Flood Control
4-5
CHAPTER 2 DISASTERS IN BCT
2.1 Past Disasters
2.1.1 Disaster reports of OCD-ARMM
The Office of Civil Defense (OCD-ARMM) prepares disaster reports for every disaster event, and submits them to the OCD Central Office. However, historic statistic data have not been compiled yet as only in 2013 the report template was drafted by the OCD Central Office. OCD-ARMM started to prepare disaster reports of the main land provinces in 2014, following the draft template. Its satellite office in Zamboanga prepares disaster reports of the island provinces and submits them directly to the Central Office.
Table 2.1 is a summary of the disaster reports for three flood events in 2014. Unfortunately, there is no disaster event record of the island provinces in the reports for the reason mentioned above. According to staff of OCD-ARMM, main disasters in the region are flood and landslide, and the two mainland provinces, Maguindanao and Lanao del Sur are more susceptible to disasters than the three island provinces, Sulu, Balisan and Tawi Tawi.
Table 2.1 Summary of Disaster Reports of OCD-ARMM for Three Flood Events
Disaster Event Affected Municipalities Casualties Affected people
Damage to houses and infrastructures
Agricultural loss
Note
Flood in Maguindanao Province (June 13 to July 9, 2014)
Mamasapano, Datu Salibo, Shariff Saydona1, Datu Piang1, Sultan sa Barongis, Rajah Buayan1, Datu Abdulah Sangki, Mother Kabuntalan, Northern Kabuntalan, Ampatuan, Datu Montawal, Pagalungan, Datu Odin Sinsuat, Sultan Kudarat, General Salipada K. Pendatun (GSKP), Sultan Mastura, Mangudadatu, Buluan, Pandag, Talitay, Buldon, Barira
1 dead, No missing, No injured
32,001 families/ 160,005 individuals
No damage reported
PHP 43 million 8,303 ha affected. No reported livestock or fishery damage
State of Calamity was declared for Maguindanao Province on June 19 and released on June 23
Flash Flood in North Upi of Maguindanao Province (6/13–7/9/ 2014)
North Upi of Maguindanao No Casualties95 families/ 137 individuals
3 houses totally and 7 houses partially damaged.
2 ha of corn farm No Declaration of State of Calamity
Flood in Maguindanao Province (August 25 to September 9, 2014)
Ampatuan, Buldon, Datu Montawal, Mamasapano, Pagalungan, Paglat, Shariff Saydona Mustapha, Sultan Kudarat, Sultan Mastura, Sultan Sa Barongis, North Upi, South Upi, Northern Kabuntalan, Mother Kabuntalan, Datu Salibo, Rajah Buayan, Datu Abdullah Sangki, Talitay, Magudadatu, Pandag, Buluan, General Salipada K. Pendatun (GSKP), Datu Piang, Datu Odin Sinsuat, Datu Hoffer, Talayan*
5 dead and 4 injured by flash flood and landslide in North Upi
35,930 families/ 176,355 individuals
11 houses totally damaged and 3 houses partially damaged. A primary school destroyed by landslide A number of properties were damaged due to tornado incident at Barangay Magsaysay, Parang Maguindanao
PHP 45 million 8,784 ha affected
A state of Calamity was declared for Kudarat Municipality on Sep. 9, for Kabuntalan Municipality on Sep. 8 and for Pagalungan Municipality on Aug. 29
Source: OCD-ARMM.
2.1.2 Historical floods
Flooding in the BCT is usually associated with the occurrence of typhoons, thunderstorms and/or monsoon rains. In particular, Typhoon Frank in 2008 triggered massive inundations in the provinces of Cotabato, South Cotabato and Sultan Kudarat (all in Region XII) and in the provinces of Lanao del Sur and Maguindanao (both in ARMM). Table 2.2 shows flood damages in the BCT according to the National Disaster Coordinating Council (NDCC), the forerunner of the National Disaster Risk Reduction and Management Council (NDRRMC). A total of 46 people were killed, and 554,262 people in 490 barangays were affected.
According to officials of DPWH, the Simuay River changed its main course from west to south, namely to the Rio Grande de Mindanao (the Mindanao River) during the flood. This course change not only caused flooding over the Sultan Kudarat municipality of Maguindanao province but also brought about

Comprehensive capacity development project for the Bangsamoro Sector Report 2-4: River and Flood Control
4-6
siltation of sediments in the river channel of the Rio Grande de Mindanao. Moreover, water hyacinth flowing from the upstream was caught and accumulated at the new Delta Bridge and clogged the river channel. The siltation and the clogging raised the river water level, resulting in overflow into Cotabato City and Sultan Kudarat.
Table 2.2 Flood Damages in ARMM and Cotabato City by Typhoon Frank in 2008
Province/City Population
(as of August 2007)No. of affected
Barangays Affected population(% of population)
No. of dead/missing
Maguindanao 1,273,725 279 311,379 (24.4%) 43 Lanao del Sur 1,138,544 176 138,693 (12.2%) 0 Tawi-Tawi 450,346 5 450 (0.1%) 0 Basilan 408,520 5 1,475 (0.4%) 0 Sulu 849,670 0 0 (0%) 0 Cotabato City 259,153 25 102,265 (39.5) 3
Total 4,379,948 490 554,262 (12.6%) 46
Source: NDDC-OCD.
In 2009, Typhoon Jolina displaced 15,000 families and inundated nearly all the barangays in Cotabato City (36 out of 37 barangays). For weeks, large tract of farmlands were submerged causing massive losses in agricultural productivity and income.
From May to June 2011, moderately heavy rain caused massive flooding in 31 of the 37 barangays in Cotabato City, and seven municipalities of Maguindanao were under 5-feet of flood. In Lanao del Sur, inundation reached knee-deep in six municipalities. The Regional Disaster and Risk Reduction Management Council (RDRRMC) reported that about 75% of the houses and farmlands in Cotabato City and nearby environs were submerged for several weeks. Among those greatly affected were those in low-lying areas (floodplains) and near the major rivers of the Mindanao River Basin.
During the 2011 flood, water hyacinth became one of the most troublesome issue again. Accumulation of water hyacinth under the Delta Bridge and on the Tamontaka River contributed to the flood. The one under the Delta Bridge reached an estimated area of 16 ha, which was double its size three years before during the onslaught of Typhoon Frank in 2008. As a solution to the water hyacinth problem, its utilization as materials for handicraft, feed, fertilizer, bio-energy, and other purposes is being promoted by the private sector in cooperation with DPWH and local government units (LGUs).
Major natural disasters that hit the region in 2010–2011and their damages are summarized in Table 2.3.
Figure 2.1 Flood Areas around Cotabato City Caused by Typhoon Frank in 2008
Photo 1: Accumulation of water hyacinth under Delta Bridge on Rio de Grande River in June 2011

Comprehensive capacity development project for the Bangsamoro Sector Report 2-4: River and Flood Control
4-7
Table 2.3 Natural Disaster Damages in ARMM, 2010–2011
Type of disaster Date Affected population Affected areas
Flash flood June 2010 9,388 families 40,000 persons
Maguindanao Province (10 barangays)
Flash flood January 2011 11,816 families 59,080 persons
Maguindanao Province (26 barangays)
Flash flood February 2011 553 families Sulu Province (4 coastal barangays)
Flood May–June 2011 53,188 families 324,261 persons
Maguindanao Province (168 barangays)
Flood May–June 2011 10,263 families 51,315 persons
Sulu (9 barangays)
Typhoon Sendong December 15–16, 2011 27,357 families 138,504 persons
Maguindanao Province (15 barangays)
Source NDRRMC.
2.2 Flood Hazard Maps
There are available susceptibility maps of flood and landslide by the Mining and Geo-science Bureau (MGB) of DENR, as shown in Figure 2.2. From the map, it can be observed that there is a huge extensive flood area along the Rio Grande de Mindanao (the lowest part of the Mindanao River) and in the marsh areas, and landside areas are also extensive in the south-western areas of Maguindanao and the western and south-western areas of the Lake Lanao. It is also seen that the island provinces are less disaster-prone than the mainland provinces except for flood areas around the coast of Sulu and landslide areas in Basilan.
This map, based on the 1/50,000 NAMRIA maps, is useful to generally understand potential disasters in the region, but it might be too coarse to be used for practical disaster risk reduction and management such as preparation of evacuation plan, land-use planning, etc.
Figure 2.3 is a flood area map of the 100-year return period prepared under the Mindanao River Basin Integrated Management and Development Master Plan (MRBIMDMP). Under the master plan study, flood area maps of 5, 10, 25 and 50-year return periods were also prepared.
Recently more detailed flood hazard maps are being prepared by MGB and the Project NOAH (Nationwide Operational Assessment of Hazards) as presented in Table 2.4. They are all based on high-resolution maps, and are expected to be more practically used for the disaster risk reduction and management.
Table 2.4 Flood Hazard Maps
Map Target area Produced by Base map resolution Present status Flood Susceptibility Map Whole Country MGB, DENR 1/50,000 Published Landslide Susceptibility Map Whole Country MGB, DENR 1/10,000 (IFSAR) Published
Potential flood Area Map Mindanao River Basin
MRBIMDMP GDEM (global digital elevation model) by
NASA in 2007 Published
Flood Susceptibility Map Whole Country MGB, DENR 1/10,000 (IFSAR) Under preparationLandslide Susceptibility Map Whole Country MGB, DENR 1/10,000 (IFSAR) Under preparation
Flood Hazard Map Mindanao River Basin
Project NOAH 1/10,000 (IFSAR) and
additional LiDAR survey data
Under preparation
Landslide Hazard Map Whole Country Project NOAH 1/10,000 (IFSAR) Under preparationStorm Surge Hazard Map Whole Country Project NOAH 1/10,000 (IFSAR) Under preparation
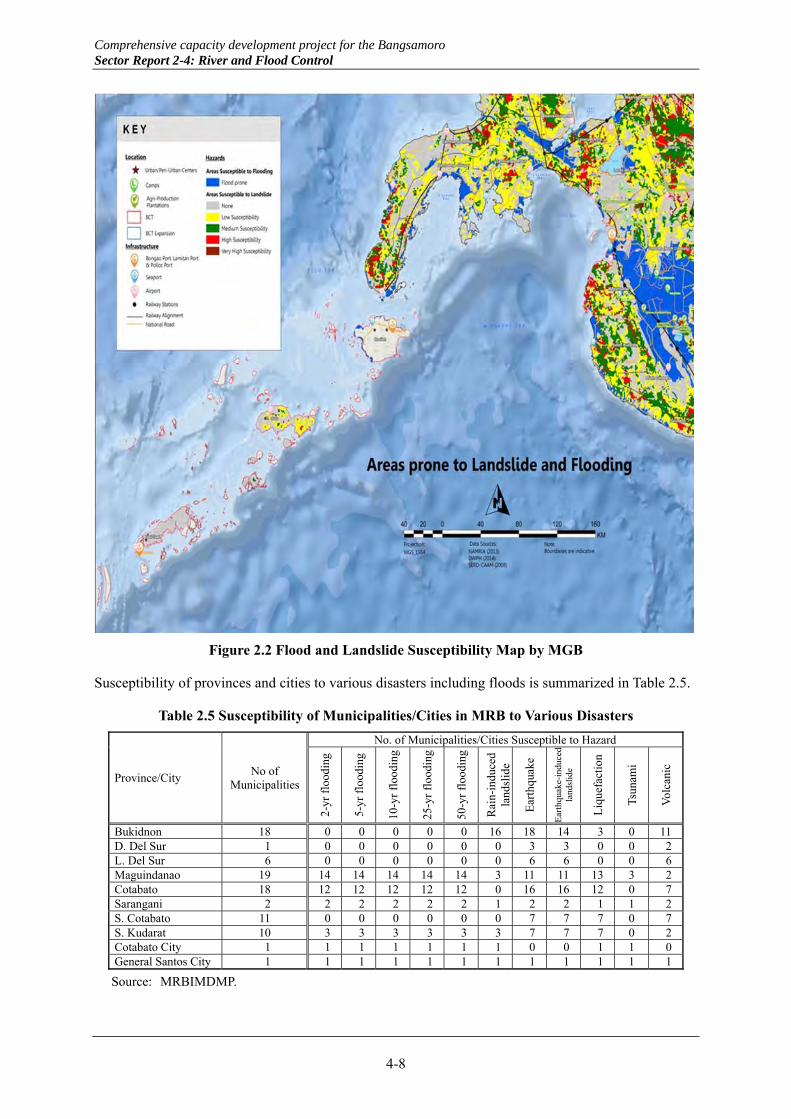
Comprehensive capacity development project for the Bangsamoro Sector Report 2-4: River and Flood Control
4-8
Figure 2.2 Flood and Landslide Susceptibility Map by MGB
Susceptibility of provinces and cities to various disasters including floods is summarized in Table 2.5.
Table 2.5 Susceptibility of Municipalities/Cities in MRB to Various Disasters
Province/City No of
Municipalities
No. of Municipalities/Cities Susceptible to Hazard
2-yr
flo
odin
g
5-yr
flo
odin
g
10-y
r fl
oodi
ng
25-y
r fl
oodi
ng
50-y
r fl
oodi
ng
Rai
n-in
duce
d la
ndsl
ide
Ear
thqu
ake
Ear
thqu
ake-
indu
ced
land
slid
e
Liq
uefa
ctio
n
Tsun
ami
Vol
cani
c
Bukidnon 18 0 0 0 0 0 16 18 14 3 0 11D. Del Sur 1 0 0 0 0 0 0 3 3 0 0 2L. Del Sur 6 0 0 0 0 0 0 6 6 0 0 6Maguindanao 19 14 14 14 14 14 3 11 11 13 3 2Cotabato 18 12 12 12 12 12 0 16 16 12 0 7Sarangani 2 2 2 2 2 2 1 2 2 1 1 2S. Cotabato 11 0 0 0 0 0 0 7 7 7 0 7S. Kudarat 10 3 3 3 3 3 3 7 7 7 0 2Cotabato City 1 1 1 1 1 1 1 0 0 1 1 0General Santos City 1 1 1 1 1 1 1 1 1 1 1 1
Source: MRBIMDMP.

Comprehensive capacity development project for the Bangsamoro Sector Report 2-4: River and Flood Control
4-9
Figure 2.3 Flood Area Map by MRBIMDMP (100-year Return Period)
Possible causes of flood in the Mindanao River Basin (MRB), based on the findings of previous studies are summarized in Table 2.6.
Table 2.6 Possible Causes of Floods in Mindanao River Basin (MRB)
Cause of Floods Description Poor flow capacity Poor flow capacities of shallow, gentle and meandering river channels of the Mindanao River and
its tributaries are one of the major cause of flooding. Heavy erosion and siltation
Erosion is likely to occur due to the steep slope, no vegetation, and poorly consolidated or compacted sediments in the MRB. Eroded sediment is transported downstream and makes shallow the river beds.
River course change Heavy erosion and siltation can even change river courses in the BCT as the case of the Simuay River. Another example of the Allah River is as follows.

Comprehensive capacity development project for the Bangsamoro Sector Report 2-4: River and Flood Control
4-10
Cause of Floods Description The denuded upper mountains and hills in the Allah River basin, the pyroclastic materials from previous eruptions of Mt. Parker and the rich farmlands of Banga, Isulan, Tacurong and Koronadal contribute to the major problem of siltation that has caused the perennial inundation of its flood plains where most of the populated centers and agricultural fields are located. The major storms of 2008 and 2009 have caused the river to change its course five times. In May 2011, the entire river diverted towards Barangay Tinumiguez at Lambayong, Sultan Kudarat and destroyed over 2,000 hectares of rice field and flowed through a 4 km stretch of the Lambayong-Marbel road. In 2009, the diversion of the river course to the populated area of Lambayong imperiled the residents. (see Figure 4)
Water Hyacinth The presence of water hyacinth (an indication of the poor water quality) which had been carried downstream from the Ligawasan Marsh caused the clogging of the Tamontaka River and the Rio Grande de Mindanao and consequently caused the great flood disaster in June 2011. The water hyacinth stretched nearly 8 km and had an estimated depth of nearly 5 m.
2.3 Impact of Climate Change
The impact of climate change is a common concern of all mankind, but the situation is more serious for the Philippine people, who have been hit so often recently by extreme flood catastrophes, Tropical Strom Ondoy in 2009, Typhoon Pablo and Tropical Storm Sendong in 2012, and Typhoon Yolanda in 2013, etc.
Box 1 presents climate projections in 2020 and 2050 for the mainland provinces of ARMM by PAGASA. Box 2 is an extract on Asia Region from the Chapter 24 of Impact, Adaptation and Vulnerability: Climate Change 2014 by the Working Group II of IPCC. According to them, the frequency of extremely heavy rainfall will increase, and precipitation will likely be more extreme near the centers of tropical cyclones causing landslides and future increases in precipitation extremes related to the monsoon are also very likely. Therefore, rain-induced hazards such as flood and landslide will likely increase in the future.
Figure 2.4 River Course Change of Allah River

Comprehensive capacity development project for the Bangsamoro Sector Report 2-4: River and Flood Control
4-11
Box 1: Climate Projections in 2020 and 2050 in Provinces in ARMM by PAGASA
The projected seasonal temperature increase, seasonal rainfall change and frequency of extreme events in 2020 and 2050 under the medium-range emission scenario in the provinces in ARMM are presented in Table a, Table b and Table c, respectively.
Source: http://pagasa.dost.gov.ph/index.php/component/content/category/116-climate-change-in-the-
philippines
Box 2: Projected Climate Change for Asia Region quoted from IPCC 5th Assessment Report
24.3.2. Projected Climate Change
24.3.2.1. Tropical and Extra-tropical Cyclones
The future influence of climate change on tropical cyclones is likely to vary by region, but there is low confidence in region-specific projections of frequency and intensity. However, better process understanding and model agreement in specific regions indicate that precipitation will likely be more extreme near the centers of tropical cyclones making landfall in West, East, South, and Southeast Asia (see WGI AR5 Sections 14.6, 14.8.9-12). There is medium confidence that a projected poleward shift
in the North Pacific storm track of extra-tropical cyclones is more likely than not. There is low confidence in the magnitude of regional storm track changes and the impact of such changes on regional surface climate (see WGI AR5 Section 14.6).
24.3.2.2. Monsoons
Future increases in precipitation extremes related to the monsoon are very likely in East, South, and Southeast Asia (see WGI AR5 Sections 14.2.1, 14.8.9, 14.8.11-12). More than 85% of CMIP5 models show an increase in mean precipitation in the East Asian summer monsoons, while more than 95% of models project an increase in heavy precipitation events (see WGI AR5 Section 14.2.2, Figure 14.4). All models and all scenarios project an increase in both the mean and extreme precipitation in the Indian summer monsoon (see WGI AR5 Section 14.2.2 and Southern Asia (SAS) in Figure 14.4). In these two regions, the inter-annual standard deviation of seasonal mean precipitation also increases (see WGI AR5 Section 14.2.2).
Source: Chapter 24, Impact, Adaptation and Vulnerability: Climate Change 2014, by IPCC Working Group II.

Comprehensive capacity development project for the Bangsamoro Sector Report 2-4: River and Flood Control
4-12
CHAPTER 3 DISASTER RISK REDUCTION AND MANAGEMENT
3.1 Disaster Risk Reduction System
3.1.1 Republic ACT 10121
In response to the phenomena of disasters and extreme events, the Philippine Government passed a major legislation: Philippine Disaster Risk Reduction and Management Act of 2010 or RA 10121. This act aims to transform the Philippines’ disaster management system from disaster relief and response towards disaster risk reduction and management (DRRM). The National Disaster Risk Reduction and Management Council (NDRRMC) has been given the mandate to craft and implement the National DRRM Framework and Plan which utilizes the multi-hazard approach in managing the impact of natural and human-induced disasters.
RA 10121 supersedes the three-decade old Presidential Decree (PD) 1566, which established the National Disaster Coordinating Council (NDCC) and previous disaster risk management system in the Country, which was primarily focused on post-disaster response. In adherence to the Philippine Constitution and to international commitments, RA 10121 calls for the development of a National DRRM Framework that provides for a “comprehensive, all-hazards, multi-sectoral, inter-agency, and community-based approach to disaster risk reduction and management.”
RA 10121 promotes a holistic approach to minimize the socio-economic and environmental impacts of disasters and to mainstream DRRM and climate change adaptation (CCA) into development processes. It encourages the involvement and participation of local communities, civil society organizations (CSOs), private sector, and volunteers to utilize their resources and facilities for the protection of life and preservation of properties.
RA 10121 has several salient provisions that underpin the long-term resilience of the Philippines to natural hazards. In terms of participation of stakeholders, the law expanded the membership of NDRRMC from the former NDCC set-up which was mainly composed of the government’s line departments. NDRRMC is now composed of a Chairperson, four Vice- Chairpersons, and 39 members including representatives of four CSOs and one from the private sector as shown Figure 3.1. Corresponding to NDRRMC at the national level, DRRMCs were also organized at the Regional, Provincial, City and Municipal levels. Figure 3.2 presents the organizations of Regional and Local (City and Municipal) DRRMCs.
Another salient provision is the establishment of permanent Local DRRM Offices in every province, city, and municipality. The primary mandate of the Local DRRM Offices is to set the direction, development, implementation, and coordination of DRRM programs within their territorial jurisdictions.
Under RA 10121, the former Local Calamity Fund under PD 1566 is now known as the Local DRRM Fund (LDRRMF). Not less than 5% of the estimated revenues from regular sources will be set aside as the LDRRMF to support DRRM activities such as pre-disaster preparedness programs including training, purchasing life-saving rescue equipment, supplies, and medicines; post-disaster activities; and payment of premiums on calamity insurance. Of the amount appropriated for the LDRRMF, 30% will be allocated as quick response fund (QRF) or stand-by fund for relief and recovery programs in calamities, epidemics, or complex emergencies, which may be normalized as quickly as possible.
National DRRM Council (NDRRMC)
Figure 3.1 Organizational Chart of National DRRM Council

Comprehensive capacity development project for the Bangsamoro Sector Report 2-4: River and Flood Control
4-13
Regional DRRM Council, ARMM Local DRRM Council (LDRRMC)
Figure 3.2 Organizational Structure of Regional and Local DRRM Councils
3.1.2 National DRRM Plan (NDRRMP) 2011–2028
NDRRMP fulfills the requirement of RA 10121 of 2010, which provides the legal basis for policies, plans and programs to deal with disasters. The plan covers four thematic areas (Figure 3.3), namely, 1) Disaster Prevention and Mitigation; 2) Disaster Preparedness; 3) Disaster Response; and 4) Disaster Rehabilitation and Recovery, which correspond to the structure of the National Disaster Risk Reduction and Management Council (NDRRMC). For each thematic area, a lead agency is designated as shown in Table 3.1. OCD is responsible for not only implementing NDRRMP but also ensuring that the physical framework and social, economic, and environmental plans for communities, cities, municipalities, and provinces are consistent with the plan.
Figure 3.3 Four Thematic Areas of Philippine DRRM System

Comprehensive capacity development project for the Bangsamoro Sector Report 2-4: River and Flood Control
4-14
Table 3.1 Lead Agency, Outcome and Key Result Areas of Each Area of DRRM System
Area Lead
agency Outcome Key result area
Prevention and Mitigation
DOST
Avoid hazards and mitigate their potential impacts by reducing vulnerabilities and exposure and enhancing capacities of communities
- Mainstreamed and integrated DRR & CCA in national, sectoral, regional and local development, policies, plans, and budget.
- DRRM & CCA-sensitive environmental management. - Increased disaster resiliency of infrastructure systems. - Community-based and scientific DRR & CCA assessment,
mapping, analysis, and monitoring. - Risk transfer mechanisms
Preparedness DILG
Establish and strengthen capacities of communities to anticipate, cope and recover from the negative impacts of emergency occurrences & disasters
- Community awareness and understanding of risk factors - Contingency planning at the local level (including incident
command system, early warning systems, preemptive evacuation, stockpiling, and equipping)
- Local drills and simulation exercises - National disaster response planning
Response DSWD
Provide life preservation and meet the basic subsistence needs of affected population based on acceptable standards during or immediately after a disaster
- Damage and needs assessment - Relief operations - Search, rescue, and retrieval - Dissemination & sharing of disaster-related information - Water, sanitation, and health - Development & provision of temporary shelter - Mental & social support - Early recovery mechanism - Management of dead and missing - Evacuation management - Social protection intervention - Civil & uniformed services coordination
Rehabilitation & Recovery
NEDA
Restore and improve facilities, livelihood and living conditions and organizational capacities of affected communities, and reduced disaster risks in accordance with the building back better principle
- Livelihood - Shelter - Infrastructure
Source: NDRRMP 2011–2028.
3.1.3 Regional DRRM Plan 2012–2028
In accordance with NDRRMP, RDRRMP 2012–2018 was prepared to provide local authorities with ready options and priorities for actions. Disaster risk reduction and management can be highly effective when local authorities integrate DRRM measures and objectives in various aspects of local governance functions, responsibilities, and practices. This includes the systematic consideration of risk and risk reduction strategies and plans in ARMM such as regional development plans, food security and related human security strategies, environmental management strategies, integrated water resource management plans, and integrated coastal zone management plans.
ARMM RDRRMP intends to provide local LGUs with the knowledge and capacity necessary to effectively comply with the RA 10121, which requires the establishment of an LDRRM Office in every province, city, and municipality. Each LDRRM plan is implemented together with local partners and stakeholders.
The outline of ARMM RDRRMP is summarized in Table 3.2. For the four thematic areas, 24 outputs are proposed. According to the implementation timeline of RDRRMP, all the activities of the 24 outputs will be 100% completed by 2028. OCD-ARMM and ORG/TMS-ARMM are to submit to the Office of the ARMM Regional Governor through the Executive Secretary and the ARMM Regional Legislative Assembly (RLA), within the first quarter of the succeeding year, an annual report relating to the progress of the implementation of RDRRMP as part of the monitoring and evaluation system.

Comprehensive capacity development project for the Bangsamoro Sector Report 2-4: River and Flood Control
4-15
Table 3.2 ARMM Regional DRRM Plan
Area Lead
agency Goal Objectives Outcomes Lead agency
Prevention and Mitigation
DOST-ARMM
Avoid hazards and mitigate their po-tential impacts by reducing vulnera-bilities and expo-sure and enhanc-ing capacities of communities in the ARMM
Reduce vulnerability and exposure of communities to all hazards Enhance capacities of communities to reduce their own risks and cope with the impacts of all hazards
DRRM and CCA mainstreamed and inte-grated in regional, sectoral and local develop-ment policies, plans and budget
OCD-ARMM and ORG/TMS-ARMM
DRRM and CCA-sensitive environmental management
DENR-ARMM
Increased disaster resilience of infrastructure systems
DPWH-ARMM
Community based and scientific DRRM and CCA assessment, mapping, analysis and monitoring are conducted and/or improved
OCD-ARMM & ORG/TMS-ARMM
Communities have access to effective and ap-plicable disaster risk financing and insurance
FBMS/ ORT-ARMM
End-to-End monitoring system (monitoring and response), forecasting and early warning are established and/or improved
DOST-ARMM
Preparedness DILG-ARMM
Establish and strengthen capaci-ties of communi-ties to anticipate, cope and recover from the negative impacts of emer-gency occurrences & disasters in the ARMM
Increase the level of awareness of the community to the threats and impacts of all hazards, risks and vulnerabilitiesEquip the community with the neces-sary skills to cope with the negative im-pacts of a disaster Increase the capacity of institutions Develop and implement comprehensive regional and local disaster preparedness policies, plans and systems Strengthen partnership among all key players and stakeholders Optimize utilization of capacity-build-ing resources and match with the needs of the LGUs
Increased level of awareness and enhanced capacity of the community to the threats and impacts of all hazards
BPI-ARMM
Communities are equipped with necessary skills and capability to cope with the impacts of disasters
DILG-ARMM /& OCD-ARMM
Increased DRRM and CCA capacity of Local DRRM Councils and Offices
DILG-ARMM
Developed and implemented comprehensive regional and local preparedness and response policies, plans, and systems
DILG-ARMM and OCD-ARMM
Strengthened partnership and coordination among all key players and stakeholders
DILG-ARMM
Response DSWD-ARMM
Provide life preservation and meet the basic subsistence needs of affected popula-tion based on ac-ceptable standards during or immedi-ately after a disas-ter in the ARMM
Decrease the number of preventable deaths and injuries Provide basic subsistence needs of af-fected population Immediately restore basic social service
Well-established disaster response operations DSWD-ARMM
Adequate and prompt assessment of needs and damages
OCD-ARMM and DSWD-ARMM
Integrated and coordinated search, rescue, and retrieval (SRR) capacity
OCD-ARMM, DILG-ARMM, and DOH-ARMM
Evacuated safely and on time affected com-munities
LGUs
Temporary shelter needs are adequately ad-dressed
DSWD-ARMM
Basic health services provided to affected population whether inside or outside ECs
DOH-ARMM
Mental and social wellbeing promoted and mental health problems and risks reduced
DOH-ARMM
Coordinated, integrated system for early re-covery implemented at the regional and local levels
DSWD-ARMM
Rehabilitation & Recovery
RPDO-ARMM
Restore and im-prove facilities, livelihood and liv-ing conditions and organizational ca-pacities of affected communities, and reduced disaster risks in accordance with the building-back-better prin-ciple
Restore people’s means of livelihood and continuity of economic activities and business Restore shelter and other build-ings/installation Reconstruct infrastructure and other public utilities Assist in the physical and psychological rehabilitation of persons who suffered from the effects of disaster
Damages, losses, and needs Assessed OCD-ARMM and ORG/TMS-ARMM
Economic activities restored and, if possible, strengthened or expanded
PRDO
DRRM/CCA elements incorporated in human settlement
HLURB-ARMM
Disaster and climate change-resilient and in-frastructure reconstructed
DPWH-ARMM
A psychologically sound, safe, and secured citizenry that is protected from the effects of disasters able to restore to normal functioning after each disaster
DOH-ARMM and DSWD-ARMM
Source: ARMM Regional DRRM Plan.
3.1.4 DRRM practices
Since the RA 10121 was promulgated in January 2010, the DRRM system has been developed nation-wide. Notwithstanding, the level of implementation and enforcement of the new system seems to still remain at its infantile stage.
Under the Mindanao River Basin Integrated Management and Development Master Plan study, key informant interviews were conducted with local heads from July to August of 2010. The results disclosed that risk information had been hardly available at the local level, and early warning systems and protocols on response were not clearly established. Only twelve of the forty municipalities (30%)

Comprehensive capacity development project for the Bangsamoro Sector Report 2-4: River and Flood Control
4-16
interviewed were able to provide copies of their respective preparedness and contingency plans. These, however, were either outdated or at the proposal stage. None had been approved by their respective local councils for appropriation. Table 3.3 provides a summary checklist of selected LGU disaster management plans.
Table 3.3 Summary of Checklist of Selected LGUs in MRB
Indicator No.
Province/City
Mag
uind
anao
Mag
uind
anao
S. C
otab
ato
S. C
otab
ato
S. C
otab
ato
Sul
tan
Kud
arat
Sar
anga
ni
Gen
eral
San
tos
Cit
y
Sar
anga
ni
Buu
kido
n
Buk
idon
Sul
tan
Kud
arat
Municipality/City
Bul
uan*
Dat
u P
agla
s*
Kor
onad
al
Cit
y
Tam
paka
n
Tup
i
Bag
umba
yan
Ala
bel
Mal
ungo
n
Mar
amag
Mal
ayba
lay
Cit
y
Esp
eran
za
1 Preparedness 1.1 Vulnerability Assessment ++ ++ ++ ++ + ++ 1.2 Planning + + ++ ++ ++ + ++ ++ ++ ++ 1.3 Institutional framework + ++ ++ ++ ++ ++ ++ ++ + 1.4 Information System ++ 1.5 Resource base + ++ ++ ++ ++ ++ 1.6 Warning systems ++ ++ ++ ++ 1.7 Response mechanism + ++ ++ ++ 1,8 Public education training ++ ++ ++ ++ ++ ++ ++ 1.9 Rehearsals 2 Mitigation
2.1 Engineering ++ 2.2 Spatial Planning + 2.3 Economic 2.4 Management and institution ++ ++ 2.5 Societal 2.6 Conflict resolution ++ ++ 2.7 Timing 2.8 Political 2.9 Long-term development efforts ++ ++ ++ 3 Reconstruction and rehabilitation
3.1 Damage assessment ++ ++ ++ + 3.2 Capacities assessment + ++ ++ ++ 3.3 Institutional arrangement + ++ 3.4 Income generation activities 3.5 Community organization + ++ ++ ++ ++ ++ 3.6 Capital resources ++ 3.7 Planning/phasing of activities ++ ++ 3.8 Timing 3.9 Emergency settlement + ++ ++ 4. Response
4.1 Protocol ++ 4.2 Quick response mechanism ++ 4.3 Relief resources + ++
Note: + Mentioned in general term; ++ Specific activities identified; +++ with concrete programs/projects with funding/approved by Sanggunian; ++++ Links risk assessment to planning and with approved budget; Not present if not indicated; * located in BCT.
Source: MRBIMDMP.
The above-mentioned information might be already too old as the interviews were made in 2010, five years ago. A JICA capacity development project, the Autonomous Region in Muslim Mindanao (ARMM) Human Resource Development Project was implemented between May 19, 2008 and March 31, 2011. DPWH-ARMM staff were trained in skills of flood control study under the infrastructure development course of the project. Therefore, some improvement might have been made in this aspect at least.
As described in the Final Report of the Disaster Risk Reduction and Management Capacity Enhancement Project (DRRMCEP) of JICA (March 2015), however, the percentage of LGUs that have submitted their Local DRRM Plans was only 50% for ARMM as of December 2014, the lowest among the 16 regions of which average was 90%. As for the establishment of the Regional DRRM Office (RDRRMO) and the Humanitarian Emergency Action Response Team (HEART), there may be still
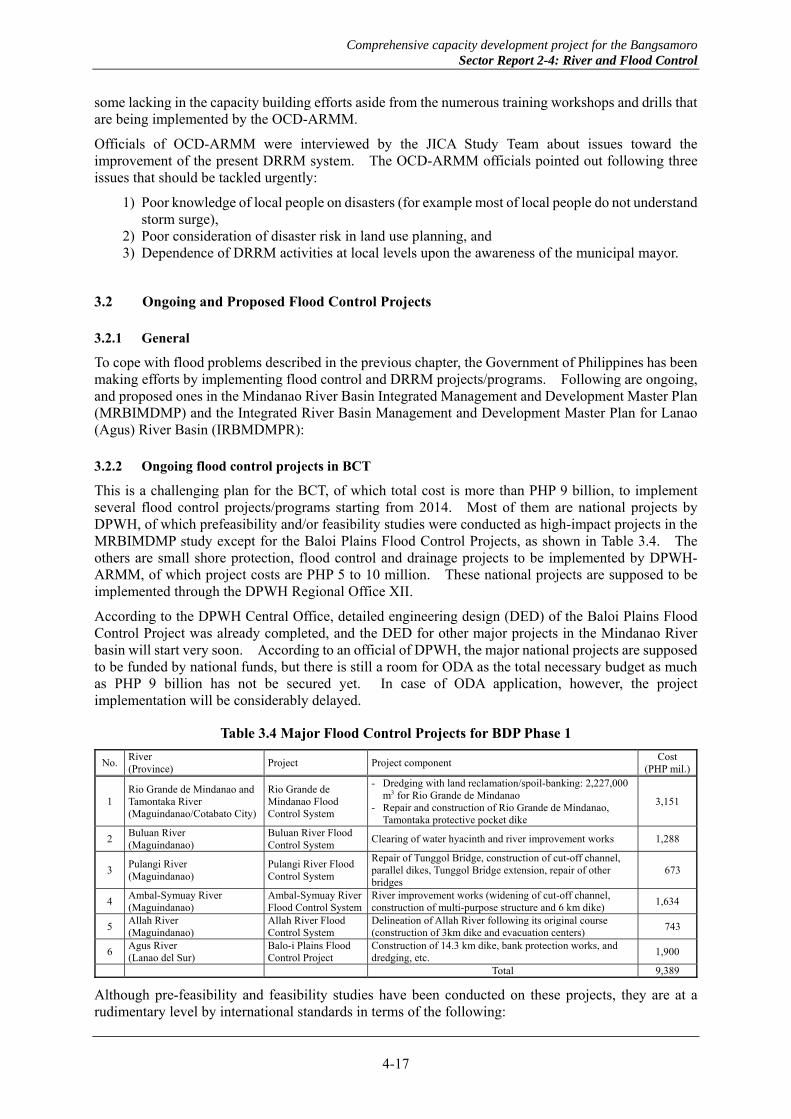
Comprehensive capacity development project for the Bangsamoro Sector Report 2-4: River and Flood Control
4-17
some lacking in the capacity building efforts aside from the numerous training workshops and drills that are being implemented by the OCD-ARMM.
Officials of OCD-ARMM were interviewed by the JICA Study Team about issues toward the improvement of the present DRRM system. The OCD-ARMM officials pointed out following three issues that should be tackled urgently:
1) Poor knowledge of local people on disasters (for example most of local people do not understand storm surge),
2) Poor consideration of disaster risk in land use planning, and 3) Dependence of DRRM activities at local levels upon the awareness of the municipal mayor.
3.2 Ongoing and Proposed Flood Control Projects
3.2.1 General
To cope with flood problems described in the previous chapter, the Government of Philippines has been making efforts by implementing flood control and DRRM projects/programs. Following are ongoing, and proposed ones in the Mindanao River Basin Integrated Management and Development Master Plan (MRBIMDMP) and the Integrated River Basin Management and Development Master Plan for Lanao (Agus) River Basin (IRBMDMPR):
3.2.2 Ongoing flood control projects in BCT
This is a challenging plan for the BCT, of which total cost is more than PHP 9 billion, to implement several flood control projects/programs starting from 2014. Most of them are national projects by DPWH, of which prefeasibility and/or feasibility studies were conducted as high-impact projects in the MRBIMDMP study except for the Baloi Plains Flood Control Projects, as shown in Table 3.4. The others are small shore protection, flood control and drainage projects to be implemented by DPWH-ARMM, of which project costs are PHP 5 to 10 million. These national projects are supposed to be implemented through the DPWH Regional Office XII.
According to the DPWH Central Office, detailed engineering design (DED) of the Baloi Plains Flood Control Project was already completed, and the DED for other major projects in the Mindanao River basin will start very soon. According to an official of DPWH, the major national projects are supposed to be funded by national funds, but there is still a room for ODA as the total necessary budget as much as PHP 9 billion has not be secured yet. In case of ODA application, however, the project implementation will be considerably delayed.
Table 3.4 Major Flood Control Projects for BDP Phase 1
No. River (Province)
Project Project component Cost
(PHP mil.)
1 Rio Grande de Mindanao and Tamontaka River (Maguindanao/Cotabato City)
Rio Grande de Mindanao Flood Control System
- Dredging with land reclamation/spoil-banking: 2,227,000 m3 for Rio Grande de Mindanao
- Repair and construction of Rio Grande de Mindanao, Tamontaka protective pocket dike
3,151
2 Buluan River (Maguindanao)
Buluan River Flood Control System
Clearing of water hyacinth and river improvement works 1,288
3 Pulangi River (Maguindanao)
Pulangi River Flood Control System
Repair of Tunggol Bridge, construction of cut-off channel, parallel dikes, Tunggol Bridge extension, repair of other bridges
673
4 Ambal-Symuay River (Maguindanao)
Ambal-Symuay River Flood Control System
River improvement works (widening of cut-off channel, construction of multi-purpose structure and 6 km dike)
1,634
5 Allah River (Maguindanao)
Allah River Flood Control System
Delineation of Allah River following its original course (construction of 3km dike and evacuation centers)
743
6 Agus River (Lanao del Sur)
Balo-i Plains Flood Control Project
Construction of 14.3 km dike, bank protection works, and dredging, etc.
1,900
Total 9,389
Although pre-feasibility and feasibility studies have been conducted on these projects, they are at a rudimentary level by international standards in terms of the following:

Comprehensive capacity development project for the Bangsamoro Sector Report 2-4: River and Flood Control
4-18
The pre-feasibility and feasibility studies are based on topographic information of coarse resolution;
Hydrological and hydraulic analysis models were not validated with actual observation data;
A basin-wide point of view including effects of the marsh areas and sediment supply from the upstream was lacking; and
The contents of the projects were already considerably modified but review studies have not been conducted yet.
Therefore, they still remain pre-mature, and need to be reviewed. It is strongly recommended that the long-term and overall projects be reviewed with a basin-wide point of view.
3.2.3 Flood forecasting and warning system by PAGASA
PAGASA is the duly mandated agency to operate 98% of all hydro-meteorological observation networks in the Country. It issues all official forecast, warnings, advisories, outlooks, and press releases on severe weather and extreme events such as tropical cyclones, floods, droughts/dry spell, and El Niño/La Niña. Currently PAGASA is operating flood forecasting and warning system in five river basins out of the 18 major river basins in the Philippines, and has an intention to expand the system over the remaining 13 major river basins including the Mindanao River Basin.
In the MRBIMDMP a pre-feasibility study on the development of early warning and flood forecasting project, which is to be undertaken by PAGASA, was conducted. The study proposed a flood forecasting and warning system consisting of three zones, namely, (1) Data Collection Zone, (2) Command Zone, and (3) Warning Recipient Zone (Table 3.5). The project is planned to be implemented in two phases, taking into account constraints of finance and capacity of operators. In the first phase data collection and warning dissemination will be made manually through a short message system (SMS) by cellular phone, and full automation by introducing telemeter system and warning dissemination through Internet will be in the second phase. The total cost was estimated at about PHP 2.0 million.
Table 3.5 Proposed Flood Forecasting and Warning System
Component Contents
1. Data Collection Zone A total of 13 stations are proposed in the Mindanao River Basin. Rainfall heights are measured and transmitted manually during Phase I while they will be converted into telemetered stations in Phase II.
2. Command Zone
One comand center is proposed at CDRRMC Cotabato City, and four sub-command cnters are proposed at PDRRMCs of Maguindanao, Sultan Kudarat, South Cotabato and Cotaboto Provinces. The command center center will receive the rainfall data tai are stord in the database of the flood simulation model. During high rainfall event, visualization module of the simulation model will be activated to forecast the probable areas to be flooded based on the rainfall data. If there are places found to be flooded, a warning bulletin will be sent to their respective sub- command centers. The sub-command centers then will transmit the text message to probable affected warning recipient zones.
3. Warning Recipient Zone.As warning recipients, 17 municipalities in Maguindanao, 12 municipalities in North Cotabato, 1 city in South Cotabato and 5 municipalities in Sultan Kudarat are proposed.
Source: MRBIMDMP.
On the other hand the Project NOAH has commenced in 2012 under the initiative of DOST- Advanced Science and Technology Institute (ASTI), and telemetry system based on SMS is being constructed in the Mindanao River Basin, too, as described in the following section. Coordination or integration with the Project-NOAH will be a challenge for the realization of the flood forecasting and warning system for the Mindanao River Basin to avoid duplication of investment.
3.2.4 Project NOAH
The Project NOAH, launched in July 2012, is a responsive disaster management program that makes use of advanced scientific research and cutting edge technology to reduce risks in highly vulnerable communities. This project has been executed by DOST with the participation of a variety of related

Comprehensive capacity development project for the Bangsamoro Sector Report 2-4: River and Flood Control
4-19
governmental and non-governmental organizations and donors including PAGASA, DOST, PHIVOLCS, the University of the Philippines, DILG, MMDA, DENR, DPWH, NDRRMC-OCD, Smart Communications, Inc., SUN Cellular, Google Crisis Response, Petron, Life So Mandane (www.lifesomundane.net), Rotary Club of Pinamalayan Central, World Bank, USAID, and GiZ.
Source: http://beta.noah.dost.gov.ph/
Figure 3.4 NOAH Website
The Project NOAH envisions a disaster-free Philippines where communities are empowered through open access to accurate, reliable and timely hazard and risk information, and has following missions:
- To develop high-resolution hazard maps for various types of natural hazards using frontier science and cutting-edge technology;
- To undertake investigations in meteorological and geological hazards to improve the Country’s capability to prevent and mitigate the potentially disastrous impacts of natural hazards;
- To systematically simulate, validate, and improve geo-hazard maps; - To integrate and assist other agencies in identifying meteorological and geological hazards with
the ultimate objective of promoting safety in communities affected by natural hazards; and - To collaborate with similar institutions or organizations, both national and international, in
furtherance of the above purposes.
The Project NOAH has nine components, and the progress of each of the components related to the BCT is summarized as shown in Table 3.6.
One of the most important benefits of the Project NOAH is mapping of high resolution that is based on the LiDAR survey data with 50 cm horizontal and 20 cm vertical resolution for more important areas as well as the IFSAR survey data by NAMRIA with 5 m horizontal and 1m vertical resolution. These detailed maps will be practically useful for investigation of evacuation routes and places and land use planning that are difficult with the existing MGB susceptibility maps that are based on 1/50,000 NAMRIA maps. On the other hand, the NOAH maps have a weak point, too. They are not subject to validation with observed data during past disasters such as flood marks and landslide areas. Therefore, they still might include a certain error in terms of accuracy, and should be improved and updated at every disaster event through validation with observed information.
The next challenges might be maintenance of the equipment and systems, and dissemination of the project products to local governments and communities. Especially the maintenance problem is urgent. One third of the devices installed in ARMM in 2014 were already out of order. According to Dr.
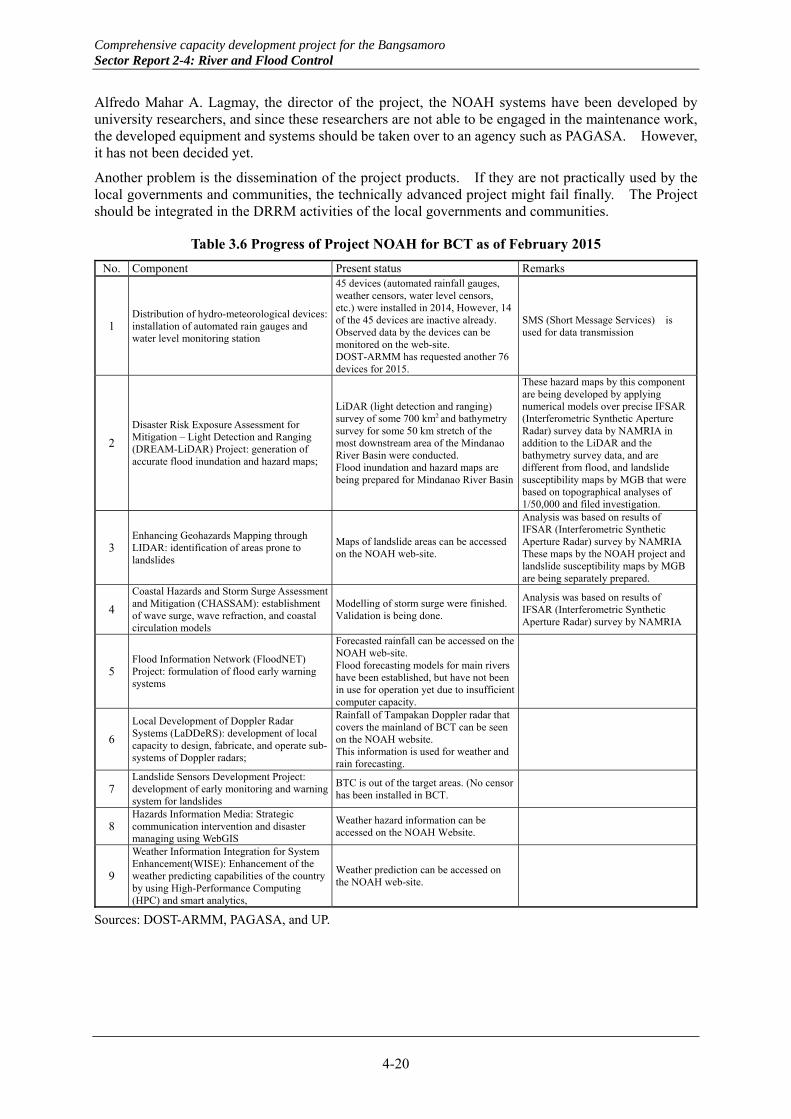
Comprehensive capacity development project for the Bangsamoro Sector Report 2-4: River and Flood Control
4-20
Alfredo Mahar A. Lagmay, the director of the project, the NOAH systems have been developed by university researchers, and since these researchers are not able to be engaged in the maintenance work, the developed equipment and systems should be taken over to an agency such as PAGASA. However, it has not been decided yet.
Another problem is the dissemination of the project products. If they are not practically used by the local governments and communities, the technically advanced project might fail finally. The Project should be integrated in the DRRM activities of the local governments and communities.
Table 3.6 Progress of Project NOAH for BCT as of February 2015
No. Component Present status Remarks
1 Distribution of hydro-meteorological devices: installation of automated rain gauges and water level monitoring station
45 devices (automated rainfall gauges, weather censors, water level censors, etc.) were installed in 2014, However, 14 of the 45 devices are inactive already. Observed data by the devices can be monitored on the web-site. DOST-ARMM has requested another 76 devices for 2015.
SMS (Short Message Services) is used for data transmission
2
Disaster Risk Exposure Assessment for Mitigation – Light Detection and Ranging (DREAM-LiDAR) Project: generation of accurate flood inundation and hazard maps;
LiDAR (light detection and ranging) survey of some 700 km2 and bathymetry survey for some 50 km stretch of the most downstream area of the Mindanao River Basin were conducted. Flood inundation and hazard maps are being prepared for Mindanao River Basin
These hazard maps by this component are being developed by applying numerical models over precise IFSAR (Interferometric Synthetic Aperture Radar) survey data by NAMRIA in addition to the LiDAR and the bathymetry survey data, and are different from flood, and landslide susceptibility maps by MGB that were based on topographical analyses of 1/50,000 and filed investigation.
3 Enhancing Geohazards Mapping through LIDAR: identification of areas prone to landslides
Maps of landslide areas can be accessed on the NOAH web-site.
Analysis was based on results of IFSAR (Interferometric Synthetic Aperture Radar) survey by NAMRIA These maps by the NOAH project and landslide susceptibility maps by MGB are being separately prepared.
4
Coastal Hazards and Storm Surge Assessment and Mitigation (CHASSAM): establishment of wave surge, wave refraction, and coastal circulation models
Modelling of storm surge were finished. Validation is being done.
Analysis was based on results of IFSAR (Interferometric Synthetic Aperture Radar) survey by NAMRIA
5 Flood Information Network (FloodNET) Project: formulation of flood early warning systems
Forecasted rainfall can be accessed on the NOAH web-site. Flood forecasting models for main rivers have been established, but have not been in use for operation yet due to insufficient computer capacity.
6
Local Development of Doppler Radar Systems (LaDDeRS): development of local capacity to design, fabricate, and operate sub-systems of Doppler radars;
Rainfall of Tampakan Doppler radar that covers the mainland of BCT can be seen on the NOAH website. This information is used for weather and rain forecasting.
7 Landslide Sensors Development Project: development of early monitoring and warning system for landslides
BTC is out of the target areas. (No censor has been installed in BCT.
8 Hazards Information Media: Strategic communication intervention and disaster managing using WebGIS
Weather hazard information can be accessed on the NOAH Website.
9
Weather Information Integration for System Enhancement(WISE): Enhancement of the weather predicting capabilities of the country by using High-Performance Computing (HPC) and smart analytics,
Weather prediction can be accessed on the NOAH web-site.
Sources: DOST-ARMM, PAGASA, and UP.

Comprehensive capacity development project for the Bangsamoro Sector Report 2-4: River and Flood Control
4-21
3.2.5 Mindanao River Basin Integrated Management and Development Master Plan (MRBIMDMP)
The Mindanao River basin is the second largest river basin in the Philippines with the catchment area of 21,503 km2 which pours to the Illana Bay through Central and Southern Mindanao. Major rivers within the basin include the Allah River, traversing the Allah Valley in the south, the Pulangi River with headwater from Bukidnon; the Ambal-Simuay River System originating from Lanao del Sur, and the Mindanao and Tamontaka Rivers in the lowest part of the river basin. There are three huge marshes, Ligawasan, Ebpanan and Libungan, in the central and lower parts of the basin, which act as natural storages to attenuate large flows including several lakes. Before entering Cotabato City, the Mindanao River bifurcates into the Rio Grande de Mindanao and the Tamontaka Rivers. The river basin extends over two Provinces of Maguindanao and Lanao del Sur of ARMM, a province of Bukidnon of Region X, a province of Davao del Norte of Region XI, and three provinces of Sultan Kudarat, Cotabato and South Cotabato, and Cotabato City of Region XII.
The Mindanao River Basin Integrated Management and Development Project Master Plan (MRBIMDMP) was prepared by a local consultant firm, Woodfields Consultants, Inc. in 2012. The plan aimed to determine the specific causes of the physical deterioration of the basin, and to formulate a master plan that would provide the blue print for a balanced development approach for the basin area through sound water resources development and management practices, although specific contents of the project components were considerably modified from the original ones in the MRBIMDMP.
As part of outputs of the master plan study, a variety of flood control and DRRM projects/programs were proposed as shown in Table 3.7. They cover non-structural measures as well as structural ones. As mentioned in the previous section, the first seven projects in the table have already entered into their preparation process, although the contents of the project components were considerably modified.
In addition, long-term, overall flood control projects were also proposed for the Rio Grande de Mindanao, Allah, Pulangi River systems. However, neither pre-feasibility study nor feasibility has been conducted yet. Only conceptual illustrations are presented.
Table 3.7 MRBIMDMP Development Matrix for Flood and Disaster Risk Management
Development Vision
A Mindanao River Basin that is a sustainable area of peace and development where all stakehold-ers, striving as active collaborators and competent stewards of the Almighty Creator, adhere to the judicious use of its natural resources to enjoy nondiscriminatory socio-economic growth, human development and ecological balance that is inclusive for all and without aggression to anyone or anything.
Development Goal Ensure a focused, comprehensive and integrated development and management of the Mindanao River Basin that would prevent, mitigate and protect its stakeholders from any calamities and dis-aster risks, and facilitate the attainment of sustainable development.
Development Issues & Challenges
Increasing occurrence and worsening effects of floods, and risks from other natural hazards.
Figure 3.5 Mindanao River Basin

Comprehensive capacity development project for the Bangsamoro Sector Report 2-4: River and Flood Control
4-22
Goals Objectives Strategies Program/Project/Activity Status (as of Feb. 2015)
Strengthened flood and other disaster risk management through in-creased coop-eration and partnership with local gov-ernment units and other stakeholders towards build-ing safe and re-silient commu-nities.
To develop, implement and maintain a flood control management system in ac-tive collabora-tion with con-cerned national and local stake-holders
Adoption of an in-tegrated flood man-agement approach
Integrated Flood Control, River Bank Protection and Rehabilitation of Ambal-Simuay River System
FS completed. DED to start soon
Siltation Control and Management for Rio Grande de Mindanao System
FS completed. DED to start soon
Siltation Control and Management for Allah River System
FS completed. DED to start soon
Siltation Control and Management for Buayan-Malungon River System*
FS completed. DED to start soon
Integrated Flood Control, River Bank Protection and Rehabilitation of Rio Grande de Mindanao System
Pre-FS completed. DED to start soon
Integrated Flood Control, River Bank Protection and Rehabilitation of Allah River System
Pre-FS completed. DED to start soon
Integrated Flood Control, River Bank Protection and Rehabilitation of Pulangi System
Pre-FS completed. DED to start soon
Integrated Flood Control, River Bank Protection and Rehabilitation of Buayan-Malungon River System*
Pre-FS completed.
Early Warning and Flood Forecasting System for the MRB and BMRB*
Pre-FS completed.
Dendro-Thermal Power Pre-FS completed. Implementation of thematic development plans and projects for watershed man-agement, wetland management, water re-source management & development, hu-man development and creation of the MRBA*
Establishment of a technical coordinating sub-unit within the proposed MRB-DRRM Technical Committee focusing on Integrated Flood Management.
Basin-wide risk as-sessment and moni-toring
Establishment of a basin-wide multi-haz-ard early warning and forecasting system
Establishment of a basin-wide knowledge management center on disas-ter risk management
Strengthen disaster preparedness
Establishment of an MRBA*-DRRM Technical Committee
Acquire necessary equipment and facili-ties on rescue/response to support LGUs in managing disaster emergency situa-tions
Design and conduct series of training-workshops on preparedness and contin-gency planning
Preparation and implementation of a ba-sin-wide community-oriented
IEC campaign on climate change and disaster risk reduction
Capacity develop-ment for LGUs and other basin stakeholders
Creation/organization of instructors and trainers on disaster risk assessment (haz-ard characterization, frequency analysis, consequence analysis, risk estimation, risk evaluation and GIS) to sup-port/augment local initiatives
Creation of a pool of experts from the academe/industry for scientific research on hazards and risks that will provide specialized advice to LGUs and other ba-sin stakeholders
Mainstream DRRM Preparation and implementation of an

Comprehensive capacity development project for the Bangsamoro Sector Report 2-4: River and Flood Control
4-23
Goals Objectives Strategies Program/Project/Activity Status (as of Feb. 2015)and CCA in all de-velopment policies, programs and plans of sub-national govern-ment agencies, LGUs and other ba-sin stakeholders
MRB disaster risk management compre-hensive resource development plan
Monitoring and evaluation system on DRRM and CCA mainstreaming efficacy by the MRBA
*Buayan-Malungon River Basin (BMRB), allied river basin of MRB, located in Regions XI and XII.
3.2.6 Integrated River Basin Management and Development Master Plan for Lanao (Agus) River Basin (IRBMPRRB)
The Lanao (Agus) River basin is one of the 18 major river basins in the Philippines. The total catchment area is 1,987 km2 consisting of five major sub-basins namely, Agus, Gata, Masiu, Ramain, and Taraka (Figure 3.6). All the major sub-basins except for the Agus River supply water to the Lake Lanao. The Agus River serves as the drainage of the Lake Lanao, and is famous for a cascade hydropower generation system where water from the Lake Lanao is regulated and released to the Agus River through the Agus I regulation dam in Marawi City. Of the Lanao (Agus) River basin catchment area, 89% is under the administrative jurisdiction of Lanao del Sur Province of ARMM, while 11% is part of Lanao del Norte of Region X.
The Integrated River Basin Management and Development Master Plan for Lanao (Agus) River Basin (IRBMPRRB) was completed by the College of Forestry and Natural Resources of the University of the Philippines Los Banos in January 2015. The master plan study aimed to formulate an Integrated River Basin Management and Development Master Plan for the Lanao (Agus) River basin, which addresses concerns on 1) water resources management, 2) watershed management, 3) flood control/mitigation and disaster risk reduction management and hazard management, 4) river and river delta management, 5) coastal and fresh water resources management, 6) biodiversity conservation, 7) climate change adaptation and mitigation, 8) mineral resources management, 9) sustainable management through community participation, 10) economic development, and 12) institutional linkages and organizational structure for river basin management.
According to the flood and landslide susceptibility map by MGB (Figure 2.2), flood-prone areas cover about 10% of the total catchment area. The Ramain and Taraka sub-basins and the other sub-basins surrounding the Lake Lanao are more susceptible to flooding. The Gata sub-basin is the most susceptible to landslide.
With a development objective to establish a flood-free Lanao (Agus) River basin, several structural and non-structural flood control, disaster risk reduction and management, and climate change adaptation projects and programs were proposed as shown in Table 3.8. It is considered that these projects and programs were elaborated mainly through various stakeholders during a series of consultations and meetings. However, engineering studies have not been conducted to formulate such projects or programs. Thus, the proposed projects/programs should be regarded as conceptual ones.

Comprehensive capacity development project for the Bangsamoro Sector Report 2-4: River and Flood Control
4-24
Source: IRBMPRRB.
Figure 3.6 Lanao (Agus) River Basin
Table 3.8 Proposed Projects for Disaster Risk Reduction and Climate Change Adaptation Program
Programs/Projects Location Implementing Agency Total Estimated Cost (PHP mil.)
Expected Source of Fund
Installation, Operation and Maintenance of Weather Monitoring Stations
Marawi city, Iligan City RBCO, DOST, DENR 35 ODA, GOP
Establishment of early flood warning system
IliganC ity, Ramain, Taraka, Gata and Malaig
RBCO, DOST, DENR 25 GOP, ODA
Construction, operation and maintenance of smart flood control structure
Iligan City, Ramain, Taraka, Gata and Malaig
DPWH 300 GOP, ODA, PPP
River Channelization Ramain, Taraka, Gata and Malaig
DPWH 150 GOP, ODA, PPP
Development of high resolution flood model and flood Hazard Maps of Lanao River Basin
Lanao River Basin DREAM, DENR 10 ODA, DOST, DENR
Capacity Development of LGUs on DRR and CCA
39 cities and municipalities inside the Lanao River Basin
LGUs, DILG, CCC, DENR, DA, DOH, DOST, DPWH, DOE
642
Grant, Loan, Presidential Support Fund (PSF)
Rapid Visual Vulnerability Assessment of Structures
Iligan City, Marawi City DOST, DPWH 15 GOP, ODA
Seismic Hazard and Risk Mitigation Planning
Iligan City, Ramain, Taraka, Gata and Malaig
DOST, DPWH 20 GOP, ODA
Total 1,197

Comprehensive capacity development project for the Bangsamoro Sector Report 2-4: River and Flood Control
4-25
CHAPTER 4 PROPOSED PROJECTS FOR BDP
4.1 Proposed Projects
As projects under the Enhanced Resources Management Initiative, the following two projects are proposed for the river and flood control sector:
1) Mindanao River Basin Integrated Flood Management Project (MRBIFMP), and 2) Bangsamoro Disaster Risk Reduction and Management Project (Bangsamoro DRRMP)
4.2 Mindanao River Basin Integrated Flood Management Project
As part of output of the Mindanao River Basin Integrated Management and Development Master Plan (MRBIMDMP), a variety of flood control and DRRM projects and programs were proposed. They cover structural measures as well as non-structural ones. Five of these flood control projects, which correspond to the five sub-projects (SP-2 to SP-6) in Table 4.1, are now about to be subjected to DED.
However, the master plan has to be regarded as a conceptual plan, especially on the flood control aspect, for the following reasons:
Hydrological and hydraulic analysis models were not validated with actual observation data;
The study was based on coarse geo- and topo-graphic information; and
A basin-wide point of view including effects of the marsh areas and sediment supply from the upstream was lacking.
Under these circumstances, the Mindanao River Basin Integrated Flood Management Project (MRBIFMP) aims to comprehensively deal with the flood problems in the Mindanao River Basin, composed of the eight sub-projects listed in Table 4.1.
Table 4.1 Eight Sub-Projects of Mindanao River Basin Integrated Flood Management
No. Sub-project Status SP-1 Comprehensive Study on Flood Control for Mindanao River Basin SP-2 Rio Grande de Mindanao and Tamontaka Rivers Flood Control Systems Ongoing SP-3 Buluan River Flood Control System Ongoing SP-4 Pulangi River Flood Control System including Repair of Tunggol Bridge Ongoing SP-5 Ambal-Simuay River Flood Control Ongoing SP-6 Ala River Flood Control System Ongoing SP-7 Mindanao River Basin Flood Forecasting and Warning System Pre-feasibility study SP-8 Mindanao River Basin Urgent Flood and Sediment Control Project
The most important sub-project is SP-1: Comprehensive Study on Flood Control for Mindanao River Basin. The comprehensive study aims to formulate an overall flood control plan including flood forecasting and warning system, paying special attentions to validation of hydrological and hydraulic models with observed data, river morphology, sediment balance, retarding effects of the marsh areas, utilization of products of recent related projects, climate change adaptation, etc. The five ongoing sub-projects (SP-2 to SP-6), which is supposed to be implemented soon, will be reviewed under the comprehensive study. If these projects are found insufficient or inappropriate for the expected effects, supplemental/additional works for filling in the gaps will be planned under the study, and further might be implemented as high-priority projects under SP-8.
The project profiles are presented in the Project Report, and the terms of reference for SP-1 are also presented in the Project Report.

Comprehensive capacity development project for the Bangsamoro Sector Report 2-4: River and Flood Control
4-26
4.3 Bangsamoro Disaster Risk Reduction and Management Project
The proposed Bangsamoro Core Territory or the Bangsamoro region comprises the present Autonomous Region of Muslim Mindanao’s five component provinces of Maguindanao, Lanao de Sur, Basilan, Sulu and Tawi-Tawi alongside two cities and the expansion areas of at least six municipalities in Lanao de Norte Province, 39 barangays in North Cotabato Province, together with the chartered city of Cotabato and Isabela City, located in Central and Western Mindanao. The total land area is approximately 15,000 km2 with a population of about 4 million as of 2010.
Similar to other regions in the Philippines, the Bangsamoro region is exposed to many types of hazards. Floods and storm surges have been most frequently occurring. Due to its geography and geology, there is a high level of exposure to earthquake, tsunami and landslide. The periodic El Nino southern oscillation is likely to bring drought in the vast agricultural lands in Maguindanao Province. A number of active volcanoes that can be found in Sulu, Lanao de Sur, Bukidnon, and South Cotabato Provinces likewise trigger constant threats to its communities.
Meanwhile, the DRRM Act of 2010 (RA 10121) has shifted its DRRM policies from a reactive to a proactive approach. The ARMM Regional DRRM Plan 2012–2028 (RDRRMP) has been prepared to guide local authorities to effectively comply with the DRRM Act, in which one of the prioritized DRRM activities described in the NDRRMP and the RDRRMP, the capacity development of LGUs, has been strongly emphasized. Further, to implement the DRRM activities efficiently under the new approach, the needs for preparing various plans as well as establishing and strengthening the capabilities of related agencies have been rapidly increasing.
Following the current undertakings, the ongoing DRRM efforts in the ARMM territory may ‘have not’ been progressed well, and are still far behind the time frame proposed in the RDRRMP. As described in the Final Report of the Disaster Risk Reduction and Management Capacity Enhancement Project (DRRMCEP) of JICA dated March 2015, the percentage of LGUs that have submitted their Local DRRM Plans was only 50% for ARMM as of December 2014, the lowest among the 16 regions of which average was 90%. As for the establishment of the Regional DRRM Office (RDRRMO) and the Humanitarian Emergency Action Response Team (HEART), there may still be some deficiencies in the capacity building efforts despite numerous training workshops and drills that are being implemented by the OCD-ARMM.
DRRM efforts at the national level have been progressed gradually on the other hand. JICA implemented the DRRMCEP between 2012 and 2015 to further strengthen the capacity for DRRM of OCD. The JICA project developed a variety of training modules, regional and local DDRM plans of selected regions and LGUs, monitoring and evaluation tools, National Disaster Response Plans for hydro-meteorological, earthquake and tsunami which are definitely useful as references, guides or prototypes for the DRRM activities at all levels.
The Bangsamoro Disaster Risk Reduction and Management Project (Bangsamoro DRRMP) aims to improve the DRRM activities at the regional to the barangay levels in the new Bangsamoro by utilizing fruits of the above-mentioned recent efforts at the maximum so that substantial DRRM activities could be launched as soon as possible. The project features are summarized in Table 4.2, and the detailed project profile with the project design matrix is presented in the Project Report.
Table 4.2 Features of Bangsamoro Disaster Risk Reduction and Management Project
Project Title Bangsamoro Disaster Risk Reduction And Management Project (Bangsamoro DRRM Project) Goal To improved DRRM activities in Bangsamoro Project Purpose Substantial DRRM activities are launched in the Bangsamoro region
Expected Outputs
Output 1: DRRM activities at the Bangsamoro region level are improved. Output 2: DRRM activities at the LGU level are improved. Output 3: DRRM training system and program for all levels from region to barangay is developed.Output 4: Model Early Warning Systems (EWSs) are developed in the pilot LGUs
Project Area Bangsamoro Core Territory (Bangsamoro Region) Executing Agencies OCD, Bangsamoro Government, LGUs Project Period 4 years Project Cost USD 3 million

Comprehensive capacity development project for the Bangsamoro Sector Report 2-5: Power Policy
Comprehensive Capacity Development Project for the Bangsamoro
Development Plan for the Bangsamoro
Final Report
Sector Report 2-5: Power Policy

Comprehensive capacity development project for the Bangsamoro Sector Report 2-5: Power Policy

Comprehensive capacity development project for the Bangsamoro Sector Report 2-5: Power Policy
5-i
Table of Contents
Chapter 1 Current Situation of Mindanao Power Sector ................................................................. 5-1 1.1 Structure of Power Sector ..................................................................................................... 5-1 1.2 Regulations and Laws in Power Sector ................................................................................. 5-1 1.3 Governmental Organizations in Power Sector ...................................................................... 5-1
1.3.1 Department of Energy ..................................................................................................... 5-1 1.3.2 National Power Corporation ............................................................................................ 5-2 1.3.3 National Power Corporation-Small Power Utility Group ............................................... 5-3 1.3.4 Power Sector Assets and Liabilities ................................................................................ 5-3 1.3.5 National Transmission Corporation ................................................................................. 5-4 1.3.6 National Grid Corporation of the Philippines ................................................................. 5-4 1.3.7 National Electrification Administration .......................................................................... 5-5 1.3.8 Electric cooperatives ....................................................................................................... 5-5 1.3.9 Private investor-owned utilities and local government unit-owned utilities ................... 5-9 1.3.10 Energy Regulatory Commission ...................................................................................... 5-9
1.4 Generation ........................................................................................................................... 5-10 1.4.1 Ratio of generation fuel types ....................................................................................... 5-10 1.4.2 Off-grid generators ........................................................................................................ 5-11 1.4.3 Independent power producers ....................................................................................... 5-12
1.5 Transmission System ........................................................................................................... 5-12 1.6 Distribution System ............................................................................................................. 5-14
1.6.1 System profile................................................................................................................ 5-14 1.6.2 Utilities rates ................................................................................................................. 5-14
1.7 Power Demand .................................................................................................................... 5-15 1.8 Conventional Energy Sources ............................................................................................. 5-17 1.9 Renewable Energy .............................................................................................................. 5-17
1.9.1 Hydro power potential resources ................................................................................... 5-18 1.9.2 Geothermal potential resources ..................................................................................... 5-19 1.9.3 Biomass potential resources .......................................................................................... 5-19 1.9.4 Solar potential resources ............................................................................................... 5-19 1.9.5 Ocean energy potential resources .................................................................................. 5-23 1.9.6 Wind power potential resources .................................................................................... 5-23
1.10 Electricity Rate .................................................................................................................... 5-24
Chapter 2 Power Sector Development Plan ................................................................................... 5-27 2.1 Demand Forecast ................................................................................................................. 5-27 2.2 Energy Outlook by Sector ................................................................................................... 5-28 2.3 Power Development Plan .................................................................................................... 5-29 2.4 Transmission Development Plan ......................................................................................... 5-29
2.4.1 Tacurong–Sultan Kudarat 138 kV transmission lines construction project ................... 5-31 2.4.2 Agus 1-2 switchyard upgrading and rehabilitation ....................................................... 5-32 2.4.3 Agus 5 switchyard upgrading and rehabilitation ........................................................... 5-32 2.4.4 Other projects ................................................................................................................ 5-32
2.5 Distribution Plan ................................................................................................................. 5-33 2.5.1 Distribution development plan ...................................................................................... 5-33 2.5.2 Missionary electrification development plan ................................................................ 5-34 2.5.3 Progress of energization plan ........................................................................................ 5-34
Chapter 3 Issues of Power Sector .................................................................................................. 5-36 3.1 Power Supply Shortages ..................................................................................................... 5-36 3.2 Aged Distribution Facilities ................................................................................................ 5-37 3.3 High Distribution Loss Rates .............................................................................................. 5-38 3.4 Low Energization (Electrification) Rate ............................................................................. 5-40

Comprehensive capacity development project for the Bangsamoro Sector Report 2-5: Power Policy
5-ii
Chapter 4 Proposals of Priority Projects ........................................................................................ 5-41 4.1 Boom Truck Procurement Plan for Distribution Work ........................................................ 5-41
4.1.1 Background and issues .................................................................................................. 5-41 4.1.2 Scope of proposal .......................................................................................................... 5-41 4.1.3 Project purpose .............................................................................................................. 5-42 4.1.4 Expected effects ............................................................................................................ 5-42 4.1.5 Security consideration ................................................................................................... 5-42
4.2 Rehabilitation Plan for MAGELCO's Distribution Facilities ............................................. 5-42 4.2.1 Background and issues .................................................................................................. 5-42 4.2.2 Rehabilitation program by MAGELCO ........................................................................ 5-43 4.2.3 Scope of proposal .......................................................................................................... 5-44 4.2.4 Project purpose .............................................................................................................. 5-44 4.2.5 Expected effects ............................................................................................................ 5-44 4.2.6 Considerations for project implementation ................................................................... 5-45
4.3 Development of Low-head Hydro Power Plant in Tawi-Tawi ............................................ 5-46 4.3.1 Background and issues .................................................................................................. 5-46 4.3.2 Scope of proposal .......................................................................................................... 5-46 4.3.3 Project purpose .............................................................................................................. 5-46 4.3.4 Expected effects ............................................................................................................ 5-46 4.3.5 Consideration for project implementation ..................................................................... 5-48
Chapter 5 Recommendations for the Bangsamoro Power Sector .................................................. 5-49 5.1 Recommended Action Plans ............................................................................................... 5-49
5.1.1 Specific action plans for power supply shortages ......................................................... 5-49 5.1.2 Specific action plans for aged distribution facilities ..................................................... 5-49 5.1.3 Specific action plans for high distribution loss rates ..................................................... 5-50 5.1.4 Specific action plans for low electrification rate ........................................................... 5-50
5.2 Recommended Power Policies ............................................................................................ 5-50 5.2.1 Empowerment of Bangsamoro government to develop power sources ........................ 5-50 5.2.2 Establishment of proper FIT prices ............................................................................... 5-50 5.2.3 Integration of ECs into ARMM ..................................................................................... 5-52 5.2.4 Introduction of capacity development system to Bangsamoro government .................. 5-52

Comprehensive capacity development project for the Bangsamoro Sector Report 2-5: Power Policy
5-iii
List of Tables
Table 1.1 List of Dispatching Control Centers in Mindanao ................................................................ 5-5 Table 1.2 List of Potential Franchise Areas of ECs in Bangsamoro ..................................................... 5-7 Table 1.3 Excerpt from Compliance Report by NEA (1st Quarter, 2014) ............................................ 5-9 Table 1.4 List of Power Generation Facilities in Mindanao ............................................................... 5-10 Table 1.5 List of Generators Connected to Off-grid in ARMM ......................................................... 5-11 Table 1.6 Comparison of Substation Names ...................................................................................... 5-12 Table 1.7 Transmission and Substation Facilities ............................................................................... 5-13 Table 1.8 Distribution Voltage ............................................................................................................ 5-14 Table 1.9 Target Capacity Addition for Introducing Renewable Energy in Mindanao ...................... 5-18 Table 1.10 FIT Rates .......................................................................................................................... 5-18 Table 1.11 Hydropower Potential Resources in Mindanao (as of December 2013) ........................... 5-19 Table 1.12 Hydropower Potential Resources by Province in Bangsamoro ........................................ 5-19 Table 1.13 Hydropower Plant Construction Plan in Mindanao (as of December 2013) .................... 5-20 Table 1.14 Geothermal Power Potential Resources in Mindanao ...................................................... 5-20 Table 1.15 Biomass Capacity Additions Planned in Mindanao (as of December 2013) .................... 5-21 Table 1.16 Solar Potential Resources in Mindanao ............................................................................ 5-23 Table 1.17 Solar Potential Resources in ARMM ................................................................................ 5-23 Table 1.18 Ocean Energy Potential Resources in Mindanao .............................................................. 5-23 Table 1.19 Ocean Energy Potential Resources in ARMM ................................................................. 5-23 Table 1.20 EC’s Unbundled Average Effective Residential Electricity Rates (PHP/kWh),
June 2014 ....................................................................................................................... 5-26 Table 2.1 Committed Projects for New Power Plants in Mindanao ................................................... 5-29 Table 2.2 Added Capacity in Islands of ARMM ................................................................................ 5-30 Table 2.3 Power Circuit Breaker Targeted for Replacement in ARMM............................................. 5-32 Table 2.4 Excerpt from DDP 2010-2019 (SULECO) ......................................................................... 5-33 Table 2.5 MAGELCO Short Term Distribution Development Plan, 2015–2017 ............................... 5-34 Table 2.6 Progress of Energization in ARMM (Disclosed on February 9, 2015) ............................... 5-35 Table 3.1 Demand and Supply Balance Forecast: Feb. 16–22, 2015 ................................................. 5-36 Table 3.2 Example of Power Demand and Supply Balance in Mindanao by Hour ............................ 5-37 Table 3.3 Financial Conditions of ECs in ARMM ............................................................................. 5-39 Table 3.4 ECs’ Distribution Loss Rate ............................................................................................... 5-39 Table 3.5 Electrification Rates in Franchise Area of ECs in ARMM (December 31, 2014) .............. 5-40 Table 4.1 Example of Allocation of Boom Trucks with Bucket/Digger............................................. 5-41 Table 4.2 Substation Load Forecast and Loading Analysis ................................................................ 5-43 Table 4.3 Power Flow Simulation Results ......................................................................................... 5-43

Comprehensive capacity development project for the Bangsamoro Sector Report 2-5: Power Policy
5-iv
List of Figures
Figure 1.1 Concept of Power Business Structure in Mindanao ............................................................ 5-1 Figure 1.2 Organizational Chart of DOE ............................................................................................. 5-2 Figure 1.3 NPC Organizational Chart .................................................................................................. 5-3 Figure 1.4 Organizational Chart of TransCo ........................................................................................ 5-4 Figure 1.5 Organizational Chart of NEA ............................................................................................. 5-5 Figure 1.6 Franchise Areas of ECs in Mindanao .................................................................................. 5-6 Figure 1.7 Franchise Areas of ECs in Bangsamoro .............................................................................. 5-8 Figure 1.8 Organizational Chart of ERC .............................................................................................. 5-9 Figure 1.9 Generation Capacity by Source ......................................................................................... 5-11 Figure 1.10 Generation Shares by Organization in Mindanao (as of April 2014) .............................. 5-11 Figure 1.11 Mindanao Power Supply System Diagram ..................................................................... 5-13 Figure 1.12 Power Flow in the Mindanao Main Grid (December 2, 2014) ....................................... 5-14 Figure 1.13 Transmission and Distribution Lines in Cotabato City ................................................... 5-15 Figure 1.14 Image of CLPC Transmission and Distribution Facility Configurations ........................ 5-15 Figure 1.15 Peak Power Demand in Mindanao .................................................................................. 5-16 Figure 1.16 Energy Consumption by Sector ...................................................................................... 5-16 Figure 1.17 Daily Load Curves in Mindanao Main Grid ................................................................... 5-17 Figure 1.18 Targets for Introducing Renewable Energy in Mindanao ............................................... 5-18 Figure 1.19 Map of Potential Geothermal Development Sites in Mindanao ..................................... 5-21 Figure 1.20 Biomass Potential Resources in Mindanao ..................................................................... 5-22 Figure 1.21 Solar Potential Map of Mindanao ................................................................................... 5-22 Figure 1.22 Mindanao Ocean Energy Potential Map ......................................................................... 5-24 Figure 1.23 Wind Power Potential Resources in Philippines ............................................................. 5-25 Figure 1.24 Electric Tariff by Capital Cities in Asian Countries ........................................................ 5-25 Figure 1.25 Average Electric System Rate ......................................................................................... 5-26 Figure 2.1 Projected Peak Demand in Mindanao ............................................................................... 5-27 Figure 2.2 Demand Forecast for Basilan, Sulu, and Tawi-Tawi ......................................................... 5-27 Figure 2.3 Energy Outlook by Sector in Mindanao: High Economic Target Scenario ...................... 5-28 Figure 2.4 Energy Outlook by Sector in Mindanao: Base Case Scenario .......................................... 5-28 Figure 2.5 Electricity Demand-Supply Balance 2014–2030: High Economic Target Scenario ......... 5-30 Figure 2.6 Electricity Demand-Supply Balance 2014–2030: Base Case Scenario ............................ 5-30 Figure 2.7 Zoomed System Diagram around Tacurong S/S and Sultan Kudarat S/S ......................... 5-31 Figure 2.8 Image of Newly Constructed 138 kV T/L between Tacurong S/S and Sultan Kudarat
S/S ................................................................................................................................. 5-31 Figure 2.9 Image of System Condition before/after Agus1-2 Upgrading and Rehabilitation
Project ............................................................................................................................ 5-32 Figure 2.10 Energization Image by DDP and MEDP for Remote Areas ............................................ 5-34 Figure 3.1 Electricity Demand and Supply Profile of MAGELCO ................................................... 5-37 Figure 3.2 Distribution Line Facilities of MAGELCO ...................................................................... 5-38 Figure 3.3 Record of Power Sales of MAGELCO for October 2014 ................................................. 5-40 Figure 3.4 KWh Meters Installed in Franchise Area of MAGELCO ................................................. 5-40 Figure 4.1 Boom Trucks Owned by MAGELCO and LASURECO .................................................. 5-41 Figure 4.2 Power Facilities for Priority Project in MAGLECO’s Rehabilitation Plan ...................... 5-45 Figure 4.3 Single Line Diagram of Current Distribution System ....................................................... 5-45 Figure 4.4 Location of Malum River in Tawi-Tawi ........................................................................... 5-47 Figure 4.5 Potential Hydro Power Plant Development Sites on Malum River in Tawi-Tawi ............ 5-47 Figure 4.6 Cross Sections of Potential Hydro Power Plant Development Sites ................................. 5-47 Figure 4.7 Average Rainfall in Major Cities by Region in the Philippines, 2000–2012 .................... 5-48 Figure 5.1 Procedure for Improvement of the Bangsamoro Power Sector......................................... 5-51

Comprehensive capacity development project for the Bangsamoro Sector Report 2-5: Power Policy
5-v
Abbreviations, Unit of Measurement, and Currency
(Refer to Sector Report 2-1: Road Transport, pp. 1-v through 1-x.)

Comprehensive capacity development project for the Bangsamoro Sector Report 2-5: Power Policy
5-vi

Comprehensive capacity development project for the Bangsamoro Sector Report 2-5: Power Policy
5-1
CHAPTER 1 CURRENT SITUATION OF MINDANAO POWER SECTOR
1.1 Structure of Power Sector
As of January 2015, the power sector in the Republic of the Philippines is divided into power generation, power transmission, and power distribution business fields respectively, where the national and private power operators are coexisting as power suppliers playing roles in supplying power. The conceptual diagram of the power business structure is shown in Figure 1.1.
In Mindanao, the contract of the electricity transaction between generation companies and distribution companies or customers is based mainly on a bilateral arrangement. On the other hand, the electricity transaction is conducted through wholesale power trading market with the exception of a bilateral contract in the Luzon and Visayas regions. In Mindanao, the Interim Mindanao Electric Market (IMEM), which is a mandatory program for all generation capacities, customers with embedded generation, and distribution utilities, was officially launched in September 2013. However, it is requiring further improvement in terms of system design, contract rule, etc. and the Department of Energy (DOE) is presently making its effort to address those issues in order to allow it to properly function. In the future, the IMEM is to be transferred to the wholesale power trading market as well as the one in Luzon and Visayas.
Source: Power Industry in Overseas Countries (JEPIC), MEP 2014–2030 (DOE).
Figure 1.1 Concept of Power Business Structure in Mindanao
1.2 Regulations and Laws in Power Sector
In 2001, the Electric Power Industry Restructuring Act (EPIRA) was enacted in the power sector of the Philippines and its restructuring process is still ongoing. The purposes of the EPIRA are as follows:
1) Sale of NPC assets, 2) Introduction of market mechanism by establishing wholesale power market, and 3) Introduction of competition principle by liberalization of power retail market.
1.3 Governmental Organizations in Power Sector
1.3.1 Department of Energy
The Department of Energy (DOE) is one of the central governmental administrative authorities that has a jurisdiction in the energy sector in the Philippines and plays a role of formulating basic policies and
On-grid Off-grid
IPPs
NEA
ECs PIOUs
Customer
Generation
Transmission
Distribution
System Operation & Planning
NPC-IPPs
(CLPC, DLPC, ILPC, CEPALCO)(MAGELCO, LASURECO)
NPC-SPUG
ECs
Customer
(BASELCO, TAWELCO, SULECO, SIALECO, CASELCO)
NEATransCo
PSALMManamgement of Power Generation Assets
NPC
Power Flow
Manamgement of Transmission and Sustations Assets
NGCP

Comprehensive capacity development project for the Bangsamoro Sector Report 2-5: Power Policy
5-2
energy program related to the development and utilization of energy resources. The organization chart of DOE is shown in Figure 1.2.
Source: DOE website.
Figure 1.2 Organizational Chart of DOE
1.3.2 National Power Corporation
The National Power Corporation (NPC) was established as a national power company fully capitalized by the Philippine Government in 1936. It used to own the majority of power plants and transmission lines and be the principal power provider in the Philippines. After independent power producers (IPPs) were approved to enter the power market in 1993, the financial status of NPC was seriously aggravated

Comprehensive capacity development project for the Bangsamoro Sector Report 2-5: Power Policy
5-3
because power purchase from IPPs at a high rate, responsibility for fuel supply, and exchange rate risk became a burden on NPC. Furthermore, a depreciation of Peso caused by the Asian currency crisis compounded its management condition, and the financial deficit of the government, consequently, was viewed with suspicion.
In response to this situation, the Philippine Government enacted the EPIRA to restructure the power sector. Since the EPIRA enforcement, the assets owned by NPC are being sold and privatized in order. As of January 2015, the power supply by the power plants (PB104 and Agus-Pulangi complex) operated by NPC accounts for 41% (828 MW) of the total power output 1,794 MW generated by all power plants connected to the Mindanao on-grid. According to 24th Electric Power Industry Reform Act Implementation Status Report periodically issued by ERC, the ownership of the Agus-Pulangi hydro complex, which is the largest hydro power plant in Mindanao, shall be subject to the consultation with the Congress and it is going to be discussed whether the water resource tapped from the Lanao Lake should attribute to the Bangsamoro autonomous equity or the Government of the Philippines.
Source: NPC website.
Figure 1.3 NPC Organizational Chart
1.3.3 National Power Corporation-Small Power Utility Group
The National Power Corporation-Small Power Utility Group (NPC-SPUG) is an organization established inside NPC and has a responsibility for supplying the power for islands such as Basilan, Sulu, and Tawi-Tawi, and missionary areas (remote areas) which have no connection with on-grid. NPC-SPUG is in charge of maintaining and operating small-scale generators and planning the power development plan in the missionary areas. The power generated by NPC-SPUG is supplied for distribution utilities such as electric cooperatives (ECs).
1.3.4 Power Sector Assets and Liabilities
The Power Sector Assets and Liabilities (PSALM) was established based on the EPIRA aiming to proceed with the sale of available assets owned by NPC for the repayment of a debt of NPC. Two

Comprehensive capacity development project for the Bangsamoro Sector Report 2-5: Power Policy
5-4
power plants in Mindanao, namely, PB104 and the Agus-Pulangi hydro complex are now owned by PSALM.
1.3.5 National Transmission Corporation
The National Transmission Corporation (TransCo) was originally the transmission department of NPC. Based on the EPIRA enforcement, it was spun off from NPC and established as TransCo that owns the assets of the transmission facilities ever owned by NPC. TransCo has a responsibility for managing and supervising the transmission business operated by NGCP.
Source: TransCo website.
Figure 1.4 Organizational Chart of TransCo
1.3.6 National Grid Corporation of the Philippines
The National Grid Corporation of the Philippines (NGCP)is a private company that maintains, operates, plans, and constructs 138 kV and 69 kV power transmission network in the Philippines. NGCP took over the system operation business of TransCo that spun off from the transmission department of NPC through bidding. The corporation was established on the basis of joint finance of two domestic companies in the Philippines and State of the Grid in China (SGCP) in 2008. The former companies are Monte Oro Grid Resources Corporation and Calaca High Power Corporation International that are wholly owned subsidiaries of International Container Terminal Services, Inc. (ICTSI), one of the large companies doing port and harbor business.
Each company is equally making 30% investment to NGCP and on the other hand, the investment ratio of SGCP is 40%. As for dispatching control centers in Mindanao, the Mindanao Regional Control Center (MRCC) is conducting power demand and supply operation and five Area Control Centers (ACCs) are conducting system operation allocated to each ACC in Mindanao. Also, back-up function of MRCC is installed in the Iligan ACC. RCC and each ACC have been updated since the mid-2000s

Comprehensive capacity development project for the Bangsamoro Sector Report 2-5: Power Policy
5-5
and a new SCADA/EMS system manufactured by SIMENS has just installed in 2012.
Table 1.1 List of Dispatching Control Centers in Mindanao
Dispatching control center Location Date commissioned Mindanao RCC Cagayan de Oro City April 2012 Butuan ACC Butuan City February 2006 Davao ACC Davao City December 2005 General Santos ACC General Santos City November 2006 Zamboanga ACC Zamboanga City February 2005 Iligan ACC (with backup function of MRCC) Iligan City October 2010
Source: TDP 2013 Volume II (Part1).
1.3.7 National Electrification Administration
The National Electrification Energy (NEA), originally created as the Electrification Administration (EA) in 1960, was established in 1969 for the purpose of promotion of regional electrification as a national policy. NEA’s role is not only to manage and supervise ECs in the Philippines but also to finance ECs as the financial support for regional electrification. NEA sets the goal of achieving the electrification of all regions by the end of 2020. The organization chart of NEA is shown in Figure 1.5.
Source: NEA website.
Figure 1.5 Organizational Chart of NEA
1.3.8 Electric cooperatives
Electric cooperatives (ECs) are non-profit public distribution utilities. In Mindanao, 33 ECs exist including neighboring islands. The franchise of ECs in Mindanao is shown in Figure 1.6. Also, the list of ECs whose franchise could be included in Bangsamoro is shown in Table 1.2.

Comprehensive capacity development project for the Bangsamoro Sector Report 2-5: Power Policy
5-6
Source: DOE, DDP 2010–2019.
Figure 1.6 Franchise Areas of ECs in Mindanao

Comprehensive capacity development project for the Bangsamoro Sector Report 2-5: Power Policy
5-7
Table 1.2 List of Potential Franchise Areas of ECs in Bangsamoro
No. Region Name of ECs Mindanao Island
1 ARMM
Mindanao Electric Cooperative (MAGELCO) 2 Lanao Del Sur Electric Cooperative (LASURECO)
Neighboring Islands 3
ARMM
Basilan Electric Cooperative (BASELCO) 4 Sulu Electric Cooperative (SULECO) 5 Siai Electric Cooperative (SIASELCO) 6 Tawi-Tawi Electric Cooperative (TAWELCO) 7 Cagayan De Sulu Electric Cooperative (CASELCO)
Source: JICA Study Team.
The detailed franchise map of each EC in Bangsamoro is shown Figure 1.7. The bold red lines on the map mean 13.2 kV distribution lines and is called as a back-bone line.
MAGELCO & CLPC LASURECO
BASELCO SULECO

Comprehensive capacity development project for the Bangsamoro Sector Report 2-5: Power Policy
5-8
TAWELCO SIASELCO
CASELCO
Source: Documents provided by NEA.
Figure 1.7 Franchise Areas of ECs in Bangsamoro
ECs provide the power for their customers through their owned distribution network and maintain, plan and construct the distribution lines including 69 kV sub-transmission lines. In the first quarter of 2014, the performance assessment targeting for ECs was conducted by NEA and all the ECs were classified into Green, Yellow (b-1), Yellow (b-2) and Red in terms of its operation and financial status. As a result of the assessment, most ECs in the ARMM are categorized into Red group. “Red” means that the performance improvement is strongly required. Especially, the Mindanao Electric Cooperative (MAGELCO) was evaluated as the worst rate (11th of 11 ECs included in the Red group). With regard to other ECs in the ARMM, Lanao del Sur Electric Cooperative (LASURECO) was 10th, Sulu Electric Cooperative (SULECO) was 9th, Basilan Electric Cooperative (BASELCO) was 8th, Tawi-Tawi Electric Cooperative (TAWELCO) was 7th in the Red group. The assessment report shows that most ECs in the region are facing the severe condition from an operational and financial point of view. The excerpt from the assessment report by NEA is shown in Table 1.3.

Comprehensive capacity development project for the Bangsamoro Sector Report 2-5: Power Policy
5-9
Table 1.3 Excerpt from Compliance Report by NEA (1st Quarter, 2014)
Source: NEA, Compliance Report on Performance of ECs 1st Quarter, 2014.
1.3.9 Private investor-owned utilities and local government unit-owned utilities
Aside from ECs, private investor-owned utilities (PIOUs) and LGU-owned utilities (LGUOUs) operated by local governments are existing in the Philippines. In Mindanao, two major private distribution utilities (DUs), Davao Light and Power Company (DLPC) and Cotabato Light and Power Company (CLPC), both of which are owned by one of major holding companies representing the Philippines, the Avoitiz group, and Illigan Light and Power Company (ILPC), and Cagayan Electric Power and Light Company (CEPALCO) are doing their business as PIOUs. Of those DUs, CLPC is supplying power for Cotabato City in the ARMM.
1.3.10 Energy Regulatory Commission
The Energy Regulatory Committee (ERC) was established on the basis of the EPIRA and has the authority of regulating and supervising generation, transmission, and distribution business fields. Also, ERC has a role for streamlining regulatory rules of the power supply and acceleration of competition in the power market. The organization chart of ERC is shown in Figure 1.8.
Source: ERC website.
Figure 1.8 Organizational Chart of ERC

Comprehensive capacity development project for the Bangsamoro Sector Report 2-5: Power Policy
5-10
1.4 Generation
1.4.1 Ratio of generation fuel types
As of March 2014, the total installed capacity of all generation facilities in Mindanao (Table 1.4) is 2,150.9 MW and the total dependable power output is 1,811.7 MW. Figure 1.9 shows the generation shares by source: diesel 33.1%, hydro 49.3%, coal 10.8%, geothermal 5.0%, and biomass 1.7%. The share of solar generation is almost nil. Close to a half of the power supply depends on hydro generation. New IPPs using coal, however, are planned to be constructed in the near future, and the dependence on hydro power generation is projected to decrease. The generation shares by owner in Mindanao is shown in Figure 1.10. According to this figure, the generation share of NPC accounts for 50% and that of PSALM is 25% of all. From this point of view, it is found that the generation power still depends on the power plants owned by the Government.
Table 1.4 List of Power Generation Facilities in Mindanao
The Agus-Pulangi hydro complex, tapped from the largest lake in Mindanao, Lanao Lake, is included in the government-owned power plants and it is highly controversial whether or not these power plants should be attributed to the Bangsamoro autonomous equity. According to Mindanao Development Authority (MinDA), it seems that there is an opinion that the generation facility itself should be owned by the Central Government and the water resource tapped from the Lanao Lake as a fuel should be attributed to the new Bangsamoro government. In the 24th Electric Power Industry Reform Act Implementation Status Report, there is a description that the ownership of Agus-Pulangi hydro complex would be decided based on the discussion in the Congress in 2017.
【Diesel】 712.9 653.6 MINDANAO ENERGYSYSTEM 1
18.9 18.0 1 25-Aug-1995
MINDANAO ENERGYSYSTEM 2
27.5 27.0 2 March 2012
COTABATO LIGHT 10.0 9.9 6 1963BAJADA DPP 58.7 48.0 12 05-Jun-1995KING ENERGY 3.2 3.1 26-Aug-2012SPPC 59.0 50.0 6 26-Mar-1998PB 104 32.0 16.0 4 September 2005TMI 2 100.0 99.0 2 26-Feb-1994TMI 1 100.0 99.0 2 20-Jul-1994WMPC 113.0 100.0 10 12-Dec-1997MPC - IDPP 103.0 98.0 18 May 2014KEGI - Misamis Or. 10.6 10.0 25-Sep-2013MPC-Koronadal 13.0 13.0 01-Oct-2013EEI Power 15.0 15.0 26-Dec-2013SoEnergy 19.0 19.0 March 2014
MPC-Digos 15.0 15.0 28 March 2014
KEGI - Panaon 15.0 13.6 May 2014
【Geothermal】 108.5 98.0
MT APO 108.5 98.0 2 15-Dec-1996
【Hydro】 1,060.6 839.7 Large Hydroelectric Plants 1,024.7 812.0 AGUS 1 80.0 50.0 2 23-Jun-1992AGUS 2 180.0 122.0 3 6-June-1979, 27-Nov-1979AGUS 4 158.1 136.0 3 16-Mar-1985, 16-Apr-1985AGUS 5 55.0 52.0 2 9-Feb-1985, 8-Mar-1985AGUS 6 200.0 151.0 5 1-Jul-1953, 28-Apr-1971AGUS 7 54.0 40.0 2 5-Mar-1983, 17-Dec-1983PULANGI 4 255.0 225.0 3 21-Dec-1985, 21-Jun-1986SIBULAN HEP 42.6 36.0 4 March 2010Small Hydroelectric Plants 35.9 27.7AGUSAN 1.6 1.6 2 28-Dec-1957BUBUNAWAN 7.0 0.0 1 22-Sep-2001CABULIG HEP 9.2 8.0 1 24-Sep-2012TALOMO HEP 4.5 4.5 5 01-Oct-1998TUDAYA 1 6.6 6.6 2014/5/1TUDAYA 2 7.0 7.0 2014/5/1
【Solar】 1.0 0.3 SOLAR PV 1.0 0.3 1 September 2004
【Coal】 232.0 210 MINDANAO COAL 232.0 210.0 2 16-Sep-2006
【Biomass】 35.9 10.0 CRYSTAL SUGAR 35.9 10.0 4
Total Mindanao 2,150.9 1,811.7
Release Date, Oct 2014
Cagayan de Oro City Mindanao Energy Systems
Facility NameInstalledCapacity
DependableCapacity
Numberof Unit
Location Owner Year Commissioned
Cagayan de Oro City Mindanao Energy Systems
Cotabato Cotabato LightDavao City Davao LightValencia City, Bukidnon King Energy Generation IncAlabel, Sarangani Southern Philippines PowerBrgy Ilang,Davao PSALM
Nasipit, Agusan del Norte Therma Mobile Inc.Maco, Davao del Norte Therma Marine Inc.Sangali, Zamboanga City Western Mindanao PowerDalipuga, Iligan City Mapalad Power CorporationGingoong, Misamis Oriental King Energy Generating Inc.Koronadal City, South Cotabato Mapalad Power CorporationDavao del Norte EEI Power
Kidapawan, North Cotabato Energy Development Corp.
Marawi City,Lanao Sur PSALMSaguiaran, Lanao Sur PSALMBaloi, Lanao del Norte PSALMBuru-un, Iligan City PSALMBuru-un, Iligan City PSALMBuru-un, Iligan City PSALMMaramag, Bukidnon PSALMSanta cruz, Davao del Sur HEDCOR Sibulan Inc. M. Fortich, Bukidnon FG Bukidnon Power Corp.Baungon,Bukidnon BPC Inc.Claveria, Misamis Oriental Mindanao Energy SystemsMintal, Davao City HEDCOR Inc.
Note: Excluding off-grid generators, parts in red mean
Bgry. Apopong, Gen. Santos City, South Cotabato SoEnergy Int'l Philippines, Inc.
Digos, Davao del sur Mapalad Power Corporation
Panaon, Ozamis City, Misamis Occ. King Energy Generation Inc
Sta. Cruz, Davao del Sur
PHIVIDEC,Villanueva,Misamis STEAG State Power Inc. Maramag, Bukidnon Crystal Sugar Co., Inc.
Sta. Cruz, Davao del Sur
HEDCOR Inc.
HEDCOR Inc.
Sitio Lomboy,Cagayan de Oro CEPALCO
Source: DOE, List of Existing Plants 2014

Comprehensive capacity development project for the Bangsamoro Sector Report 2-5: Power Policy
5-11
Source: Created by DOE, List of Existing Plants
2014. Source: DOE, 24th EPIRA Implementation Status Report
(covering Nov. 2013 to Apr. 2014).
Figure 1.9 Generation Capacity by Source Figure 1.10 Generation Shares by Organization in Mindanao (as of April 2014)
1.4.2 Off-grid generators
Generators connected to the off-grid system exist in the islands in the ARMM and are operated by NPC-SPUG. All generators are diesel generators and the one in Basilan is the largest-scale unit with a capacity of approximately 20 MW. The second largest unit is installed in Sulu and its capacity is 15 MW. In Tawi-Tawi, the generator with a capacity of approximately 6 MW is installed and the remaining smaller-scale units are dispersedly installed in the island. Since these generators are run by diesel fuel oil, the burden on the environment is large and can be operated only for 6–8 hours per day due to the mechanical limitation. Accordingly, it is necessary and meaningful to introduce generation that can be operated during 24 hours and eco-friendly generations utilizing renewable energy in order to achieve the stable power supply and revitalization of the local economic activities. Table 1.5 shows the list of generators connected to the off-grid in the ARMM (islands).
Table 1.5 List of Generators Connected to Off-grid in ARMM
NPC-SPUG Power Plants
ECs Existing Capacity
Operating hours
Location Installed (MW)
Dependable(MW)
Sulu SULECO 15.54 10.40 24 Sulu Luuk SULECO 0.33 0.29 8 Sulu Siasi SIASELCO 2.08 1.65 20 Sulu Tawi-Tawi TAWELCO 6.49 4.16 24 Tawi-Tawi Cagayan de Tawi-Tawi CASELCO 1.02 0.80 8 Tawi-Tawi Balimbing TAWELCO 0.73 0.65 8 Tawi-Tawi Manuk-Mangkaw TAWELCO 0.16 0.15 6 Tawi-Tawi Sibutu TAWELCO 0.33 0.28 6 Tawi-Tawi Sitangkay TAWELCO 1.16 0.99 6 Tawi-Tawi Tandubanak TAWELCO 0.44 0.38 6 Tawi-Tawi Tandubas TAWELCO 0.26 0.22 6 Tawi-Tawi West Simunul TAWELCO 0.73 0.63 6 Tawi-Tawi Basilan BASELCO 20.05 14.40 24 Basilan
Total 49.32 35
Source: DOE, Mindanao Energy Plan 2014.
According to Table 1.5, the dependable capacity of all the generators in the islands provinces is a bit smaller than the installed capacity. This is because the actual output is set to be 80% of the installed capacity. However, due to the shortage of spare parts and aging of facilities and equipment, some units cannot produce the power at 60% to 70% of the installed capacity.

Comprehensive capacity development project for the Bangsamoro Sector Report 2-5: Power Policy
5-12
1.4.3 Independent power producers
In the 1990s, independent power producers (IPPs) were approved to enter the power market in the Philippines to eliminate serious shortages of power sources. Since then, IPPs became a major part of power generation share in the power market of the Philippines due to the development of new power generation financed by conglomerates and the promotion of sales of generation assets owned by NPC. However, the ratio of IPPs facilities in all the generation facilities in Mindanao still remains to be approximately 25%. IPPs are classified into NPC/IPPs that sell the power to NPC based on a supply-demand contract with NPC and Non-NPC/IPPs that supply the power for customers through the transmission network based on the bilateral contract.
The typical major conglomerate managing IPPs in Mindanao is the Avoitiz group and approximate 19% of all the power plants in Mindanao are operated by subsidiary companies under the umbrella of the Avoitiz group. Not only Therma Mobile Inc. and Therma Marine Inc. that have generators with a capacity of 100 MW respectively but also local distribution company, CLPC with diesel generators that supplies the power for Cotabato City and DLPC that supplies the power for Davao City are wholly owned subsidiary companies of the Avoitis group. As a second typical conglomerate, the Alson Power group is well-known group operating several IPPs. The power plants owned by the Alson group account for approximately 14% of all the power plants in Mindanao. Mapalad Power Corporation that have generators with a capacity of 103 MW is also a subsidiary under the Alson power group.
1.5 Transmission System
The transmission system in Mindanao is divided broadly into on-grid and off-grid. The off-grid means the small-scale and independent power network that is not connected to the on-grid. The transmission network is operated at the voltage class of 138 kV and 69 kV. The transmission system including substations is operated and maintained by the private company, NGCP, based on the grid-code under supervision of TransCo that manages the transmission and substation assets. The on-grids in Luzon and Visayas are connected by a submarine cable. The on-grid in Mindanao, however, unconnected to the Luzon-Visayas power system, is an independent system in Mindanao. The system diagram in Mindanao is shown in Figure 1.11.
To ensure the consistency and standardization in naming of substations, some substations described above is renamed as shown in Table 1.6.
Table 1.6 Comparison of Substation Names
Source: NGCP, Transmission Development Plan 2013.

Comprehensive capacity development project for the Bangsamoro Sector Report 2-5: Power Policy
5-13
Source: NGCP, Transmission Development Plan 2013.
Figure 1.11 Mindanao Power Supply System Diagram
Figure 1.12 presents actual power flow in the Mindanao main grid. This was recorded at 16:59 on December 2, 2014. From this power flow, it is found that the power was being transmitted largely from the north to the south. It is because many power plants with a large capacity such as the Agus hydro power plants are intensively situated in the northern part of Mindanao and the regions consuming much load such as the Davao City are situated in the southern part of Mindanao. On the other hand, focusing on the ARMM, which will be incorporated into the Bangsamoro region, the power flow for each transmission line from Kibawe to Sultan Kudarat and Tacuronge located in the province of Maguindanao and Sultan Kudarat is 32.2 MW and 66.6 MW, respectively.
Table1.7 shows the scales of transmission and substation facilities in the Mindanao main grid.
Table 1.7 Transmission and Substation Facilities
Voltage class Transmission lies
(ckt-km) Sub-transmission Lines (ckt-km)
Substation capacity (MVA)
138 kV 3,268.09 33.84 3,240 69 kV ≥ 4 1,839.71 77.5
Total 3,272.09 1,839.71 3,317.5
Source: NGCP, Transmission Development Plan 2013.

Comprehensive capacity development project for the Bangsamoro Sector Report 2-5: Power Policy
5-14
Source: NGCP.
Figure 1.12 Power Flow in the Mindanao Main Grid (December 2, 2014)
1.6 Distribution System
1.6.1 System profile
The distribution system in Mindanao is operated by ECs or PIOUs. Table 1.8 shows distribution voltage applied to the distribution network in Mindanao. The applied voltage and number of power lines are determined based on the conditions of power demand scale and power contract with customers.
Table 1.8 Distribution Voltage
Classification Voltage Type of neutral grounding point
High voltage 13.2 kV (3-phase 3-line, 3 phase 3-line), 7.62 kV (1-phase) Solidly grounded Low voltage 240V (1-phase 2-line), 3-phase 3-line —
Source: NEA.
In the ARMM, the jointly used poles shared by transmission lines and distribution lines are observed. Figure 1.13 shows the picture of transmission lines and distribution lines passing through Cotabato City.
Both transmission lines and distribution lines are owned and maintained by CLPC that supplies the power for Cotabato City. According to CLPC, the upper transmission lines are power facilities that were constructed to link points receiving the power from NGCP to improve the reliability of power supply. Figure 1.14 illustrates the image of CLPC transmission and distribution facility configurations.
Under the normal condition, the power is supplied for Cotabato City by the distribution line of CLPC via the Sultan Kudarat substation managed by NGCP. If the power supply is interrupted due to the system fault occurred at the upper transmission system of NGCP, the power failure can be restored in supplying the power from the extra power source, the Tacurong substation. CLPC accomplished the high supply reliability by introducing this system configuration.
1.6.2 Utilities rates
Utilities rates including electricity in the Philippines are relatively high compared to other Asian countries.

Comprehensive capacity development project for the Bangsamoro Sector Report 2-5: Power Policy
5-15
Figure 1.13 Transmission and Distribution Lines in Cotabato City
Figure 1.14 Image of CLPC Transmission and Distribution Facility Configurations
1.7 Power Demand
The power demand in Mindanao is on a strong upward trend and the average growth rate of power demand is approximately 3.8% over the past decade. Figure 1.15 shows the actual demand in Mindanao from 2004 to 2013 over the past decade.
In a certain year, negative growth was found but the peak demand is growing at the average rate of approximately 2.45%. In accordance with this growing trend of the peak demand, the energy consumption is also growing as shown in Figure 1.16. As of the fiscal year (FY) 2013, the energy consumption by the residential use is the leading primary use representing 41.5% (249 kTOE) of the total power consumption. Also, the energy consumption in the industrial and commercial use combined accounts for 38.9% (233 kTOE) and 19.7% (118 kTOE) respectively. The energy consumption in the agriculture is relatively small compared to the one in other sectors.
Figure 1.17 presents the daily load curve showing the power demand changing from hour to hour in the Mindanao main grid. The power load tends to reach the peak from 18:00 to 20:00 in the evening and the maximum power demand to be recorded till the end of 2013 is 1,420 MW recorded on December12, 2013. On the other hand, the minimum power demand is 1,027 MW recorded on January1, 2013. However, this load duration curve is superficial because this is formed with a result of load curtailment during the daytime caused by the shortage of power supply. It might become the different shape if this is formed without an effect of load curtailment. As a trend, the power consumption in the dry season is a bit larger than the one in the wet season.
Tacurong S/S
Jurisdiction of NGCP
Assets of CLPC
69kV Transmission Line
13.2kV Distribution System
Substation
Power
In case that the power supply from Sultan Kudarat is interrupted due to unforseensystem faults, the power supply can be recovered by switching this circuit breaker.
<Cotabato>
Sultan Kudarat S/S
13.2kV Distribution System 13.2kV Distribution System
Power
SubstationSubstation
PowerPowerPower
Jurisdiction of NGCP
69 kV Transmission
13.2 kV Distribution

Comprehensive capacity development project for the Bangsamoro Sector Report 2-5: Power Policy
5-16
Source: DOE, Philippine Power Statistics 2013 & Mindanao Energy Outlook 2014–2030.
Figure 1.15 Peak Power Demand in Mindanao
Source: DOE, Mindanao Energy Outlook 2014–2030.
Figure 1.16 Energy Consumption by Sector
Year 2004 2005 2006 2007 2008 2009 2010 2011 2012 2013
Peak Demand[MW]
1,177 1,149 1,228 1,241 1,204 1,303 1,288 1,346 1,321 1,428
Growth Rate 4.07% -2.38% 6.88% 1.06% -2.98% 8.22% -1.15% 4.50% -1.86% 8.10%
Year 2003 2004 2005 2006 2007 2008 2009 2010 2011 2012 2013
Agriculture 23 29 21 24 34 25 33 28 26 27 31
Residential 231 246 252 257 265 266 239 239 250 254 249Commercial 68 74 76 78 83 88 98 109 114 124 118
Industrial 153 166 172 171 180 189 203 210 224 238 233Others 0 0 0 0 0 0 0 0 0 0 0
Electricity Sales 452 487 500 506 528 543 540 558 588 616 600Utilities Own Use 9 12 15 15 24 24 25 24 25 26 21
Power Losses 75 80 85 91 91 92 107 110 107 114 116Total 536 579 600 612 643 659 672 692 720 756 737

Comprehensive capacity development project for the Bangsamoro Sector Report 2-5: Power Policy
5-17
894 862 844 841
885 923
867
978
1,163
1,260 1,308 1,292 1,272
1,327 1,302 1,294 1,239
1,420 1,372
1,333
1,243
1,126
1,027
928 928
819 761
728 731 677 659 673 698
713 748 780 792 800 805 802
798
969 1,007
1,027 973
886
811
766
0
200
400
600
800
1,000
1,200
1,400
1,600
1 2 3 4 5 6 7 8 9 10 11 12 13 14 15 16 17 18 19 20 21 22 23 24
Pow
er D
eman
d [M
W]
[Time]
Highest Peak(Dec.12, 2013)
Lowest Peak(Jan.1, 2013)
Dry Season, Weekday(May.15, 2013)
Dry Season, Saturday(May.11, 2013)
Dry Season, Sunday(May.12, 2013)
Wet Season, Weekday(Jul.3, 2013)
Wet Season, Saturday(Jul.6,2013)
Wet Season, Sunday(Jul.7,2013)
Source: Provided by NGCP.
Figure 1.17 Daily Load Curves in Mindanao Main Grid
1.8 Conventional Energy Sources
The present JICA Study focusses on power supply policies for Bangsamoro instead of covering the broader energy sector as a whole. The Philippine Government promotes use of renewable energy for power supply in general. In Mindanao, a large coal-fired thermal plant will be commissioned in 2016, followed by small hydropower plants to resolve power shortages by the main grid power supply. Also, oil-fired thermal power and gas turbine plants make the unit cost of electricity higher than the existing hydropower derived electricity. In view also of adverse environmental effects, conventional power supply based of fossil fuel resources is not dealt with in the Study.
There exist potentials for natural gas in the Ligawasan Marsh area of Maguindanao, which may deserve investigation. A pre-feasibility level study may be undertaken to examine this possibility for power supply.
1.9 Renewable Energy
In the Philippines, the renewable energy (RE) is being gradually introduced since the promulgation of the Renewable Energy Laws enacted in 2008, which aims to protect the environment and ensure the national energy security. In the National Renewable Energy Program (NREP), DOE formulated the development plan for introducing RE such as geothermal, hydro, biomass, wind, solar and ocean energy to set targets for the whole area of the Philippines and each regional area, Luzon, Visayas and Mindanao. Table 1.9 shows the target allocated by accumulated annual goal set for each type of renewable energy on the capacity of the existing units (Figure 1.18).
By the end of 2030, the hydro power capacity will be most developed as the largest target, 1,263.9 MW, followed by the development of the geothermal, 340 MW. The development of biomass, wind, solar and ocean energy are relatively small compared to the hydro and geothermal. In order to achieve this goal, it is required that the comprehensive system is developed to tackle and cope with a gap impeding popularization of RE and the essential features of action plan is formulated to promote the investment by the private sector. On the other hand, the proper setting of fee-in-tariff (FIT) is required to stimulate the spread of RE. If not proper, it would be difficult to attract the investors, who try to secure their profit by harnessing RE, of which the generation cost is higher than the fossil fuel, to the power market. Table 1.10 shows the FIT rate approved by ERC on July 2012. Incidentally, this FIT rate is applied to the power generators with renewable energy resource which are connected to the main grid.

Comprehensive capacity development project for the Bangsamoro Sector Report 2-5: Power Policy
5-18
Table 1.9 Target Capacity Addition for Introducing Renewable Energy in Mindanao
Source: DOE, Renewable Energy Plans and Programs.
Source: DOE.
Figure 1.18 Targets for Introducing Renewable Energy in Mindanao
Table 1.10 FIT Rates
Types of RE PHP/kWh Wind 8.53 Biomass 6.63 Solar 9.68 Hydropower (run-of-river) 5.90
Source: DOE, Mindanao Energy Plan 2014.
1.9.1 Hydro power potential resources
According to the Mindanao Energy Plan (MEP) 2014–2030 prepared by DOE, it is estimated that the equivalent of 1,379.32 MW has hydro resource potential and the number of potential sites for its exploration and development is estimated to be 238 in Mindanao. Of the total potential resources, the hydro power potential with 17 identified sites which could provide a total aggregate capacity of 27.15 MW is estimated in the ARMM. The hydro power potential resources in Mindanao are shown in Table 1.11.
A ratio of hydro potential resources in the region accounts only for 2% of the total potential capacity in
108.5158.5
398.5
428.5 448.5
10471121.8
2010.9
2310.9 2310.9
0
500
1000
1500
2000
2500
2014.3 2015 2020 2025 2030
[MW]
[Year]
Geothermal
Hydro
Biomass
Wind
Solar
Ocean Energy

Comprehensive capacity development project for the Bangsamoro Sector Report 2-5: Power Policy
5-19
the whole area of Mindanao and the number of hydro potential sites is the least in the ARMM compared to other regions. Table 1.12 shows hydro potential resources by province in Mindanao.
Although the number of hydro potential sites is eight, the largest number compared to other provinces, the potential capacity is only around 5 MW and smaller than in Lanao del Sur and Sulu. Nine commissioned projects, which are not in the ARMM but in Region X and Region XI, are ongoing and new hydro power plants with total capacity of 90.8 MW are scheduled to be commissioned by the end of 2017. Further, indicative six projects are expected in the northern part of Mindanao. No development project is planned in the ARMM (Table 1.13).
Table 1.11 Hydropower Potential Resources in Mindanao (as of December 2013)
Region Location No. of potential sites Total estimated capacity (MW) IX Zamboanga Peninsula 28 80.06 X Northern Mindanao 63 679.79 XI Davao Region 41 151.58 XII SOCCSKSARGEN 46 161.05 XIII Caroga 43 279.69
ARMM ARMM 17 27.15 Total 238 1,379.32
Source: DOE, Mindanao Energy Plan 2014.
Table 1.12 Hydropower Potential Resources by Province in Bangsamoro
Province No. of sites Potential capacity (MW) Pre-development investment
requirement (PHP 106) Maguindanao 8 5.23 562.23 Lanao del Sur 7 11.29 1,213.68 Sulu 2 10.63 1,142.73
Total 17 27.15 2,918.64
Source: DOE, MEP 2014–2030.
1.9.2 Geothermal potential resources
The Philippines having active volcanic activities are endowed with rich geothermal resources and remains the second largest geothermal power producer in the world. In Mindanao, Mt. Apo geothermal power plant with a capacity of 108.5 MW is operated by a private company which sells the generated power to NPC based on the power purchase agreement. The geothermal power potential resources estimated as of December 2013 are 290 MW in Mindanao. Table 1.14 and Figure 1.19 show the geothermal power potential resources in Mindanao and map of the geothermal development in Mindanao respectively. As of January 2015, no addition of geothermal power plants is planned in the ARMM.
1.9.3 Biomass potential resources
Mindanao is endowed with rich biomass resources. According to the biomass potential map issued by DOE, the bagasse potential resources are nil, while rice potential resources are estimated to be 4.47 MW and coconuts are estimated to be 84.87 MW (Figure 1.20). As of January 2015, two construction projects of the biomass power plants in Maguindanao are ongoing and they were originally scheduled to be commissioned by the end of 2015. The output of each power plant is 1.6 MW and 10 MW, respectively. Table 1.15 shows the biomass capacity additions planned in Mindanao.
1.9.4 Solar potential resources
Solar energy is one of the promising RE resources in Mindanao. Studies conducted by the National Renewable Energy Laboratory (NREL) indicate that Mindanao has high solar power potential with an average amount of 5–5.5 kW/m2/day (Figure 1.21).

Comprehensive capacity development project for the Bangsamoro Sector Report 2-5: Power Policy
5-20
Table 1.13 Hydropower Plant Construction Plan in Mindanao (as of December 2013)
Source: DOE, MEP 2014–2030.
Table 1.14 Geothermal Power Potential Resources in Mindanao
Region Location No. of potential sites Total estimated capacity(MW) IX Zamboanga Peninsula 1 40 X Northern Mindanao 3 80 XI Davao Region 1 40 XII SOCCSKSARGEN 3 100 XIII Caroga 1 30 Total 9 290
Source: DOE, Mindanao Energy Plan 2014.

Comprehensive capacity development project for the Bangsamoro Sector Report 2-5: Power Policy
5-21
Source: DOE, Renewable Energy Plans and Programs (2011–2030).
Figure 1.19 Map of Potential Geothermal Development Sites in Mindanao
Table 1.15 Biomass Capacity Additions Planned in Mindanao (as of December 2013)
Source: DOE, MEP 204–2030.

Comprehensive capacity development project for the Bangsamoro Sector Report 2-5: Power Policy
5-22
Rice
Baggasse
Coconuts
Source: DOE website.
Figure 1.20 Biomass Potential Resources in Mindanao
Source: NREL materials.
Figure 1.21 Solar Potential Map of Mindanao
Mindanao has 17 solar potential sites, of which two sites are located in the ARMM (Table 1.16). Their combined output is around 37 MW, accounting for 18% of total estimated capacity in Mindanao. Those pre-development projects entail estimated cost of approximately PHP 2,918.64 million. The breakdown of solar potential sites in the ARMM is shown in Table 1.17.

Comprehensive capacity development project for the Bangsamoro Sector Report 2-5: Power Policy
5-23
Table 1.16 Solar Potential Resources in Mindanao
Region Location No. of potential sites Total estimated capacity (MW) IX Zamboanga Peninsula 3 21 X Northern Mindanao 1 20 XI Davao Region 2 45 XII SOCCSKSARGEN 5 47 XIII Caroga 4 31
ARMM ARMM 2 37 Total 17 201
Source: DOE, Mindanao Energy Plan 2014.
Table 1.17 Solar Potential Resources in ARMM
Region Location Potential capacity
(MW) Pre-development investment
requirement (PHP 106)
ARMM Tawi-Tawi 2 172 Marawi, Lanao Del Sur 35 3,010
Total 37 2,918.64
Source: ibid.
1.9.5 Ocean energy potential resources
Ocean energy power generation is a generating method harnessing RE such as ocean current, wave, tide, and a difference of sea water temperature. Mindanao has eight ocean energy potential sites identified with total capacity of 24 MW, of which the ARMM has five potential sites with a capacity of 8 MW (Table 1.18). Table 1.19 shows the ocean energy potential resources by location in the area. As shown in Figure 1.22, the ocean energy potential sites are studded with coastal areas of Mindanao and small neighboring islands.
Table 1.18 Ocean Energy Potential Resources in Mindanao
Region Location No. of potential sites Total estimated capacity (MW) XII SOCCSKSARGEN 1 1 XIII Caroga 2 15
ARMM ARMM 5 8 Total 8 24
Source: ibid.
Table 1.19 Ocean Energy Potential Resources in ARMM
Region Location Potential capacity
(MW) Pre-development investment
requirement (PHP 106)
ARMM Tongkil, Sulu 1 7 Sulu 2.5 17.5 Tawi-Tawi 4.5 31.5
Total 8 168
Source: ibid.
1.9.6 Wind power potential resources
According to the investigation result by NREL, the wind power potential resources in Mindanao are lower than those in Luzon and Visayas (Figure 1.23). According to Figure 1.23, Mindanao has the highest wind power potentials with total capacity of 2,000 to 4,000 MW in the western coastal area of Mindanao Island. However, it is comparatively lower than in Luzon and Visayas. The ARMM has wind power potential resources with a capacity of 100 to 1,000 MW and it is also lower than in other regions. For the development of wind power, a small part of Region X and Region XIII in Mindanao is targeted.
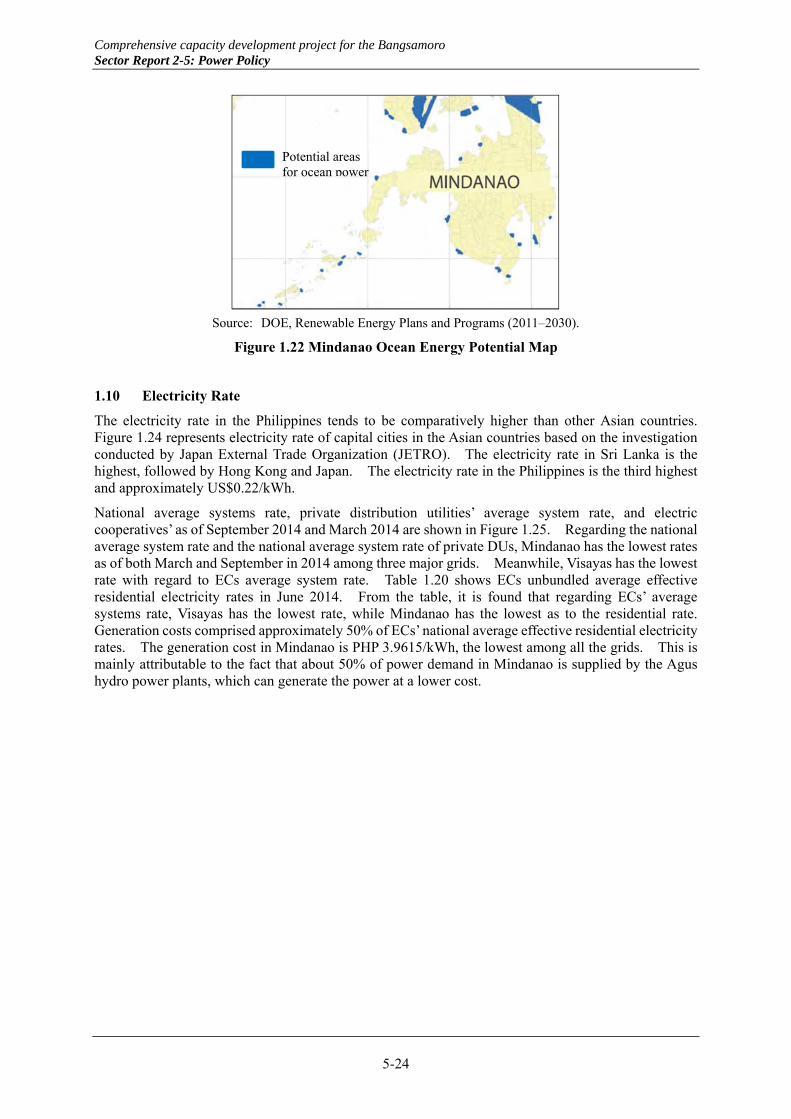
Comprehensive capacity development project for the Bangsamoro Sector Report 2-5: Power Policy
5-24
Source: DOE, Renewable Energy Plans and Programs (2011–2030).
Figure 1.22 Mindanao Ocean Energy Potential Map
1.10 Electricity Rate
The electricity rate in the Philippines tends to be comparatively higher than other Asian countries. Figure 1.24 represents electricity rate of capital cities in the Asian countries based on the investigation conducted by Japan External Trade Organization (JETRO). The electricity rate in Sri Lanka is the highest, followed by Hong Kong and Japan. The electricity rate in the Philippines is the third highest and approximately US$0.22/kWh.
National average systems rate, private distribution utilities’ average system rate, and electric cooperatives’ as of September 2014 and March 2014 are shown in Figure 1.25. Regarding the national average system rate and the national average system rate of private DUs, Mindanao has the lowest rates as of both March and September in 2014 among three major grids. Meanwhile, Visayas has the lowest rate with regard to ECs average system rate. Table 1.20 shows ECs unbundled average effective residential electricity rates in June 2014. From the table, it is found that regarding ECs’ average systems rate, Visayas has the lowest rate, while Mindanao has the lowest as to the residential rate. Generation costs comprised approximately 50% of ECs’ national average effective residential electricity rates. The generation cost in Mindanao is PHP 3.9615/kWh, the lowest among all the grids. This is mainly attributable to the fact that about 50% of power demand in Mindanao is supplied by the Agus hydro power plants, which can generate the power at a lower cost.
Potential areas for ocean power

Comprehensive capacity development project for the Bangsamoro Sector Report 2-5: Power Policy
5-25
Source NREL, Wind Energy Resource Atlas of the Philippines.
Figure 1.23 Wind Power Potential Resources in Philippines
Source: JETRO website data.
Figure 1.24 Electric Tariff by Capital Cities in Asian Countries
0.00
0.05
0.10
0.15
0.20
0.25
0.30
0.35
0.40
India(New Deli)
Indonesia(Jakarta)
Cambodia(Phnun Penh)
Singapore(Singapore)
Sri Lanka(Colombo)
Pakistan(Kalachi)
Bangladesh(Dhaka)
Malaysia(Kuala Lumpur)
Vietnum(Hanoi)
Tailand(Bangkok)
Myanmer(Yangon)
Mongolia(Ulan Bator)
Laos(Vientian)
Korea(Soul)
Taiwan(Taipei)
China(Beijin)
Hong Kong(Hong Kong)
Japan(Tokyo)
Philippine(Maila)
Ele
ctri
city
Rat
e [U
SD
]
Country (Capital City)

Comprehensive capacity development project for the Bangsamoro Sector Report 2-5: Power Policy
5-26
Source: DOE, 25th EPIRA Implementation Status Report.
Figure 1.25 Average Electric System Rate
Table 1.20 EC’s Unbundled Average Effective Residential Electricity Rates (PHP/kWh), June 2014

Comprehensive capacity development project for the Bangsamoro Sector Report 2-5: Power Policy
5-27
CHAPTER 2 POWER SECTOR DEVELOPMENT PLAN
2.1 Demand Forecast
Two demand projections, namely, Base Case and High Economic Target, have been prepared by DOE. The base case demand forecast is obtained from the Distribution Development Plan (DDP) submitted by all distribution utilities in Mindanao, while the high economic target demand forecast is based on the gross regional domestic product (GRDP) target from the peace and development framework plan prepared by Mindanao Development Authority (MinDA). In the case of the high economic target scenario, the growth rate of peak demand is expected to be around 12-14% during 2014-16. From 2017 onward, the peak demand growth rate is expected to be 8-10%. On the other hand, in the case of base case scenario, the growth rate of peak demand is estimated to be around 6-12% and from 2017 onward, the growth rate of around 4-5% is expected. Figure 2.1 shows the peak demand projection for both the base case scenario and the high economic target scenario in Mindanao.
Source: DOE, Mindanao Energy Outlook 2014–2030.
Figure 2.1 Projected Peak Demand in Mindanao
As for the demand forecast in missionary areas such as Basilan, Sulu, and Tawi-Tawi, the peak demand is expected to increase substantially by the end of 2030. The projected peak demand for Basilan and Tawi-Tawi in 2030 is estimated to be approximately twice as much as the demand in 2014. Also, it is expected that the peak demand for Sulu in 2030 will reach 38.92 MW, which is equivalent to about 4.6 times the demand in 2014. Figure 2.2 shows the demand forecast for Basilan, Sulu, and Tawi-Tawi.
Source: DOE, Mindanao Energy Plan 2014.
Figure 2.2 Demand Forecast for Basilan, Sulu, and Tawi-Tawi
Year 2014 2015 2016 2017 2018 2019 2020 2021 2022 2023 2024 2025 2026 2027 2028 2029 2030
High EconomicTarget Scenario
1,641 1,733 1,955 2,112 2,281 2,463 2,660 2,900 3,161 3,445 3,755 4,093 4,502 4,952 5,448 5,992 6,592
Growth Rate 14.95% 5.60% 12.80% 8.00% 8.00% 8.00% 8.00% 9.00% 9.00% 9.00% 9.00% 9.00% 10.00% 10.00% 10.00% 10.00% 10.00%Base CaseScenario
1,517 1,619 1,826 1,902 1,980 2,060 2,147 2,268 2,372 2,492 2,620 2,754 2,896 3,046 3,205 3,373 3,550
Growth Rate 6.02% 6.72% 12.80% 4.20% 4.10% 4.03% 4.22% 5.65% 4.55% 5.08% 5.11% 5.14% 5.16% 5.18% 5.21% 5.23% 5.25%
[Unit: MW]
2014 2015 2020 2025 2030
Basilan 7.94 8.33 10.63 13.57 17.32
Sulu 8.47 9.32 15.01 24.17 38.92Tawi-Tawi 3.15 3.30 4.22 5.38 6.87
IslandsYear

Comprehensive capacity development project for the Bangsamoro Sector Report 2-5: Power Policy
5-28
2.2 Energy Outlook by Sector
For the energy outlook by sector in Mindanao, two scenarios, the high economic target scenario and base case scenario, have been prepared as well as the demand forecast by DOE. Figure 2.3 and 2.4 show the high economic target scenario and base case scenario of the energy outlook by sector in Mindanao respectively.
Source: DOE.
Figure 2.3 Energy Outlook by Sector in Mindanao: High Economic Target Scenario
Source: ibid.
Figure 2.4 Energy Outlook by Sector in Mindanao: Base Case Scenario
In both cases, the energy required for the residential and industrial use is highly and almost equally
[Unit: kTOE]Year 2014 2015 2016 2017 2018 2019 2020 2021 2022 2023 2024 2025 2026 2027 2028 2029 2030
Agriculture 33 34 37 39 41 43 45 48 51 54 57 60 64 68 73 77 82
Residential 304 322 363 391 421 452 484 525 568 616 667 721 788 860 939 1024 1116Commercial 138 145 165 180 197 217 239 265 294 326 361 401 449 502 562 630 706
Industrial 278 294 331 358 387 417 451 491 536 584 636 694 763 839 923 1016 1117Others 0 0 0 0 0 0 0 0 0 0 0 0 0 0 0 0 0
Electricity Sales 720 760 860 929 1005 1086 1174 1281 1398 1525 1664 1816 2000 2202 2424 2669 2939Utilities Own Use 22 24 27 29 31 33 36 39 43 47 51 56 61 67 74 81 89
Power Losses 116 122 138 149 161 174 188 204 223 243 265 289 317 349 384 423 465Total 858 906 1024 1107 1196 1293 1398 1525 1664 1815 1980 2160 2378 2618 2882 3173 3493
[Unit: kTOE]Year 2014 2015 2016 2017 2018 2019 2020 2021 2022 2023 2024 2025 2026 2027 2028 2029 2030
Agriculture 32 34 37 38 39 40 41 42 44 45 47 48 50 52 53 55 57
Residential 277 297 335 348 362 375 389 410 427 447 468 491 514 539 564 591 619Commercial 129 137 156 164 172 180 190 203 214 227 241 256 272 289 307 327 348
Industrial 257 274 309 322 336 349 364 385 402 423 444 467 491 517 544 573 603Others 0 0 0 0 0 0 0 0 0 0 0 0 0 0 0 0 0
Electricity Sales 663 708 800 834 869 904 943 997 1043 1097 1154 1214 1278 1345 1416 1491 1570
Utilities Own Use 21 22 25 26 27 28 29 31 32 34 36 37 39 41 43 46 48Power Losses 107 114 129 134 140 145 151 160 167 176 185 194 204 215 226 238 250
Total 790 844 954 994 1035 1078 1124 1188 1243 1307 1374 1446 1521 1601 1685 1774 1868

Comprehensive capacity development project for the Bangsamoro Sector Report 2-5: Power Policy
5-29
expected. The second largest is the commercial use and the agriculture use is the lowest. These scenarios are based on the current share and created by proportionally increasing energy consumption for each sector.
2.3 Power Development Plan
For the development of large-scale power plants connected to the on-grid, the investment by private capitalization is required since the Philippine Government cannot directly and strongly encourage private companies to install new power plants. This situation is due to the EPIRA designed for the introduction of competitive principal by private utilities that could consequently lead to electricity price reduction. As a matter of fact, after the EPIRA was enacted, the private investment has not been so activated as expected, and the Philippines are still being annoyed by chronic power shortages that the supply cannot meet the demand. However, as a recent trend, the development of power facilities by big holding companies is being promoted and committed. The outlook of improving the power supply shortages is expected. Table 2.1 shows the committed projects for new power plants in Mindanao.
Table 2.1 Committed Projects for New Power Plants in Mindanao
Source: DOE, Mindanao Energy Plan 2014.
Although, the improvement of the power supply will be realized by the end of 2015 owing to these capacity addition committed, there is a possibility that the power shortages could occur again as far as the peak demand continue to grow. If the high economic target scenario or base case scenario can be realized, such a severe situation would appear in 2020 at the earliest and at the latest in 2024, respectively. Figures 2.5 and 2.6 show the demand-supply balance for both case scenarios.
For the small-scale power plants installed in the off-grid, the addition by NPC-SPUG is permitted. The diesel generators that are easier to install in the off-grid and the initial installation cost is smaller. From a mechanical characteristic restriction, some of those units cannot be run for 24 hours. Accordingly, it is hard to say that the stable power is supplied on the off-grid. By the end of 2030, the addition of power generators, 10 MW in Sulu and 5 MW in Tawi-Tawi are scheduled to be installed (Table 2.2).
2.4 Transmission Development Plan
The transmission development plan (TDP) is prepared by NGCP and annually updated and published on their official website. All transmission development projects planned between 2016 and 2023 are shown in the TDP 2013. The projects that may have an impact on the ARMM are as follows.
Year Name of Plants Fuel Type Capacity [MW] Location
Tuday 1 Hydro Hydro 6.6 Sta.Cruz, Davao del Sur
Tuday 2 Hydro Hydro 7 Sta.Cruz, Davao del SurMEGC Diesel Diesel 15 Dalipuga, Iligan City
PSI Bunker-Fired Power Plant Diesel 20.9 Brgy.Apopong, General Santos CityPSFI Bunder-Fired Power Plant Diesel 5.2 San Francisco, Agusan del Sur
Therma South Coal Coal 300 Toril, Davao City and Sta.Cruz, Davao del SurPuyo Hydro Hydro 30 Jabonga, Agusan del Norte
Southern Mindanao Coal Coal 200 Maasim, SaranganiKalilangan Biomass Biomass 10 Maramag, BukidnonMalaybalay Biomass Biomass 10 Maramag, BukidnonDon Carlos Biomass Biomass 10 Maramag, Bukidnon
LPC Biomass Biomass 10 MaguindanaoLake Mainit Hydro Hydro 25 Jabonga, Agusan del NorteFDC Misamis Coal Coal 405 Villanueva, Misamis Oriental
2017 Limbatangon Hydro Hydro 9 Cagayan de Oro City, Misamis Oriental
Total 1063.7
2014
2015
2016

Comprehensive capacity development project for the Bangsamoro Sector Report 2-5: Power Policy
5-30
Source: DOE, MEP 2014–2030.
Figure 2.5 Electricity Demand-Supply Balance 2014–2030: High Economic Target Scenario
Source: ibid.
Figure 2.6 Electricity Demand-Supply Balance 2014–2030: Base Case Scenario
Table 2.2 Added Capacity in Islands of ARMM
Source: DOE, MEP 2014.
2014 2015 2020 2025 2030
EstimatedInvestment
Requirement[Million PhP]
Sulu - 10 - - - 2,257.50
Tawi-Tawi - - 5 - - 645Basilan - - - - - 967.5
Islands
Year
Matching point between the supply and demand
Matching point between the supply and demand

Comprehensive capacity development project for the Bangsamoro Sector Report 2-5: Power Policy
5-31
2.4.1 Tacurong–Sultan Kudarat 138 kV transmission lines construction project
This is the project that aims to improve the system reliability of supplying the power for the Tacurong substation (S/S) and the Sultan Kudarat S/S by newly constructing 138 kV T/L, one circuit. Under normal condition, the Sultan Kudarat S/S are served through the Kibawe S/S. However, when the 138 kV line between Kibawe and Tacurong S/S is faulted or in preventive maintenance, the Tacurong S/S can accommodate the loads of the Sultan Kudarat S/S via long 69 kV transmission line with limited capacity. Consequently, some of the electricity end users have experienced frequent low voltage due to relatively long transmission line. In order to avoid this situation, this project is planned and targeting the completion in 2018. Figure 2.7 shows the zoomed system diagram around the Tacurong S/S and the Sultan Kudarat S/S and Figure 2.8 shows the image of newly constructed 138 kV T/L between the Tacurong S/S and the Sultan Kudarat S/S.
Figure 2.7 Zoomed System Diagram around Tacurong S/S and Sultan Kudarat S/S
Figure 2.8 Image of Newly Constructed 138 kV T/L between Tacurong S/S and Sultan Kudarat S/S
Kibawe 138kV
Tacurong 138kV
Sultan Kudarat138kV
To GeneralSantos
101km: New T/L
: Existing T/L
LegendPower Flow Power Flow
Loads
Normally Opened
Loads
Loads
Sultan Kudarat S/S
Tacurong S/S
Agus HEPP

Comprehensive capacity development project for the Bangsamoro Sector Report 2-5: Power Policy
5-32
2.4.2 Agus 1-2 switchyard upgrading and rehabilitation
Currently, the Agus 1 power station and the Agus 2 power station are mutually connected through a single circuit, 138 kV T/L with a length of 6 km. When this line is faulted, the generator in the Agus 1 power station is shut down and the power supply is interrupted. In order to avoid this situation, a new T/L between the Agus 1 and the Agus 2 is scheduled to be additionally constructed and completed in 2017 (Figure 2.9). Also, this project includes the rehabilitation of auxiliary equipment such as circuit breakers at the Agus switchyard as replacement of aged facilities.
Figure 2.9 Image of System Condition before/after Agus1-2 Upgrading and Rehabilitation Project
2.4.3 Agus 5 switchyard upgrading and rehabilitation
The control devices and equipment of the switchyard connected to the Agus 5 power station can be controlled from the control room shared by the operation room of the Agus 5. In order to meet the unbundling policy regulated by the EPIRA and the NGCP internal regulation, a new control room is planned to be established separately from the NPC facilities. Simultaneously, the related aged facilities are also scheduled to be replaced by the end of 2020 (Table 2.3).
Table 2.3 Power Circuit Breaker Targeted for Replacement in ARMM
Substation/Switchyard No. of 138 kV PCB and
associated equipment No. of 69 kV PCB and associated equipment
Agus 1 and 2 Switchyard 4 - Agus 5 Switchyard 6 - Sulatan Kudarat Substation - 1 Tacurong Susbstation 1 8
Source: NGCP, TDP 2013.
2.4.4 Other projects
Large-scale system reinforcement projects, which could indirectly benefit the ARMM, are under consideration as described below.
(1) Balo-i–Villanueva–Maramag–Bunawan 230 kV energization project
- Expected completion year: 2017 - Project purpose: To improve the system stability and supply reliability by upgrading from 138
kV T/L to 230 kV T/L, which is called backbone line passing through the central part of Mindanao
- Estimated invest requirement: Around PHP 2.4 billion
Agus2Agus1Fault
Agus2Agus1Fault
Shut Down
Agus2Agus1Fault
Agus2Agus1Fault
Not Shut Down
New T/LPower
<Before> <After>

Comprehensive capacity development project for the Bangsamoro Sector Report 2-5: Power Policy
5-33
(2) Leyte–Mindanao interconnection project (LMIP)
- Expected completion target: Under examination - Project purpose: To improve the supply reliability and realize the power interchange by
interconnecting Mindanao on-grid and Visayas on-gird, effective utilization of power reserves, and expansion of power wholesale market
- Estimated investment requirement: Around PHP 34 billion (only for the Mindanao side)
2.5 Distribution Plan
2.5.1 Distribution development plan
A set of expansion and rehabilitation plans for power distribution facilities, called the Distribution Development Plan (DDP), has been formulated by ECs and PIOUs. Those plans by ECs are submitted to DOE through NEA, and those by PIOUs to DOE directly. DOE compiles these expansion-and-rehabilitation plans and publishes these plans as DDP. The DDP 2010–2019 compiled by DOE shows peak demand forecast of the power supplied by ECs and yearly budget required for enforcement of power supply facilities (Table 2.4). However, it is hard to say whether these plans of ECs in the ARMM are properly formulated. Also, some of the ECs have not submitted development plans including long-term plans, and some have only short-term plans. In the DDP 2010–2019, no EC in the ARMM has an expansion plan for distribution facilities targeting 2015–2019.
Table 2.4 Excerpt from DDP 2010-2019 (SULECO)
Source: DOE, Distribution Development Plan 2010–2019.
Considering this situation, the JICA Study Team confirmed directly with MAGELCO if it has its own DDP for short and long terms. According to MAGELCO, the expansion and rehabilitation plans of distribution facilities for 2015-2017 were formulated as a short term plan as shown in Table 2.5
As stated earlier, MAGELCO was evaluated as the EC requiring drastic and prompt managerial improvement as “the worst rated EC” based on the performance assessment conducted by NEA. In
Unknown

Comprehensive capacity development project for the Bangsamoro Sector Report 2-5: Power Policy
5-34
response to this assessment, MAGELCO is currently under a restructuring process, initiated in November 2014 and some of distribution facilities is expected to be rehabilitated and expanded by the end of 2015.
Table 2.5 MAGELCO Short Term Distribution Development Plan, 2015–2017
Power Distribution Facilities 2015 2016 2017 Sub-transmission Line 69 kV (km)
Expansion 32 40 30 Replacement 1.4 0.5 -
Distribution Line13.2 kV (km)
Expansion (3-phase) 72 - - Expansion (single phase) 275 - - Replacement (3-phase) 147 - -
Distribution Transformer (sets)
10 MVA 1 - - 5 MVA 1 1 - 10 MVA Upgrading 1 - -
Source: MAGELCO.
2.5.2 Missionary electrification development plan
In addition to the DDP, the Missionary Electrification Development Plan (MEDP) is disclosed by DOE. The MEDP is a plan to energize remote areas and islands for barangay and sitio or enclave villages far from the center of barangay, located far from existing distribution network, and targeting the area to which extension of distribution lines is difficult (Figure 2.10). The business operators to be responsible for implementing the energization are stipulated by the EPIRA and prioritized as (1) a distribution company with un-electrified areas in its franchise area, (2) a distribution company adjacent to the un-electrified area, (3) third business operator, and (4) NPC-SPUG.
Source: JICA Study Team.
Figure 2.10 Energization Image by DDP and MEDP for Remote Areas
2.5.3 Progress of energization plan
The energization rate of the DDP and the MEDP is managed by DOE and disclosed on the DOE website, and the progress of energization in the ARMM is shown in Table 2.6.
BarangaySitio
: Generator
Distribution Expansion Plan (DDP)
Missionary Electrification Development Plan (MEDP)
: New Distribution Line
EC Franchise Area

Comprehensive capacity development project for the Bangsamoro Sector Report 2-5: Power Policy
5-35
Table 2.6 Progress of Energization in ARMM (Disclosed on February 9, 2015)
Source: DOE website.
StatusYear
ApprovedEC Franchise Area Type of PJT Province
No. of PJTAreas
PotentialHouse Hold
BenefeficiariesCompleted/For Inspection 2009 SIASELCO Barangay & Sitio Sulu 4 -
2013 CASELCO Barangay & Sitio Tawi-Tawi 6 9442013 TAWELCO Barangay & Sitio Tawi-Tawi 13 7502011 TAWELCO Barangay & Sitio Tawi-Tawi 3 -
Ongoing Implementation 2012 LASURECO Rehabilitation Lanao Del Sur 3 -
For Implementation/For Fund Release

Comprehensive capacity development project for the Bangsamoro Sector Report 2-5: Power Policy
5-36
CHAPTER 3 ISSUES OF POWER SECTOR
3.1 Power Supply Shortages
In Mindanao, the power demand exceeds power supply capability even as of January 2015, and this is one of the factors which constrain economic growth. The information on the demand and supply balance such as forecasted peak demand, power supply capability and reserve capacity are disclosed on the NGCP website at 4:00 in the early morning on a daily basis. Table 3.1 shows the daily demand and supply balance forecast published from February 16 to 22, 2015 by NGCP.
Table 3.1 Demand and Supply Balance Forecast: Feb. 16–22, 2015
Source: NGCP website.
According to Table 3.1, it is found that the reserve capacity is secured at more than 13% in Luzon and 6% in Visayas through the week, while the reserve capacity in Mindanao indicates negative values or almost zero through the week. This means the condition that the demand exceeds supply capacity, i.e. power shortage condition. Under the power shortage condition, the load curtailment (scheduled power outage) is implemented to keep the demand and supply balance. NGCP is also disclosing forecasted demand and supply balance on an hourly basis on its website. Table 3.2 presents an example of hourly demand and supply balance in Mindanao, disclosed on February 13, 2015.
"Net Sys. Res." in the bottom row in Table 3.2 indicates reserve capability. The reserve capacity of -537 MW here means the shortage of 537 MW in reserve capacity and the load curtailment of 537 MW is required. According to MinDA, the distribution feeders of ECs supplying the power for the area and region where there are lots of residents who do not pay tariff are targeted for the load curtailment.
LUZON VISAYAS MINDANAO
System Capacity (MW) 8,536 1,571 1,320
System Peak (MW) 7,282 1,457 1,338Reserve (MW) 1,254 114 -18Reserve Rate (%) 17.2 7.8 -1.3System Capacity (MW) 8,473 1,608 1,351System Peak (MW) 7,500 1,468 1,348Reserve (MW) 973 140 3Reserve Rate (%) 13.0 9.5 0.2System Capacity (MW) 8,566 1,608 1,371System Peak (MW) 7,430 1,428 1,362Reserve (MW) 1,136 180 9Reserve Rate (%) 15.3 12.6 0.7System Capacity (MW) 8,448 0 1,271System Peak (MW) 6,709 0 1,374Reserve (MW) 1,734 0 -103Reserve Rate (%) 25.9 0.0 -7.5System Capacity (MW) 8,473 1,473 1,271System Peak (MW) 7,430 1,389 1,362Reserve (MW) 1,043 84 -91Reserve Rate (%) 14.0 6.0 -6.7System Capacity (MW) 8,473 1,473 1,271System Peak (MW) 7,430 1,389 1,362Reserve (MW) 1,043 84 -91Reserve Rate (%) 14.0 6.0 -6.7System Capacity (MW) 8,146 1,404 1,213System Peak (MW) 6,307 1,329 1,312Reserve (MW) 1,839 75 -99Reserve Rate (%) 29.2 5.6 -7.5
Date
Feb.21 Sat
Feb.22 Sun
Feb.16 Mon.
Feb.17 Tue
Feb.18 Wed
Feb.19 Thu
Feb.20 Fri
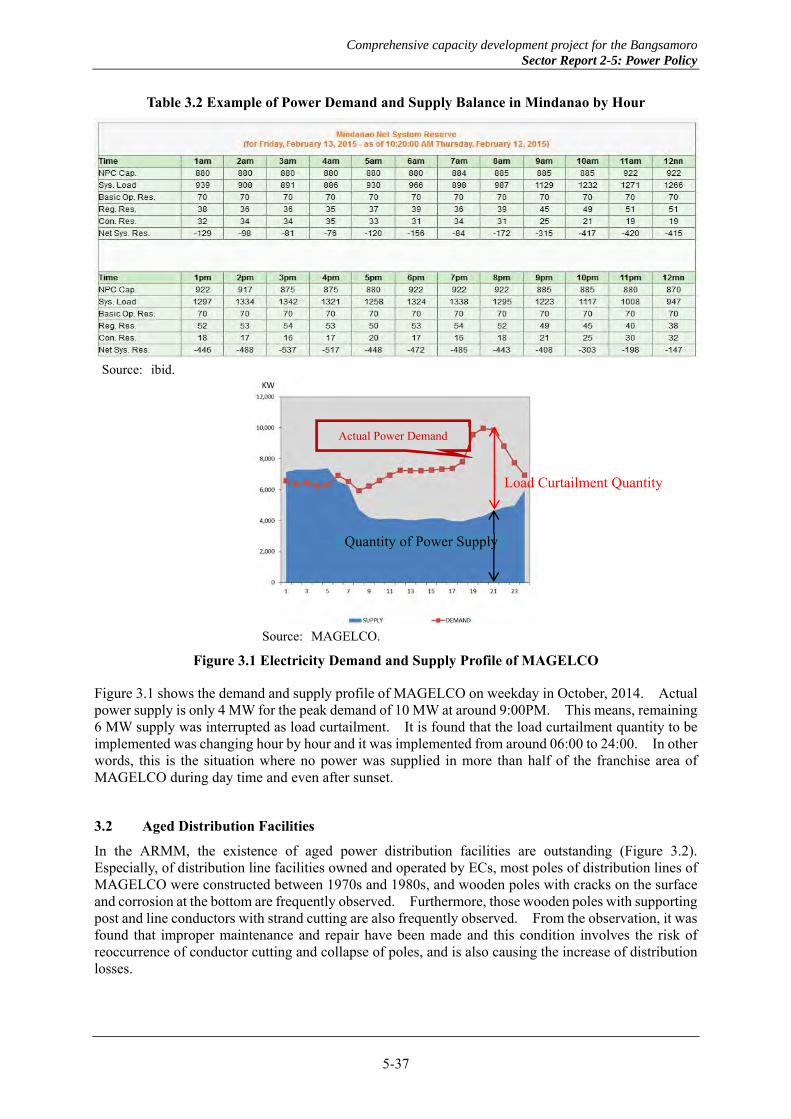
Comprehensive capacity development project for the Bangsamoro Sector Report 2-5: Power Policy
5-37
Table 3.2 Example of Power Demand and Supply Balance in Mindanao by Hour
Source: ibid.
Source: MAGELCO.
Figure 3.1 Electricity Demand and Supply Profile of MAGELCO
Figure 3.1 shows the demand and supply profile of MAGELCO on weekday in October, 2014. Actual power supply is only 4 MW for the peak demand of 10 MW at around 9:00PM. This means, remaining 6 MW supply was interrupted as load curtailment. It is found that the load curtailment quantity to be implemented was changing hour by hour and it was implemented from around 06:00 to 24:00. In other words, this is the situation where no power was supplied in more than half of the franchise area of MAGELCO during day time and even after sunset.
3.2 Aged Distribution Facilities
In the ARMM, the existence of aged power distribution facilities are outstanding (Figure 3.2). Especially, of distribution line facilities owned and operated by ECs, most poles of distribution lines of MAGELCO were constructed between 1970s and 1980s, and wooden poles with cracks on the surface and corrosion at the bottom are frequently observed. Furthermore, those wooden poles with supporting post and line conductors with strand cutting are also frequently observed. From the observation, it was found that improper maintenance and repair have been made and this condition involves the risk of reoccurrence of conductor cutting and collapse of poles, and is also causing the increase of distribution losses.
Load Curtailment Quantity
Quantity of Power Supply
Actual Power Demand

Comprehensive capacity development project for the Bangsamoro Sector Report 2-5: Power Policy
5-38
Very old and leaning wooden pole of distribution line with supporting post
Strand cutting of line conductor with improper repair
Power transformer without nameplate (year of manufacture, etc. are unknown)
Figure 3.2 Distribution Line Facilities of MAGELCO
Due to these aged distribution and substation facilities, the serious power outage, attributed to the system faults and equipment troubles might be caused. For the realization of stable power supply, urgent replacement of these facilities and establishment of proper operation and maintenance management system are required. ECs are non-profitable cooperatives and almost all ECs in the ARMM are not under a healthy condition in terms of the financial status. Therefore, they have difficulty in improving their distribution and substation facilities on their own and consequently, it leads to unhealthy conditions. In almost all ECs in the ARMM, the expense is surpassing the earning, and only SIASELCO is achieving a primary surplus in 2012 and 2013. Since the remaining ECs are in deficit, urgent administrative improvement for each EC is required. Table 3.3 shows financial statements of ECs in the area from 2011 to 2013.
3.3 High Distribution Loss Rates
High distribution loss rates constitute one of the issues to be solved in the ARMM. According to the performance assessment of ECs conducted by NEA, distribution loss rate for each EC is reported as shown in Table 3.4.
The loss rates of ECs in the region shown in Table 3.4 are classified as high rates compared to the rate in other Southeast Asian countries with the average rate of 12-15%, and it should be improved in consideration also of the level of loss rates in other areas of the Philippines. Distribution loss rates are classified into two categories. One is a technical loss and the other is a non-technical loss. The technical loss means an electric loss such as a heat loss which is generated by flowing current inside line conductors. The non-technical loss means a loss mainly due to the unaccounted use of electricity without paying the electric tariff.
The high loss rate in the ARMM is mainly due to the unaccounted use of electricity, which causes financial difficulty and deficit operation of ECs. The main causes of low tariff collection rate are as follows: (1) broken kWh meters, (2) utilization of used kWh meters with low accuracy, and (3) illegal connection of service wire (pilferage). As an example, power purchase by MAGLECO is 2,895,668 kWh, while its power sale is 1,626,863 kWh in October 2014 (Figure 3.3). Accordingly, the power loss and loss rate are calculated as 1,247,087 kWh and 43.07%, respectively.

Comprehensive capacity development project for the Bangsamoro Sector Report 2-5: Power Policy
5-39
Table 3.3 Financial Conditions of ECs in ARMM
Source: NEA.
Table 3.4 ECs’ Distribution Loss Rate
ECs MAGELCO BASELCO SULECO TAWELCO LASURELCO SIASELCO CASELCO
Distribution loss rate (%)
42.88 40.74 31.99 29.43 17.93 9.84 n/a
2011 2012 2013 2011 2012 2013Total Operating Revenue 167,639 159,192 168,100 583,244 690,575 649,847Total Operating Expense 247,958 241,063 247,992 721,339 711,909 644,592Operating Margin -80,319 -81,871 -79,892 -138,095 -21,333 5,255Depreciation&Amortiation Expense 7,772 8,608 9,172 4,046 4,043 4,049Interest Expense 1,212 894 1,545 7,131 7,131 7,131Net Operating Margine -89,303 -91,373 -90,609 -149,272 -32,507 -5,925 Non-Operating Revenue 2,686 5,374 4,645 3,384 2,969 2,375Non-Operating Expense 2,521 1,421 757
Net Margin/Loss -89,137 -87,420 -86,720 -145,888 -29,539 -3,550
2011 2012 2013 2011 2012 2013Total Operating Revenue 212,467 245,175 220,762 223,749 310,887 316,977Total Operating Expense 237,984 267,058 246,931 276,500 308,230 292,129Operating Margin -25,517 -21,883 -26,169 -52,751 2,657 24,848Depreciation&Amortiation Expense 9,224 9,335 9,799 5,908 6,520 3,748Interest Expense 325 312 321 92,443 107,764 62,842Net Operating Margine -35,066 -31,530 -36,289 -151,102 -111,627 -41,742 Non-Operating Revenue 740 1,149 1,032Non-Operating Expense 154 200 122
Net Margin/Loss -35,066 -31,530 -36,289 -150,516 -110,678 -40,832
2011 2012 2013 2011 2012 2013Total Operating Revenue 119,314 134,406 122,809 19,002 24,142 22,650Total Operating Expense 129,630 144,085 139,907 19,845 23,787 20,702Operating Margin -10,316 -9,679 -17,098 -843 355 1,948Depreciation&Amortiation Expense 2,839 2,466 2,636 246 230 295Interest Expense 55,572 61,302 66,936Net Operating Margine -68,727 -73,447 -86,670 -1,089 125 1,653Non-Operating Revenue 5,008 4,105 4,206 860 1,074 1,004Non-Operating Expense 1,070 157 46
Net Margin/Loss -64,789 -69,501 -82,509 -229 1,199 2,657
2011 2012 2013Total Operating Revenue 2,929 6,740 5,308Total Operating Expense 4,665 8,228 6,122Operating Margin -1,736 -1,488 -814 Depreciation&Amortiation ExpenseInterest ExpenseNet Operating Margine -1,736 -1,488 -814 Non-Operating Revenue 190 248 282Non-Operating Expense 200 166 657
Net Margin/Loss -1,746 -1,406 -1,189
Maguindanao Electric Cooperative Lanao Del Sur Electric Cooperative(MAGELCO) (LASURECO)
Basilan Electric Cooperative Sulu Electric Cooperative
Cagayan De Sulu Electric Cooperative(CASELCO)
(BASELCO) (SULECO)
Tawi-Tawi Electric Cooperative Siasi Electric Cooperative(TAWELCO) (SIASELCO)

Comprehensive capacity development project for the Bangsamoro Sector Report 2-5: Power Policy
5-40
Source: MAGELCO.
Figure 3.3 Record of Power Sales of MAGELCO for October 2014
Broken kWh Meter Illegal connection (indicated by arrow)
Figure 3.4 KWh Meters Installed in Franchise Area of MAGELCO
3.4 Low Energization (Electrification) Rate
The energization rate in the ARMM stays at a quite low level. Table 3.5 shows energization rates by franchise area of ECs in the ARMM. According to Table 3.5, the almost 100% energization rate is achieved at the barangay level. However, the connection rates at the sitio level varies and relatively low on an average. One sitio indicates the connection rate of 0%. The connection rates of service wire as a whole are shown to be low between 24% and 53%. This is due to the definition of energization rate and because "the barangay where a distribution line is passing through it and ready to connect service wire to the customers" is regarded as being energized. Therefore, Table 3.5 shows that there is a house on which the distribution lines are passing through but it has no service wire, namely, no power supply.
Table 3.5 Electrification Rates in Franchise Area of ECs in ARMM (December 31, 2014)
Source: NEA.
Energized/Completed
Energized/Completed
SERVED
To Date To Date TO DATE
TAWELCO 9 100 186 186 100 0 344 200 58 144 47,000 12,498 27
SIASELCO 2 100 66 66 100 0 75 31 41 44 13,000 4,067 31SULECO 16 100 330 330 100 0 81 62 77 19 85,000 25,295 30BASELCO 14 100 269 269 100 0 220 105 48 115 75,000 39,964 53CASELCO 2 100 17 17 100 0 26 0 0 26 5,000 1,961 39LASURELCO 41 100 1,175 1,175 100 0 68 68 100 0 138,000 56,357 41MAGELCO 30 100 404 398 99 9 1,245 497 40 748 116,000 27,485 24
Total 114 100 2,447 2,441 99 9 2,059 963 47 1,096 479,000 167,627 35
CONNECTIONS
POTENTIAL %ECs
SITIOS
Potential % Unenergized
MUNICIPALTIES/CITIES BARANGAYS
Coverage/Energized
% Potential % Unenergized
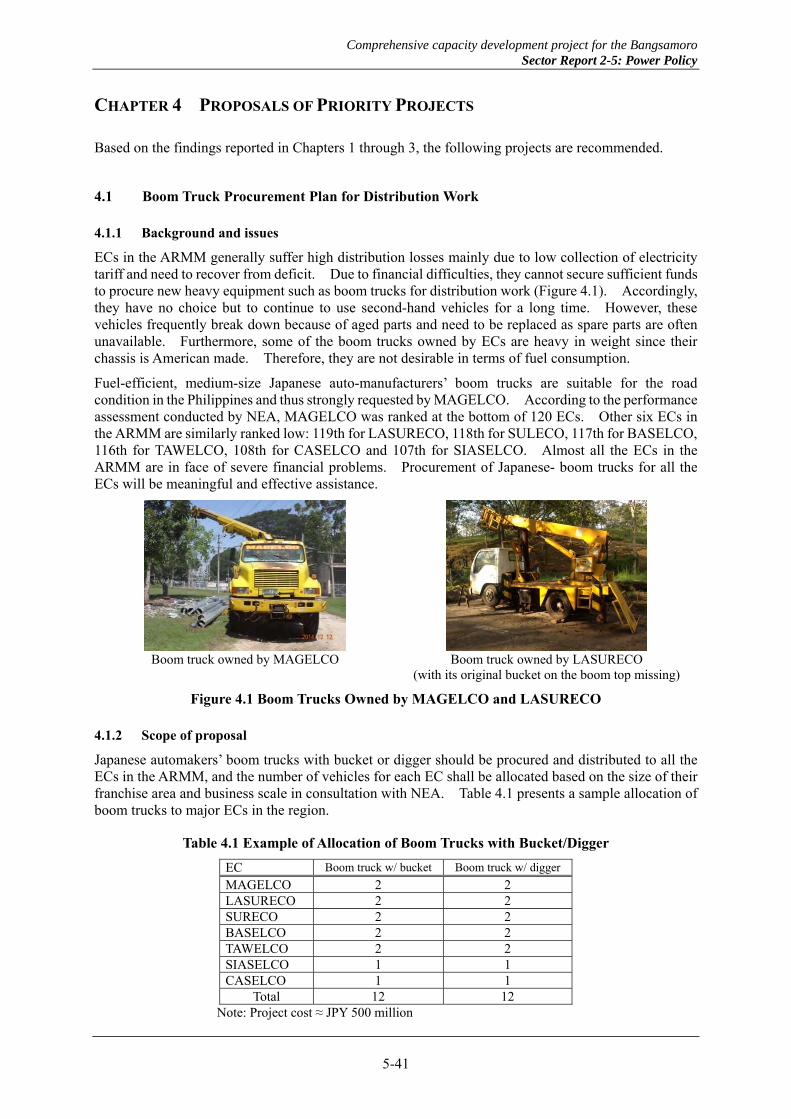
Comprehensive capacity development project for the Bangsamoro Sector Report 2-5: Power Policy
5-41
CHAPTER 4 PROPOSALS OF PRIORITY PROJECTS
Based on the findings reported in Chapters 1 through 3, the following projects are recommended.
4.1 Boom Truck Procurement Plan for Distribution Work
4.1.1 Background and issues
ECs in the ARMM generally suffer high distribution losses mainly due to low collection of electricity tariff and need to recover from deficit. Due to financial difficulties, they cannot secure sufficient funds to procure new heavy equipment such as boom trucks for distribution work (Figure 4.1). Accordingly, they have no choice but to continue to use second-hand vehicles for a long time. However, these vehicles frequently break down because of aged parts and need to be replaced as spare parts are often unavailable. Furthermore, some of the boom trucks owned by ECs are heavy in weight since their chassis is American made. Therefore, they are not desirable in terms of fuel consumption.
Fuel-efficient, medium-size Japanese auto-manufacturers’ boom trucks are suitable for the road condition in the Philippines and thus strongly requested by MAGELCO. According to the performance assessment conducted by NEA, MAGELCO was ranked at the bottom of 120 ECs. Other six ECs in the ARMM are similarly ranked low: 119th for LASURECO, 118th for SULECO, 117th for BASELCO, 116th for TAWELCO, 108th for CASELCO and 107th for SIASELCO. Almost all the ECs in the ARMM are in face of severe financial problems. Procurement of Japanese- boom trucks for all the ECs will be meaningful and effective assistance.
Boom truck owned by MAGELCO Boom truck owned by LASURECO
(with its original bucket on the boom top missing)
Figure 4.1 Boom Trucks Owned by MAGELCO and LASURECO
4.1.2 Scope of proposal
Japanese automakers’ boom trucks with bucket or digger should be procured and distributed to all the ECs in the ARMM, and the number of vehicles for each EC shall be allocated based on the size of their franchise area and business scale in consultation with NEA. Table 4.1 presents a sample allocation of boom trucks to major ECs in the region.
Table 4.1 Example of Allocation of Boom Trucks with Bucket/Digger
EC Boom truck w/ bucket Boom truck w/ digger
MAGELCO 2 2 LASURECO 2 2 SURECO 2 2 BASELCO 2 2 TAWELCO 2 2 SIASELCO 1 1 CASELCO 1 1
Total 12 12 Note: Project cost ≈ JPY 500 million

Comprehensive capacity development project for the Bangsamoro Sector Report 2-5: Power Policy
5-42
4.1.3 Project purpose
This project aims to improve the capacity of ECs in the ARMM for construction and maintenance work.
4.1.4 Expected effects
The following effects are expected:
- High visibility of the assistance expected in the whole ARMM including islands; - Contribution by small and medium-sized firms; - Minimization of the risk that the delivered equipment is exposed for a long time at site in the
process of procurement; - Delivery to ECs in a short period of time, approximately two years, compared to infrastructure
related projects; and - The experience of the Philippine Government to receive the boom trucks procured through
grant aid scheme, through the Yolanda relief project.
Therefore, it would be possible to smoothly implement the boom truck procurement plan for ECs in the ARMM.
4.1.5 Security consideration
There are many places where it is difficult to ensure security in Mindanao especially in the ARMM. Accordingly, it should be carefully considered to secure the security on transportation route and storage warehouse at the time of delivery of the boom trucks.
4.2 Rehabilitation Plan for MAGELCO's Distribution Facilities
4.2.1 Background and issues
MAGELCO was established on September 4, 1975 by NEC in accordance with Presidential Decree 269 as a non-stock, non-profit, non-political venture corporation owned by its members. As of today, it has three substations to supply power in the province of Maguindanao. However, MAGELCO is facing with serious issues in its power supply facilities which should be improved urgently to get out of the red. The following are the problems of the MAGELCO.
(1) Distribution system reliability
The distribution facilities in the MAGELCO's franchise area in the ARMM were constructed in the 1970s and the 1980s. In the site survey conducted by the JICA Study Team, it was observed that, of all the wooden poles and cross-arms of distribution facilities with an average span length of 100 m, approximately 60% were inclined. Over the years of operation, line conductors in many portions of the distribution lines have been damaged (cut) and not been properly jointed or terminated. The power distribution lines are now dilapidated and unreliable.
(2) Substation capacity and facilities
According to the substation load forecasts and loading analysis as shown in Table 4.2, the Salbu substation requires immediate capacity augmentation because it is scheduled to additionally supply the power through the DOS and Maganoy feeders newly connected to the system.
Also, existing substations are protected only by power fuses on the 69 kV line side. In order to improve the system reliability and shorten the duration of power outage, circuit breakers and instrument transformers should be installed on the primary side of substations.

Comprehensive capacity development project for the Bangsamoro Sector Report 2-5: Power Policy
5-43
Table 4.2 Substation Load Forecast and Loading Analysis
Source: MAGELCO.
(3) Primary line losses
The 13.2 kV distribution lines were constructed using #1/0 (54 mm2), #2/0 (67 mm2) and #4/0 (107 mm2) AWG ACSR. The increase in customer demand and its present aging condition made the line capacities insufficient. Also it shall be noted that the existing backbone 13.2 kV lines are over-stretched using undersized conductors. This causes high primary line losses and voltage drops below 10% of nominal level in the distribution system. Table 4.3 shows results of power flow simulation carried out by MAGELCO showing primary line losses per feeder line for the Salbu and HQ substations.
From Table 4.3, the total line losses of 8% is too high, and lowest voltage level less than 0.9 PU is serious status to supply power for customers properly. In accordance with the NEA Engineering Bulletin, recommended percent losses on primary lines are 3%. The serious effort of loss reduction is required.
Table 4.3 Power Flow Simulation Results
Source: ibid.
(4) Metering defects and losses
Illegal connections of service wires and breaking of kWh meters are being done on a day-to-day basis in the franchise area. According to the sampling calibration of 251 sets of kWh-meter, 75% (187 sets) of kWh-meter were found to be of low accuracy or defective, which resulted in low tariff collection rate. Therefore, replacement or installation of properly functioning kWh-meters is urgently needed to improve financial and managing status of MAGELCO.
4.2.2 Rehabilitation program by MAGELCO
MAGELCO had prepared a rehabilitation program presented below before the JICA Study Team conducted its field survey at the beginning of December 2014:
(1) Sub-transmission projects
- Construction of 69 kV/13.2 kV UB line
Rated capacity (MVA) 5 5 10
Power factor (%) 97.7 98.7 92.4
Year MW load % loading MW load % loading MW load % loading
2008 3.33 68.25 2.13 43.26 3.5 37.87
2009 3.12 63.87 2.19 44.45 3.69 39.97
2010 3.02 61.72 2.37 48.03 3.86 41.80
2011 2.84 58.10 2.50 50.59 4.09 44.30
2012 3.38 69.19 2.58 52.29 4.37 47.30
2013 3.91 80.04 2.75 55.72 4.56 49.40
2014 3.93 80.53 2.88 58.45 4.80 51.92
2015 4.03 82.46 3.02 61.19 5.03 54.49
2016 4.15 84.93 3.15 63.92 5.28 57.11
2017 4.27 87.37 3.29 66.65 5.52 59.78
SALBU SS CAPITON SS (HQ) SIMUAY SS
SS-end MW SS-end MW Line losses % line Lowest voltageLoad Load kWh losses level, PU
CAPITON (HQ) DOS 1.63 646,549 72,761 11 0.82UPI 1.03 408,118 41,158 10 0.80
SALBU MAGANOY 2.61 1,033,560 54,482 5 0.87Total 5.27 2,088,227 168,401 8
Substation Feeder

Comprehensive capacity development project for the Bangsamoro Sector Report 2-5: Power Policy
5-44
- Installation of switchyard Kauran SS - Installation of switchyard at HQ SS
(2) Substation projects
- Installation of new 5 MVA Kauran SS - Installation of new 10 MVA Landasan SS - Upgrading of Salbu SS to 10 MVA capacity - Installation of 5 MVA Nuro SS
(3) Rehabilitation of 13.2 kV lines
- Total 115 km
(4) Metering project
- 30,000 sets of kWh-meters
(5) Construction vehicles
- Purchase of two boom trucks and five utility vehicles
4.2.3 Scope of proposal
The following project components extracted from the Rehabilitation Program of MAGELCO are recommended based on the criteria: 1) security during construction work, and 2) budget for Japanese grant aid projects:
- Power transformer and substation equipment for new construction and improvement of substations as follows: one lot of substation equipment for HQ substation and one unit of 5 MVA for NURO substation
- 69 kV/13.2 kV transmission and distribution facilities: 30 km total length; under-built; concrete poles)
- Digital-type kWh meter: 10,000sets - Boom trucks with bucket and boom trucks with digger: two units each
The proposed priority project for the rehabilitation of the power facilities of MAGELCO is shown in Figure 4.2. Figure 4.3 is the single line diagram showing the current distribution system of MAGELCO.
4.2.4 Project purpose
The project aims at
- Improvement of supply reliability of distribution network, - Realization of quality power supply at the proper supply voltage, - Distribution loss reduction and prevention and reduction of illegal connections, - Upgrading of supply capacity to satisfy future increasing power demand, and - Improvement of rate of tariff collection.
4.2.5 Expected effects
The following effects are expected:
- Since this type of project could be a role model of project implementation, the success of this project will lead to the continuous project formulation to supply equipment and materials to the ECs in the missionary areas and islands such as Lanao del Sur and Basilan. Consequently, this can contribute to the economic development of the Bangsamoro area.
- Improvement of quality of life of local residents
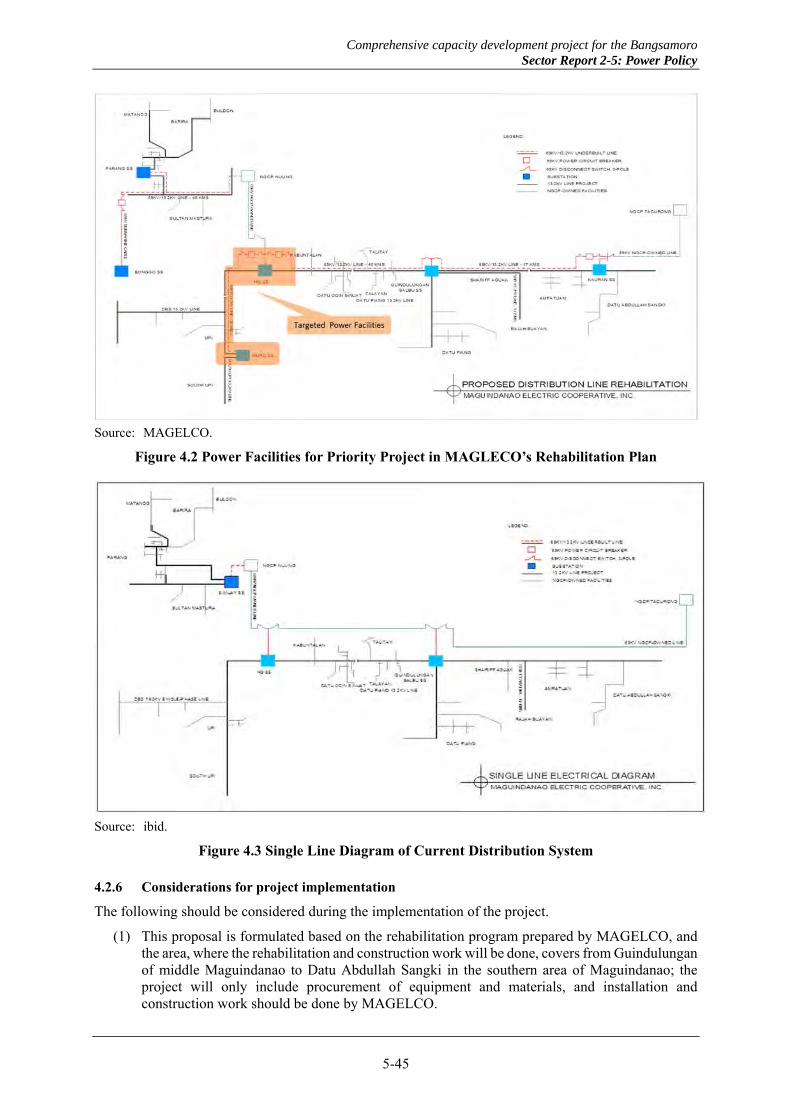
Comprehensive capacity development project for the Bangsamoro Sector Report 2-5: Power Policy
5-45
Source: MAGELCO.
Figure 4.2 Power Facilities for Priority Project in MAGLECO’s Rehabilitation Plan
Source: ibid.
Figure 4.3 Single Line Diagram of Current Distribution System
4.2.6 Considerations for project implementation
The following should be considered during the implementation of the project.
(1) This proposal is formulated based on the rehabilitation program prepared by MAGELCO, and the area, where the rehabilitation and construction work will be done, covers from Guindulungan of middle Maguindanao to Datu Abdullah Sangki in the southern area of Maguindanao; the project will only include procurement of equipment and materials, and installation and construction work should be done by MAGELCO.

Comprehensive capacity development project for the Bangsamoro Sector Report 2-5: Power Policy
5-46
(2) It is necessary to confirm the ability of project management of MAGELCO and ability of contractors because the requirement of project implementation is conditioned to be done by MAGELCO.
(3) It is necessary to review the scope of the project and technical justification because this scope of project has been determined by MAGELCO.
(4) It is required to ensure the security during construction work.
4.3 Development of Low-head Hydro Power Plant in Tawi-Tawi
4.3.1 Background and issues
As stated in Sub-section 1.8.1, Mindanao is rich in hydro resources. Various types of surveys for development of hydro resources are ongoing in the main island of Mindanao, while in surrounding island provinces of Bangsamoro, development studies have not been promoted sufficiently due to the security and potential risk. However, Tawi-Tawi seems to be a comparatively less risky island than other islands judged from hearing surveys. In the Bangsamoro Development Agency (BDA) Transitional Development Plan, the development of a mini-hydro power plant (MHPP) at the Busay falls in Bohol Province and Bongao in Tawi-Tawi Province is designated as one of the prioritized projects. In order to grow out of dependency on diesel generation and facilitate the introduction of renewable energy sources on the islands, the development of a low-head hydro power plant in Tawi-Tawi is recommended.
4.3.2 Scope of proposal
The Malum River flows in the southern part of Tawi-Tawi island as shown in Figure 4.4. Figure 4.5 and Figure 4.6 present three candidate sites for the development of a hydro power plant along the river. As shown in the figure, there is a road crossing the upper stream of the Malum River. This road could be used for transporting materials required for the construction of the plant and even for the construction work downstream of the Malum River. Also, a temporary construction road may be built branching from the road to further facilitate the construction works.
Panglima Sugala, the third municipality of Tawi-Tawi Province, is close to the construction sites. This is an important factor for the workers and employees related to the construction of the power plant. Easy access to the construction sites is an advantage.
At these targeted points, a hydro-power plant should be developed based on the site survey. From the above diagram, the effective head can be expected to be approximately 5–10 m or slightly more. Accordingly, a low-head type of hydro power plant would be highly recommended.
4.3.3 Project purpose
The purpose of this project is to harness the hydroelectric potential of the Malum River and the Busay falls to produce electricity and contribute to CO2 emission reduction in using renewable energy instead of fossil fuel.
4.3.4 Expected effects
The following effects are expected:
- Contribution to the reduction of fuel procurement cost required for power supply with diesel generators and the promotion of renewable energy in the Philippines, and
- Demonstration of effectiveness of the renewable energy development in the island and provision of an incentive for further renewable energy development in other islands such as Sulu and Basilan.

Comprehensive capacity development project for the Bangsamoro Sector Report 2-5: Power Policy
5-47
Source: JICA Study Team.
Figure 4.4 Location of Malum River in Tawi-Tawi
Source: JICA Study Team.
Figure 4.5 Potential Hydro Power Plant Development Sites on Malum River in Tawi-Tawi
Source: JICA Study Team.
Figure 4.6 Cross Sections of Potential Hydro Power Plant Development Sites

Comprehensive capacity development project for the Bangsamoro Sector Report 2-5: Power Policy
5-48
4.3.5 Consideration for project implementation
For rough estimate of the expected output of a hydro power plant, it is required to measure the flow rate of the river (m3/sec) on a monthly and yearly basis. According to DPWH-ARMM, such data are not available at present. Therefore, prior to the implementation of this project, a pre-FS or FS is highly recommended with the following surveys:
- Water flow and geographic survey, - System impact study, - Environment impact assessment (EIA), - Economic analysis, and - Surveys on fishery and water rights.
Rainfall is an important factor in designing the development plan. Figure 4.7 shows average rainfall for typical city of each region in the Philippines. It is found that Mindanao area has less rainfall relatively compared with other regions. The less rainfall could possibly lead to the lack of power output caused by drought. Therefore, the development of hydro power plant should be evaluated in a comprehensive manner.
Tawi-Tawi (Mindanao [Small Island]) Manila (Luzon)
Cebu (Visayas) Davao (Mindanao[Main Island])
Figure 4.7 Average Rainfall in Major Cities by Region in the Philippines, 2000–2012

Comprehensive capacity development project for the Bangsamoro Sector Report 2-5: Power Policy
5-49
CHAPTER 5 RECOMMENDATIONS FOR THE BANGSAMORO POWER SECTOR
As stated in Section 3, the critical issues in the Bangsamoro power sector are classified into (1) power supply shortages, (2) aged distribution facilities, (3) high distribution loss rate, and (4) low electrification rate. In order to effectively address these issues and accelerate the development of Bangsamoro area, the following action plans and power policy are recommended.
5.1 Recommended Action Plans
5.1.1 Specific action plans for power supply shortages
As stated in Section 3.1, the power shortage in Mindanao is one of critical issues in the power sector and the load curtailment is being conducted almost every day in accordance with the rule that the areas and regions where there are lots of residents not paying electric tariff are targeted for the load shedding. This means that ECs having a low rate of tariff collection and poor financial status are targeted for the load shedding. Therefore, it is required to improve ECs’ financial status by improving this low rate of tariff collection so that ECs in Bangsamoro are excluded from the target of the load curtailment. In order to realize this situation, the following actions are effective measures to:
- Establish the strict rule of the tariff collection and strict disconnection and reconnection policy, - Replace aged/broken kWh-meters to new ones with accuracy and implement accurate meter-
reading, - Promote awareness campaign to power consumers regarding tariff payment, and - Prevent illegal connections by regular monitoring
One of ECs in the Bangsamoro area, MAGELCO has already been introducing and implementing some activities mentioned above. Similarly, it is desirable for other ECs to introduce these counter measures against the illegal connections.
In order to tackle with the power shortages, it is also effective to introduce the power facilities such as small power plants and power resources with renewable energy as well as connect to the distribution grid. Since ECs are not permitted to introduce and own generators due to the regulation of power sector, new power producers as IPPs, are required and it is essential to make an effort to attract investors into the power sector in Mindanao.
5.1.2 Specific action plans for aged distribution facilities
The rehabilitation and expansion program in the franchise area of MAGELCO, which has been well prepared, should be implemented immediately to improve its financial status. MAGELCO plays an important role for supplying the power for the central area of Bangsamoro. The rehabilitation and expansion of distribution lines and substations contribute to the improvement of technical losses, and replacement of kWh-meters can decrease non-technical losses. These measures combined will lead to the increase of billing amount.
The following actions can be recommended:
- To secure own budget by requesting NEA for financial assistance, and - To request international donors for financial and technical assistance.
Furthermore, for the ECs in islands provinces, the following procedures are recommended:
- To study current status of existing facilities, and - To prepare EC’s own rehabilitation and expansion programs.
It is noted that MAGELCO has introduced computerized on-line receipting system of the member-consumers' payment on January 7, 2015 and it is achieving notable results as regards the improvement of the tariff collection rate.

Comprehensive capacity development project for the Bangsamoro Sector Report 2-5: Power Policy
5-50
5.1.3 Specific action plans for high distribution loss rates
Distribution losses include both technical and non-technical losses, and the technical losses can be improved by rehabilitation and expansion of distribution facilities using proper conductor size and proper line configuration and suitable transformer capacity. Non-technical losses are mainly due to 1) low accuracy of kWh-meters, 2) un-metering including illegal connection, and 3) bill collection method. Therefore, to reduce non-technical losses, the same measures as the action plans recommended for the power shortage should be undertaken.
5.1.4 Specific action plans for low electrification rate
As mentioned in Section 3.4, barangays of all the ECs have been recorded to be electrified. However, the connection rate to customers is as low as 24% to 53%. Therefore, ECs including MAGELCO have to enhance and expedite electrification programs. The following actions are recommended:
- To promote public relations activities, - To secure own budget by requesting NEA for financial assistance, and - To request international donors for financial and technical assistance.
The relationships among four issues of action plans, the expected results and actions to be done are shown in Figure 5.1.
5.2 Recommended Power Policies
The recommended power policies intended for the new Bangsamoro autonomous government are as follows.
5.2.1 Empowerment of Bangsamoro government to develop power sources
The power supply is requisite for the economic growth and various existing industries in the modern society. In Mindanao, and even in other regions of the Philippines, the frequent power shortages are annoying the public and enterprises. According to the EPIRA, the development of power source is entrusted mainly to the private sector and investors/developers.
However, in order to facilitate and achieve rapid economic growth in the Bangsamoro region, it would be necessary and effective not to rely too much on the private sector to avoid risk such as sudden termination of the construction work due to unforeseen situations, but to promote and develop it by the Bangsamoro autonomous government itself and/or the new governmental organization to be established in the Bangsamoro autonomous government that has a responsibility of power development. Therefore, the Bangsamoro government needs to have the authority of developing the power sources. At present, since the power sector in Bangsamoro is under an effect of the EPIRA, it can be recommended to coordinate with ERC to discuss the future structure of power sector in Bangsamoro and coverage of the EPIRA. The development of power sources should be undertaken by the initiative of the Bangsamoro governmental organization.
5.2.2 Establishment of proper FIT prices
The feed-in-tariff (FIT) system is known as an effective measure to expedite the introduction of renewable energy in the world. In the Philippines, this system has already been introduced and is functioning properly. However, a lower rate of the FIT has a possibility of becoming an obstacle to investors who try to invest and develop the renewable energy resources. In order to attract such kinds of investors and private companies to the Bangsamoro region, it is recommended to properly raise FIT rates for renewable energy in Mindanao. However, it may cause an increase in the burden of tariff payers as it may lead to a rise of electric tariff. The key is to adequately and strategically set up specific FIT prices in consideration of the economic level of Bangsamoro in cooperation with DOE, ERC and other related organizations.

Comprehensive capacity development project for the Bangsamoro Sector Report 2-5: Power Policy
5-51
Figure 5.1 Procedure for Improvement of the Bangsamoro Power Sector
(Action-1)
- Secure own budget
(NEA financial assistance)
- Assistance of international donor
- Construction of 69kV/13.2kV underbuilt lines
- Installation of switchyard
- Instalation / upgrading of power transformer
- Rehabilitation of 13.2kV lines
- Replacement of kWh-meters
- etc.
(Action-1)
- Establishment of Strict rule & policy
for tariff collection
- Promotion of awareness campagin
for tariff collection
- Prevention of illegal connection
-Improvement of distribution loss rate - Improvement of tariff collection rate
- Increase of billing amount
- PR activity
- (Action-1) : Refer to the above
Note: : issues : results : action
③High distribution loss rate
Reduction of distribution losses
(Introduction of on-line receipting system)
voltage
Technical losses Non-technical losses
Acurate meter-reading
(Increase of billing amount)
Start
Well done
Power supplier (PSALM)
Transmission provider (NGCP)
Implementation of electrification program
④Low electrification rate①Power supply shortage
Budget for contract Budget for mplementation
Improvement of financial status of MAGELCO
Increase in revenue
Improve system
②Aged Distribution Facilities
Rehabilitation and expansion of distribution facilities

Comprehensive capacity development project for the Bangsamoro Sector Report 2-5: Power Policy
5-52
5.2.3 Integration of ECs into ARMM
As stated in Sub-section 1.3.8, there are seven ECs in the ARMM. For effective management, it would be worth considering the possibility of integration of those ECs as one distribution utility in the Bangsamoro region. It would be possible to effectively manage the power distribution business and comprehensively plan the development of the distribution network, considering the entire development of the Bangsamoro region.
5.2.4 Introduction of capacity development system to Bangsamoro government
Even if the organization or ministry that can handle the power sector is newly established in the Bangsamoro government, it would take some time for the Bangsamoro government itself to properly control the power sector. For a specified period of time, the management of the power sector in the Bangsamoro region may be undertaken effectively based on the cooperation and leadership of the Philippine Central Government, focusing on capacity development of the Bangsamoro power sector.