comprehensive multi-year plan - epiepi.gov.pk/wp-content/uploads/2014/09/national-cmyp.pdf ·...
TRANSCRIPT

2014
Comprehensive Multi-Year Plan
Immunization Program of Pakistan
Preface ........................................................................................................................... i
1 Situational Analysis ................................................................................................... 1 1.1 Background information ............................................................................................................... 1
1.1.1 Landscape and climate ....................................................................................................... 1
1.1.2 Administrative and political structure ............................................................................... 1
1.1.3 Demographic ..................................................................................................................... 2
1.1.4 Social and political context ............................................................................................... 4
1.1.5 Economics and financing .................................................................................................. 5
1.2 Health Sector Analysis .................................................................................................................. 7
1.2.1 Health Status ...................................................................................................................... 7
1.2.2 Governance ........................................................................................................................ 8
1.2.3 Health workforce ............................................................................................................... 9
1.2.4 Finance ............................................................................................................................. 10
1.2.5 Medical products and Technology ................................................................................... 10
1.2.6 Service delivery ................................................................................................................ 11
1.2.7 Health Information management .................................................................................... 14
1.3 Immunization system .................................................................................................................. 16
1.3.1 Routine Immunization ..................................................................................................... 16
1.3.2 Accelerated Disease Control Initiatives ........................................................................... 21
1.3.3 Analysis of Immunization system performance ............................................................. 23
1.4 Summary – SWOT ...................................................................................................................... 35
2 Immunization objectives and strategies .................................................................. 36 2.1 Program objectives and milestones ........................................................................................... 36
2.2 Strategies and main activities ..................................................................................................... 37
2.2.1 Program Management .................................................................................................... 37
2.2.2 Human Resource Management ...................................................................................... 39
2.2.3 Costing and Financing ..................................................................................................... 41
2.2.4 Vaccine, Cold Chain and Logistics .................................................................................. 42
2.2.5 Immunization Services Delivery ..................................................................................... 44
2.2.6 Monitoring, Surveillance and Reporting ........................................................................ 45
2.2.7 Demand Generation, Communication and Advocacy .................................................... 47
2.3 Alignment with GVAP, Regional Targets and Health Sector Strategy ...................................... 48
3 Implementation and M&E....................................................................................... 49 3.1 Timelines for the cMYP .............................................................................................................. 49
3.2 Monitoring and Evaluation ......................................................................................................... 54
3.2.1 M&E Framework for immunization ............................................................................... 54
3.2.2 Monitoring and Evaluation Strategy and Plan ............................................................... 54
4 Immunization Program Costing and Financing ....................................................... 55 4.1 Current program costs and financing ......................................................................................... 55
4.2 Future resource requirements .................................................................................................... 57

Comprehensive Multi-Year Plan | Immunization Program of Pakistan
4.2.1 Overview ........................................................................................................................... 57
4.2.2 Resource requirements for the establishment of the buffer stock of vaccines .............. 58
4.3 Future financing and funding gaps of the immunization program ............................................ 59
4.4 Funding gap analysis .................................................................................................................. 60
4.5 Financial sustainability .............................................................................................................. 62
5 Annexes .................................................................................................................. 63 Annex 1: Statistical and technical details .............................................................................. 64
Annex 2: Summary of SWOT Analysis by Provinces .............................................................. 78
Annex 3: Immunization program objectives and milestones ................................................ 85
Annex 4 Description of governance entities ......................................................................... 88
Annex 5 WHO Support to EPI in Pakistan 2014-2015 – key areas and activities ............... 92
Annex 6: WB support to immunization (EPI) in Pakistan (NISP project outline) ............... 94
Annex 7: GVAP Checklist ....................................................................................................... 96
Annex 8: Costing and financing (national) ........................................................................... 101
Annex 9: Costing and Financing (Federal) ........................................................................... 115
Annex 10: Integrated EPI and PEI district micro-planning ................................................... 119
Annex 11: EPI performance Indicators to be shared by DHT to DPEC ................................. 120
Annex 12: vLMIS priority districts of Pakistan ...................................................................... 122
Annex 13: vLMIS current and Fiture costing ......................................................................... 123
Annex 14: DHIS Project implementation ............................................................................... 124
List of figures and boxes
Figure 1: The share of rural population by provinces (2012) .............................................................. 3
Figure 2: GDP per capita by years ....................................................................................................... 5
Figure 3: Pakistan progress to attaining health related MDGs (2013) ................................................ 7
Figure 4: Planned supply of healthcare work force (per 1000 population) by years .......................... 9
Figure 5: Challenges related to HRH ................................................................................................... 9
Figure 6: Health expenditures (as % or in current $) ........................................................................ 10
Figure 7 Coverage of EPI services by ESDP ...................................................................................... 11
Figure 8: Service develiry capacity by type of healthcare proviers and functional status in Pakistan, public sector ......................................................................................................................... 12
Figure 9: Service delivery capacity per type of healthcare professional and functionla status at the community level by typology and status in Pakistan, public sector ................................... 12
Figure 10: Structure of deliveries by place and skilled birth attentands (SBA) ................................... 13
Figure 11: Problems in accessing health care reported by CBAW (national average) ........................ 13
Figure 12: Key health findings in the Situational Analysis, province-by-province ............................. 13
Figure 13: Number of cases of selecd VPD (1999-2012) ...................................................................... 16
Figure 14: Coverage estimates (in %) by years and sources, Pakistan ................................................. 17
Figure 15: Situational Analysis – routine immunization based on official estimates of provinces by years ..................................................................................................................................... 17
Figure 16: Immunizaiton coverage trends: FIC and DTP3 by years and recall method, Pakistan ..... 18
Figure 17: Proportion of FIC by entities and years, based on records and recall (PSLM) .................. 19
Figure 18: Fully immunized child (0-11 months) by selected provinces and surveys ......................... 19
Figure 19: Fully immunized child by gender and provinces and recall methods, PLSM 2011-12 ...... 20
Figure 20: FIC (based on record) - inequalities by wealth, residence and years (PSLM) .................. 20
Figure 21: Situational Analysis - by accelerated disease control initiatives ........................................ 21

Comprehensive Multi-Year Plan | Immunization Program of Pakistan
Figure 22: Number of Polio SIA round by provinces and years ........................................................... 21
Figure 23: Size of target population and number of Polio affected UC by the level of risks and provinces ............................................................................................................................. 22
Figure 24: Competencies by the immunization system components ................................................. 23
Figure 25: Situational analysis of routine EPI by immunization system components ....................... 24
Figure 26: Number and proportion of UC with annual micro-plans for immunization .................... 27
Figure 27: Availability and workload of skilled immunization staff (2012) ....................................... 29
Figure 28: Staffing gap (SIS) by provinces .......................................................................................... 30
Figure 29: AFP detection rate/100,000 population under 15 year of age by provinces and years .... 32
Figure 30: Baseline Cost Profile (shared costs and campaigns included) .......................................... 55
Figure 31: Cost structure by provinces and major cost categories, routine immunization (2012) .... 55
Figure 32: Baseline Financing Profile .................................................................................................. 56
Figure 33: Immunization program baseline indicators (National) ..................................................... 56
Figure 34: Total resource requirements (2014-2018) by immunization system components - National ............................................................................................................................... 57
Figure 35: Total resource requirements by immunization system components and years ................. 57
Figure 36: Future resource requirements by cost categories (routine immunization) ...................... 58
Figure 37: Cost of establishing and maintaining buffer stock by provinces and years of establishing the buffer stock ................................................................................................................... 58
Figure 38: Financing structure by sources and types of financing ..................................................... 59
Figure 39: Financing and funding gap by Years .................................................................................. 60
Figure 40: Funding gap (without shared costs) by types of financing (2014-2018) ........................... 60
Figure 41: Structure of the funding gap by types of financing (national, 2014-2018) ........................ 61
Figure 42: Breakdown of “Activities and other reccurent costs” funding gap by cost categories and types of financing ................................................................................................................. 61
Figure 43: Description of provinces by administrative structure and target population (2012) ....... 64
Figure 44: Population projections by sources: NISP and provincial cMYPs ...................................... 64
Figure 45: School enrollment by levels of education and gender (2010-12) ...................................... 64
Figure 46: Poverty indicators ............................................................................................................... 65
Figure 47: District wise incidence of poverty (headcount ratio) ......................................................... 66
Figure 48: Federal government expenditures and revenues (in million PKR) ................................... 66
Figure 49: Findings of PDHS: Immunization coverage by household characteristics, 2012-13 ........ 67
Figure 50: Frequency of problems in accessing health care as reported by CBAW by federal entities ............................................................................................................................................. 67
Figure 51: Human resource for health by categories and years .......................................................... 68
Figure 52: Immunization coverage and inequity by years, Pakistan (PSLM) .................................... 68
Figure 53: FIC by years and provinces (PSLM) ................................................................................... 68
Figure 54: FIC by Provinces, residence, gender, years and data collection methods ......................... 69
Figure 55: High risk polio areas by provinces and districts ................................................................ 70
Figure 56: Ratio of vaccinators and SIS to total population and surviving infants (per 10,000) by provinces .............................................................................................................................. 71
Figure 57: Structure of SIS (by medical staff categories) by provinces (2012) .................................... 71
Figure 58: Distribution of immunization workforce between PEI and EPI by provinces .................. 72
Figure 59: Selected healthcare financing indicators 1995-2011, Pakistan .......................................... 73
Figure 60: The number of cases of VPD by years ................................................................................ 74
Figure 61: DTP3 coverage estimates by years ans sources, Pakistan (detailed) ................................. 74
Figure 62: Immunization system performance - cold chain and transportation details by provinces (2012) ................................................................................................................................... 75
Figure 63: Immunization system performance – service delivery details by provinces (2012) .......... 75
Figure 64: Immunization system performance – surveillance and reporting by provinces (2012) .... 75

Comprehensive Multi-Year Plan | Immunization Program of Pakistan
Figure 65: Governance arrangements, EPI, Federal level ................................................................... 76
Figure 66: Governance and administration schemes of EPI and PEI at the federal and provincial levels .................................................................................................................................... 77
Figure 67: Immunization program outcome indicators with baseline and targets (2018) by federal entities ................................................................................................................................ 85
Figure 68: FIC baseline and targets by provinces and years ............................................................... 86
Figure 69: Geographical equity baseline and targets by provinces and years .................................... 86
Figure 70: Drop-out rate baseline and targets by provinces and years .............................................. 86
Figure 71: Cost of establishing and maintaining the buffer stock at national, provincial and district levels by federating entities and years (year of buffer stock establishment – 2015)......... 87
Figure 72: Immunization programcosts in 2012 by cMYP components and provinces .................... 101
Figure 73: Routine immunization costs (2012) by major cost categories and provinces .................. 101
Figure 74: Personnel cost structure by provinces (2012) .................................................................. 102
Figure 75: Baseline financial indicators by provinces ....................................................................... 103
Figure 76: Total resource requirements (2014-2018) by major system components and provinces 104
Figure 77: Total (2014-2018) resource requirements by cMYP components and provinces ............ 105
Figure 78: Total resource requirements by years (national) .............................................................. 105
Figure 79: Total resource requirements (2014-2018) by major cost categories and provinces – routine immunization only ............................................................................................... 106
Figure 80: Total (2014-2018) resource requirements by cost category and provinces ..................... 107
Figure 81: Total financing by type of financing, sources of financing and provinces (2014-2018) . 108
Figure 82: Total financing by type of financing, sources and years .................................................. 109
Figure 83: Composition of the Funding Gap with secured financing only by provinces (2014-2018) (shared costs are not included) ......................................................................................... 112
Figure 84: Composition of the funding GAP with problable financing by provinces (2014-2018) (shared costs are not included ........................................................................................... 112
Figure 85: Structure of the funding gap for “Activities and other recurrent cots” by provinces (2014-2018) .................................................................................................................................. 112
Figure 86: Costs and resource requirements of SIA by provinces, cost categories and years ........... 113
Figure 87: Federal EPI Cell vehicle fleet characteristics .................................................................... 115
Figure 88: Federal EPI Expenditure for FY 2011-12 (in PKR) ........................................................... 116
Figure 89: Immunization program resource requirements at the federal level by cost categories ... 117
Figure 90: Immunization program resource requirements at the federal level by cMYP components and years (thousand US$) ................................................................................................. 118
Figure 91: Immunization program financing (secured + probable) and funding gap at the federal level (thousand US$) by years and financing sources ...................................................... 118
Figure 92: vLMIS development and scaling-up plan ......................................................................... 123
Figure 93: vLMIS development, deployment and operation cost projections (in nominal prices) .. 123
Figure 94: Implementation of DHIS by districts, interventions and funding agencies .................... 124
Figure 95: Federal EPI Cell staffing table ........................................................................................... 127
Box 1: WHO Immunization in Practice topics .............................................................................. 40
Box 2: vLMIS benefits for all steps of vaccine supply management ............................................. 43

Comprehensive Multi-Year Plan | Immunization Program of Pakistan
Abbreviations
ACS Additional Chief Secretary
AD Auto-destruct (syringes)
AEFI Adverse events following immunization
AFP Acute flaccid paralysis
AGPR Account General Pakistan Revenues
AHQH Agency Head Quarter hospital
AIC Area in charges
AJK Azad Jammu & Kashmir
ASV Assistant Superintendent Vaccination
BAL Balochistan
BCG Bacille-Calmette-Guerin vaccine
BHU Basic health unit
BSN Baccalaureate of science in nursing
BSP Budget Strategy Paper/Process
CBAW Childbearing age women
CCC Concept Clearance Committee
CCEM Cold Chain Equipment Manager
CCI Council of Common Interest
CDA Capital Development Authority
CDC Communicable Disease Control
CDWP Central Development Working Party
CHC Community health centres
cLIMS Logistics Management Information System for Contraceptive Supply Chain
CMW Community midwife
CPI Consumer Price Index
CSF Coalition Support Fund, Cash Settled Futures
DDHO Deputy District Health Officer
DDM Direct disbursement mechanism
DDO Drawing and Disbursement Officer
DFID Department for International Development
DHCSO District Health Communication Support Officer
DHO District Health Officer
DHQH District Head Quarters hospital
DHS Director Health Services
DHIS District health information system
DoH Department of Health
DOTS Directly observed treatment short course
DPCR District Polio Control Room
DPEC District Polio Eradication Committee
DPT Same as DTP
DSV District Superintendent Vaccinationn
DTP Diphtheria, Tetanus and Pertussis (vaccine)
EAD Economic Affairs Division
ECC Economic Coordination Committee
ECNEC Executive Committee of the National Economic Council
EDO Executive District Officer
EmONC Emergency obstetrical and neonatal care
EPI Extended program of immunization
ESDP Essential service delivery package

Comprehensive Multi-Year Plan | Immunization Program of Pakistan
FATA Federally Administered Tribal Areas
FEPIC Federal EPI Cell
FIC Fully immunized child
FMOH Federal Ministry of Health
FR Frontier region
FSW Female sex worker
FTE Full time equivalent
FWW Family Welfare Worker
FX Foreign exchange
FY Fiscal year
GAVI Global Alliance for Vaccines and Immunization
GB Gilgit-Baltistan
GBt Government budget
GGE General government expenditure
GGHE General government health expenditure
GHED Global health expenditure database (WHO)
GIZ Deutsche Gesellschaft für Internationale Zusammenarbeit
HR Human resources
HRH Human Resources for Health
HSS Health system support
HSW Hijra Sex worker
IBD Invasive bacterial diseases (surveillance)
ICC Interagency Coordination Committee
ICS Immunization (system) component specific
ICT Islamabad Capital Territory
IDU Injected drug user
ILR Ice-lined refrigerator
IPCP Inter-provincial Coordination Committee on Polio
IPV Inactivated polio vaccine
ISS Immunization system support
JICA Japan International Cooperation Agency
KAP Knowledge, attitude and practice
KP Khyber-Pakhtunkhwa
KPH Khyber Pakhtunkhwa primary Health
KPK Khyber-Pakhtunkhwa
LHS Lady health supervisor
LHV Lady health visitor
LHW Lady health worker
LoC Line of control
LPN Licensed Practical Nurse
MCH Maternal and child health
MDGs Millennium development goals
MNCH Maternal, newborn and child health
MNHSRC National Health Services, Regulations and Coordination Division
MoH Ministry of Health
MoU Memorandum of understanding
MPI Multidimensional Poverty Index
MSD Measles second dose
MSN Master of science in nursing
MSW Male sex worker
MTBF Medium Term Budgetary Framework
MTFF Medium Term Fiscal Framework

Comprehensive Multi-Year Plan | Immunization Program of Pakistan
NEAP National Emergency Action Plan for polio
NEC National Economic Council
NFC National Financial Commission
NICC National Interagency Coordination Committee
NIPS National Institute of Population Studies
NSC National Steering Committee (for EPI and for PEI)
NTF National Task Force (for Polio)
OBB Output based budgeting
OOPS Out of pocket spending
OPV Oral polio vaccine
PDHS Pakistan Demographic and Health Survey
PEI Polio Eradication Initiative
PICC Project Implementation Coordination Committee
P-ICC Provincial Interagency Coordination Committee
PM&DC Pakistan Medical & Dental Council
PNC Pakistan Nursing Council
POL Patrol oil lubricants
PPHI People’s Primary Healthcare Initiative
PPMA Pakistan Pharmaceutical Manufacturers’ Association
PPRA Public Procurement Regulatory Authority
PSDP Public Sector Development Plan
PSLM Pakistan social and living standards measurement survey
PUN Punjab
RED Reach every district
REUC Reaching every Union Council
RHC Rural health center
RRL Regional reference laboratory
SBA Skilled birth attendant
SBP State Bank of Pakistan
SC PEI Steering Committee (on Polio Eradication Initiative)
SIADS Short interval additional dose strategy
SIN Sindh
SOPs Standard operating procedures
SWOT Strength, weaknesses, opportunities and threats
TBD To be defined…
TB-DMIS Tuberculosis drug management information system
THE Total health expenditure
THQ Tehsil Head Quarter
THQH Tehsil Head Quarters hospital
TPM Third party monitoring
TSV Tehsil Superintendent Vaccination
TT Tetanus toxoid
U5MR Under five mortality rate
UCMO Union Council Medical Officer
UCO Union Council Communication Officer
UCPW Union Council polio worker
UNFPA United Nations Population Fund
UNICEF United Nations Children Fund
UPEC UC Polio Eradication Committee
USAID U.S. Agency for International Development
vLMIS Vaccine Logistics Management Information System
VPD Vaccine preventable diseases

Comprehensive Multi-Year Plan | Immunization Program of Pakistan
WMS Warehouse management system
WPV Wild poliovirus

Executive Summary: Comprehensive Multi-Year Plan, 2014-2018 | Expanded Programme on Immunization, Pakistan
Results: Immunization Situation Analysis Summary 2010 -2013
Achievements 1. Capacity building of the provincial EPI staff from all
provinces and federating units on vaccine management
2. Program management structures sustained at all levels after devolution
3. Introduction of PCV10 throughout the country
4. National immunization policy prepared
5. Development of AEFI surveillance guidelines
6. Expansion of VPD surveillance system
7. Fully functional AFP surveillance system
8. Cold chain capacity partially updated at different levels
Immunization Coverage
40
50
60
70
80
90
100
1999 2000 2001 2002 2003 2004 2005 2006 2007 2008 2009 2010 2011 2012
DTP3 - Survey (PDHS) FIC - Survey (PDHS) DTP3 - Country Official Estimates
DTP3 - JRF Administrative coverage DTP3 - WHO/UNICEF Estimates
Immunization System Analysis 1. Shortage of skilled immunization staff for routine
immunization and non-polio SIAs – XX%
2. High reliance of routine immunization on outreach service delivery suffering from inadequate transport infrastructure and overburdened immunization staff
3. Outdated cold chain capacity with poor maintenance capacity and weak vaccine management practices
4. Unreliable and insufficient funding of routine immunization
5. Unreliable monitoring and reporting system
6. Low awareness of the population of the importance and benefits of immunization
Health System Constraints 1. Insufficient governance / managerial capacity for administrative and
financial autonomy after the devolution of health sector to provinces
2. High share of private sector in medical services delivery combined with inadequate regulation
3. Inadequate physical infrastructure at the front line of service delivery in public sector
4. Insufficient healthcare financing (2.5% of GDP) with high level of private financing (73%) and low allocation to healthcare in the stage budget (3.6%)
5. Shortage of healthcare professionals both at the facility and community levels
6. Fragmentation of (vertical) public health programs
7. Majority of population (63%) experiences problems in accessing or using healthcare services
8. Rural-urban inequality in health care delivery
Vaccine Preventable Disease Incidence
Indicators 2008 2012
Polio 117 74
Measles (lab confirmed) 1,129 8,046
Tetanus Neonatal 320 809
Diphtheria 32 98
Rota 1,692
Rubella 483
Pertussis 169 60
Baseline Costing Profile
Advocacy and Communication2%
Programme Management
1%
Service Delivery
18%
Shared Health
Systems Costs23%
SIA Total32%
Vaccine Supply
and Logistics (RI only)
24%
Baseline financial indicators
Total Immunization Expenditures $180,793,176
Campaigns $75,301,701
Routine Immunization only $105,491,475
Per Capita (Routine Only) $0.60
Per DTP3 child (Routine Only) $29
% Vaccines and supplies (RI) 46.5%
% Government Funding 57%
% THE 2.0%
% GHE 19.9%
% GDP 0.048%
Total Shared Costs $54,662,109
% Shared health systems cost 23%
Total Immunization system costs $235,455,285
Baseline Financing Profile Gov. Co-Financing
1.40%
Provincial Government
27.93%
WHO0.17%
PEI36.81%
Federal Government
6.31%
USAID3.60%
GAVI (ISS , NVS, HSS)
22.46%

Executive Summary: Comprehensive Multi-Year Plan, 2014-2018 | Expanded Programme on Immunization, Pakistan
Strategic Plan: Summary 2014 -2018
National Immunization Priorities
1. Increasing immunization coverage and reducing vaccine-preventable diseases
2. Stopping wild poliovirus transmission throughout Pakistan and eradicating the disease
3. Improving quality, efficiency and sustainability of immunization
4. Changing political and public awareness of and attitudes toward importance of immunization
5. New vaccine introduction (IPV, Rota)
Immunization Priority Objectives
1. Increase control of VPD diseases
2. Increase coverage and equity of routine immunization
3. Improve surveillance of VPD diseases and AEFI
4. Improve effective vaccine management
5. Improve monitoring and reporting of immunization services
6. Increase sustainability of immunization financing
National Program Monitoring Framework
Indicator 2012 2018 Target
DTP3 69% 85%
BCG 85% 92%
OPV 83% 85%
Measles 61% 79%
TT 63% 78%
IPV 0% 91%
PCV 0% 72%
Rota 0% 64%
MR 0% 79%
Drop-out rate 18% 9%
Equity – geographic 20% 73%
Equity – wealth 47% 20%
Priority National Program Strategies
1 Streamline immunization program management at all levels in the light of the devolution and with focus on local ownership and sustainability
2 Improve immunization service delivery through:
2.1 mobilization of additional skilled immunization staff and strengthening physical infrastructure
2.2 implementation of micro-planning in all UCs
2.3 Upgrade of physical infrastructure and logistics system
3 Increase sustainability of immunization through:
3.1 Effective integration into MNCH services
3.2 Improved planning and budgeting
4 Increase political and public awareness of the importance of immunization through evidence based advocacy, communication and social mobilization activities
Major Risks and Challenges
1. Security and poor law and order conditions particularly in KP, FATA and Balochistan
2. Natural disasters
3. Political interference, in staffing particular
4. Social and cultural barriers (except Sindh and Punjab)
5. Illiteracy and poverty
Health and Development Impacts
1. Improve child survival through contribution to achievement of MDG5.
2. Reduced disability in the community associated with vaccine-preventable disease (AFP, meningitis).
3. Contribute to poverty reduction goals through the reduction of preventable hospitalization for childhood illnesses.
4. Contribute to health expenditure savings through reduced hospital burden of VPD (pneumonia, diarrhea, meningitis)
Cost and Financing Projections
2014 2015 2016 2017 2018 Total
Total resources required (US$ million) $483.6 $535.8 $520.7 $530.2 $541.8 $2,612.1
Cost per capita (in US$) $2.64 $2.86 $2.73 $2.73 $2.73 $2.74
Total secure financing (US$ million) $417.4 $383.2 $167.4 $174.8 $168.2 $1,311.1
Funding Gap (with secure) (US$ million) $66.2 $152.6 $353.3 $355.4 $373.6 $1,301.0
Total probable financing (US$ million) $27.0 $114.6 $258.4 $236.8 $262.1 $898.9
Funding Gap (with secure & probable) (US$ million) $39.2 $38.0 $94.9 $118.5 $111.5 $402.1
8% 7% 18% 22% 21% 15%
Comprehensive Multi-Year Plan | Immunization Program of Pakistan
Preface
The current document represents an attempt of consolidation of results of an inclusive strategic
planning exercise for immunization carried out by the Government of Pakistan (GoP) and partners at
provincial and federal levels. Designated health authorities in each federal entity conducted a series of
consultations with key stakeholders and designed respective comprehensive multi-year plans for
immunization (cMYP).
A “bottom-up” approach to the strategic planning for immunization ensures true local ownership and
is aligned with the key principles of devolution of responsibilities for health care to federal entities as
required by the 18th Amendment to the Constitution of Pakistan. Each cMYP developed by federal
entities:
a) Conveys understanding of immunization related context specific to the entity
b) Reflects a vision of the sub-national authorities and partners of the developments of
immunization and strategic decisions necessary to achieve immunization outcomes
addressing entity specific challenges and tacking stock of past achievements
c) Presents a financial framework (projections of resource requirements and financing) linking
availability of resources (financial or service delivery capacity) with immunization
performance targets
Sub-national cMYPs are primarily intended to inform local policy-making process being translated
into respective budget planning and execution instruments as well as to guide in-country development
partners, donors and non-governmental organizations in providing support to immunization.
Despite the devolution of health care, the federal health authorities retain exclusive responsibilities
and roles in fulfillment national commitments of Pakistan at the global and regional levels (such as
Millennium Development Goals) while supporting sub-national entities in the implementation of their
respective immunization programs. Therefore, the main purpose of current national cMYP is to
provide an overall description of achievements and expected developments in immunization from a
national perspective by:
1) consolidating sub-national cMYPs into one narrative
2) Highlighting immunization related challenges, expectations and intended efforts at the
federal level not covered by sub-national cMYPs.
The consolidated national cMYP is primarily meant for federal level policy makers to inform
budgetary decisions and actions within the federal competencies as well as for international actors
supporting Pakistan in fulfilling its commitments.
Finally, production of sub-national and consolidated national cMYPs is not the end but the beginning
of evidence-based, result-based and transparent strategic governance processes in immunization at
federal and sub-national levels.

Comprehensive Multi-Year Plan | Immunization Program of Pakistan
1
1 Situational Analysis
1.1 Background information
1.1.1 Landscape and climate
Pakistan covers an area of 796,095 km2 and is the 36th largest nation by total area. Ranging from the
coastal areas of the south to the glaciated mountains of the north, Pakistan's landscapes vary from
plains to deserts, forests, hills and plateaus. It is divided into three major geographic areas:
The northern highlands contain the Karakoram, Hindu Kush and Pamir mountain ranges with
five of the fourteen mountain peaks over 8,000 meters
The Hindu River plain covers the territory from Kashmir region to the Arabian Sea where the
Indus River (1,609 km) and its tributaries flow with alluvial plains along it in Punjab and Sindh
The Balochistan Plateau lies in the west bordering with Iran.
Approximately 26% of land is arable (207,144 km2) with 200,000 km2 of land being irrigated.
The climate varies from tropical to temperate, with arid conditions in the coastal south. There is a
monsoon season with frequent flooding due to heavy rainfall and a dry season with significantly less
rainfall or none at all. Rainfall varies greatly from year to year, and patterns of alternate flooding and
drought are common.
Pakistan overlaps the Indian and Eurasian tectonic plates and is prone to violent earthquakes.
1.1.2 Administrative and political structure
Pakistan gained its independence
from British India in 1947. The first
constitution was adopted in 1956
during the transition to the Islamic
Republic of Pakistan. The constitution
of 1973 lays the foundation of the
current political system. Pakistan
today is a multi-party system
parliamentary state with clear division
of power and responsibilities between
legislative, executive and judiciary
branches of government:
The president is the head of the
State and is the civilian commander-in-chief of the Pakistan Armed Forces. The president is
elected by an electoral college1.
Legislative branch consists of a 100-member Senate and a 342-member National Assembly.
Members of the National Assembly are elected directly by voters representing electoral districts.
1 According to article 41(3) of the 1973 Constitution of Pakistan, this electoral college consists of the Senate, the
National Assembly of Pakistan, and Four Provincial Assemblies (GB has also a provincial assembly but it not part of the electoral college)

Comprehensive Multi-Year Plan | Immunization Program of Pakistan Chapter 1: Situational Analysis
2
Senate members are elected by provincial legislators. Provinces have equal representation in the
Senate including FATA with fixed seats.
Executive branch is headed by the Prime Minister responsible for appointing a cabinet of
ministers and running the government operations. The Prime Minister is usually the leader of the
largest party or a collation in the National Assembly.
The judiciary of Pakistan consists of two classes of courts: superior (the Supreme Court of
Pakistan, the Federal Shariat Court and five High Courts) and subordinated judiciary.
Islamic Republic of Pakistan (Jamhuryat Islami Pakistan) is federation of four provinces and five
administrative territories as shown below (in alphabetic order) often referred to as “federal entities”:
Full name Short name2 Type
Azad Kashmir AJK Administrative territory
Federally Administered Tribal Areas FATA Administrative territory
Islamabad Capital Territory ICT Administrative territory
Capital Development Authority CDA Administrative territory
Khyber Pakhtunkhwa KP Province
Sindh SIN Province
Punjab PUN Province
Balochistan BAL Province
Gilgit-Baltistan GB Administrative territory
Provincial governments have a similar system of government with a directly elected Provincial
Assembly where the leader of the largest party/coalition elects Chief Minister. The Chief Minister is
the head of provincial cabinet and oversees the provincial government operation. Provincial
Governors playing role as the ceremonial head of province are appointed by the President.
Local government follows a three-tier system of districts, tehsils and union councils (UC) as shown in
Figure 43 (on page 64 in Annex 1).
1.1.3 Demographic
The population of Pakistan reached 184.5 million in 2012-12 according to the National Institute of
Population Studies (NIPS). The population growth rate is estimated at the level of 2% and the total
population is expected to reach 192.1 million in 2018 (as shown in Figure 44 on page 64 in Annex 1).
Approximately 64 percent of the population lives in rural areas with different patterns across federal
entities as shown in Figure 1 on page 3.
Formal registering of births is not widely practiced in Pakistan, even though the national registration
system was introduced in 1973 and enforced by the directorate general of registration. According to
PDHS 2012-13, more than 3 in 10 children under age 5 have been registered and 32 percent have a
birth certificate. Although the government’s vital registration system requires that a newborn be
registered within the shortest possible time after birth, children under age 2 are less likely to be
registered than children age 2-4 (31 percent and 35 percent, respectively). The registration of older
children is primarily driven by the practice of asking parents to produce a child’s birth certificate for
school admission.
2 As used hereinafter

Comprehensive Multi-Year Plan | Immunization Program of Pakistan Chapter 1: Situational Analysis
3
Birth certificates are made mandatory for services such as school enrollment, passports, voter
registration, and marriage registration. Local governmental organizations and nongovernmental
organizations (NGOs) are participating in birth registration for workplace populations. Rural
residents, people living in Balochistan, Khyber Pakhtunkhwa, and Gilgit-Baltistan; and those in the
lower two wealth quintiles are less likely to have a birth certificate.
Figure 1: The share of rural population by provinces (2012)
Source: Provincial cMYPs
Pakistan has a legal and administrative structure stipulating official registration of births according to
standard procedures. In 2000, the government established the National Database and Registration
Authority (NADRA) to oversee registration of the population. All children under age 18 are registered
using the “Bay Form,” and adults age 18 and older are issued a computerized national identity card
(CNIC). According to PDHS 2012-13, about 20 percent of the household population under age 18 has a
Bay Form. More than four in five adults (age 18 and over) have a CNIC. Forty-six percent of the
population does not have any form of registration.
Internal migration is a common phenomenon in Pakistan: according to the Pakistan Integrated
Household Survey (PIHS) 1998, 21.5% of population migrated within and between districts (out of
which one third of migrants moved between rural and urban settings); according to Labor Force
Survey (LFS) 1998, 13.5% of population was involved in inter-district migration. Marital and family
movements constituted the major reason for migration (followed by economic factors – 18.1-20.9%).
According to the PDHS 2012-2013, 4% of household members have migrated to their current place of
residence in the past 10 years (“in-migration”); 18 percent of households have at least one usual
member who has migrated in the last 10 years (“out-migration”).

Comprehensive Multi-Year Plan | Immunization Program of Pakistan Chapter 1: Situational Analysis
4
1.1.4 Social and political context
(1) Poverty
Approximately one out of five persons lived in poverty (consuming less than $1.25 a day) in 2006-
2008. 27% of rural population and 13.1% of urban population consumption was below national
poverty line3 (see Figure 46 on page 65).
According to conservative estimates of the Sustainable Development Policy Institute (SDPI), 33
percent of Pakistanis were living below poverty line in 2012 with substantial rural-urban (46% vs. 18%
respectively) and provincial disparities (52% population living below poverty line in Balochistan,
followed by Sindh with 33%, Khyber Pakhtunkhwa with 32% and Punjab with 19% - see Figure 47 on
page 66 for district wise incidence of poverty)4.
(2) Education
According to the World Bank5, average adult literacy rate was 54.9% in 2009 (68.6% among males
and 40.3% females). However, literacy among youth was much higher – 70.7%, especially among
females (61.5%). PDHS 2012-2013 revealed that only 43.4% of women (age 15-49) was literate vs.
65.4%a of men. Literacy among women was twice less frequent in rural areas (30.6%) than in urban
settings.
57 percent of ever-married women age 15-49 have never attended school and only 9 percent reached
class or higher (PDHS 2012-2013). Urban women are far more like to be educated than rural women.
Only 29 percent of ever-married age 15-49 men have never attended school (the highest value
observed in Balochistan – more than half). School enrollment details are presented in Annex 1 (see
Figure 45 on page 64).
(3) Culture and traditions
Ethnical Punjabi constitute 45% of the population, Pashtun – 15.4%, Sindhi – 14%, Sariaki – 8.4-
10.5%, Muhajirs – 7.6, Balochi – 3.6% and other ethnical groups – 4.7-6.3%.
More than sixty languages are spoken in Pakistan: Urdu is national language and is understood by
over 75% of Pakistanis. Approximately half of population speaks Punjabi, 12% - Sindhi, 8% - Pashto
and 3% - Balochi. English as official language is used in government, legal contracts and official
business.
Approximately 85-90% of the population is Sunni and 10-15% Shia Muslim. Followers of other
religions (Christianity, Hinduism, etc) constitute 3.6% (2010 estimates).
Pakistani society is largely hierarchical, emphasizing local cultural etiquettes and traditional Islamic
values that govern personal and political life. According to PDHS 2012-13, “Only 38 percent of
currently married women participate jointly with their husbands in making decisions pertaining to
their own health care, major household purchases, and visits to their family or relatives.”
3 Pakistan’s Planning Commission declared an official poverty line in 2011 as 2350 calories per adult equivalent
per day (2150 calories in the urban areas and 2450 calories in the rural areas); it is equivalent to 673.54 PKR per capita per month consumption in 1998-99 prices.
4 Arif Naveed, Nazim Ali. “Clustered Deprivation: District Profile of Poverty in Pakistan”. First Edition September 2012. Sustainable Development Policy Institute. ISBN: 978-969-8344-17-7
5 http://data.worldbank.org/country/pakistan

Comprehensive Multi-Year Plan | Immunization Program of Pakistan Chapter 1: Situational Analysis
5
1.1.5 Economics and financing
(1) Economic outlook
According to the World Bank, Gross Domestic Product (GDP) per capita has almost doubled from
63,700 in 2008 up to 112,000 in 2012 (in current PKR), but showed a slight increase from 52,500 up
to 54,600 if expressed in constant PKR as shown in Figure 2 below:
Figure 2: GDP per capita by years
Source: The World Bank (2014)
Gross National Income (GNI) per capita increased from 990 in 2008 to 1,260 in 2012 (Atlas method,
current US$) according to the World Bank.
Per capita income increased from 54,759 in 2009 up to 58,932 (in 2005-06 PKR in 2012/13, while in
current PKR it increased by 50% from 80,545 to 131,543 according to the Pakistan Bureau of Statistics
(SBP, Monthly Statistical Bulletin, February 2014).
Official exchange rate of PKR to US$ has been increasing from 78.49 in 2008/09 (average annual) to
108.38 in November 2013 (State Bank of Pakistan, Monthly Statistical Bulletin February 2014). CPI
Inflation (overall) decreased from 8.1% in Nov-Dec 2012 to 5.1% in May 2013 but increased up to
10.9% in November 2013.
According to the economic survey annual report 2012-2013 (The Ministry of Finance), real GDP
growth was 3.6% in 2013 fiscal year compared to 4.4% in the previous year. The investment-to-GDP
ratio was 14.2 percent in FY13, which is lower than the 14.9 percent realized in FY12. More
importantly, private investment fell to 8.7 percent of GDP in FY13, which is far below the level
required to meet the country’s needs. Revenues were initially projected to grow at 31.7 percent in FY13
compared with an average increase of 14.9 percent in the preceding five years. During the course of
the year, the government could only realize 88.3 percent of the projected revenue, with revenues

Comprehensive Multi-Year Plan | Immunization Program of Pakistan Chapter 1: Situational Analysis
6
growing at only 16.2 percent. This shortfall was entirely due to lower growth in tax collection, as non-
tax revenues surpassed the annual target because of CSF inflows.
Although weak economic activity could also be blamed, the fall in tax-to-GDP ratio from 10.2 percent
in FY12, to 9.6 percent in FY13, suggests this is not the case – in effect, tax revenue collection could
not even keep pace with the subdued growth in nominal GDP. In our view, the stagnant tax-to-GDP
ratio (one of the lowest in the world) is the biggest impediment to a stable macro economy, which is
required to deliver higher economic growth.
Financing the growing fiscal gap and balancing competing expenditure needs, has dominated
policymaking in the country. Government borrowing from domestic sources in FY13, was actually
higher than the overall fiscal deficit in the year, as net external debt payments had to be paid despite
insufficient fresh external inflows. Other than the drain on domestic resources, this resulted in a sharp
fall in SBP’s FX reserves during the year
(2) Public expenditure management
There are two types of public budget: regular (or current expenditure) budget and development
budget. The distinction between current and development expenditure is based on the type of effect
the expenditure has on the production capacity of the economy. All expenditures that keep intact,
enlarge and improve the physical resources of the country and/or improve the knowledge, skill and
productivity of the people and encourage efficiency with which available resources are used are
defined as development expenditure. All the remaining expenditure is defined to belong to the
category of current expenditure.
The conventional practice in Pakistan in the formulation of expenditure budgets had been based on
the ''bottom-up" demands of various government agencies. It has been replaced by combined a “top
down” and “bottom up” planning approach since the introduction of Medium Term Budgetary
Framework (MTBF) 6:
“Top down” approach ensures the alignment of federal budget allocations to the strategies and
priorities of the Government and is built on the Medium Term Fiscal Framework (MTFF). A
Budget Strategy Paper (BSP) prepared jointly by the Financial Division and the Planning
Commission in October and February provides options for sectoral expenditures in the light of
government priorities and budget constraints.
“Bottom up” component of MTBF replaces the traditional process of budget preparation driven
upwards by spending agents (line ministries) by implementing Output Based Budgeting (OBB)
across all ministries/divisions of the federal government.
The MTBF involves preparation by line ministries of three-year expenditure estimates within the
ceilings provided by the Ministry of Finance (for the recurrent budget) and by the Planning
Commission (for the development budget). Each year, the MTBF process involves the rolling forward
of the previous MTBF estimate by one year and the addition of a new outer year. Composition of the
Federal budget is presented in Figure 48 (on page 66).
Fiscal year in Pakistan runs from July 1 to June 30.
6 See details on a budget preparation process under MTBF on the Ministry of Finance official website

Comprehensive Multi-Year Plan | Immunization Program of Pakistan Chapter 1: Situational Analysis
7
1.2 Health Sector Analysis
1.2.1 Health Status
Pakistan is off track in its progress toward achieving health related Millennium Development Goals
despite the success in the reduction of diarrhea incidence among children under age five and
remarkable decline in infant mortality and maternal mortality rates over the last two decades:
Figure 3: Pakistan progress to attaining health related MDGs (2013)
Goals and indicators Achievement7 Target8 Status
Goal 4: Reduce Child Mortality
Under 5 Mortality Rate (deaths per 1000 live births) 89 52 Off Track
Infant Mortality Rate (Deaths per 1000 live births) 74 40 Off Track
Proportion of Fully Immunized Children 12-13 Months 80 >90 Off Track
Proportion of under 1 year children immunized against measles 81 >90 Off Track
Proportion of Children Under 5 who suffered from Diarrhea in the last 30 days (percent)
8 <10 Achieved
Lady Health Worker’s coverage (% of target population) 83 100 Off Track
Goal 5: Improve Maternal Health
Maternal Mortality Ratio 276 140 On Track
Proportion of births attended by Skilled Birth Attendants 52.1 >90 Off Track
Contraceptive prevalence rate 35.4 55 Off Track
Proportion of CBAW who had given birth during last 3 years and made at least one antenatal consultation
68 100 Off Track
Goal 6: Combat HIV/AIDS, Malaria and Other Diseases
HIV prevalence among 15-49 year old pregnant women 0.041 50% On Track
HIV prevalence among vulnerable groups IDU=37.4 FSW=0.8
MSW=3.1
HSW=7.3
50% Off Track
Proportion of population in malaria risk areas using effective prevention and treatment measures
40 75 Off Track
Incidence of TB/10,000 230 45 Off Track
TB cases detected and cured under DOTS 91 85 Achieved
Source: Planning Commission, Government of Pakistan. “Pakistan Millennium Development Goals. Report 2013”
Life expectancy at birth has been increasing from 63 in 1993 to 66 in 2012. Infant mortality rate (IMR)
has decreased from 105.9 in 1995 to 69.3 in 2012 according to WHO estimates (Global Health
Observatory Data Repository). Maternal mortality rate reduced from 490 to 260 in the same period.
The lowest infant mortality rate and under five mortality rate were observed in KP (58 and 70
respectively) (PDHS 2012-13).
Pakistan Demographic and Household Survey 2012-13 found the proportion of 1-year-old children
immunized against measles to be as low as 61.4% (vs. 81% as shown in Figure 3 above) and the
proportion of fully immunize child9 - 58.8% (vs. 80% originally reported). The survey also revealed
that 22.5% of children under age 5 had diarrhea in the two weeks preceding the survey that is almost 3
7 Latest National Value 8 % - baseline reduced by …% 9 With BCG, measles, and 3 doses of DTP and polio (excluding birth dose OPV)

Comprehensive Multi-Year Plan | Immunization Program of Pakistan Chapter 1: Situational Analysis
8
times higher than the reported MDG achievement (8%) (The highest value was observed in KP –
27.9%).
1.2.2 Governance
In pursuance to 18th Amendment to the Constitution, health sector has been devolved to the provinces
with absolute administrative and financial autonomy. Accordingly Ministry of Health was abolished
on 30th June 2011. The following residual functions have been spread to various Ministries/Divisions
including Planning & Development Division, Cabinet Division, Inter-Provincial Coordination
Division, Capital Administration & Development Division, Economic Affairs Division and Interior
Division. The health functions retained at the federal level are:
National Planning
Coordination (with provinces and international development partners)
Funding of Vertical Programs in Health Sector
Regulation of Pharmaceutical Sector
International Health Regulations
Dealing with International Agreements and MoUs
Training Abroad
Although vertical Programs in health sector have been devolved to the provinces, however, upon their
request and in pursuance to the decision of CCI, funding for these vertical Programs during the 7th
NFC Award shall be catered to by Federal Government (till July 2015).
A new ministry was established at the federal level in order to address institutional fragmentation in
health at the federal level on May 3, 2013: the existing Division of National and Health Services and
Regulations was renamed as the National Health Services, Regulations and Coordination Division
(MNHSRC).
Prior to the implementation of the 18th Amendment the Federal Ministry of Health was responsible
for policy development, standard setting, regulatory frameworks for drugs and services, development
of national plans, inter-provincial coordination, monitoring, evaluation, research, resource
mobilization, and provision of services through vertical programs such as LHWs, EPI, etc.
The mandates of provincial Departments of Health covered policy, intra-provincial coordination,
monitoring, and evaluation, medical and nursing education and tertiary care service delivery. District
administrations were responsible for implementation, monitoring and supervision, management of
healthcare delivery at and below the District Headquarter Hospitals (DHQHs) and implementation of
federal vertical programs at the district level.
After the devolution of vertical programs the provincial governments assumed the role once played by
the federal government. As highlighted in recent situational analysis carried out by UNICEF10, in the
immediate future the policies and program cycles already in place will most likely continue; however
the provinces may find difficulties in allocating budgets for these programs in the long-run. Some
provincial governments have already raised concerns over their ability to provide budget allocations
for the next year.
10 UNICEF. “Situational Analysis of children and women in Pakistan. National Report”, June 2012

Comprehensive Multi-Year Plan | Immunization Program of Pakistan Chapter 1: Situational Analysis
9
1.2.3 Health workforce
Pakistan National Health Policy 2009 planned to increase supply of healthcare workforce as shown
Figure 4 below:
Figure 4: Planned supply of healthcare work force (per 1000 population) by years
Healthcare workforce
Baseline Targets
2006-07 2009-10 2010-11 2011-12 2012-13 2013-14 2014-15
Doctors 0.75 0.78 0.80 0.81 0.83 0.85 0.87
Nurses 0.34 0.38 0.40 0.42 0.44 0.46 0.49
LHVs 0.047 0.054 0.056 0.059 0.062 0.065 0.068
LHWs 0.54 0.61 0.66 0.66 0.68 0.68 0.67
Source: Pakistan National Policy 2009
As stated in Pakistan National Health Policy, there were at least 71 medical and dental colleagues in
the country: 32 in public and 39 in the private sector. The number of registered doctors exceeded
111,600 doctors and 8,400 dentists including 21,500 specialist doctors and 517 specialist dentists.
According to WHO statistics, the number of doctors per 10,000 was 8 in 2012 (slightly below the
policy target) as shown in Figure 51 (on page 68),
All medical doctors and dentists must be registered with Pakistan Medical & Dental Council (PM&DC)
to practice in Pakistan. PM&DC sets uniform minimum educational standards, issues
recommendations for recognition of medical
teaching institutions/programs, issues
experience certificates to faculties and
maintains the register of medical and dental
practitioners.
Pakistan Nursing Council (PNC) is an
autonomous regulatory body constituted under
the Pakistan Nursing Council Act (1973) and
empowered to register/license Nurses,
Midwives, Lady Health Visitors (LHVs) and
Nursing Auxiliaries to practice in Pakistan.
There are four nursing examination boards in
Pakistan - one nursing examination board is
located in each province functioning under the umbrella of PNC.
PNC recognized in total 78 nursing institutions in Punjab, 78 – in Sindh, 26 in KP and 15 Balochistan
in 2011. PNC recognized 27 post-basic courses in nursing institutions, 35 nursing institutions to offer
degree programs (Post RN BSN, Generic BSN, MSN), 9 institutions to prepare licensed practical
nurses (PLN) (2-year programs) and 5 institution - Family Welfare Workers (FWW).
More than 46,000 nurses and 4500 Lady Health Visitors (LHVs) are registered with Pakistan Nursing
Council (PNC), backed up by a community based workforce of about 95,000 lady health workers.
Pakistan also initiated a programme to deploy 12,000 community midwives (CMW) in the rural areas.
Pakistan has been suffering from a variety of challenges related to human resources for health (HRH)
as shown in Figure 5 above. Since the devolution the major HRH challenges include a) reorganization
of the HRH regulatory function and establishment of linkages and coordination between the
Figure 5: Challenges related to HRH
Rural/ urban maldistribution of health workers
Weak HRH management system
Shortage of HRH, mostly in rural areas
“Brain drain” of skilled health workers to other countries
A non-regulated private sector that operates primarily in urban areas
Tenuous quality control and standardization of care
Health information systems not inclusive of HRH
Lack of a coordination mechanism for HRH stakeholders
Source: Global Health Workforce Alliance

Comprehensive Multi-Year Plan | Immunization Program of Pakistan Chapter 1: Situational Analysis
10
Federation and the provinces in terms of formulation and regulation of HRH policies and decisions at
the federal level; and b) Managing HRH liability as a consequence of devolution at the federal level.
1.2.4 Finance
Total health expenditure (THE) constituted 2.5% of GDP and amounted to 23$ (current) per capita in
2012 (WHO EMRO database). General government health expenditure (GGHE) was up to 27% of
THE (down from 38% in 2011) amounting to 8$ (current) per capita. Only 3.6% of general
government expenditures (GGE) were allocated to healthcare as shown in Figure 6 below:
Figure 6: Health expenditures (as % or in current $)
2003 2004 2005 2006 2007 2008 2009 2010 2011 2012
THE as % of GDP 4.1 3 2.4 2.2 2.1 2 2.9 2.6 2 2.5
GGHE as % of THE 27.7 28.5 27.7 19.6 17.5 16.8 29.7 32.8 38 27
GGHE as % of GGE 2.6 1.9 2.6 1.9 1.5 1.4 3.5 3.6 4 3.6
Per capita THE 18 15 13 14 15 18 24 23 22 22
Per capita GHE 4 4 4 3 3 3 7 7 8 8 Source: WHO EMRO database
Out of pocket spending (OOPS) constituted 88.6-88.8% of private health care expenditures (or 55-
58% of THE) according to Global Health Expenditure Database (WHO).
The share of external funding in the general government healthcare expenditures varied between 13%-
19% in recent years.
As shown in Figure 48 “Federal government expenditures and revenues (in million PKR)” (on page
66), federal government current expenditures on health services amounted to 7.8 billion PKR in 2011-
12 FY and planned to increase to 9.9 billion PKR in FY 2013-14 (that is 0.35% and 0.31% of federal
government current/regular budget).
Health care financing selected indicators and trends are presented in Figure 59 (on page 73).
1.2.5 Medical products and Technology
The Drug Regulatory Authority of Pakistan (DRAP) has been established under the DRAP Act 2012 to
provide effective coordination and enforcement of the Drugs Act, 1976 (XXXI of 1976) and to bring
harmony in inter-provincial trade and commerce of therapeutic goods. According to the DRAP Act
2012, “No human biological drug is allowed sale and use until a “Lot Release Certificate” from the
Federal Government Analyst of the National Control Laboratory for Biologicals, Islamabad has been
obtained” (article 1.(7), Schedule – I).
“The National Drug Policy (1997) promotes the essential medicines concept and the use of the
National Essential Drug list, for example by mandating all government and semi-government health
institutions to conduct bulk procurement in accordance with the list; however there is poor adherence
to this” (WHO EMRO11). According to recent research, “policy concerns related to essential medicine
access need integrated responses across various components of the health systems, are poorly
addressed by existing evidence, and require an expanded health systems research agenda”12.
11 WHO EMRO. “Pakistan - Medicine prices, availability, affordability and price components”. 12 Zaidi S, Bigdeli M, Aleem N, Rashidian A (2013) Access to Essential Medicines in Pakistan: Policy and Health
Systems Research Concerns. PLoS ONE 8(5): e63515. doi:10.1371/journal.pone.0063515

Comprehensive Multi-Year Plan | Immunization Program of Pakistan Chapter 1: Situational Analysis
11
There were 478 licensed pharmaceutical manufacturers in Pakistan and the market share of
domestically produced pharmaceuticals amounted to 47% (WHO13). The drugs registered in Pakistan
totaled around 66,000 with 55,000 of them being active drugs, as reported by PPMA14.
In Pakistan, there are legal or regulatory provisions affecting pricing of medicines. These provisions
are aimed at the level of manufacturers, wholesalers and retailers. The government runs an active
national medicines price monitoring system for retail prices. Regulations exist mandating that retail
medicine price information should be publicly accessible.
The public sector procurement in Pakistan is centralized and decentralized. It is centralized under the
responsibility of the Public Procurement Regulatory Authority (PPRA) and is framed by Public
Procurement Code consisted of PPRA Ordinance 2002, Public Procurement Rules 2004, Public
Procurement Regulations 2008 and Consultancy Services Regulations 2010. Provincial authorities
apply own procurement rules. Procurement of pharmaceuticals is based on prequalification of
suppliers at the federal level. Medical Store Depots in provinces call quotations from a list of
prequalified companies
1.2.6 Service delivery
According to the Pakistan Health Policy, essential service delivery package (ESDP) has been
introduced at the national level to reduce morbidity and
mortality. Each sub-national authority redefines its content
tailoring to local context. The package sets a list of medical
services to be delivered as well as defines physical
infrastructure, staff, equipment and supplies necessary to
deliver these services. Medical services are divided into 2
categories (core package and optional services) and 5 packages
by delivery levels (BHU, RHC, Referral Hospital/THQ&DHQ,
Tertiary and community).
EPI services (EPI plus) are delivered in the packages at community level, BHU and RHU levels as
shown in Figure 7:
Medical services in Pakistan are delivered at two service delivery interfaces: health care facilities and
communities. Health care provider organizations operate in public and private domain. There is no
accurate information about the number and typology of private health care providers. Public-private
partnerships are widespread in some areas: People’s Primary Healthcare Initiative (PPHI) manages
the majority of BHUs in KP and Singh15.
Facility based medical services in public sector are usually provided at 4 levels: provincial (teaching
hospital), district, tehsils and UC (mostly BHUs, as well as MCH centers & dispensaries as shown in
Figure 8 below:
13 “Pakistan Pharmaceutical Country Profile”. 2010. 14 http://www.thenews.com.pk/Todays-News-6-28593-Pakistan-has-so-far-registered-66000-drugs-PPMA 15 PPHI Sindh Bulletin 2013
Figure 7 Coverage of EPI services by ESDP
ESDP Package EPI services
BHU
RHC
THQ/RHQ
Tertiary
Community

Comprehensive Multi-Year Plan | Immunization Program of Pakistan Chapter 1: Situational Analysis
12
Figure 8: Service develiry capacity by type of healthcare providers and functional status in Pakistan, public sector
Functional Status
Type of health facilities Required16 Functional Delivering EPI
01. Teaching Hospitals 6 6
02. DHQ 148 129 129
03. THQ 460 155 155
04. RHC 1,090 669 668
05. BHU 6,711 5,130 4,658
06. Urban Health Centers 5 5
07. Urban Health Units 16 16
08. MCH Centers & Dispensaries 210 3,450 416
09. Others 573 825 211
10. (LHW) Health House 142,175 76,171
11. Private (obstetric service)
12. Civil Dispensaries 598 622 117
13. First Aid Posts 90 129 2
14. Civil Hospital 45 41 40
15. Community health Centers 163 110
Grand Total 152,263 87,458 6,423 Source: Provincial cMYPs
Medical services at the community level are delivered by a numerous healthcare professionals, some
of them hired and supported by vertical healthcare programs (e.g. LHW) as shown in Figure 9 below:
Figure 9: Service delivery capacity per type of healthcare professional and functionla status at the community level by typology and status in Pakistan, public sector
Source: Provincial cMYPs
Some professionals (such as LHV or Vaccinator) deliver services to communities at “front line” health
care facilities (such as BHU, EPI Centers or MCH Centers).
16 For certain type of healthcare facilities (“others”, First Aid Posts”, “Civil Hospitals”) there are no recognized
norms to estimate requirements. The numbers reflect perceptions of provincial health authorities 17 The number of required LHW differs from the number of required LHW Health Houses; some provinces stated
higher requirement figures for LHW than for LHW Health Houses
Type of personnel Functional Status
Required Functional Delivering EPI
01. LHW17 162,634 94,996 14,865
02. CMW 3,073 0
03. Vaccinator 14,145 10,159 10,159
04. DSV 27 27 0
05. TSV 123 123 0
06. LHV 401 2,051 59
07. LHS 2,248 1,015 0
08. CDC 3,520 1,767 0
09. Sanitary patrol 3,520 1,735 0
10. Nurses 340 256
10. Nurses | Dispensers 33 33
Grand Total 186,958 115,235 25,116

Comprehensive Multi-Year Plan | Immunization Program of Pakistan Chapter 1: Situational Analysis
13
Skilled birth attendants (SBA) assisted 52.1% of deliveries: traditional birth attendants were involved
on par with medical doctors (41% of SBA assisted deliveries). The lowest rate was observed in rural
Baluchistan (14.2%), among households in the
lowest wealth quintile (29.8%) (PDHS 2012-13).
According to PDHS 2012-13, only 48% of births in
Pakistan took place in health facilities: 15% in
public and 34% in private clinics. The lowest
facility based delivery rate was observed in
Balochistan (15.8%).
47.3% deliveries of all deliveries takes place at
home and are not attended by any qualified
provider as shown in Figure 10 above. Only 8% of
home deliveries were assisted by SBA.
Approximately 40% of mothers did receive
postnatal check-up in the first two days after birth
(the highest values observed in KP and
Balochistan – 62%) and 53% of infants did not
receive postnatal checkup in the first weak after
birth (the highest values observed in Balochistan
and KP – 81% and 77% respectively) (PDHS 2012-
13).
Figure 11: Problems in accessing health care reported by CBAW (national average)
Source: PDHS 2012-13
Figure 10: Structure of deliveries by place and skilled birth attentands (SBA)
47.8
4.4
0.5
47.3
HealthFacility
Home
SBA-
SBA+
Source: PDHS 2012-2013
Figure 12: Key health findings in the Situational Analysis, province-by-province
PUNJAB: Even in Pakistan’s most populous province, only 75 per cent of the population have access to a health facility within a half-hour’s distance. The province is putting emphasis on scaledup mobile health units (MHUs) and Lady Health Workers (LHWs) to reach children and women of child-bearing age
SINDH: Health indicators in Sindh suffered a huge setback as a result of the floods of July 2010 (and were challenged again by renewed floods in 2011). Pregnancy and childbirth remain serious life-threatening events

Comprehensive Multi-Year Plan | Immunization Program of Pakistan Chapter 1: Situational Analysis
14
Only one third of women (of
childbearing age) had no
serious problem in accessing
health care services (as shown
in Figure 11 on page 13). CBAW
living in rural area are more
likely to experience at least one
problem in accessing health
care than one living in urban
areas (72.3% and 47.3%
respectively) compared to “Not
wanting to go alone” was the
most frequent reason (53.1%).
At least one access barrier
affected CBAW mostly in KP
(85.2%) and Balochistan
(81.3%) as shown in Figure 50
(on page 67). Transportation
was the number one access
problem in GB (69.2%). Permission to go for treatment was affecting access mostly in Balochistan
(57.1%) compared to other provinces (17.7% national average).
1.2.7 Health Information management
The Government of Pakistan (GoP) developed Health Management Information System (HMIS) for
for the First Level Care Facilities (FLCF) during 1992 to 1995 (with the support of USAID)/
Based on the request from GoP, JICA implemented the Study on Improvement of Management
Information Systems in Health Sector (2004-2007). Through the study, a new health system called
DHIS was developed and National Action Plan (NAP) for the nationwide prevalence of DHIS was
approved at the Steering Committee. “DHIS Project for Evidence-Based Decision Making and
Management” supported by JICA, provincial governments as well as other development partners
(WHO, UNICEF, UNFPA, USAID, GIZ, Save the Children) achieved the following results18 by
completion in July 2012 (see details in Annex 14 “DHIS Project implementation” on page 124):
In 87 DHOs of 100 target districts, routine operation (resource allocation) and budget planning
have been practiced based on the analysis of DHIS data which has been collected for more than 3
consecutive months.
At all PHDs (including AJK and FATA) and 100 target DHOs, the revised DHIS software, a
platform for DHIS data input, was installed
Training on collection of information related to medical facilities was conducted through Cascade
Training Method and 173 master trainers at the district level 9,586 staff at the primary and
secondary level medical facilities has been trained.
18 JICA. “Summary of Terminal Evaluation Study of the Project”. June 2012
for many women, and high rates of female illiteracy prevent women from independently making health decisions, seeking assistance, and stepping out of the household.
BALOCHISTAN: The largely rural population has little or no recourse to medical professionals for reproductive health care. Women are not typically free to travel without a male and they prefer to be seen only by the few female doctors available.
KP: The provincial government spends nearly twice as much on security and law enforcement as on health and education combined. The lack of female staff in primary health care facilities reduces women’s access to health care.
FATA: In 2010, 450 community health centres were reported closed by the Government due to the unwillingness of personnel (especially women) to work in the region, and the number of female patients seeking health care fell from 70,000 in 2006 to 9,234 in 2010.
AJK: The rough terrain, the harsh climate, and various cultural factors discourage women from reaching medical facilities for safe deliveries at health institutions.
GB: Forty-five per cent of babies were delivered in health centres in areas where health facilities are mostly concentrated, while limited health facilities in other districts have led to lower percentages of deliveries assisted by health professionals.
Source: UNICEF. “Situational Analysis of children and women in Pakistan”. June 2012
Comprehensive Multi-Year Plan | Immunization Program of Pakistan Chapter 1: Situational Analysis
15
For the purpose of DHIS data input, analysis and use at PHD and DHO, 81 provincial master
trainers and 129 district master trainers were trained. Staff in 99 DHOs out of 100 target DHOs as
well as all PHDs has been trained on use of DHIS data. By using the results of analysis of the
DHIS data, the items for resource reallocation and budgeting have been identified in 87 DHOs
The failure of district authorities to allocate sufficient budget for the implementation of DHIS project
decreased the coverage of districts with DHIS. DHIS roll-out was also impeded by devolution related
processes (a lack of an organization at the federal level responsible for DHIS).
The revised system (DHIS), unlike the previous system, gathers and collates information from
secondary hospitals (tehsil and district hospitals) and some other important health care levels. This is
in addition to the data collected from nearly 1300 first-level care facilities. However, the assessment
found that “compliance rates of DHIS monthly report from public primary and secondary level
medical facilities to DHOs were kept more than 90% at the last 6 months of the project in 39 districts
(39 %) out of 100 target districts”.
A parallel community based information system has also been developed in 1994, which is functioning
under the National Program for Family Planning and Primary Health Care (NPFP&PHC). In addition
there are several other information systems specifically geared to the needs of vertical programs such
as EPI, TB, AIDS, Malaria etc., which are not fully integrated into HMIS. However, the software for
NPFP&PHC is based on the same parameters that of HMIS software19. National Integrated Report
200820 provides an example of using data from separate health management information systems to
quantify different aspects of health care system performance in Pakistan.
Health management information systems in Pakistan suffer from fragmentation and waste of
resources due to the duplication of efforts via parallel health information systems. Quality of primary
data is another concern undermining the reliability of reported statistics.
In addition to routine information flows in healthcare, Pakistan Demographic and Health surveys
conducted periodically by the Government of Pakistan (using a standard data collection methodology)
provide valuable insight in health status of population and delivery of medical services.
Pakistan Logistics Management Information System (LMIS) developed by USAID Deliver Project to
address the challenges of health commodities distribution Pakistan provides a modern and unified
platform to manage commodity supplies in three areas: vaccines (vLMIS), contraceptives (cLMIS) and
TB (TB-DMIS). vLMIS is discussed in detail in the corresponding section below (see 2.2.4 “Vaccine,
Cold Chain and Logistics” on page 42).
19 National Health Management Information System (HMIS) (Pakistan) 20 National Health Information System, Government of Pakistan
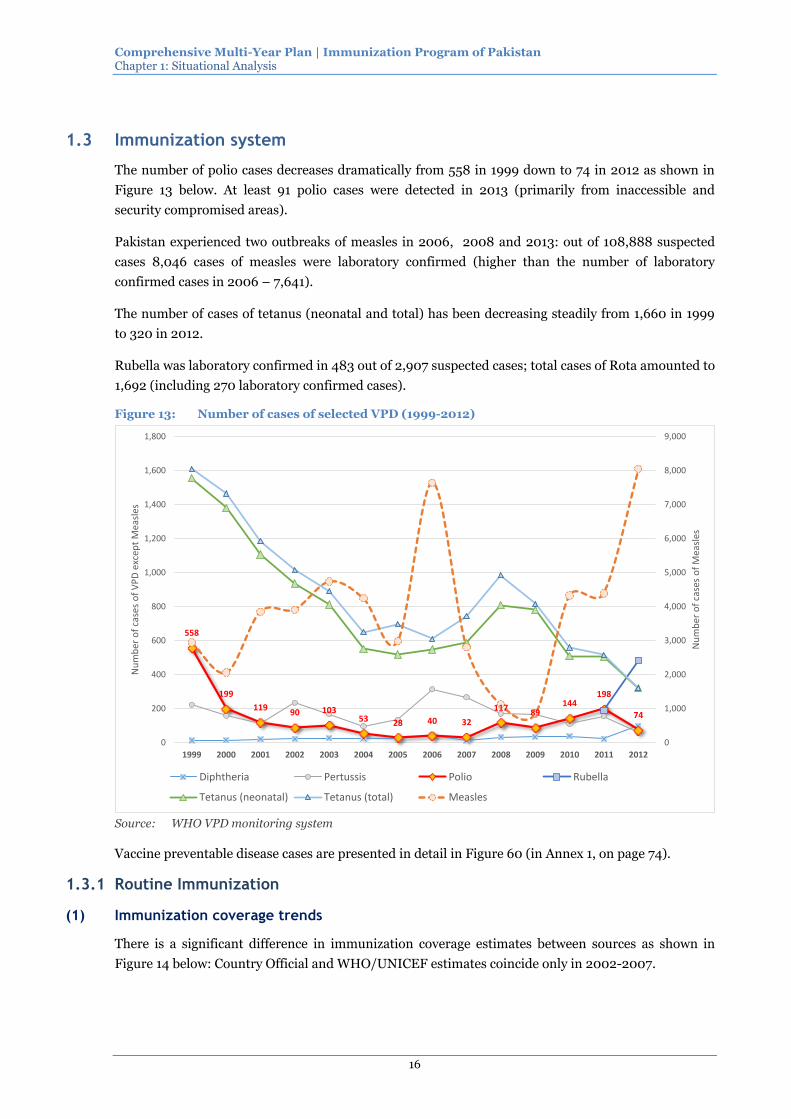
Comprehensive Multi-Year Plan | Immunization Program of Pakistan Chapter 1: Situational Analysis
16
1.3 Immunization system
The number of polio cases decreases dramatically from 558 in 1999 down to 74 in 2012 as shown in
Figure 13 below. At least 91 polio cases were detected in 2013 (primarily from inaccessible and
security compromised areas).
Pakistan experienced two outbreaks of measles in 2006, 2008 and 2013: out of 108,888 suspected
cases 8,046 cases of measles were laboratory confirmed (higher than the number of laboratory
confirmed cases in 2006 – 7,641).
The number of cases of tetanus (neonatal and total) has been decreasing steadily from 1,660 in 1999
to 320 in 2012.
Rubella was laboratory confirmed in 483 out of 2,907 suspected cases; total cases of Rota amounted to
1,692 (including 270 laboratory confirmed cases).
Figure 13: Number of cases of selected VPD (1999-2012)
558
199
11990 103
53 28 40 32
11789
144198
74
0
1,000
2,000
3,000
4,000
5,000
6,000
7,000
8,000
9,000
0
200
400
600
800
1,000
1,200
1,400
1,600
1,800
1999 2000 2001 2002 2003 2004 2005 2006 2007 2008 2009 2010 2011 2012
Nu
mb
er o
f ca
ses
of
Mea
sles
Nu
mb
er o
f ca
ses
of
VP
D e
xcep
t M
easl
es
Diphtheria Pertussis Polio Rubella
Tetanus (neonatal) Tetanus (total) Measles
Source: WHO VPD monitoring system
Vaccine preventable disease cases are presented in detail in Figure 60 (in Annex 1, on page 74).
1.3.1 Routine Immunization
(1) Immunization coverage trends
There is a significant difference in immunization coverage estimates between sources as shown in
Figure 14 below: Country Official and WHO/UNICEF estimates coincide only in 2002-2007.

Comprehensive Multi-Year Plan | Immunization Program of Pakistan Chapter 1: Situational Analysis
17
DTP3 coverage has been increasing in the last decade and reached in 2012 the level of 89% according
to the country official estimates (against WHO/UNICEF estimate of 81% and PDHS finding of 69%,
see details in Figure 61 on page 74).
Figure 14: Coverage estimates (in %) by years and sources, Pakistan
40
50
60
70
80
90
100
1999 2000 2001 2002 2003 2004 2005 2006 2007 2008 2009 2010 2011 2012
DTP3 - Survey (PDHS) FIC - Survey (PDHS) DTP3 - Country Official Estimates
DTP3 - JRF Administrative coverage DTP3 - WHO/UNICEF Estimates
Administrative (reported) coverage
Official coverage estimates provided by provinces are summarized in Figure 15 below:
Figure 15: Situational Analysis – routine immunization based on official estimates of provinces by years21
Indicators 2010 2011 2012
Official Coverage Estimates
DTP1 97% 97% 89%
DTP3 88% 87% 79%
Measles 1 82% 87% 76%
Measles 2 60% 63% 24%
OPV0 68% 65% 68%
% Fully Immunized Child (range by provinces) 46% – 94% 43% – 98% 16% – 95%
Access and demand
% Drop Out DTP1 - DTP3 8% 10% 10%
% Drop Out DTP1 - Measles (1st dose) 14% 10% 14%
% Drop out Measles 1st and 2nd dose 23% 23% 51%
Immunization Equity
Number and proportion of districts with DTP3 coverage > 80% 65 (45%) 78 (53%) 46 (32%) Source: Provincial cMYPs
21 Measles 2nd dose coverage in 2012 does not include Punjab

Comprehensive Multi-Year Plan | Immunization Program of Pakistan Chapter 1: Situational Analysis
18
Survey coverage
The Government of Pakistan carries out periodically two population based surveys: Pakistan Bureau
of Statistics runs Pakistan Social and Living Standard Measurement Survey (PSLM) every year and
National Institute of Population Studies (NISP) conducted 3 Pakistan Demographic and Health
Surveys (PDHS 1990-91, 2006-07 and 2012-13). Immunization related findings of these surveys are
presented and discussed separately because methodological differences between PSLM and PDHS.
According to PSLM, the DTP3 coverage remained above 80% if record and recalled method was used
for data collection, however it has not exceeded 60% if data was collected based on record as shown in
Figure 16 below:
Figure 16: Immunizaiton coverage trends: FIC and DTP3 by years and recall method, Pakistan
58
83
40
50
60
70
80
90
100
2004-05 2005-06 2006-07 2007-08 2008-09 2010-11 2011-12
FIC - Based on record
FIC - Based on recordand recall
DTP3 - Based onrecord
DTP3 - Based onrecord and recall
Source: PSLM reports, Pakistan Bureau of Statistics
Proportion of fully immunized child (FIC) based on the data collected via record and recall methods
varied significantly by provinces in the last decade as shown in Figure 17 below: immunization has
improved significantly in Punjab and remained at the high level in AJK while it remained below 60%
in Balochistan.

Comprehensive Multi-Year Plan | Immunization Program of Pakistan Chapter 1: Situational Analysis
19
Figure 17: Proportion of FIC by entities and years, based on records and recall (PSLM)
20
30
40
50
60
70
80
90
100
1 9 9 9 - 9 1 2 0 0 1 - 0 2 2 0 0 3 - 0 4 2 0 0 4 - 0 5 2 0 0 5 - 0 6 2 0 0 6 - 0 7 2 0 0 7 - 0 8 2 0 0 8 - 0 9 2 0 1 0 - 1 1 2 0 1 1 - 1 2
Pakistan
Punjab
Sindh
KP
Balochistan
AJK
GB
FATA
Source: Planning Commission, Government of Pakistan. “MDGs Report 2013”.
Coverage of children (by 12 months of age) was 32.7% for DTP3, 35.5% for measles and 32.6% for
OPV3 in 1990-1991 (PDHS 1990-1991). The recent survey (PDHS 2012-13) revealed significant
improvement: DTP3 – 65.2%, Measles – 61.4% and OPV3 – 85.3% (see details in Figure 49 on page
67).
Figure 18: Fully immunized child (0-11 months) by selected provinces and surveys
53
37
47
35
47
65
37
60
24
56
66
29
53
16
54
0
10
20
30
40
50
60
70
Punjab Sindh KP Balochistan Pakistan
Fully
imu
niz
ed c
ove
rge
in %
PDHS 2006-2007[1] PSLM 2011-12 PDHS 2012-2013
Source: Government of Pakistan (PDHS, PSLM Reports)
Comparison of the proportion of FIC between PDHS 2006-07 and PDHS 2012-13 by provinces (see
Figure 18 above) shows the improvement at the national level from 47% up to 54%. The observed
improvement was achieved at the cost of Punjab (53% and 66% respectively) and KP (47% and 53%
respectively) offset by the deterioration of coverage in Sindh (from 37% to 29%) and Balochistan
(from 35% to 16%) confirmed by PLSM results conducted a year earlier (based on records).

Comprehensive Multi-Year Plan | Immunization Program of Pakistan Chapter 1: Situational Analysis
20
(2) Inequalities in immunization coverage
Comparison of immunization outcomes by provinces, residence types, gender, years and data
collection methods are presented in detail in Figure 54 (on page 69) and Figure 49 (on page 67).
Figure 19: Fully immunized child by gender and provinces and recall methods, PLSM 2011-12
0
10
20
30
40
50
60
70
Punjab Sindh KP Balochistan Pakistan
Based on record
Male Female
0
10
20
30
40
50
60
70
80
90
100
Punjab Sindh KP Balochistan Pakistan
Based on record and recall
Male Female
Gender inequality pattern changes by provinces and data collection methods as shown in Figure 19
above: record based survey (PSLM 2011-12) revealed that the proportion of FIC was higher among
girls in KP (63% vs. 56%), while the opposite was observed when record and recall method was used
for data collection (82% vs. 77%). The proportion of FIC was higher among girls in KP in 2010-11 and
2007-08 when coverage was measured based on record. FIC dominated among boys in Sindh and
Balochistan, and was slightly higher in Punjab in case of record based data collection, however when
record and recall based data is compares this difference become negligible in Sindh, more prominent
in Punjab and remains almost the same in Balochistan.
Figure 20: FIC (based on record) - inequalities by wealth, residence and years (PSLM)
PSLM 2007-08
Male Female All Male Female All Male Female All
1st Quintile 48 39 43 40 38 39 41 38 40
5th Quintile 72 86 78 60 65 62 65 75 70
Difference 24 47 35 20 27 23 24 37 30
PSLM 2011-12
Male Female All Male Female All Male Female All
1st Quintile 61 40 50 40 38 39 43 39 41
5th Quintile 84 85 85 76 82 78 80 84 82
Difference 23 45 35 36 44 39 37 45 41
Urban Rural National
Urban Rural National
The gap in FIC proportion between the lowest and highest income quintiles widened from 30 per cent
points in 2007-08 to 41 per cent points in 2011-12. The widest gap between the poorest and richest
was observed among females (45 vs. 37 among males in 2011-12).

Comprehensive Multi-Year Plan | Immunization Program of Pakistan Chapter 1: Situational Analysis
21
PDHS 2012-13 revealed the following differences in coverage between the lowest and highest wealth
quintiles (see Figure 49 on page 67): FIC – 43 per cent points, BCG – 14.6 per cent points, DTP3 –
47.1 per cent points, OPV3 – 13 per cent points, measles – 47.7 per cent points.
The share of districts with DTP3 coverage above 80% has been decreasing from 45% in 2010 down to
32% in 2012 (as shown in Figure 15 on page 17).
1.3.2 Accelerated Disease Control Initiatives
“More than 40 health workers and police personnel providing security to teams administering anti-
polio drops to children have been killed in incidents of violence in the country since December 2012,
according to a tally by news agency AFP”22
Figure 21: Situational Analysis - by accelerated disease control initiatives
Indicators 2010 2011 2012
Polio
OPV3 coverage 88% 88% 89%
Number of rounds and sub-national rounds per year 77 77 78
Coverage Range (by provinces) 90% - 100% 92% - 99% 93% - 98%
MNT
TT2+ coverage 58% 60% 65%
Number and proportion of districts reporting >1 case of neonatal tetanus per 1000 live birth 5 (3%) 4(3%) 13 (9%)
Was there an SIA? (Y/N) Yes No Yes
Neonatal deaths reported and investigated 0 0 42
Delivery at Facility Rate 7% 13% 26%
Measles & Rubella
Measles / MR vaccination coverage (1st dose) 82% 87% 76%
Measles / MR vaccination coverage (2nd dose) 60% 63%
Number of lab confirmed measles/rubella outbreaks 1,398 1,618 6,542
Geographic extent National Immunization Day
Age Group (in months) 0-60 0-60 0-60
Coverage range (by provinces) 92% - 103% 94% - 105% 97% - 106%
Total Measles Cases (Lab/Clinical/epidemiological) 4,134 4,890 23,943
Total Rubella Cases (Lab/Clinical/epidemiological) 83 58 117
Source: Provincial cMYPs
22 http://www.dawn.com/news/1087643/two-polio-workers-among-six-kidnapped-from-fr-tank
Figure 22: Number of Polio SIA round by provinces and years
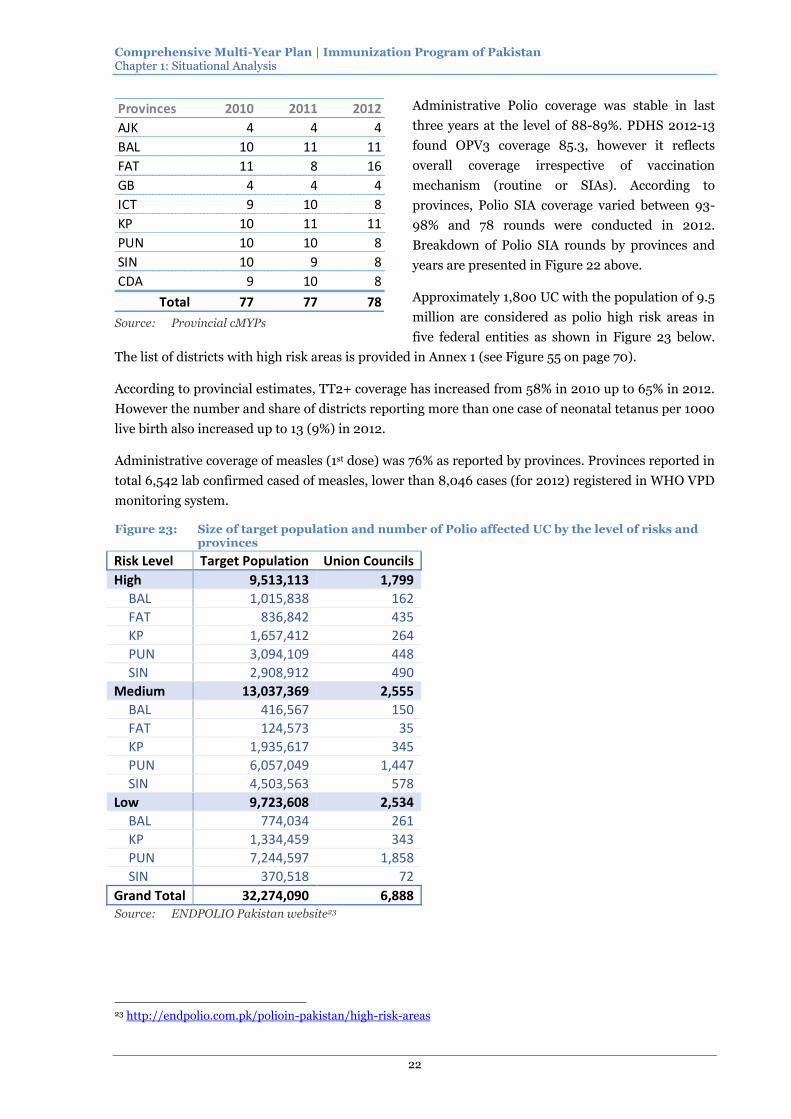
Comprehensive Multi-Year Plan | Immunization Program of Pakistan Chapter 1: Situational Analysis
22
Administrative Polio coverage was stable in last
three years at the level of 88-89%. PDHS 2012-13
found OPV3 coverage 85.3, however it reflects
overall coverage irrespective of vaccination
mechanism (routine or SIAs). According to
provinces, Polio SIA coverage varied between 93-
98% and 78 rounds were conducted in 2012.
Breakdown of Polio SIA rounds by provinces and
years are presented in Figure 22 above.
Approximately 1,800 UC with the population of 9.5
million are considered as polio high risk areas in
five federal entities as shown in Figure 23 below.
The list of districts with high risk areas is provided in Annex 1 (see Figure 55 on page 70).
According to provincial estimates, TT2+ coverage has increased from 58% in 2010 up to 65% in 2012.
However the number and share of districts reporting more than one case of neonatal tetanus per 1000
live birth also increased up to 13 (9%) in 2012.
Administrative coverage of measles (1st dose) was 76% as reported by provinces. Provinces reported in
total 6,542 lab confirmed cased of measles, lower than 8,046 cases (for 2012) registered in WHO VPD
monitoring system.
Figure 23: Size of target population and number of Polio affected UC by the level of risks and provinces
Risk Level Target Population Union Councils
High 9,513,113 1,799
BAL 1,015,838 162
FAT 836,842 435
KP 1,657,412 264
PUN 3,094,109 448
SIN 2,908,912 490
Medium 13,037,369 2,555
BAL 416,567 150
FAT 124,573 35
KP 1,935,617 345
PUN 6,057,049 1,447
SIN 4,503,563 578
Low 9,723,608 2,534
BAL 774,034 261
KP 1,334,459 343
PUN 7,244,597 1,858
SIN 370,518 72
Grand Total 32,274,090 6,888 Source: ENDPOLIO Pakistan website23
23 http://endpolio.com.pk/polioin-pakistan/high-risk-areas
Provinces 2010 2011 2012
AJK 4 4 4
BAL 10 11 11
FAT 11 8 16
GB 4 4 4
ICT 9 10 8
KP 10 11 11
PUN 10 10 8
SIN 10 9 8
CDA 9 10 8
Total 77 77 78 Source: Provincial cMYPs

Comprehensive Multi-Year Plan | Immunization Program of Pakistan Chapter 1: Situational Analysis
23
1.3.3 Analysis of Immunization system performance
The immunization system, once being a vertical public health program managed from Islamabad,
today represents a complex set of federal and provincial programs due to the recent devolution of
healthcare functions. Therefore, the analysis of the immunization performance in Pakistan takes into
account the distribution of competences between federal and provincial immunization programs as
described in Figure 24 (below). Most of EPI implementation functions has moved to provincial EPI
entities and their performance is analyzed in details in respective provincial cMYPs. The present
analysis of immunization system performance focuses on the federal level functions while highlighting
some key performance issues at sub-national levels.
Figure 24: Competencies by the immunization system components
Immunization system components
Federal Provincial
Program Management Policy setting (NITAG)
Coordination (NICC)
Representation of the country in front of international agencies
Oversight of EPI implementation (NSC EPI)
Regulation of supply of medicines and commodities (NRA)
Provide policy inputs on provincial priorities (to NITAG)
Policy adjustments (PITAG) – optional
Coordination (PICC)
Implementation – EPI Cells
Immunization service delivery
Setting national standards for service delivery (as integral part of policy making)
Expansion and maintenance of service delivery infrastructure
Oversight of adherence to service delivery standards
Human resource management
Setting accreditation rules and standards
Human resource planning
Mobilization of HR
Capacity building of HR
Cost and Financing Financing of co-financing commitments (till June 2015)
Establishment of national mechanisms for fulfillment of co-financing commitments (after June 2014)
Financing vaccines and injection supplies for administrative areas
Financing of Federal level EPI activities
Mobilization of donor financings
Oversight of the implementation of provincial financial sustainability strategies
Financing of vaccines
Co-financing of GAVI NVS vaccines (after June 2015)
Development and implementation of financial sustainability strategies
Vaccine, cold chain and logistics
Procurement of vaccines and injection supplies
Procurement of cold chain
Establishment and maintenance of emergency vaccine stock
Supply and storage of vaccines and injection supplies
Implementation of effective vaccine management
Implementation of vaccine safety policies
Surveillance and reporting
Coordination ,Information collection and sharing
Provision of guidelines and SOPs
Consolidation of national reports
Implementation of surveillance and data collection policies
Generation of provincial reports
Demand generation, communication and advocacy
Organizing/conducting national KAP surveys (with partners)
Development and endorsement of
Implementation of communication strategies (including local context specific
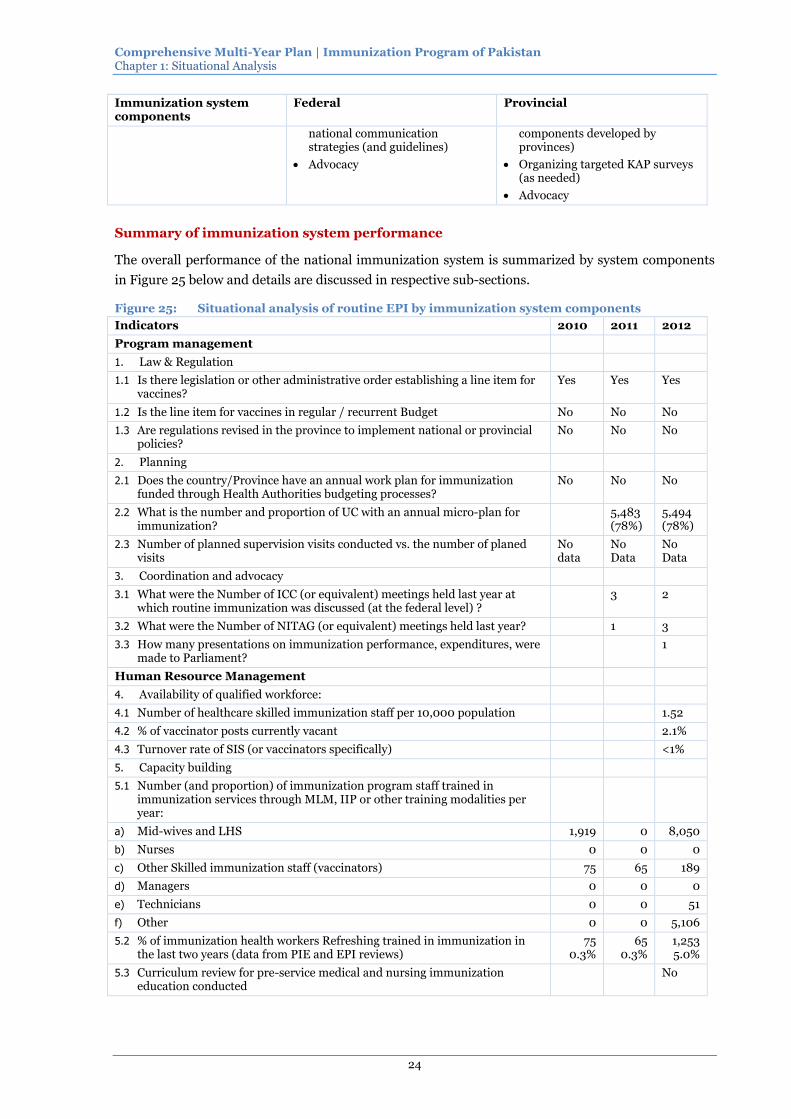
Comprehensive Multi-Year Plan | Immunization Program of Pakistan Chapter 1: Situational Analysis
24
Immunization system components
Federal Provincial
national communication strategies (and guidelines)
Advocacy
components developed by provinces)
Organizing targeted KAP surveys (as needed)
Advocacy
Summary of immunization system performance
The overall performance of the national immunization system is summarized by system components
in Figure 25 below and details are discussed in respective sub-sections.
Figure 25: Situational analysis of routine EPI by immunization system components
Indicators 2010 2011 2012
Program management
1. Law & Regulation
1.1 Is there legislation or other administrative order establishing a line item for vaccines?
Yes Yes Yes
1.2 Is the line item for vaccines in regular / recurrent Budget No No No
1.3 Are regulations revised in the province to implement national or provincial policies?
No No No
2. Planning
2.1 Does the country/Province have an annual work plan for immunization funded through Health Authorities budgeting processes?
No No No
2.2 What is the number and proportion of UC with an annual micro-plan for immunization?
5,483 (78%)
5,494 (78%)
2.3 Number of planned supervision visits conducted vs. the number of planed visits
No data
No Data
No Data
3. Coordination and advocacy
3.1 What were the Number of ICC (or equivalent) meetings held last year at which routine immunization was discussed (at the federal level) ?
3 2
3.2 What were the Number of NITAG (or equivalent) meetings held last year? 1 3
3.3 How many presentations on immunization performance, expenditures, were made to Parliament?
1
Human Resource Management
4. Availability of qualified workforce:
4.1 Number of healthcare skilled immunization staff per 10,000 population 1.52
4.2 % of vaccinator posts currently vacant 2.1%
4.3 Turnover rate of SIS (or vaccinators specifically) <1%
5. Capacity building
5.1 Number (and proportion) of immunization program staff trained in immunization services through MLM, IIP or other training modalities per year:
a) Mid-wives and LHS 1,919 0 8,050
b) Nurses 0 0 0
c) Other Skilled immunization staff (vaccinators) 75 65 189
d) Managers 0 0 0
e) Technicians 0 0 51
f) Other 0 0 5,106
5.2 % of immunization health workers Refreshing trained in immunization in the last two years (data from PIE and EPI reviews)
75 0.3%
65 0.3%
1,253 5.0%
5.3 Curriculum review for pre-service medical and nursing immunization education conducted
No

Comprehensive Multi-Year Plan | Immunization Program of Pakistan Chapter 1: Situational Analysis
25
Indicators 2010 2011 2012
Costing and financing
6. Financial sustainability
6.1 What percentage of total routine vaccine spending was financed using government funds? (including loans and excluding external public financing)
6.2 What proportion of the line item in the provincial budget for immunization was actually funded (actually allocated / planned)?
6.3 What % of immunization resources are being met by the domestic health budget (as identified in the annual budget plan)
6.4 Government expenditures on routine immunization per surviving infant
6.5 Are provincial immunization budgets and expenditures monitored and reported at national level?
Vaccine supply, quality and logistics
7. Transport / Mobility
7.1 Percentage of districts with a sufficient number of supervisory/EPI field activity vehicles /motorbikes/bicycles (based on their need) in working condition
51% (75)
7.2 Number of UC with vaccinators using transportation means for outreach 5,060
8. Vaccine supply
8.1 Was there a stock-out of any antigen at provincial or district level during 2012?
Yes
8.2 If yes, specify duration in months 1-2
8.3 If yes, specify which antigen(s) OPV
9. Cold chain / logistics
9.1 Number of UC with adequate numbers of appropriate and functional cold chain equipment vs. Number of UC with functioning health facilities
5,684
a) With ILR 4,892
b) With any kind of refrigerators 792
9.2 Availability of a cold chain replacement plan No
10. Waste disposal
10.1 Availability of a waste management policy (guidelines/SOP) Yes
10.2 Number of districts implementing waste management policy All
Immunization services
11. Geographical access:
11.1 Number of population per each EPI fixed sites 25,294
11.2 Proportion of area covered by immunization service to the total populated area
55%-91%
11.3 Proportion of UC not having EPI centers 13%
11.4 Proportion of UC not having Skilled Immunization Staff (SIS) 7%
12. Efficiency of service delivery
12.1 Share of immunization services delivered by EPI centers 20%-100%
12.2 Average time EPI Centers provide immunization service per day 6
Surveillance and Reporting
13. Routine Surveillance
13.1 Percentage of integrated VPD surveillance reports received at provincial level from districts compared to number of reports expected:
a) Timeliness 30-64%
b) Completeness 31-100%
13.2 AFP detection rate/100,000 population under 15 year of age 2.1-7.0
13.3 % suspected measles cases for which a laboratory test was conducted 11%-

Comprehensive Multi-Year Plan | Immunization Program of Pakistan Chapter 1: Situational Analysis
26
Indicators 2010 2011 2012
34%
13.4 Number of neonatal deaths for which a follow up investigation was conducted
0-7
13.5 Sentinel Surveillance for Rotavirus established PUN and SIN
13.6 Sentinel Surveillance for meningitis (Hib/PCV) established SIN
13.7 % of suspected meningitis cases tested for Hib/pneumococcal disease according to standard protocol
0
14. Coverage monitoring
14.1 % gap in match between DTP3 survey coverage and officially reported figures
1%-54%
15. Immunization safety
15.1 % of districts (or UC?) that have been supplied with adequate (equal or more) number of AD syringes for all routine immunizations
100%
16. Adverse Events
16.1 National AEFI System is Active with a designated national/provincial committee
No
16.2 Number of serious AEFI cases reported and investigated No
Demand Generation and Communization
17. Communization strategy
17.1 Availability of a routine immunization communication plan No No No
17.2 KAP Study conducted in relation to immunization No No No
18. Evidence based communication
18.1 % of government funds on demand generation / communication: EPI and
PEI
0% 0% 0%
a) EPI (without PEI) 0% 0% 0%
b) PEI 0% 0% 0%
Source: Provincial cMYPs

Comprehensive Multi-Year Plan | Immunization Program of Pakistan Chapter 1: Situational Analysis
27
(1) Program Management
Vaccine related line item was only in development budget (not in regular one) at the Federal level and
has never budgeted by provinces before the devolution as far as it was traditionally financed by the
federal authorities as one of vertical national public health programs. As of now, there is no legislative
or other administrative order establishing a line
item of vaccine except KP. No province specific
regulations or annual plans existed to implement
immunization related national policies before the
devolution.
A national immunization policy document was
finalized awaiting official approval.
Only 78% UC’s in Pakistan had micro-plans for
immunization in 2012 (that is 5,494 out of 7,047
UCs). Even if all 3,520 UCs in Punjab had micro-
plans they were not implemented properly.
Distribution of UCs with micro-plans for
immunization by provinces and years is shown in
Figure 26 above.
There was no reliable data on the number of planned supervision visits conducted in provinces (that
indicates itself on the capacity problems at the provincial level).
NICC met three times in 2011 and two times in 2012 and 2013. NITAG met once in 2011, three times
in 2012 and two times in 2013.
Governance and administration of the national immunization program at the Federal level is carried
by the following entities (see):
National Interagency Coordination Committee (NICC)
National Steering Committee for EPI (NSC EPI)
National Immunization Technical Advisory Group (NITAG)
Impact Assessment Committee
Project Implementation Coordination Committee (PICC)
Federal EPI Cell
Purpose, composition and operation of some of these entities is described in Annex 4 (on page 88).
There is some overlap of functions and responsibilities between the governance entities (except
NITAG).
Establishment of an inter-provincial coordination committee has been envisaged since the devolution
in order to formalize an interface of interaction between provincial and federal EPI teams. The county
considers the feasibility of integration of inter-provincial coordination function into existing entities
(e.g. NICC) instead of establishing one more stand-alone body (see Figure 65 on page 76).
National efforts for polio eradication under NEAP are governed and implemented by two entities:
The Prime Minister’s National Task Force
Prime Minister’s Polio Monitoring and Coordination Cell
Figure 26: Number and proportion of UC with annual micro-plans for immunization
Provinces 2011 2012
AJK 0 (0%) 0 (0%)
BAL 0 (0%) 0 (0%)
CDA 0 (0%) 0 (0%)
FAT 0 (0%) 0 (0%)
GB 33 (30%) 44 (40%)
ICT 0 (0%) 0 (0%)
KP 1,040 (100%) 1,040 (100%)
PUN 3,520 (100%) 3,520 (100%)
SIN 890 (79%) 890 (79%)
Pakistan 5,483 (78%) 5,494 (78%) Source: Provincial cMYPs
Comprehensive Multi-Year Plan | Immunization Program of Pakistan Chapter 1: Situational Analysis
28
The National Steering Committee for Polio
Provincial Vaccine Management Committees
Provincial Task Force / Steering Committees for Polio
The National Immunization Program Manager serves as National Coordinator of PEI, however the
National Technical Coordinator is subordinated administratively to the National Task Force/PEI
Team (see Figure 66 on page 77). Administrative or functional interaction between federal and
provincial levels differ for EPI and PEI:
Governance of non-polio related immunization programs gets fully decentralized:
Provincial EPI teams exercise a high level of autonomy and can transfer voluntarily some
provincial tasks to the Federal EPI cell based on arguments of efficiency and effectiveness (e.g.
pooled procurement of vaccines and injection supplies);
the Federal EPI cell cannot give policy directives to provincial EPI teams and can exercise its
authority through “soft methods” such as regulation (laying down policy rules and supervising
adherence provinces to them) and coordination (exchange of opinions, experience sharing
and streamlining communication with traditional EPI partners)
Provincial EPI teams have no direct administrative power on EPI related technical or medical
staff at sub-provincial levels: EPI coordinators wherever available subordinate to DHOs and
vaccinators (as well as other SIS) are accountable to respective healthcare/facility
administrators
Governance and administration of PEI remains relatively centralized:
Despite intensive involvement of sub-national level stakeholders in the organization of PEI
efforts on the ground (through provincial task teams or steering committees and
DPEC/UPEC), managerial and technical personnel at the ground level are directly
accountable to the PEI federal team and are paid from the federal budget of the NEAP (using
DDM)
Operational and financial planning (budgeting) of NEAP implementation is done at the
federal level, although district health systems are responsible for the implementation and
existing EPI provincial infrastructure support the program implementation
The Federal EPI was established in 1978 and is still based in NIH premises having offices in different
blocks and cold rooms in 11 places which were difficult for the programme to manage on both sides. In
order to address these problems, a plan for constructing office accommodation and warehouses at a
cost of Rs. 397.196 million was incorporated in the previous PC1. Out of which, Rs. 372.000 million
has been utilized by the Pakistan Works Department in constructing Office Blocks and Warehouses.
(2) Immunization Services Delivery
Immunization services are delivered by 6,979 EPI Centers and average population served by an EPI
Center amounts to 25,300 (see details in Figure 63 on page 75).
Approximately 915 UCs throughout the country did not have EPI Centers (or 13% of all UCs) and 489
UCs are not staffed with SIS (or 7% of all UCs).

Comprehensive Multi-Year Plan | Immunization Program of Pakistan Chapter 1: Situational Analysis
29
Immunization services are delivered via fixed cites and outreach/mobile approaches: contribution of
fixed delivery sites to the immunization service delivery varied between 20%-25% (in Punjab and
Balochistan) to almost 100% in Sindh. No data was available for CDA, GB and ICT.
EPI Centers provided immunization services 6 hours per day in average in all provinces (except KP
where average time amounted to 8 hours per day).
(3) Human Resource Management
Almost all existing vaccinator posts are filled: only 2.1% of posts were vacant in 2012 (20% in CDA,
12% in ICT and 9% in Punjab); staff turnover is negligible.
In average, the ratio of vaccinators and all SIS per 10,000 population amounted to 0.58 and 1.52
respectively in 2012 (see Figure 56 on page 71). The highest ratio was observed in Balochistan (1.46
and 2.34 respectively) while the lowest – in CDA (0.13 and 0.58 respectively).
According to provincial cMYPs, existing vaccinator posts constituted 72% of their requirement (as
shown in Figure 8 on page 12). However, more detailed analysis of the workload of skilled
immunization staff (SIS) expressed in full time equivalents (FTE) by staff categories and profile of
workload (PEI and non-polio related EPI activities) revealed 45% shortage of SIS for EPI as shown in
Figure 27 below:
Figure 27: Availability and workload of skilled immunization staff (2012)
Accredited EPI Service Providers
Posts occupied
(in FTE)
Share of Total Operation Time
allocated to Immunization
Share of immunization time spent on
PEI
FTE spent on
PEI
Available (FTE) for EPI
Total FTE spent on immune-
zation
Vaccinators 10,159 100.00% 33.30% 3,383 6,776 10,159
Nurses24 7,413 0.00% 0 0 0
Dispensers 9,877 2.64% 55.94% 146 115 261
Lady Health Visitors (LHVs) 7,660 13.79% 16.10% 170 886 1,056
Medical Technicians (MT) 8,639 12.68% 59.00% 646 449 1,095
Female Medical Technicians 281 1.78% 40.00% 2 3 5
Mid-wives 6,903 8.49% 0.00% 0 586 586
Lady Health Workers (LHWs) 80,345 15.04% 48.23% 5,828 6,255 12,083
Other 10,033 15.28% 19.63% 301 1,232 1,533
10,476 16,302 26,778 39% 61% 100%
Total FTE available for EPI (except PEI) 16,302 Total FTE Needed for EPI (except PEI) 29,594 Deficit 13,292 45%
Vaccinators constituted more than 90% of SIS in AJK, Balochistan, FATA, GB and ICT (as shown
Figure 57 on page 71). LHWs prevailed in KP (1,200 vs. 576 vaccinators) and played significant role in
Punjab Sindh (45% and 30% of the immunization workforce respectively).
ICT, GB and AJK experience the highest shortage of SIS (60% and above) as shown in Figure 28
below:
24 The number of posts occupied (in FTE) for nurses and LHWs differ from previous estimates of healthcare
service delivery capacity (in Figure 9); these figures have been used for the calculation of the HR gap

Comprehensive Multi-Year Plan | Immunization Program of Pakistan Chapter 1: Situational Analysis
30
Figure 28: Staffing gap (SIS) by provinces
0%
10%
20%
30%
40%
50%
60%
70%
AJK BAL FAT GB ICT CDA KP PUN SIN Pakistan
Source: Provincial cMYPs
In average, approximately 39% of time of the available SIS (and 33% of the available vaccinators) is
spent on PEI related activities nationwide (as shown in Figure 58 on page 72): occupation of SIS by
PEI related duties was the highest in KP and Balochistan (63% and 59%) and the lowest in Sindh
(19%) among polio affected provinces.
Federal EPI cell staffing table includes 59 types of posts: only 53 positions are filled out of 146
sanctioned positions (FTE) as shown in Figure 95 (on page 127). Most of provincial EPI cells have a
limited number of managerial and technical staff.
(4) Costing and Financing
See section 4 “Immunization Program Costing and Financing” (on page 55).
(5) Vaccine, Cold Chain and Logistics
75 out of 147 districts (51%) had sufficient number of supervisory or EPI field activity transport in
working conditions in 2012, while vaccinators use transportation means for outreach in 5,060 (72%)
of UC (see details by provinces in Figure 62 on page 75). The number of UC with adequate number of
appropriate and functional cold chain equipment amounted to 5,684 (or 81% of all UCs), out of which
ILR was available in 4,892 UCs.
Most of provinces experienced 1 or 2 month stock out of Polio in 2012. Waste management policies
were available and implemented in almost all districts.
Vaccines and injection supplies shipped to Pakistan are delivered to a Federal EPI warehouse. The are
27 walk-in cold rooms in the warehouse.
Federal EPI cell contracts transportation services to deliver a) all commodities after custom clearance
to the warehouse, and b) polio vaccines for Polio SIA to selected districts/provinces. Transportation of
the rest of vaccines and injection supplies from the federal warehouse is managed by provinces.
Effective vaccine and stock management
With WHO assistance the federal EPI has made an inventory and computerized all its vaccine
and logistics management system in the federal store using standard software.
In absence of an efficient vaccine forecasting system certain vaccines goes stock-out on some
occasions and sometimes excess vaccine comes under threat of expiry.

Comprehensive Multi-Year Plan | Immunization Program of Pakistan Chapter 1: Situational Analysis
31
No proper maintenance service available for the expensive cold chain equipment.
The system of repair and maintenance of cold chain is ad-hoc.
EPI doesn’t have its own mechanical workshop at any level.
Similarly the programme is lacking or inadequate availability of skilled manpower to repair
these costly equipments when goes out of service.
Transport for EPI field supervision activities is still lacking in parts of the country
Supervision of district and health posts in cold chain management is still unsatisfactory and
there are no guidelines or written operational procedure
Cold chain inventory
National Steering Committee endorsed building a national cold chain inventory data based on
recommendations of an international mission on vaccine management in 2012. upon request of
government of Pakistan and in response to mission’s recommendation the Vaccine Management team
Pakistan Country Office (PCO), UNICEF, under the overall guidance of Polio Team Lead, took
initiative to develop a computer based cold chain inventory dataset for the country.
This Cold chain inventory system is developed by utilizing Cold Chain Equipment Manager (CCEM)25.
Data for cold chain inventory was gathered from 2076 immunization centers and vaccines stored and
was entered into CCEM 2.0 Pakistan version). It is planned that results shown by the CCEM Pakistan
database will be shared with Government of Pakistan and all immunization partners in the country in
a separate meeting by the end of January 2014.
This cold chain database will be incorporated into Vaccine Logistic Management Information System
(vLMIS) as discussed below and will give a real time picture on the current status of cold chain
equipment in polio high-risk districts of Pakistan.
Vaccine Logistics Management Information System
Delivery project financed by USAID and implemented by John Snow, Incorporated has been
introducing an integrated logistics management information system for health commodities covering
areas of family planning, tuberculosis and immunization.
Vaccine logistics management information system (vLMIS) is expected to improve substantially
vaccine supply and stock management via:
Enabling EPI teams at all levels to assess real time data to ensure that vaccines and cold chain
equipment are always available in sufficient quantities at the service delivery points to meet and-
user needs;
Bringing down wastage of vaccines and cold chain equipment
Enabling policy/decision makers to take evidence based decisions with regard to forecasting,
quantification, financing and procurement planning.
25 Microsoft Access based software developed by PATH in collaboration with USAID, UNICEF & WHO for
strategic management, planning and forecasting cold chain equipment needs of the country

Comprehensive Multi-Year Plan | Immunization Program of Pakistan Chapter 1: Situational Analysis
32
vLMIS is expected to turn EPI/PEI logistics from Push to Pull system with a visibility across EPI and
Polio supply chain. Existing CCEM, VSSM and SDMS functions will be put together on one
Government’s platform (see http://lmis.gov.pk).
VLMIS software was developed and tested in November 2013 (Release 1). More functional versions of
the software (with 5 functional/user modules and SMS reporting capabilities) will be released in 2014.
The project identified 54 vLMIS priority districts in consultation with the government and partners
(see the list of districts in Annex 12 on page 122). The government together with WHO and Unicef
nominated 50 officials as Trainers that underwent 3 rounds of training of trainers (ToT) in 2013. In
addition, province specific rollout training plans have been developed for training of >900 federal,
provincial, district and UC levels officials (5 Provinces/FATA + 54 districts + 423 Lead UCs) on WMS
and Vaccine Data Entry in the 1st half of 2014. Orientation of 555 federal, provincial, district and UC
levels managers on vLMIS in 2014 is part of the plan. There is an intention to extend vLMIS coverage
to remaining 97 districts (in 2014-2015).
(6) Surveillance and Reporting
In Pakistan, AFP surveillance began in 1997, but was given focused attention in 2000:
National surveillance reporting started in Pakistan in 1995. Virological classification of cases has
been adopted in Pakistan since 2000. Since 1999, the rate of non-polio acute flaccid
paralysis below the age of 15 years has exceeded 2 per 100 000 with more than 80% adequate
collection of stool samples.
Supplementary surveillance was introduced in 2009 and samples are collected regularly from all
the big cities of the provinces: Punjab (Lahore, Rawalpindi, Multan), Sindh (Karachi), Baluchistan
(Quetta), Khyper Pakhtoun (Peshawar).
As confirmed by international reviews, Pakistan has a well-functioning and sensitive AFP surveillance
system at national, provincial, and district levels. The system has achieved and maintained all
indicators above the internationally agreed standards for certification since 2001.
AFP Surveillance is conducted through passive (Zero Reporting) and active (Active Surveillance)
mechanisms. The system operates as per defined standard operating procedures with set timelines
quality monitoring indicators. AFP detection rate varied from 1.96 to 7.5 by provinces in 2012 as
shown in Figure 29 below:
Figure 29: AFP detection rate/100,000 population under 15 year of age by provinces and years
2010 2011 2012
AJK 2.40 3.00 2.30
BAL 7.20 7.40 5.10
CDA 1.80 2.40
FAT 1.15 1.75 1.96
GB 4.40 5.50 4.40
ICT 6.30
KP 7.50
PUN 5.74 6.47 5.77

Comprehensive Multi-Year Plan | Immunization Program of Pakistan Chapter 1: Situational Analysis
33
The best available method to confirm the diagnosis of
poliomyelitis is the isolation and identification of
poliovirus from the stool. The World Health
Organization (WHO) has developed a global network of laboratories to provide this service in
collaboration with several other institutions. The virology laboratory at NIH Islamabad is the Regional
Reference Laboratory (RRL) for polio eradication and continues to demonstrate very high standards
of quality control and meeting the international targets for accuracy. The RRL will also play a key role
in certification of polio eradication by verifying the absence of wild poliovirus circulation.
EPI Pakistan with the assistance of WHO has also established sentinel sites at tertiary care hospitals
level to see the status of those diseases against them new vaccines will be included in the vaccination
schedule. Sentinel surveillance for Rotavirus operates in Punjab and Sindh (Karachi), and sentinel
Surveillance for meningitis (Hib/PCV) was established in Sindh.
The health management information system (HMIS) and or district health information system
(DHIS) still appears to provide less representative data on EPI-related diseases and indicators than
the routine EPI reporting system. Coordination between the two systems is still limited. Gap in match
between DTP3 survey coverage and officially reported figures varies between 1% to 54% across
provinces (see Figure 64 on page 75) and amounted to 30 per cent points in 2012 (89% vs. 69%) as
discussed in detail in section 1.3.1(1) “Immunization coverage trends” (on page 16).
National AEFI system is not active in provinces and no serious AEFI cases have been reported and
invesitaged.
Timeliness and completeness of integrated VPD surveillance reports received at provincial level from
districts varied across provinces from 30-64% and 31-100% respectively as shown in Figure 64 (on
page 75).
All districts have been supplied with adequate number of AD syringes for routine immunization.
(7) Demand Generation, Communication and Advocacy
A knowledge, attitude and practice (KAP) study on immunization related issues has not been
conducted nationwide or any province in recent years (2010-2013) and routine immunization
communication plans were not available in provinces.
Communications and social mobilization activities supported by UNICEF in Pakistan were focuses on
ensuring the development of locally appropriate activities to address challenges unique to high risk
areas in the WPV transmission zones of Balochistan, the North West Frontier and Sindh. District
communication officers were deployed in the high risk districts in 2007 to support the development of
appropriate strategies, including activities to address refusals, highly mobile populations and
accessibility in security compromised areas.
UNICEF conducted a sociological (KAP) study in Balochistan and FATA in 2007 showed high
awareness of polio diseases and vaccine availability throughout communities. Similar evidence on
other VPDs and vaccination is not available.
For communication and community engagement; UNICEF Country Office has already initiated the
process of converging Polio and EPI with the development of Integrated Advocacy, Social mobilization
and Communication Strategic plan for Routine immunization including Polio and new vaccines (PCV-
SIN 8.40 8.10 7.00
Source: Provincial cMYPs

Comprehensive Multi-Year Plan | Immunization Program of Pakistan Chapter 1: Situational Analysis
34
10). The strategic plan has behavior change communication strategy with clearly set behavioural
objectives, key messages around routine immunization including polio and target audience specified
at primary, secondary and tertiary level. Moreover, during the next six months, in the selected
districts, the Polio COMNet staff shall be oriented on the integration of messages around Polio and
routine immunization with the distribution of the pictorial, easy-to-use information, education, and
communication material which could be integrated into their existing toolkits.

Comprehensive Multi-Year Plan | Immunization Program of Pakistan Chapter 1: Situational Analysis
35
1.4 Summary – SWOT Strength Weaknesses
Federal
o Program management systems in place
o Functional and sufficient cold chain system
o National EPI policy prepared
o Effective procurement and supply system of vaccines and injection supplies
o Commitment of the Federal Government to finance vaccines (including co-financing) till July 2015
o Well-functioning and sensitive AFP surveillance system
o Effective cooperation with in-country partners and international agencies
Provincial
o Low turnover of vaccinators
o Stable supply of vaccines and injection supplies
o Cold chain inventory database for polio high-risk districts is available and informs decision-makers
o vLMIS has been introduced to priority districts
o Functional AFP surveillance (Sindh, Punjab, KP)
o Functional DHIS/VPD reporting systems (Balochistan, KP, Sindh, AJK)
Federal:
o Inefficient use of resources due to poor integration of PEI and routine immunization infrastructure and operation
o Inadequate staffing of the Federal EPI Cell
o Complex and inefficient governance (supervisory and coordination) arrangements
o AEFI policy is not implemented
Provincial
o Insufficient number of fixed EPI Centers
o Substantial shortage of skilled immunization staff for routine immunization
o Overburdened and demotivated EPI staff (Sindh, Punjab)
o UC micro plans not implemented (except Sindh and KP)
o Inadequate transport facility for vaccinators (except Punjab)
o Deficient or poor quality outreach services
o Insufficient number or outdated cold chain equipment
o Poor vaccine management
o Weak capacity for vaccine forecasting and procurement and financial management
o Understaffed Provincial EPI Cells and no dedicated EPI managers or technical EPI staff at sub-provincial levels
o Insufficient and unreliable funding of immunization
o Lack of community awareness of the importance and benefits of immunization
Opportunities Threats
Federal:
o Governments commitment to the attainment of the health related MDGs
Provincial:
o Strong support of development partners
o Availability of health field staff to be involved in immunization (except FATA)
o Public-private partnerships for service delivery, community mobilization and reporting (in Sindh, KP)
o Interest or involvement of political leadership in immunization (except Sindh, Punjab and KP)
Federal:
o Lack of federal entity in charge of development and operation of health management information system(s) nationwide
o Low and stagnant tax-to-GDP ratio, as the major impediment to a stable macro-economy
Provincial:
o Security, poor law and order issues (except Punjab)
o Natural disasters
o Illiteracy
o Poverty
o Political interference in staffing
o Social and cultural barriers (except Sindh and Punjab)

Comprehensive Multi-Year Plan | Immunization Program of Pakistan
36
2 Immunization objectives and strategies
2.1 Program objectives and milestones
Goal of the immunization program in Pakistan is to decrease VPD associated morbidity and mortality:
Measles: Reduction of measles morbidity and mortality by 50% compared to the 2012 level.
Polio: Interruption of transmission of indigenous wild Poliovirus by the end of 2015 and
certification of a Polio Free Pakistan by the end of 2018
Tetanus: Elimination of Neonatal Tetanus by 2015 and maintain the elimination status till 2018.
Cases of measles
per 1 million population
Cases of Polio Cases of Tetanus per 100,000 newborns
From To by 2018 From To by 2018 From To by 2018
Punjab 34 20 2 0 0.8 0.5
Sindh 218 55 4 0 1.8 0.5
Balochistan 225 110 4 0 0.6 0.3
KP
AJK <5 0 <1
CDA <5 0 <1
FATA <5 20 0 <1
GB <5 1 0 <1
ICT <5 0 0 <1
The objective of the national immunization program is to improve performance of the immunization
system that is measured in terms of coverage and equity as listed below:
Indicators 2012 2014 2015 2016 2017 2018
1. Increase DTP3 coverage 64% 69% 73% 77% 81% 85%
2. Increase Measles 1 coverage 61% 63% 68% 72% 76% 79%
3. Increase the proportion of population protected at birth from neonatal tetanus
64% 65% 67% 70% 74% 77%
4. Increase OPV3 coverage 83% 69% 73% 77% 81% 85%
5. Increase PCV coverage 0% 68% 73% 77% 81% 85%
6. Increase IPV coverage 0% 0% 22% 50% 61% 72%
7. Increase Rota Coverage 0% 0% 0% 33% 54% 64%
8. Increase Hepatitis (birth dose) coverage 0% 8% 29% 49% 59% 69%
9. Increase the proportion of children fully immunized26 53% 59% 63% 69% 73% 77%
10. Improve geographical equity - % of districts that have at or above 80% DTP3 coverage
20% 32% 41% 52% 62% 73%
11. Improve socio-economic equity27,28 47% 40% 35% 30% 25% 20%
12. Decrease drop-out rate - percentage point difference between DTP1 and DTP3 coverage
18% 15% 13% 12% 10% 9%
13. Increased demand - % of children whose mothers intend to vaccinate children
TBD TBD
Immunization system outcome targets (by provinces) are presented in Figure 67 on page 85.
26 % of children aged 12-23 months who receive all basic vaccinations in a country’s routine immunization
program 27 DTP3 coverage in the lowest wealth quintile is +/- X % points of the coverage in the highest wealth quintile 28 PDHS 2012-13 figure was selected as baseline, that is slightly higher than PSLM 2011-12 finding (41 per centile
point)
Comprehensive Multi-Year Plan | Immunization Program of Pakistan Chapter 2: Immunization objectives and strategies
37
2.2 Strategies and main activities
2.2.1 Program Management
The objective of the immunization system component is to increase program management
performance at federal, provincial and sub-provincial levels. It means that by 2018:
Federal level:
Immunization program governance is streamlined
Federal EPI Cell structure, staffing and operation is optimized
Provincial level:
Immunization program planning is integrated into provincial budgeting, namely:
o EPI annual plans are developed and consistent with the provincial cMYP
o PC1 are adjusted as needed and aligned with the EPI annual plans
Implementation annual progress reports are produced and discussed with key stakeholders
regularly
The provincial cMYP is updated regularly reflecting either changes in the context
(epidemiological, vaccine availability, etc.), resource availability or immunization system
outcomes (achievements)
The turnover of EPI key managerial staff decreases
Coordination or interaction with EPI partners (donors, private entities and non-governmental
organizations) increases (e.g. partners engage in decision-making (e.g. planning, assessment
of achievements or challenges) regularly, as documented in meeting minutes)
Strategies and activities to achieve the component objective are as follows:
ISC Objective 1: Increase program management performance
Strategy 1.1 Streamline management processes (both at federal and provincial levels):
Activity 1.1.1 Review and develop effective and efficient management structure and
procedures
(1) Revise job descriptions
(2) Revise or introduce new standard operating procedures
(3) Revise or introduce new reporting mechanisms
Activity 1.1.2 Carry out regular supportive supervision visits including following up
results/recommendations of the previous visits
Activity 1.1.3 Assess competencies of key EPI management staff on a regular basis
(1) Develop assessment criteria/methodology

Comprehensive Multi-Year Plan | Immunization Program of Pakistan Chapter 2: Immunization objectives and strategies
38
(2) Adjust regulations (introducing competency assessment as a
mandatory procedure)
(3) Carry out assessments
Activity 1.1.4 Provide methodological guidance and supportive supervision to provincial EPI teams on different aspects of EPI planning and implementation
Activity 1.1.5 Mobilize Technical support as needed (e.g. for Annual Plan
development, APR development, cMYP revision)
Strategy 1.2 Management staff capacity building and motivation growth (see corresponding
strategy under HR management component)
Strategy 1.3 Advocacy and partnership building (both at federal and provincial levels)
Activity 1.3.1 Produce regularly policy briefs/advocacy materials to share with high
level officials
Activity 1.3.2 Attend high level meetings and present immunization program
achievements, challenges and solutions
Activity 1.3.3 Organize consultations meetings with EPI partners and follow up
implementation of decisions and actions agreed in the past
Activity 1.3.4 Explore possibility of engagement of non-state actors in the
implementation of the immunization program and make
corresponding arrangements (including strengthening of
coordination mechanism for CSOs involved in immunization)
Strategy 1.4 Keep National EPI Policy updated (federal level):
Activity 1.4.1 Review and refine the national EPI policy relating to the provision of
immunization services to newborn children and pregnant women all
over the country
Activity 1.4.2 Revise the EPI policy incorporating newly invented vaccines into EPI
immunization schedule from time to time to protect children and
pregnant women against VPD based on global, regional or country
specific evidence
Strategy 1.5 Strengthen oversight by integrating PEI oversight structures into EPI performance
monitoring (at federal level):
Activity 1.5.1 Develop a detailed action plan (with time-bound milestones and
responsible entities) for the harmonization of PEI and routine
immunization operation
Activity 1.5.2 For routine immunization see Activity 6.4.3 (on page 46)
Activity 1.5.3 Use Polio oversight mechanisms (at national, provincial, district and
UC levels) for SIA (e.g. integrated Polio-Measles SIA)

Comprehensive Multi-Year Plan | Immunization Program of Pakistan Chapter 2: Immunization objectives and strategies
39
Strategy 1.6 Increase effectiveness of the cooperation with and credibility of the country in front of
international partner and donor community (at the federal level) see Strategy 3.1 (on
page 41) under component “Costing and Financing”
2.2.2 Human Resource Management
The objective of the immunization system component is to increase the availability of qualified human
resources for the immunization program. It means that by 2018:
Proportion of population served to skilled immunization staff (SIS) increases from 55% to 99%
Managerial and technical positions are fully filled at the federal and provincial levels
Provinces elaborates several scenarios of mobilization of additional SIS and filling in the existing gap:
Total FTE spent on
immunization FTE spent on
PEI
Total FTE available for
EPI (except PEI)
Total FTE Needed for EPI
(except PEI) GAP (in FTE and %)
Baseline 26,778 10,476 16,302 29,674 13,372 45%
Scenario 1 32,707 10,476 22,231 29,674 7,443 25%
Scenario 2 36,268 10,476 25,795 29,674 3,804 13%
Scenario 3 39,727 10,473 29,254 29,594 345 1%
16,302
22,23125,870
29,329
13,372
7,4433,804
345
B A S E L I N E S C E N A R I O 1 S C E N A R I O 2 S C E N A R I O 3
Total FTE available for EPI (except PEI) GAP (in FTE and %)
All provinces opted for scenario 3 that entails application of 2 strategies described below (Strategy 2.1
and Strategy 2.2).
Strategies and activities to achieve the component objective are as follows:
ISC Objective 2: Increase the availability of qualified human resources for the
immunization program (at provincial level)
Strategy 2.1 Increase the number of SIS by mobilizing (or focusing on) vaccinators
Activity 2.1.1 Advertise vaccinator positions in provincial/local media
Activity 2.1.2 Conduct meetings with local authorities/communities promoting job
of vaccinators (could be part of communication campaign)

Comprehensive Multi-Year Plan | Immunization Program of Pakistan Chapter 2: Immunization objectives and strategies
40
Activity 2.1.3 Select and contract new vaccinators
Activity 2.1.4 Explore and provide professional/carrier growth opportunities to
vaccinators
Strategy 2.2 Increase the number of SIS by integrating available qualified health professionals in
the delivery of immunization services:
Activity 2.2.1 Assess opportunities (availability, readiness/willingness) for
engagement of different categories of SIS into immunization program
Activity 2.2.2 Carry out consultations with relevant health authorities (vertical
program management) and agree on feasible and sustainable
arrangements
Activity 2.2.3 Revise the regulatory framework (standards/guidelines, scope of
work) in order to ensure the engagement of SIS in the immunization
as planned
Activity 2.2.4 Carry out trainings in immunization for LHW and mid-wives (as
needed)
Strategy 2.3 Increase effectiveness of trainings of EPI medical and managerial staff:
Activity 2.3.1 Carry out refreshing training for each SIS at least once in 2 years (as
per the national policy)
Activity 2.3.2 Carry out training of managerial staff in planning (e.g. vaccine
forecasting, budgeting), reporting, decision making and advocacy
Activity 2.3.3 Assess periodically competency of selected category of healthcare
professionals involved
in immunization
Activity 2.3.4 Introduce a system of
pre and post trainings
assessment of the
knowledge of trainees
Activity 2.3.5 Train immunization
staff in medical,
surveillance and
logistics required for
the introduction of new
vaccines
Strategy 2.4 Increase motivation of key staff of the immunization program
Activity 2.4.1 Assess regularly motivations of selected category of HR of the
immunization system
Box 1: WHO Immunization in Practice topics
Vaccine Preventable Target Diseases
EPI Vaccines used in Pakistan
Cold Chain
Ensuring Safe Injections
Planning Immunization Sessions to Reach Every Infant
Holding an Immunization Session
Monitoring and Using Your Data
Building Community Support for Immunization

Comprehensive Multi-Year Plan | Immunization Program of Pakistan Chapter 2: Immunization objectives and strategies
41
Activity 2.4.2 Develop and implement non-financial incentives (carrier growth
opportunities, promotion, recognition/awards, etc.)
Activity 2.4.3 Explore possibilities for financial incentives (bonuses, performance
based payments, etc.) and implement whenever feasible
Strategy 2.5 Integrate frontline workers and Polio staff into EPI through capacity building (linked
to Activity 1.5.1 above):
Activity 2.5.1 Carry out orientation training for technical polio staff on
“Immunization Monitoring Checklist”29
Activity 2.5.2 Conduct trainings on WHO’s immunization in Practice (see Box 1
above)
Activity 2.5.3 Provide refresher/orientation training to Polio Technical staff and
UCMOs for routine immunization planning
Activity 2.5.4 Provide training to PEOs, UCMOs and UCPWs on integrated VPD
surveillance system
Activity 2.5.5 Carry out training on creating demand for Routine Immunization
Activity 2.5.6 Provide MLM training to PEO and UCMOs
2.2.3 Costing and Financing
The objective of the immunization system component is to increase financial efficiency and
sustainability of the immunization program. It means that by 2018:
Cost per fully immunization child:
Either increases from X$/PKR to Y$/PKR
Or remains within a range of X-Y $/PKR
Immunization system outcome targets are balanced with the financial resources available:
Proportion of secured financial resources vs. planned
Coverage targets revised/adjusted to the availability of funding
ISC Objective 3: Increase financial efficiency and sustainability of the immunization
program
Strategy 3.1 Increase effectiveness of the cooperation with and credibility of the country in front of
international partner and donor community (at the federal level):
Activity 3.1.1 Represent the country in front of international agencies and donors
Activity 3.1.2 Facilitate development of national proposals/applications for financial and technical support from donors
Activity 3.1.3 Ensure timely and proper fulfillment of national reporting obligations and transparent financial accountability
29 “focuses on 7 questions/observations covering session implementation, defaulter tracking, vaccine supply, cold
chain maintenance, injection safety, AEFI and providing information to mothers”

Comprehensive Multi-Year Plan | Immunization Program of Pakistan Chapter 2: Immunization objectives and strategies
42
Activity 3.1.4 Provide technical know-how acquired from the international professional organizations30 and disseminate the same to Provinces/Areas for better implementation of immunization programs
Activity 3.1.5 Coordinate with international partners/donors to secure funds for the purchase of vaccines and financing of programmatic activities
Activity 3.1.6 Establish and operate financial mechanisms for ensuring timely payment of country’s co-financing obligations and smoothing resource mobilization of funds for pooled procurement of vaccines and commodities.
Activity 3.1.7 Assess financial sustainability of provincial EPIs and provide recommendations for the revision and implementation of feasible and effective financial sustainability strategies
Strategy 3.2 Establishment of a reserve central (national) pool to cater for emergencies (linked to the Strategy 4.631 on page 44):
Activity 3.2.1 Development financial mechanisms and procedures for the replenishment of the buffer stock at the national level after emergencies
Activity 3.2.2 Endorsement of regulatory changes necessary for the operation of the reserve pool
Financial outlook and sustainability strategies are discussed in details in section 4 “Immunization
Program Costing and Financing” and relevant sections of the provincial cMYPs.
2.2.4 Vaccine, Cold Chain and Logistics
The objective of the immunization system component is to improve/sustain uninterrupted supply of
vaccines to immunization service delivery. It means that by 2018:
Number (%) of EPI Centers experiencing stock-outs equals to zero
% of districts with average EVM score above 80% increased (target to be defined after EVM
assessment planned in 2014).
Strategies and activities to achieve the component objective are as follows:
ISC Objective 4: Improve/sustain uninterrupted supply of vaccines to immunization
service delivery
Strategy 4.1 Upgrade/maintain adequate cold chain equipment and storage infrastructure
Activity 4.1.1 Assess of needs for cold chain upgrade
Activity 4.1.2 Develop specifications and procurement plan (aligned with the
availability of funding)
Activity 4.1.3 Purchase and install necessary activity
Activity 4.1.4 Provide maintenance services on a regular basis
30 such as World Health Organization, Centre for Diseases Control & Prevention, Atlanta, USA and UNICEF 31 If the National Immunization Policy is implemented and 6 month buffer stocks is established at the federal
level (at least), sufficient volume of vaccines will be available to supply to emergency areas immediately; however, the buffer stock should be replenished within a predefined time framework. Therefore, if the buffer stock is available, the emergency pool becomes combination of a “virtual stock” of commodities and financial mechanisms

Comprehensive Multi-Year Plan | Immunization Program of Pakistan Chapter 2: Immunization objectives and strategies
43
Activity 4.1.5 Construct new and/or refurbish existing warehouses at provincial and
sub-provincial levels
Strategy 4.2 Improve vaccine management by implementing EVM Improvement plan
Activity 4.2.1 Carry out EVM assessment
Activity 4.2.2 Revise the annual work plan in accordance with the EVM
improvement plan
Activity 4.2.3 Report on the progress of implementation of the EVM improvement
Plan
Strategy 4.3 Prepare cold chain and vaccine
management for the introduction of
new vaccine (the federal and
provincial levels)
Activity 4.3.1 Expand cold chain
storage capacity if
needed
Activity 4.3.2 Train vaccine
management
personnel (as
needed, linked to
Activity 4.2.2 above)
Strategy 4.4 Introduce integrated IT solutions for effective vaccine supply and stock management
(see Box 2 above) (at federal level):
Activity 4.4.1 Develop advanced versions of vLMIS (releases 3.0 and 4.0)
Activity 4.4.2 Procure and install necessary IT equipment in selected 54 districts
with further expansion to 97 districts
Activity 4.4.3 Train end-users (designated specialists) at all levels
Activity 4.4.4 Introduce monitoring and SMS reporting in the vLMIS
Strategy 4.5 Introduce a pooled procurement mechanism for vaccines and injection supplies (at
the federal level):
Activity 4.5.1 Develop in consultation with provincial teams procedures for
forecasting vaccine and injection supply needs and posting
procurement requests, as well as for the payment by provinces
Activity 4.5.2 Endorse a pooled procurement mechanisms and revise regulations at
federal and provincial as needed
Activity 4.5.3 Carry out pooled procurement in accordance with the regulations and
standard operational procedures
Box 2: vLMIS benefits for all steps of vaccine supply management
Forecasting and quantification
Financial arrangements
Procurement planning (what, how and when)
Supply and distribution planning
Stock adjustments
Determining cold chain and storage capacity
Product expiry (FEFO)
Vaccine wastages control

Comprehensive Multi-Year Plan | Immunization Program of Pakistan Chapter 2: Immunization objectives and strategies
44
Strategy 4.6 Establish vaccine and injection buffer stock in accordance with the National
Immunization Policy requirements (at the federal and provincial levels)
Activity 4.6.1 Assess the availability of required funding (see section 4.2.2
“Resource requirements for the establishment of the buffer stock of
vaccines” on page 58) as well as storage space and purchase the
necessary volume of commodities
Activity 4.6.2 Revise the National Immunization Policy adjusting it to the
availability of funds and/or storage capacity (as interim measure) if
needed
2.2.5 Immunization Services Delivery
The objective of the immunization system component is to strengthen capacity of immunization
service delivery. It means that by 2018:
Geographical access increased: Number of population per each EPI fixed sites meets the
minimum requirements defined by the National Immunization Policy (10,000 per SIS in urban
areas and 5,000 per SIS in rural areas)
Share of static/fixed immunization services delivered by EPI centers (vs. outreach) increased
Average time EPI Centers provide immunization service per day increases from 6 to 7 hours per
EPI center in selected districts
Proportion of UC not having EPI centers decreased from 21% to 0%
Proportion of UC not having Skilled Immunization Staff (SIS) decreased from 9% to 0%
Proportion of UC delivering new vaccine increases to 100%
Strategies and activities to achieve the component objective are as follows:
ISC Objective 5: Strengthen and optimize capacity of immunization service delivery
Strategy 5.1 Make existing BHU/RHC functional (for EPI)
Activity 5.1.1 Repair facility/infrastructure
Activity 5.1.2 Recruit qualified staff (see corresponding strategy under component
2.2.2 “Human Resource Management”)
Activity 5.1.3 Install cold chain equipment (see corresponding strategy under
component 2.2.4 “Vaccine, Cold Chain and Logistics”)
Strategy 5.2 Performance based contracting out (at the federal and provincial levels)
Activity 5.2.1 Develop a conceptual framework (or national guidelines) for
contracting out immunization services
Activity 5.2.2 Develop ToR/Scope of Work for contracting out
Activity 5.2.3 Select and contract qualified immunization service providers

Comprehensive Multi-Year Plan | Immunization Program of Pakistan Chapter 2: Immunization objectives and strategies
45
Activity 5.2.4 Conduct oversight of contract implementation
Activity 5.2.5 Assess performance and efficiency of the contracting out mechanism
(linked with Program management component)
Strategy 5.3 Increase performance/efficiency (effective coverage) of existing EPI Centers
Activity 5.3.1 Revise regulations
Activity 5.3.2 Mobilize additional qualified staff SIS
Activity 5.3.3 Introduce contracting/financing mechanism
Activity 5.3.4 Improve micro-planning through:
(1) Integration of PEI and EPI micro-planning (see details in Annex 10
on page 119)
(2) regular supportive supervision of designated staff at EPI centers
2.2.6 Monitoring, Surveillance and Reporting
The objective of the immunization system component is to increase performance of surveillance and
routine monitoring/reporting. It means that by 2018:
Reliability and accuracy of administrative data increased:
Discrepancy ratio (between administrative and survey data) decreases from 30% to <5%
% of reporting units receiving satisfactory DQS score/mark increases >95%
Ability of surveillance to detect and report on certain cases increased:
National AEFI system is functional and serious cases of AEFI are reported and analyzed
Timeliness and completeness of integrated VPD surveillance reports received at provincial
level improved (above 90% and 99% respectively)
Number of non polio AFP cases detected and reported (>1 per 100,000 children under 15
years of age)
Number of discarded measles cases per 100,000 population
Strategies and activities to achieve the component objective are as follows:
ISC Objective 6: Performance of surveillance and routine monitoring/reporting increased
Strategy 6.1 Streamline data collection and reporting practices (integrate EPI routine monitoring
into data management mainstream) (at the federal and provincial levels)
Activity 6.1.1 Assess main causes of data quality flaws
Activity 6.1.2 Introduce regular (FORMAL) feedback mechanism on the
administrative reports of subordinated entities
Activity 6.1.3 Provide continuous supportive supervision
Comprehensive Multi-Year Plan | Immunization Program of Pakistan Chapter 2: Immunization objectives and strategies
46
Activity 6.1.4 Carry out regular monitoring and evaluation of the implementation of
immunization programs in randomly selected districts throughout the
year.
Activity 6.1.5 Collect, clean and analyze coverage data received from the Provinces
and provide a feedback to them pinpointing strengths and weaknesses
of their immunization programme
Activity 6.1.6 Conduct DQS at regular interval
Activity 6.1.7 Conduct periodic review meetings on immunization at national level
Strategy 6.2 Expand surveillance network (primarily by 1) establishing new points/units or by 2)
engaging existing capacities)
Activity 6.2.1 Provide logistical support
Activity 6.2.2 Capacity building
Activity 6.2.3 Revision of guidelines/forms
Activity 6.2.4 Conduct proficiency tests for laboratories (% of lab of the tests)
Strategy 6.3 Conduct regular immunization coverage evaluation surveys (both at federal and
provincial levels:
Activity 6.3.1 Carry out data collection/field work
Activity 6.3.2 Analyze consistency between reported and surveyed coverage by
districts and provide recommendations to EPI management teams
Activity 6.3.3 Promote integration of ICE findings into decision making (planning
and budgeting)
Strategy 6.4 Integrate EPI and PEI monitoring (both at the federal and provincial levels):
Activity 6.4.1 Introduce “Immunization Monitoring Checklists” in daily practice of
Polio eradication Officers, UC Medical Officers and UC Polio Workers
Activity 6.4.2 Introduce the processing and analysis of the immunization
monitoring checklists by the district polio control rooms including
feedback to UC and District committees
Activity 6.4.3 Introduce information sharing by DHT at every DPEC meetings
related to the performance of EPI (see the list of indicators in Annex
11 on page 120)
Strategy 6.5 Strengthen VPD surveillance with the support of District Level PEI Staff (coordinated
from the federal level but implemented at provincial and sub-provincial levels):
Activity 6.5.1 Conduct regular monitoring of timeliness and completeness of the
weekly reporting from health facilities at district level and share the
indicators in DPEC meeting through Polio Control room
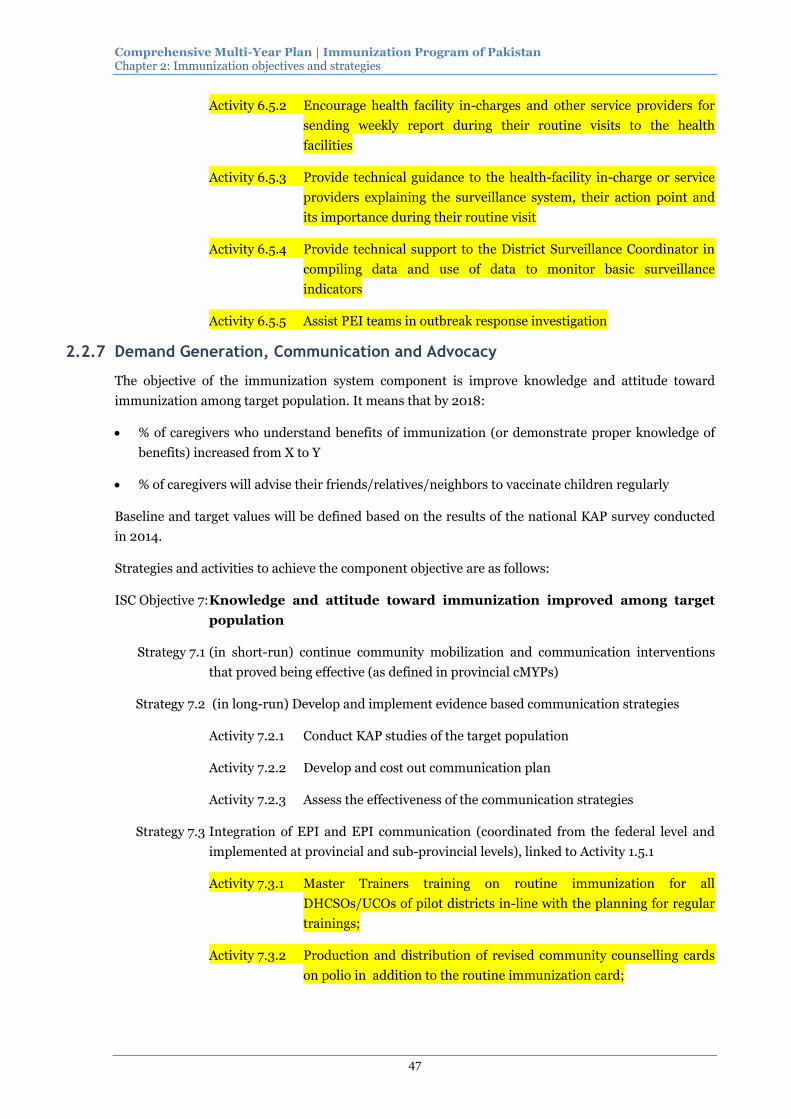
Comprehensive Multi-Year Plan | Immunization Program of Pakistan Chapter 2: Immunization objectives and strategies
47
Activity 6.5.2 Encourage health facility in-charges and other service providers for
sending weekly report during their routine visits to the health
facilities
Activity 6.5.3 Provide technical guidance to the health-facility in-charge or service
providers explaining the surveillance system, their action point and
its importance during their routine visit
Activity 6.5.4 Provide technical support to the District Surveillance Coordinator in
compiling data and use of data to monitor basic surveillance
indicators
Activity 6.5.5 Assist PEI teams in outbreak response investigation
2.2.7 Demand Generation, Communication and Advocacy
The objective of the immunization system component is improve knowledge and attitude toward
immunization among target population. It means that by 2018:
% of caregivers who understand benefits of immunization (or demonstrate proper knowledge of
benefits) increased from X to Y
% of caregivers will advise their friends/relatives/neighbors to vaccinate children regularly
Baseline and target values will be defined based on the results of the national KAP survey conducted
in 2014.
Strategies and activities to achieve the component objective are as follows:
ISC Objective 7: Knowledge and attitude toward immunization improved among target
population
Strategy 7.1 (in short-run) continue community mobilization and communication interventions
that proved being effective (as defined in provincial cMYPs)
Strategy 7.2 (in long-run) Develop and implement evidence based communication strategies
Activity 7.2.1 Conduct KAP studies of the target population
Activity 7.2.2 Develop and cost out communication plan
Activity 7.2.3 Assess the effectiveness of the communication strategies
Strategy 7.3 Integration of EPI and EPI communication (coordinated from the federal level and
implemented at provincial and sub-provincial levels), linked to Activity 1.5.1
Activity 7.3.1 Master Trainers training on routine immunization for all
DHCSOs/UCOs of pilot districts in-line with the planning for regular
trainings;
Activity 7.3.2 Production and distribution of revised community counselling cards
on polio in addition to the routine immunization card;
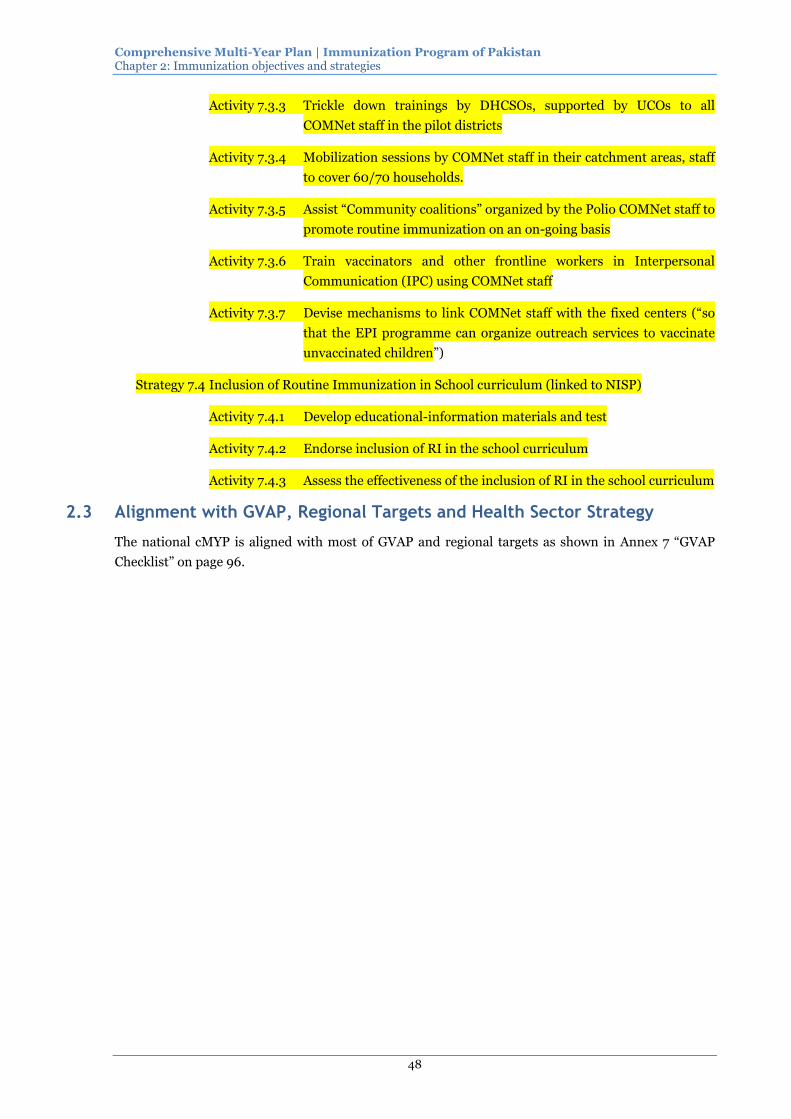
Comprehensive Multi-Year Plan | Immunization Program of Pakistan Chapter 2: Immunization objectives and strategies
48
Activity 7.3.3 Trickle down trainings by DHCSOs, supported by UCOs to all
COMNet staff in the pilot districts
Activity 7.3.4 Mobilization sessions by COMNet staff in their catchment areas, staff
to cover 60/70 households.
Activity 7.3.5 Assist “Community coalitions” organized by the Polio COMNet staff to
promote routine immunization on an on-going basis
Activity 7.3.6 Train vaccinators and other frontline workers in Interpersonal
Communication (IPC) using COMNet staff
Activity 7.3.7 Devise mechanisms to link COMNet staff with the fixed centers (“so
that the EPI programme can organize outreach services to vaccinate
unvaccinated children”)
Strategy 7.4 Inclusion of Routine Immunization in School curriculum (linked to NISP)
Activity 7.4.1 Develop educational-information materials and test
Activity 7.4.2 Endorse inclusion of RI in the school curriculum
Activity 7.4.3 Assess the effectiveness of the inclusion of RI in the school curriculum
2.3 Alignment with GVAP, Regional Targets and Health Sector Strategy
The national cMYP is aligned with most of GVAP and regional targets as shown in Annex 7 “GVAP
Checklist” on page 96.

Comprehensive Multi-Year Plan | Immunization Program of Pakistan
49
3 Implementation and M&E
3.1 Timelines for the cMYP
Timeline for the implementation of the cMYP is described in detail in provincial cMYPs. The timeline
below depicts strategies and activities implemented exclusively at the federal level or at both levels:
Objective/strategies/activities
20
14
20
15
20
16
20
17
20
18
ISC Objective 1: Increase program management performance
Strategy 1.1 Streamline management processes:
Activity 1.1.1 Review and develop effective and efficient management structure and procedures
(1) Revise job descriptions
(2) Revise or introduce new standard operating procedures
(3) Revise or introduce new reporting mechanisms
Activity 1.1.2 Carry out regular supportive supervision visits including following up results/recommendations of the previous visits
Activity 1.1.3 Assess competencies of key EPI management staff on a regular basis
(1) Develop assessment criteria/methodology
(2) Adjust regulations (introducing competency assessment as a mandatory procedure)
(3) Carry out assessments
Activity 1.1.4 Mobilize Technical support as needed (e.g. for Annual Plan development, APR development, cMYP revision)
Strategy 1.2 Management staff capacity building and motivation growth (see corresponding strategy under HR management component)
Strategy 1.3 Advocacy and partnership building
Activity 1.3.1 Produce regularly policy briefs/advocacy materials to share with high level officials
Activity 1.3.2 Attend high level meetings and present immunization program achievements, challenges and solutions
Activity 1.3.3 Organize consultations meetings with EPI partners and follow up implementation of decisions and actions agreed in the past
Activity 1.3.4 Explore possibility of engagement of non-state actors in the implementation of the immunization program and make corresponding arrangements
Strategy 1.4 Keep National EPI Policy updated (federal level)
Activity 1.4.1 Review and refine the national EPI policy relating to the provision of immunization services to newborn children and pregnant women all over the country
Activity 1.4.2 Revise the EPI policy incorporating newly invented vaccines into EPI immunization schedule from time to time to protect children and pregnant women against VPD based on global, regional or country specific evidence
Strategy 1.5 Strengthen oversight by integrating PEI oversight structures

Comprehensive Multi-Year Plan | Immunization Program of Pakistan Chapter 3: Implementation and M&E
50
Objective/strategies/activities
20
14
20
15
20
16
20
17
20
18
into EPI performance monitoring (at federal level):
Activity 1.5.1 Develop a detailed action plan (with time-bound milestones and responsible entities) for the harmonization of PEI and routine immunization operation
Activity 1.5.2 For routine immunization see Activity 6.4.3:
Activity 1.5.3 Use Polio oversight mechanisms (at national, provincial, district and UC levels) for SIA (e.g. integrated Polio-Measles SIA)
ISC Objective 2: Increase the availability of qualified human resources for the immunization program
Strategy 2.1 Increase the number of SIS by mobilizing (or focusing on) vaccinators
Strategy 2.2 Increase the number of SIS by integrating available qualified health professionals in the delivery of immunization services:
Strategy 2.3 Increase effectiveness of trainings of EPI medical and managerial staff:
Strategy 2.4 Increase motivation of key staff of the immunization program
Strategy 2.5 Integrate frontline workers and Polio staff into EPI through capacity building32
Activity 2.5.1 Carry out orientation training for technical polio staff on “Immunization Monitoring Checklist”
Activity 2.5.2 Conduct trainings on WHO’s immunization in Practice
Activity 2.5.3 Provide refresher/orientation training to Polio Technical staff and UCMOs for routine immunization planning
Activity 2.5.4 Carry out training on creating demand for Routine Immunization
Activity 2.5.5 Provide MLM training to PEO and UCMOs
ISC Objective 3: Increase financial efficiency and sustainability of the immunization program.
Strategy 3.1 Increase effectiveness of the cooperation with and credibility of the country in front of international partner and donor community
Activity 3.1.1 Represent the country in front of international agencies and donors
Activity 3.1.2 Facilitate development of national proposals/applications for financial and technical support from donors
Activity 3.1.3 Ensure timely and proper fulfillment of national reporting obligations and transparent financial accountability
Activity 3.1.4 Provide technical know-how acquired from the international professional organizations and disseminate the same to Provinces/Areas for better implementation of immunization programs
Activity 3.1.5 Coordinate with international partners/donors to secure funds for the purchase of vaccines and financing of programmatic activities
Activity 3.1.6 Establish and operate financial mechanisms
32 The timeline will be refined after the completion of Activity 1.5.1
Comprehensive Multi-Year Plan | Immunization Program of Pakistan Chapter 3: Implementation and M&E
51
Objective/strategies/activities
20
14
20
15
20
16
20
17
20
18
for ensuring timely payment of country’s co-financing obligations and smoothing resource mobilization of funds for pooled procurement of vaccines and commodities.
Activity 3.1.7 Assess financial sustainability of provincial EPIs and provide recommendations for the revision and implementation of feasible and effective financial sustainability strategies
Strategy 3.2 Establishment of a reserve central (national) pool to cater for emergencies
Activity 3.2.1 Development financial mechanisms and procedures for the replenishment of the buffer stock at the national level after emergencies
Activity 3.2.2 Endorsement of regulatory changes necessary for the operation of the reserve pool
ISC Objective 4: Improve/sustain uninterrupted supply of vaccines to immunization service delivery
Strategy 4.1 Upgrade/maintain adequate cold chain equipment
Strategy 4.2 Improve vaccine management by implementing EVM Improvement plan
Activity 4.2.1 Carry out EVM assessment
Activity 4.2.2 Revise the annual work plan in accordance with the EVM improvement plan
Activity 4.2.3 Report on the progress of implementation of the EVM improvement Plan
Strategy 4.3 Prepare cold chain and vaccine management for the introduction of new vaccine
Activity 4.3.1 Expand cold chain storage capacity if needed
Activity 4.3.2 Train vaccine management personnel (as needed)
Strategy 4.4 Introduce integrated IT solutions for effective vaccine supply and stock management
Activity 4.4.1 Develop advanced versions of vLMIS (releases 3.0 and 4.0)
Activity 4.4.2 Procure and install necessary IT equipment in selected 54 districts with further expansion to 97 districts
Activity 4.4.3 Train end-users (designated specialists) at all levels
Activity 4.4.4 Introduce monitoring and SMS reporting in the vLMIS
Strategy 4.5 Introduce a pooled procurement mechanism for vaccines and injection supplies (at the federal level):
Activity 4.5.1 Develop in consultation with provincial teams procedures for forecasting vaccine and injection supply needs and posting procurement requests, as well as for the payment by provinces
Activity 4.5.2 Endorse a pooled procurement mechanisms and revise regulations at federal and provincial as needed
Activity 4.5.3 Carry out pooled procurement in accordance with the regulations and standard operational procedures
Strategy 4.6 Establish vaccine and injection buffer stock in accordance with
Comprehensive Multi-Year Plan | Immunization Program of Pakistan Chapter 3: Implementation and M&E
52
Objective/strategies/activities
20
14
20
15
20
16
20
17
20
18
the National Immunization Policy requirements
Activity 4.6.1 Assess the availability of required funding as well as storage space and purchase the necessary volume of commodities
Activity 4.6.2 Revise the National Immunization Policy adjusting it to the availability of funds and/or storage capacity (as interim measure) if needed
ISC Objective 5: Strengthen capacity of immunization service delivery
Strategy 5.1 Make existing BHU/RHC functional (for EPI)
Strategy 5.2 Performance based contracting out
Activity 5.2.1 Develop a conceptual framework (or national guidelines) for contracting out immunization services
Activity 5.2.2 Develop ToR/Scope of Work for contracting out
Activity 5.2.3 Select and contract qualified immunization service providers
Activity 5.2.4 Conduct oversight of contract implementation
Activity 5.2.5 Assess performance and efficiency of the contracting out mechanism (linked with Program management component)
Strategy 5.3 Increase performance/efficiency (effective coverage) of existing EPI Centers
Activity 5.3.1 Revise regulations
Activity 5.3.2 Mobilize additional qualified staff SIS
Activity 5.3.3 Introduce contracting/financing mechanism
Activity 5.3.4 Improve micro-planning through
(1) Integration of PEI and EPI micro-planning
(2) regular supportive supervision of designated staff at EPI centers
ISC Objective 6: Performance of surveillance and routine monitoring/reporting increased
Strategy 6.1 Streamline data collection and reporting practices (integrate EPI routine monitoring into data management mainstream)
Activity 6.1.1 Assess main causes of data quality flaws
Activity 6.1.2 Introduce regular (FORMAL) feedback mechanism on the administrative reports of subordinated entities
Activity 6.1.3 Provide continuous supportive supervision
Activity 6.1.4 Carry out regular monitoring and evaluation of the implementation of immunization programs in randomly selected districts throughout the year.
Activity 6.1.5 Collect, clean and analyze coverage data received from the Provinces and provide a feedback to them pinpointing strengths and weaknesses of their immunization programme
Activity 6.1.6 Conduct DQS at regular interval33
Activity 6.1.7 Conduct periodic review meetings on immunization at national level
Strategy 6.2 Expand surveillance network
33 Frequency of DSQ is subject to modification

Comprehensive Multi-Year Plan | Immunization Program of Pakistan Chapter 3: Implementation and M&E
53
Objective/strategies/activities
20
14
20
15
20
16
20
17
20
18
Strategy 6.3 Conduct regular immunization coverage evaluation surveys
Activity 6.3.1 Carry out data collection/field work
Activity 6.3.2 Analyze consistency between reported and surveyed coverage by districts and provide recommendations to EPI management teams
Activity 6.3.3 Promote integration of ICE findings into decision making (planning and budgeting)
Strategy 6.4 Integrate EPI and PEI monitoring
Activity 6.4.1 Activity 6.4.1 Introduce “Immunization Monitoring Checklists” in daily practice of Polio eradication Officers, UC Medical Officers and UC Polio Workers
Activity 6.4.2 Introduce the processing and analysis of the immunization monitoring checklists by the district polio control rooms including feedback to UC and District committees
Activity 6.4.3 Introduce information sharing by DHT at every DPEC meetings related to the performance of EPI
Strategy 6.5 Strengthen VPD surveillance with the support of District Level PEI Staff
Activity 6.5.1 Conduct regular monitoring of timeliness and completeness of the weekly reporting from health facilities at district level and share the indicators in DPEC meeting through Polio Control room
Activity 6.5.2 Encourage health facility in-charges and other service providers for sending weekly report during their routine visits to the health facilities
Activity 6.5.3 Provide technical guidance to the health-facility in-charge or service providers explaining the surveillance system, their action point and its importance during their routine visit
Activity 6.5.4 Provide technical support to the District Surveillance Coordinator in compiling data and use of data to monitor basic surveillance indicators
Activity 6.5.5 Assist PEI teams in outbreak response investigation
ISC Objective 7: Knowledge and attitude toward immunization improved among target population
Strategy 7.1 (in short-run) continue community mobilization and communication interventions that proved being effective:
Strategy 7.2 Implement evidence based communication strategies
Strategy 7.3 Integration of EPI and EPI communication34:
Activity 7.3.1 Master Trainers training on routine immunization for all DHCSOs/UCOs of pilot districts in-line with the planning for regular trainings;
Activity 7.3.2 Production and distribution of revised community counselling cards on polio in addition to the routine immunization card
34 The timeline will be refined after the completion of Activity 1.5.1

Comprehensive Multi-Year Plan | Immunization Program of Pakistan Chapter 3: Implementation and M&E
54
Objective/strategies/activities
20
14
20
15
20
16
20
17
20
18
Activity 7.3.3 Trickle down trainings by DHCSOs, supported by UCOs to all COMNet staff in the pilot districts
Activity 7.3.4 Mobilization sessions by COMNet staff in their catchment areas, staff to cover 60/70 households
Activity 7.3.5 Assist “Community coalitions” organized by the Polio COMNet staff to promote routine immunization on an on-going basis
Activity 7.3.6 Train vaccinators and other frontline workers in Interpersonal Communication (IPC) using COMNet staff
Activity 7.3.7 Devise mechanisms to link COMNet staff with the fixed centers
Strategy 7.4 Inclusion of Routine Immunization in School curriculum (linked to NISP)
Activity 7.4.1 Develop educational-information materials and test
Activity 7.4.2 Endorse inclusion of RI in the school curriculum
Activity 7.4.3 Assess the effectiveness of the inclusion of RI in the school curriculum
3.2 Monitoring and Evaluation
3.2.1 M&E Framework for immunization
National immunization program impact and outcome level targets are outlined in section 2.1
“Program objectives and milestones” (on page 36) and serve as a national performance framework.
Contribution of provincial immunization programs toward achieving national immunization program
outcomes and impact are presented in 9 provincial M&E frameworks (attached to respective cMYP
documents).
3.2.2 Monitoring and Evaluation Strategy and Plan
The Federal EPI cell provides methodological guidance for the standardization of performance
indicators defined in provincial cMYPs.
Provincial EPI teams are responsible for data collection, performance measurement, reporting and
analysis of the progress of program implementation (as outlined in respective sections of provincial
cMYPs).
The Federal EPI cell synthesizes provincial immunization program performance reports annually and
prepared the national (progress) report to share with in-country stakeholders and international
partners (e.g. Annual Progress Report to submitted to GAVI).

Comprehensive Multi-Year Plan | Immunization Program of Pakistan
55
4 Immunization Program Costing and Financing
4.1 Current program costs and financing
The total cost of immunization program amounted to 238.7 US$ million in 2012 as shown in Figure
30 below:
Figure 30: Baseline Cost Profile (shared costs and campaigns included)
Category 2012
Vaccine Supply and Logistics (RI only) $4,179,030
Service Delivery $516,685
Monitoring and Disease Surveillance $2,231,469
Advocacy and Communication $42,873,835
Program Management $55,917,287
SIA Total $75,301,701
Shared Health Systems Costs $57,698,816
Grand Total $238,718,823
Advocacy and Communication2%
Programme Management
1%
Service Delivery
18%
Shared Health
Systems Costs23%
SIA Total32%
Vaccine Supply
and Logistics (RI only)
24%
SIA accounted for one third of the total cost (75.3 US$ million), and the remaining costs were
allocated to vaccine supply and logistics (24%), shared health system resources (23%) and service
delivery (18%). Distribution of immunization program costs by provinces is shown in Figure 72 (on
page 101): Punjab accounted for the half of annual costs followed by Sindh (20%) and KP (13%).
98% of SIA costs were spent on polio campaigns in 2012 as shown in Figure 86 (on page 113):
43.95 US$ million was the cost of OPV and 29.95 US$ million constituted operational costs.
Figure 31: Cost structure by provinces and major cost categories, routine immunization (2012)
30.3%
16.3%
40.6%45.1%
26.2% 25.1%
59.2%
32.9% 36.4%
50.2%
53.7%
18.6%
26.1%
50.0%
42.0%
24.1%
38.9% 39.2%
0%
10%
20%
30%
40%
50%
60%
70%
80%
90%
100%
AJK BAL CDA PUN FAT GP ICT KP SIN
Traditional Vaccines Underused Vaccines Injection supplies
Personnel Transportation Other routine recurrent costs
Vehicles Cold chain equipment

Comprehensive Multi-Year Plan | Immunization Program of Pakistan Chapter 4: Immunization Program Costing and Financing
56
Figure 31 above illustrates that underused vaccines and labor were major cost drivers in the baseline
year (accounting for 37.0% and 35.7% of Routine Immunization costs – 105.6 US$ million). Vaccine
and injection supplies absorbed 46.4% of the total cost (see Figure 73 on page 101). It is noteworthy
that personnel costs prevailed in Balochistan (53.7%), AJK (50.2%) and FATA (50.0%).
More detailed analysis of the personnel cost structure (see Figure 74 on page 102) shows that shared
labor costs dominated (56%) reaching as high as 70% of total labor costs in Punjab in 2012.
Figure 32: Baseline Financing Profile (with and without shared costs)
Shared costs excluded Shared costs included
Gov. Co-Financing
1.40%
Provincial Government
27.93%
WHO0.17%
PEI36.81%
Federal Government
6.31%
USAID3.60%
GAVI (ISS , NVS, HSS)
22.46%
Gov. Co-Financing
1.08%
Provincial Government
44.29%
UNICEF1.00%
WHO0.13%
PEI28.19%
Federal Government
5.36%
USAID2.76%
GAVI (ISS , NVS, HSS)17.20%
If shared (healthcare system) costs are not taken into account, PEI/NEAP was the major source of
financing in the baseline year constituting 36.81% of total financing followed by provincial
governments (with 27.93% share) and GAVI (with 22.46% share) as shown in Figure 32 above. With
shared costs provincial governments were the major source of financing with 44.29% share followed
by PEI (28.19%). Federal government’s share was 5.36% plus 1.08% accounting for co-financing of
GAVI supported vaccine (Pentavalent).
Figure 33: Immunization program baseline indicators (National)
Cost per DTP3 child was 29 US$ in 2012 as shown in Figure 33 above; Routine immunization costs
constituted 0.048% of GDP and 2% of total health expenditures (THE). Shared health care system
costs constituted 23% of the total immunization system costs. Baseline financial indicators by
provinces are presented in Figure 75 (on page 103).
Total Immunization Expenditures $180,793,176
Campaigns $75,301,701
Routine Immunization only $105,491,475
Per Capita (Routine Only) $0.60
Per DTP3 child (Routine Only) $29
% Vaccines and supplies (Routine) 46.5%
% Government funding 57%
% Total health expenditures 2.0%
% Gov. health expenditures 19.9%
% GDP 0.048%
Total Shared Costs $54,662,109
% Shared health systems cost 23%
TOTAL $235,455,285

Comprehensive Multi-Year Plan | Immunization Program of Pakistan Chapter 4: Immunization Program Costing and Financing
57
4.2 Future resource requirements
4.2.1 Overview
Total resource requirement for 2014-2018 is estimated at 2.62 US$ billion as shown in Figure 34
below: SIA is expected to absorb 24% of resources and the remaining to be allocated to routine
immunization (including shared health system costs). The share of vaccines and logistics (for routine
immunization) amounts to 1.12 US$ billion (or 43% of total resource requirements.
Figure 34: Total resource requirements (2014-2018) by immunization system components - National
Category TOTAL
Vaccine Supply and Logistics (routine only) $1,124,125,441 43%
Service Delivery $378,723,741 14%
Advocacy and Communication $20,010,090 1%
Monitoring and Disease Surveillance $28,352,726 1%
Programme Management $67,379,934 3%
Supplemental Immunization Activities (SIA) $636,152,440 24%
Shared Health Systems Costs $357,356,215 14%
GRAND TOTAL $2,612,100,587 100%
Total resource requirements increase from 483 US$ million in 2014 up to 541 US$ million in 2018 as
shown in Figure 35 below:
Figure 35: Total resource requirements by immunization system components and years
$0
$100,000,000
$200,000,000
$300,000,000
$400,000,000
$500,000,000
$600,000,000
2014 2015 2016 2017 2018
Vaccine Supply and Logistics (routine) Service Delivery Advocacy and Communication
Monitoring and Disease Surveillance Programme Management SIAs
Shared Health Systems Costs
Annual resource requirements increase mainly due to the cost of vaccines and logistics (introduction
of Rota and expected upgrade of vaccine storage and cold chain).
Resource requirements by major components and provinces are presented in details in Figure 76 (on
page 104) and Figure 77(on page 105): Routine immunization (recurrent costs) vary from 49.9% in
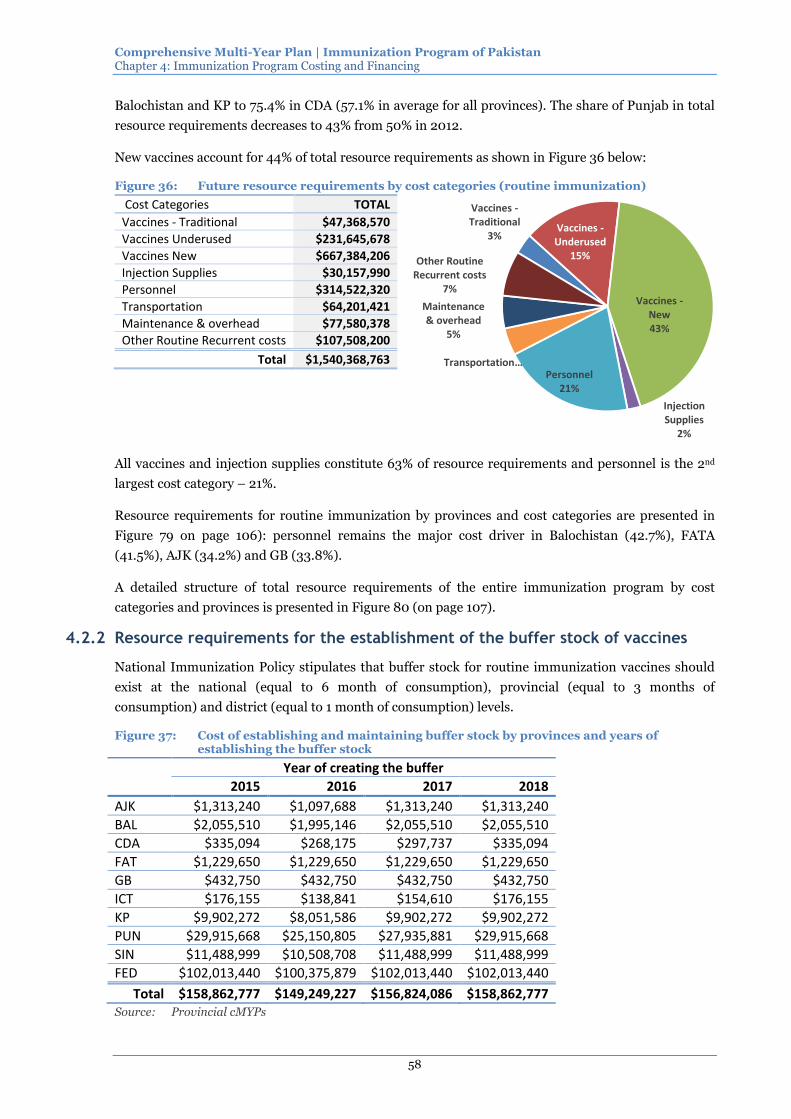
Comprehensive Multi-Year Plan | Immunization Program of Pakistan Chapter 4: Immunization Program Costing and Financing
58
Balochistan and KP to 75.4% in CDA (57.1% in average for all provinces). The share of Punjab in total
resource requirements decreases to 43% from 50% in 2012.
New vaccines account for 44% of total resource requirements as shown in Figure 36 below:
Figure 36: Future resource requirements by cost categories (routine immunization)
Cost Categories TOTAL
Vaccines - Traditional $47,368,570
Vaccines Underused $231,645,678
Vaccines New $667,384,206
Injection Supplies $30,157,990
Personnel $314,522,320
Transportation $64,201,421
Maintenance & overhead $77,580,378
Other Routine Recurrent costs $107,508,200
Total $1,540,368,763
Vaccines -Traditional
3%Vaccines -Underused
15%
Vaccines -New43%
Injection Supplies
2%
Personnel21%
Transportation…
Maintenance & overhead
5%
Other Routine Recurrent costs
7%
All vaccines and injection supplies constitute 63% of resource requirements and personnel is the 2nd
largest cost category – 21%.
Resource requirements for routine immunization by provinces and cost categories are presented in
Figure 79 on page 106): personnel remains the major cost driver in Balochistan (42.7%), FATA
(41.5%), AJK (34.2%) and GB (33.8%).
A detailed structure of total resource requirements of the entire immunization program by cost
categories and provinces is presented in Figure 80 (on page 107).
4.2.2 Resource requirements for the establishment of the buffer stock of vaccines
National Immunization Policy stipulates that buffer stock for routine immunization vaccines should
exist at the national (equal to 6 month of consumption), provincial (equal to 3 months of
consumption) and district (equal to 1 month of consumption) levels.
Figure 37: Cost of establishing and maintaining buffer stock by provinces and years of establishing the buffer stock
Year of creating the buffer
2015 2016 2017 2018
AJK $1,313,240 $1,097,688 $1,313,240 $1,313,240
BAL $2,055,510 $1,995,146 $2,055,510 $2,055,510
CDA $335,094 $268,175 $297,737 $335,094
FAT $1,229,650 $1,229,650 $1,229,650 $1,229,650
GB $432,750 $432,750 $432,750 $432,750
ICT $176,155 $138,841 $154,610 $176,155
KP $9,902,272 $8,051,586 $9,902,272 $9,902,272
PUN $29,915,668 $25,150,805 $27,935,881 $29,915,668
SIN $11,488,999 $10,508,708 $11,488,999 $11,488,999
FED $102,013,440 $100,375,879 $102,013,440 $102,013,440
Total $158,862,777 $149,249,227 $156,824,086 $158,862,777 Source: Provincial cMYPs

Comprehensive Multi-Year Plan | Immunization Program of Pakistan Chapter 4: Immunization Program Costing and Financing
59
Cost of the implementation of this policy varies between 149 and 159 million US$.
If the buffer stock is established in 2015 at all levels, 118.8 million US$ has to be allocated to procure
the necessary volume of vaccines and injection supplies (see Figure 71 on page 87); next year spending
on keeping the buffer stock at the required level is minimal – 206 thousand US$, however the
resource requirement increases in 2017 and 2018 ($22.9 and $16.9 million US$ respectively).
Establishment of the buffer stock only at the federal level requires financing of 71.3 million US$ in
2015 followed by 31.7 million US$ to maintain the buffer at the desired level in 2016-2018.
4.3 Future financing and funding gaps of the immunization program
Total financing of the immunization program is estimated at 1.32 US$ billion if only secured financing
is considered and at 2.12 US$ billion with probable financing.
Figure 38: Financing structure by sources and types of financing
Secured financing Probable financing
Provincial Government
47.90%
Gov. Co-Financing of
GAVI Vaccine2.63%
UNICEF0.25%
WHO0.92%
World Bank
0.00%
PEI15.12%
Gov't of China0.41%
USAID0.18%
Federal Government
12.16%
GAVI (ISS , NVS, HSS)
20.15%
Others (CDC, CIDA, JICA,
DFID, Rotary Int.)
0.29%
Provincial Government
3%
Gov. Co-Financing of
GAVI Vaccine
5%UNICEF
5%WHO
4%
World Bank 3%
PEI11%
Federal Government
2%
GAVI (ISS , NVS, HSS)
66%
Others (CDC, CIDA, JICA,
DFID, Rotary Int.)1%
63% of secured financing comes from the government, followed by GAVI (20%) and PEI (15%) as
shown in Figure 38 above. GAVI accounts for 66% of probable financing followed by PEI (11%),
UNICEF (5%), Government (co-financing – 5%) and WHO (4%). Financing of the immunization
program by provinces is presented in Figure 81 (on page 108).
As shown in Figure 82 (on page 109) financing projection reaches maximum in 2015 (478 US$
million) and decreases gradually (due to uncertainty about external funding) while resource
requirements keeps growing. This translates into widening funding gap from 10% (49 US$ million) in
2014 to 23% (124 US$ million) in 2018 as presented in Figure 39 below:
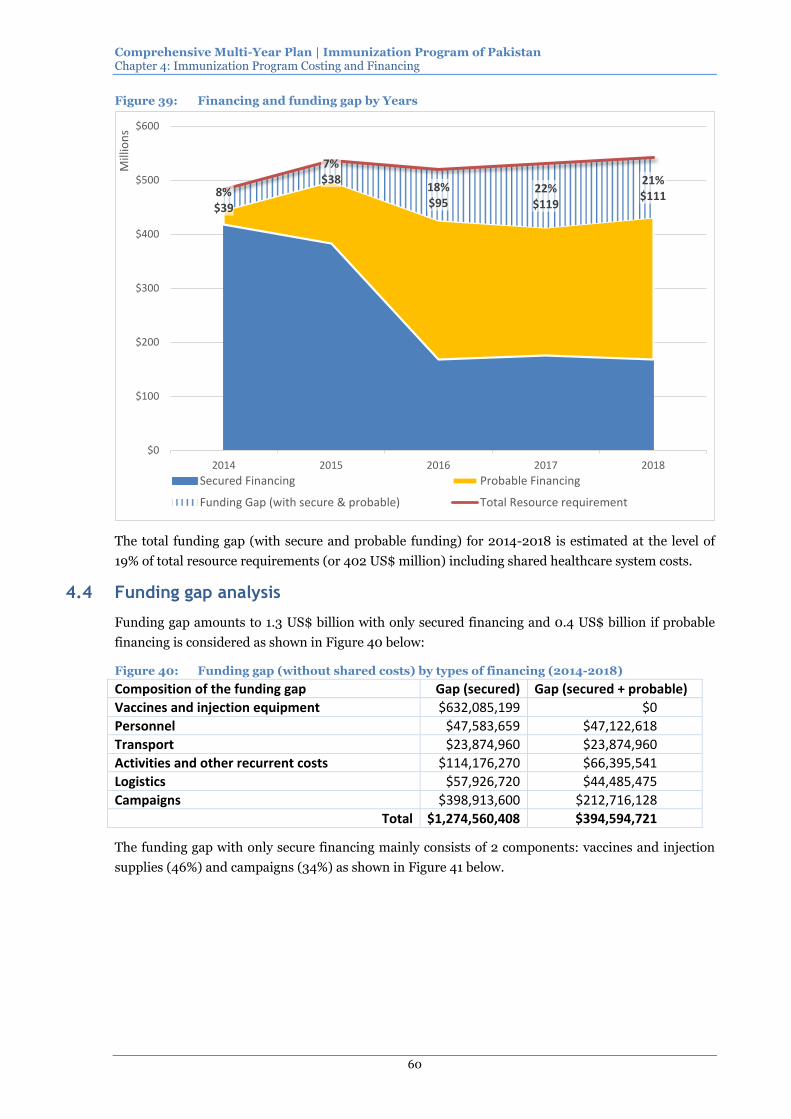
Comprehensive Multi-Year Plan | Immunization Program of Pakistan Chapter 4: Immunization Program Costing and Financing
60
Figure 39: Financing and funding gap by Years
8%$39
7%$38
18%$95
22%$119
21%$111
$0
$100
$200
$300
$400
$500
$600
2014 2015 2016 2017 2018
Mill
ion
s
Secured Financing Probable Financing
Funding Gap (with secure & probable) Total Resource requirement
The total funding gap (with secure and probable funding) for 2014-2018 is estimated at the level of
19% of total resource requirements (or 402 US$ million) including shared healthcare system costs.
4.4 Funding gap analysis
Funding gap amounts to 1.3 US$ billion with only secured financing and 0.4 US$ billion if probable
financing is considered as shown in Figure 40 below:
Figure 40: Funding gap (without shared costs) by types of financing (2014-2018)
Composition of the funding gap Gap (secured) Gap (secured + probable)
Vaccines and injection equipment $632,085,199 $0
Personnel $47,583,659 $47,122,618
Transport $23,874,960 $23,874,960
Activities and other recurrent costs $114,176,270 $66,395,541
Logistics $57,926,720 $44,485,475
Campaigns $398,913,600 $212,716,128
Total $1,274,560,408 $394,594,721
The funding gap with only secure financing mainly consists of 2 components: vaccines and injection
supplies (46%) and campaigns (34%) as shown in Figure 41 below.

Comprehensive Multi-Year Plan | Immunization Program of Pakistan Chapter 4: Immunization Program Costing and Financing
61
Figure 41: Structure of the funding gap by types of financing (national, 2014-2018)
Secured financing Secured + Probable financing
Vaccines and injection
equipment50%
Personnel4%
Transport2%
Activities and other
recurrent costs9%
Logistics4%
Campaigns31%
Personnel12%
Transport6%
Activities and other
recurrent costs17%
Logistics11%
Campaigns54%
Probable financing allows to fill the vaccine and injection supply component of the funding gap
completely – it is related to the success of application to GAVI for Rota.
The share of campaigns in the funding gap increases (up to 54%) when probable funding is considered
although in absolute terms the gap decreases from 398.9 US$ million to 212.7 US$ million (due to 186
US$ million probable financing for campaigns).
Funding gap related to personnel and transport remain unaffected with probable financing (in
absolute terms) resulting in the increase of its share in the funding gap structure (12% and 6%
correspondingly).
Funding gap structure by type of financing and provinces is presented in Figure 83 and Figure 84 on
page 112. It shows that probable funding is sufficient to fill the funding gap for routine immunization
in Balochistan and Punjab.
Probable financing allows to fill half of the funding gap related activities and other routine costs,
however its share in the funding gap increases from 9% (with secure financing only) to 17% (with
probable financing). Further breakdown of this component (see Figure 85 on page 112) shows that:
24.6 US$ million funding gap (or 44% of this component cost) is related to cold chain maintenance
and overhead (affecting mostly Sindh – 15.2 US$ million and KP – 6.4 US$ million). The program
management is the second largest element – 16.7 US$ million (30%).
Figure 42: Breakdown of “Activities and other reccurent costs” funding gap by cost categories and types of financing
Secured financing Probable financing % of resource requirement
Cold chain maintenance and overheads $35,673,371 31% $24,609,924 37% 36%
Maintenance of other capital equipment $469,910 0% $305,419 0% 35%
Building overheads (electricity, water…) $5,272,783 5% $1,008,696 2% 12%
Short-term training $19,813,708 17% $5,272,517 8% 25%
IEC/social mobilization $6,461,178 6% $5,149,379 8% 26%
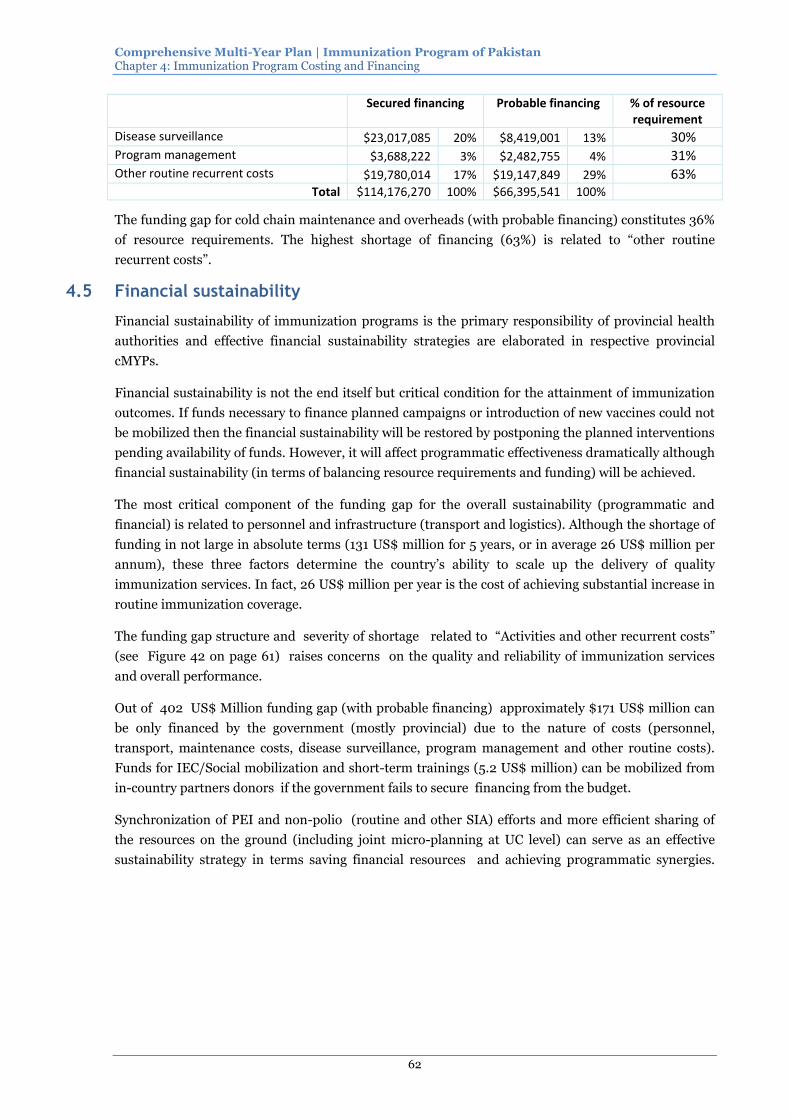
Comprehensive Multi-Year Plan | Immunization Program of Pakistan Chapter 4: Immunization Program Costing and Financing
62
Secured financing Probable financing % of resource requirement
Disease surveillance $23,017,085 20% $8,419,001 13% 30%
Program management $3,688,222 3% $2,482,755 4% 31%
Other routine recurrent costs $19,780,014 17% $19,147,849 29% 63%
Total $114,176,270 100% $66,395,541 100%
The funding gap for cold chain maintenance and overheads (with probable financing) constitutes 36%
of resource requirements. The highest shortage of financing (63%) is related to “other routine
recurrent costs”.
4.5 Financial sustainability
Financial sustainability of immunization programs is the primary responsibility of provincial health
authorities and effective financial sustainability strategies are elaborated in respective provincial
cMYPs.
Financial sustainability is not the end itself but critical condition for the attainment of immunization
outcomes. If funds necessary to finance planned campaigns or introduction of new vaccines could not
be mobilized then the financial sustainability will be restored by postponing the planned interventions
pending availability of funds. However, it will affect programmatic effectiveness dramatically although
financial sustainability (in terms of balancing resource requirements and funding) will be achieved.
The most critical component of the funding gap for the overall sustainability (programmatic and
financial) is related to personnel and infrastructure (transport and logistics). Although the shortage of
funding in not large in absolute terms (131 US$ million for 5 years, or in average 26 US$ million per
annum), these three factors determine the country’s ability to scale up the delivery of quality
immunization services. In fact, 26 US$ million per year is the cost of achieving substantial increase in
routine immunization coverage.
The funding gap structure and severity of shortage related to “Activities and other recurrent costs”
(see Figure 42 on page 61) raises concerns on the quality and reliability of immunization services
and overall performance.
Out of 402 US$ Million funding gap (with probable financing) approximately $171 US$ million can
be only financed by the government (mostly provincial) due to the nature of costs (personnel,
transport, maintenance costs, disease surveillance, program management and other routine costs).
Funds for IEC/Social mobilization and short-term trainings (5.2 US$ million) can be mobilized from
in-country partners donors if the government fails to secure financing from the budget.
Synchronization of PEI and non-polio (routine and other SIA) efforts and more efficient sharing of
the resources on the ground (including joint micro-planning at UC level) can serve as an effective
sustainability strategy in terms saving financial resources and achieving programmatic synergies.

Comprehensive Multi-Year Plan | Immunization Program of Pakistan
63
5 Annexes

Comprehensive Multi-Year Plan | Immunization Program of Pakistan Chapter 5: Annexes
64
Annex 1: Statistical and technical details
Figure 43: Description of provinces by administrative structure and target population (2012)
Provinces
Number of: Average Population
Per UC Districts UC Birth
cohort Surviving
infants Pregnant
women Total
Population
AJK 10 203 145,471 134,270 148,381 4,156,319 20,474
BAL 30 607 290,347 267,990 296,154 8,295,628 13,667
CDA 1 16 31,806 29,357 32,443 908,754 56,797
FAT 14 416 150,561 138,967 153,572 4,301,732 10,341
GB 7 110 45,011 41,816 45,912 1,286,039 11,691
ICT 1 12 16,536 15,263 16,867 472,454 39,371
KP 25 1,040 907,543 854,906 925,694 25,929,799 24,932
PUN 36 3,520 3,218,012 2,970,225 3,282,373 91,943,208 26,120
SIN 23 1,166 1,373,099 1,267,471 1,400,561 39,231,406 33,646
Total 147 7,090 6,178,386 5,720,265 6,301,956 176,525,339 24,898 Source: Provincial cMYP (situational analysis tools and cMYP Costing Tools)
Figure 44: Population projections by sources: NISP and provincial cMYPs
01. NISP
2012 2014 2018 2012 2014 2018 2012 2014 2018 2012 2014 2018
Pakistan 172,825,579 179,032,927 192,124,481 6,048,895 6,266,152 6,724,357 5,583,130 5,802,457 6,226,754 6,169,873 6,391,475 6,858,844
Punjab 91,943,208 95,245,517 102,210,224 3,218,012 3,333,593 3,577,358 2,970,225 3,086,907 3,312,633 3,282,373 3,400,265 3,648,905
Sindh 39,231,406 40,640,474 43,612,257 1,373,099 1,422,417 1,526,429 1,267,371 1,317,158 1,413,473 1,400,561 1,450,865 1,556,958
KP 22,985,802 23,811,379 25,552,556 804,503 833,398 894,339 742,556 771,727 828,158 820,593 850,066 912,226
Bstan 8,295,628 8,593,580 9,221,975 290,347 300,775 322,769 267,990 278,518 298,884 296,154 306,791 329,225
FATA 3,802,163 3,938,724 4,226,739 133,076 137,855 147,936 122,829 127,654 136,989 135,737 140,612 150,895
AJK 3,629,337 3,759,691 4,034,614 127,027 131,589 141,211 117,246 121,852 130,762 129,567 134,221 144,036
GB 1,555,430 1,611,296 1,729,120 54,440 56,395 60,519 50,248 52,222 56,041 55,529 57,523 61,730
ICT/CDA 1,382,605 1,432,263 1,536,996 48,391 50,129 53,795 44,665 46,420 49,814 49,359 51,132 54,871
02. cMYP
2012 2014 2018 2012 2014 2018 2012 2014 2018 2012 2014 2018
Pakistan 178,341,452 185,423,671 200,473,409 6,241,951 6,489,828 7,016,569 5,778,564 6,027,786 6,526,178 6,366,790 6,619,625 7,156,901
Punjab 91,943,208 95,245,517 102,210,222 3,218,012 3,333,593 3,577,358 2,970,225 3,086,907 3,312,633 3,282,373 3,400,265 3,648,905
Sindh 39,231,406 40,640,474 43,612,256 1,373,099 1,422,417 1,526,429 1,267,371 1,317,158 1,413,473 1,400,561 1,450,865 1,556,958
KP 25,929,799 27,375,547 30,513,367 907,543 958,144 1,067,968 854,905 905,446 1,017,773 925,694 977,307 1,089,327
Bstan 8,295,628 8,593,581 9,221,975 290,347 300,775 322,769 267,990 278,518 298,884 296,154 306,791 329,225
FATA 4,156,319 4,359,068 4,794,718 145,471 152,567 167,815 134,270 141,277 155,397 148,381 155,619 171,171
AJK 4,156,319 4,359,068 4,794,718 145,471 152,567 167,815 134,270 141,277 155,397 148,381 155,619 171,171
GB 4,156,319 4,359,068 4,794,718 145,471 152,567 167,815 134,270 141,277 155,397 148,381 155,619 171,171
ICT/CDA 472,454 491,348 531,434 16,536 17,197 18,600 15,263 15,925 17,224 16,867 17,541 18,972
Total Population Live Birth Surviving Infants Pregnant Women
Total Population Live Birth Surviving Infants Pregnant Women
Figure 45: School enrollment by levels of education and gender (2010-12)
School enrollment indicators 2010 2011 2012
School enrollment, primary (% gross): 94.8 92.3 92.9
Female 87.0 85.1 86.3
Male 102.0 98.9 99.0
School enrollment, primary (% net): 74.0 72.0 72.5
Female 67.9 66.4 67.3
Male 79.6 77.2 77.2
Primary completion rate, total (% of relevant age group): 66.9 66.6 71.9
Female 60.3 60.1 66.1

Comprehensive Multi-Year Plan | Immunization Program of Pakistan Chapter 5: Annexes
65
School enrollment indicators 2010 2011 2012
Male 73.1 72.7 77.2
Adjusted net enrollment rate, primary (% of primary school age children): 74.0 72.0 72.5
Female 67.9 66.4 67.3
Male 79.6 77.2 77.2
School enrollment, secondary (% net) 34.5 36.1
Female 29.6 30.6
Male 39.2 41.3
School enrollment, tertiary (% gross) 8.3 9.5
Female 8.0 9.3
Male 8.6 9.7
Source: The World Bank (2014)
Definition of indicators:
School enrollment, primary (% gross)
Total is the total enrollment in primary education, regardless of age, expressed as a percentage of the population of official primary education age.
School enrollment, primary (% net) Total is the ratio of children of the official primary school age who are enrolled in primary school to the total population of the official primary school age.
Primary completion rate, total (% of relevant age group)
Total is the total number of new entrants in the last grade of primary education, regardless of age, expressed as percentage of the total population of the theoretical entrance age to the last grade of primary. This indicator is also known as "gross intake rate to the last grade of primary."
Adjusted net enrollment rate, primary (% of primary school age
children)
Adjusted net enrollment is the number of pupils of the school-age group for primary education, enrolled either in primary or secondary education, expressed as a percentage of the total population in that age group.
School enrollment, secondary (% net)
Total is the ratio of children of the official secondary school age who are enrolled in secondary school to the population of the official secondary school age.
School enrollment, tertiary (% gross)
Total is the total enrollment in tertiary education (ISCED 5 and 6), regardless of age, expressed as a percentage of the total population of the five-year age group following on from secondary school leaving.
Figure 46: Poverty indicators
2006 2008
Poverty headcount ratio at $2 a day (PPP) (% of population) 60.98 60.19
Poverty headcount ratio at $1.25 a day (PPP) (% of population) 22.58 21.04
Poverty gap35 at $2 a day (PPP) (%) 18.78 17.94
Poverty gap at $1.25 a day (PPP) (%) 4.06 3.49
GINI index36 32.74 30.02
Poverty headcount ratio at national poverty line (% of population) 22.3
Poverty headcount ratio at rural poverty line (% of rural population) 27
Poverty headcount ratio at urban poverty line (% of urban population) 13.1
Source: The World Bank 2014
35 Poverty gap is the mean shortfall from the poverty line (counting the nonpoor as having zero shortfall),
expressed as a percentage of the poverty line. This measure reflects the depth of poverty as well as its incidence.
36 GINI index measures the extent to which the distribution of income or consumption expenditure among individuals or households within an economy deviates from a perfectly equal distribution. A Gini index of 0 represents perfect equality, while an index of 100 implies perfect inequality.

Comprehensive Multi-Year Plan | Immunization Program of Pakistan Chapter 5: Annexes
66
Figure 47: District wise incidence of poverty (headcount ratio)
Source: SDPI
Figure 48: Federal government expenditures and revenues (in million PKR)
2009-10 2010-11 2011-12 2012-13 2013-14
Expenditures
I Revenue Expenditure 2,333,701 2,498,582 2,589,746 3,233,905 3,691,581
I.A Current Expenditure 2,017,255 2,295,921 2,209,324 2,803,621 3,196,083
Health services 6,743 7,455 7,811 9,512 9,863
I.B Development Expenditure 316,446 202,661 380,422 430,284 495,498
II Capital Disbursement 243,319 179,549 203,886 591,800 535,246
Total Expenditures 2,577,020 2,678,131 2,793,632 3,825,705 4,226,827
Current Expenditure as % of total 86.44% 91.89% 85.31% 86.69% 86.58%
Health service as % of current expenditure 0.33% 0.32% 0.35% 0.34% 0.31%
Revenues
I.A Revenue receipts (net) 1,396,670 1,238,200 1,334,297 1,560,351 1,917,708
I.B Internal Resources 375,690 520,299 527,570 442,310 734,609
I.C External resources 381,175 131,878 128,650 -1,676 130,458
Loans 450,218 254,720 229,010 187,094 467,437
Grants 127,768 35,103 34,930 29,102 29,782
Less repayment -196,811 -157,945 -135,290 -217,872 -366,761
I. Total Receipts 2,153,535 1,890,377 1,990,517 2,000,985 2,782,775
II Change in provincial cash balance 77,568 119,805 -37,290 -62,172 23,101
III Privatization Proceeds 79,200
IV Credit from Banking System 89,110 452,219 711,670 1,508,487 974,987
Total Resources 2,320,213 2,462,401 2,664,897 3,447,300 3,860,063
Source: Monthly Statistical Bulletin February 2014, the State Bank of Pakistan
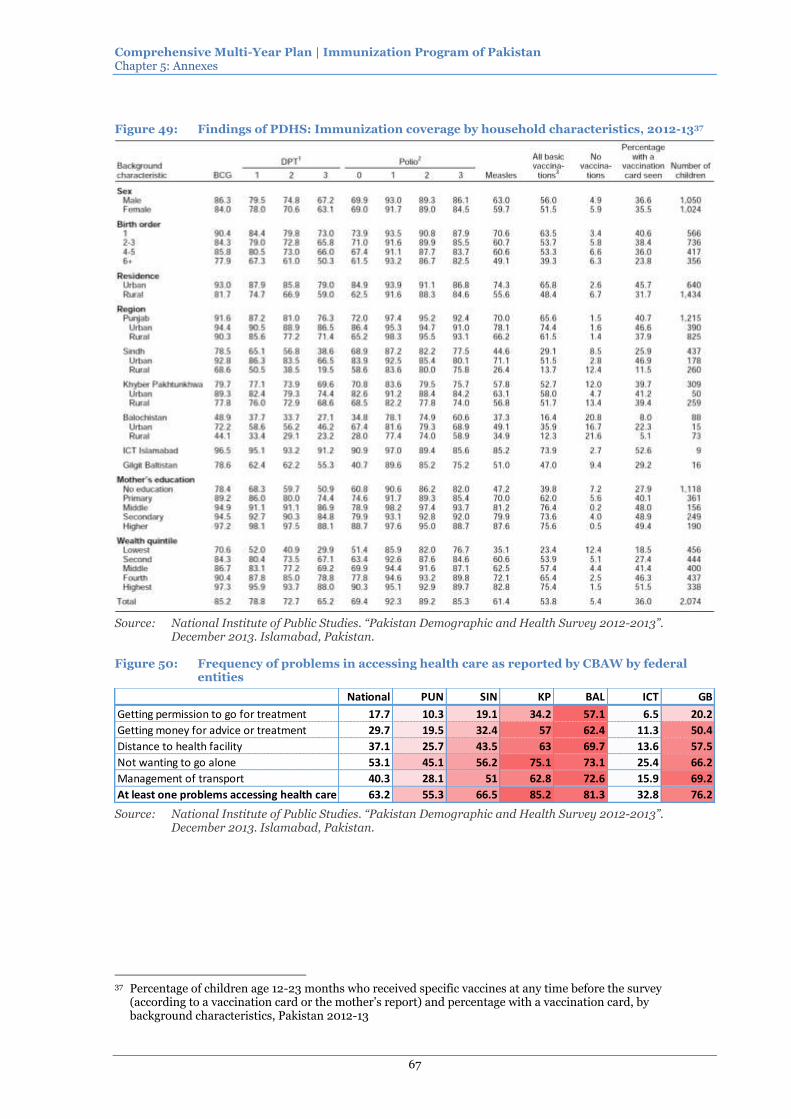
Comprehensive Multi-Year Plan | Immunization Program of Pakistan Chapter 5: Annexes
67
Figure 49: Findings of PDHS: Immunization coverage by household characteristics, 2012-1337
Source: National Institute of Public Studies. “Pakistan Demographic and Health Survey 2012-2013”.
December 2013. Islamabad, Pakistan.
Figure 50: Frequency of problems in accessing health care as reported by CBAW by federal entities
National PUN SIN KP BAL ICT GB
Getting permission to go for treatment 17.7 10.3 19.1 34.2 57.1 6.5 20.2
Getting money for advice or treatment 29.7 19.5 32.4 57 62.4 11.3 50.4
Distance to health facility 37.1 25.7 43.5 63 69.7 13.6 57.5
Not wanting to go alone 53.1 45.1 56.2 75.1 73.1 25.4 66.2
Management of transport 40.3 28.1 51 62.8 72.6 15.9 69.2
At least one problems accessing health care 63.2 55.3 66.5 85.2 81.3 32.8 76.2 Source: National Institute of Public Studies. “Pakistan Demographic and Health Survey 2012-2013”.
December 2013. Islamabad, Pakistan.
37 Percentage of children age 12-23 months who received specific vaccines at any time before the survey
(according to a vaccination card or the mother’s report) and percentage with a vaccination card, by background characteristics, Pakistan 2012-13

Comprehensive Multi-Year Plan | Immunization Program of Pakistan Chapter 5: Annexes
68
Figure 51: Human resource for health by categories and years
Source: WHO EMRO regional database
Figure 52: Immunization coverage and inequity by years, Pakistan (PSLM)
2004-05 2005-06 2006-07 2007-08 2008-09 2010-11 2011-12
FIC - Based on record 49 49 50 51 51 53 56
FIC - Based on record and recall 77 71 76 73 78 81 80
Record Based
DTP3 50 53 53 55 51 56 58
DTP3 Urban 62 63 65 66 61 67 70
DTP3 Rural 43 49 48 51 47 51 53
OPV3 50 55 53 56 50 53 59
Measles 49 52 51 53 51 53 57
Recard and Recall based
DTP3 80 77 82 79 84 92 83
DTP3 Urban 89 89 90 88 93 83 90
DTP3 Rural 74 73 79 76 81 85 79
OPV3 81 96 84 93 81 79 96
Measles 78 76 77 76 79 82 81
Wealth inequity - FIC (Record based)
1st Quintile 40 41
5th Quintile 70 82
Inequity 30 41 Source: PSLM Reports, Pakistan Bureau of Statistics
Figure 53: FIC by years and provinces (PSLM)
1999-91 2001-02 2003-04 2004-05 2005-06 2006-07 2007-08 2008-09 2010-11 2011-12
Pakistan 75 53 77 71 76 73 78 81 80
Punjab 57 50 84 76 83 76 85 86 86
Sindh 45 73 71 65 67 69 75 71
KP 57 76 64 76 74 73 77 80
Balochistan 23 62 48 54 57 43 56 37
AJK 78 83 89 77 82 94 79 83
GB 64 79 68 68 77
FATA 80 Sources: Planning Commission, government of Pakistan. MDG Report 2013

Comprehensive Multi-Year Plan | Immunization Program of Pakistan Chapter 5: Annexes
69
Figure 54: FIC by Provinces, residence, gender, years and data collection methods
Based on record
Male Female Both Male Female Both Male Female Both
Urban 68 69 68 69 62 66 79 69 74
Rural 57 51 54 59 57 58 61 61 61
Overall 59 56 58 62 59 60 66 64 65
Urban 55 50 53 69 62 66 79 69 74
Rural 28 25 26 28 26 27 27 20 23
Overall 38 34 36 40 40 40 42 33 37
Urban 57 67 62 58 59 58 74 77 76
Rural 46 51 49 49 52 50 53 60 56
Overall 48 54 51 50 53 52 56 63 60
Urban 48 45 46 28 41 35 41 47 44
Rural 31 34 33 20 15 18 26 14 119
Overall 36 37 37 22 23 22 30 19 24
Urban 62 62 62 64 60 62 70 64 67
Rural 48 46 47 50 48 49 53 50 51
Overall 52 50 51 54 52 53 59 54 56
Based on recall and record
Male Female Both Male Female Both Male Female Both
Urban 83 84 83 89 83 86 89 85 87
Rural 78 68 73 87 85 86 85 88 86
Overall 79 73 76 87 84 86 86 87 86
Urban 83 76 0 83 87 85 91 89 90
Rural 64 55 59 70 64 67 55 58 56
Overall 71 62 67 74 75 77 82 77 80
Urban 87 74 74 81 86 84 60 78 69
Rural 65 78 72 77 77 77 82 76 79
Overall 69 80 74 78 77 77 82 77 89
Urban 75 74 74 81 86 84 60 78 69
Rural 47 52 50 45 45 45 37 23 29
Overall 55 58 57 55 56 56 42 32 37
Urban 83 81 82 86 84 85 89 85 87
Rural 71 67 69 80 77 79 77 76 77
Overall 75 71 73 82 79 81 81 79 80
Sindh
KP
Balochistan
National
2010-11 2011-12
2007-08 2010-11 2011-12
Punjab
Punjab
Sindh
KP
Balochistan
National
2007-08
Source: PSLM 2011-12 Report. Pakistan Bureau of Statistics
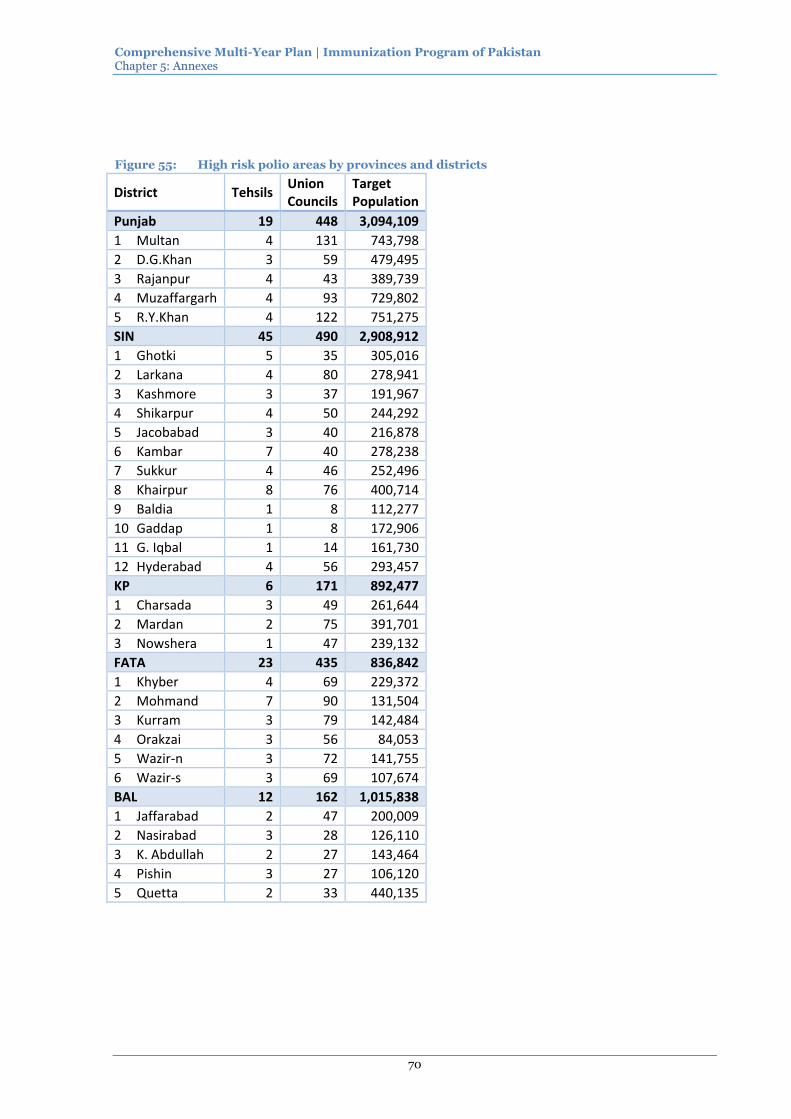
Comprehensive Multi-Year Plan | Immunization Program of Pakistan Chapter 5: Annexes
70
Figure 55: High risk polio areas by provinces and districts
District Tehsils Union Councils
Target Population
Punjab 19 448 3,094,109
1 Multan 4 131 743,798
2 D.G.Khan 3 59 479,495
3 Rajanpur 4 43 389,739
4 Muzaffargarh 4 93 729,802
5 R.Y.Khan 4 122 751,275
SIN 45 490 2,908,912
1 Ghotki 5 35 305,016
2 Larkana 4 80 278,941
3 Kashmore 3 37 191,967
4 Shikarpur 4 50 244,292
5 Jacobabad 3 40 216,878
6 Kambar 7 40 278,238
7 Sukkur 4 46 252,496
8 Khairpur 8 76 400,714
9 Baldia 1 8 112,277
10 Gaddap 1 8 172,906
11 G. Iqbal 1 14 161,730
12 Hyderabad 4 56 293,457
KP 6 171 892,477
1 Charsada 3 49 261,644
2 Mardan 2 75 391,701
3 Nowshera 1 47 239,132
FATA 23 435 836,842
1 Khyber 4 69 229,372
2 Mohmand 7 90 131,504
3 Kurram 3 79 142,484
4 Orakzai 3 56 84,053
5 Wazir-n 3 72 141,755
6 Wazir-s 3 69 107,674
BAL 12 162 1,015,838
1 Jaffarabad 2 47 200,009
2 Nasirabad 3 28 126,110
3 K. Abdullah 2 27 143,464
4 Pishin 3 27 106,120
5 Quetta 2 33 440,135

Comprehensive Multi-Year Plan | Immunization Program of Pakistan Chapter 5: Annexes
71
Figure 56: Ratio of vaccinators and SIS to total population and surviving infants (per 10,000) by provinces
0.00
0.50
1.00
1.50
2.00
2.50
AJK BAL FAT GB ICT CDA KP PUN SIN Pakistan
Vaccinators All SIS
Vaccinators All SIS Vaccinators All SIS
AJK 0.88 1.09 27.2 33.6
BAL 1.46 2.34 45.3 72.5
FAT 1.22 1.35 37.7 41.7
GB 0.87 1.21 26.8 37.1
ICT 0.44 0.57 13.8 17.7
CDA 0.13 0.58 4.1 18.1
KP 0.63 1.92 19.2 58.4
PUN 0.40 1.36 12.4 42.1
SIN 0.66 1.55 20.3 48.0
Pakistan 0.58 1.52 17.8 46.8
ProvincesPer surviving infantsPer population
Source: Provincial cMYPs
Figure 57: Structure of SIS (by medical staff categories) by provinces (2012)
0%
10%
20%
30%
40%
50%
60%
70%
80%
90%
100%
AJK BAL FAT GB ICT CDA KP PUN SIN National
Vaccinators Nurses Dispensers
Lady Health Visitors (LHVs) Medical Technicians (MT) Female Medical Technicians (FMT)
Mid-wives Lady Health Workers (LHWs) Other
Source: Provincial cMYPs
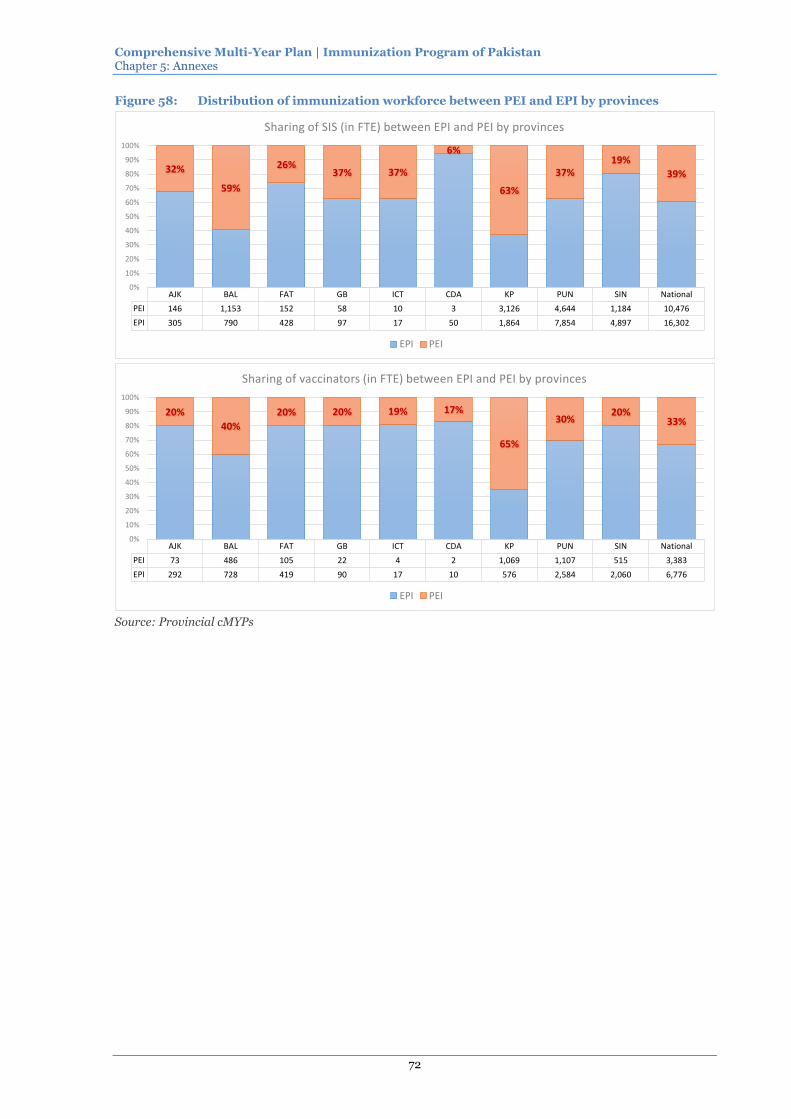
Comprehensive Multi-Year Plan | Immunization Program of Pakistan Chapter 5: Annexes
72
Figure 58: Distribution of immunization workforce between PEI and EPI by provinces
AJK BAL FAT GB ICT CDA KP PUN SIN National
PEI 146 1,153 152 58 10 3 3,126 4,644 1,184 10,476
EPI 305 790 428 97 17 50 1,864 7,854 4,897 16,302
32%
59%
26%37% 37%
6%
63%
37%19%
39%
0%
10%
20%
30%
40%
50%
60%
70%
80%
90%
100%
Sharing of SIS (in FTE) between EPI and PEI by provinces
EPI PEI
AJK BAL FAT GB ICT CDA KP PUN SIN National
PEI 73 486 105 22 4 2 1,069 1,107 515 3,383
EPI 292 728 419 90 17 10 576 2,584 2,060 6,776
20%
40%
20% 20% 19% 17%
65%
30%20%
33%
0%
10%
20%
30%
40%
50%
60%
70%
80%
90%
100%
Sharing of vaccinators (in FTE) between EPI and PEI by provinces
EPI PEI
Source: Provincial cMYPs

Comprehensive Multi-Year Plan | Immunization Program of Pakistan Chapter 5: Annexes
73
Figure 59: Selected healthcare financing indicators 1995-2011, Pakistan
Indicators 1995 1996 1997 1998 1999 2000 2001 2002 2003 2004 2005 2006 2007 2008 2009 2010 2011
External resources on health as % of THE 0.8 0.7 0.7 0.7 0.7 0.8 1.1 1.4 1.5 1.9 2.7 2.6 3.0 3.8 3.4 3.8 5.1
GGHE as % of THE 26.1 27.5 25.4 20.5 19.4 21.6 21.1 28.8 24.1 25.6 26.8 31.2 27.2 26.1 26.2 28.2 27.1
Private expenditure on health (PvtHE) as % of THE 73.9 72.5 74.6 79.5 80.6 78.4 78.9 71.2 75.9 74.4 73.2 68.8 72.8 73.9 73.8 71.8 72.9
GGHE as % of General government expenditure 2.7 2.9 2.8 2.4 2.4 2.4 2.4 3.0 2.8 3.0 3.1 3.5 3.2 3.2 3.3 3.4 3.6
Social security funds as % of GGHE 5.1 4.8 4.9 5.7 5.6 5.7 5.7 4.6 4.9 4.5 4.4 3.9 4.1 3.7 3.5 3.4 3.2
Out of pocket expenditure as % of PvtHE 97.7 97.7 97.7 81.9 82.3 80.6 78.0 78.0 80.2 81.3 81.4 82.0 85.3 87.5 88.8 88.0 86.6
Out of pocket expenditure as % of THE 72.2 70.8 72.9 65.1 66.3 63.2 61.6 55.5 60.9 60.5 59.5 56.4 62.1 64.7 65.5 63.2 63.2
THE per capita (in current US$) 15.2 15.1 14.8 15.6 15.7 15.0 13.1 14.9 15.8 17.7 19.2 21.7 26.1 28.9 26.3 28.0 29.6
THE per capita in PPP$ (PKR per US$) 47.5 50.7 50.7 55.4 58.6 49.6 47.6 51.8 51.9 56.1 59.7 63.8 74.1 83.7 74.4 74.5 68.9
GGHE per capita (in current US$) 3.9 4.1 3.8 3.2 3.0 3.2 2.8 4.3 3.8 4.5 5.1 6.7 7.1 7.5 6.9 7.9 8.0
GGHE per capita PPP$ (PKR per US$) 12.4 13.9 12.9 11.3 11.4 10.7 10.0 14.9 12.5 14.4 16.0 19.9 20.1 21.8 19.5 21.0 18.7
GGHE as % of GDP 0.9 0.9 0.9 0.7 0.7 0.7 0.6 0.9 0.7 0.7 0.7 0.9 0.8 0.9 0.8 0.8 0.7
OOPS / capita at exchange rate 11.0 10.7 10.8 10.1 10.4 9.4 8.1 8.3 9.6 10.7 11.4 12.2 16.2 18.7 17.3 17.7 18.7
In million PKR
Rest of the world funds / External resources 4.7 5.3 6.1 6.6 7.3 8.7 13.4 18.5 21.1 30.6 48.0 54.9 78.8 130.4 123.2 155.6 229.8
Total expenditure on health 611 712 814 968 1,095 1,159 1,199 1,340 1,399 1,611 1,808 2,108 2,607 3,410 3,667 4,145 4,522
General government expenditure on health 159 196 207 198 212 251 253 386 337 412 485 657 708 889 961 1,169 1,225
Ministry of Health 13.8 15.5 16.7 18.6 17.8 20.0 20.6 51.8 60.8 68.5 88.7 121.7 111.3 140.5 146.8 185.2 0.0
Social security funds 8.1 9.3 10.2 11.2 11.9 14.2 14.3 17.8 16.6 18.7 21.3 25.8 29.0 32.6 33.9 39.6 39.6
Private expenditure on health 452 517 607 769 883 908 947 954 1,062 1,199 1,323 1,451 1,898 2,521 2,706 2,976 3,298
Private insurance 1.0 1.1 1.3 1.4 1.6 2.1 2.4 2.4 2.6 3.1 3.7 4.2 4.7 5.2 6.9 8.1 10.1
Out of pocket expenditure 441 505 594 630 726 732 738 744 852 974 1,077 1,190 1,620 2,205 2,404 2,620 2,856
Gross Domestic Product 18,659 21,202 24,283 26,777 29,384 38,261 42,099 44,527 48,756 56,406 64,998 76,232 86,730 102,428 127,240 148,037 180,329
Final consumption expenditure of Households and Non-profit institutions serving households 13,514 15,452 18,182 19,297 22,240 28,840 32,111 33,299 36,010 41,847 50,015 57,202 65,438 78,353 103,381 121,889 151,600
General government expenditure 5,955 6,845 7,510 8,237 8,772 10,430 10,488 13,073 12,220 13,755 15,619 18,912 22,237 28,150 29,247 34,188 34,227
In million current US$
Rest of the world funds / External resources 15.0 15.0 15.0 15.0 15.0 16.0 22.0 31.0 37.0 53.0 81.0 91.0 130.0 185.0 151.0 183.0 266.0
Total expenditure on health 1,931 1,974 1,981 2,148 2,212 2,161 1,937 2,244 2,422 2,765 3,039 3,497 4,292 4,844 4,488 4,865 5,238
General government expenditure on health 503 542 503 440 429 467 408 647 583 708 816 1,090 1,166 1,263 1,176 1,372 1,418
Ministry of Health 44.0 43.0 40.0 41.0 36.0 37.0 33.0 87.0 105.0 118.0 149.0 202.0 183.0 200.0 180.0 217.0
Social security funds 26.0 26.0 25.0 25.0 24.0 26.0 23.0 30.0 29.0 32.0 36.0 43.0 48.0 46.0 41.0 46.0 46.0
Private expenditure on health 1,428 1,432 1,478 1,708 1,783 1,693 1,529 1,598 1,839 2,057 2,223 2,407 3,125 3,581 3,312 3,493 3,819
Private insurance 3.0 3.0 3.0 3.0 3.0 4.0 4.0 4.0 5.0 5.0 6.0 7.0 8.0 7.0 8.0 10.0 12.0
Out of pocket expenditure 1,394 1,398 1,444 1,399 1,467 1,365 1,192 1,246 1,475 1,672 1,809 1,974 2,666 3,132 2,942 3,076 3,308
Gross Domestic Product 58,968 58,766 59,066 59,443 59,361 71,319 67,981 74,554 84,424 96,821 109,213 126,482 142,793 145,478 155,716 173,764 208,851
Final consumption expenditure of Households and Non-profit institutions serving households
42,708 42,829 44,226 42,838 44,929 53,758 51,853 55,754 62,352 71,831 84,038 94,907 107,738 111,284 126,517 143,073 175,578
General government expenditure 18,821 18,973 18,268 18,286 17,722 19,441 16,937 21,890 21,160 23,610 26,244 31,377 36,610 39,982 35,793 40,129 39,641
Source: WHO GHED

Comprehensive Multi-Year Plan | Immunization Program of Pakistan Chapter 5: Annexes
74
Figure 60: The number of cases of VPD by years
VPD 1980 1982 1983 1984 1985 1986 1987 1988 1989 1990 1991 1992 1993 1994 1995 1996 1997 1998 1999 2000 2001 2002 2003 2004 2005 2006 2007 2008 2009 2010 2011 2012
Diphtheria 14,328 6,520 1,402 670 1,450 3,179 2,720 2,011 167 1,371 26 72 34 28 9 13 26 20 12 13 19 22 26 24 23 42 11 32 34 37 22 98
Measles 28,573 19,890 21,004 17,322 26,686 42,304 45,996 55,543 2,349 21,785 617 2,967 1,967 1,421 1,720 1,090 1,848 2,333 2,940 2,064 3,849 3,903 4,740 4,248 2,981 7,641 2,801 1,129 863 4,321 4,386 8,046
Pertussis 42,947 50,932 51,680 38,677 55,659 53,835 47,676 62,382 1,324 24,545 140 276 473 411 180 201 238 103 222 160 109 233 167 97 133 313 267 169 164 109 156 60
Polio 2,980 3,506 901 595 2,159 643 1,214 935 811 777 1,147 1,046 1,803 527 508 341 1,147 341 558 199 119 90 103 53 28 40 32 117 89 144 198 74
Rubella 189 483
Tetanus (neonatal) 1,085 907 881 535 576 1,064 2,300 1,971 1,449 1,067 1,430 1,737 1,685 1,842 1,580 2,012 2,053 1,918 1,555 1,380 1,107 935 812 551 518 548 586 809 781 508 505 320
Tetanus (total) 2,738 3,856 4,880 5,599 8,143 6,137 3,190 2,164 1,494 4,080 1,544 1,875 1,858 1,940 1,687 2,125 2,119 1,957 1,610 1,465 1,184 1,016 890 649 697 610 743 984 816 559 516 320
Source: WHO vaccine preventable diseases: monitoring system. 2013 global summary38
Figure 61: DTP3 coverage estimates by years ans sources, Pakistan (detailed)
1999 2000 2001 2002 2003 2004 2005 2006 2007 2008 2009 2010 2011 2012
DTP3 - Country Official Estimates 80 78 76 68 67 65 80 83 83 73 85 88 89 89
DTP3 - JRF Administrative coverage 76 69 71 67 72 86 88 73 88 99 93 94
DTP3 - WHO/UNICEF Estimates 58 62 65 68 67 65 80 83 83 69 76 86 80 81
DTP3 - Survey (PDHS) 59 69
FIC - Survey (PDHS) 47 54 Source: WHO, UNICEF, NISP
38 http://apps.who.int/immunization_monitoring/globalsummary/incidences?c=PAK

Comprehensive Multi-Year Plan | Immunization Program of Pakistan Chapter 5: Annexes
75
Figure 62: Immunization system performance - cold chain and transportation details by provinces (2012)
AJK BAL CDA FAT GB ICT KP PUN SIN National
7.1 Percentage of districts with a sufficient number of transport in working condition
70% (7) 0% (0) 100% (1) 100% (14) 100% (7) 100% (1) 50% (13) 25% (9) 100% (23) 0% (75)
7.2 Number of UC with vaccinators using transportation means for outreach 20 (10%) 0 (0%) 12 (75%) 132 (32%) 65 (59%) 12 (100%) 436 (42%) 3,378 (96%) 1,005 (89%) 5,060 (72%)
9.1 Number of UC with adequate numbers of appropriate and functional cold chain equipment vs. Number of UC with functioning health facilities
182 (90%) 420 (69%) 43 (269%) 180 (43%) 99 (90%) 12 (100%) 946 (91%) 2,841 (81%) 961 (86%) 5,684 (81%)
9.1. a) With ILR 122 (60%) 380 (63%) 18 (113%) 155 (37%) 88 (80%) 9 (75%) 930 (89%) 2,560 (73%) 630 (56%) 4,892 (69%)
9.1.b) With any kind of refrigerators 60 (30%) 40 (7%) 25 (156%) 25 (6%) 11 (10%) 3 (25%) 16 (2%) 281 (8%) 331 (29%) 792 (11%)
Source: Provincial cMYPs
Figure 63: Immunization system performance – service delivery details by provinces (2012)
AJK BAL CDA FAT GB ICT KP PUN SIN National
11. Number of functioning EPI Centers 352 474 43 180 117 18 994 3,343 1,458 6,979
11.1 Number of population per each EPI fixed sites 11,808 17,500 21,134 23,899 10,002 26,247 23,000 27,500 26,908 25,294
11.2 Proportion of area covered by immunization service to the total populated area 55% 80% 91%
11.3 Proportion of UC not having EPI centers 10%|21 37%|227 38%|6 57%|236 10%|11 0% 9%|94 19%|679 9%|101 13%|915
11.4 Proportion of UC not having Skilled Immunization Staff (SIS) 10%|21 0% 10%|11 0% 9%|94 4%|142 9%|101 7%|489
12.1 Share of immunization services delivered by EPI centers 80% 25% 43% 90% 20% 100%
12.2 Average time EPI Centers provide immunization service per day 6 6 6 6 6 6 8 6 6
Source: Provincial cMYPs
Figure 64: Immunization system performance – surveillance and reporting by provinces (2012)
AJK BAL CDA FAT GB ICT KP PUN SIN 13.1 Percentage of integrated VPD surveillance reports received at provincial level from districts compared to number of reports expected
13.1.a Timeliness 50% 30% 50% 50% 50% 50% 70% 70% 64% 13.1.b Completeness 100% 31% 100% 100% 100% 100% 90% 80% 94%
13.2 AFP detection rate/100,000 population under 15 year of age 2.30 5.10 2.40 1.96 4.40 6.30 7.50 5.70 7.00 13.3 % suspected measles cases for which a laboratory test was conducted 30% 11% 74% 30% 30% 20% 30% 3051 34% 13.4 Number of neonatal deaths for which a follow up investigation conducted 7 0 0 0 0 0 - - 13.5 Sentinel Surveillance for Rotavirus established No No No No No No No Yes Yes 13.6 Sentinel Surveillance for meningitis (Hib/PCV) established No No No No No No No - Yes 13.7 % of suspected meningitis cases tested for Hib/pneumococcal disease according to standard protocol 0% No 0% 0% 0% 0% No - - 14.1 % gap in match between DTP3 survey coverage and officially reported figures 36% 38% - - 1% 19% 12% 54% 15.1 % of districts (or UC?) that have been supplied with adequate (equal or more) number of AD syringes 100% 100% 100% 100% 100% 100% 100% 100% 100% 16.1 National AEFI System is Active with a designated national/provincial No No No No No No No No No 16.2 Number of serious AEFI cases reported and investigated No No No No No No No No No
Source: Provincial cMYPs
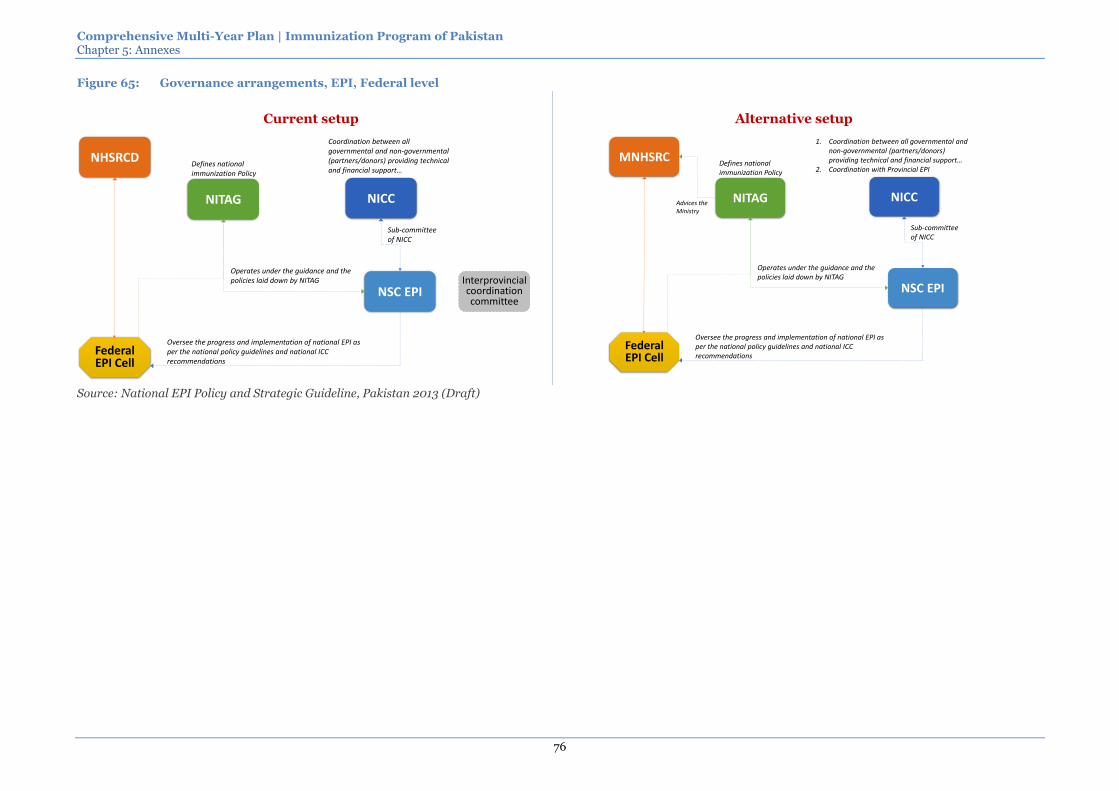
Comprehensive Multi-Year Plan | Immunization Program of Pakistan Chapter 5: Annexes
76
Figure 65: Governance arrangements, EPI, Federal level
Current setup Alternative setup
NHSRCD
Federal EPI Cell
NITAG NICC
NSC EPI
Sub-committee of NICC
Oversee the progress and implementation of national EPI as per the national policy guidelines and national ICC recommendations
Operates under the guidance and the policies laid down by NITAG Interprovincial
coordination committee
Defines national immunization Policy
Coordination between all governmental and non-governmental (partners/donors) providing technical and financial support…
MNHSRC
Federal EPI Cell
NITAG NICC
NSC EPI
Sub-committee of NICC
Oversee the progress and implementation of national EPI as per the national policy guidelines and national ICC recommendations
Operates under the guidance and the policies laid down by NITAG
Defines national immunization Policy
1. Coordination between all governmental and non-governmental (partners/donors) providing technical and financial support…
2. Coordination with Provincial EPI
Advices the Ministry
Source: National EPI Policy and Strategic Guideline, Pakistan 2013 (Draft)

Comprehensive Multi-Year Plan | Immunization Program of Pakistan Chapter 5: Annexes
77
Figure 66: Governance and administration schemes of EPI and PEI at the federal and provincial levels
NHSRCD
NITAG NICC
NSC EPI
Sub-committee of NICC
Oversee the progress and implementation of national EPI as per the national policy guidelines and national ICC recommendations
Operates under the guidance and the policies laid down by NITAG
Defines national immunization Policy
1. Coordination between all governmental and non-governmental (partners/donors) providing technical and financial support…
2. Coordination with Provincial EPI
Federal EPI Cell
Serves as a secretariat of NITAG
Advices the Ministry
Polio Cell at PM
Technical coordinator
(Senior full time officer)
National coordinator
National Program Manager
Bill Gates Foundation
WHO Polio
UNICEF
WB
PEI Partners National
Team Leader
Provincial EPI Cell
P-ICCP-MoH
DHO
DPEC
Provincial Task Force
SC PEI
Vaccinators
District supervisors
(AIC/UCMOs)
Vaccinator teams
Fe
de
ra
l
le
ve
lP
rov
inc
ial le
ve
lPrimer Minister’s
National Task Force
Senior Focal Person
UPEC
Polio Control room
Polio Control room
Polio Control room
Provincial Technical
Focal Person for NEAP

Comprehensive Multi-Year Plan | Immunization Program of Pakistan Chapter 5: Annexes
78
Annex 2: Summary of SWOT Analysis by Provinces
Strength Weaknesses Opportunities Threats
Sindh Low turnover of vaccinators
Service delivery infrastructure
Functional AFP surveillance
Information system available
EPI integrated in healthcare system
Insufficient number of fixed EPI centers
Mobility of vaccinators is compromised due to old motorcycles and increased fuel prices
Core EPI staff is overburdened and demotivated (at all levels)
Insufficient number of cold chain equipment – all kinds at all levels
Vaccines are not in provincial budget
Understaffed provincial EPI unit and no EPI technical staff at the district level
Significant difference in coverage figures between coverage program (administrative) data and survey results
Inadequate budget for routine expenses and delayed released of finances
Unknown status of community knowledge of and attitude toward immunization
Public-Public and Public-Private partnerships (for service delivery and community mobilization)
44% of population covered by LHWs
Mobile health in EPI service delivery successfully implemented in Karachi
Lack of political commitment
Political interference in staffing
Natural disasters
Security issues
Punjab Well-structured program
Trained HR (vaccinators, LHVs)
Regular EPI budget for salaries and overheads
Well placed infrastructure (for fixed and outreach)
Disease surveillance dashboard and AFP surveillance system
Substantial shortage of vaccinators
Demotivated vaccinators and EPI supervisors
Deficient and low quality outreach sessions
UC micro plans are not implemented
Deficient fixed sites in urban areas including slums particularly mega cities
Frequent polio SIAs
No proper warehouse at provincial and sub-provincial levels
Lack of vaccine management and weak vaccine supply and distribution system
Shortage of vehicles for distribution of vaccines
Lack of program ownership by decision makers
Understaffed Provincial EPI cell and lack of capacity among managerial staff
Weak monitoring and supervision system and inflated coverage data
Lack of awareness among community regarding immunization
Shortage of EPI funds
Huge network of health field staff (LHWs, H&N Supervisors, etc.)
Huge number of PEI workers moving house to house and PEI developed infrastructure for communication
Strong support of the development partners
Political interference particularly at district level
Illiteracy and poverty
Overreliance on donors (for vaccines, cold chain equipment, etc.)
Misconceptions in the community that polio vaccination protects children for all EPI diseases
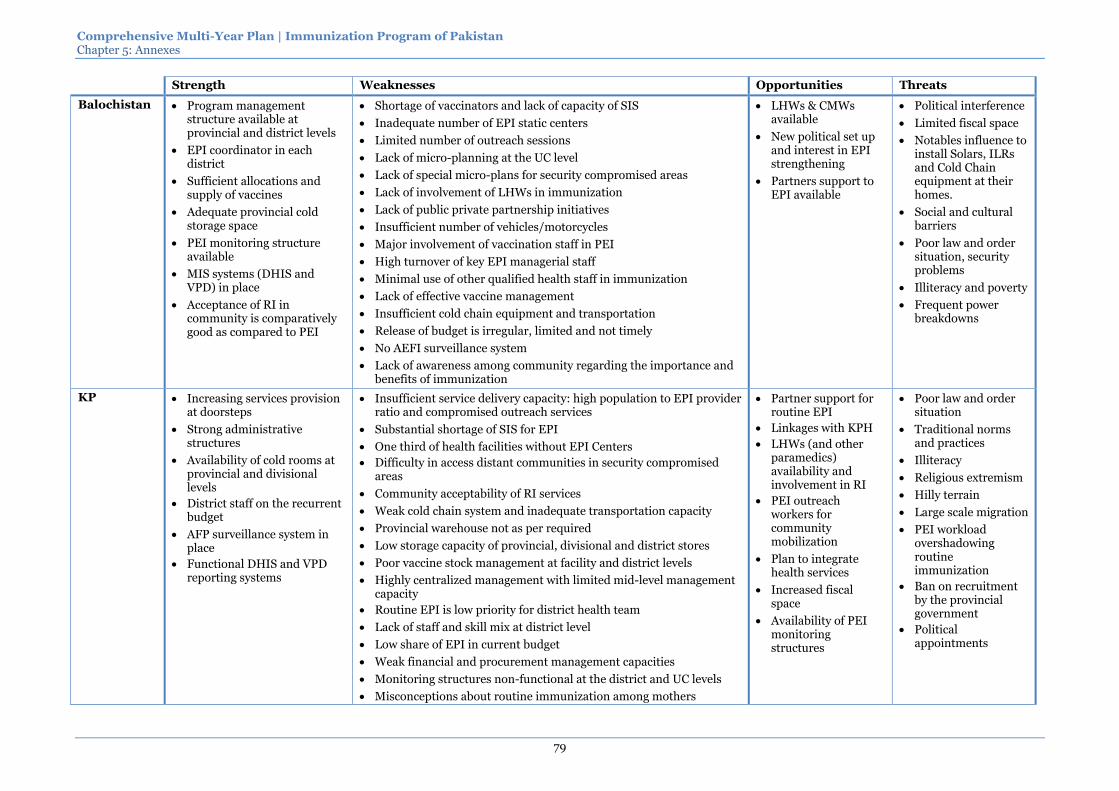
Comprehensive Multi-Year Plan | Immunization Program of Pakistan Chapter 5: Annexes
79
Strength Weaknesses Opportunities Threats
Balochistan Program management structure available at provincial and district levels
EPI coordinator in each district
Sufficient allocations and supply of vaccines
Adequate provincial cold storage space
PEI monitoring structure available
MIS systems (DHIS and VPD) in place
Acceptance of RI in community is comparatively good as compared to PEI
Shortage of vaccinators and lack of capacity of SIS
Inadequate number of EPI static centers
Limited number of outreach sessions
Lack of micro-planning at the UC level
Lack of special micro-plans for security compromised areas
Lack of involvement of LHWs in immunization
Lack of public private partnership initiatives
Insufficient number of vehicles/motorcycles
Major involvement of vaccination staff in PEI
High turnover of key EPI managerial staff
Minimal use of other qualified health staff in immunization
Lack of effective vaccine management
Insufficient cold chain equipment and transportation
Release of budget is irregular, limited and not timely
No AEFI surveillance system
Lack of awareness among community regarding the importance and benefits of immunization
LHWs & CMWs available
New political set up and interest in EPI strengthening
Partners support to EPI available
Political interference
Limited fiscal space
Notables influence to install Solars, ILRs and Cold Chain equipment at their homes.
Social and cultural barriers
Poor law and order situation, security problems
Illiteracy and poverty
Frequent power breakdowns
KP Increasing services provision at doorsteps
Strong administrative structures
Availability of cold rooms at provincial and divisional levels
District staff on the recurrent budget
AFP surveillance system in place
Functional DHIS and VPD reporting systems
Insufficient service delivery capacity: high population to EPI provider ratio and compromised outreach services
Substantial shortage of SIS for EPI
One third of health facilities without EPI Centers
Difficulty in access distant communities in security compromised areas
Community acceptability of RI services
Weak cold chain system and inadequate transportation capacity
Provincial warehouse not as per required
Low storage capacity of provincial, divisional and district stores
Poor vaccine stock management at facility and district levels
Highly centralized management with limited mid-level management capacity
Routine EPI is low priority for district health team
Lack of staff and skill mix at district level
Low share of EPI in current budget
Weak financial and procurement management capacities
Monitoring structures non-functional at the district and UC levels
Misconceptions about routine immunization among mothers
Partner support for routine EPI
Linkages with KPH
LHWs (and other paramedics) availability and involvement in RI
PEI outreach workers for community mobilization
Plan to integrate health services
Increased fiscal space
Availability of PEI monitoring structures
Poor law and order situation
Traditional norms and practices
Illiteracy
Religious extremism
Hilly terrain
Large scale migration
PEI workload overshadowing routine immunization
Ban on recruitment by the provincial government
Political appointments

Comprehensive Multi-Year Plan | Immunization Program of Pakistan Chapter 5: Annexes
80
Strength Weaknesses Opportunities Threats
AJK Availability of fixed EPI centers in high proportion of union councils
Separate management structure for immunization program at provincial level
Availability of fulltime dedicated EPI program manager at provincial level
All notified positions of vaccinator are filled
Negligible turnover of vaccinators
An extensive network of immunization system in place across AJK
PI staff is paid through non-recurrent annual budget
Continuity of funding for the existing staff through regular budget
Availability of functional cold chain equipment in a large majority of union councils
Proximity to Federal EPI Cell for collecting vaccines
Formal reporting system in place
A substantial number of health facilities operating without EPI services leading to high dependence on outreach immunization services
Poorly functioning outreach immunization services
EPI service provision limited to fixed centers
Difficulty in target setting for union councils
Lack of UC level micro planning
Lack of focus on dropout from vaccination
Low storage capacity for vaccine and other logistics
Inadequate planning for effective vaccine management
Inadequate transport facility for vaccinators
Inadequate refresher trainings for vaccinators
Paramedical staff not trained in immunization protocols
Poor capacity of provincial EPI office due absence of qualified technical staff for surveillance, monitoring and evaluation, cold chain management
Absence of bottom-up planning system (from UC upwards)
EPI not integrated with other MCH programs
No rationalization of operation expenditures by determining unit costs
No budget line item for vaccine procurement
Absence of feedback mechanism from provincial and district levels
Lack of staff qualified in surveillance
Irregular reporting from health facility level
No context specific communication strategy is available
Immunization staff not trained in social mobilization and communication
Lack of advocacy to policy makers and other stakeholders
AJK government’s initiative on developing an integrated approach in health service delivery
Support from external partners
New Government’s commitment towards immunization program
Presence of other paramedical staff (nurses, LHV, health technicians) for involvement in vaccination activities
Availability of multiple mechanism for communication (radio, TV, print media)
Public demand for establishing EPI centers
Escalation of border security issues across LoC
Natural disasters
Geographical landscape not suitable for maintaining a single warehouse for vaccine storage
Lack of involvement in broader policy processes can sideline immunization system
Political interference in staff relocation
Media hype created by incorrect reporting of morbidity and mortality by vaccine preventable diseases
Social barriers against immunization

Comprehensive Multi-Year Plan | Immunization Program of Pakistan Chapter 5: Annexes
81
Strength Weaknesses Opportunities Threats
FATA Immunization a recognized government responsibility
National immunization policy and schedule in place
Separate management structure for immunization program at provincial level
An extensive network of immunization system in place across FATA
Availability of established fixed EPI centers in all agencies and FRs
Availability of fulltime dedicated EPI program manager at provincial level
All notified positions of vaccinator are filled
Negligible turnover of vaccinators who are appointed on permanent basis
EPI staff is paid through non-recurrent annual budget
Continuity of funding for the existing staff through regular budget
Availability of functional cold chain equipment in a majority of union councils
A substantial number of health facilities operating without EPI services leading to high dependence on outreach immunization services
Poorly functioning outreach immunization services
EPI service provision limited to fixed centers
Difficulty in target setting for union councils
Lack of UC level micro planning
Lack of focus on dropout from vaccination
No human resource management policy
Poor capacity of EPI Office at FATA secretariat due to non-availability of qualified technical staff for surveillance, monitoring and evaluation, cold chain management
Paramedical staff not trained in immunization protocols
Inadequate refresher trainings for vaccinators
Program managers not formally trained in MLM trainings
Dependence upon a substantial number of vaccinators supported through GAVI
Weak planning and monitoring processes
Absence of bottom-up planning system (from UC upwards)
EPI not integrated with other MCH programs
EPI managers not trained in costing and financing
No rationalization of operation expenditures by determining unit costs
No budget line item for vaccine procurement
Low storage capacity for vaccine and other logistics at provincial level
Dependence on KPK for storage of vaccines
Inadequate planning for effective vaccine management
Inadequate transport facility for vaccinators
Inability to maintain or repair installed cold chain equipment due to the lack of technical capacity and/or adequate financing
Lack of staff qualified in surveillance
Irregular reporting from health facility level
Lack of validation of reported data
No context specific communication strategy is available
Availability of a large number of paramedical staff who can be trained in vaccination
Involvement of top political leadership in PEI
Support from external partners
Availability of multiple mechanism for communication (radio, TV, print media)
Involvement of political and religious leadership
Escalation of military conflicts
Hilly and difficult terrain
Precarious law and order situation
Limited availability of trained human resource
Limited fiscal space on account of dependence upon the Federal government
Donor fatigue
Community opposition to immunization especially against Polio
Media hype created by incorrect reporting of morbidity and mortality by vaccine preventable diseases
Social barriers against immunization
Frequent power breakdowns

Comprehensive Multi-Year Plan | Immunization Program of Pakistan Chapter 5: Annexes
82
Strength Weaknesses Opportunities Threats
GB Availability of established fixed EPI in all districts
90% EPI centers are functional
National immunization policy and schedule in place
Separate management structure for immunization program at provincial level
An extensive network of immunization system in place across GB
Availability of fulltime dedicated EPI program manager at provincial level
All notified positions of vaccinator are filled
Negligible turnover of vaccinators who are appointed on permanent basis
EPI staff is paid through non-recurrent annual budget
Continuity of funding for the existing staff through regular budget
Availability of functional cold chain equipment in a majority of union councils
A substantial number of health facilities operating without EPI services leading to high dependence on outreach immunization services
Poorly functioning outreach immunization services
EPI service provision limited to fixed centers
Poor capacity of provincial EPI office due absence of qualified technical staff for surveillance, monitoring and evaluation, cold chain management
Paramedical staff partially trained in immunization protocols
Inadequate refresher trainings for vaccinators
Program managers not formally trained in MLM trainings
Weak planning and monitoring processes
EPI not integrated with other MCH programs
EPI managers not trained in costing and financing
No rationalization of operation expenditures by determining unit costs
No budget line item for vaccine procurement
Low storage capacity for vaccine and other logistics at provincial level
Inadequate planning for effective vaccine management
Inadequate transport facility for vaccinators
Weak rationalization of POL for district staff
Lack of technical expertise for repair and maintenance
Lack of staff qualified in surveillance
Irregular reporting from health facility level
No context specific communication strategy is available
Immunization staff not trained in social mobilization and communication
Involvement of top political leadership in PEI
Involvement of top bureaucratic leadership in immunization activities
Support from external partners
Availability of a large number of paramedical staff who can be trained in vaccination
Natural disasters
Sensitive law and order situation due to sectarian conflicts
Escalation of sectarian conflicts
Hilly and difficult terrain
Limited availability of trained human resource
Limited fiscal space on account of dependence upon the Federal government
Donor fatigue
Frequent power breakdowns
Media hype created by incorrect reporting of morbidity and mortality by vaccine preventable diseases
Social barriers against immunization

Comprehensive Multi-Year Plan | Immunization Program of Pakistan Chapter 5: Annexes
83
Strength Weaknesses Opportunities Threats
ICT National immunization policy and schedule in place
Separate management structure for immunization program at provincial level
A network of immunization system in place across ICT
Self-initiative of developing tools for monitoring and supervision
Availability of fulltime dedicated EPI program manager at provincial level
All notified positions of vaccinator are filled
Negligible turnover of vaccinators who are appointed on permanent basis
Focus on long-term staff retention through recruitment of vaccinators from union councils of their residence
EPI staff is paid through recurrent annual budge
Availability of established fixed EPI centers in all union councils
100% EPI centers are functional
Small administrative unit and easy to manage
Availability of functional cold chain equipment in 100% union councils
Availability of up-to-date surveillance and reporting guidelines and standardized case definitions
60-65% population requires coverage through outreach immunization services
EPI service provision limited to fixed centers
Difficulty in target setting for union councils
Lack of focus on dropout from vaccination
Low storage capacity for vaccine and other logistics at district level
Inadequate planning for effective vaccine management
Inadequate transport facility for vaccinators
Lack of technical expertise for repair and maintenance
Use of Federal government’s HR policy in conflict with National EPI Policy for vaccinators recruitment
Poor capacity of provincial EPI office due absence of qualified technical staff for surveillance, monitoring and evaluation, cold chain management
Paramedical staff not trained in immunization protocols
Inadequate refresher trainings for vaccinators
Program managers not formally trained in MLM trainings
Weak planning and monitoring processes
Absence of annual development plans
Lack of continuity in bottom-up planning system (from UC upwards)
Tools for monitoring and supervision developed but not standardized
EPI not integrated with other MCH programs
EPI managers not trained in costing and financing
No rationalization of operation expenditures by determining unit costs
No budget line item for vaccine procurement
No use of surveillance data for program management
Absence of feedback mechanism from federal and district levels
Lack of staff qualified in surveillance
Irregular reporting from health facility level
Lack of validation of reported data
No context specific communication strategy is available
Immunization staff not trained in social mobilization and communication
Donor support for RED strategy
Availability of a large number of paramedical staff who can be trained in vaccination
Involvement of top political leadership in PEI
Presence of other paramedical staff for involvement in vaccination activities
Availability of space for constructing warehouse in government health facilities
Availability of multiple mechanism for communication (radio, TV, print media)
High literacy rates
Donor support
Limited fiscal space on account of dependence upon the Federal government
Frequent power breakdowns
Limited fiscal space on account of dependence upon the Federal government
Media hype created by incorrect reporting of morbidity and mortality by vaccine preventable diseases
Social barriers against immunization among population migrating from KPK
Sensitive law and order situation due to influx from KPK who are not registered in ICT
Seasonal migration from Murree and AJK 4-5 UCs for 4-5 months

Comprehensive Multi-Year Plan | Immunization Program of Pakistan Chapter 5: Annexes
84
Strength Weaknesses Opportunities Threats
CDA National immunization policy and schedule in place
Improvisation for developing a network of immunization system in place
Availability of established fixed EPI centers both in public and private sector
100% notified EPI centers are functional
Availability of functional cold chain equipment in 100% EPI centers
Availability of transport facility for vaccinators
Regularization of GAVI support EPI staff
Training of health care providers from other than CDA employees on immunization practices
Human resources available in private health sector
Availability of up-to-date surveillance and reporting guidelines and standardized case definitions
Absence of health centers in rural areas
EPI service provision in urban areas limited to fixed centers
Difficulty in target setting due to lack of information on actual population size
Lack of focus on dropout from vaccination
Low storage capacity for vaccine and other logistics at district level
Inadequate planning for effective vaccine management
Lack of technical expertise for repair and maintenance
Use of Federal government’s HR policy in conflict with National EPI Policy for vaccinators recruitment
Poor capacity of provincial EPI office due absence of qualified technical staff for surveillance, monitoring and evaluation, cold chain management
Absence of fulltime dedicated EPI coordinator at DHS level
25 vacant positions of vaccinators (out of 80 required)
Absence of EPI guidelines for private sector
Weak planning and monitoring processes
Absence of annual development plans
Weak management structure for immunization program
Program managers not formally trained in MLM trainings
EPI managers not trained in costing and financing
No rationalization of operation expenditures by determining unit costs
No budget line item for vaccine procurement
No use of surveillance data for program management
Absence of feedback mechanism from DHS to surveillance sites
Lack of staff qualified in surveillance
Irregular reporting from health facility level
Lack of validation of reported data
No context specific communication strategy is available
Immunization staff not trained in social mobilization and communication
Involvement of top bureaucratic leadership in immunization activities especially for PEI
Availability of space for constructing warehouse in government health facilities
Large private health sector and involvement of private healthcare providers in immunization
Availability of multiple mechanism for communication (radio, TV, print media)
High literacy rates
Donor support
Non-availability of LHWs in rural areas
Limited fiscal space for PHC activities
Frequent power breakdowns
Limited availability of services in CDA health centers
Media hype created by incorrect reporting of morbidity and mortality by vaccine preventable diseases
Seasonal migration from Murree and AJK for 4-5 months
Social barriers against immunization among population migrating from KPK
Source: Provincial cMYPs

Comprehensive Multi-Year Plan | Immunization Program of Pakistan Chapter 5: Annexes
85
Annex 3: Immunization program objectives and milestones
Figure 67: Immunization program outcome indicators with baseline and targets (2018) by federal entities39
Indicators AJK BAL CDA FAT GB ICT KP PUN SIN
2012 2018 2012 2018 2012 2018 2012 2018 2012 2018 2012 2018 2012 2018 2012 2018 2012 2018
1 Increase DTP3 coverage 65% 85% 27% 70% 87% 92% 44% 75% 55.3% 85% 91% 92% 70% 90% 76% 85% 39% 85%
2 Increase Measles 1 coverage 64.5% 82% 37% 65% 87% 90% 50% 73% 51% 80% 85% 90% 58% 80% 70% 80% 45% 80%
3 Increase the proportion of population protected at birth from neonatal tetanus
63.5% 80% 23% 50% 25% 55% 35% 60% 51.8% 70% 75% 80% 66% 80% 74% 85% 54% 65%
4 Increase OPV3 coverage 81.7% 85% 61% 70% 87% 92% 44% 75% 75.2% 85% 91% 92% 76% 95% 92% 85% 39% 85%
5 Increase PCV coverage - 80% - 70% 0% 92% 0% 75% 0% 85% 0% 92% 0% 90% 85% 0% 75%
6 Increase IPV coverage - 80% - 50% 92% 0% 75% 0% 85% 0% 92% 0% 75% 70% 0% 75%
7 Increase Rota coverage - 80% - 50% 92% 0% 75% 0% 85% 0% 85% 0% 80% 60% 0% 60%
8 Increase Hepatitis (birth dose) coverage
- 50% 0% 90% 70% 0 75%
9 Increase the proportion of fully immunized children
45.6% 70% 16 65% 75% 80% 50% 70% 47% 80% 73.9% 80% 80% 66% 77% 0% 80%
10 Improve geographical equity - % of districts(UC) that have at or above 80% DTP3 coverage
60% 80% 0 60% 36% 100% 7% 77% 0% 100% 100% 100% 53% 90% -- 61% 29% 75%
11 Improve socio-economic equity - difference in DTP3 coverage between the lowest and highest wealth quintiles
27% 10% - - - 25% 25% - 25% - 25% 43% 15% -- -- 33% 15%
12 Decrease drop-out rate - percentage point difference between DTP1 and DTP3 coverage
14.8% 4% 11% <10 12% 4% 13% 4% 7.1% 4% 10% 4% 10% 7% 11 <10 30% 8%
13 Increased demand - % of children whose mothers intend to vaccinate children
50% - 50% 25% 25% 25% 25% - 35% - 2% 26% -
Source: Provincial cMYPs
39 Symbols mean an increase/decrease in per cent points from the baseline value
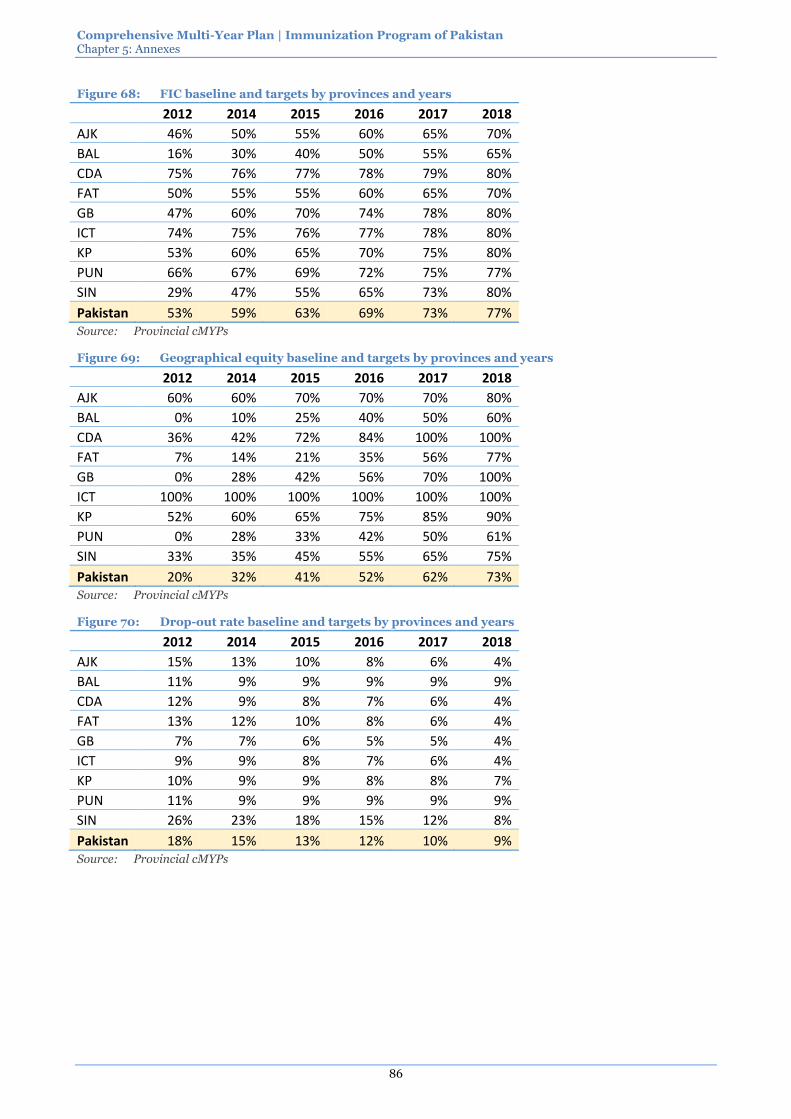
Comprehensive Multi-Year Plan | Immunization Program of Pakistan Chapter 5: Annexes
86
Figure 68: FIC baseline and targets by provinces and years
2012 2014 2015 2016 2017 2018
AJK 46% 50% 55% 60% 65% 70%
BAL 16% 30% 40% 50% 55% 65%
CDA 75% 76% 77% 78% 79% 80%
FAT 50% 55% 55% 60% 65% 70%
GB 47% 60% 70% 74% 78% 80%
ICT 74% 75% 76% 77% 78% 80%
KP 53% 60% 65% 70% 75% 80%
PUN 66% 67% 69% 72% 75% 77%
SIN 29% 47% 55% 65% 73% 80%
Pakistan 53% 59% 63% 69% 73% 77% Source: Provincial cMYPs
Figure 69: Geographical equity baseline and targets by provinces and years
2012 2014 2015 2016 2017 2018
AJK 60% 60% 70% 70% 70% 80%
BAL 0% 10% 25% 40% 50% 60%
CDA 36% 42% 72% 84% 100% 100%
FAT 7% 14% 21% 35% 56% 77%
GB 0% 28% 42% 56% 70% 100%
ICT 100% 100% 100% 100% 100% 100%
KP 52% 60% 65% 75% 85% 90%
PUN 0% 28% 33% 42% 50% 61%
SIN 33% 35% 45% 55% 65% 75%
Pakistan 20% 32% 41% 52% 62% 73% Source: Provincial cMYPs
Figure 70: Drop-out rate baseline and targets by provinces and years
2012 2014 2015 2016 2017 2018
AJK 15% 13% 10% 8% 6% 4%
BAL 11% 9% 9% 9% 9% 9%
CDA 12% 9% 8% 7% 6% 4%
FAT 13% 12% 10% 8% 6% 4%
GB 7% 7% 6% 5% 5% 4%
ICT 9% 9% 8% 7% 6% 4%
KP 10% 9% 9% 8% 8% 7%
PUN 11% 9% 9% 9% 9% 9%
SIN 26% 23% 18% 15% 12% 8%
Pakistan 18% 15% 13% 12% 10% 9% Source: Provincial cMYPs

Comprehensive Multi-Year Plan | Immunization Program of Pakistan Chapter 5: Annexes
87
Figure 71: Cost of establishing and maintaining the buffer stock at national, provincial and district levels by federating entities and years (year of buffer stock establishment – 2015)
2014 2015 2016 2017 2018 Total
AJK $1,120,327 $73,407 $119,506 $1,313,240
BAL $1,332,101 $587,042 $136,366 $2,055,510
CDA $314,513 $20,582 $335,094
FAT $627,357 $100,030 $212,419 $289,844 $1,229,650
GB $214,234 $106,367 $44,905 $67,243 $432,750
ICT $169,710 $6,445 $176,155
KP $7,828,094 $665,408 $1,408,769 $9,902,272
PUN $28,359,874 $1,555,794 $29,915,668
SIN $7,550,440 $2,886,804 $1,051,754 $11,488,999
FED $71,274,976 $18,449,768 $12,288,695 $102,013,440
Total $0 $118,791,627 $206,398 $22,919,754 $16,944,998 $158,862,777 Source: Provincial cMYPs

Comprehensive Multi-Year Plan | Immunization Program of Pakistan Chapter 5: Annexes
88
Annex 4 Description of governance entities
Impact assessment committee
Purpose: Conduct in-depth program review of EPI
Composition: Headed by the Chief Health Planning Commission
Members:
Ministry of National Health Services, Regulation and Coordination,
NPM-EPI,
Representative from the Ministry of Finance,
Representative of EAD,
Provincial and Federating Managers
One member each from WHO and UNICEF.
Operation: Meeting quarterly conducting desk review of programmatic and financial reports of the EPI
Carrying out coordination field visits
Project Implementation Coordination Committee (PICC)
Purpose: 1. Oversee and review the technical and financial progress of the project and
2. PSDP funds.
3. Provide guidance to the program in proper implementation of the project and resolve bottlenecks which create problem in its implementation.
4. To monitor project at provincial level on periodic basis
Composition: Financial Advisor Ministry of National Health Services, Regulation and Coordination
Sr. JS PDM/Health, Ministry of National Health Services, Regulation and Coordination
Chief Health Planning, P&D
National Programme Manager EPI (Secretary)
Director Generals Health Services of all provinces
Provincial Programme Managers EPI
Co-opted members (any) with permission of Chairman
Operation: Meets as and when required
National Interagency Co-ordination Committee (NICC)
Purpose: 1. Coordinate support at national level from government and partner agencies to strengthen EPI and polio eradication activities in Pakistan.
2. Mobilize the national government and NGOs to eradicate polio and control other vaccine-preventable disease.
3. Assist Pakistan in becoming self-sufficient in its immunization programmes.
4. Establish a forum for exchange of information and dialogue on immunization programmes in the country and facilitate that dialogue by making data information sources readily available.
5. Ensure the availability of appropriate policies, advice and tools to the Pakistan government.
6. Assist the international and national community in identifying and developing support for new disease control programmes when appropriate intervention tools, such as new vaccines become available.
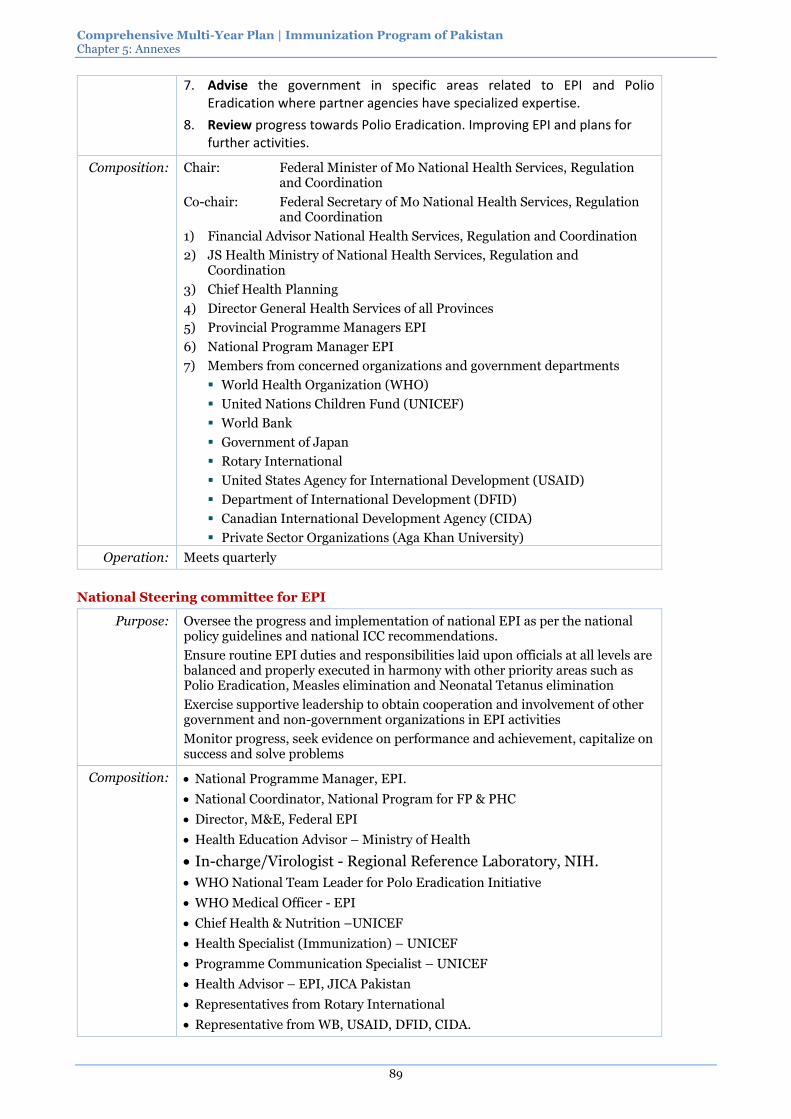
Comprehensive Multi-Year Plan | Immunization Program of Pakistan Chapter 5: Annexes
89
7. Advise the government in specific areas related to EPI and Polio Eradication where partner agencies have specialized expertise.
8. Review progress towards Polio Eradication. Improving EPI and plans for further activities.
Composition: Chair: Federal Minister of Mo National Health Services, Regulation and Coordination
Co-chair: Federal Secretary of Mo National Health Services, Regulation and Coordination
1) Financial Advisor National Health Services, Regulation and Coordination
2) JS Health Ministry of National Health Services, Regulation and Coordination
3) Chief Health Planning
4) Director General Health Services of all Provinces
5) Provincial Programme Managers EPI
6) National Program Manager EPI
7) Members from concerned organizations and government departments
World Health Organization (WHO)
United Nations Children Fund (UNICEF)
World Bank
Government of Japan
Rotary International
United States Agency for International Development (USAID)
Department of International Development (DFID)
Canadian International Development Agency (CIDA)
Private Sector Organizations (Aga Khan University)
Operation: Meets quarterly
National Steering committee for EPI
Purpose: Oversee the progress and implementation of national EPI as per the national policy guidelines and national ICC recommendations.
Ensure routine EPI duties and responsibilities laid upon officials at all levels are balanced and properly executed in harmony with other priority areas such as Polio Eradication, Measles elimination and Neonatal Tetanus elimination
Exercise supportive leadership to obtain cooperation and involvement of other government and non-government organizations in EPI activities
Monitor progress, seek evidence on performance and achievement, capitalize on success and solve problems
Composition: National Programme Manager, EPI.
National Coordinator, National Program for FP & PHC
Director, M&E, Federal EPI
Health Education Advisor – Ministry of Health
In-charge/Virologist - Regional Reference Laboratory, NIH.
WHO National Team Leader for Polo Eradication Initiative
WHO Medical Officer - EPI
Chief Health & Nutrition –UNICEF
Health Specialist (Immunization) – UNICEF
Programme Communication Specialist – UNICEF
Health Advisor – EPI, JICA Pakistan
Representatives from Rotary International
Representative from WB, USAID, DFID, CIDA.

Comprehensive Multi-Year Plan | Immunization Program of Pakistan Chapter 5: Annexes
90
Operation: Hold Quarterly provincial meeting
NITAG
Purpose: Guide policy makers in the Federal Ministry of Health and Federal EPI of Paista to make evidence based immunization related policy decision for routine immunization activities and for national emergencies
Conduct policy analysis and formulate strategies for control, elimination and eradication of VCD
Bridging partnerships among different immunization stakeholders from other government and non-government organizations, associations, bodies and civil societies
Composition: Formed by the executive order of the Ministry of NHSRC (on the basis of a proposal from Federal EPI “in accordance with the NSC EPI decision”)
Core members – independent experts (meeting specific criteria) from the following fields
o Pediatrics
o Infectious disease epidemiology
o Immunology
o Clinical Research
o Virology
o Microbiology
o Health Economics
o Social sciences
Liaison members (not participate in final decision making):
o National Program Manager, EPI (secretary of the NITAG)
o Chief Health, Planning Commission
o Chief, Public Health Division, National Institute of Health
o National Team Leader – PEI, World Health Organization
o Chief – Health & Nutrition, UNICEF
o Medical Officer – EPI, World Health Organization
o Executive Director – Pakistan Medical Research Council
o President – Pakistan Pediatrics Association
Operation: Policy guideline and recommendations are submitted to the Ministry for final approval and implementation
Frequency of meetings – as needed
National Task Force for Polio Eradication
Purpose: Oversee and monitor the progress made against National Emergency Plan of Action for polio eradication throughout the country with especial focus on high risk districts.
Ensure that appropriate support is available to all provinces for successful implementation of District/Agency/Town Specific Plans for polio eradication.
Composition: Prime Minister Islamic Republic of Pakistan (Chairman)
Governor Khyber Pakhtunkhwa / FATA
Chief Ministers of all provinces
Federal Minister for IPC
Special Assistant to Prime Minister (SAPM) for Social Sector
Principal Secretary to Prime Minister Representative of the Chief of Army Staff
Federal Secretary IPC National Coordinator
PM’s Polio Monitoring Cell /Focal Person
National Programme Manager EPI

Comprehensive Multi-Year Plan | Immunization Program of Pakistan Chapter 5: Annexes
91
Representatives of WHO, UNICEF, Rotary and Bill Gates Foundation, WB and USAID
Any other nominee
Operation: Meets every six months to review the following aspects of Polio eradication initiative:
1. The progress made in provinces against Emergency Plan of Action 2011 for eradication of Polio and direct the federal and provincial governments to take remedial measures
2. Inter-provincial and inter sectoral coordination and give direction on issues if any of them hampering the efforts.
3. Adequate resources are secured for the implementation of National Emergency Plan of Action for polio eradication.
Provincial Task Force / Steering Committee for Polio Eradication
Purpose: Oversee and monitor the progress made against National Emergency Plan of Action for polio eradication in province.
Composition: Chief Minister/ Chief Secretary - Chairman
Secretary, Health Department - Secretariat
Technical Focal Person for National Emergency Action Plan for Polio Eradication in Chief Minister Office – to be nominated by Chief Secretary
Secretary, Department of Education, Information, Local Government, Auqaf and Home.
Director General Health Services
Provincial EPI Manager along with Provincial Head of PRSP/PPHI
Provincial Heads of development partners (WHO, UNICEF, Rotary, etc.)
Any other nominee of Chief Secretary
All Deputy Commissioners/ District Coordination Officers of the province / Political Agents (PA) of FATA will attend the meeting of PSC/PTF.
Operation: Meet every two months to review and monitor the following aspects of Polio eradication initiative
1. Progress made in province against National Emergency Plan of Action for eradication of Polio and provide guidance on challenges being faced by each district.
2. Involvement of district and sub-district level arm of government to assume the responsibility of ensuring implementation of District Specific plan.
3. Involvement of the line departments and assigning specific roles and tasks to each department for the successful campaign implementation.
4. The plan and progress for advocacy and social mobilization activities at provincial and sub-provincial levels and ensure availability of adequate resources and their optimal use.

Comprehensive Multi-Year Plan | Immunization Program of Pakistan
92
Annex 5 WHO Support to EPI in Pakistan 2014-2015 – key areas and activities
1 Support country in developing and updating cMYP, annual Plan of Action and microplan at national, provincial, district and lower administrative levels. 1.1 Technical assistance to the Federal and Provincial health ministry and health departments in
developing cMYP and annual Plan of Action. Technical assistance to districts and below district level in developing operational microplan. 1.1.1 cMYP development individually for every province/area and then combine to form the
national cMYP 1.1.2 Development of annual PoA for every province/area and at national level in the line of
respective cMYPs 1.1.3 Development of operational micro-plan at district and lower administrative levels
1.2 Holding workshops at national, provincial, district level for developing cMYP, annual PoA and operational microplan
1.3 Training of national and provincial immunization managers/officers and other stakeholders in developing cMYP and annual PoA. Capacity building of the district and lowest administrative unit immunization managers, immunization staff and officials of support agencies in developing operational microplan following RED approach
2 Support country in strengthening routine immunization 2.1 Technical assistance to the federal and provincial EPI for strengthening routine immunization 2.2 Capacity building of federal and provincial immunization staff and service providers in
vaccine management, data quality improvement, cold chain management, service delivery 2.3 Operational expenses for strengthening routine immunization 2.4 Supply and logistics for strengthening routine immunization
3 Support country in introducing new vaccines in the national immunization schedule 3.1 Support country in introducing new vaccine in the national immunization schedule 3.2 Technical assistance in submitting application for new vaccine introduction 3.3 Training of immunization staff in introduction of new introduction 3.4 Development, revision, printing and distribution of immunization tools, forms, guidelines for
new vaccine introduction 3.5 Operational expenses for new vaccine introduction 3.6 Post Introduction Evaluation
4 Support country in monitoring, evaluation and use of surveillance and immunization data 4.1 Use of surveillance and immunization data for monitoring and evaluation of the
immunization program 4.1.1 Technical assistance to the national and provincial EPI on using surveillance and
immunization data for monitoring and evaluation of immunization program 4.1.2 Capacity building of the national, provincial, district immunization staff on using
surveillance and immunization data for monitoring and evaluation of immunization program
4.1.3 Operational expenses for monitoring and evaluation of the immunization program at different levels
4.1.4 Review of surveillance and immunization data through periodical review meetings, DQS, desk review and surveys
4.1.5 Supply and logistics for conducting monitoring and evaluation of the immunization program
5 Support country in developing and implementing national measles, rubella/CRS, NT elimination strategy and introduction of Hep B birth dose 5.1 Planning and implementing Measles SIA at national and sub-national level to raise immunity
against measles among the susceptible age group 5.1.1 Technical assistance to the national, provincial and district level in planning and
implementing Measles SIA

Comprehensive Multi-Year Plan | Immunization Program of Pakistan Chapter 5: Annexes
93
5.1.2 Training of immunization staff at various level in micro planning and implementation of Measles SIA
5.1.3 Operational expenses for implantation, monitoring and evaluation of the measles SIA 5.1.4 Monitoring and evaluation of Measles SIA and review of qualitative and quantitative
aspects of Measles SIA through established monitoring system and independently 5.1.5 Providing support for supply and logistics for conducting Measles SIA
5.2 Improvement of routine coverage for both 1st and 2nd dose of measles vaccination 5.3 Maternal and Neonatal Tetanus (MNT) SIA in selected areas according to risk assessment 5.4 Introduction of Hep B birth dose
6 Support country in strengthening integrated VPD surveillance including measles and rubella/congenital rubella syndrome surveillance 6.1 Strengthening Integrated Vaccine Preventable Diseases (VPD) Surveillance including case-
based measles/Rubella surveillance 6.1.1 Technical assistance for integrated VPD surveillance including case-based measles
surveillance 6.1.2 Capacity building of the national, provincial, district surveillance staff, laboratory staff
and service providers at different levels on integrated VPD surveillance including case-based measles surveillance
6.1.3 Operational expenses for the national integrated VPD surveillance including case-based measles surveillance and the national laboratory
6.1.4 Supplies and logistics for the national measles laboratory 6.1.5 Laboratory support for Measles surveillance as a part of the integrated VPD
surveillance to the national laboratory 6.1.6 Review of integrated VPD surveillance system including case-based measles/Rubella
surveillance 6.2 Support country in establishing Congenital Rubella Syndrome (CRS) sentinal surveillance
7 Support National Verification Committees on measles/rubella elimination 7.1 Establishment of Measles/Rubella elimination verification committees
8 Support National Immunization Technical Advisory Group and Inter-agency Coordination Committee in decision making on country need for new vaccine products through providing relevant data for inform decision making 8.1 Strengthening the decision making process of NITAG and ICC
9 Sentinel surveillance for IBD and Rotavirus diarrhea 9.1 IBD and Rotavirus Surveillance
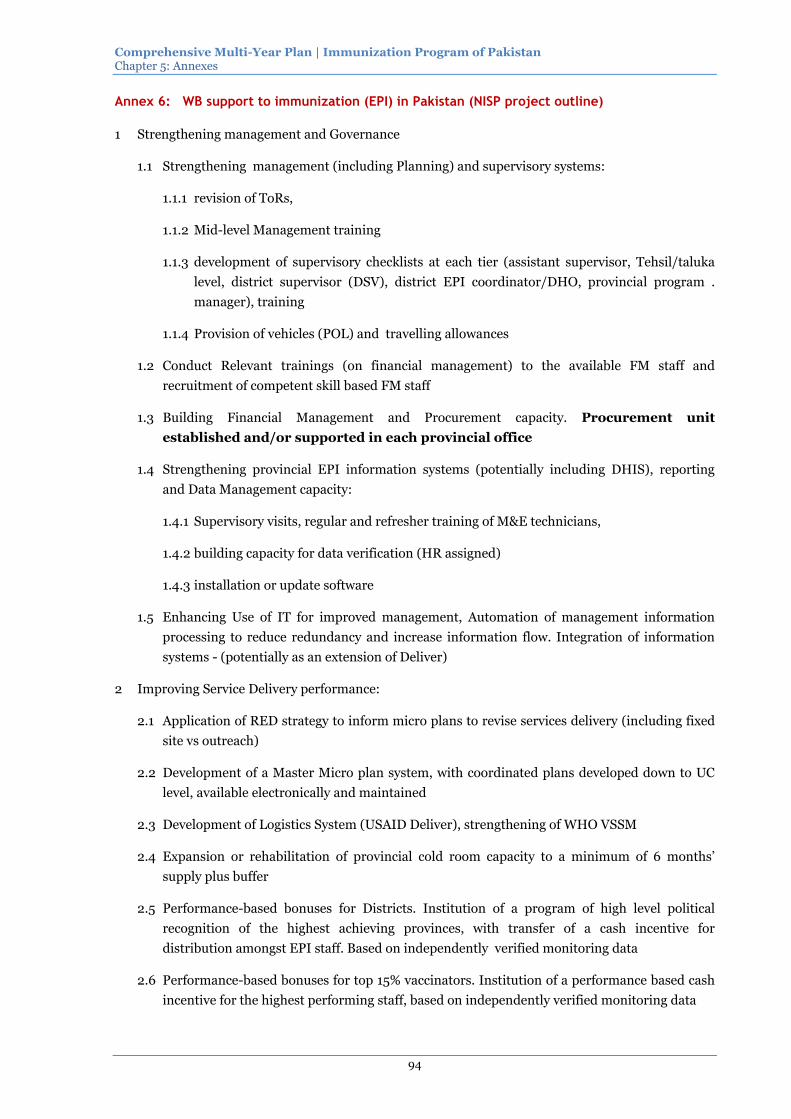
Comprehensive Multi-Year Plan | Immunization Program of Pakistan Chapter 5: Annexes
94
Annex 6: WB support to immunization (EPI) in Pakistan (NISP project outline)
1 Strengthening management and Governance
1.1 Strengthening management (including Planning) and supervisory systems:
1.1.1 revision of ToRs,
1.1.2 Mid-level Management training
1.1.3 development of supervisory checklists at each tier (assistant supervisor, Tehsil/taluka
level, district supervisor (DSV), district EPI coordinator/DHO, provincial program .
manager), training
1.1.4 Provision of vehicles (POL) and travelling allowances
1.2 Conduct Relevant trainings (on financial management) to the available FM staff and
recruitment of competent skill based FM staff
1.3 Building Financial Management and Procurement capacity. Procurement unit
established and/or supported in each provincial office
1.4 Strengthening provincial EPI information systems (potentially including DHIS), reporting
and Data Management capacity:
1.4.1 Supervisory visits, regular and refresher training of M&E technicians,
1.4.2 building capacity for data verification (HR assigned)
1.4.3 installation or update software
1.5 Enhancing Use of IT for improved management, Automation of management information
processing to reduce redundancy and increase information flow. Integration of information
systems - (potentially as an extension of Deliver)
2 Improving Service Delivery performance:
2.1 Application of RED strategy to inform micro plans to revise services delivery (including fixed
site vs outreach)
2.2 Development of a Master Micro plan system, with coordinated plans developed down to UC
level, available electronically and maintained
2.3 Development of Logistics System (USAID Deliver), strengthening of WHO VSSM
2.4 Expansion or rehabilitation of provincial cold room capacity to a minimum of 6 months’
supply plus buffer
2.5 Performance-based bonuses for Districts. Institution of a program of high level political
recognition of the highest achieving provinces, with transfer of a cash incentive for
distribution amongst EPI staff. Based on independently verified monitoring data
2.6 Performance-based bonuses for top 15% vaccinators. Institution of a performance based cash
incentive for the highest performing staff, based on independently verified monitoring data

Comprehensive Multi-Year Plan | Immunization Program of Pakistan Chapter 5: Annexes
95
2.7 Human Resources - functioning EPI centers in each health facility, 2 vaccinators per UC, 25%
of vaccinators are females
3 Demand Generation
3.1 Social Marketing and behavior change - CSO contracts, support for health education
promotion units at provincial and federal levels, CSO contracts in place. Coverage of urban
slum populations.
3.2 Routine Immunization inclusion in School Curriculum

Comprehensive Multi-Year Plan | Immunization Program of Pakistan Chapter 5: Annexes
96
Annex 7: GVAP Checklist
GVAP Strategies
Key Activities
Activity included in cMYP
Yes
No
No
t
ap
pli
cab
le
New
acti
vit
y
ne
ed
ed
Strategic objective 1: All countries commit to immunization as a priority.
Establish and sustain commitment to immunization.
Ensure legislation or legal framework in all countries, including provisions for a budget line for immunization, and for monitoring and reporting.
Develop comprehensive national immunization plans that are part of overall national health plans through a bottom-up process including all stakeholders.
Set ambitious but attainable country-specific targets within the context of morbidity and mortality reduction goals.
Scrutinize, defend, and more closely follow immunization budgets, disbursements and immunization programme activities.
Support local civil society organizations and professional associations to contribute to national discussions of immunizations and health.
Inform and engage opinion leaders on the value of immunization.
Explore models to promote collaboration between the stakeholders that generate evidence on immunization and those who use it to set priorities and formulate policies.
Develop and disseminate the evidence base on the public health value of vaccines and immunization and the added value of achieving equity in access and use of immunization.
Develop and disseminate the evidence base for the broad economic benefits of immunization for individuals, households, communities, and countries.
Include immunization in the agendas of governing body meetings at all levels and in other social, health and economic forums.
Strengthen national capacity to formulate evidence-based policies.
Create or strengthen independent bodies that formulate national immunization policies (for example, NITAGs or regional technical advisory groups).
Develop more effective ways for National Regulatory Agencies (NRAs), Health Sector Coordination Committees (HSCCs), and Interagency Coordination Committees (ICCs) to support immunization programmes as part of disease control programmes and preventive health care.
Create regional forums and peer-to-peer exchange of information, best practices and tools.
Create expanded and more transparent mechanisms for aggregating, sharing, and using information to monitor commitments.
Strategic objective 2: Individuals and communities understand the value of vaccines and demand immunization as both their right and responsibility.
Engage individuals and communities on the benefits of immunization and hear their concerns.
Engage in a dialogue which both transmits information and responds to people's concerns and fears.
Utilize social media tools and lessons from commercial and social marketing efforts.
Leverage new mobile and Internet-based technologies.
Include immunization in the basic education curriculum.
Conduct communications research.

Comprehensive Multi-Year Plan | Immunization Program of Pakistan Chapter 5: Annexes
97
GVAP Strategies
Key Activities
Activity included in cMYP
Yes
No
No
t
ap
pli
cab
le
New
acti
vit
y
ne
ed
ed
Create incentives to stimulate demand.
Create incentives to households and health workers for immunization, where appropriate and while respecting the autonomy of beneficiaries (for example, cash or in-kind transfers, bundling of services, media recognition).
Conduct social research to improve the delivery of immunization services and the ability to meet the needs of diverse communities.
Build advocacy capacity.
Recruit new voices, including those of educators, religious leaders, traditional and social media personalities, family physicians, community health workers, and trained immunization champions (among others).
Train healthcare workers on effective communication techniques, especially to address vaccine hesitancy and to respond to reports of serious adverse events following immunization in order to maintain trust and allay fears.
Engage, enable and support in-country CSOs to advocate to local communities and policy-makers and in local and global media regarding the value of vaccines.
Create national or regional advocacy plans that involve in-country CSOs.
Link global, national and community advocacy efforts with professional and academic networks.
Strategic objective 3: The benefits of immunization are equitably extended to all people.
Develop and implement new strategies to address inequities.
Recast "Reaching Every District" to "Reaching Every Community" to address inequities within districts.
Engage underserved and marginalized groups to develop locally tailored, targeted strategies for reducing inequities.
Introduce appropriate new vaccines in national immunization programmes (see also Objective 5).
Establish a life course approach to immunization planning and implementation, including new strategies to ensure equity across the life span.
Prevent and respond to vaccine-preventable diseases during disease outbreaks, humanitarian crises, and in conflict zones.
Build knowledge base and capacity to enable equitable delivery.
Track each individual's immunization status, leveraging immunization registries, electronic databases and national identification number systems.
Take advantage of community structures to enhance communication and deliver services (for example, traditional birth attendants, birth registries).
Involve CSOs in community outreach and planning.
Develop new approaches to community engagement for urban and peri-urban areas.
Train health workers and CSOs on how to engage communities, identify influential people who can assist in planning, organizing and monitoring health and immunization programmes, identify community needs and work with communities to meet those needs.
Conduct operational and social science research to identify successful strategies to reduce inequities and improve the quality and delivery of immunization services.

Comprehensive Multi-Year Plan | Immunization Program of Pakistan Chapter 5: Annexes
98
GVAP Strategies
Key Activities
Activity included in cMYP
Yes
No
No
t
ap
pli
cab
le
New
acti
vit
y
ne
ed
ed
Strategic objective 4: Strong immunization systems that are an integral part of a well-functioning health system.
Develop comprehensive and coordinated approaches.
Ensure that global vaccine programmes focusing on eradication and elimination goals are incorporated into national immunization programmes.
Ensure that new vaccine deployment is accompanied by comprehensive disease control plans
Ensure coordination between the public and private sectors for new vaccine introduction, reporting of vaccine-preventable diseases and administration of vaccines, and ensure quality of vaccination in the public and private sectors.
Consider the inclusion of vaccines in health programmes across the life course.
Strengthen monitoring and surveillance systems.
Improve the quality of all immunization administrative data and promote its analysis and use at all administrative levels to improve programme performances.
Develop and promote the use of new technologies for collection, transmission and analysis of immunization data.
Further strengthen, improve quality and expand disease surveillance systems to generate information based on laboratory confirmed cases for decision-making, monitoring the impact of immunization on morbidity and mortality and changes in disease epidemiology.
Ensure capacity for vaccine safety activities, including capacity to collect and interpret safety data, with enhanced capacity in countries that introduce newly developed vaccines.
Strengthen capacity of managers and frontline workers.
Ensure that immunization and other primary health care programmes have adequate human resources to schedule and deliver predictable services of acceptable quality.
Increase levels of pre-service, in-service and post-service training for human resources, and develop new, relevant curricula that approach immunization as a component of comprehensive disease control.
Promote coordinated training and supervision of community-based health workers.
Strengthen infrastructure and logistics.
Innovate to improve cold chain capacity and logistics, as well as waste management.
Minimize the environmental impact of energy, materials and processes used in immunization supply systems, both within countries and globally.
Staff supply systems with adequate numbers of competent, motivated and empowered personnel at all levels.
Establish information systems that help staff accurately track the available supply.
Strategic objective 5: Immunization programmes have sustainable access to predictable funding, quality supply and innovative technologies.
Increase total amount of funding.
Establish a commitment for governments to invest in immunization according to their ability to pay and the expected benefits.
Engage new potential domestic and development partners and diversify sources of funding.
Comprehensive Multi-Year Plan | Immunization Program of Pakistan Chapter 5: Annexes
99
GVAP Strategies
Key Activities
Activity included in cMYP
Yes
No
No
t
ap
pli
cab
le
New
acti
vit
y
ne
ed
ed
Develop the next generation of innovative financing mechanisms.
Increase affordability for middle-income countries.
Explore differential pricing approaches to define explicit criteria for price tiers and the current and future prices to be made available to lower middle-income and middle-income countries.
Explore pooled negotiation or procurement mechanisms for lower-middle-income and middle income countries.
Improve allocation of funding in low- and middle-income countries.
Strengthen budgeting and financial management in-country to better integrate financial and health care planning and priority setting.
Coordinate funding support from development partners and other external sources.
Evaluate and improve funding support mechanisms on the basis of their effectiveness in reaching disease goals.
Base funding on transparency and objectivity in order to ensure the sustainability of programmes.
Promote the use of cost and cost-benefit arguments in fund raising, decision-making, and defence of immunization funding.
Explore pay-for-performance funding systems.
Secure quality supply
Build and support networks of regulators and suppliers to share best practices and to improve quality assurance capabilities and quality control.
Develop tools to strengthen global standardization of manufacturing and regulatory processes.
Strengthen national regulatory systems and develop globally harmonized regulations.
Ensure a forum where countries can communicate expected demand for vaccines and technologies and provide guidance to manufacturers on desired product profiles.
Strategic objective 6: Country, regional and global R&D innovations maximize the benefits of immunization.
Expand capabilities and increase engagement with end-users.
Engage with end users to prioritize vaccines and innovations according to perceived demand and added value.
Establish platforms for exchange of information on immunization research and consensus building.
Build more capacity and human resources in low- and middle-income countries to conduct R&D and operational research.
Increase networking among research centres for efficient building of partnerships among high-, middle- and low-income countries’ institutions.
Promote collaboration between traditional research disciplines and scientists from disciplines not previously engaged in vaccine research.
Enable the development of new vaccines
Research on the fundamentals of innate and adaptive immune responses, particularly in humans.
Research on immunologic and molecular characteristics of microbes.
Improve understanding of the extent and causes of variation in pathogen and human population responses to vaccines.
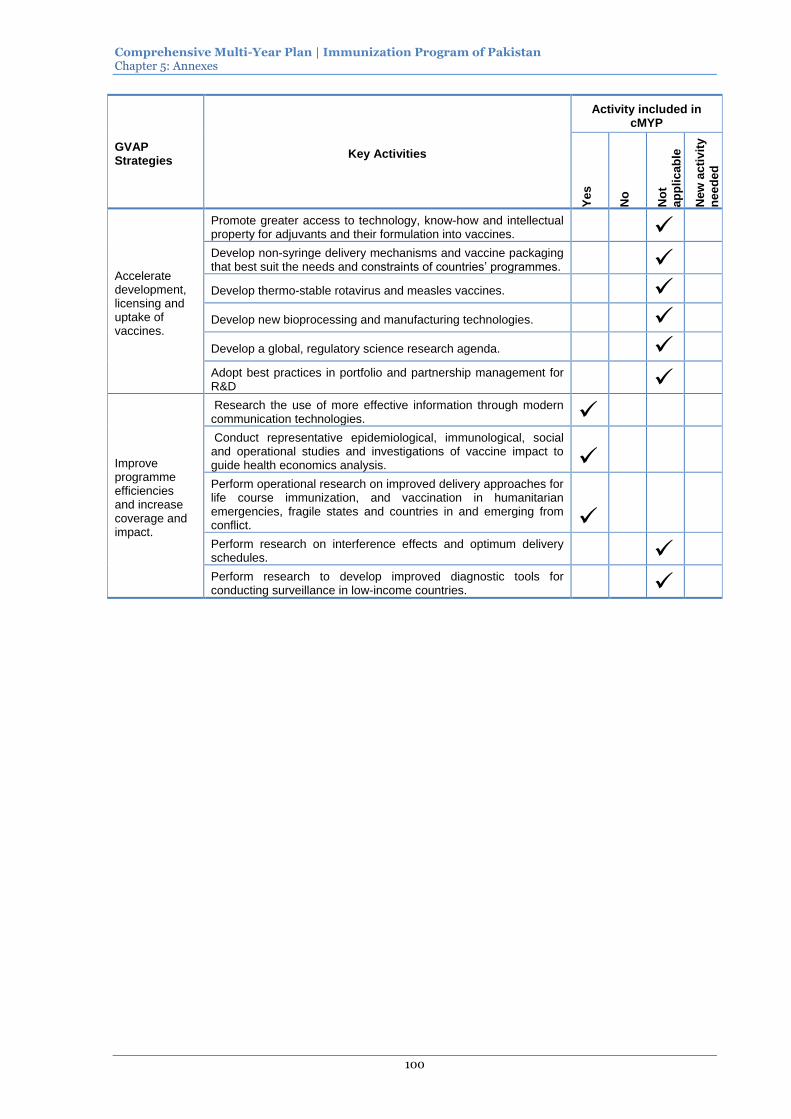
Comprehensive Multi-Year Plan | Immunization Program of Pakistan Chapter 5: Annexes
100
GVAP Strategies
Key Activities
Activity included in cMYP
Yes
No
No
t
ap
pli
cab
le
New
acti
vit
y
ne
ed
ed
Accelerate development, licensing and uptake of vaccines.
Promote greater access to technology, know-how and intellectual property for adjuvants and their formulation into vaccines.
Develop non-syringe delivery mechanisms and vaccine packaging that best suit the needs and constraints of countries’ programmes.
Develop thermo-stable rotavirus and measles vaccines.
Develop new bioprocessing and manufacturing technologies.
Develop a global, regulatory science research agenda.
Adopt best practices in portfolio and partnership management for R&D
Improve programme efficiencies and increase coverage and impact.
Research the use of more effective information through modern communication technologies.
Conduct representative epidemiological, immunological, social and operational studies and investigations of vaccine impact to guide health economics analysis.
Perform operational research on improved delivery approaches for life course immunization, and vaccination in humanitarian emergencies, fragile states and countries in and emerging from conflict.
Perform research on interference effects and optimum delivery schedules.
Perform research to develop improved diagnostic tools for conducting surveillance in low-income countries.

Comprehensive Multi-Year Plan | Immunization Program of Pakistan
101
Annex 8: Costing and financing (national)
Figure 72: Immunization programcosts in 2012 by cMYP components and provinces
Category AJK BAL FAT GB ICT KP PUN SIN FED CDA OTAL
Vaccine Supply and Logistics (routine only) $1,671,215 $3,311,361 $1,653,716 $474,460 $214,287 $7,600,403 $27,601,015 $14,504,737 $346,833 $320,789 $57,698,816
Service Delivery $1,855,800 $5,346,812 $2,154,300 $652,237 $80,307 $6,564,924 $13,770,814 $11,120,644 $1,232,695 $95,303 $42,873,835
Advocacy and Communication $0 $72,186 $163,383 $3,000 $0 $1,387,899 $2,170,876 $35,556 $346,130 $0 $4,179,030
Monitoring and Disease Surveillance $0 $282,981 $0 $0 $0 $15,556 $196,148 $22,000 $0 $0 $516,685
Program Management $0 $328,304 $9,333 $68,120 $4,667 $661,667 $788,899 $285,778 $82,702 $2,000 $2,231,469
Supplemental Immunization Activities (SIA) (includes vaccine and operation costs) $1,239,822 $7,984,126 $2,122,574 $194,434 $95,270 $4,979,795 $44,801,426 $13,726,007 $0 $158,248 $75,301,701
Shared Health Systems Costs $1,953,184 $4,666,101 $528,592 $455,547 $64,707 $9,388,563 $30,760,349 $6,813,200 $1,255,178 $31,867 $55,917,287
GRAND TOTAL $6,720,021 $21,991,870 $6,631,898 $1,847,797 $459,237 $30,598,806 $120,089,527 $46,507,921 $3,263,538 $608,206 $238,718,823
% of Total 3% 9% 3% 1% 0% 13% 50% 19% 1% 100%
Figure 73: Routine immunization costs (2012) by major cost categories and provinces
Cost categories AJK BAL CDA PUN FAT GP ICT KP SIN Total
Traditional Vaccines $183,565 $298,075 $30,317 $3,927,426 $207,407 $48,695 $19,125 $977,460 $1,398,747 $7,090,817
Underused Vaccines $1,069,988 $1,521,589 $169,638 $20,072,614 $1,041,547 $300,658 $177,085 $5,332,073 $9,445,898 $39,131,090
New Vaccines $0 $0 $0 $0 $0 $0 $0 $0 $0 $0
Injection supplies $65,184 $102,790 $10,985 $1,236,262 $63,564 $15,978 $8,045 $747,561 $617,932 $2,868,301
Personnel $1,771,707 $5,013,238 $77,640 $11,629,261 $1,988,899 $502,980 $72,132 $6,312,720 $10,177,401 $37,545,978
Transportation $84,093 $333,574 $17,663 $2,141,553 $165,400 $149,257 $8,175 $252,204 $943,243 $4,095,163
Other routine recurrent costs $276,922 $1,128,733 $27,182 $5,520,637 $347,248 $180,249 $14,699 $2,608,430 $2,457,716 $12,561,816
Vehicles $0 $116,667 $0 $0 $0 $0 $0 $0 $72,222 $188,889
Cold chain equipment $75,556 $826,978 $84,667 $0 $166,667 $0 $0 $0 $855,556 $2,009,422
Other capital equipment $0 $0 $0 $0 $0 $0 $0 $0 $0 $0
Total $3,527,015 $9,341,644 $418,092 $44,527,752 $3,980,732 $1,197,817 $299,261 $16,230,448 $25,968,715 $105,491,475

Comprehensive Multi-Year Plan | Immunization Program of Pakistan Chapter 5: Annexes
102
Figure 74: Personnel cost structure by provinces (2012)
AJK BAL CDA FATA GB ICT KP PUN SIN Total Provinces
Salaries of full-time NIP health workers $1,682,133 $4,120,870 $76,760 $1,952,713 $465,067 $70,592 $6,217,373 $10,471,245 $9,633,261 $34,690,014
Per-diems for outreach vaccinators/mobile teams $24,333 $225,224 $880 $27,947 $8,213 $1,540 $87,733 $575,796 $188,833 $1,140,500
Per-diems for supervision and monitoring $65,240 $667,144 $0 $8,240 $29,700 $0 $7,613 $582,220 $355,307 $1,715,464
Shared personnel costs $1,953,184 $4,666,101 $31,867 $528,592 $455,547 $64,453 $9,182,939 $30,760,349 $6,803,620 $54,446,652
Total $3,724,891 $9,679,339 $109,507 $2,517,491 $958,527 $136,585 $15,495,659 $42,389,610 $16,981,021 $91,992,630
52% 48%
29%21%
48% 47%59%
73%
40%
59%
0%
10%
20%
30%
40%
50%
60%
70%
80%
90%
100%
AJK BAL CDA FATA GB ICT KP PUN SIN Total Provinces
Personnel cost structure - Baseline
Salaries of full-time NIP health workers (immunization specific) Per-diems for outreach vaccinators/mobile teams
Per-diems for supervision and monitoring Shared personnel costs
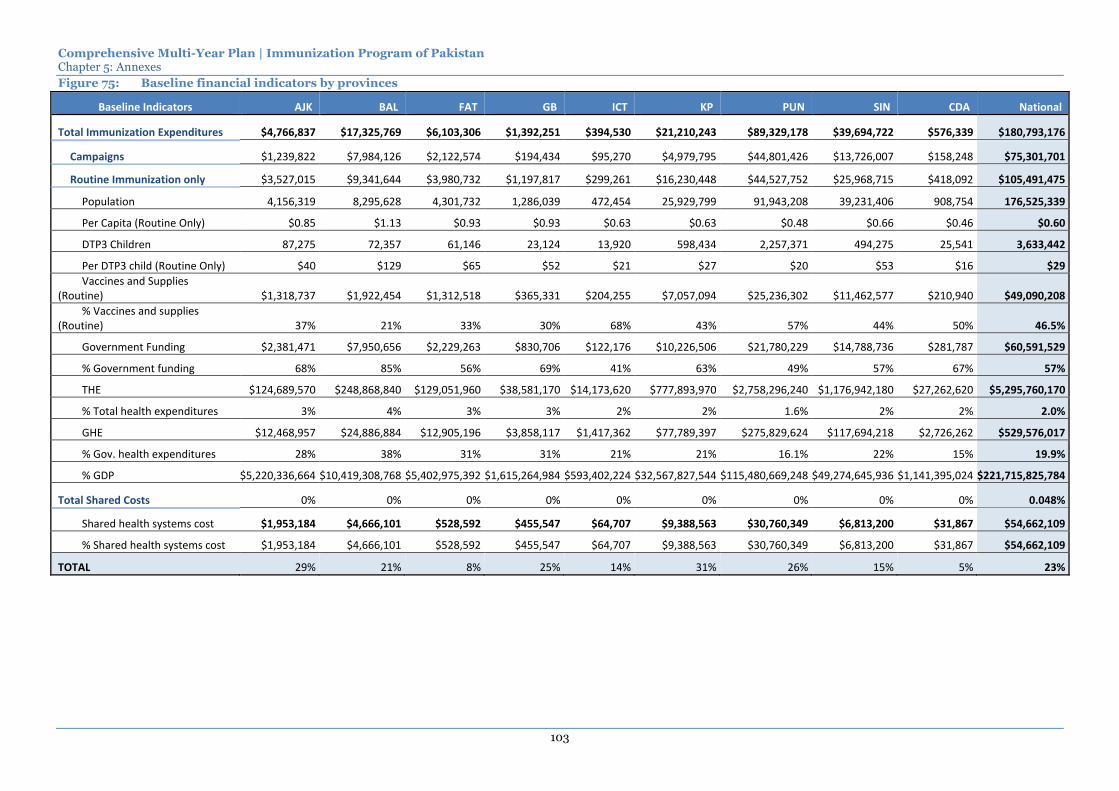
Comprehensive Multi-Year Plan | Immunization Program of Pakistan Chapter 5: Annexes
103
Figure 75: Baseline financial indicators by provinces
Baseline Indicators AJK BAL FAT GB ICT KP PUN SIN CDA National
Total Immunization Expenditures $4,766,837 $17,325,769 $6,103,306 $1,392,251 $394,530 $21,210,243 $89,329,178 $39,694,722 $576,339 $180,793,176
Campaigns $1,239,822 $7,984,126 $2,122,574 $194,434 $95,270 $4,979,795 $44,801,426 $13,726,007 $158,248 $75,301,701
Routine Immunization only $3,527,015 $9,341,644 $3,980,732 $1,197,817 $299,261 $16,230,448 $44,527,752 $25,968,715 $418,092 $105,491,475
Population 4,156,319 8,295,628 4,301,732 1,286,039 472,454 25,929,799 91,943,208 39,231,406 908,754 176,525,339
Per Capita (Routine Only) $0.85 $1.13 $0.93 $0.93 $0.63 $0.63 $0.48 $0.66 $0.46 $0.60
DTP3 Children 87,275 72,357 61,146 23,124 13,920 598,434 2,257,371 494,275 25,541 3,633,442
Per DTP3 child (Routine Only) $40 $129 $65 $52 $21 $27 $20 $53 $16 $29
Vaccines and Supplies (Routine) $1,318,737 $1,922,454 $1,312,518 $365,331 $204,255 $7,057,094 $25,236,302 $11,462,577 $210,940 $49,090,208
% Vaccines and supplies (Routine) 37% 21% 33% 30% 68% 43% 57% 44% 50% 46.5%
Government Funding $2,381,471 $7,950,656 $2,229,263 $830,706 $122,176 $10,226,506 $21,780,229 $14,788,736 $281,787 $60,591,529
% Government funding 68% 85% 56% 69% 41% 63% 49% 57% 67% 57%
THE $124,689,570 $248,868,840 $129,051,960 $38,581,170 $14,173,620 $777,893,970 $2,758,296,240 $1,176,942,180 $27,262,620 $5,295,760,170
% Total health expenditures 3% 4% 3% 3% 2% 2% 1.6% 2% 2% 2.0%
GHE $12,468,957 $24,886,884 $12,905,196 $3,858,117 $1,417,362 $77,789,397 $275,829,624 $117,694,218 $2,726,262 $529,576,017
% Gov. health expenditures 28% 38% 31% 31% 21% 21% 16.1% 22% 15% 19.9%
% GDP $5,220,336,664 $10,419,308,768 $5,402,975,392 $1,615,264,984 $593,402,224 $32,567,827,544 $115,480,669,248 $49,274,645,936 $1,141,395,024 $221,715,825,784
Total Shared Costs 0% 0% 0% 0% 0% 0% 0% 0% 0% 0.048%
Shared health systems cost $1,953,184 $4,666,101 $528,592 $455,547 $64,707 $9,388,563 $30,760,349 $6,813,200 $31,867 $54,662,109
% Shared health systems cost $1,953,184 $4,666,101 $528,592 $455,547 $64,707 $9,388,563 $30,760,349 $6,813,200 $31,867 $54,662,109
TOTAL 29% 21% 8% 25% 14% 31% 26% 15% 5% 23%

Comprehensive Multi-Year Plan | Immunization Program of Pakistan Chapter 5: Annexes
104
Figure 76: Total resource requirements (2014-2018) by major system components and provinces
AJK BAL CDA FAT GB ICT KP PUN SIN Total Provinces FED TOTAL
Routine - Reccurent $44,450,919 $85,518,005 $7,629,934 $47,152,031 $17,502,158 $4,141,387 $226,100,847 $641,129,842 $311,883,473 $1,385,508,595 $154,860,168 $1,540,368,763
Routine - Capital $4,694,697 $16,312,658 $245,502 $4,890,051 $1,318,003 $218,003 $9,617,741 $13,119,991 $27,806,523 $78,223,169 $0 $78,223,169
SIA $9,782,625 $39,630,161 $2,046,244 $16,700,550 $2,798,609 $1,105,162 $151,018,818 $284,752,159 $97,296,297 $605,130,625 $31,021,815 $636,152,440
Shared system costs $14,143,915 $29,896,596 $201,905 $3,408,078 $2,957,939 $430,975 $66,978,521 $196,310,334 $43,027,950 $357,356,215 $0 $357,356,215
Total $73,072,155 $171,357,420 $10,123,585 $72,150,710 $24,576,710 $5,895,527 $453,715,927 $1,135,312,326 $480,014,243 $2,426,218,604 $185,881,983 $2,612,100,587
60.8%49.9%
75.4%65.4%
71.2% 70.2%
49.8%56.5%
65.0%57.1%
83.3%
59.0%
13.4%23.1%
20.2%23.1% 11.4% 18.7%
33.3% 25.1%
20.3%
24.9%
16.7%
24.4%
0%
10%
20%
30%
40%
50%
60%
70%
80%
90%
100%
AJK BAL CDA FAT GB ICT KP PUN SIN Total Provinces FED TOTAL
Routine - Reccurent Routine - Capital SIA Shared system costs

Comprehensive Multi-Year Plan | Immunization Program of Pakistan Chapter 5: Annexes
105
Figure 77: Total (2014-2018) resource requirements by cMYP components and provinces
Category AJK BAL FAT GB ICT KP PUN SIN FED CDA TOTAL
Vaccine Supply and Logistics (routine only) $29,938,883 $55,546,374 $25,905,013 $9,340,573 $3,205,343 $172,103,641 $505,203,407 $227,542,948 $89,452,117 $5,887,142 $1,124,125,441
Service Delivery $17,999,193 $41,981,360 $24,522,357 $8,276,546 $881,726 $53,214,630 $122,408,160 $100,052,680 $7,661,598 $1,725,491 $378,723,741
Advocacy and Communication $61,139 $635,822 $77,401 $61,139 $33,526 $1,233,156 $12,708,044 $936,408 $4,229,929 $33,526 $20,010,090
Monitoring and Disease Surveillance $414,680 $1,866,055 $602,664 $602,664 $127,139 $1,359,835 $7,854,883 $3,416,813 $11,974,773 $133,221 $28,352,726
Programme Management $731,721 $1,801,053 $934,646 $539,240 $111,656 $7,807,326 $6,075,338 $7,741,147 $41,541,752 $96,056 $67,379,934
SIA $9,782,625 $39,630,161 $16,700,550 $2,798,609 $1,105,162 $151,018,818 $284,752,159 $97,296,297 $31,021,815 $2,046,244 $636,152,440
Shared Health Systems Costs $14,143,915 $29,896,596 $3,408,078 $2,957,939 $430,975 $66,978,521 $196,310,334 $43,027,950 $0 $201,905 $357,356,215
GRAND TOTAL $73,072,155 $171,357,420 $72,150,710 $24,576,710 $5,895,527 $453,715,927 $1,135,312,326 $480,014,243 $185,881,983 $10,123,585 $2,612,100,587
% of Total 3% 7% 3% 1% 0% 17% 43% 18% 7% 0% 100%
Figure 78: Total resource requirements by years (national)
Category 2014 2015 2016 2017 2018 TOTAL
Vaccine Supply and Logistics (routine only) $185,329,186 $239,841,482 $230,940,886 $225,861,309 $242,152,578 $1,124,125,441 43%
Service Delivery $55,772,132 $70,146,280 $80,697,783 $83,138,301 $88,969,245 $378,723,741 14%
Advocacy and Communication $3,749,448 $3,807,708 $4,024,080 $4,146,114 $4,282,740 $20,010,090 1%
Monitoring and Disease Surveillance $5,491,749 $6,613,610 $5,197,284 $5,438,141 $5,611,942 $28,352,726 1%
Programme Management $15,398,505 $16,610,415 $13,506,792 $11,272,040 $10,592,182 $67,379,934 3%
Supplemental Immunization Activities (SIA) (includes vaccine and operation costs) $156,549,542 $127,214,667 $115,601,855 $126,117,382 $110,668,993 $636,152,440 24%
Shared Health Systems Costs $61,327,546 $71,554,300 $70,739,446 $74,222,626 $79,512,297 $357,356,215 14%
GRAND TOTAL $483,618,108 $535,788,463 $520,708,125 $530,195,913 $541,789,978 $2,612,100,587 100%

Comprehensive Multi-Year Plan | Immunization Program of Pakistan Chapter 5: Annexes
106
Figure 79: Total resource requirements (2014-2018) by major cost categories and provinces – routine immunization only
AJK BAL CDA FAT GB ICT KP PUN SIN Total Provinces FED TOTAL
Vaccines - Traditional $1,091,794 $1,346,875 $255,919 $898,213 $327,577 $140,406 $7,563,048 $21,641,063 $7,492,467 $40,757,362 $6,611,208 $47,368,570
Vacccines Underused $4,946,807 $7,555,610 $1,253,555 $4,205,493 $1,575,183 $661,693 $35,560,279 $116,451,915 $41,893,270 $214,103,806 $17,541,872 $231,645,678
Vaccines New $14,742,445 $21,099,065 $3,740,413 $12,450,451 $4,362,757 $1,969,603 $106,118,180 $321,844,145 $118,673,200 $605,000,257 $62,383,949 $667,384,206
Injection Supplies $640,598 $940,969 $146,792 $517,437 $188,134 $82,364 $4,472,902 $15,088,016 $5,364,745 $27,441,957 $2,716,033 $30,157,990
Personnel $15,212,397 $36,479,312 $1,357,959 $19,569,358 $5,916,596 $686,221 $46,238,989 $105,644,830 $78,300,347 $309,406,007 $5,116,312 $314,522,320
Transportation $2,786,797 $5,502,048 $367,532 $4,952,999 $2,359,950 $195,505 $6,975,641 $16,763,331 $21,752,333 $61,656,136 $2,545,285 $64,201,421
Maintenance & overhead $3,863,366 $8,954,442 $258,646 $3,011,397 $1,608,765 $176,559 $12,839,240 $19,804,855 $26,425,064 $76,942,333 $638,045 $77,580,378
Other Routine Recurrent costs $1,166,716 $3,639,684 $249,118 $1,546,682 $1,163,196 $229,036 $6,332,568 $23,891,688 $11,982,049 $50,200,736 $57,307,464 $107,508,200
Total $44,450,919 $85,518,005 $7,629,934 $47,152,031 $17,502,158 $4,141,387 $226,100,847 $641,129,842 $311,883,473 $1,385,508,595 $154,860,168 $1,540,368,763
33.2%
24.7%
49.0%
26.4% 24.9%
47.6% 46.9%50.2%
38.1%43.7%
40.3%43.3%
34.2%
42.7%
17.8%
41.5%33.8%
16.6% 20.5%16.5%
25.1%
22.3%
3.3%
20.4%
0%
10%
20%
30%
40%
50%
60%
70%
80%
90%
100%
AJK BAL CDA FAT GB ICT KP PUN SIN Total Provinces FED TOTAL
Vaccines - Traditional Vaccines - Underused Vaccines - New Injection Supplies
Personnel Transportation Maintenance & overhead Other Routine Recurrent costs

Comprehensive Multi-Year Plan | Immunization Program of Pakistan Chapter 5: Annexes
107
Figure 80: Total (2014-2018) resource requirements by cost category and provinces AJK BAL CDA FAT GB ICT KP PUN SIN FED TOTAL
Routine Recurrent Costs
Vaccines (routine vaccines only) $20,781,046 $30,001,550 $5,249,888 $17,554,157 $6,265,517 $2,771,702 $149,241,506 $459,937,123 $168,058,936 $86,537,029 $946,398,454
Traditional $1,091,794 $1,346,875 $255,919 $898,213 $327,577 $140,406 $7,563,048 $21,641,063 $7,492,467 $6,611,208 $47,368,570
Underused $4,946,807 $7,555,610 $1,253,555 $4,205,493 $1,575,183 $661,693 $35,560,279 $116,451,915 $41,893,270 $17,541,872 $231,645,678
New $14,742,445 $21,099,065 $3,740,413 $12,450,451 $4,362,757 $1,969,603 $106,118,180 $321,844,145 $118,673,200 $62,383,949 $667,384,206
Injection supplies $640,598 $940,969 $146,792 $517,437 $188,134 $82,364 $4,472,902 $15,088,016 $5,364,745 $2,716,033 $30,157,990
Personnel $15,212,397 $36,479,312 $1,357,959 $19,569,358 $5,916,596 $686,221 $46,238,989 $105,644,830 $78,300,347 $5,116,312 $314,522,320
Salaries of full-time NIP health workers (immunization specific) $14,192,481 $29,748,731 $1,340,767 $19,160,433 $5,444,675 $669,494 $45,450,386 $95,998,957 $72,003,388 $4,190,327 $288,199,640
Per-diems for outreach vaccinators/mobile teams $329,891 $1,608,164 $17,191 $275,617 $168,451 $16,727 $649,739 $5,386,009 $1,441,763 $0 $9,893,552
Per-diems for supervision and monitoring $690,025 $5,122,416 $0 $133,308 $303,470 $0 $138,865 $4,259,864 $4,855,195 $925,985 $16,429,128
Transportation $2,786,797 $5,502,048 $367,532 $4,952,999 $2,359,950 $195,505 $6,975,641 $16,763,331 $21,752,333 $2,545,285 $64,201,421
Fixed site strategy (incl. vaccine distribution) $1,466,735 $1,774,854 $193,438 $2,606,842 $1,242,079 $102,897 $2,705,235 $7,133,332 $11,448,596 $1,683,904 $30,357,912
Outreach strategy $1,173,388 $3,549,708 $154,751 $2,085,473 $993,663 $82,318 $3,864,621 $8,916,665 $9,158,877 $777,186 $30,756,651
Mobile strategy $146,674 $177,485 $19,344 $260,684 $124,208 $10,290 $405,785 $713,333 $1,144,860 $84,195 $3,086,858
Maintenance and overhead $3,863,366 $8,954,442 $258,646 $3,011,397 $1,608,765 $176,559 $12,839,240 $19,804,855 $26,425,064 $638,045 $77,580,378
Cold chain maintenance and overheads $3,766,380 $8,246,005 $238,515 $2,871,293 $1,526,961 $127,874 $8,588,970 $16,993,112 $25,925,907 $199,055 $68,484,071
Maintenance of other capital equipment $56,163 $45,191 $6,445 $72,075 $41,958 $5,400 $182,521 $65,166 $386,837 $0 $861,756
Building overheads (electricity, water…) $40,823 $663,246 $13,686 $68,029 $39,846 $43,286 $4,067,748 $2,746,577 $112,320 $438,990 $8,234,550
Short-term training $265,918 $833,710 $22,504 $244,888 $113,560 $23,804 $1,337,208 $2,784,695 $4,499,533 $10,616,242 $20,742,062
IEC/social mobilization $61,139 $635,822 $33,526 $77,401 $61,139 $33,526 $1,233,156 $12,708,044 $936,408 $4,229,929 $20,010,090
Disease surveillance $414,680 $1,866,055 $133,221 $602,664 $602,664 $127,139 $1,359,835 $7,854,883 $3,416,813 $11,974,773 $28,352,726
Programme management $191,139 $304,097 $14,818 $366,647 $128,543 $14,818 $939,098 $544,065 $1,097,163 $4,390,780 $7,991,169
Other routine recurrent costs $233,841 $0 $45,048 $255,082 $257,290 $29,748 $1,463,271 $0 $2,032,132 $26,095,740 $30,412,153
Subtotal $44,450,919 $85,518,005 $7,629,934 $47,152,031 $17,502,158 $4,141,387 $226,100,847 $641,129,842 $311,883,473 $154,860,168 $1,540,368,763
Routine Capital Costs
Vehicles $1,738,920 $3,086,658 $137,460 $1,815,254 $458,160 $128,640 $3,223,248 $5,356,726 $5,931,069 $0 $21,876,136
Cold chain equipment $2,862,333 $13,153,938 $97,302 $2,956,646 $788,896 $79,220 $6,214,575 $7,675,488 $21,316,509 $0 $55,144,908
Other capital equipment $93,443 $72,062 $10,740 $118,150 $70,947 $10,143 $179,918 $87,777 $558,945 $0 $1,202,126
Subtotal $4,694,697 $16,312,658 $245,502 $4,890,051 $1,318,003 $218,003 $9,617,741 $13,119,991 $27,806,523 $0 $78,223,169
Supplemental Immunization Activities (SIA)
Polio Eradication Initiative (PEI) (0-5 years) $7,575,522 $35,817,380 $1,565,440 $12,812,918 $1,885,933 $855,196 $114,261,083 $246,460,670 $80,890,391 $31,021,815 $533,146,346
Vaccines and Injection Supplies $3,128,821 $19,157,950 $672,557 $6,937,817 $963,912 $485,421 $101,236,160 $174,429,964 $34,084,985 $0 $341,097,588
Operational costs $4,446,701 $16,659,430 $892,882 $5,875,101 $922,021 $369,775 $13,024,922 $72,030,705 $46,805,406 $31,021,815 $192,048,758
Measles 6 months-10 years $1,462,253 $1,468,328 $306,334 $1,453,517 $436,239 $159,261 $9,066,350 $14,615,105 $7,934,916 $0 $36,902,303
Vaccines and Injection Supplies $425,939 $839,707 $92,349 $438,949 $131,510 $48,011 $2,484,538 $9,306,754 $3,971,115 $0 $17,738,873
Operational costs $1,036,314 $628,621 $213,986 $1,014,569 $304,729 $111,249 $6,581,811 $5,308,350 $3,963,801 $0 $19,163,430
Measles 9 months-5 years $744,850 $693,374 $174,470 $735,177 $221,366 $90,706 $6,549,743 $6,841,219 $3,783,065 $0 $19,833,969
Vaccines and Injection Supplies $207,947 $373,666 $44,520 $212,920 $63,998 $23,145 $1,814,181 $4,141,461 $1,767,127 $0 $8,648,964
Operational costs $536,903 $319,708 $129,951 $522,257 $157,369 $67,560 $4,735,562 $2,699,757 $2,015,937 $0 $11,185,005
Operational costs $0 $0 $0 $0 $0 $0 $0 $0 $0 $0 $0
Measles 9 months-3 years $0 $0 $0 $0 $0 $0 $0 $0 $0 $0 $0

Comprehensive Multi-Year Plan | Immunization Program of Pakistan Chapter 5: Annexes
108
Vaccines and Injection Supplies $0 $0 $0 $0 $0 $0 $0 $0 $0 $0 $0
Operational costs $0 $1,651,079 $0 $1,698,937 $255,071 $0 $21,141,643 $16,835,166 $4,687,925 $0 $46,269,821
Vaccines and Injection Supplies $0 $1,465,239 $0 $473,961 $71,156 $0 $11,288,162 $14,950,562 $2,370,907 $0 $30,619,987
Operational costs $0 $185,840 $0 $1,224,977 $183,915 $0 $9,853,481 $1,884,604 $2,317,019 $0 $15,649,834
Subtotal $9,782,625 $39,630,161 $2,046,244 $16,700,550 $2,798,609 $1,105,162 $151,018,818 $284,752,159 $97,296,297 $31,021,815 $636,152,440
Shared Health Systems Costs
Shared personnel costs $12,375,235 $29,564,085 $201,905 $3,349,122 $2,898,983 $408,371 $61,837,228 $194,895,390 $39,474,010 $0 $345,004,330
Shared transportation costs $0 $0 $0 $0 $0 $1,609 $1,302,818 $0 $59,815 $0 $1,364,241
Construction of new buildings $1,768,680 $332,512 $0 $58,956 $58,956 $20,995 $3,838,475 $1,414,944 $3,494,126 $0 $10,987,644
Subtotal $14,143,915 $29,896,596 $201,905 $3,408,078 $2,957,939 $430,975 $66,978,521 $196,310,334 $43,027,950 $0 $357,356,215
GRANDTOTAL $73,072,155 $171,357,420 $10,123,585 $72,150,710 $24,576,710 $5,895,527 $453,715,927 $1,135,312,326 $480,014,243 $185,881,983 $2,612,100,587
Routine Immunization $63,289,531 $131,727,259 $8,077,341 $55,450,160 $21,778,100 $4,790,365 $302,697,109 $850,560,167 $382,717,947 $154,860,168 $1,975,948,147
Supplemental Immunization Activities $9,782,625 $39,630,161 $2,046,244 $16,700,550 $2,798,609 $1,105,162 $151,018,818 $284,752,159 $97,296,297 $31,021,815 $636,152,440
Figure 81: Total financing by type of financing, sources of financing and provinces (2014-2018)
Secured Financing
Funding Source AJK BAL CDA FAT FED GB ICT KP PUN SIN Total
Provincial Government $26,086,659 $85,018,989 $1,020,902 $12,020,388 $0 $6,958,195 $930,021 $114,885,232 $344,863,644 $109,526,810 $701,310,840
Gov. Co-Financing $217,251 $1,276,197 $59,753 $344,652 $0 $135,108 $68,589 $4,621,844 $19,280,274 $9,907,459 $35,911,128
UNICEF $60,981 $0 $0 $128,427 $4,901,024 $89,464 $0 $366,270 $0 $1,424,130 $6,970,296
WHO $206,691 $0 $80,714 $907,904 $2,800,000 $343,616 $63,749 $0 $0 $9,955,335 $14,358,009
World Bank $0 $0 $0 $0 $0 $0 $0 $0 $0 $0 $0
PEI $2,866,777 $9,207,774 $508,481 $9,118,869 $32,651,749 $717,928 $460,512 $43,514,681 $94,537,988 $6,578,593 $200,163,352
Gov't of China $188,096 $596,978 $51,601 $204,762 $0 $78,571 $42,857 $646,446 $3,162,000 $434,133 $5,405,444
USAID $0 $0 $525 $12,051 $1,681,115 $0 $525 $118,105 $0 $580,015 $2,392,336
Federal Government $2,277,342 $2,287,844 $402,711 $1,926,031 $11,410,236 $515,712 $222,770 $50,000 $36,729,078 $13,619,797 $69,441,521
GAVI (ISS , NVS, HSS) $6,693,748 $8,366,614 $1,778,116 $6,427,701 $1,915,736 $1,817,252 $948,425 $49,865,846 $152,936,402 $40,547,516 $271,297,356
Others40 $150,028 $0 $30,419 $0 $2,864,145 $46,035 $17,046 $749,793 $0 $0 $3,857,466
Grand Total $38,747,573 $106,754,396 $3,933,222 $31,090,785 $58,224,005 $10,701,881 $2,754,495 $214,818,217 $651,509,387 $192,573,788 $1,311,107,749
Probable Financing
Funding Source AJK BAL CDA FAT FED GB ICT KP PUN SIN Total
Provincial Government $1,768,680 $2,463,186 $17,191 $933,017 $0 $58,956 $16,727 $14,955,003 $18,471,712 $0 $38,684,473
40 CDC, CIDA, JICA, DFID, Rotary Int., etc

Comprehensive Multi-Year Plan | Immunization Program of Pakistan Chapter 5: Annexes
109
Gov. Co-Financing $593,111 $0 $144,350 $1,127,980 $0 $388,128 $154,814 $13,358,946 $0 $25,804,369 $41,571,698
UNICEF $150,691 $7,894,711 $48,344 $1,996,638 $0 $363,289 $48,344 $21,364,643 $6,999,318 $542,453 $39,408,431
WHO $587,461 $8,489,005 $108,277 $245,921 $0 $470,654 $105,160 $0 $4,793,454 $19,326,310 $34,126,243
World Bank $168,241 $5,847,457 $10,711 $175,656 $15,888,363 $159,244 $10,711 $735,000 $0 $0 $22,995,382
PEI $4,705,244 $0 $997,815 $3,694,049 $0 $1,168,005 $394,684 $70,884,402 $0 $0 $81,844,200
Gov't of China $0 $0 $0 $0 $0 $0 $0 $0 $0 $0 $0
USAID $0 $0 $547 $0 $0 $0 $547 $850,000 $0 $0 $851,094
Federal Government $587,536 $0 $113,256 $0 $86,537,029 $165,719 $60,884 $0 $0 $13,510,568 $100,974,991
GAVI (ISS , NVS, HSS) $13,019,231 $28,183,197 $3,177,552 $12,040,116 $0 $3,935,723 $1,584,018 $90,510,702 $285,410,124 $91,268,095 $529,128,758
Others $0 $5,114,912 $0 $0 $0 $0 $0 $0 $4,213,965 $0 $9,328,878
Grand Total $21,580,194 $57,992,469 $4,618,044 $20,213,377 $102,425,392 $6,709,717 $2,375,889 $212,658,695 $319,888,575 $150,451,795 $898,914,147
Total Financing
Funding Source AJK BAL CDA FAT FED GB ICT KP PUN SIN Total
Provincial Government $27,855,339 $87,482,175 $1,038,093 $12,953,405 $0 $7,017,151 $946,748 $129,840,235 $363,335,357 $109,526,810 $739,995,313
Gov. Co-Financing $810,362 $1,276,197 $204,103 $1,472,632 $0 $523,236 $223,403 $17,980,790 $19,280,274 $35,711,828 $77,482,826
UNICEF $211,672 $7,894,711 $48,344 $2,125,065 $4,901,024 $452,753 $48,344 $21,730,913 $6,999,318 $1,966,583 $46,378,727
WHO $794,151 $8,489,005 $188,991 $1,153,825 $2,800,000 $814,270 $168,909 $0 $4,793,454 $29,281,646 $48,484,252
World Bank $168,241 $5,847,457 $10,711 $175,656 $15,888,363 $159,244 $10,711 $735,000 $0 $0 $22,995,382
PEI $7,572,022 $9,207,774 $1,506,297 $12,812,918 $32,651,749 $1,885,933 $855,196 $114,399,083 $94,537,988 $6,578,593 $282,007,552
Gov't of China $188,096 $596,978 $51,601 $204,762 $0 $78,571 $42,857 $646,446 $3,162,000 $434,133 $5,405,444
USAID $0 $0 $1,072 $12,051 $1,681,115 $0 $1,072 $968,105 $0 $580,015 $3,243,430
Federal Government $2,864,878 $2,287,844 $515,967 $1,926,031 $97,947,265 $681,430 $283,655 $50,000 $36,729,078 $27,130,364 $170,416,513
GAVI (ISS , NVS, HSS) $19,712,978 $36,549,811 $4,955,668 $18,467,817 $1,915,736 $5,752,975 $2,532,443 $140,376,547 $438,346,526 $131,815,611 $800,426,114
Others $150,028 $5,114,912 $30,419 $0 $2,864,145 $46,035 $17,046 $749,793 $4,213,965 $0 $13,186,344
Grand Total $60,327,768 $164,746,866 $8,551,265 $51,304,162 $160,649,397 $17,411,598 $5,130,383 $427,476,912 $971,397,961 $343,025,583 $2,210,021,896
Figure 82: Total financing by type of financing, sources and years
Secured Financing
Funding Source 2014 2015 2016 2017 2018 Total
Provincial Government $115,906,409 $134,217,692 $149,949,584 $153,892,755 $147,344,400 $634,006,019
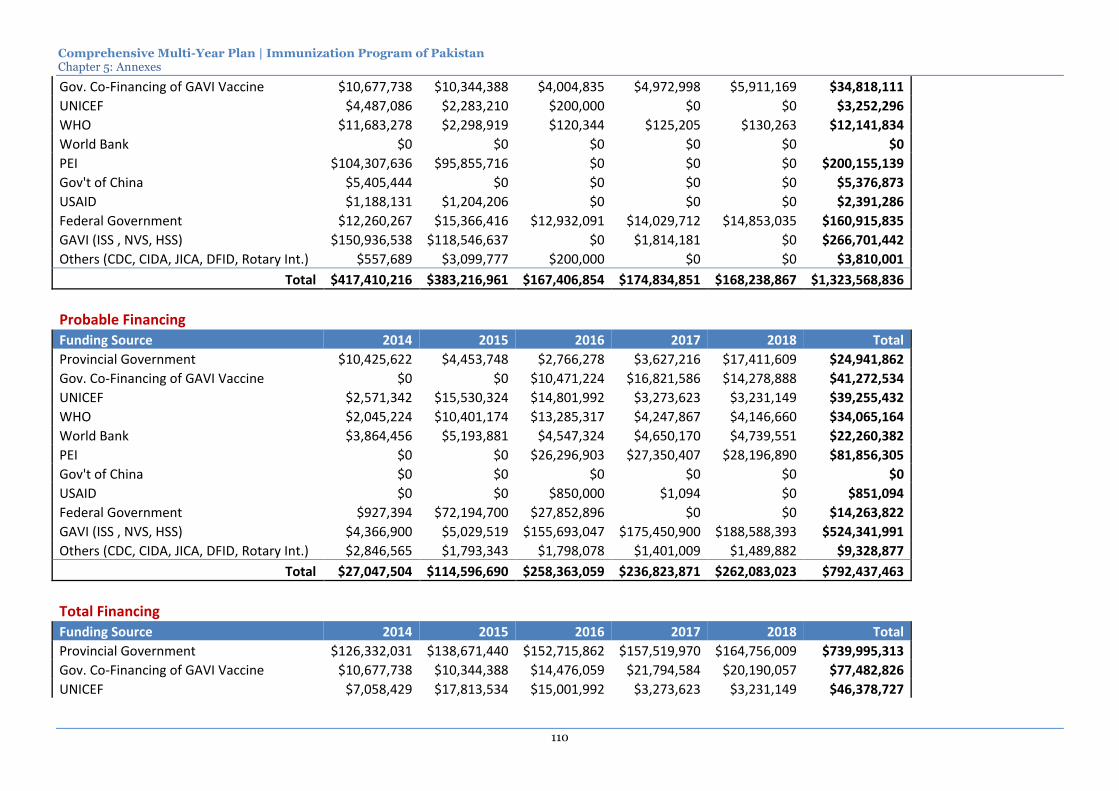
Comprehensive Multi-Year Plan | Immunization Program of Pakistan Chapter 5: Annexes
110
Gov. Co-Financing of GAVI Vaccine $10,677,738 $10,344,388 $4,004,835 $4,972,998 $5,911,169 $34,818,111
UNICEF $4,487,086 $2,283,210 $200,000 $0 $0 $3,252,296
WHO $11,683,278 $2,298,919 $120,344 $125,205 $130,263 $12,141,834
World Bank $0 $0 $0 $0 $0 $0
PEI $104,307,636 $95,855,716 $0 $0 $0 $200,155,139
Gov't of China $5,405,444 $0 $0 $0 $0 $5,376,873
USAID $1,188,131 $1,204,206 $0 $0 $0 $2,391,286
Federal Government $12,260,267 $15,366,416 $12,932,091 $14,029,712 $14,853,035 $160,915,835
GAVI (ISS , NVS, HSS) $150,936,538 $118,546,637 $0 $1,814,181 $0 $266,701,442
Others (CDC, CIDA, JICA, DFID, Rotary Int.) $557,689 $3,099,777 $200,000 $0 $0 $3,810,001
Total $417,410,216 $383,216,961 $167,406,854 $174,834,851 $168,238,867 $1,323,568,836
Probable Financing
Funding Source 2014 2015 2016 2017 2018 Total
Provincial Government $10,425,622 $4,453,748 $2,766,278 $3,627,216 $17,411,609 $24,941,862
Gov. Co-Financing of GAVI Vaccine $0 $0 $10,471,224 $16,821,586 $14,278,888 $41,272,534
UNICEF $2,571,342 $15,530,324 $14,801,992 $3,273,623 $3,231,149 $39,255,432
WHO $2,045,224 $10,401,174 $13,285,317 $4,247,867 $4,146,660 $34,065,164
World Bank $3,864,456 $5,193,881 $4,547,324 $4,650,170 $4,739,551 $22,260,382
PEI $0 $0 $26,296,903 $27,350,407 $28,196,890 $81,856,305
Gov't of China $0 $0 $0 $0 $0 $0
USAID $0 $0 $850,000 $1,094 $0 $851,094
Federal Government $927,394 $72,194,700 $27,852,896 $0 $0 $14,263,822
GAVI (ISS , NVS, HSS) $4,366,900 $5,029,519 $155,693,047 $175,450,900 $188,588,393 $524,341,991
Others (CDC, CIDA, JICA, DFID, Rotary Int.) $2,846,565 $1,793,343 $1,798,078 $1,401,009 $1,489,882 $9,328,877
Total $27,047,504 $114,596,690 $258,363,059 $236,823,871 $262,083,023 $792,437,463
Total Financing
Funding Source 2014 2015 2016 2017 2018 Total
Provincial Government $126,332,031 $138,671,440 $152,715,862 $157,519,970 $164,756,009 $739,995,313
Gov. Co-Financing of GAVI Vaccine $10,677,738 $10,344,388 $14,476,059 $21,794,584 $20,190,057 $77,482,826
UNICEF $7,058,429 $17,813,534 $15,001,992 $3,273,623 $3,231,149 $46,378,727

Comprehensive Multi-Year Plan | Immunization Program of Pakistan Chapter 5: Annexes
111
WHO $13,728,502 $12,700,093 $13,405,661 $4,373,072 $4,276,923 $48,484,252
World Bank $3,864,456 $5,193,881 $4,547,324 $4,650,170 $4,739,551 $22,995,382
PEI $104,307,636 $95,855,716 $26,296,903 $27,350,407 $28,196,890 $282,007,552
Gov't of China $5,405,444 $0 $0 $0 $0 $5,405,444
USAID $1,188,131 $1,204,206 $850,000 $1,094 $0 $3,243,430
Federal Government $13,187,661 $87,561,117 $40,784,987 $14,029,712 $14,853,035 $170,416,513
GAVI (ISS , NVS, HSS) $155,303,438 $123,576,156 $155,693,047 $177,265,081 $188,588,393 $800,426,114
Others (CDC, CIDA, JICA, DFID, Rotary Int.) $3,404,254 $4,893,120 $1,998,078 $1,401,009 $1,489,882 $13,186,344
Total $444,457,720 $497,813,651 $425,769,913 $411,658,721 $430,321,890 $2,210,021,896

Comprehensive Multi-Year Plan | Immunization Program of Pakistan Chapter 5: Annexes
112
Figure 83: Composition of the Funding Gap with secured financing only by provinces (2014-2018) (shared costs are not included)
Funding gap components
AJK BAL FAT GB ICT KP PUN SIN CDA FED TOTAL
Vaccines and inj. equip. $13,612,342 $19,746,028 $12,432,919 $4,323,851 $1,738,832 $99,134,086 $274,165,746 $117,072,464 $3,321,903 $86,537,029 $632,085,199
Personnel $5,807,963 $0 $10,833,735 $3,289,008 $311,510 $284,595 $0 $26,106,340 $950,507 $0 $47,583,659
Transport $2,329,419 $0 $4,075,034 $1,572,223 $152,112 $0 $0 $15,472,396 $273,775 $0 $23,874,960
Activities and other recurrent costs $916,297 $6,872,701 $2,682,392 $1,742,296 $239,383 $14,214,422 $20,380,397 $25,839,554 $167,879 $41,120,949 $114,176,270
Logistics $3,852,251 $7,963,560 $4,072,050 $1,125,646 $131,926 $9,474,884 $4,935,232 $26,180,411 $190,759 $0 $57,926,720
Campaigns $6,037,630 $29,688,223 $6,128,163 $1,762,848 $546,274 $96,952,876 $182,906,619 $73,605,424 $1,285,541 $0 $398,913,600
Total $0 $0 $776,675 $0 $0 $14,998,371 $0 $33,740 $0 $0 $15,808,786
Figure 84: Composition of the funding GAP with problable financing by provinces (2014-2018) (shared costs are not included
Funding gap components
AJK BAL FAT GB ICT KP PUN SIN CDA FED TOTAL
Vaccines and inj. equip. $0 $0 $0 $0 $0 $0 $0 $0 $0 $0 $0
Personnel $5,807,963 $0 $10,691,207 $3,289,008 $294,783 $0 $0 $26,106,340 $933,316 $0 $47,122,618
Transport $2,329,419 $0 $4,075,034 $1,572,223 $152,112 $0 $0 $15,472,396 $273,775 $0 $23,874,960
Activities and other recurrent costs $9,905 $0 $1,949,300 $956,867 $74,621 $12,332,708 $0 $25,839,554 $0 $25,232,586 $66,395,541
Logistics $3,852,251 $0 $4,072,050 $1,125,646 $131,926 $9,474,884 $0 $25,637,958 $190,759 $0 $44,485,475
Campaigns $744,850 $6,610,555 $0 $221,366 $90,706 $191,270 $163,914,364 $40,768,546 $174,470 $0 $212,716,128
Total $0 $0 $0 $0 $0 $1,001,678 $0 $33,740 $0 $0 $1,035,418
Figure 85: Structure of the funding gap for “Activities and other recurrent cots” by provinces (2014-2018)
AJK BAL CDA FAT GB ICT KP PUN SIN FED National
Cold chain maintenance and overheads $0 $0 $0 $1,944,861 $956,867 $74,621 $6,389,421 $0 $15,244,153 $0 $24,609,924 Maintenance of other capital equipment $0 $0 $0 $0 $0 $0 $60,100 $0 $245,320 $0 $305,419 Building overheads (electricity, water…) $9,905 $0 $0 $4,439 $0 $0 $924,497 $0 $69,855 $0 $1,008,696 Short-term training $0 $0 $0 $0 $0 $0 $1,030,718 $0 $4,241,799 $0 $5,272,517 IEC/social mobilization $0 $0 $0 $0 $0 $0 $1,053,872 $0 $727,834 $3,367,673 $5,149,379 Disease surveillance $0 $0 $0 $0 $0 $0 $1,262,835 $0 $2,826,672 $4,329,495 $8,419,001 Program management $0 $0 $0 $0 $0 $0 $613,680 $0 $923,113 $945,962 $2,482,755 Other routine recurrent costs $0 $0 $0 $0 $0 $0 $997,585 $0 $1,560,808 $16,589,456 $19,147,849
Total $9,905 $0 $0 $1,949,300 $956,867 $74,621 $12,332,708 $0 $25,839,554 $25,232,586 $66,395,541

Comprehensive Multi-Year Plan | Immunization Program of Pakistan Chapter 5: Annexes
113
Figure 86: Costs and resource requirements of SIA by provinces, cost categories and years
All SIA
Province 2012 2014 2015 2016 2017 2018 Total (2014-2018)
AJK 1,239,822 2,872,072 1,460,458 1,513,060 2,312,556 1,624,479 9,782,625
BAL 7,984,126 8,167,464 7,408,563 7,606,538 8,517,603 7,929,992 39,630,161
CDA 158,248 581,473 292,485 311,382 506,452 354,452 2,046,244
FAT 2,122,574 6,258,873 4,956,711 1,532,825 2,317,847 1,634,294 16,700,550
GB 194,434 836,725 413,846 427,694 663,415 456,929 2,798,609
ICT 95,270 383,627 236,146 124,451 222,071 138,868 1,105,162
KP 4,979,795 30,324,377 32,497,334 33,540,715 30,248,994 24,407,397 151,018,818
PUN 44,801,426 64,568,092 51,119,240 52,821,474 60,904,551 55,338,802 284,752,159
SIN 13,726,007 24,664,818 15,700,088 17,723,715 20,423,894 18,783,781 97,296,297
FED 0 17,892,020 13,129,795 0 0 0 31,021,815
Total 75,301,701 156,549,542 127,214,667 115,601,855 126,117,382 110,668,993 636,152,440
Polio Details
Province Polio costs 2012 2014 2015 2016 2017 2018 Total (2014-2018)
AJK Vaccines and Injection Supplies 421,024 596,320 610,692 625,409 640,482 655,917 3,128,821
AJK Operational costs 818,798 813,499 849,766 887,651 927,224 968,561 4,446,701
BAL Vaccines and Injection Supplies 3,524,685 3,651,280 3,754,985 3,821,825 3,929,954 3,999,906 19,157,950
BAL Operational costs 3,062,460 3,047,856 3,197,111 3,319,100 3,481,266 3,614,097 16,659,430
CDA Vaccines and Injection Supplies 10,247 129,289 131,849 134,460 137,122 139,837 672,557
CDA Operational costs 148,001 145,849 160,636 176,922 194,859 214,615 892,882
FAT Vaccines and Injection Supplies 74,950 2,458,138 2,511,971 641,746 655,800 670,162 6,937,817
FAT Operational costs 2,047,624 2,031,378 2,117,382 551,757 575,117 599,467 5,875,101
GB Vaccines and Injection Supplies 23,312 184,116 188,351 192,683 197,114 201,648 963,912
GB Operational costs 171,122 169,057 176,404 184,071 192,071 200,418 922,021
ICT Vaccines and Injection Supplies 4,497 134,433 137,095 69,905 71,289 72,700 485,421
ICT Operational costs 90,773 89,933 99,051 54,547 60,077 66,168 369,775
KP Vaccines and Injection Supplies 2,774,795 18,921,980 19,644,857 20,185,090 20,953,999 21,530,234 101,236,160
KP Operational costs 2,205,000 2,336,047 2,473,797 2,592,663 2,745,253 2,877,163 13,024,922
PUN Vaccines and Injection Supplies 31,629,546 33,455,380 34,050,887 35,014,281 35,637,535 36,271,882 174,429,964
PUN Operational costs 13,171,880 13,262,832 13,768,889 14,441,618 14,992,653 15,564,712 72,030,705
SIN Vaccines and Injection Supplies 5,491,554 6,578,593 6,695,692 6,814,875 6,936,180 7,059,644 34,084,985
SIN Operational costs 8,234,453 8,673,452 9,004,396 9,347,968 9,704,649 10,074,940 46,805,406
FED Vaccines and Injection Supplies 0 0 0 0 0 0 0

Comprehensive Multi-Year Plan | Immunization Program of Pakistan Chapter 5: Annexes
114
FED Operational costs 0 17,892,020 13,129,795 0 0 0 31,021,815
Total 73,904,720 114,571,453 112,703,607 99,056,570 102,032,644 104,782,071 533,146,346
Polio Summary
Provinces 2012 2014 2015 2016 2017 2018 Total (2014-2018)
AJK 1,239,822 1,409,819 1,460,458 1,513,060 1,567,706 1,624,479 7,575,522
BAL 6,587,145 6,699,136 6,952,096 7,140,925 7,411,220 7,614,003 35,817,380
FAT 158,248 275,139 292,485 311,382 331,981 354,452 1,565,440
GB 2,122,574 4,489,516 4,629,353 1,193,503 1,230,917 1,269,629 12,812,918
ICT 194,434 353,173 364,755 376,754 389,185 402,066 1,885,933
KP 95,270 224,366 236,146 124,451 131,365 138,868 855,196
PUN 4,979,795 21,258,027 22,118,654 22,777,753 23,699,252 24,407,397 114,261,083
SIN 44,801,426 46,718,212 47,819,776 49,455,899 50,630,188 51,836,594 246,460,670
FED 13,726,007 15,252,045 15,700,088 16,162,844 16,640,830 17,134,584 80,890,391
Total Polio 73,904,720 0 17,892,020 13,129,795 0 0 0
Vaccines and Injection Supplies 43,954,610
Operational costs 29,950,110 73,904,720 114,571,453 112,703,607 99,056,570 102,032,644 104,782,071
Other SIA
Provinces 2012 2014 2015 2016 2017 2018 Total (2014-2018)
AJK 0 1,462,253 0 0 744,850 0 2,207,103
BAL 1,396,981 1,468,328 456,467 465,613 1,106,384 315,989 3,812,781
CDA 0 306,334 0 0 174,470 0 480,805
FAT 0 1,769,357 327,358 339,322 1,086,929 364,666 3,887,632
GB 0 483,552 49,091 50,940 274,230 54,863 912,676
ICT 0 159,261 0 0 90,706 0 249,966
KP 0 9,066,350 10,378,681 10,762,962 6,549,743 0 36,757,735
PUN 0 17,849,881 3,299,464 3,365,575 10,274,363 3,502,208 38,291,490
SIN 0 9,412,773 0 1,560,872 3,783,065 1,649,196 16,405,906
FED 0 0 0 0 0 0 0
Total 1,396,981 41,978,089 14,511,060 16,545,285 24,084,738 5,886,922 103,006,094
Other SIA as % of Total SIA 27% 11% 14% 19% 5% 16%
Polio SIA as % of Total SIA 73% 89% 86% 81% 95% 84%

Comprehensive Multi-Year Plan | Immunization Program of Pakistan
115
Annex 9: Costing and Financing (Federal)
0. Demographics
Population estimate for 2012 and projections for population growth, birth rate, infant mortality
rate and CBAW share are based on NISP figures and are used for the calculation of vaccine buffers
at the national level in section 1. Vaccine and Injection supplies.
1. Vaccines & Injection Supplies
No costs were entered for vaccines and injection supplies in 2012 in order to avoid double-
counting of vaccine costs – vaccines and injection supplies were consumed in provinces, therefore
the corresponding expenditures are reflected in provincial cMYPs and Federal Government is
indicated as source of financing whenever vaccines were purchased by the Federal Government
and then distributed to provinces.
50% coverage rate is projected for all existing vaccines in 2015 – it corresponds to the 6 month
buffer stock that has to be created at the national level according to the National Immunization
Policy draft. It is assumed that buffer stocks for all vaccines are depleted at the national level, so
the Federal Government has to finance the purchase of all vaccines to establish the buffer stock in
addition to vaccine needs forecasted by provinces. As to Rotavirus, it will be introduced in 2016
and 25% buffer stock is already considered by provinces that is equivalent to 3 month buffer as
defined in the National Immunization Policy draft. Therefore, the Federal Government has to
purchase 6 month buffer stock amount (equivalent to the annual consumption with 50% coverage).
Financing of the establishment of the buffer stock at the national level is considered “probable”.
2. Personnel Costs
Personnel costs are calculated based on the staffing table of the Federal EPI Cell (see Figure 95 on
page 127) and salary rates of public servants.
It is assumed that existing vacancies will be filled in 2014 unless the Federal EPI Cell structure is
optimized as a result of activities under Objective 1 (see Strategy 1.1 “Streamline management
processes (both at federal and provincial levels):” on page 37).
3. Vehicles & Transport Costs
Past expenditures and future resource requirements were calculated based on the following
assumptions (see Figure 87 below):
Figure 87: Federal EPI Cell vehicle fleet characteristics
Type of Vehicle Average Price for a New Vehicle of this
Type (in Rs)
Fuel consumption (Liters per 100
km)
Distance (Avg. Kilometers per
year)
#Total as of 2012
#New in 2013
Double Cabin / 4 WD 3,500,000 14 4000*12 2 4
Single Cabin 2,500,000 12 4000*12 2 2
Toyota Corolla 1,800,000 12 ------ 0 0
Motorcycles 90,000 2 1200*12 0 0
Bicycle N-A -N-A 0 0
Truck -N-A -N-A 3,000*12 0 2
Refrigerated Truck Large -N-A -N-A 2,000*12 2 2
Refrigerated Truck Medium -N-A -N-A N-A 0 6
Refrigerated Van Toyota Hilux 221,00,000 12 3,000*12 2 4
Although the Federal Cell purchased new vehicles in 2013, they were entered in the costing tool as
“New in 2012” in order to estimate corresponding running and maintenance costs in 2014-2018.

Comprehensive Multi-Year Plan | Immunization Program of Pakistan Chapter 5: Annexes
116
Federal EPI Cells outsourced transportation services for the delivery of vaccines (2012 expenditure
amounted to 31 million PKR); it was assumed that transportation service outsourcing remains at
the same level in the future.
4. Cold Chain Equipment, Maintenance & Overheads
Only existing 27 walk-in cold rooms (with average price for new – 2.5 million PKR) were counted
with no expansion plans.
5. Operational Cost of Campaigns
No costs were inquired at the Federal level for running campaigns in provinces 2012. However, a
portion of operational costs of polio campaigns that is not reflected in provincial cMYPs was
projected for 2014 (17.9 million US$) and 2015 (13.1 million US$).
5. Program Activities, Other Recurrent Costs and Surveillance
Social Mobilization
UNICEF intends to support “demand generation and creating awareness for routine EPI activities
through CSOs and community development) providing 60,000 US$ financing in 2014.
The Federal EPI Cell allocated 785,349 US$ to health education activities and producing printing
materials that will be financed from GAVI ISS in 2014, but no funding has been mobilized for
subsequent years.
Trainings
Middle Level management (MLM) initial and bi-annual training costs were estimated at 2 million
US$ per year and are
supposed to be financed by
the WB project (although
trainings will be conducted
in provinces, the project is
considered as national).
Program management
It was estimated that
expansion of CCEM
nationwide (it covers now
only PEI targeted areas) will
cost 710 thousand US$ in
2014 and 473 thousand US$
in 2015; no financing was
available to cover this cost.
EPI and PEI integration costs were estimated at 1.63 million US$ (in 2014-2015) and are expected
to be financed from PEI funds.
WHO plans to provide technical assistance to federal and provincial health authorities to
strengthen their capacity, improve planning practices and strengthen routine immunization. The
cost of planned activities was estimated at 1 million US$ in 2014 and 360 thousand US$ in 2015. In
addition, WHO will support strengthening the decision making process of NITAG and NICC
(estimated at 20,000 US$ in 2014).
Other Activities
vLMIS development, nationwide wide deployment and maintenance was estimated at 20.96
million US$ (without accounting for inflation) excluding construction of warehouses (see budget
and financing details in Figure 93 on page 123). USAID financing of 1.68 million US$ was assessed
Figure 88: Federal EPI Expenditure for FY 2011-12 (in PKR)
Expenditure Heads Amount Classification
Recruitment/Establishment 23,212,946 Recurrent
Civil Works 100,000,000 Capital
POL, Repairs & Maintenance 6,829,892 Recurrent
Stationary 1,155,710 Recurrent
Utilities 10,401,392 Recurrent
Transport 31,868,358 Recurrent
Miscellaneous 7,967,090 Recurrent
HEA & Printing 31,151,712 Recurrent
Total 212,587,100
Source: WB Pakistan data, unpublished

Comprehensive Multi-Year Plan | Immunization Program of Pakistan Chapter 5: Annexes
117
as “secured”, and the remaining 5.75 million US$ financing is required to cover investment costs.
Operation and HR support costs (3.72 and 9.8 million US$ respectively) is unfunded.
Improvement of the routine immunization coverage and logistics includes a set of interventions
financed and/or implemented by partners:
WHO plans to direct its support to the improvement of routine coverage for both 1st and 2nd
dose of measles vaccination, supply and logistics for strengthening routine immunization and
introduction of Hep B birth dose (estimated at 120,000 US$ in 2014).
UNICEF plans to provide technical support to introduce and support methodologies to
identify main drivers of inequities shifting the focus beyond national level planning for RED
and REUC. UNICEF allocated 248,000 in 2014 (from GAVI funds under 2.2.1 of GAVI
Business Plan). In addition to that, UNICEF intends to spend 410 thousand US$ on the
introduction of HepB birth doe for improved neonatal care in 2015 (from GAVI HSS funding),
approximately 3 million US$ on WASH, Nutrition, MNCH and EPI in 2014-2016 (from CIDA
Polio Plus grant).
Surveillance
It is planned to conduct nationwide immunization coverage surveys every year to be financed by
the WB project (1 million US$ per survey).
Surveillance also includes costs associated with VPD, Measles case based, bacterial meningitis and
rota virus surveillance activities. This cost (250 thousand US$) will be financed from GAVI ISS in
2014, but no funding is available for afterwards. GAVI ISS is expected to finance surveillance
related supportive activities (802 thousand US$) but no financing is available later.
WHO plans to support the country in establishing CRS sentinel surveillance in 2014-2015 (with
total financing of 20,000 US$). In addition, WHO’s support to the use of surveillance and
immunization data for monitoring and evaluation of the immunization program is estimated at
700,000 US$ in 2015 and the post introduction evaluation at 10,000 US$ in 2015.
6. Other Equipment Needs and Capital Costs
No costs for other equipment or capital costs were projected.
7. Building & Building Overheads
Building and overhead costs include main building (50% of space used for EPI offices), and 4 other
constructions belonging to the Federal EPI Cell. This cost reflected in the shared healthcare system
costs.
Resource requirements
Immunization program needs at the federal level are estimated at 150 million US$, out of which 31
million US$ is required for polio campaigns in 2014 and 2015 (not covered by provinces) as shown
in Figure 89 below”
Figure 89: Immunization program resource requirements at the federal level by cost categories
Cost Category 2014 2015 2016 2017 2018 Total
Traditional Vaccines $0 $6,611,208 $0 $0 $0 $6,611,208
Underused Vaccines $0 $17,541,872 $0 $0 $0 $17,541,872
New Vaccines $0 $41,345,928 $21,038,021 $0 $0 $62,383,949
Injection supplies $0 $2,716,033 $0 $0 $0 $2,716,033
Personnel $925,924 $972,220 $1,020,831 $1,071,872 $1,125,466 $5,116,312
Transportation $466,524 $486,813 $508,056 $530,300 $553,592 $2,545,285
Other routine recurrent costs $13,554,822 $14,985,444 $11,059,576 $9,731,101 $8,614,566 $57,945,508

Comprehensive Multi-Year Plan | Immunization Program of Pakistan Chapter 5: Annexes
118
Cost Category 2014 2015 2016 2017 2018 Total
Vehicles $0 $0 $0 $0 $0 $0
Cold chain equipment $0 $0 $0 $0 $0 $0
Other capital equipment $0 $0 $0 $0 $0 $0
Campaigns $17,892,020 $13,129,795 $0 $0 $0 $31,021,815
Total $32,839,290 $97,789,313 $33,626,484 $11,333,273 $10,293,624 $185,881,983
A sharp increase in resource requirements in 2015 is caused by an intention to establish national
level buffer stock (equivalent to 6 month consumption) as described in 4.2.2 (on page 58).
If vaccine (buffer stock) and campaign related costs are excluded, the resource requirement at the
federal level amounts to 68 million US$ in 2014-2018 out of which up to 58 million US$ are
needed for programmatic activities and the rest for the operation of the Federal Cell.
Figure 90: Immunization program resource requirements at the federal level by cMYP components and years (thousand US$)
cMYP Component 2014 2015 2016 2017 2018 Total
Vaccine Supply and Logistics (routine only) 38 68,254 21,078 41 41 89,452
Service Delivery 1,392 1,459 1,529 1,602 1,679 7,662
Advocacy and Communication 862 817 833 850 867 4,230
Monitoring and Disease Surveillance 2,037 3,451 2,119 2,162 2,205 11,975
Program Management 10,617 10,678 8,067 6,679 5,501 41,542
SIA 17,892 13,130 0 0 0 31,022
Shared Health Systems Costs 0 0 0 0 0 0
Total 32,839 97,789 33,626 11,333 10,294 185,882
Future financing
The government is main source of financing: 62% of expected financing comes from the federal
government and another 21% from NEAP that constitutes in total 83% of financing (as Figure 91
below).
Figure 91: Immunization program financing (secured + probable) and funding gap at the federal level (thousand US$) by years and financing sources
Secure + Probable Funding 2014 2015 2016 2017 2018 Total
Federal Government $1,670 $70,038 $22,694 $1,732 $1,812 $97,947
GAVI (ISS , NVS, HSS) $1,916 $0 $0 $0 $0 $1,916
UNICEF $1,120 $1,680 $0 $0 $0 $2,800
World Bank $2,418 $2,283 $200 $0 $0 $4,901
Others (CDC, CIDA, JICA, DFID) $3,024 $3,121 $3,184 $3,247 $3,312 $15,888
PEI $18,707 $13,945 $0 $0 $0 $32,652
USAID $958 $723 $0 $0 $0 $1,681
Total Funding $29,813 $94,655 $26,078 $4,980 $5,124 $157,785
Total Cost / Resource Needs $32,839 $97,789 $33,626 $11,333 $10,294 $217,623
Funding Gap $3,026 $3,134 $7,548 $6,354 $5,170 $59,838
The funding gap constitutes 27% of the resource requirements in 2014-2018 and amounts to 60
million US$.

Comprehensive Multi-Year Plan | Immunization Program of Pakistan Chapter 5: Annexes
119
Annex 10: Integrated EPI and PEI district micro-planning
The routine immunization micro-plan is to be developed at UC level by the UC immunization team
headed by UCMO. The local vaccinator, LHV, LHSs, Nutrition supervisor, CDC supervisor,
Sanitary Petrol and other local immunization staff will form the team to develop this micro-plan.
UCPWs and UCOs will facilitate and support in this exercise providing information from Polio SIA
micro-plan. District level Polio staff may also provide technical support wherever necessary.
Step 1
The first step of developing UC micro-plan will be to draw a UC map showing all health facilities,
functioning EPI centers, community/villages with their tentative monthly target for <1 yr children,
major geographical landmarks e.g. river, canal, roads etc. Existing Polio SIA micro-plan map can
be used for this purpose.
Step 2
The second step will be to identify the catchment area of the existing EPI fixed center on the map.
This can be done by demarcating an area 3 km radius or 30 minutes travel distance around the
fixed center(s). Normal mode of transport for local people should be considered for measuring
travel distance.
Step 3
The third step will be dividing the rest of the area of the UC (excluding the fixed center catchment
area identified in step 2) in to 15 – 18 blocks. Boundary of village/community, major landmark e.g.
river, canal, roads, target children etc. to be considered for identifying these blocks. Each block is
to be assigned for an outreach team for one day. Location of vaccination sites for outreach services
in the blocks will be identified in the micro-plan and local community will be informed about its
location and date/day when the vaccinator will be visiting.
Step 4
The fourth step will be assigning specific date for conduction of outreach session in each of these
blocks. Name of the immunization staff who will conduct the vaccination session on that particular
date also has to be specified in the micro-plan. Depending on number of immunization staff
available in the UC, more than one outreach vaccination session can be planned on any given day.
If there is no SIA scheduled in any particular month, then the required number of days dedicated
to routine immunization outreach service can be increased in that month. If there are one or more
SIAs in a month then a lesser number of outreach sessions will be held in that month. Attempts are
to be made so outreach sessions are conducted in blocks having maximum number of target
children in such months.
Step 5
The fifth step will be developing vaccine and logistics distribution, transportation and supervision
plan for each outreach vaccination session.
UC should develop the micro-plan for at least for one quarter (3 months) at a time and copy of that
micro-plan to be kept at Tehsil/Taluka and district level. The session plan should
consider/integrate Polio SIAs (as well as other vaccination campaigns e.g. measles) as well.

Comprehensive Multi-Year Plan | Immunization Program of Pakistan Chapter 5: Annexes
120
Annex 11: EPI performance Indicators to be shared by DHT to DPEC
1. What percentage of UCs in the district developed an integrated micro-plan for outreach vaccination session
%
2. Number of vaccination sessions at EPI fixed center were monitored in the district by PEI staff
#
3. Number of vaccination sessions at EPI fixed center were monitored in the district by UCMOs and other Health department staff
#
4. Number of outreach vaccination sessions monitored in the district by PEI staff according to micro-plan
#
5. Number of outreach vaccination sessions monitored in the district by UCMOs and other Health department staff according to micro-plan
#
6. Total number of monitored outreach vaccination sessions were actually found held according to micro-plan
# (%)
7. Total number of monitored outreach vaccination teams found having updated defaulter list
# (%)
8. Total number of monitored vaccination teams (fixed and outreach) were found using a standard vaccine carrier with four icepacks and foam pad
# (%)
9.a. Number of monitored outreach vaccination sessions were found with no
or inadequate tOPV
# (%)
9.b. Number of monitored outreach vaccination sessions were found with no
or inadequate Pentavalent vaccine
# (%)
9.c. Number of monitored outreach vaccination sessions were found with no
or inadequate PCV10 vaccine
# (%)
9.d Number of monitored outreach vaccination sessions were found with no
or inadequate measles vaccine # (%)
9.e. Number of monitored outreach vaccination sessions were found with no
or inadequate TT vaccine
# (%)
10. Number of monitored vaccination teams (fixed and outreach) were found using safety box
# (%)
11. Number of monitored vaccination teams (fixed and outreach) were found giving message to the mother/care giver about expected AEFI relevant to the antigen(s) administered
# (%)
12. Number of monitored vaccination teams (fixed and outreach) were found giving message to the mother/care giver about date and importance of next visit when applicable
# (%)
13. Whether the monthly EPI review meeting held at district level with all UCMOs under the chairmanship of EDO (Health)/DHO/Agency Surgeon in this month or not. (minutes of the meeting to be shared with the DPEC chairman to consider the meeting was actually held)
Yes/No
14. How many monthly EPI review meeting held at tehsil/taluka level with respective vaccinators under the chairmanship of DDHO in this month? (minutes of the meetings to be shared with the DPEC chairman to consider the meetings were actually held)
#

Comprehensive Multi-Year Plan | Immunization Program of Pakistan Chapter 5: Annexes
121
15. Vaccine stock and utilization information in the district for the immediate past month
Antigen Stock at the
beginning of the last month (in
doses)
Received during the last month
(in doses)
Number of children/women vaccinated Stock at the end of the last month (in doses)
0 dose
1st dose
2nd dose
3rd dose
4th dose
5th dose
Routine immunization
BCG
OPV
Penta
PCV10
Measles
TT
SIA
OPV
Others
16. Trend of number of zero dose children identified through last 4 Polio SIAs held in the district
Polio SIA (NID, SNID, SIAD, Mop-up activities)
Number of zero dose children identified
1st SIA
2nd SIA
3rd SIA
4th SIA
17. Timeliness and completeness of integrated weekly VPD surveillance system (both indicators should be at least 80%)
(a) How many health facilities are in the integrated VPD surveillance network in the districts?
(b) How many total weekly VPD surveillance report received in the district within due date from health facilities till last week since beginning of the year
Timeliness: (b ÷ a X Last Epi wk number) X 100
(c ) How many total weekly VPD surveillance report received in the district from health facilities till last week since beginning of the year
Completeness: (c ÷ a X Last Epi wk number) X 100

Comprehensive Multi-Year Plan | Immunization Program of Pakistan Chapter 5: Annexes
122
Annex 12: vLMIS priority districts of Pakistan
Sr.# District Province #.of Districts
Sr.# District Province #.of Districts
1 Kabdulah Balochistan
9 districts
28 Gohtki Sindh
2 Pishin Balochistan 29 Kambar Sindh
3 Quetta Balochistan 30 Kashmore Sindh
4 Jafarabad Balochistan 31 Khairpur Sindh
5 Nasirabad Balochistan 32 Larkana Sindh
6 Killa Saifullah Balochistan 33 Shikarpur Sindh
7 Khuzdar Balochistan 34 Sukkur Sindh
8 Sheerani Balochistan 35 Peshawar Khyber Pakhtunkhwa
5 Districts
9 Lasbella Balochistan 36 Charsada Khyber Pakhtunkhwa
10 Bhawalpur Punjab
13 Districts
37 Mardan Khyber Pakhtunkhwa
11 DG Khan Punjab 38 Nowshera Khyber Pakhtunkhwa
12 Faisalabad Punjab 39 Lakki Marwat Khyber Pakhtunkhwa
13 Gujranwala Punjab 40 Bajour FATA
14 Agencies
and FR
14 Lahore Punjab 41 Khyber Agency FATA
15 Mianwali Punjab 42 Mohmand Agency FATA
16 Multan Punjab 43 Lower Kurram Agency
FATA
17 Muzaffargarh Punjab 44 Upper Kurram Agency
FATA
18 Rahim Yar Khan Punjab 45 Orakzai Agency FATA
19 Rajanpur Punjab 46 North Waziristan FATA
20 Rawalpindi Punjab 47 South Waziristan FATA
21 Sahiwal Punjab 48 FR Bannu FATA
22 Sargodha Punjab 49 FR DI Khan FATA
23 Hyderabad Sindh 12 Districts
50 FR Kohat FATA
24 Jacobabad Sindh 51 FR Lakki FATA
25 Baldia Sindh 52 FR Peshawar FATA
26 Gaddap Sindh 53 FR Tank FATA
27 Gulshan-e-Iqbal Sindh 54 Islamabad Capital ICT 1 District
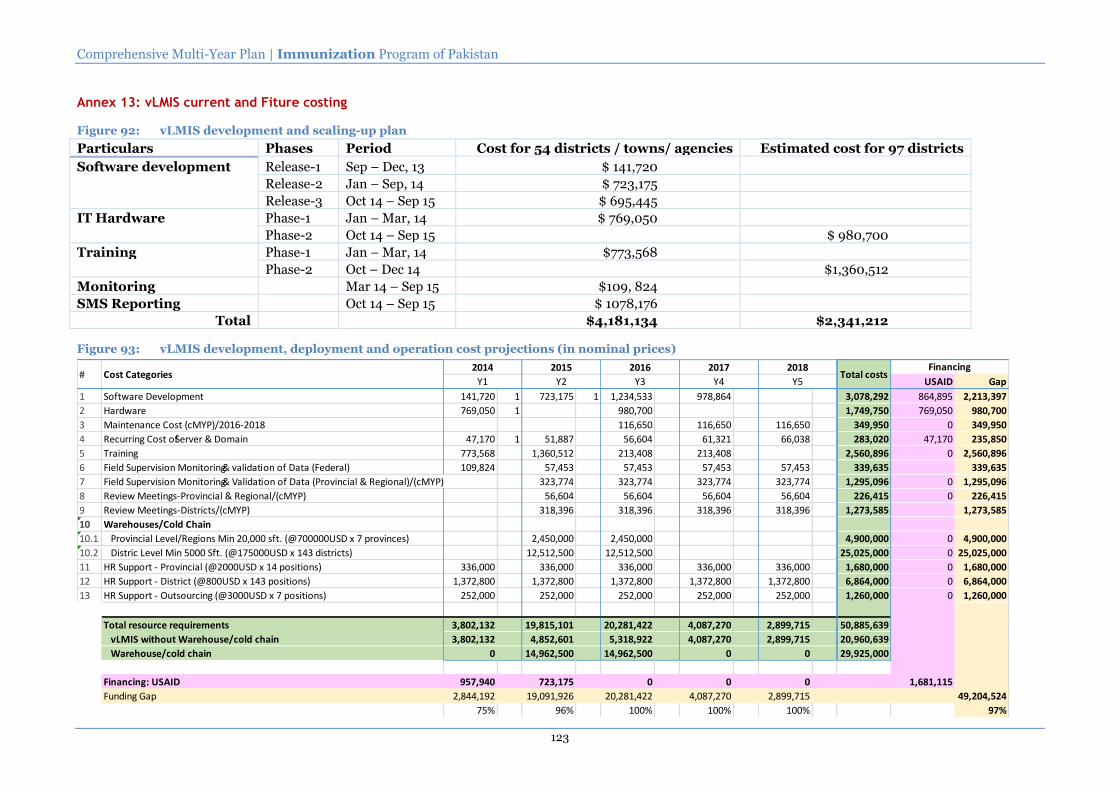
Comprehensive Multi-Year Plan | Immunization Program of Pakistan
123
Annex 13: vLMIS current and Fiture costing
Figure 92: vLMIS development and scaling-up plan
Particulars Phases Period Cost for 54 districts / towns/ agencies Estimated cost for 97 districts
Software development Release-1 Sep – Dec, 13 $ 141,720
Release-2 Jan – Sep, 14 $ 723,175
Release-3 Oct 14 – Sep 15 $ 695,445
IT Hardware Phase-1 Jan – Mar, 14 $ 769,050
Phase-2 Oct 14 – Sep 15 $ 980,700
Training Phase-1 Jan – Mar, 14 $773,568
Phase-2 Oct – Dec 14 $1,360,512
Monitoring Mar 14 – Sep 15 $109, 824
SMS Reporting Oct 14 – Sep 15 $ 1078,176
Total $4,181,134 $2,341,212
Figure 93: vLMIS development, deployment and operation cost projections (in nominal prices)
USAID Gap
1 Software Development 141,720 1 723,175 1 1,234,533 978,864 3,078,292 864,895 2,213,397
2 Hardware 769,050 1 980,700 1,749,750 769,050 980,700
3 Maintenance Cost (cMYP)/2016-2018 116,650 116,650 116,650 349,950 0 349,950
4 Recurring Cost of Server & Domain 47,170 1 51,887 56,604 61,321 66,038 283,020 47,170 235,850
5 Training 773,568 1,360,512 213,408 213,408 2,560,896 0 2,560,896
6 Field Supervision Monitoring & validation of Data (Federal) 109,824 57,453 57,453 57,453 57,453 339,635 339,635
7 Field Supervision Monitoring & Validation of Data (Provincial & Regional)/(cMYP) 323,774 323,774 323,774 323,774 1,295,096 0 1,295,096
8 Review Meetings-Provincial & Regional/(cMYP) 56,604 56,604 56,604 56,604 226,415 0 226,415
9 Review Meetings-Districts/(cMYP) 318,396 318,396 318,396 318,396 1,273,585 1,273,585
10 Warehouses/Cold Chain
10.1 Provincial Level/Regions Min 20,000 sft. (@700000USD x 7 provinces) 2,450,000 2,450,000 4,900,000 0 4,900,000
10.2 Distric Level Min 5000 Sft. (@175000USD x 143 districts) 12,512,500 12,512,500 25,025,000 0 25,025,000
11 HR Support - Provincial (@2000USD x 14 positions) 336,000 336,000 336,000 336,000 336,000 1,680,000 0 1,680,000
12 HR Support - District (@800USD x 143 positions) 1,372,800 1,372,800 1,372,800 1,372,800 1,372,800 6,864,000 0 6,864,000
13 HR Support - Outsourcing (@3000USD x 7 positions) 252,000 252,000 252,000 252,000 252,000 1,260,000 0 1,260,000
Total resource requirements 3,802,132 19,815,101 20,281,422 4,087,270 2,899,715 50,885,639
vLMIS without Warehouse/cold chain 3,802,132 4,852,601 5,318,922 4,087,270 2,899,715 20,960,639
Warehouse/cold chain 0 14,962,500 14,962,500 0 0 29,925,000
Financing: USAID 957,940 723,175 0 0 0 1,681,115
Funding Gap 2,844,192 19,091,926 20,281,422 4,087,270 2,899,715 49,204,524
75% 96% 100% 100% 100% 97%
FinancingCost Categories#
2017 2018
Y5Y4Total costs
2014
Y1
2015
Y2
2016
Y3

Comprehensive Multi-Year Plan | Immunization Program of Pakistan
124
Annex 14: DHIS Project implementation
Districts Directly Supported by JICA
Funded by: WHO USAID JICA
UNICEF GIZ Provincial Gov't
UNFPA Save the Children Others
Figure 94: Implementation of DHIS by districts, interventions and funding agencies
No. Name of Districts
Hard
wa
re (P
C)
Pro
cure
me
nt
Dis
tributio
n o
f To
ols
&
Instru
men
ts
Revis
ed
DH
IS
Softw
are
Insta
llatio
n
With
Wo
rksho
p
Implementation of DHIS Training for Districts
General (for
District)
General (for
FLCF)
Data Collection
Use of Information
Islamabad Capital Territory (ICT)
Balochistan Province
B-1 Awran
B-2 Barkhan
B-3 Bolan
B-4 Chagai
B-5 Dera Bugti
B-6 Gwadar
B-7 Harnai
B-8 Jafarabad
B-9 Jhal Magsi
B-10 Kalat
B-11 Kech
B-12 Kharan
B-13 Kohlu
B-14 Khuzdar
B-15 Killa Abdullah
B-16 Killa Saifullah
B-17 Lasbela
B-18 Loralai
B-19 Mastung
B-20 Musakhel
B-21 Nasirabad
B-22 Noshki
B-23 Panjgur
B-24 Pishin
B-25 Quetta
B-26 Sherani
B-27 Sibi
B-28 Washuk
B-29 Zhob
B-30 Ziarat
Gilgit-Baltistan Province
G-1 Ghanche
G-2 Skardu
G-3 Astore
G-4 Diamer
G-5 Ghizer
G-6 Gilgit
G-7 Hunza-Nagar
Khyber Pakhtunkhwa Province
K-1 Abbottabad
K-2 Bannu
K-3 Battagram
K-4 Buner

Comprehensive Multi-Year Plan | Immunization Program of Pakistan Chapter 5: Annexes
125
No. Name of Districts
Hard
wa
re (P
C)
Pro
cure
me
nt
Dis
tributio
n o
f To
ols
&
Instru
men
ts
Revis
ed
DH
IS
Softw
are
Insta
llatio
n
With
Wo
rksho
p
Implementation of DHIS Training for Districts
General (for
District)
General (for
FLCF)
Data Collection
Use of Information
K-5 Charsadda
K-6 Chitral
K-7 Dera Ismail Khan
K-8 Hangu
K-9 Haripur
K-10 Kala Dhaka
K-11 Karak
K-12 Kohat
K-13 Kohistan
K-14 Lakki Marwat
K-15 Lower Dir
K-16 Malakand
K-17 Mansehra
K-18 Mardan
K-19 Nowshera
K-20 Peshawar
K-21 Shangla
K-22 Swabi
K-23 Swat
K-24 Tank
K-25 Upper Dir
Punjab Province
P-1 Attock
P-2 Bahawalnagar
P-3 Bahawalpur
P-4 Bhakkar
P-5 Chakwal
P-6 Chiniot
P-7 Dera Ghazi Khan
P-8 Faisalabad
P-9 Gujranwala
P-10 Gujrat
P-11 Hafizabad
P-12 Jhang
P-13 Jhelum
P-14 Kasur
P-15 Khanewal
P-16 Khushab
P-17 Lahore
P-18 Layyah
P-19 Lodhran
P-20 Mandi Bahauddin
P-21 Mianwali
P-22 Multan
P-23 Muzaffargarh
P-24 Narowal
P-25 Nankana Sahib
P-26 Okara
P-27 Pakpattan
P-28 Rahim Yar Khan
P-29 Rajanpur
P-30 Rawalpindi
P-31 Sahiwal
P-32 Sargodha
P-33 Sheikhupura

Comprehensive Multi-Year Plan | Immunization Program of Pakistan Chapter 5: Annexes
126
No. Name of Districts
Hard
wa
re (P
C)
Pro
cure
me
nt
Dis
tributio
n o
f To
ols
&
Instru
men
ts
Revis
ed
DH
IS
Softw
are
Insta
llatio
n
With
Wo
rksho
p
Implementation of DHIS Training for Districts
General (for
District)
General (for
FLCF)
Data Collection
Use of Information
P-34 Sialkot
P-35 Toba Tek Singh
P-36 Vehari
Sindh Province
S-1 Badin
S-2 Dadu
S-3 Ghotki
S-4 Hyderabad
S-5 Jacobabad
S-6 Jamshoro
S-7 Karachi
S-8 Kashmore
S-9 Khairpur
S-10 Larkana
S-11 Matiari
S-12 Mirpurkhas
S-13 Naushahro Firoze
S-14 Nawabshah
S-15 Qambar Shahdadkot
S-16 Sanghar
S-17 Shikarpur
S-18 Sukkur
S-19 Tando Allahyar
S-20 Tando Muhammad Khan
S-21 Tharparkar
S-22 Thatta
S-23 Umerkot
Azad Jammu and Kashmir (AJK)
A-1 Muzaffarabad
A-2 Hattian
A-3 Neelum
A-4 Mirpur
A-5 Bhimber
A-6 Kotli
A-7 Poonch
A-8 Bagh
A-9 Haveli
A-10 Sudhnati
Federally Administered Tribal Areas (FATA)
F-1 Bajaur
F-2 Khyber
F-3 Kurram
F-4 Mohmand
F-5 North Waziristan
F-6 Orakzai
F-7 South Waziristan
F-8 Bannu
F-9 Dera Ismail Khan
F-10 Kohat
F-11 Lakki Marwat
F-12 Peshawar
F-13 Tank
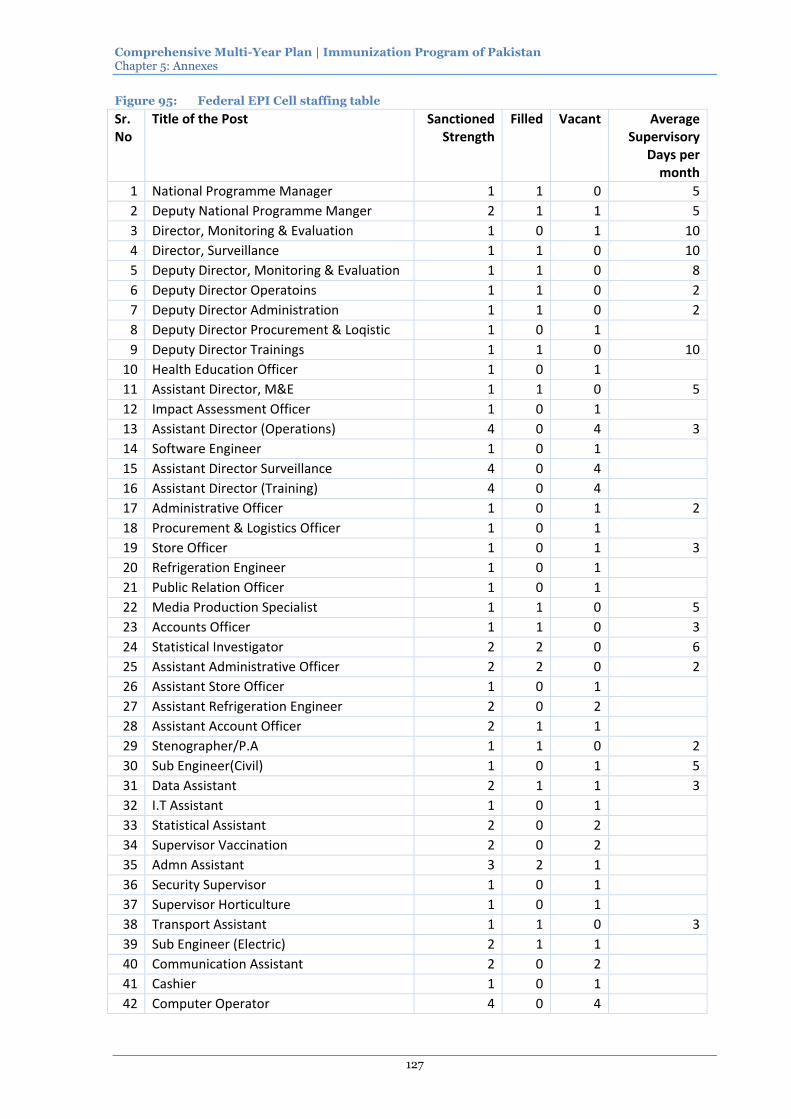
Comprehensive Multi-Year Plan | Immunization Program of Pakistan Chapter 5: Annexes
127
Figure 95: Federal EPI Cell staffing table
Sr. No
Title of the Post Sanctioned Strength
Filled Vacant Average Supervisory
Days per month
1 National Programme Manager 1 1 0 5
2 Deputy National Programme Manger 2 1 1 5
3 Director, Monitoring & Evaluation 1 0 1 10
4 Director, Surveillance 1 1 0 10
5 Deputy Director, Monitoring & Evaluation 1 1 0 8
6 Deputy Director Operatoins 1 1 0 2
7 Deputy Director Administration 1 1 0 2
8 Deputy Director Procurement & Loqistic 1 0 1
9 Deputy Director Trainings 1 1 0 10
10 Health Education Officer 1 0 1
11 Assistant Director, M&E 1 1 0 5
12 Impact Assessment Officer 1 0 1
13 Assistant Director (Operations) 4 0 4 3
14 Software Engineer 1 0 1
15 Assistant Director Surveillance 4 0 4
16 Assistant Director (Training) 4 0 4
17 Administrative Officer 1 0 1 2
18 Procurement & Logistics Officer 1 0 1
19 Store Officer 1 0 1 3
20 Refrigeration Engineer 1 0 1
21 Public Relation Officer 1 0 1
22 Media Production Specialist 1 1 0 5
23 Accounts Officer 1 1 0 3
24 Statistical Investigator 2 2 0 6
25 Assistant Administrative Officer 2 2 0 2
26 Assistant Store Officer 1 0 1
27 Assistant Refrigeration Engineer 2 0 2
28 Assistant Account Officer 2 1 1
29 Stenographer/P.A 1 1 0 2
30 Sub Engineer(Civil) 1 0 1 5
31 Data Assistant 2 1 1 3
32 I.T Assistant 1 0 1
33 Statistical Assistant 2 0 2
34 Supervisor Vaccination 2 0 2
35 Admn Assistant 3 2 1
36 Security Supervisor 1 0 1
37 Supervisor Horticulture 1 0 1
38 Transport Assistant 1 1 0 3
39 Sub Engineer (Electric) 2 1 1
40 Communication Assistant 2 0 2
41 Cashier 1 0 1
42 Computer Operator 4 0 4

Comprehensive Multi-Year Plan | Immunization Program of Pakistan Chapter 5: Annexes
128
Sr. No
Title of the Post Sanctioned Strength
Filled Vacant Average Supervisory
Days per month
43 Accountant 2 0 2
44 Receptionist 1 0 1
45 Assistant Supervisor Vaccination 5 4 1 10
46 Supervisor Transport 1 0 1
47 Vehicle Mechanic 1 0 1
48 Storekeeper 4 0 4
49 Photographer 1 0 1
50 Telephone Operator 2 0 2
51 Refrigeration Mechanic 4 3 1 5
52 Drivers 14 7 7 10
53 Daftri 2 0 2
54 Naib Qasid 12 9 3 0
55 Security Guards 8 0 8
56 Cleaners 6 5 1 0
57 Gardner's 4 0 4
58 Labourers 10 4 6 0
59 Helpers 3 0 3
Total 146 53 93