comprehensive plan - washington county, minnesota
TRANSCRIPT

WASHINGTON COUNTY 2040 COMPREHENSIVE PLAN
Comprehensive Plan
Downtown Marine St. Croix
Chapter 10 - Economic Competitiveness

ECONOMIC COMPETITIVENESS
WASHINGTON COUNTY 2040 COMPREHENSIVE PLAN 10-i
Table of Contents Table of Contents .......................................................................................................................................................... 10-i
List of Figures ................................................................................................................................................................. 10-i
List of Tables .................................................................................................................................................................. 10-i
Executive Summary ...................................................................................................................................................... 10-1
Existing Conditions ....................................................................................................................................................... 10-1
Washington County Employment ............................................................................................................................ 10-2
Employment Industries ............................................................................................................................................ 10-3
Wages in Washington County .................................................................................................................................. 10-5
Unemployment......................................................................................................................................................... 10-7
Workforce Development .......................................................................................................................................... 10-7
Key Industries/Centers of Employment ....................................................................................................................... 10-9
Opportunities and Challenges .................................................................................................................................... 10-14
Goals, Policies, and Strategies .................................................................................................................................... 10-15
List of Figures Employment in Washington County......................................................................................................... 10-2 Washington County Employment by Industry, 2017 ............................................................................... 10-4 Average Annual Wages ............................................................................................................................. 10-6 Average Annual Unemployment Rates .................................................................................................... 10-7 Central Minnesota Share of Jobs by Educational Requirements ............................................................. 10-8 2010 Washington County Employment Distribution by City/Township ................................................ 10-10 2040 Forecasted Washington County Employment Distribution by City/Township.............................. 10-11 Forecasted Employment Growth by City/Township, 2010 to 2040 ....................................................... 10-13
List of Tables Table 1: Metro Area Jobs Growth by County ......................................................................................................... 10-2 Table 2: Washington County Industry Employment Statistics, 2017 ..................................................................... 10-3 Table 3: Washington County Average Annual Wage by Industry, 2017 ................................................................ 10-5 Table 4: Washington County Labor Force .............................................................................................................. 10-8 Table 5: Educational Attainment for Washington County’s Labor Force between 25 and 64 years old ............... 10-9 Table 6: Forecasted Employment Growth by City/Township, 2010 to 2040 ....................................................... 10-12 Table 7: Economic Development Opportunities and Challenges ......................................................................... 10-14

ECONOMIC COMPETITIVENESS
WASHINGTON COUNTY 2040 COMPREHENSIVE PLAN 10-1
Executive Summary Economic competitiveness may be a new element to the 2040 Comprehensive Plan; however, economic development initiatives are a core part of Washington County’s planning activities. The Washington County Community Development Agency (CDA) plays the economic development role for the county, monitoring changing trends, promoting economic development and ensuring the availability of programs and services for cities, townships and the county. The CDA was approved for creation by the Washington County Board of Commissioners in June of 2016. A full time Economic Development Director was hired by the CDA to serve as the designated point of contact and to coordinate the economic development efforts within the county.
Since its creation, the CDA has developed initiatives and programs to support the future of the county. These economic development initiatives are recognized in Washington County’s Economic Development Plan prepared by the CDA in 2017. This plan was created in collaboration with local agencies (e.g., cities and townships) and businesses and reflects their vision of the county from an economic development perspective.
This chapter provides a snapshot of the 2017 – 2019 Washington County Economic Development Plan (Appendix P), with supplemental existing conditions and trends information. The 2017-2019 plan should be referenced for more information regarding economic development initiatives throughout the county. This plan is updated every three years, and the most recent plan should always be referred to.
Existing Conditions Washington County strives to provide a variety of resources to create a welcoming environment for businesses and communities to enhance economic development, expand the tax base, and promote job creation. To achieve this goal, the CDA helps communities attract businesses and talent by cultivating partnerships, promoting Washington County across the region, supporting business-friendly infrastructure
development, and technical and financial assistance.
A review of historic and forecasted economic data presented by various data sources offer a clear picture of Washington County’s economic conditions. A summary review of economic data for Washington County finds that the county’s economy is healthy.
• Washington County is a competitive, job creating economy. The county has experienced steady and robust growth in the number of jobs and weathered the recession well. Washington County had 24 percent employment growth from 2000-2017 adding 16,446 new jobs. The number of jobs in 2017 has rebounded to pre-recession levels to 85,263 total jobs.
• Washington County competes very well within the region and the Twin Cities economy. A total of 236 new establishments have been added since 2010.
• Washington County is especially competitive and has significantly more jobs in comparison to neighboring counties in Wisconsin. Washington County’s employment growth rate exceeded or was on par with neighboring counites.

ECONOMIC COMPETITIVENESS
WASHINGTON COUNTY 2040 COMPREHENSIVE PLAN 10-2
Washington County Employment With a highly-educated and growing labor pool, affordable and safe communities, and scenic landscapes and recreation opportunities, Washington County is home to many businesses and continuing to attract new ones. In fact, the Metropolitan Council projects Washington County’s workforce to grow by 32 percent or 33,513 by 2040. This growth will outpace Anoka, Dakota, Hennepin and Ramsey County (see Table 1). Industries that have grown between 2013 and 2015 include those in the Health Care Services, Manufacturing, and Professional and Technical Service.
Table 1: Metro Area Jobs Growth by County
County 2010 2040 Growth Percentage
Carver 31,836 53,840 41%
Scott 41,534 68,640 39%
Washington 71,897 105,410 32%
Dakota 170,192 236,300 28%
Anoka 106,387 145,420 27%
Hennepin 805,089 1,038,140 22%
Ramsey 316,937 393,070 19%
Washington County has continued to experience an increase in employment over the last 40 years (see Figure 1). The county experienced a moderate growth rate through the recession of 6.4 percent from 2000 to 2010. Employment totals have grown at twice the rate since 2010, experiencing a 14.9 percent increase from 2010 to 2016.
Employment in Washington County
Source: Quarterly Census of Employment and Wages, MNDEED
14,460
27,884
41,954
67,64971,957 73,557 74,605 76,425 77,679
79,92982,674
0
10,000
20,000
30,000
40,000
50,000
60,000
70,000
80,000
90,000
1970 1980 1990 2000 2010 2011 2012 2013 2014 2015 2016

ECONOMIC COMPETITIVENESS
WASHINGTON COUNTY 2040 COMPREHENSIVE PLAN 10-3
Employment Industries
Overall, Washington County is home to over 5,500 businesses (see Table 2). Many of these businesses (86 percent) are comprised of less than 20 employees. Furthermore, Washington County is home to 17,847 self-employed businesses or “non-employers” in 2014 (defined as businesses without employees that are subject to federal income tax).
Table 2: Washington County Industry Employment Statistics, 2017
NAICS Industry Title Number of Establishments
Number of Jobs
Percent of Jobs
Total, All Industries 5,525 85,263 100.0% Retail Trade 679 13,939 16.3%
Health Care and Social Assistance 602 11,847 13.9%
Accommodation and Food Services 413 9,875 11.6%
Manufacturing 218 9,671 11.3%
Educational Services 147 6,163 7.2%
Construction 531 3,938 4.6%
Public Administration 56 3,908 4.6%
Other Services 638 3,514 4.1%
Professional, Scientific, and Technical Services 672 3,370 4.0%
Finance and Insurance 364 3,183 3.7%
Administrative and Support and Waste Management and Remediation Services
270 3,140 3.7%
Wholesale Trade 210 2,749 3.2%
Transportation and Warehousing 135 2,559 3.0%
Arts, Entertainment, and Recreation 135 2,551 3.0%
Management of Companies and Enterprises 47 1,683 2.0%
Information 73 1,109 1.3%
Agriculture, Forestry, Fishing and Hunting 45 876 1.0%
Real Estate and Rental and Leasing 276 857 1.0%
Utilities 7 265 0.3%
Mining 7 58 0.1% Source: MN DEED, Quarterly Census of Employment and Wages (QCEW), Quarter 3 2017
Throughout Washington County the highest concentration of jobs in 2017 was supported in the Retail Trade and Health Care and Social Assistance industries, comprising over 30 percent of the county’s jobs (see Figure 2). These industries experienced moderate growth rates between 2010 and 2017 of 17.1 percent and 32.7 percent

ECONOMIC COMPETITIVENESS
WASHINGTON COUNTY 2040 COMPREHENSIVE PLAN 10-4
respectively. The wholesale trade industry experienced the largest growth over the seven-year period, growing 80.6 percent.
Washington County Employment by Industry, 2017
58
265
876
1,109
1,683
2,551
2,559
2,749
3,140
3,370
3,514
3,908
3,938
4,040
6,163
9,671
9,875
11,847
13,939
0 2,000 4,000 6,000 8,000 10,000 12,000 14,000 16,000
Mining
Utilities
Agriculture, Forestry, Fishing and Hunting
Information
Management of Companies and Enterprises
Arts, Entertainment, and Recreation
Transportation and Warehousing
Wholesale Trade
Administrative and Support and Waste Management andRemediation Services
Professional, Scientific, and Technical Services
Other Services
Public Administration
Construction
Financial Activities
Educational Services
Manufacturing
Accommodation and Food Services
Health Care and Social Assistance
Retail Trade

ECONOMIC COMPETITIVENESS
WASHINGTON COUNTY 2040 COMPREHENSIVE PLAN 10-5
Wages in Washington County Washington County industries provide average annual wages between $16,000 and $110,000, as reported in 2017 (see Table 3). The industries with the top average annual wages include utilities ($110,552), mining ($84,864), and wholesale trade ($75,902).
Table 3: Washington County Average Annual Wage by Industry, 2017
NAICS Industry Title Average Annual Wage
Utilities $110,552
Mining $84,864
Wholesale Trade $75,920
Management of Companies and Enterprises $74,152
Professional, Scientific, and Technical Services $65,728
Construction $65,104
Financial Activities $64,532
Manufacturing $61,360
Public Administration $53,300
Health Care and Social Assistance $51,168
Information $50,752
Administrative and Support and Waste Management and Remediation Services $47,528
Transportation and Warehousing $42,120
Educational Services $42,016
Agriculture, Forestry, Fishing and Hunting $33,540
Other Services $25,636
Retail Trade $25,272
Accommodation and Food Services $17,836
Arts, Entertainment, and Recreation $16,640
Source: MN DEED, Quarterly Census of Employment and Wages (QCEW), Quarter 3 2017

ECONOMIC COMPETITIVENESS
WASHINGTON COUNTY 2040 COMPREHENSIVE PLAN 10-6
Washington County’s annual average wages are lower than the Twin Cities region (see Figure 3). The wage gap between the two areas has increased over the last 20 years. As previously noted, wages in Washington County are lower than incomes earned outside of the county. It is important to develop affordable work force housing to support employees that wish to work and live in Washington County.
Average Annual Wages
Source: Metropolitan Council, Community Profile Washington County
$32,053
$43,461
$39,062
$58,111
$0
$10,000
$20,000
$30,000
$40,000
$50,000
$60,000
$70,000
2000 2010
Washington County Twin Cities Region

ECONOMIC COMPETITIVENESS
WASHINGTON COUNTY 2040 COMPREHENSIVE PLAN 10-7
Unemployment Washington County’s unemployment rate has historically followed regional trends for both the Twin Cities 7-county region and the Minneapolis-St. Paul Metropolitan Statistical Area (MSA). However, the Washington County unemployment rate has trended lower than both regional totals. The county’s unemployment rate highest rate in 2010 with 7.2 percent, and the lowest in 1998 and 1999 at 1.8 percent. The 2017 unemployment rate is reported as 3.1 percent.
Average Annual Unemployment Rates
Workforce Development The availability of a skilled workforce is a key component of economic development. Without an available workforce, employers cannot grow local businesses and reinvest in a community. Varying levels of workforce development are needed to support a diverse economy and include all ages, educational backgrounds and industries.
3.70%
4.30%4.10%
3.80%
2.90%
2.60%2.70%
2.10%
1.80%1.80%
2.50%
3.00%
3.80%
4.20%
4.10%
3.50%3.50%
4.00%
5.00%
7.20%
6.70%
5.90%
5.10%
4.40%
3.60%
3.20%
3.40%3.10%
0.00%
1.00%
2.00%
3.00%
4.00%
5.00%
6.00%
7.00%
8.00%
9.00%
1990
1991
1992
1993
1994
1995
1996
1997
1998
1999
2000
2001
2002
2003
2004
2005
2006
2007
2008
2009
2010
2011
2012
2013
2014
2015
2016
2017
Washington County Twin Cities Region Minneapolis-St Paul MSA

ECONOMIC COMPETITIVENESS
WASHINGTON COUNTY 2040 COMPREHENSIVE PLAN 10-8
As the county’s population grows and changes, so will the ages of available employees. Washington County experienced an overall increase in the total labor force between 2010 and 2016 of 4.2 percent. However, the labor force between the ages of 25 to 44 and 45 to 54 experienced a decrease of 7.5 percent and 1.3 percent respectively (see Table 4).
Table 4: Washington County Labor Force
Labor Force Age Cohort 2010 Labor Force 2016 Labor Force Percent Change
16 to 19 12,436 13,519 8.7%
20 to 24 11,474 13,729 19.7%
25 to 44 67,137 62,097 -7.5%
45 to 54 39,579 39,055 -1.3%
55 to 64 29,816 33,285 11.6%
65 to 74 14,639 19,111 30.5%
75 and over 10,789 12,828 18.9%
Total Labor Force 185,870 193,624 4.2% Source: American Community Survey Estimates, 2010 and 2016
Washington County’s various industries employ residents with various educational backgrounds. An environment of this nature provides employment opportunities from a diverse group of residents. Economic development can include efforts beyond industry growth and include efforts to develop a diverse available workforce. The Minnesota Department of Employment and Economic Development (MN DEED) monitors the state’s share of jobs by educational requirements. Over 60 percent of jobs in metro area require a high school diploma or less as a requirement (see Figure 5). A bachelor’s or graduate degree is required for 21.5 percent of the jobs throughout the area.
Metro Minnesota Share of Jobs by Educational Requirements
Source: DEED Occupational Employment Statistics (OES), Quarter 1, 2016
60.5%
4.2%4.7%
21.5%
3.6%5.2%
1,040,350
72,340
80,640
369,990
61,170 88,520High School or Less
Vocational Training
Associate Degree
Bachelor's Degree
Graduate Degree
No Assigned EducationalRequirement
ECONOMIC COMPETITIVENESS
WASHINGTON COUNTY 2040 COMPREHENSIVE PLAN 10-9
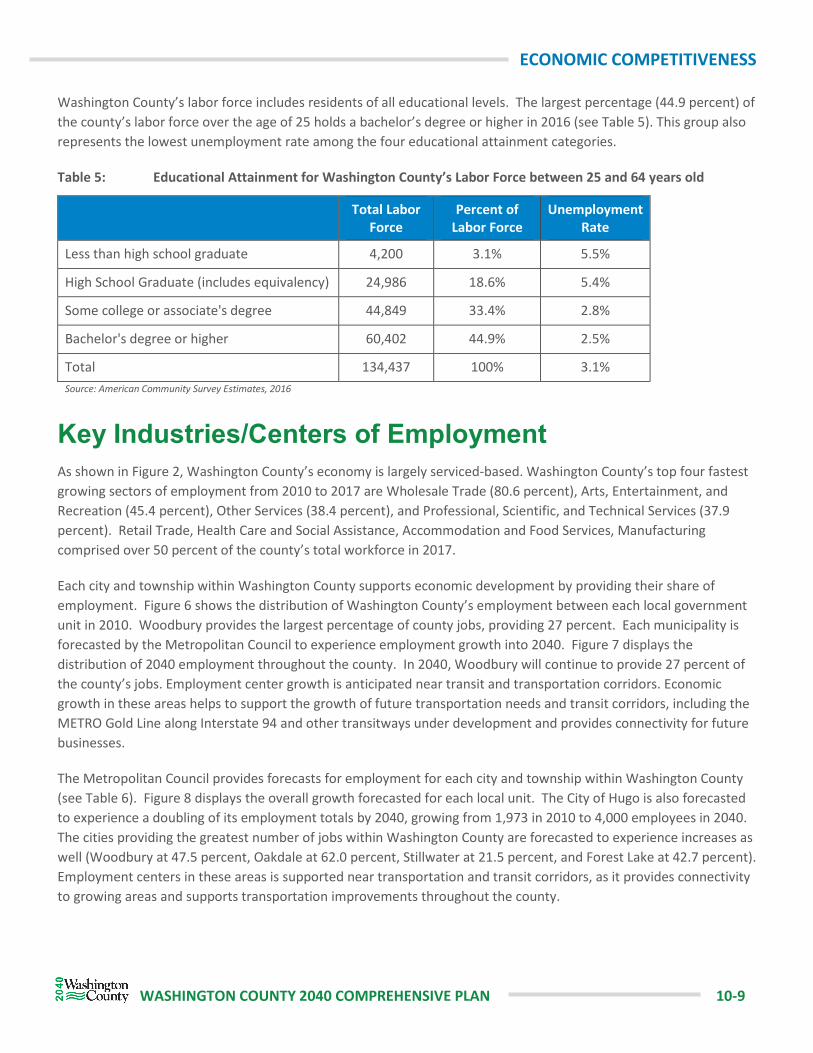
Washington County’s labor force includes residents of all educational levels. The largest percentage (44.9 percent) of the county’s labor force over the age of 25 holds a bachelor’s degree or higher in 2016 (see Table 5). This group also represents the lowest unemployment rate among the four educational attainment categories.
Table 5: Educational Attainment for Washington County’s Labor Force between 25 and 64 years old
Total Labor Force
Percent of Labor Force
Unemployment Rate
Less than high school graduate 4,200 3.1% 5.5%
High School Graduate (includes equivalency) 24,986 18.6% 5.4%
Some college or associate's degree 44,849 33.4% 2.8%
Bachelor's degree or higher 60,402 44.9% 2.5%
Total 134,437 100% 3.1% Source: American Community Survey Estimates, 2016
Key Industries/Centers of Employment As shown in Figure 2, Washington County’s economy is largely serviced-based. Washington County’s top four fastest growing sectors of employment from 2010 to 2017 are Wholesale Trade (80.6 percent), Arts, Entertainment, and Recreation (45.4 percent), Other Services (38.4 percent), and Professional, Scientific, and Technical Services (37.9 percent). Retail Trade, Health Care and Social Assistance, Accommodation and Food Services, Manufacturing comprised over 50 percent of the county’s total workforce in 2017.
Each city and township within Washington County supports economic development by providing their share of employment. Figure 6 shows the distribution of Washington County’s employment between each local government unit in 2010. Woodbury provides the largest percentage of county jobs, providing 27 percent. Each municipality is forecasted by the Metropolitan Council to experience employment growth into 2040. Figure 7 displays the distribution of 2040 employment throughout the county. In 2040, Woodbury will continue to provide 27 percent of the county’s jobs. Employment center growth is anticipated near transit and transportation corridors. Economic growth in these areas helps to support the growth of future transportation needs and transit corridors, including the METRO Gold Line along Interstate 94 and other transitways under development and provides connectivity for future businesses.
The Metropolitan Council provides forecasts for employment for each city and township within Washington County (see Table 6). Figure 8 displays the overall growth forecasted for each local unit. The City of Hugo is also forecasted to experience a doubling of its employment totals by 2040, growing from 1,973 in 2010 to 4,000 employees in 2040. The cities providing the greatest number of jobs within Washington County are forecasted to experience increases as well (Woodbury at 47.5 percent, Oakdale at 62.0 percent, Stillwater at 21.5 percent, and Forest Lake at 42.7 percent). Employment centers in these areas is supported near transportation and transit corridors, as it provides connectivity to growing areas and supports transportation improvements throughout the county.

ECONOMIC COMPETITIVENESS
WASHINGTON COUNTY 2040 COMPREHENSIVE PLAN 10-10
2010 Washington County Employment Distribution by City/Township

ECONOMIC COMPETITIVENESS
WASHINGTON COUNTY 2040 COMPREHENSIVE PLAN 10-11
2040 Forecasted Washington County Employment Distribution by City/Township

ECONOMIC COMPETITIVENESS
WASHINGTON COUNTY 2040 COMPREHENSIVE PLAN 10-12
Table 6: Forecasted Employment Growth by City/Township, 2010 to 2040
City/Township 2010 Employment
2040 Employment
Percent Change
Woodbury 19,438 28,700 47.6% Oakdale 8,651 14,000 61.8% Stillwater 9,628 11,700 21.5% Forest Lake 6,449 9,200 42.7% Cottage Grove 6,484 9,000 38.8% Oak Park Heights 4,358 7,500 72.1% Bayport 3,790 4,600 21.4% Hugo 1,973 4,000 102.7% Lake Elmo 1,941 3,800 95.8% Mahtomedi 2,090 2,700 29.2% St. Paul Park 1,515 2,400 58.4% Newport 1,605 2,100 30.8% Grant 449 840 87.1% Scandia 519 730 40.7% Denmark Twp. 629 650 3.3% Afton 411 550 33.8% Lakeland 302 440 45.7% West Lakeland Twp. 232 370 59.5% Dellwood 277 330 19.1% Baytown Twp. 69 260 276.8% Stillwater Twp. 165 250 51.5% White Bear Lake* 184 240 30.4% Willernie 182 200 9.9% May Twp. 66 180 172.7% Lake St. Croix Beach 129 160 24.0% Marine on St. Croix 124 160 29.0% Hastings* 64 100 56.3% Pine Springs 72 80 11.1% Lakeland Shores 26 50 92.3% Grey Cloud Island Twp. 10 40 300.0% Birchwood Village 25 30 20.0% Landfall 25 30 20.0% St. Mary’s Point 15 20 33.3% *Employment totals for only the portions of the communities within Washington County Source: Metropolitan Council

ECONOMIC COMPETITIVENESS
WASHINGTON COUNTY 2040 COMPREHENSIVE PLAN 10-13
Forecasted Employment Growth by City/Township, 2010 to 2040

ECONOMIC COMPETITIVENESS
WASHINGTON COUNTY 2040 COMPREHENSIVE PLAN 10-14
Opportunities and Challenges To support Washington County’s economic competitiveness and support development throughout the county, several opportunities and challenges have been identified (see Table 7). Realization of these items helps to identify programs and actions that can be put into place by the CDA and Washington County to continue to grow the county’s thriving economy.
Table 7: Economic Development Opportunities and Challenges
Economic Development Opportunities
Small businesses are vital to Washington County’s economy. 86 percent of the Washington County businesses have less than 20 employees. Washington County is home to 17,847 self-employed businesses or “non-employers” in 2014 (defined as businesses without employees that are subject to federal income tax). An opportunity exists to support and grow the existing businesses and business owners.
Washington County has a highly-valued quality of life, rich diverse communities and many assets and amenities. An opportunity exists to market and promote these amenities to site selectors and businesses looking to expand or relocate.
Washington County has a growing population and a growing labor force. An opportunity exists to leverage the quality of this growing labor force to attract new business development.
Technical and financial resources for small businesses are available through the Open to Business Program.
Economic Development Challenges
Currently, businesses who are searching for sites may not know about the assets and advantages of locating in Washington County. A county wide marketing effort is cohesive, strong, and unique will help Washington County stand out to businesses, in addition to a robust spectrum of promotion tools. The CDA Economic Development Director can serve as a critical point of contact for referral to opportunities in communities.
Over 100,000 working residents commute outside of the county to work every day (76.9 percent). A focus should be to work with the private sector and communities within Washington County to increase the opportunities for people to both live and work in the county.
Several communities have identified that highspeed broadband networks are not available. This is equally important as other typical utilities for growing businesses.
There are limited shovel ready sites for new commercial and industrial development to take place. Any activities to take place under this category will need to be coordinated with the local communities within the county.

ECONOMIC COMPETITIVENESS
WASHINGTON COUNTY 2040 COMPREHENSIVE PLAN 10-15
Goals, Policies, and Strategies To guide future decision making and county actions, goals, policies and strategies have been developed specific to the economic competitiveness element. The following pages outline five goals with corresponding policies and strategies that set the course for the county’s future. The policies and strategies identified for economic competitiveness collectively respond to the element’s five goals. This comprehensive approach provides an opportunity to utilize the policy or to employ strategies in a manner that supports one or more of the defined goals. Chapter 3, Goals, Polices, and Strategies, also provides the information contained within this section, along with the goals for the other plan elements. Chapter 11, Implementation, provides tools that can be utilized while working to achieve these goals.
Economic Competitiveness Goals
Goal 1: Promote and market the quality of life, rich diversity and assets of the county.
Goal 2: Provide resources to help entrepreneurs get started and existing businesses grow.
Goal 3: Be a value-added partner to other public and private entities.
Goal 4: Find ways to help our businesses attract and retain talent and find ways to keep our working residents here in the county.
Goal 5: Promote strong infrastructure, multi-modal transportation and highspeed broadband.
Economic Competitiveness Policy Economic Competitiveness Strategy
The private sector is the lead that drive the economy.
The County will work in partnership with the private sector.
Help existing businesses grow and entrepreneurs get started.
The County will not duplicate or replace the work of cities and other public and private partners.
The County will work in collaboration with public and private partners, and will provide leadership where the County can make the most difference when asked.
Promote multi-modal transportation, transit and highspeed broadband opportunities that will stimulate economic growth in Washington County.
Business attraction and business retention are essential policy objectives.
A balanced approach to pursue both of businesses attraction and business retention policy areas is required.
Market and promote Washington County, enhancing the efforts currently being implemented by our public and private sector partners.
The County supports a strong collaborative approach to economic development.
No matter the location, economic development is a benefit to the entire County.
Support efforts to ensure a highly skilled workforce and adequate workforce housing.

ECONOMIC COMPETITIVENESS
WASHINGTON COUNTY 2040 COMPREHENSIVE PLAN 10-16
Economic Competitiveness Policy Economic Competitiveness Strategy
The County supports a strong collaborative approach to economic development. (Continued)
Provide resources to cities, townships and local government economic development authorities located in Washington County. Assist communities and local area chambers of commerce with Business Retention and Enhancement visits when requested.
The diversity of the County requires an adaptable and open-minded approach.
The distinctive qualities of the County require flexibility.
Promote the quality of life and assets of the county including the rich diversity of communities with unique micro-markets.