comprehensive shear wave velocity study in the … development and technology modot rdt 05-006...
TRANSCRIPT
Research, Development and Technology
MoDOT
RDT 05-006
Comprehensive Shear Wave Velocity Study in the Poplar Bluff Area,
Southeast Missouri
May, 2005
RI 03-029
University of Missouri/Rolla
Final Project Report RDT 05-006
COMPREHENSIVE SHEAR-WAVE
VELOCITY STUDY IN THE POPLAR BLUFF AREA, SOUTHEAST MISSOURI
Submitted to:
Missouri Department of Transportation
Submitted by:
Neil Anderson, David Hoffman, Wanxing Liu, Ronaldo Luna, Richard Stephenson and Thanop Thitimakorn
The University of Missouri-Rolla
April 30th, 2005 The opinions, findings, and conclusions expressed in this publication are those of the principal investigators and the Missouri Department of Transportation; Research, Development and Technology. They are not necessarily those of the U.S. Department of Transportation, Federal Highway Administration. This report does not constitute a standard regulation.
MoDOT Final Report RDT 05-006: Comprehensive Shear-Wave Velocity Study in the Poplar Bluff Area, Southeast Missouri
TECHNICAL REPORT DOCUMENTATION PAGE
1. Report No. 2. Government Accession No. 3. Recipient's Catalog No. RDT 05-006 4. Title and Subtitle 5. Report Date
April 30, 2005 6. Performing Organization Code
Comprehensive Shear-Wave Velocity Study in the Poplar Bluff Area, Southeast Missouri
University Missouri-Rolla 7. Author(s) 8. Performing Organization Report No.
Anderson, N., Hoffman, D., Liu, W., Luna, R., Stephenson, R., and Thitimakorn, T.
RDT RI 03-029
9. Performing Organization Name and Address 10. Work Unit No. 11. Contract or Grant No.
Department of Geology and Geophysics University of Missouri-Rolla 1870 Miner Circle Rolla, MO 65409
RI03-029
12. Sponsoring Agency Name and Address 13. Type of Report and Period Covered Final Report 14. Sponsoring Agency Code
Missouri Department of Transportation Research, Development and Technology Division P.O. Box 270, Jefferson City, MO 65102 MoDOT 15. Supplementary Notes
This investigation was conducted by the University of Missouri-Rolla in cooperation with the Missouri Department of Transportation.
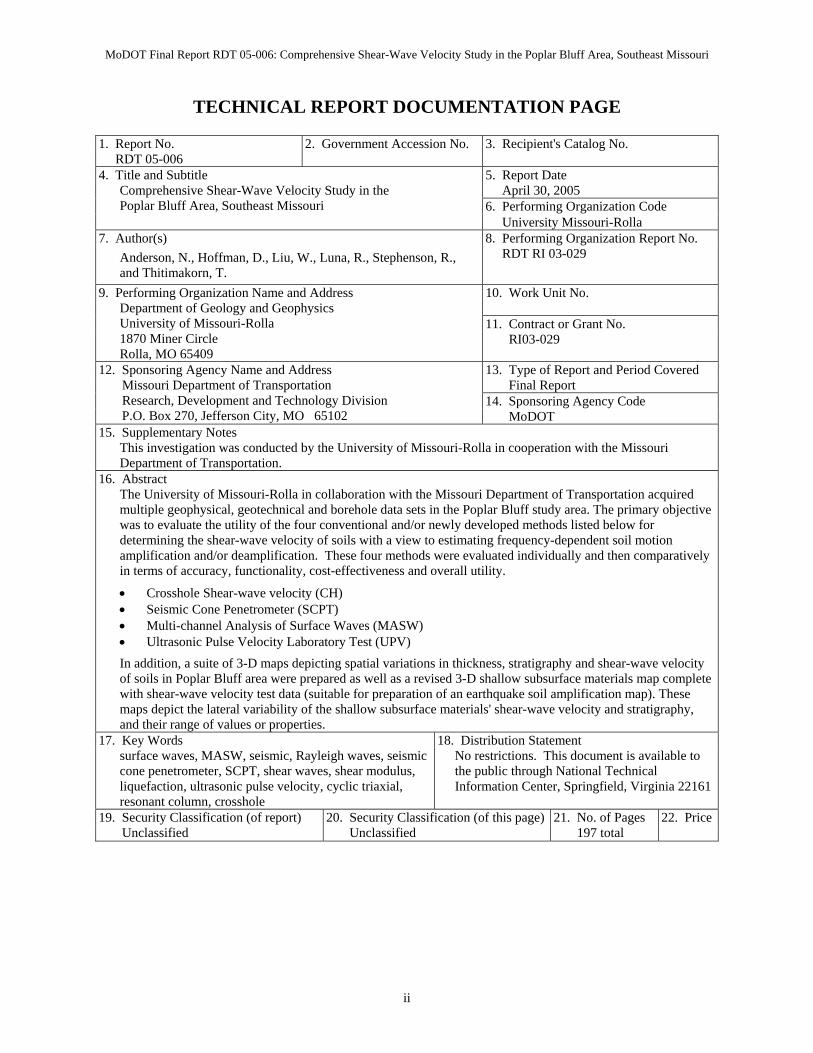
16. Abstract The University of Missouri-Rolla in collaboration with the Missouri Department of Transportation acquired multiple geophysical, geotechnical and borehole data sets in the Poplar Bluff study area. The primary objective was to evaluate the utility of the four conventional and/or newly developed methods listed below for determining the shear-wave velocity of soils with a view to estimating frequency-dependent soil motion amplification and/or deamplification. These four methods were evaluated individually and then comparatively in terms of accuracy, functionality, cost-effectiveness and overall utility.
• Crosshole Shear-wave velocity (CH) • Seismic Cone Penetrometer (SCPT) • Multi-channel Analysis of Surface Waves (MASW) • Ultrasonic Pulse Velocity Laboratory Test (UPV)
In addition, a suite of 3-D maps depicting spatial variations in thickness, stratigraphy and shear-wave velocity of soils in Poplar Bluff area were prepared as well as a revised 3-D shallow subsurface materials map complete with shear-wave velocity test data (suitable for preparation of an earthquake soil amplification map). These maps depict the lateral variability of the shallow subsurface materials' shear-wave velocity and stratigraphy, and their range of values or properties.
17. Key Words 18. Distribution Statement surface waves, MASW, seismic, Rayleigh waves, seismic cone penetrometer, SCPT, shear waves, shear modulus, liquefaction, ultrasonic pulse velocity, cyclic triaxial, resonant column, crosshole
No restrictions. This document is available to the public through National Technical Information Center, Springfield, Virginia 22161
19. Security Classification (of report) 20. Security Classification (of this page) 21. No. of Pages 22. Price Unclassified Unclassified 197 total
ii
MoDOT Final Report RDT 05-006: Comprehensive Shear-Wave Velocity Study in the Poplar Bluff Area, Southeast Missouri
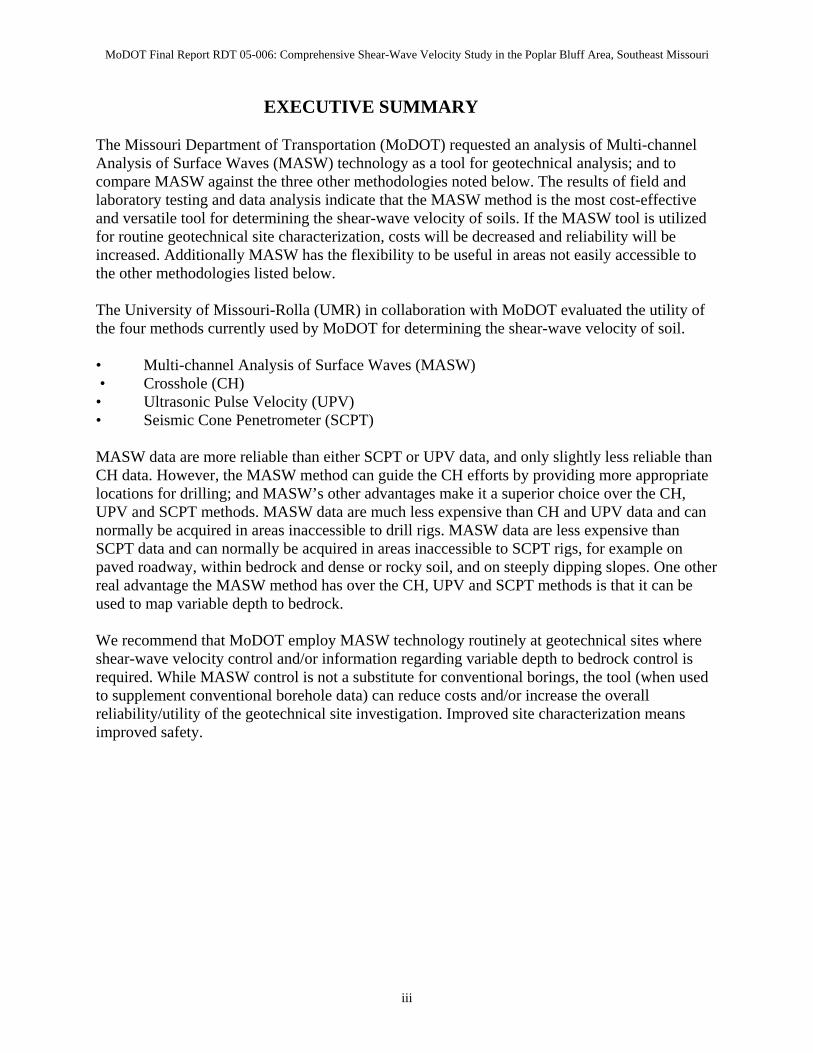
EXECUTIVE SUMMARY The Missouri Department of Transportation (MoDOT) requested an analysis of Multi-channel Analysis of Surface Waves (MASW) technology as a tool for geotechnical analysis; and to compare MASW against the three other methodologies noted below. The results of field and laboratory testing and data analysis indicate that the MASW method is the most cost-effective and versatile tool for determining the shear-wave velocity of soils. If the MASW tool is utilized for routine geotechnical site characterization, costs will be decreased and reliability will be increased. Additionally MASW has the flexibility to be useful in areas not easily accessible to the other methodologies listed below. The University of Missouri-Rolla (UMR) in collaboration with MoDOT evaluated the utility of the four methods currently used by MoDOT for determining the shear-wave velocity of soil. • Multi-channel Analysis of Surface Waves (MASW) • Crosshole (CH) • Ultrasonic Pulse Velocity (UPV) • Seismic Cone Penetrometer (SCPT) MASW data are more reliable than either SCPT or UPV data, and only slightly less reliable than CH data. However, the MASW method can guide the CH efforts by providing more appropriate locations for drilling; and MASW’s other advantages make it a superior choice over the CH, UPV and SCPT methods. MASW data are much less expensive than CH and UPV data and can normally be acquired in areas inaccessible to drill rigs. MASW data are less expensive than SCPT data and can normally be acquired in areas inaccessible to SCPT rigs, for example on paved roadway, within bedrock and dense or rocky soil, and on steeply dipping slopes. One other real advantage the MASW method has over the CH, UPV and SCPT methods is that it can be used to map variable depth to bedrock. We recommend that MoDOT employ MASW technology routinely at geotechnical sites where shear-wave velocity control and/or information regarding variable depth to bedrock control is required. While MASW control is not a substitute for conventional borings, the tool (when used to supplement conventional borehole data) can reduce costs and/or increase the overall reliability/utility of the geotechnical site investigation. Improved site characterization means improved safety.
iii

MoDOT Final Report RDT 05-006: Comprehensive Shear-Wave Velocity Study in the Poplar Bluff Area, Southeast Missouri
ACKNOWLEDGEMENTS The work presented in this report was the product of many collaborators at the Missouri Department of Transportation and the University of Missouri-Rolla. The authors would like to thank Tom Fennessey, Soils & Geology Group, Missouri Department of Transportation, for his efforts as technical liaison and his efforts to see this work move towards implementation within the Department. The financial support from the Missouri Department of Transportation via Task Order RI03-029 is also acknowledged. Thanks also go to the University of Missouri-Rolla University Transportation Center for the matching funds provided for this research project to support graduate students.
iv
MoDOT Final Report RDT 05-006: Comprehensive Shear-Wave Velocity Study in the Poplar Bluff Area, Southeast Missouri
TABLE OF CONTENTS Section Page TITLE PAGE i TECHNICAL REPORT DOCUMENTATION PAGE ii EXECUTIVE SUMMARY iii ACKNOWLEDGEMENTS iv TABLE OF CONTENTS v LIST OF FIGURES viii LIST OF TABLES xvi 1. INTRODUCTION 1
1.1 Statement of Problem 1 1.2 Scope of Work/Objectives 1 1.3 Deliverables 2 1.4 Work Plan 2 1.4.1 Summary of Field and Laboratory Work Plan 2 1.4.2 Generation of Suite of 3-D Maps 4
2. POPLAR BLUFF STUDY AREA 5
2.1 Why Poplar Bluff? 5 2.2 Poplar Bluff Test Sites 6
3. TECHNICAL PROGRAM 15
3.1 Overview 15 4. DRILLING AND SAMPLING PROGRAM 16
4.1 Overview 16 4.2 Drilling and Sampling: Field Procedures 16 4.3 Borehole Logs 17
5. INVASIVE AND NON-INVASIVE FIELD TESTS 17
5.1 Overview 17 5.2 Crosshole (CH) Method 18
5.2.1 Overview 18 5.2.2 CH: Acquisition, Processing and Interpretation 19 5.2.3 Summary Evaluation of CH Method 21
v

MoDOT Final Report RDT 05-006: Comprehensive Shear-Wave Velocity Study in the Poplar Bluff Area, Southeast Missouri
5.3 Seismic Cone Penetrometer (SCPT) Method 27 5.3.1 Overview 27 5.3.2 SCPT: Acquisition, Processing and Interpretation 28 5.3.3 Summary Evaluation of SCPT Method 31
5.4 Multi-channel Analysis of Surface Waves (MASW) Method 43 5.4.1 Overview 43 5.4.2 1-D MASW: Acquisition, Processing and Interpretation 43 5.4.3 2-D MASW: Acquisition, Processing and Interpretation 46 5.4.4 Summary Evaluation of MASW Method 48
6. LABORATORY DYNAMIC SOIL TESTING 57
6.1 Overview 57 6.2 Soil Specimen Tested 58 6.3 Ultrasonic Pulse Velocity (UPV) Laboratory Tests 60
6.3.1 Overview 60 6.3.2 UPV Test Results 60 6.3.3 Summary Evaluation of UPV Method 62
6.4 Cyclic Triaxial (CT) Laboratory Tests 64 6.4.1 Overview 64 6.4.2 CT Test Results 69 6.4.3 Summary Evaluation of CT Method 74
7. COMPARATIVE ANALYSES OF SHEAR-WAVE METHODS 77
7.1 Overview 77 7.2 Comparative Analysis 77
8. MODIFIED GEOLOGIC AND EARTHQUAKE HAZARDS MAPS 82
8.1 Overview 82 8.2 Basic Maps 83 8.3 Stratigraphic Maps 84 8.4 Shear-wave Velocity Map 85 8.5 Earthquake Soil Amplification Map 86
9. DISCUSSION AND RECOMMENDATIONS 110
9.1 Overview 110 9.2 Conclusions and Recommendations 110
10. REFERENCES 111 APPENDIX A: INDIVIDUAL SITE AND BOREHOLE LOCATIONS 113 APPENDIX B: GEOTECHNICAL BOREHOLE LOGS 114 APPENDIX C: LABORATORY SOIL INDEX PROPERTIES TEST RESULTS 134 APPENDIX D: SEISMIC CONE PENETROMETER (SCPT) DATA 142
vi

MoDOT Final Report RDT 05-006: Comprehensive Shear-Wave Velocity Study in the Poplar Bluff Area, Southeast Missouri
APPENDIX E: MASW SENSITIVITY ANALYSES 168
E.1 Overview 168 E.2 Sensitivity Study #1: Extraction of Dispersion Curve Data 168 E.3 Sensitivity Study #2: Inversion of Surface (Rayleigh) Wave Data 169
APPENDIX F: RESONANT COLUMN TEST RESULTS 172
vii
MoDOT Final Report RDT 05-006: Comprehensive Shear-Wave Velocity Study in the Poplar Bluff Area, Southeast Missouri
LIST OF FIGURES Figure Caption Description Page Figure 2.1 Poplar Bluff study area. 8 Figure 2.2 Poplar Bluff study area physiographic provinces and 9
surficial materials. Figure 2.3 Poplar Bluff study area MASW test sites. (2-D MASW 10
shear-wave velocity profiles were acquired at Sites #3, #10, #13, and #31. SCPT data were acquired at thirty test sites during the course of the Poplar Bluff study; SCPT data were acquired at the other ten sites during an earlier study.)
Figure 2.4 Poplar Bluff study area SCPT test sites. (SCPT data were 12
acquired at fifteen of the test sites during the course of the Poplar Bluff study; SCPT data were acquired at the other five sites during an earlier study.)
Figure 2.5 Poplar Bluff study area CH test sites. 13 Figure 2.6 Poplar Bluff study area drill hole sampling sites. (Refer to 14 Figures 5.9, 5.10, and 5.11, and Appendix A.) Figure 5.1 Plot of CH, MASW and SCPT shear-wave velocity profiles 21 for Site #3. The MASW profile was generated by averaging the two 1-D MASW profiles closest to the CH location. The vertical sampling interval shown is therefore smaller than the actual vertical sampling interval on either of the two 1-D profiles used for averaging purposes. Figure 5.2 Site #3 MASW, SCPT and CH locations. 22 Figure 5.3 Plot of CH and MASW shear-wave velocity profiles for 23 Site #15. SCPT data were not acquired at this site because the soil was too coarse. Figure 5.4 Illustration of SCPT method. 28 Figure 5.5 Suite of SCPT shear-wave velocity profiles from Site #3. 33 Figure 5.6 Suite of SCPT shear-wave velocity profiles from Site #10. 34 Figure 5.7 Suite of SCPT shear-wave velocity profiles from Site #13. 35
viii
MoDOT Final Report RDT 05-006: Comprehensive Shear-Wave Velocity Study in the Poplar Bluff Area, Southeast Missouri
Figure 5.8 Suite of SCPT shear-wave velocity profiles from Site #31. 36 Figure 5.9 Site #10 MASW and SCPT locations. 37 Figure 5.10 Site #13 MASW and SCPT locations. 38 Figure 5.11 Site #31 MASW and SCPT locations. 39 Figure 5.12 Acquisition of MASW field data. 44 Figure 5.13 Processing of 1-D MASW field data. 45 Figure 5.14 Generation of a 2-D MASW shear-wave velocity profile. 49 Figure 5.15 2-D MASW shear-wave velocity profile for Site #3 50
(Figure 5.2). Figure 5.16 2-D MASW shear-wave velocity profile for Site #10 51
(Figure 5.9). Figure 5.17 2-D MASW shear-wave velocity profile for Site #13 52
(Figure 5.10). Figure 5.18 2-D MASW shear-wave velocity profile for Site #31 53
(Figure 5.11). Figure 6.1 Stress-strain curve with variation of shear modulus 58
And modulus reduction curve. Figure 6.2 Ultrasonic transducer control unit. 59 Figure 6.3 Ultrasonic transducers. 61 Figure 6.4 Screen shot of shear-wave arrival trace. 61 Figure 6.6 Schematic of cyclic triaxial test equipment. 66 Figure 6.7 GCTS stress-path triaxial test equipment. 66 Figure 6.8 Load frame, cell and pressure control panel. 67 Figure 6.9 Hysteresis loop showing secant and tangent shear 67
modulus.
ix
MoDOT Final Report RDT 05-006: Comprehensive Shear-Wave Velocity Study in the Poplar Bluff Area, Southeast Missouri
Figure 6.10 Shear modulus vs. strain for residuum. 69 Figure 6.11a Shear modulus vs. strain for sand. 70
Figure 6.11b Shear modulus vs. strain for sand. 70
Figure 6.12 Shear modulus vs. strain for silt/clay. 71 Figure 6.13 Normalized shear modulus at different strain levels using 72
cyclic triaxial test: (a) residium soil; (b) sand; (c) silt/clay.
Figure 6.14 Example of cyclic triaxial test results. 73 Figure 8.1 Poplar Bluff study area topography and physiography map. 87 Figure 8.2 Poplar Bluff study area ground surface topography map. 88 Figure 8.3 Poplar Bluff study area ground surface topography map 89 with contours. Figure 8.4 Poplar Bluff study area surficial materials and 90 physiography map. Figure 8.5 Poplar Bluff study area LOGMAIN well data points map. 91 Figure 8.6 Poplar Bluff study area WIMS well data points map. 92 Figure 8.7 Poplar Bluff study area MoDOT boring data points map. 93 Figure 8.8 Poplar Bluff study area LOGMAIN, WIMS & MoDOT 94 data points map. Figure 8.9 Poplar Bluff study area LOGMAIN soil thickness map. 95 Figure 8.10 Poplar Bluff study area WIMS soil thickness map. 96 Figure 8.11 Poplar Bluff study area LOGMAIN bedrock surface 97 topography map. Figure 8.12 Poplar Bluff 3-D model, high angle view from southeast 98 to northwest. Figure 8.13 Poplar Bluff 3-D model, low angle view from southeast 99 to northwest. Figure 8.14 Poplar Bluff 3-D model, ground level view from southeast 100
x
MoDOT Final Report RDT 05-006: Comprehensive Shear-Wave Velocity Study in the Poplar Bluff Area, Southeast Missouri
to northwest. Figure 8.15 Poplar Bluff 3-D model, low angle below ground view 101 from southeast to northwest. Figure 8.16 Poplar Bluff 3-D model, zoomed very low angle view 102 from southeast to northwest. Figure 8.17 Poplar Bluff 3-D model, ground level view from west to east. 103 Figure 8.18 Poplar Bluff 3-D model, high angle view from northwest 104 to southeast. Figure 8.19 Poplar Bluff 3-D model, ground level view from northwest 105 to southeast. Figure 8.20 Poplar Bluff 3-D model, 30% transparent ground surface, 106 high angle view from east-northeast to west-southwest. Figure 8.21 Poplar Bluff study area shear-wave velocity test values. 107 Figure 8.22 Poplar Bluff study area shear-wave velocity test values 108 and surficial materials units. Figure 8.23 Poplar Bluff study area soil amplification map. 109 Figure A.1 Soil samples with Upland Boring ID BHUMR-1, 113 were extracted from the borehole at Test Site #15 (Figure 2.6). Figure A.2 Soil samples with Lowland Boring IDs CHUMR-1, 114 CHUMR-2 and CHUMR-3 were extracted from the borehole at Test Site #19 (Figure 2.6). Figure A.3 Soil samples with Lowland Boring IDs BHUMR-2 115 were extracted from the borehole at Test Site #25 (Figure 2.6). Figure B.1 Geotechnical borehole log for Boring ID BHUMR-1 116 (Appendix A). Figure B.2 Geotechnical borehole log for Boring ID BHUMR-1 117 (Appendix A). Figure B.3 Geotechnical borehole log for Boring ID BHUMR-2 118 (Appendix A).
xi
MoDOT Final Report RDT 05-006: Comprehensive Shear-Wave Velocity Study in the Poplar Bluff Area, Southeast Missouri
Figure B.4 Geotechnical borehole log for Boring ID BHUMR-2 118 (Appendix A). Figure B.5 Geotechnical borehole log for Boring ID BHUMR-2 119 (Appendix A). Figure B.6 Geotechnical borehole log for Boring ID BHUMR-5 120 (Appendix A). Figure B.7 Geotechnical borehole log for Boring ID BHUMR-5 121 (Appendix A). Figure B.8 Geotechnical borehole log for Boring ID BHUMR-5 122 (Appendix A). Figure B.9 Geotechnical borehole log for Boring ID BHUMR-6 123 (Appendix A). Figure B.10 Geotechnical borehole log for Boring ID BHUMR-6 124 (Appendix A). Figure B.11 Geotechnical borehole log for Boring ID BHUMR-6 125 (Appendix A). Figure B.12 Geotechnical borehole log for Upland Boring ID 126 CHUMR-1 (Appendix A). Figure B.13 Geotechnical borehole log for Upland Boring ID 127 CHUMR-1 (Appendix A). Figure B.14 Geotechnical borehole log for Upland Boring ID 128 CHUMR-1 (Appendix A). Figure B.15 Geotechnical borehole log for Upland Boring ID 129 CHUMR-1 (Appendix A). Figure B.16 Geotechnical borehole log for Lowland Boring ID 130 CHUMR-3 (Appendix A). Figure B.17 Geotechnical borehole log for Lowland Boring ID 131 CHUMR-3 (Appendix A). Figure B.18 Geotechnical borehole log for Lowland Boring ID 132 CHUMR-3 (Appendix A).
xii
MoDOT Final Report RDT 05-006: Comprehensive Shear-Wave Velocity Study in the Poplar Bluff Area, Southeast Missouri
Figure B.19 Geotechnical borehole log for Lowland Boring ID 133 CHUMR-3 (Appendix A). Figure C.1 Grain size distribution curve for Boring ID 134 BHUMR-1 (Appendix A). Figure C.2 Grain size distribution curve for Boring IDs 135 BHUMR-1 and BHUMR-2 (Appendix A). Figure C.3 Grain size distribution curve for Boring ID 136 BHUMR-2 (Appendix A). Figure C.4 Grain size distribution curve for Boring IDs 137 BHUMR-1, and BHUMR-5 (Appendix A). Figure C.5 Grain size distribution curve for Boring IDs 138 BHUMR-5, and BHUMR-6 (Appendix A). Figure C.6 Grain size distribution curve for Boring IDs 139 BHUMR-1, BHUMR-2, BHUMR-5, BHUMR-6, and Upland CHUMR-1 (Appendix A). Figure C.7 Grain size distribution curve for Upland Boring ID 140 CHUMR-1 (Appendix A). Figure C.8 Grain size distribution curve for Upland Boring IDs 141 CHUMR-1, and CHUMR-3 (Appendix A). Figure D.1 SCPT data for SCPT Test Site #3-1 (Figure 2.4). 142 Figure D.2 SCPT data for SCPT Test Site #3-2 (Figure 2.4). 143 Figure D.3 SCPT data for SCPT Test Site #3-3 (Figure 2.4). 144 Figure D.4 SCPT data for SCPT Test Site #3-4 (Figure 2.4). 145 Figure D.5 SCPT data for SCPT Test Site #3-5 (Figure 2.4). 146 Figure D.6 SCPT data for SCPT Test Site #4-1 (Figure 2.4). 147 Figure D.7 SCPT data for SCPT Test Site #5-1 (Figure 2.4). 148 Figure D.8 SCPT data for SCPT Test Site #10-1 (Figure 2.4). 149 Figure D.9 SCPT data for SCPT Test Site #10-2 (Figure 2.4). 150
xiii
MoDOT Final Report RDT 05-006: Comprehensive Shear-Wave Velocity Study in the Poplar Bluff Area, Southeast Missouri
Figure D.10 SCPT data for SCPT Test Site #10-3 (Figure 2.4). 151 Figure D.11 SCPT data for SCPT Test Site #10-4 (Figure 2.4). 152 Figure D.12 SCPT data for SCPT Test Site #10-5 (Figure 2.4). 153 Figure D.13 SCPT data for SCPT Test Site #12-1 (Figure 2.4). 154 Figure D.14 SCPT data for SCPT Test Site #13-1 (Figure 2.4). 155 Figure D.15 SCPT data for SCPT Test Site #13-2 (Figure 2.4). 156 Figure D.16 SCPT data for SCPT Test Site #13-3 (Figure 2.4). 157 Figure D.17 SCPT data for SCPT Test Site #13-4 (Figure 2.4). 158 Figure D.18 SCPT data for SCPT Test Site #13-5 (Figure 2.4). 159 Figure D.19 SCPT data for SCPT Test Site #30-1 (Figure 2.4). 160 Figure D.20 SCPT data for SCPT Test Site #31-1 (Figure 2.4). 161 Figure D.21 SCPT data for SCPT Test Site #31-2 (Figure 2.4). 162 Figure D.22 SCPT data for SCPT Test Site #31-3 (Figure 2.4). 163 Figure D.23 SCPT data for SCPT Test Site #31-4 (Figure 2.4). 164 Figure D.24 SCPT data for SCPT Test Site #31-5 (Figure 2.4). 165 Figure D.25 SCPT data for SCPT Test Site #32-1 (Figure 2.4). 166 Figure D.26 SCPT data for SCPT Test Site #38-1 (Figure 2.4). 167 Figure E.1 Field record and three interpreted dispersion curves. 170 Figure E.2 Three interpreted dispersion curves and corresponding 171
1-D shear-wave velocity profiles.
Figure F.1 Shear modulus variation with shear strain. 172 Figure F.2 Normalized shear modulus reduction with shear strain 173 Figure F.3 Resonant frequency and shear modulus of sample 174
CHUMR 3-150 at different shear strain levels (a) psf=1%; (b) psf=2%; (c) psf=3%; (d) psf=4%; (e) psf=10%.
xiv
MoDOT Final Report RDT 05-006: Comprehensive Shear-Wave Velocity Study in the Poplar Bluff Area, Southeast Missouri
Figure F.4 Resonant frequency and shear modulus of sample 176
BHUMR1-032 at different strain levels (a) psf=1%; (b) psf=2%; (c) psf=3%; (d) psf=4%; (e) psf=10%; (f) psf=20%.
Figure F.5 Resonant frequency and shear modulus of sample 178
CHUMR3-141 at different shear strain levels (a) psf=5%; (b) psf=10%; (c) psf=20%; (d) psf=30%; (e) psf=40%; (f) psf=50%; (g) psf=60%; (h) psf=70%; (i) psf=80%.
xv
MoDOT Final Report RDT 05-006: Comprehensive Shear-Wave Velocity Study in the Poplar Bluff Area, Southeast Missouri
LIST OF TABLES
Table Caption Description Page
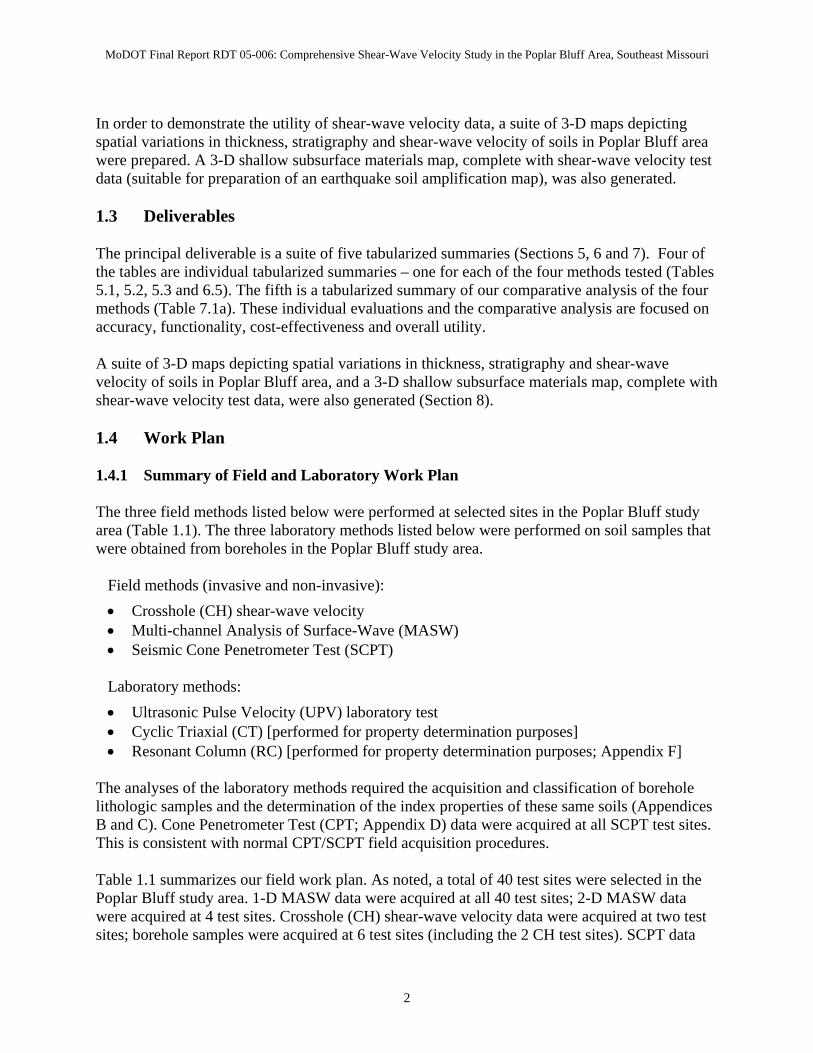
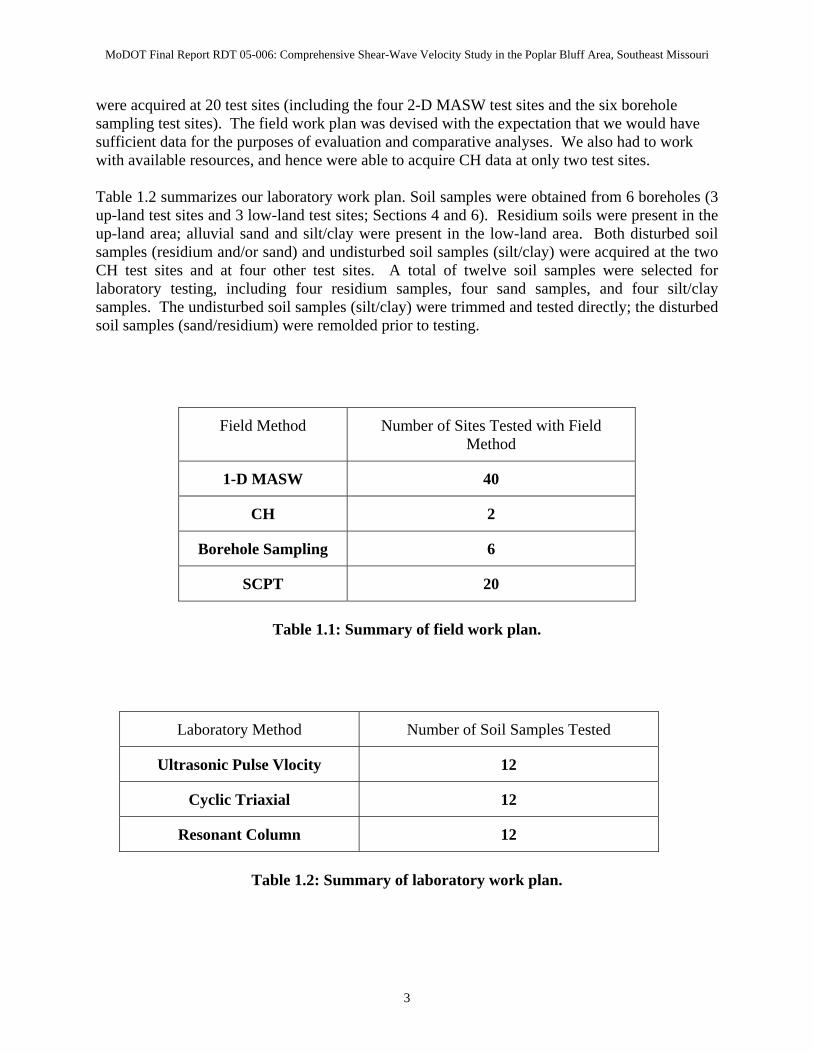
Table 1.1 Summary of field work plan. 3 Table 1.2 Summary of laboratory work plan. 3 Table 2.1 Poplar Bluff study area shear-wave velocity test sites. 11 Table 4.1 Drilling and borehole detailed plan (site, structure and 17 sampling). Table 5.1 Tabularized summary of the CH method. 24
Table 5.2 Tabularized summary of the SCPT method. 40
Table 5.3 Tabularized summary of the MASW method. 54 Table 6.1 Soil specimens tested. 59 Table 6.2 UPV test results. 62 Table 6.3 Tabularized summary of the UPV method. 63 Table 6.4 CT test results. 68 Table 6.5 Tabularized summary of the CT method. 74 Table 7.1a Overall ranking of MASW, CH, SCPT and UPV methods 78
(based on tests of relatively uniform soils in Poplar Bluff study area).
Table 7.2b Accuracy and reliability of MASW, CH, SCPT and 78 UPV methods. Table 7.1c Functionality (acquisition) of MASW, CH, SCPT and 79 UPV methods. Table 7.1d Functionality (processing) of MASW, CH, SCPT and 79 UPV methods. Table 7.1e Ranking of utility of MASW, CH, SCPT and UPV shear 80 wave profile data.
xvi
MoDOT Final Report RDT 05-006: Comprehensive Shear-Wave Velocity Study in the Poplar Bluff Area, Southeast Missouri
Table 7.1f Ranking of utility (supplemental considerations) of MASW, 80 CH, SCPT and UPV shear-wave profile data. Table 7.1g Cost-effectiveness of MASW, CH, SCPT and UPV 81 shear-wave profile data. Table 7.1h Relative utility to MoDOT (for determination of shear - 81 wave velocity of soil in Mississippi Embayment). Table A.1 Drilling and borehole detailed plan (site, structure and 113 sampling).
xvii
MoDOT Final Report RDT 05-006: Comprehensive Shear-Wave Velocity Study in the Poplar Bluff Area, Southeast Missouri
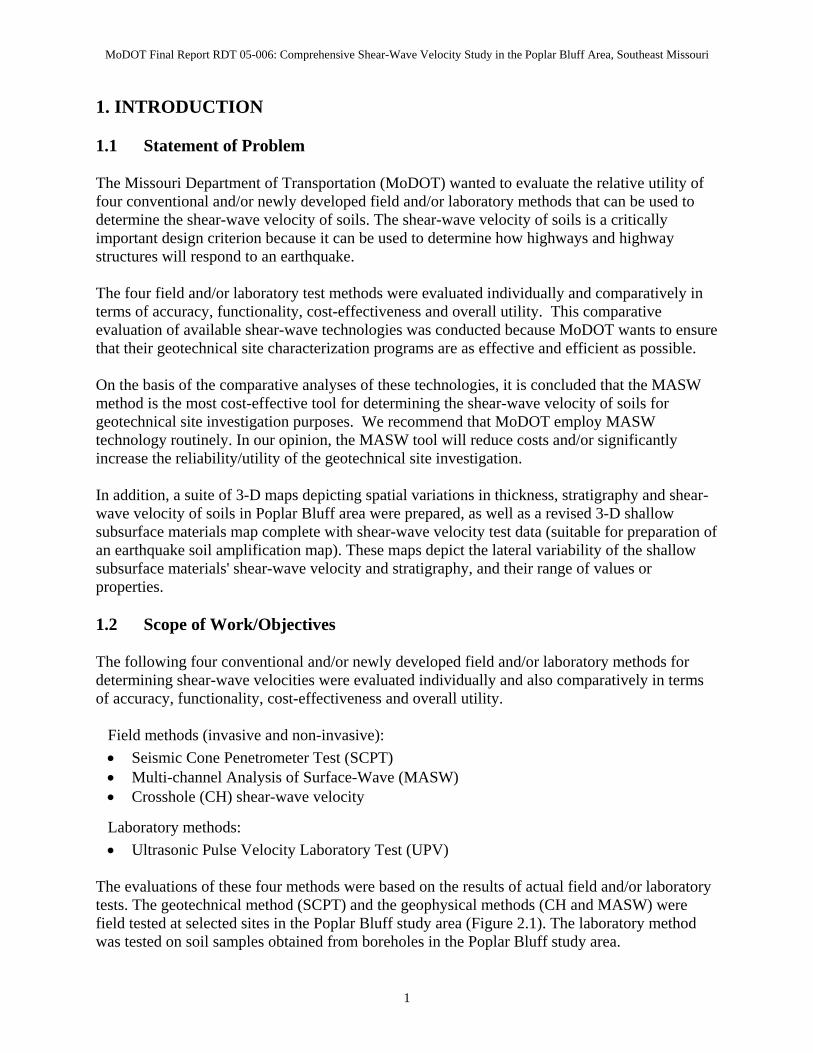
1. INTRODUCTION 1.1 Statement of Problem The Missouri Department of Transportation (MoDOT) wanted to evaluate the relative utility of four conventional and/or newly developed field and/or laboratory methods that can be used to determine the shear-wave velocity of soils. The shear-wave velocity of soils is a critically important design criterion because it can be used to determine how highways and highway structures will respond to an earthquake. The four field and/or laboratory test methods were evaluated individually and comparatively in terms of accuracy, functionality, cost-effectiveness and overall utility. This comparative evaluation of available shear-wave technologies was conducted because MoDOT wants to ensure that their geotechnical site characterization programs are as effective and efficient as possible. On the basis of the comparative analyses of these technologies, it is concluded that the MASW method is the most cost-effective tool for determining the shear-wave velocity of soils for geotechnical site investigation purposes. We recommend that MoDOT employ MASW technology routinely. In our opinion, the MASW tool will reduce costs and/or significantly increase the reliability/utility of the geotechnical site investigation. In addition, a suite of 3-D maps depicting spatial variations in thickness, stratigraphy and shear-wave velocity of soils in Poplar Bluff area were prepared, as well as a revised 3-D shallow subsurface materials map complete with shear-wave velocity test data (suitable for preparation of an earthquake soil amplification map). These maps depict the lateral variability of the shallow subsurface materials' shear-wave velocity and stratigraphy, and their range of values or properties. 1.2 Scope of Work/Objectives The following four conventional and/or newly developed field and/or laboratory methods for determining shear-wave velocities were evaluated individually and also comparatively in terms of accuracy, functionality, cost-effectiveness and overall utility.
Field methods (invasive and non-invasive):
• Seismic Cone Penetrometer Test (SCPT) • Multi-channel Analysis of Surface-Wave (MASW) • Crosshole (CH) shear-wave velocity
Laboratory methods:
• Ultrasonic Pulse Velocity Laboratory Test (UPV) The evaluations of these four methods were based on the results of actual field and/or laboratory tests. The geotechnical method (SCPT) and the geophysical methods (CH and MASW) were field tested at selected sites in the Poplar Bluff study area (Figure 2.1). The laboratory method was tested on soil samples obtained from boreholes in the Poplar Bluff study area.
1
MoDOT Final Report RDT 05-006: Comprehensive Shear-Wave Velocity Study in the Poplar Bluff Area, Southeast Missouri
In order to demonstrate the utility of shear-wave velocity data, a suite of 3-D maps depicting spatial variations in thickness, stratigraphy and shear-wave velocity of soils in Poplar Bluff area were prepared. A 3-D shallow subsurface materials map, complete with shear-wave velocity test data (suitable for preparation of an earthquake soil amplification map), was also generated. 1.3 Deliverables The principal deliverable is a suite of five tabularized summaries (Sections 5, 6 and 7). Four of the tables are individual tabularized summaries – one for each of the four methods tested (Tables 5.1, 5.2, 5.3 and 6.5). The fifth is a tabularized summary of our comparative analysis of the four methods (Table 7.1a). These individual evaluations and the comparative analysis are focused on accuracy, functionality, cost-effectiveness and overall utility. A suite of 3-D maps depicting spatial variations in thickness, stratigraphy and shear-wave velocity of soils in Poplar Bluff area, and a 3-D shallow subsurface materials map, complete with shear-wave velocity test data, were also generated (Section 8). 1.4 Work Plan 1.4.1 Summary of Field and Laboratory Work Plan The three field methods listed below were performed at selected sites in the Poplar Bluff study area (Table 1.1). The three laboratory methods listed below were performed on soil samples that were obtained from boreholes in the Poplar Bluff study area.
Field methods (invasive and non-invasive):
• Crosshole (CH) shear-wave velocity • Multi-channel Analysis of Surface-Wave (MASW) • Seismic Cone Penetrometer Test (SCPT)
Laboratory methods:
• Ultrasonic Pulse Velocity (UPV) laboratory test • Cyclic Triaxial (CT) [performed for property determination purposes] • Resonant Column (RC) [performed for property determination purposes; Appendix F]
The analyses of the laboratory methods required the acquisition and classification of borehole lithologic samples and the determination of the index properties of these same soils (Appendices B and C). Cone Penetrometer Test (CPT; Appendix D) data were acquired at all SCPT test sites. This is consistent with normal CPT/SCPT field acquisition procedures. Table 1.1 summarizes our field work plan. As noted, a total of 40 test sites were selected in the Poplar Bluff study area. 1-D MASW data were acquired at all 40 test sites; 2-D MASW data were acquired at 4 test sites. Crosshole (CH) shear-wave velocity data were acquired at two test sites; borehole samples were acquired at 6 test sites (including the 2 CH test sites). SCPT data
2
MoDOT Final Report RDT 05-006: Comprehensive Shear-Wave Velocity Study in the Poplar Bluff Area, Southeast Missouri
were acquired at 20 test sites (including the four 2-D MASW test sites and the six borehole sampling test sites). The field work plan was devised with the expectation that we would have sufficient data for the purposes of evaluation and comparative analyses. We also had to work with available resources, and hence were able to acquire CH data at only two test sites. Table 1.2 summarizes our laboratory work plan. Soil samples were obtained from 6 boreholes (3 up-land test sites and 3 low-land test sites; Sections 4 and 6). Residium soils were present in the up-land area; alluvial sand and silt/clay were present in the low-land area. Both disturbed soil samples (residium and/or sand) and undisturbed soil samples (silt/clay) were acquired at the two CH test sites and at four other test sites. A total of twelve soil samples were selected for laboratory testing, including four residium samples, four sand samples, and four silt/clay samples. The undisturbed soil samples (silt/clay) were trimmed and tested directly; the disturbed soil samples (sand/residium) were remolded prior to testing.
Field Method Number of Sites Tested with Field Method
1-D MASW 40
CH 2
Borehole Sampling 6
SCPT 20
Table 1.1: Summary of field work plan.
Laboratory Method Number of Soil Samples Tested
Ultrasonic Pulse Vlocity 12
Cyclic Triaxial 12
Resonant Column 12
Table 1.2: Summary of laboratory work plan.
3

MoDOT Final Report RDT 05-006: Comprehensive Shear-Wave Velocity Study in the Poplar Bluff Area, Southeast Missouri
1.4.2 Generation of Suite of 3-D Maps In order to demonstrate the utility of shear-wave velocity data, a suite of 3-D maps depicting spatial variations in the thickness, stratigraphy, and shear-wave velocity of soils in the Poplar Bluff area were prepared (Section 8). A 3-D shallow subsurface materials map, complete with shear-wave velocity test data (suitable for preparation of an earthquake soil amplification map) was also generated. The generation of the suite of maps for the Poplar Bluff study area involved the following:
• Collection of readily available existing and newly generated digital data, databases, and maps with information on soil stratigraphy and shear-wave velocity from the following sources:
o Missouri Department of Natural Resources (MoDNR), Geological Survey and Resource Assessment Division LOGMAIN stratigraphic well log database WIMS water well drillers well log database Public water supply well log database Digital surficial materials maps of the study area Shear-wave velocity database for study area
o Missouri Department of Transportation, Geotechnical Section MoDOT geotechnical database New SCPT shear-wave velocity data from this study
o University of Missouri – Rolla New MASW shear-wave velocity data from this study New CH shear-wave velocity data from this study New borings stratigraphic data from this study New laboratory UPV shear-wave velocity data from this study
o Other public and commercial sources Digital Raster Graphic (DRG) topographic map images Digital Orthophoto Quarter Quadrangle (DOQQ) airphoto images Digital Elevation Model (DEM) elevation data Highway data Topographic map boundaries Urban boundaries
• Evaluation of these data for problems and determination of usefulness (re: planned
mapping). • Sorting, converting, formatting, and, where necessary, modifying the digital data for the
purposes of making the planned maps. This also involved entering some new data into tables or databases.
• Using a geographic information system (GIS), specifically ArcView with the 3-D
Analyst’s Extension, to manipulate the digital data and generate the suite of maps.
4
MoDOT Final Report RDT 05-006: Comprehensive Shear-Wave Velocity Study in the Poplar Bluff Area, Southeast Missouri
Inherent problems in the various data bases limited their usefulness. Most of these problems fell into one of the following categories.
• Inadequate location coordinates • Limited stratigraphic information • Limited depth penetration • Inadequate elevation information
Some data did not include adequate or usable location coordinates information and therefore could not be used in the GIS environment. This was a problem with some of the WIMS well log information provided by water well drillers. Most of the LOGMAIN, WIMS and public water supply well logs had little stratigraphic information on the soils or non-bedrock surficial materials. Often this interval was lumped into one entry with a generic description that could not be used to map separate layers. MoDOT boring logs have relatively detailed soil stratigraphy but the borings frequently did not penetrate very deep and therefore did not sample the entire thickness of the surficial material. In the Mississippi Embayment portion of the study area, wells and borings seldom penetrated bedrock for two reasons. For water wells, an abundant water supply is available in the shallow alluvial aquifer so there is no need to drill deeper into bedrock. For MoDOT borings, the deeper portion of the surficial materials is not explored as that stratigraphic information is not usually needed for traditional geotechnical foundation design. Therefore, surficial material thickness data is very sparse for the Mississippi Embayment area and the thickness maps produced for that area show only a minimum thickness based on available data. In most cases the bedrock surface is probably deeper than shown. In the Ozarks uplands the surficial materials are often quite thick also and therefore some wells and borings do not penetrate the entire thickness. At some locations in the Ozarks, the surficial materials thickness maps show only a minimum thickness based on available date. The public water supply well database only contained 28 wells for the study area and this database included no surficial materials stratigraphy data. Therefore, this database was not used during this study. Most of the wells in the public water supply database are also in the LOGMAIN database which was used. Some data, the WIMS well logs for example, had no elevation information and therefore could not be used to generate elevation contours and surfaces for their stratigraphic data.
Other problems in the various data sources were related to their format. It was necessary in many cases to individually review the records or fields for each log and reformat them or make new fields in a table that could be used in the GIS environment. The new data fields could then be used to map the desired characteristics. 2. POPLAR BLUFF STUDY AREA 2.1 Why Poplar Bluff? The Poplar Bluff study area was selected because a significant amount of shear-wave velocity, geotechnical and geological data already existed for the area due to an earlier study to map
5
MoDOT Final Report RDT 05-006: Comprehensive Shear-Wave Velocity Study in the Poplar Bluff Area, Southeast Missouri
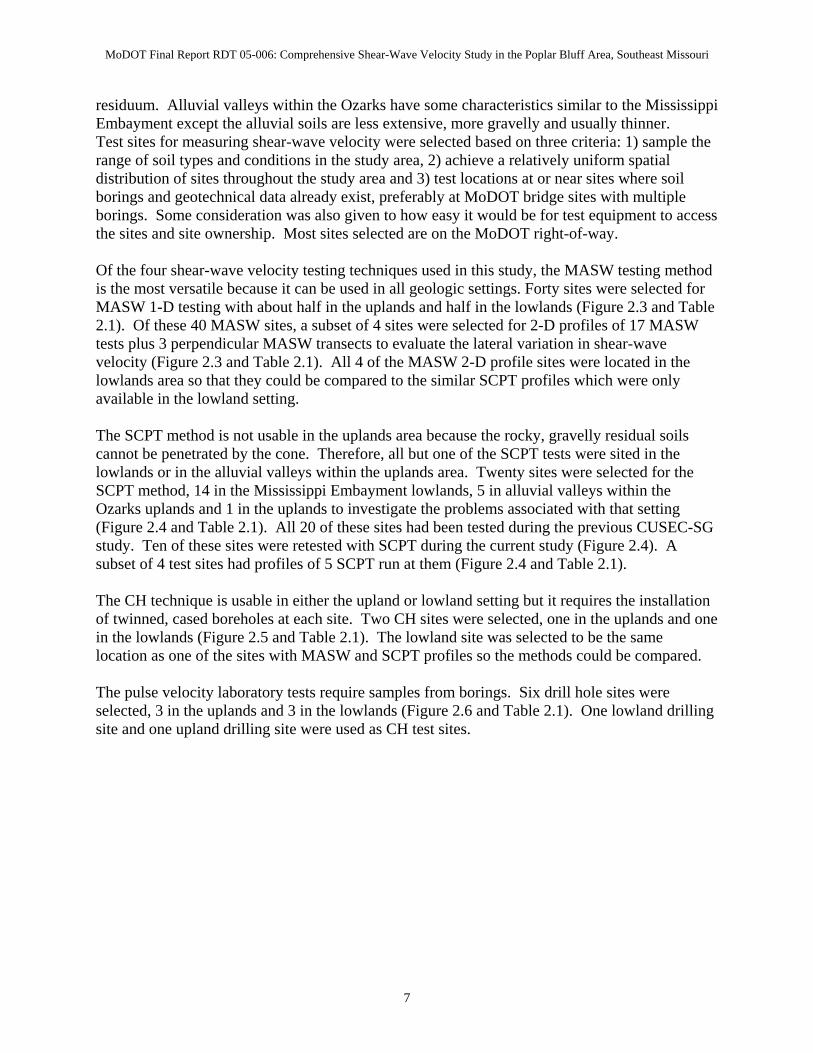
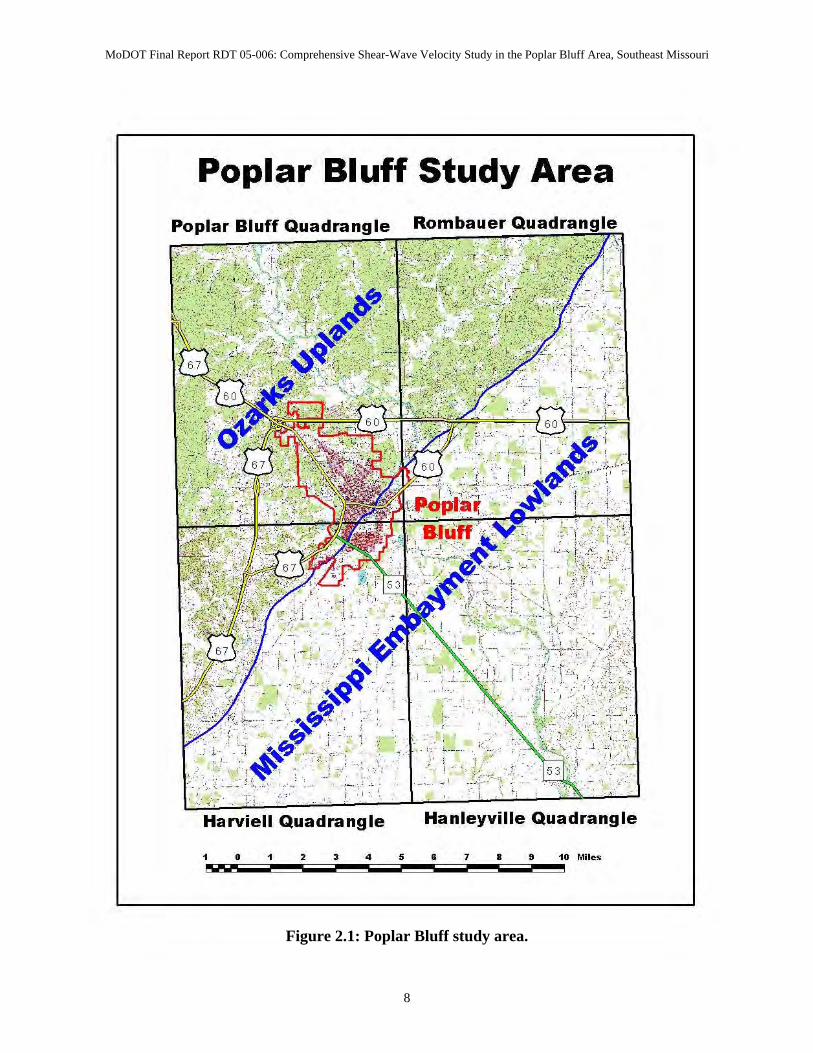
earthquake soil amplification. This existing data could be used to support the current study which is focused on comparison of shear-wave velocity testing techniques. The earlier study was conducted by the Missouri Department of Natural Resources (MoDNR), Geological Survey Program with support from the US Geological Survey (USGS), the Association of Central United States Earthquake Consortium State Geologists (CUSEC-SG) and the Missouri Department of Transportation (MoDOT). The objective of the earlier study was to map the earthquake shaking amplification characteristics of the local soils based on their shear-wave velocity. Poplar Bluff was selected for the MoDNR project because it is one of the larger communities in southeast Missouri that would be impacted by a damaging earthquake originating in the New Madrid Seismic Zone. The resulting map will help Poplar Bluff assess its earthquake shaking vulnerability and to mitigate the consequences. Of additional significance to the current study is the Poplar Bluff setting. It is partially located in the Mississippi Embayment alluvial lowlands of southeast Missouri and partially in the Ozarks uplands. Therefore, two very different types of soil materials were available for testing and comparing the four shear-wave velocity measurement techniques being evaluated. This allowed the strengths and weaknesses of the techniques to be evaluated over a larger range of materials and conditions. Two major highways traverse the study area. Route US 60 crosses the area in the east-west direction and Route US 67 crosses the area in the north-south direction. Both of these four-lane divided highways are critical emergency access routes which will need to function during and after an earthquake in southeast Missouri. Therefore, studying conditions along these routes is valuable to MoDOT’s earthquake preparedness. 2.2 Poplar Bluff Test Sites The Poplar Bluff study area was selected to include four USGS 7.5’ topographic quadrangle maps with the City of Poplar Bluff located near where the four maps join. The four maps are the Poplar Bluff, Rombauer, Harviell and Hanleyville quadrangles (Figure 2.1). The study area is about 17 miles north-south and 14 miles east-west. The northwest portion of the study area is within the Ozarks uplands province and the southeast portion is in the Mississippi Embayment lowlands province (Figure 2.1). The soils, or surficial materials (Figure 2.2), the topography and the groundwater level in these two areas are quite different. The lowland are almost flat and have stream deposited alluvial soils composed mostly of sand with some silt, clay and gravel. The alluvial soils are 100 to 200 ft thick, except adjacent to the uplands. The groundwater level is very shallow in the lowlands, commonly 5 to 15 ft deep. In the Ozarks uplands, the topography varies from quite hilly and rugged near stream valleys to gently rolling or nearly level on the upland drainage divides. The residual soils are derived from prolonged weathering of the bedrock upper surface. Intense weathering has dissolved the soluble portions of the bedrock units leaving behind thick deposits of insoluble clay and large amounts of chert gravel. The residuum varies in thickness from about 40 ft to over 200 ft, commonly being about 100 ft thick. The groundwater level is usually below the base of the residuum in the bedrock although small perched groundwater zones occasionally exist in the
6
MoDOT Final Report RDT 05-006: Comprehensive Shear-Wave Velocity Study in the Poplar Bluff Area, Southeast Missouri
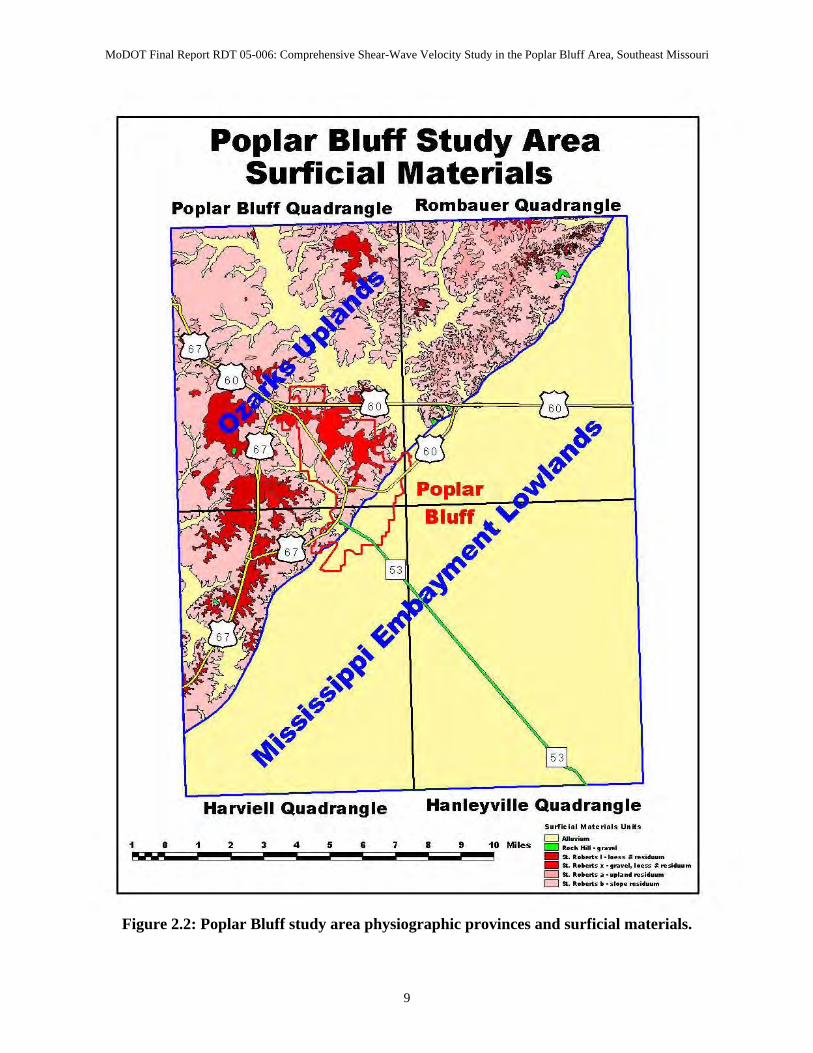
residuum. Alluvial valleys within the Ozarks have some characteristics similar to the Mississippi Embayment except the alluvial soils are less extensive, more gravelly and usually thinner. Test sites for measuring shear-wave velocity were selected based on three criteria: 1) sample the range of soil types and conditions in the study area, 2) achieve a relatively uniform spatial distribution of sites throughout the study area and 3) test locations at or near sites where soil borings and geotechnical data already exist, preferably at MoDOT bridge sites with multiple borings. Some consideration was also given to how easy it would be for test equipment to access the sites and site ownership. Most sites selected are on the MoDOT right-of-way. Of the four shear-wave velocity testing techniques used in this study, the MASW testing method is the most versatile because it can be used in all geologic settings. Forty sites were selected for MASW 1-D testing with about half in the uplands and half in the lowlands (Figure 2.3 and Table 2.1). Of these 40 MASW sites, a subset of 4 sites were selected for 2-D profiles of 17 MASW tests plus 3 perpendicular MASW transects to evaluate the lateral variation in shear-wave velocity (Figure 2.3 and Table 2.1). All 4 of the MASW 2-D profile sites were located in the lowlands area so that they could be compared to the similar SCPT profiles which were only available in the lowland setting. The SCPT method is not usable in the uplands area because the rocky, gravelly residual soils cannot be penetrated by the cone. Therefore, all but one of the SCPT tests were sited in the lowlands or in the alluvial valleys within the uplands area. Twenty sites were selected for the SCPT method, 14 in the Mississippi Embayment lowlands, 5 in alluvial valleys within the Ozarks uplands and 1 in the uplands to investigate the problems associated with that setting (Figure 2.4 and Table 2.1). All 20 of these sites had been tested during the previous CUSEC-SG study. Ten of these sites were retested with SCPT during the current study (Figure 2.4). A subset of 4 test sites had profiles of 5 SCPT run at them (Figure 2.4 and Table 2.1). The CH technique is usable in either the upland or lowland setting but it requires the installation of twinned, cased boreholes at each site. Two CH sites were selected, one in the uplands and one in the lowlands (Figure 2.5 and Table 2.1). The lowland site was selected to be the same location as one of the sites with MASW and SCPT profiles so the methods could be compared. The pulse velocity laboratory tests require samples from borings. Six drill hole sites were selected, 3 in the uplands and 3 in the lowlands (Figure 2.6 and Table 2.1). One lowland drilling site and one upland drilling site were used as CH test sites.
7
MoDOT Final Report RDT 05-006: Comprehensive Shear-Wave Velocity Study in the Poplar Bluff Area, Southeast Missouri
Figure 2.1: Poplar Bluff study area.
8
Poplar Bluff Study Area
Poplar Bluff Quadrangle
Harviell Quadrangle
, , 1'\0.-.-
, , , 4
. _, I
Hanleyville Quadrangle
, , , • 9 10 Miles
MoDOT Final Report RDT 05-006: Comprehensive Shear-Wave Velocity Study in the Poplar Bluff Area, Southeast Missouri
Figure 2.2: Poplar Bluff study area physiographic provinces and surficial materials.
9
Poplar Bluff Study Area Surficial Materials
Poplar Bluff Quadrangle
Harviell Quadrangle Hanleyville Quadrangle Surfiei.1 Mote,i.l. u"~.
~ ;,.,._1iiI._ ... '= .. ''''''' ... '= .. ' ....... 4 ........ ' """ ... '= .. ''''''' .... = .. ' ....... 10 Miles
D Alluvi ...
~ .... kHm· ...... ' _ ... Ilo . . ... ,., . . .. ~ ... i ... ..
_ ........... x · .... v." I . ... ~ '",.".u .. D st ...... ... . _.,10." ... i •• u ..
D st ...... ...... ,., .... i".u ..
MoDOT Final Report RDT 05-006: Comprehensive Shear-Wave Velocity Study in the Poplar Bluff Area, Southeast Missouri
Figure 2.3: Poplar Bluff study area MASW test sites. (2-D MASW shear-wave velocity profiles were acquired at Sites #3, #10, #13, and #31. SCPT data were acquired at thirty
test sites during the course of the Poplar Bluff study; SCPT data were acquired at the other ten sites during an earlier study.)
10
Poplar Bluff Study Area MASW Test Sites
34 ...
... 31
Harviell Quadrangle Hanleyville Quadrangle ... MASW 2-D & 1_D Test Site N us GO & US 67 D Poplar Bluff Surfiei . 1 Mote,i . l. u"~.
D Quadrangles D AI'uvi ... ... MASW 1_D Test Site N MO 53 D "ysiog~phic Provinces _ .... kHm· . ..... '
_ ... Ilo . . ... ,., . ... ~ ... i ... ..
o 2 3 4 5 CO 7 I 9 10 Miles _ ... Ilo ..... x ..... v.,,' . ... ~ .. ,; ••• D ........ ... .... , . .. ... ;."" .. D ........ ... . -. ,., ... ,Hlyu ..
MoDOT Final Report RDT 05-006: Comprehensive Shear-Wave Velocity Study in the Poplar Bluff Area, Southeast Missouri
Poplar Bluff StudyArea Shear Wave Velocity Test Sites
Site Name of Site Surficial Material Number Number Number Number Number Number Number Boring MoDOT SiteID MASW MASW SCPT SCPT CH Laboratory Borings/ ID Bridge ID
Tests Tests Tests Tests Tests Tests Sampling IDExisting New Existing New New New New
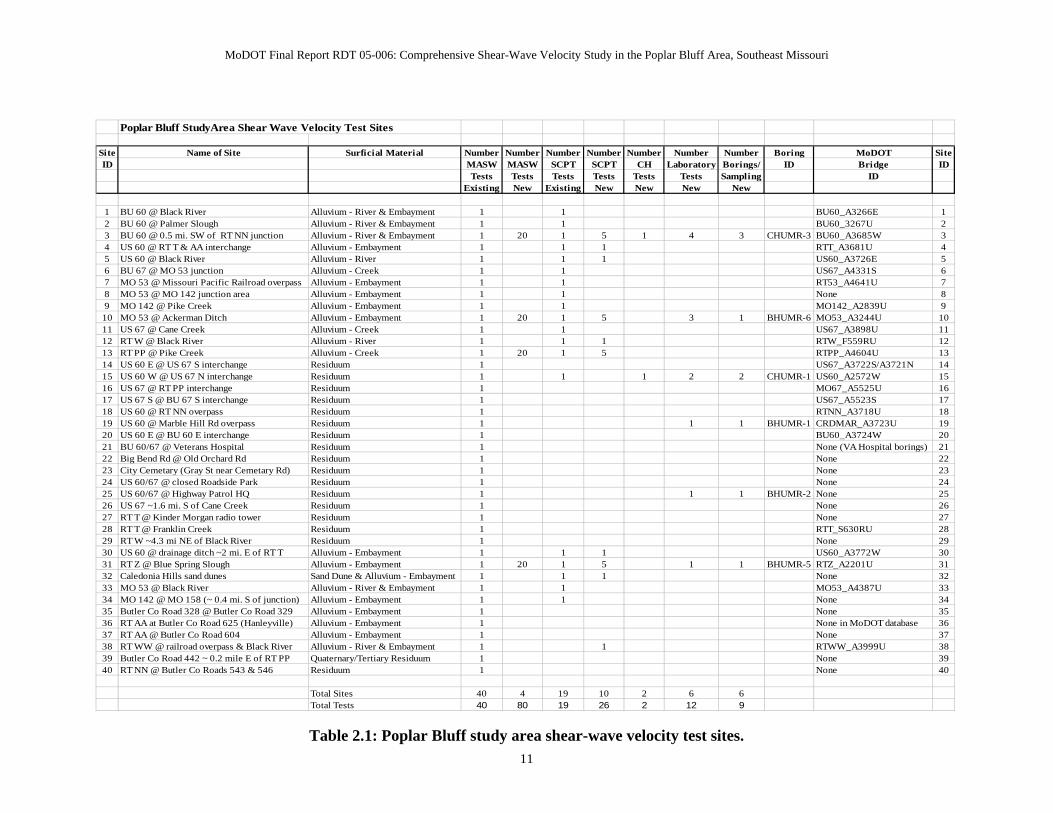
1 BU 60 @ Black River Alluvium - River & Embayment 1 1 BU60_A3266E 12 BU 60 @ Palmer Slough Alluvium - River & Embayment 1 1 BU60_3267U 23 BU 60 @ 0.5 mi. SW of RT NN junction Alluvium - River & Embayment 1 20 1 5 1 4 3 CHUMR-3 BU60_A3685W 34 US 60 @ RT T & AA interchange Alluvium - Embayment 1 1 1 RTT_A3681U 45 US 60 @ Black River Alluvium - River 1 1 1 US60_A3726E 56 BU 67 @ MO 53 junction Alluvium - Creek 1 1 US67_A4331S 67 MO 53 @ Missouri Pacific Railroad overpass Alluvium - Embayment 1 1 RT53_A4641U 78 MO 53 @ MO 142 junction area Alluvium - Embayment 1 1 None 89 MO 142 @ Pike Creek Alluvium - Embayment 1 1 MO142_A2839U 910 MO 53 @ Ackerman Ditch Alluvium - Embayment 1 20 1 5 3 1 BHUMR-6 MO53_A3244U 1011 US 67 @ Cane Creek Alluvium - Creek 1 1 US67_A3898U 1112 RT W @ Black River Alluvium - River 1 1 1 RTW_F559RU 1213 RT PP @ Pike Creek Alluvium - Creek 1 20 1 5 RTPP_A4604U 1314 US 60 E @ US 67 S interchange Residuum 1 US67_A3722S/A3721N 1415 US 60 W @ US 67 N interchange Residuum 1 1 1 2 2 CHUMR-1 US60_A2572W 1516 US 67 @ RT PP interchange Residuum 1 MO67_A5525U 1617 US 67 S @ BU 67 S interchange Residuum 1 US67_A5523S 1718 US 60 @ RT NN overpass Residuum 1 RTNN_A3718U 1819 US 60 @ Marble Hill Rd overpass Residuum 1 1 1 BHUMR-1 CRDMAR_A3723U 1920 US 60 E @ BU 60 E interchange Residuum 1 BU60_A3724W 2021 BU 60/67 @ Veterans Hospital Residuum 1 None (VA Hospital borings) 2122 Big Bend Rd @ Old Orchard Rd Residuum 1 None 2223 City Cemetary (Gray St near Cemetary Rd) Residuum 1 None 2324 US 60/67 @ closed Roadside Park Residuum 1 None 2425 US 60/67 @ Highway Patrol HQ Residuum 1 1 1 BHUMR-2 None 2526 US 67 ~1.6 mi. S of Cane Creek Residuum 1 None 2627 RT T @ Kinder Morgan radio tower Residuum 1 None 2728 RT T @ Franklin Creek Residuum 1 RTT_S630RU 2829 RT W ~4.3 mi NE of Black River Residuum 1 None 2930 US 60 @ drainage ditch ~2 mi. E of RT T Alluvium - Embayment 1 1 1 US60_A3772W 3031 RT Z @ Blue Spring Slough Alluvium - Embayment 1 20 1 5 1 1 BHUMR-5 RTZ_A2201U 3132 Caledonia Hills sand dunes Sand Dune & Alluvium - Embayment 1 1 1 None 3233 MO 53 @ Black River Alluvium - River & Embayment 1 1 MO53_A4387U 3334 MO 142 @ MO 158 (~ 0.4 mi. S of junction) Alluvium - Embayment 1 1 None 3435 Butler Co Road 328 @ Butler Co Road 329 Alluvium - Embayment 1 None 3536 RT AA at Butler Co Road 625 (Hanleyville) Alluvium - Embayment 1 None in MoDOT database 3637 RT AA @ Butler Co Road 604 Alluvium - Embayment 1 None 3738 RT WW @ railroad overpass & Black River Alluvium - River & Embayment 1 1 RTWW_A3999U 3839 Butler Co Road 442 ~ 0.2 mile E of RT PP Quaternary/Tertiary Residuum 1 None 3940 RT NN @ Butler Co Roads 543 & 546 Residuum 1 None 40
Total Sites 40 4 19 10 2 6 6Total Tests 40 80 19 26 2 12 9
Table 2.1: Poplar Bluff study area shear-wave velocity test sites.
11
MoDOT Final Report RDT 05-006: Comprehensive Shear-Wave Velocity Study in the Poplar Bluff Area, Southeast Missouri
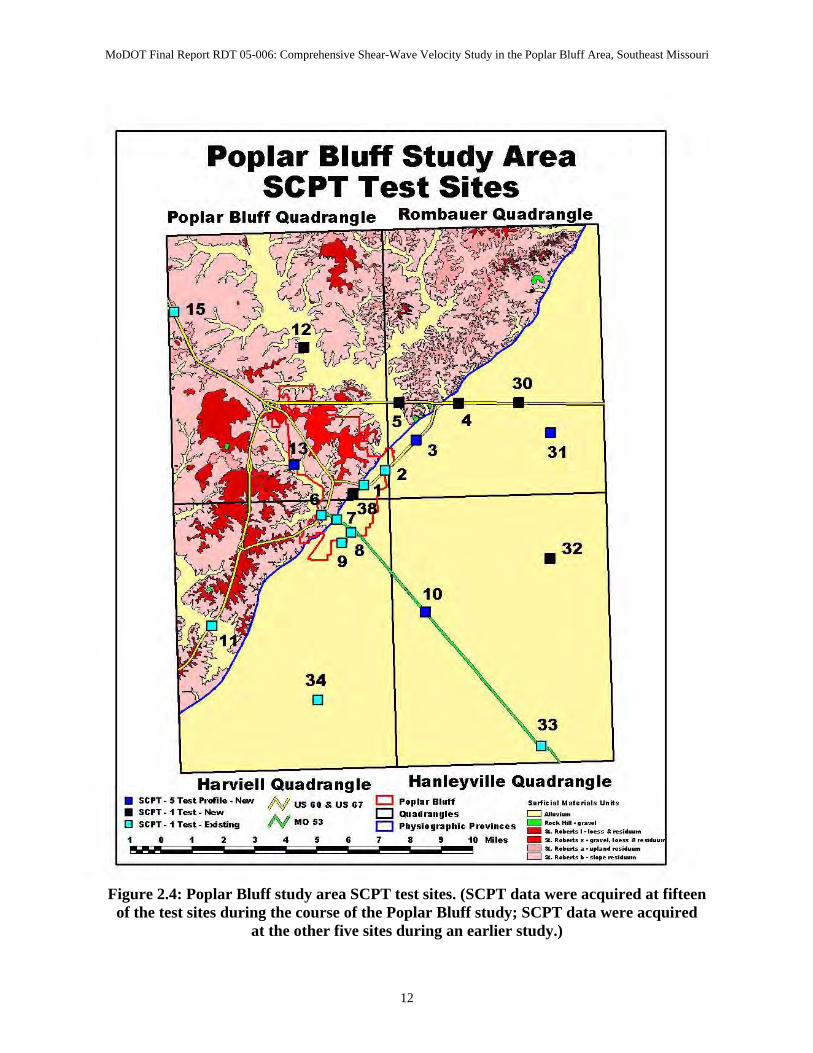
Figure 2.4: Poplar Bluff study area SCPT test sites. (SCPT data were acquired at fifteen
of the test sites during the course of the Poplar Bluff study; SCPT data were acquired at the other five sites during an earlier study.)
12
Poplar Bluff Study Area SePT Test Sites
Poplar Bluff
34 o
4
30
• 31
Harviell Quadrangle Hanleyville Quadrangle • sePT - 5 Test Profile - New N US GO & US 67 D Poplar Bluff S.rfieiol Mote,i.l. u"~ • • SePT - 1 Test_ New D Quadrangles D AI'uvi ... o SCPT_1 Test_ Existing N MO 53 D "ysiog~phic Provinces _ .... kHm ....... '
_ ... Ilo . . ... ,., . ... ~ ... i •• " ..
o 2 3 4 5 G 7 I 9 10 Miles _ ... Ilo ..... x ..... v.,,' . ... ~ .. ,; ••• D st ...... ... . _.,10." ... i""u," D ........ ... . -. ,., . ... i".u ..
MoDOT Final Report RDT 05-006: Comprehensive Shear-Wave Velocity Study in the Poplar Bluff Area, Southeast Missouri
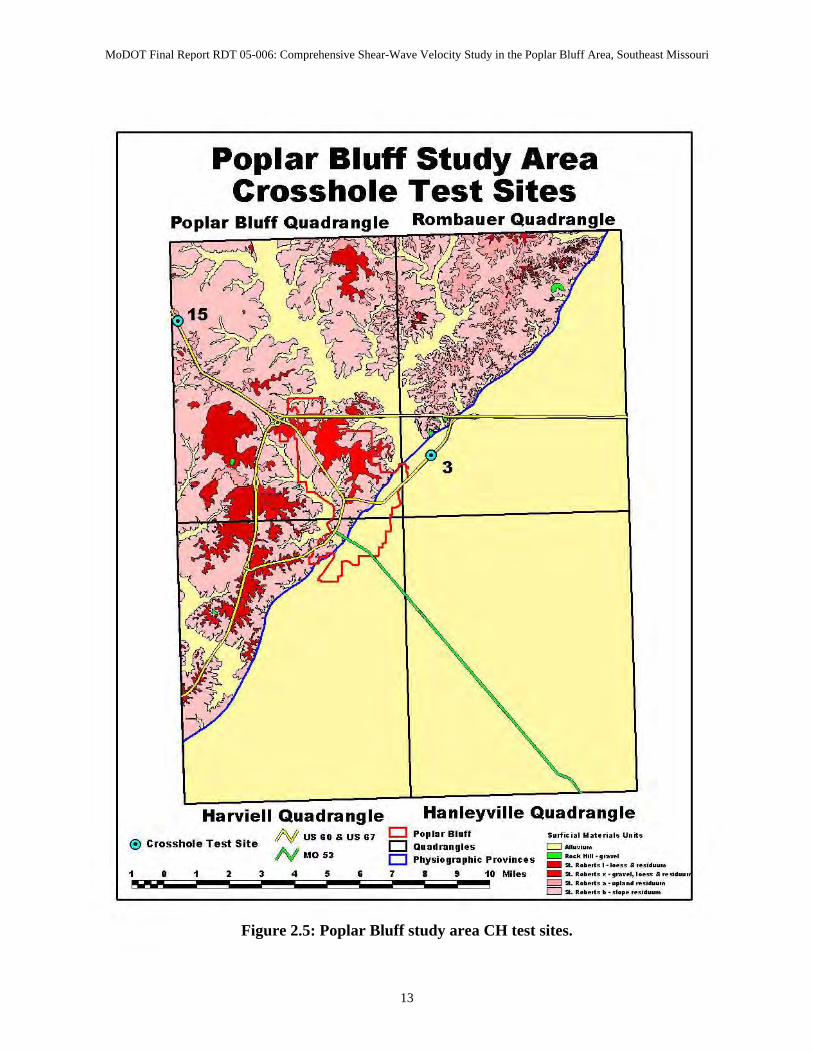
Figure 2.5: Poplar Bluff study area CH test sites.
13
Poplar Bluff Study Area Crosshole Test Sites
Poplar Bluff Qua
Harviell Quadrangle Hanleyville Quadrangle N us GO & us 67 D Poplar Bluff S.rfieiol Mote,i.l. u"~. o Crosshole Test Site D Quadrangles D AI'uvi ... N MO 53 D "ysiog~phic Provinces _ .... kH ......... '
_ ....... ... ,., . . .. ~ ... i.o.,"
1 0 1 2 3 4 5 G 7 8 9 10 Miles _ ... Ilo . . ... x ..... v. ,,' . ... ~ .. ,; ••• &-.- D st ...... .... _.,10." ... i""u," D st ...... ... ... ,., . ... i".u ..
MoDOT Final Report RDT 05-006: Comprehensive Shear-Wave Velocity Study in the Poplar Bluff Area, Southeast Missouri
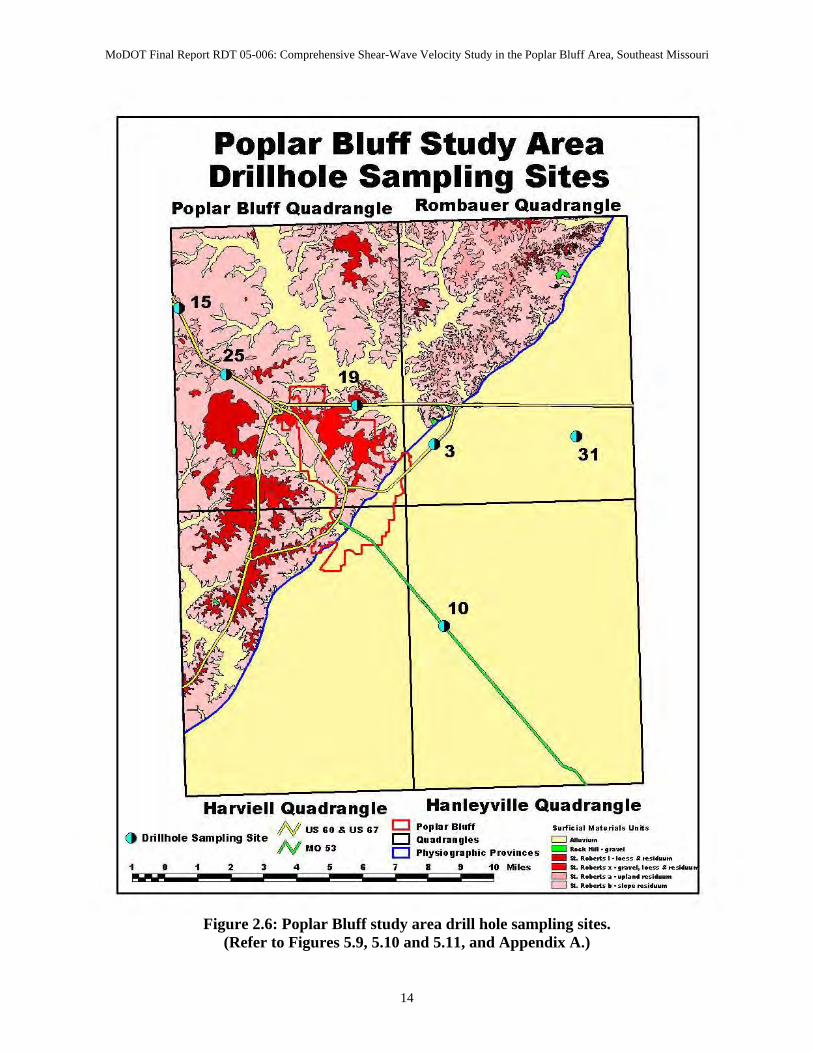
Figure 2.6: Poplar Bluff study area drill hole sampling sites.
(Refer to Figures 5.9, 5.10 and 5.11, and Appendix A.)
14
Poplar Bluff Study Area Drillhole Sampling Sites
Poplar Bluff Quadrangle
()
31
Harviell Quadrangle Hanleyville Quadrangle N us &0 & us 67 D Poplar Bluff S.rfieiol Mote,i.l. u"~.
() Drillhole Sampling Site D Quadrangles D AI'uvi ... N MO 53 D "ysiog~phic Provinces _ .... kH ......... ' _ ....... ... ,., . . .. ~ ... i.o.,"
1 0 1 2 3 4 5 G 7 8 9 10 Miles _ ... Ilo . . ... x ..... v. ,,' . ... ~ .. ,; ••• &-.- D st ...... .... _.,10." ... i""u," D st ...... ... ... ,., . ... i".u ..
MoDOT Final Report RDT 05-006: Comprehensive Shear-Wave Velocity Study in the Poplar Bluff Area, Southeast Missouri
3. TECHNICAL PROGRAM 3.1 Overview The technical program consisted of three phases: 1) drilling and sampling, 2) invasive and non-invasive field testing, and 3) laboratory dynamic soil testing. Each of these three phases can be subdivided into separate tasks as noted below.
DRILLING AND SAMPLING PROGRAM PHASE
• Task: Borehole Lithologic Samples • Task: Index Properties for Soils Tested and Soil Classification
INVASIVE AND NON-INVASIVE FIELD TESTS PHASE
• Task: Crosshole (CH) Shear-wave Velocity • Task: Multi-channel Analyses of Surface Waves (MASW) • Task: Seismic Cone Penetrometer (SCPT) and Cone Penetrometer (CPT)
LABORATORY DYNAMIC SOIL TESTING PHASE
• Task: Ultrasonic Pulse Velocity (UPV) • Task: Cyclic Triaxial (CT) • Task: Resonant Column (RC)
The drilling and sampling program (Section 4) provided the lithologic samples required for the laboratory testing phase. The index properties of the soils were obtained and the soils were classified so that laboratory test results could be related to soil lithology and other properties. The invasive and non-invasive field tests (Section 5) provided the shear-wave velocity data sets necessary to evaluate the CH, MASW and SCPT methods. CPT data were acquired at all SCPT test sites. This is consistent normal CPT/SCPT field acquisition procedures. The laboratory dynamic soil testing program (Section 6) provided the data necessary to evaluate the UPV laboratory test method. CT laboratory tests were also performed on the soil samples in order to further define soil properties. In the Section 7 of this report, the field and laboratory test methods for determining shear-wave velocity are compared. Emphasis is placed on accuracy, functionality, cost-effectiveness and overall utility.
15
MoDOT Final Report RDT 05-006: Comprehensive Shear-Wave Velocity Study in the Poplar Bluff Area, Southeast Missouri
4. DRILLING AND SAMPLING PROGRAM 4.1 Overview A total of ten boreholes were drilled in the Poplar Bluff study area (Figure 2.6). Four of the boreholes (two sets of twinned boreholes) were drilled for the purposes of conducting crosshole (CH) seismic tests (Section 5.2). The other six boreholes were drilled in order to procure soil samples for the laboratory tests (Section 6). The drilling and sampling activities were recorded and transcribed into formal borehole logs which include index soil property test data (Appendices B and C). 4.2 Drilling and Sampling: Field Procedures The drilling and sampling program was conducted by the MoDOT Soils and Geology drilling crew under the technical direction of Mr. D. Hoffman during the spring/summer of 2004. The boring locations were provided to the MoDOT drilling crew ahead of time including sketches for each testing site. The planned details were transmitted via the MoDOT drill request form. UMR personnel located and marked all subsurface exploration locations in the field with stakes and flagging prior to drill rig set-up. MoDOT conducted the utility clearance for the drill locations, which were located within the state highway right-of-way. Split spoon standard penetration test (SPT) soil sampling at 5-ft intervals were conducted starting at 0 ft or 2.5 ft depth. Below a depth of 100 ft samples should be taken on 10 foot intervals. Undisturbed tube samples (or Shelby tubes) were taken approximately every 10’ per the loggers (engineer) request. The bottom of the hole was typically sampled with a SPT sample. UMR engineer logged all the borings. If the pushed Shelby tube resulted in no-recovery, then the Dames & Moore (D&M) oversize spoon was used to collect a sample. Blow counts were not recorded for the D&M oversize spoon. An SPT was typically conducted and a split spoon sample retrieved immediately following the retrieval of a Shelby tube or oversize spoon sample if the hole left by the sampler stayed open. Rock coring was requested when rock was encountered within the planned borehole depths (100 ft or 150 ft, respectively). A summary of the drilling and sampling exploration plan is presented in Table 4.1. Shelby tubes were not extruded in the field. Shelby tubes were capped with plugs/plastic caps; sealed with electrical tape; and marked as to location/depth. UMR engineers transported and extruded tubes in the laboratory upon arrival from the field. UMR ensured that the tubes were stored and transported upright with minimal disturbance. UMR obtained field moisture samples from SPT samples, and retained the entire remainder of SPT samples in jars for further lab testing. Crosshole PVC pipes, suitable for CH data acquisition were installed. Permanent and flush to the ground access is to be constructed with a steel cover.
16
MoDOT Final Report RDT 05-006: Comprehensive Shear-Wave Velocity Study in the Poplar Bluff Area, Southeast Missouri
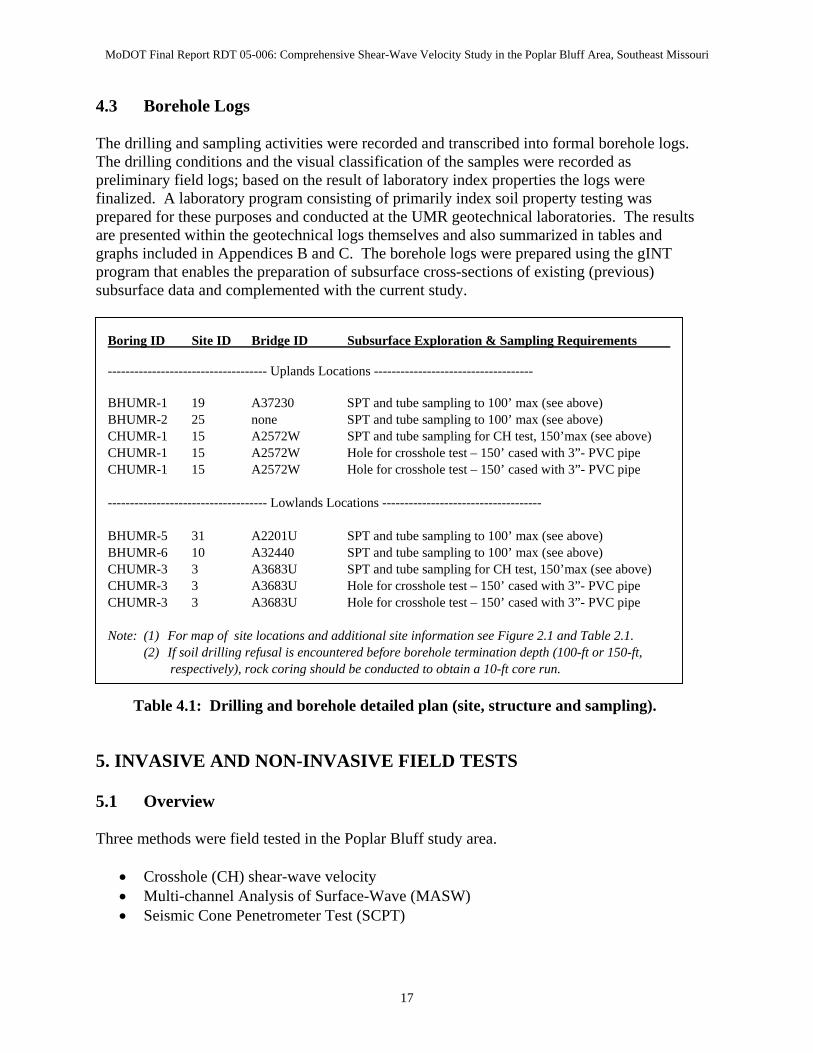
4.3 Borehole Logs The drilling and sampling activities were recorded and transcribed into formal borehole logs. The drilling conditions and the visual classification of the samples were recorded as preliminary field logs; based on the result of laboratory index properties the logs were finalized. A laboratory program consisting of primarily index soil property testing was prepared for these purposes and conducted at the UMR geotechnical laboratories. The results are presented within the geotechnical logs themselves and also summarized in tables and graphs included in Appendices B and C. The borehole logs were prepared using the gINT program that enables the preparation of subsurface cross-sections of existing (previous) subsurface data and complemented with the current study.
Boring ID Site ID Bridge ID Subsurface Exploration & Sampling Requirements ------------------------------------ Uplands Locations ------------------------------------ BHUMR-1 19 A37230 SPT and tube sampling to 100’ max (see above) BHUMR-2 25 none SPT and tube sampling to 100’ max (see above) CHUMR-1 15 A2572W SPT and tube sampling for CH test, 150’max (see above) CHUMR-1 15 A2572W Hole for crosshole test – 150’ cased with 3”- PVC pipe CHUMR-1 15 A2572W Hole for crosshole test – 150’ cased with 3”- PVC pipe ------------------------------------ Lowlands Locations ------------------------------------ BHUMR-5 31 A2201U SPT and tube sampling to 100’ max (see above) BHUMR-6 10 A32440 SPT and tube sampling to 100’ max (see above) CHUMR-3 3 A3683U SPT and tube sampling for CH test, 150’max (see above) CHUMR-3 3 A3683U Hole for crosshole test – 150’ cased with 3”- PVC pipe CHUMR-3 3 A3683U Hole for crosshole test – 150’ cased with 3”- PVC pipe Note: (1) For map of site locations and additional site information see Figure 2.1 and Table 2.1.
(2) If soil drilling refusal is encountered before borehole termination depth (100-ft or 150-ft, respectively), rock coring should be conducted to obtain a 10-ft core run.
Table 4.1: Drilling and borehole detailed plan (site, structure and sampling).
5. INVASIVE AND NON-INVASIVE FIELD TESTS 5.1 Overview Three methods were field tested in the Poplar Bluff study area.
• Crosshole (CH) shear-wave velocity • Multi-channel Analysis of Surface-Wave (MASW) • Seismic Cone Penetrometer Test (SCPT)
17
MoDOT Final Report RDT 05-006: Comprehensive Shear-Wave Velocity Study in the Poplar Bluff Area, Southeast Missouri
As noted in the Work Plan (Section 1.4), CH shear-wave velocity data were acquired at two test sites (Figure 2.5); borehole soil samples were acquired at 6 test sites (including the 2 CH test sites; Figure 2.6). 1-D MASW data were acquired at 40 test sites (Figure 2.3); 2-D MASW data were acquired at 4 test sites (Figure 2.3). SCPT data were acquired at 20 test sites (including the four 2-D MASW test sites and the four borehole sampling test sites; Figure 2.4). The field work plan was devised with the expectation that there would be sufficient data for the purposes of evaluation and comparative analyses. The CH, SCPT and MASW methods are discussed in Sections 5.2, 5.3 and 5.4, respectively. Tabularized summary evaluations of each method are presented in the appropriate Sections. A comparative analysis of all four methods is presented in Section 7. 5.2 Crosshole (CH) Method 5.2.1 Overview Crosshole (CH) shear-wave velocity data were acquired at two Sites in the Poplar Bluff study area (Sites 3 and 15: Figure 2.5). Good quality CH shear-wave velocity data, acquired in fairly uniform soil, is generally accepted as more reliable than either MASW or SCPT shear-wave velocity data. Consequently, the CH shear-wave velocity data were acquired with the expectation they could be used as a “yard stick” for determining the reasonableness of both the acquired MASW and SCPT shear-wave velocity data. CH shear-wave velocity data, particularly when acquired in fairly uniform soil, are generally more accurate than SCPT shear-wave velocity data for a number of reasons. First, the CH source signal is higher frequency than the SCPT source signal; hence the arrival time of the CH shear-wave pulse can be determined with greater precision. Second, SCPT field data are generally noisier than CH data; hence the arrival time of the shear-wave pulse on CH field data can be determined with greater accuracy. Third, CH velocities are measured using source/receiver separations of 15 ft (as per Poplar Bluff CH data set). SCPT velocities are determined using travel distances on the order of 1 m (3.3 ft). As a result, the calculation of CH velocities is less affected by small errors in the determination of the travel distances and/or travel times. Fourth, the direct compressional wave and direct shear wave are clearly visually separated on CH field data. This is not the case for SCPT field records acquired at shallow depths. CH shear-wave velocity data, particularly when acquired in fairly uniform soil, are considered to be more accurate than MASW shear-wave velocity data for several reasons. First, in the CH technique, shear-wave travel times and travel distances are measured directly and used to compute shear-wave velocities. The MASW technique, in contrast, measures surface wave travel times and travel distances. Output MASW shear-wave velocities are calculated indirectly and on the basis of estimated surface wave/shear-wave velocity ratios (Section 5.4). Second, MASW shear-wave velocities represent “average” velocities over lateral distances on the order of 100 ft (as opposed to 15 ft). Third, MASW shear-wave velocities represent “average” velocities over depth intervals that increase with increasing depth of burial (estimated 5-20 ft). In fairly uniform soil, CH velocity data is not subject to significant lateral and/or vertical averaging.
18
MoDOT Final Report RDT 05-006: Comprehensive Shear-Wave Velocity Study in the Poplar Bluff Area, Southeast Missouri
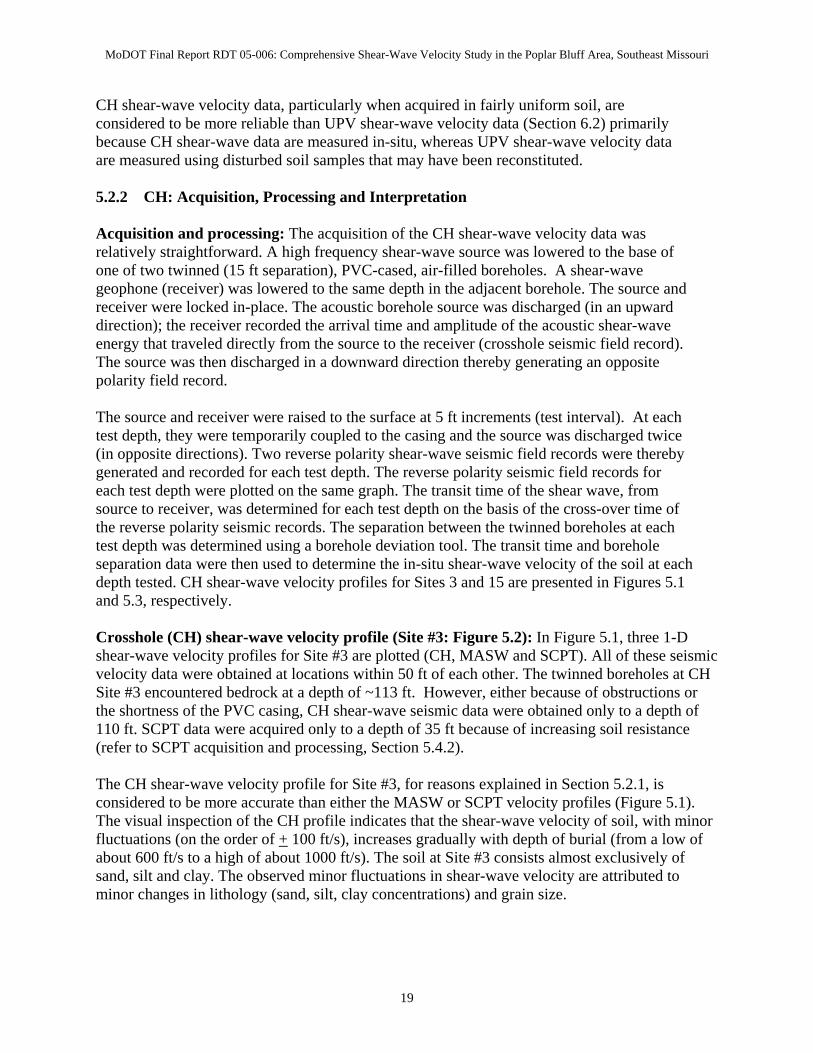
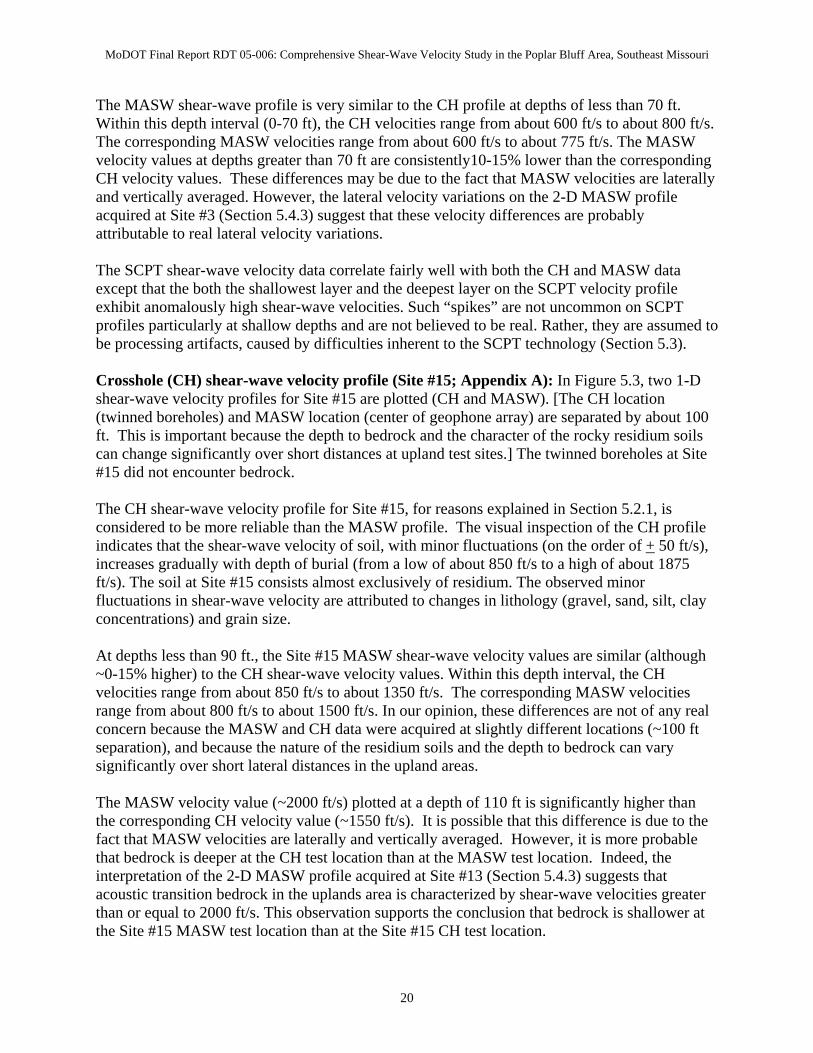
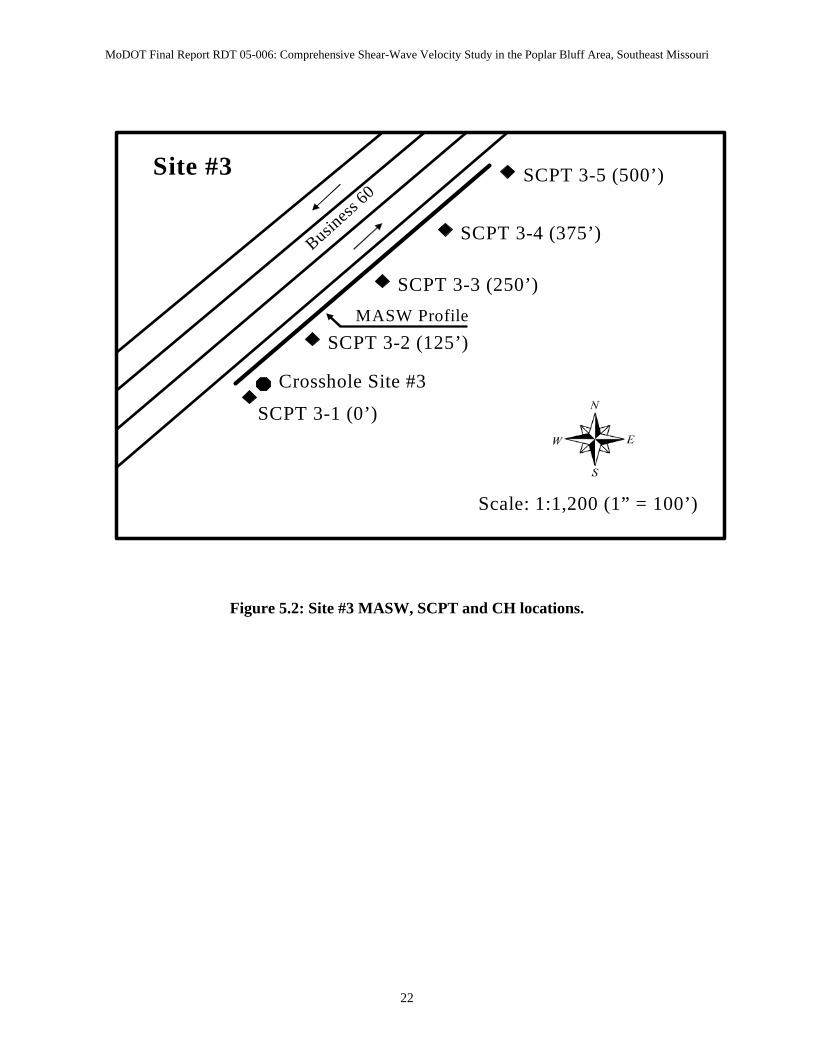
CH shear-wave velocity data, particularly when acquired in fairly uniform soil, are considered to be more reliable than UPV shear-wave velocity data (Section 6.2) primarily because CH shear-wave data are measured in-situ, whereas UPV shear-wave velocity data are measured using disturbed soil samples that may have been reconstituted. 5.2.2 CH: Acquisition, Processing and Interpretation Acquisition and processing: The acquisition of the CH shear-wave velocity data was relatively straightforward. A high frequency shear-wave source was lowered to the base of one of two twinned (15 ft separation), PVC-cased, air-filled boreholes. A shear-wave geophone (receiver) was lowered to the same depth in the adjacent borehole. The source and receiver were locked in-place. The acoustic borehole source was discharged (in an upward direction); the receiver recorded the arrival time and amplitude of the acoustic shear-wave energy that traveled directly from the source to the receiver (crosshole seismic field record). The source was then discharged in a downward direction thereby generating an opposite polarity field record. The source and receiver were raised to the surface at 5 ft increments (test interval). At each test depth, they were temporarily coupled to the casing and the source was discharged twice (in opposite directions). Two reverse polarity shear-wave seismic field records were thereby generated and recorded for each test depth. The reverse polarity seismic field records for each test depth were plotted on the same graph. The transit time of the shear wave, from source to receiver, was determined for each test depth on the basis of the cross-over time of the reverse polarity seismic records. The separation between the twinned boreholes at each test depth was determined using a borehole deviation tool. The transit time and borehole separation data were then used to determine the in-situ shear-wave velocity of the soil at each depth tested. CH shear-wave velocity profiles for Sites 3 and 15 are presented in Figures 5.1 and 5.3, respectively. Crosshole (CH) shear-wave velocity profile (Site #3: Figure 5.2): In Figure 5.1, three 1-D shear-wave velocity profiles for Site #3 are plotted (CH, MASW and SCPT). All of these seismic velocity data were obtained at locations within 50 ft of each other. The twinned boreholes at CH Site #3 encountered bedrock at a depth of ~113 ft. However, either because of obstructions or the shortness of the PVC casing, CH shear-wave seismic data were obtained only to a depth of 110 ft. SCPT data were acquired only to a depth of 35 ft because of increasing soil resistance (refer to SCPT acquisition and processing, Section 5.4.2). The CH shear-wave velocity profile for Site #3, for reasons explained in Section 5.2.1, is considered to be more accurate than either the MASW or SCPT velocity profiles (Figure 5.1). The visual inspection of the CH profile indicates that the shear-wave velocity of soil, with minor fluctuations (on the order of + 100 ft/s), increases gradually with depth of burial (from a low of about 600 ft/s to a high of about 1000 ft/s). The soil at Site #3 consists almost exclusively of sand, silt and clay. The observed minor fluctuations in shear-wave velocity are attributed to minor changes in lithology (sand, silt, clay concentrations) and grain size.
19
MoDOT Final Report RDT 05-006: Comprehensive Shear-Wave Velocity Study in the Poplar Bluff Area, Southeast Missouri
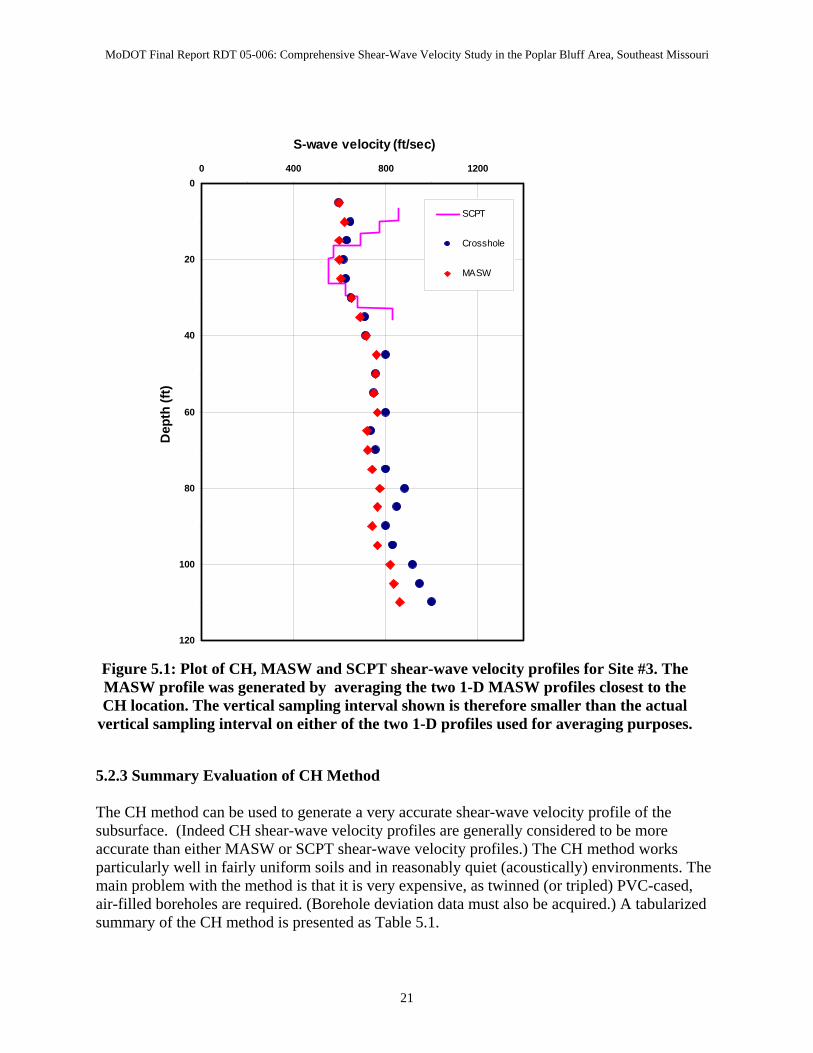
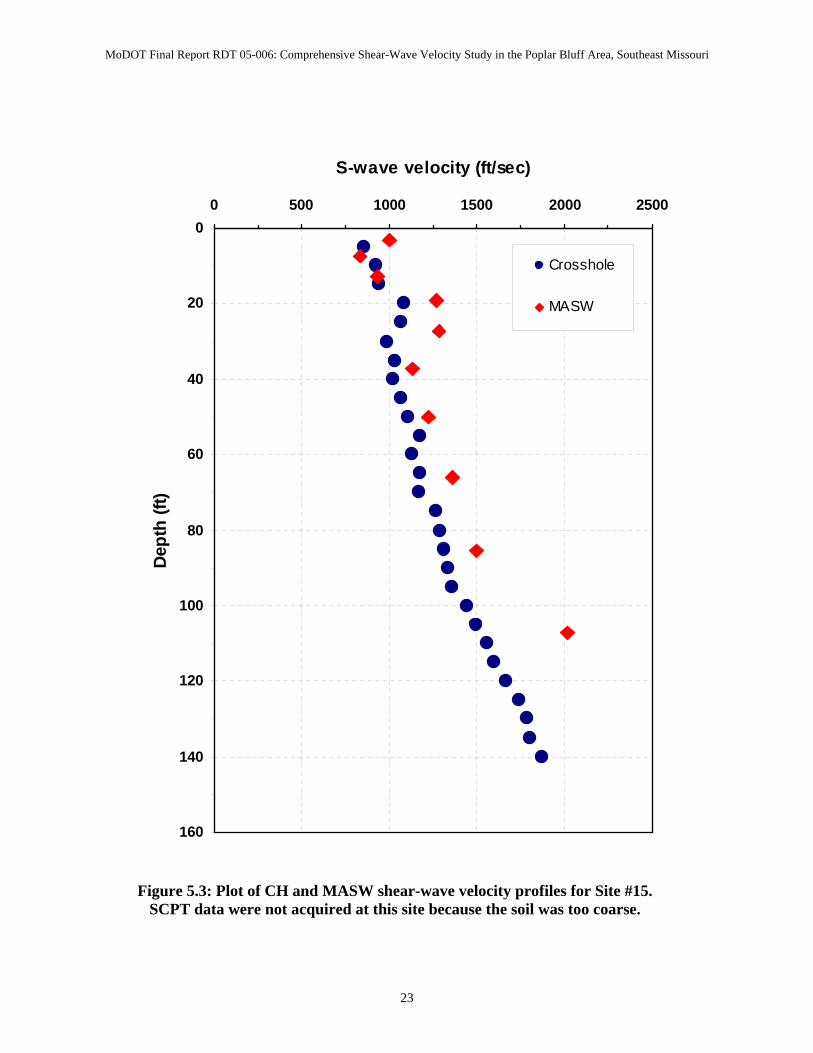
The MASW shear-wave profile is very similar to the CH profile at depths of less than 70 ft. Within this depth interval (0-70 ft), the CH velocities range from about 600 ft/s to about 800 ft/s. The corresponding MASW velocities range from about 600 ft/s to about 775 ft/s. The MASW velocity values at depths greater than 70 ft are consistently10-15% lower than the corresponding CH velocity values. These differences may be due to the fact that MASW velocities are laterally and vertically averaged. However, the lateral velocity variations on the 2-D MASW profile acquired at Site #3 (Section 5.4.3) suggest that these velocity differences are probably attributable to real lateral velocity variations. The SCPT shear-wave velocity data correlate fairly well with both the CH and MASW data except that the both the shallowest layer and the deepest layer on the SCPT velocity profile exhibit anomalously high shear-wave velocities. Such “spikes” are not uncommon on SCPT profiles particularly at shallow depths and are not believed to be real. Rather, they are assumed to be processing artifacts, caused by difficulties inherent to the SCPT technology (Section 5.3). Crosshole (CH) shear-wave velocity profile (Site #15; Appendix A): In Figure 5.3, two 1-D shear-wave velocity profiles for Site #15 are plotted (CH and MASW). [The CH location (twinned boreholes) and MASW location (center of geophone array) are separated by about 100 ft. This is important because the depth to bedrock and the character of the rocky residium soils can change significantly over short distances at upland test sites.] The twinned boreholes at Site #15 did not encounter bedrock. The CH shear-wave velocity profile for Site #15, for reasons explained in Section 5.2.1, is considered to be more reliable than the MASW profile. The visual inspection of the CH profile indicates that the shear-wave velocity of soil, with minor fluctuations (on the order of + 50 ft/s), increases gradually with depth of burial (from a low of about 850 ft/s to a high of about 1875 ft/s). The soil at Site #15 consists almost exclusively of residium. The observed minor fluctuations in shear-wave velocity are attributed to changes in lithology (gravel, sand, silt, clay concentrations) and grain size. At depths less than 90 ft., the Site #15 MASW shear-wave velocity values are similar (although ~0-15% higher) to the CH shear-wave velocity values. Within this depth interval, the CH velocities range from about 850 ft/s to about 1350 ft/s. The corresponding MASW velocities range from about 800 ft/s to about 1500 ft/s. In our opinion, these differences are not of any real concern because the MASW and CH data were acquired at slightly different locations (~100 ft separation), and because the nature of the residium soils and the depth to bedrock can vary significantly over short lateral distances in the upland areas. The MASW velocity value (~2000 ft/s) plotted at a depth of 110 ft is significantly higher than the corresponding CH velocity value (~1550 ft/s). It is possible that this difference is due to the fact that MASW velocities are laterally and vertically averaged. However, it is more probable that bedrock is deeper at the CH test location than at the MASW test location. Indeed, the interpretation of the 2-D MASW profile acquired at Site #13 (Section 5.4.3) suggests that acoustic transition bedrock in the uplands area is characterized by shear-wave velocities greater than or equal to 2000 ft/s. This observation supports the conclusion that bedrock is shallower at the Site #15 MASW test location than at the Site #15 CH test location.
20
MoDOT Final Report RDT 05-006: Comprehensive Shear-Wave Velocity Study in the Poplar Bluff Area, Southeast Missouri
0
20
40
60
80
100
120
0 400 800 1200
S-wave velocity (ft/sec)D
epth
(ft)
SCPT
Crosshole
MASW
Figure 5.1: Plot of CH, MASW and SCPT shear-wave velocity profiles for Site #3. The MASW profile was generated by averaging the two 1-D MASW profiles closest to the CH location. The vertical sampling interval shown is therefore smaller than the actual
vertical sampling interval on either of the two 1-D profiles used for averaging purposes. 5.2.3 Summary Evaluation of CH Method The CH method can be used to generate a very accurate shear-wave velocity profile of the subsurface. (Indeed CH shear-wave velocity profiles are generally considered to be more accurate than either MASW or SCPT shear-wave velocity profiles.) The CH method works particularly well in fairly uniform soils and in reasonably quiet (acoustically) environments. The main problem with the method is that it is very expensive, as twinned (or tripled) PVC-cased, air-filled boreholes are required. (Borehole deviation data must also be acquired.) A tabularized summary of the CH method is presented as Table 5.1.
21
MoDOT Final Report RDT 05-006: Comprehensive Shear-Wave Velocity Study in the Poplar Bluff Area, Southeast Missouri
Site #3
Business
60
SCPT 3-1 (0’)
SCPT 3-2 (125’)
SCPT 3-3 (250’)
SCPT 3-4 (375’)
SCPT 3-5 (500’)
Crosshole Site #3
Scale: 1:1,200 (1” = 100’)
MASW Profile
Figure 5.2: Site #3 MASW, SCPT and CH locations.
22
MoDOT Final Report RDT 05-006: Comprehensive Shear-Wave Velocity Study in the Poplar Bluff Area, Southeast Missouri
0
20
40
60
80
100
120
140
160
0 500 1000 1500 2000 2500
S-wave velocity (ft/sec)D
epth
(ft)
Crosshole
MASW
Figure 5.3: Plot of CH and MASW shear-wave velocity profiles for Site #15. SCPT data were not acquired at this site because the soil was too coarse.
23
MoDOT Final Report RDT 05-006: Comprehensive Shear-Wave Velocity Study in the Poplar Bluff Area, Southeast Missouri
ACQUISITION
Brief overview of field procedure
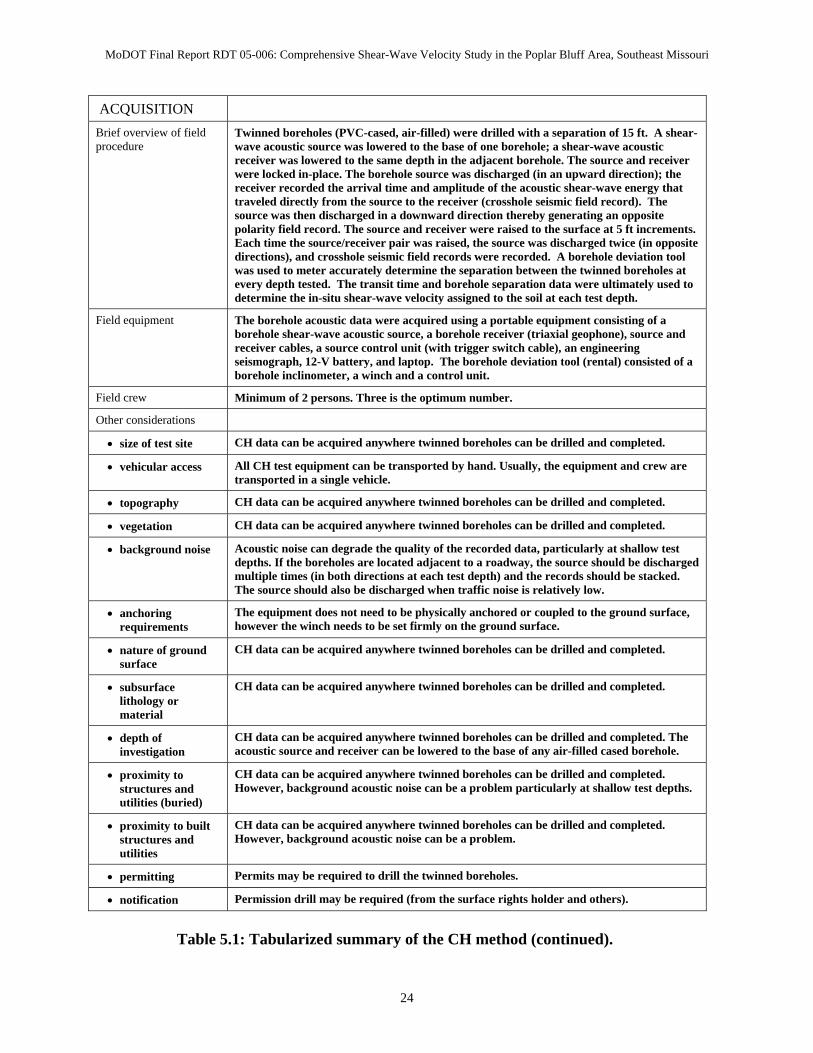
Twinned boreholes (PVC-cased, air-filled) were drilled with a separation of 15 ft. A shear-wave acoustic source was lowered to the base of one borehole; a shear-wave acoustic receiver was lowered to the same depth in the adjacent borehole. The source and receiver were locked in-place. The borehole source was discharged (in an upward direction); the receiver recorded the arrival time and amplitude of the acoustic shear-wave energy that traveled directly from the source to the receiver (crosshole seismic field record). The source was then discharged in a downward direction thereby generating an opposite polarity field record. The source and receiver were raised to the surface at 5 ft increments. Each time the source/receiver pair was raised, the source was discharged twice (in opposite directions), and crosshole seismic field records were recorded. A borehole deviation tool was used to meter accurately determine the separation between the twinned boreholes at every depth tested. The transit time and borehole separation data were ultimately used to determine the in-situ shear-wave velocity assigned to the soil at each test depth.
Field equipment The borehole acoustic data were acquired using a portable equipment consisting of a borehole shear-wave acoustic source, a borehole receiver (triaxial geophone), source and receiver cables, a source control unit (with trigger switch cable), an engineering seismograph, 12-V battery, and laptop. The borehole deviation tool (rental) consisted of a borehole inclinometer, a winch and a control unit.
Field crew Minimum of 2 persons. Three is the optimum number.
Other considerations
• size of test site CH data can be acquired anywhere twinned boreholes can be drilled and completed.
• vehicular access All CH test equipment can be transported by hand. Usually, the equipment and crew are transported in a single vehicle.
• topography CH data can be acquired anywhere twinned boreholes can be drilled and completed.
• vegetation CH data can be acquired anywhere twinned boreholes can be drilled and completed.
• background noise Acoustic noise can degrade the quality of the recorded data, particularly at shallow test depths. If the boreholes are located adjacent to a roadway, the source should be discharged multiple times (in both directions at each test depth) and the records should be stacked. The source should also be discharged when traffic noise is relatively low.
• anchoring requirements
The equipment does not need to be physically anchored or coupled to the ground surface, however the winch needs to be set firmly on the ground surface.
• nature of ground surface
CH data can be acquired anywhere twinned boreholes can be drilled and completed.
• subsurface lithology or material
CH data can be acquired anywhere twinned boreholes can be drilled and completed.
• depth of investigation
CH data can be acquired anywhere twinned boreholes can be drilled and completed. The acoustic source and receiver can be lowered to the base of any air-filled cased borehole.
• proximity to structures and utilities (buried)
CH data can be acquired anywhere twinned boreholes can be drilled and completed. However, background acoustic noise can be a problem particularly at shallow test depths.
• proximity to built structures and utilities
CH data can be acquired anywhere twinned boreholes can be drilled and completed. However, background acoustic noise can be a problem.
• permitting Permits may be required to drill the twinned boreholes.
• notification Permission drill may be required (from the surface rights holder and others).
Table 5.1: Tabularized summary of the CH method (continued).
24
MoDOT Final Report RDT 05-006: Comprehensive Shear-Wave Velocity Study in the Poplar Bluff Area, Southeast Missouri
Brief description of field data
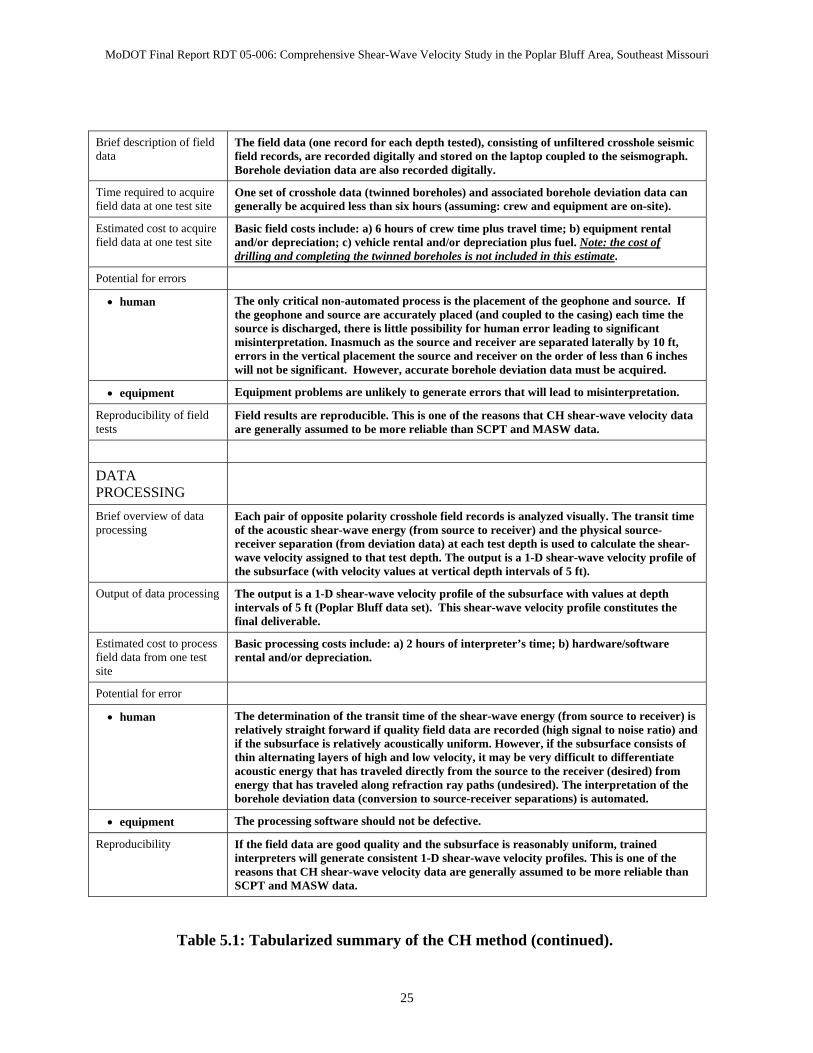
The field data (one record for each depth tested), consisting of unfiltered crosshole seismic field records, are recorded digitally and stored on the laptop coupled to the seismograph. Borehole deviation data are also recorded digitally.
Time required to acquire field data at one test site
One set of crosshole data (twinned boreholes) and associated borehole deviation data can generally be acquired less than six hours (assuming: crew and equipment are on-site).
Estimated cost to acquire field data at one test site
Basic field costs include: a) 6 hours of crew time plus travel time; b) equipment rental and/or depreciation; c) vehicle rental and/or depreciation plus fuel. Note: the cost of drilling and completing the twinned boreholes is not included in this estimate.
Potential for errors
• human The only critical non-automated process is the placement of the geophone and source. If the geophone and source are accurately placed (and coupled to the casing) each time the source is discharged, there is little possibility for human error leading to significant misinterpretation. Inasmuch as the source and receiver are separated laterally by 10 ft, errors in the vertical placement the source and receiver on the order of less than 6 inches will not be significant. However, accurate borehole deviation data must be acquired.
• equipment Equipment problems are unlikely to generate errors that will lead to misinterpretation.
Reproducibility of field tests
Field results are reproducible. This is one of the reasons that CH shear-wave velocity data are generally assumed to be more reliable than SCPT and MASW data.
DATA PROCESSING
Brief overview of data processing
Each pair of opposite polarity crosshole field records is analyzed visually. The transit time of the acoustic shear-wave energy (from source to receiver) and the physical source-receiver separation (from deviation data) at each test depth is used to calculate the shear-wave velocity assigned to that test depth. The output is a 1-D shear-wave velocity profile of the subsurface (with velocity values at vertical depth intervals of 5 ft).
Output of data processing The output is a 1-D shear-wave velocity profile of the subsurface with values at depth intervals of 5 ft (Poplar Bluff data set). This shear-wave velocity profile constitutes the final deliverable.
Estimated cost to process field data from one test site
Basic processing costs include: a) 2 hours of interpreter’s time; b) hardware/software rental and/or depreciation.
Potential for error
• human The determination of the transit time of the shear-wave energy (from source to receiver) is relatively straight forward if quality field data are recorded (high signal to noise ratio) and if the subsurface is relatively acoustically uniform. However, if the subsurface consists of thin alternating layers of high and low velocity, it may be very difficult to differentiate acoustic energy that has traveled directly from the source to the receiver (desired) from energy that has traveled along refraction ray paths (undesired). The interpretation of the borehole deviation data (conversion to source-receiver separations) is automated.
• equipment The processing software should not be defective.
Reproducibility If the field data are good quality and the subsurface is reasonably uniform, trained interpreters will generate consistent 1-D shear-wave velocity profiles. This is one of the reasons that CH shear-wave velocity data are generally assumed to be more reliable than SCPT and MASW data.
Table 5.1: Tabularized summary of the CH method (continued).
25
MoDOT Final Report RDT 05-006: Comprehensive Shear-Wave Velocity Study in the Poplar Bluff Area, Southeast Missouri
INTERPRETATION
Brief overview of interpretation of processed data
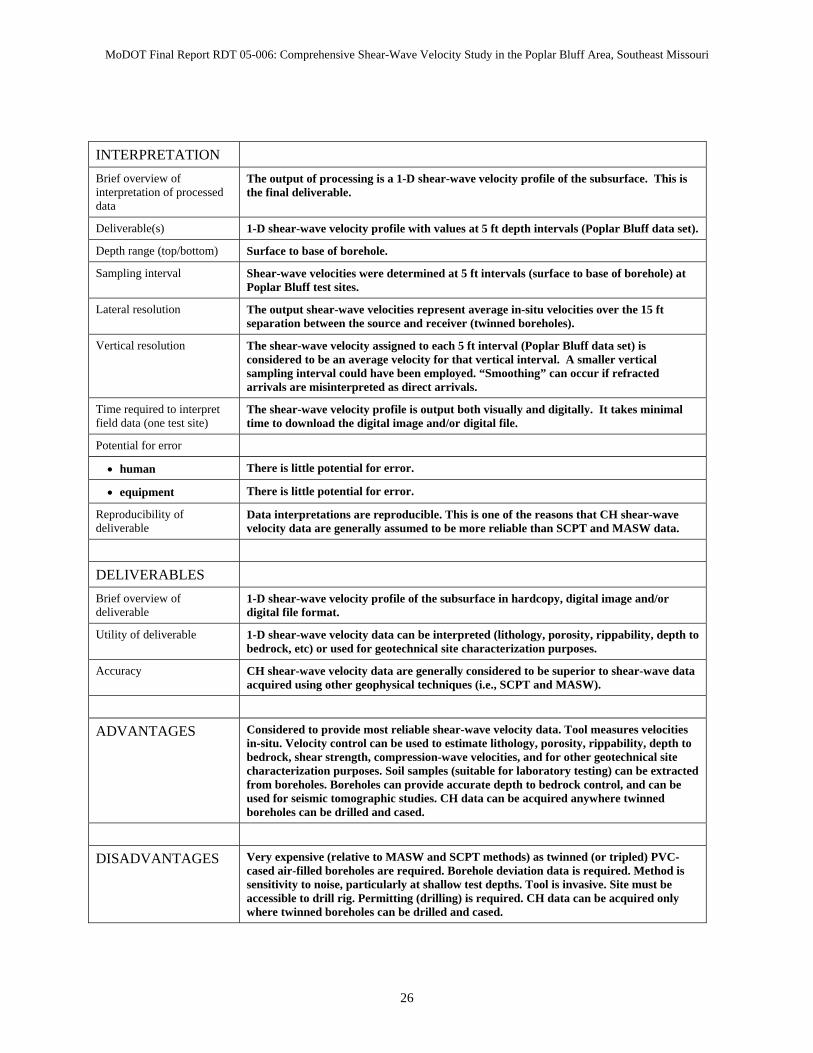
The output of processing is a 1-D shear-wave velocity profile of the subsurface. This is the final deliverable.
Deliverable(s) 1-D shear-wave velocity profile with values at 5 ft depth intervals (Poplar Bluff data set).
Depth range (top/bottom) Surface to base of borehole.
Sampling interval Shear-wave velocities were determined at 5 ft intervals (surface to base of borehole) at Poplar Bluff test sites.
Lateral resolution The output shear-wave velocities represent average in-situ velocities over the 15 ft separation between the source and receiver (twinned boreholes).
Vertical resolution The shear-wave velocity assigned to each 5 ft interval (Poplar Bluff data set) is considered to be an average velocity for that vertical interval. A smaller vertical sampling interval could have been employed. “Smoothing” can occur if refracted arrivals are misinterpreted as direct arrivals.
Time required to interpret field data (one test site)
The shear-wave velocity profile is output both visually and digitally. It takes minimal time to download the digital image and/or digital file.
Potential for error
• human There is little potential for error.
• equipment There is little potential for error.
Reproducibility of deliverable
Data interpretations are reproducible. This is one of the reasons that CH shear-wave velocity data are generally assumed to be more reliable than SCPT and MASW data.
DELIVERABLES
Brief overview of deliverable
1-D shear-wave velocity profile of the subsurface in hardcopy, digital image and/or digital file format.
Utility of deliverable 1-D shear-wave velocity data can be interpreted (lithology, porosity, rippability, depth to bedrock, etc) or used for geotechnical site characterization purposes.
Accuracy CH shear-wave velocity data are generally considered to be superior to shear-wave data acquired using other geophysical techniques (i.e., SCPT and MASW).
ADVANTAGES Considered to provide most reliable shear-wave velocity data. Tool measures velocities in-situ. Velocity control can be used to estimate lithology, porosity, rippability, depth to bedrock, shear strength, compression-wave velocities, and for other geotechnical site characterization purposes. Soil samples (suitable for laboratory testing) can be extracted from boreholes. Boreholes can provide accurate depth to bedrock control, and can be used for seismic tomographic studies. CH data can be acquired anywhere twinned boreholes can be drilled and cased.
DISADVANTAGES Very expensive (relative to MASW and SCPT methods) as twinned (or tripled) PVC-cased air-filled boreholes are required. Borehole deviation data is required. Method is sensitivity to noise, particularly at shallow test depths. Tool is invasive. Site must be accessible to drill rig. Permitting (drilling) is required. CH data can be acquired only where twinned boreholes can be drilled and cased.
26

MoDOT Final Report RDT 05-006: Comprehensive Shear-Wave Velocity Study in the Poplar Bluff Area, Southeast Missouri
Table 5.1: Tabularized summary of the CH method.
27
MoDOT Final Report RDT 05-006: Comprehensive Shear-Wave Velocity Study in the Poplar Bluff Area, Southeast Missouri
5.3 Seismic Cone Penetrometer (SCPT) Method 5.3.1 Overview Seismic cone penetrometer (SCPT) shear-wave velocity profiles were acquired by MoDOT at fifteen sites in the Poplar Bluff study area, including the four sites where 2-D MASW data were acquired (Figure 2.4). At each of these later four sites, a suite of five SCPT profiles was acquired at 125 ft intervals along the 2-D MASW traverse. All of the SCPT data were processed by MoDOT. UMR researchers were provided with hard copies and digital copies of all output SCPT shear-wave velocity profiles. The SCPT data were acquired with two objectives. The primary objective was to determine if the SCPT shear-wave velocities were reliable. The secondary objective was to estimate, on the basis of the four suites of SCPT profiles, the lateral variability of soil shear-wave velocities. Theoretically, SCPT shear-wave velocity profiles should be more accurate than either CH or MASW shear-wave velocities. This is because the SCPT velocities are measured over shorter source/receiver separations (typically 1 m) and hence are subject to less “averaging”, and because the SCPT tool measures interval velocities over vertical travel paths. The CH tool in contrast, measures interval velocities along horizontal travel paths, and uses these velocities to generate a vertical shear-wave velocity profile. In practice however, SCPT shear-wave velocities are generally considered to be less reliable than CH shear-wave seismic velocities. There are several reasons. First, the CH source signal is higher frequency than the SCPT source signal, hence the arrival time of the CH shear-wave pulse can be determined with greater precision. Second, SCPT field data are generally noisier than CH data, hence the arrival time of the shear-wave pulse on CH field data can be determined with greater accuracy. Third, CH velocities are measured using source/receiver separations on the order of 15 ft. SCPT velocities are determined using travel distances on the order of 3 ft. As a result, the calculation of CH velocities is less affected by small errors in the determination of the travel distances and/or travel times. Fourth, the direct compressional wave and direct shear wave are clearly visually separated on CH field data. This is not the case for SCPT field records acquired at shallow depths. Good quality CH shear-wave velocity data, acquired in fairly uniform soil, is generally accepted as more reliable than SCPT shear-wave velocity data. Consequently, the CH shear-wave velocity data were used as one “yard stick” for determining the reasonableness of the acquired SCPT shear-wave velocity data. Standard cone penetrometer data was also acquired at all SCPT test sites. These data are presented on standard CPT logs showing the following channels: tip resistance, sleeve friction, friction ratio, pore water pressure, and shear-wave velocity. The CPT logs are presented entirely in Appendix D of this report.
28
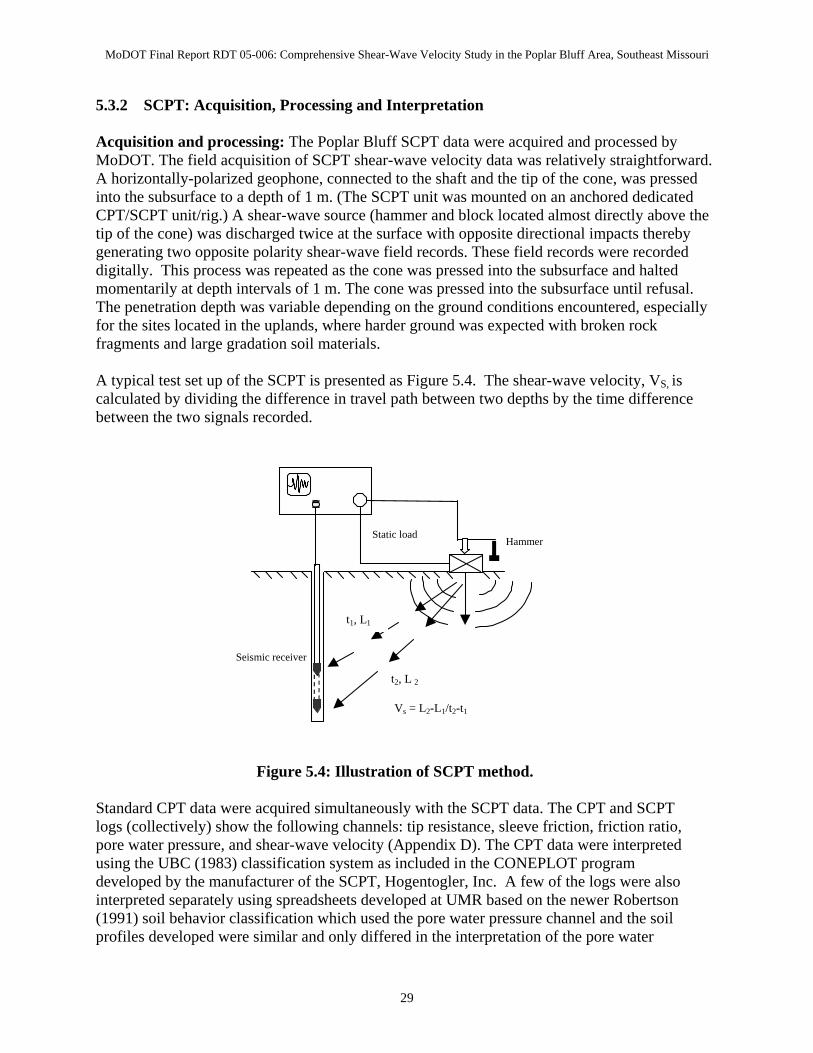
MoDOT Final Report RDT 05-006: Comprehensive Shear-Wave Velocity Study in the Poplar Bluff Area, Southeast Missouri
5.3.2 SCPT: Acquisition, Processing and Interpretation Acquisition and processing: The Poplar Bluff SCPT data were acquired and processed by MoDOT. The field acquisition of SCPT shear-wave velocity data was relatively straightforward. A horizontally-polarized geophone, connected to the shaft and the tip of the cone, was pressed into the subsurface to a depth of 1 m. (The SCPT unit was mounted on an anchored dedicated CPT/SCPT unit/rig.) A shear-wave source (hammer and block located almost directly above the tip of the cone) was discharged twice at the surface with opposite directional impacts thereby generating two opposite polarity shear-wave field records. These field records were recorded digitally. This process was repeated as the cone was pressed into the subsurface and halted momentarily at depth intervals of 1 m. The cone was pressed into the subsurface until refusal. The penetration depth was variable depending on the ground conditions encountered, especially for the sites located in the uplands, where harder ground was expected with broken rock fragments and large gradation soil materials. A typical test set up of the SCPT is presented as Figure 5.4. The shear-wave velocity, VS, is calculated by dividing the difference in travel path between two depths by the time difference between the two signals recorded.
Hammer
eceive
Seismic r r
1, L1
t2, L 2
Static load
Vs = L2-L1/t2-t1
t
Figure 5.4: Illustration of SCPT method. Standard CPT data were acquired simultaneously with the SCPT data. The CPT and SCPT logs (collectively) show the following channels: tip resistance, sleeve friction, friction ratio, pore water pressure, and shear-wave velocity (Appendix D). The CPT data were interpreted using the UBC (1983) classification system as included in the CONEPLOT program developed by the manufacturer of the SCPT, Hogentogler, Inc. A few of the logs were also interpreted separately using spreadsheets developed at UMR based on the newer Robertson (1991) soil behavior classification which used the pore water pressure channel and the soil profiles developed were similar and only differed in the interpretation of the pore water
29
MoDOT Final Report RDT 05-006: Comprehensive Shear-Wave Velocity Study in the Poplar Bluff Area, Southeast Missouri
pressure parameters, Bq. For this research project, which focused on the Vs measurements, the differences in soil profile classification were not significant. Interpretation: SCPT shear-wave velocity profiles were acquired by MoDOT at fifteen sites in the Poplar Bluff study area, including the four sites where 2-D MASW data were acquired (Figure 2.4). At each of these later four sites, a suite of five SCPT profiles was acquired at 125 ft intervals along the 2-D MASW traverse. The SCPT data were acquired with two objectives. The primary objective was to determine if the SCPT shear-wave velocities were reliable. The secondary objective was to estimate, on the basis of the four suites of SCPT profiles, the lateral variability of soil shear-wave velocities. All of the acquired SCPT data were processed by MoDOT. The UMR researchers were provided with all of the output SCPT shear-wave velocity profiles. For evaluation purposes, SCPT profiles from Sites #3, #10, #13 and #31 are presented and discussed in this Section. SCPT data from these four test sites are included in this Section because multiple SCPT profiles were acquired at these sites only. These SCPT data are presented as representative of the entire acquired SCPT data set. (SCPT data sets from the other test sites are presented in Appendix D.) SCPT shear-wave velocity profile (CH location, Site #3): In Figure 5.1, three 1-D shear-wave velocity profiles for Site #3 are plotted (SCPT, CH and MASW). (All of these seismic velocity data were obtained at locations within 50 ft of each other.) The twinned boreholes at Site #3 encountered bedrock at a depth of ~113 ft. However, because of soil resistance, SCPT data were acquired only to a depth of ~35 ft. The CH shear-wave velocity profile for Site #3, for reasons explained in Section 5.2.1, is considered to be more accurate than either the MASW or SCPT velocity profiles. The visual inspection of the CH profile indicates that the shear-wave velocity of soil, with minor fluctuations (on the order of + 100 ft/s), increases gradually with depth of burial (from a low of about 600 ft/s to a high of about 1000 ft/s). The soil at Site #3 consists almost exclusively of sand, silt and clay. The observed minor fluctuations in shear-wave velocity are attributed to minor changes in lithology (sand, silt, clay concentrations) and grain size. The MASW shear-wave profile is very similar to the CH profile at depths less than 70 ft. Within this depth interval (0-70 ft), the CH velocities range from about 600 ft/s to about 800 ft/s. The corresponding MASW velocities range from about 600 ft/s to about 775 ft/s. The MASW velocity values at depths greater than 70 ft are consistently10-15% lower than the corresponding CH velocity values. These differences may be due to the fact that MASW velocities are laterally and vertically averaged. However, the lateral velocity variations on the 2-D MASW profile acquired at Site #3 (Figure 5.5) suggest that these subtle velocity variations are probably real. The SCPT shear-wave velocity data correlate reasonably well with both the CH and MASW data except that the both the shallowest layer and the deepest layer on the SCPT velocity profile exhibit anomalously high shear-wave velocities. Such “spikes” are not uncommon on SCPT
30
MoDOT Final Report RDT 05-006: Comprehensive Shear-Wave Velocity Study in the Poplar Bluff Area, Southeast Missouri
profiles particularly at shallow depths and are not believed to be real. Rather, they are assumed to be processing artifacts, caused by difficulties inherent to the technology (Section 5.2.1). Suite of SCPT shear-wave velocity profiles (Site #3): In Figure 5.5, the suite of five SCPT shear-wave velocity profiles (and corresponding 1-D MASW profiles) from Site #3 are presented (Figure 5.2). A visual examination of both the SCPT and MASW data indicates that the two suites of shear-wave velocity profiles are similar. Indeed, the MASW profiles could be described as “smoothed” versions of the corresponding SCPT profiles. Alternatively, the SCPT data could be described as slightly “scattered” versions of the corresponding MASW data. Suffice to say that for geotechnical engineering design purposes, both sets of profiles would yield essentially the same results, excepting that the MASW data would provide velocity control to depths slightly in excess of 100 ft. While we cannot determine with complete confidence which data set is more reliable, we believe that the MASW shear-wave velocity curves are more reasonable for several reasons. First, the Site #3 CH data match the Site #3 MASW data better than the Site #3 SCPT data (Section 5.2). Second, the shallowest layer on each SCPT profile has been assigned an anomalously high velocity (albeit slightly) irrespective of its depth. We believe this is an artifact of processing rather than an indication of near surface conditions. (This conclusion is supported by the tip resistance curves on the corresponding SCPT data presented in Appendix D. Analyses of these SCPT logs shows that the layers that are assigned anomalously high shear-wave velocities are not characterized by unusually high tip resistance.) Third, the high velocity spike that is present on SCPT profile #5 at a depth of ~35 ft is not present on any of the other SCPT profiles(or on either the CH and/or MASW profiles). Inasmuch as the soil is fairly uniform at Site #3, we conclude that the isolated high velocity spike on SCPT profile #5 is an artifact of processing rather than indicative of variable subsurface conditions. (We note that high and low velocity “spikes” are not uncommon on SCPT profiles particularly at shallow depths. Generally, such “spikes” are not “real”. Rather, they are assumed to be processing artifacts, caused by difficulties inherent to the technology (Section 5.3.1). Suite of SCPT shear-wave velocity profiles (Site #10): In Figure 5.6, the suite of five SCPT shear-wave velocity profiles (and corresponding 1-D MASW profiles) from Site #10 are presented (Figure 5.9). A visual examination of both the SCPT and MASW data indicates that the two suites of shear-wave velocity profiles are similar. Indeed, the SCPT profiles could be described as slightly “scattered” versions of the corresponding MASW profiles. While we cannot determine with complete confidence which data set is more reliable, we believe that the MASW shear-wave velocity curves are more reasonable for several reasons. First, the shallowest (or next to shallowest) layer on three of the five SCPT profiles (#1, #2 and #4) has been assigned an anomalously high velocity irrespective of its depth. Inasmuch as the soil is fairly uniform at Site #10 and inasmuch as this high velocity layer is not present on SCPT profiles #3 and #5, we conclude these “spikes” are artifacts of processing rather than an indication of near surface conditions. (This conclusion is supported by the tip resistance curves on the corresponding SCPT data presented in Appendix D. Analyses of these SCPT logs shows that the layers that are assigned anomalously high shear-wave velocities are not characterized by unusually high tip resistance.) Second, the high velocity spikes that are present on SCPT profiles
31
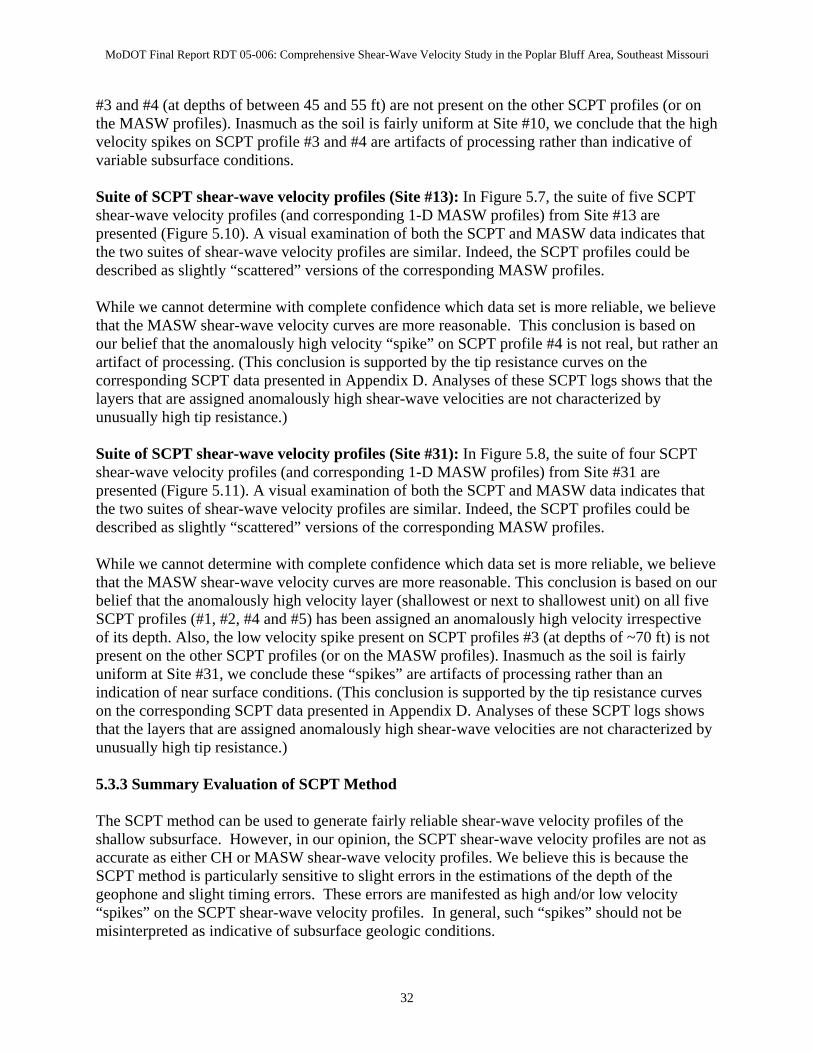
MoDOT Final Report RDT 05-006: Comprehensive Shear-Wave Velocity Study in the Poplar Bluff Area, Southeast Missouri
#3 and #4 (at depths of between 45 and 55 ft) are not present on the other SCPT profiles (or on the MASW profiles). Inasmuch as the soil is fairly uniform at Site #10, we conclude that the high velocity spikes on SCPT profile #3 and #4 are artifacts of processing rather than indicative of variable subsurface conditions. Suite of SCPT shear-wave velocity profiles (Site #13): In Figure 5.7, the suite of five SCPT shear-wave velocity profiles (and corresponding 1-D MASW profiles) from Site #13 are presented (Figure 5.10). A visual examination of both the SCPT and MASW data indicates that the two suites of shear-wave velocity profiles are similar. Indeed, the SCPT profiles could be described as slightly “scattered” versions of the corresponding MASW profiles. While we cannot determine with complete confidence which data set is more reliable, we believe that the MASW shear-wave velocity curves are more reasonable. This conclusion is based on our belief that the anomalously high velocity “spike” on SCPT profile #4 is not real, but rather an artifact of processing. (This conclusion is supported by the tip resistance curves on the corresponding SCPT data presented in Appendix D. Analyses of these SCPT logs shows that the layers that are assigned anomalously high shear-wave velocities are not characterized by unusually high tip resistance.) Suite of SCPT shear-wave velocity profiles (Site #31): In Figure 5.8, the suite of four SCPT shear-wave velocity profiles (and corresponding 1-D MASW profiles) from Site #31 are presented (Figure 5.11). A visual examination of both the SCPT and MASW data indicates that the two suites of shear-wave velocity profiles are similar. Indeed, the SCPT profiles could be described as slightly “scattered” versions of the corresponding MASW profiles. While we cannot determine with complete confidence which data set is more reliable, we believe that the MASW shear-wave velocity curves are more reasonable. This conclusion is based on our belief that the anomalously high velocity layer (shallowest or next to shallowest unit) on all five SCPT profiles (#1, #2, #4 and #5) has been assigned an anomalously high velocity irrespective of its depth. Also, the low velocity spike present on SCPT profiles #3 (at depths of ~70 ft) is not present on the other SCPT profiles (or on the MASW profiles). Inasmuch as the soil is fairly uniform at Site #31, we conclude these “spikes” are artifacts of processing rather than an indication of near surface conditions. (This conclusion is supported by the tip resistance curves on the corresponding SCPT data presented in Appendix D. Analyses of these SCPT logs shows that the layers that are assigned anomalously high shear-wave velocities are not characterized by unusually high tip resistance.) 5.3.3 Summary Evaluation of SCPT Method The SCPT method can be used to generate fairly reliable shear-wave velocity profiles of the shallow subsurface. However, in our opinion, the SCPT shear-wave velocity profiles are not as accurate as either CH or MASW shear-wave velocity profiles. We believe this is because the SCPT method is particularly sensitive to slight errors in the estimations of the depth of the geophone and slight timing errors. These errors are manifested as high and/or low velocity “spikes” on the SCPT shear-wave velocity profiles. In general, such “spikes” should not be misinterpreted as indicative of subsurface geologic conditions.
32

MoDOT Final Report RDT 05-006: Comprehensive Shear-Wave Velocity Study in the Poplar Bluff Area, Southeast Missouri
On the upside, the SCPT shear-wave velocity profiles (“spikes” excepted) are very similar to both the CH and MASW shear-wave velocity profiles. For geotechnical engineering purposes, the SCPT profiles would yield essentially the same result as the CH or MASW profiles, excepting for the depth limitations associated with the SCPT method. The biggest advantage of the SCPT in comparison with other methods is the fact that the simultaneously acquired CPT data provide information about static soil properties such as point bearing (qc), sleeve frictional resistance (fs) and stratigraphy, as well as ground proofing the site. The strain induced immediately around the probe during penetration is a very large strain and thus, both large and small strain parameters can be obtained. A tabularized summary of the SCPT method is presented as Table 5.2.
33
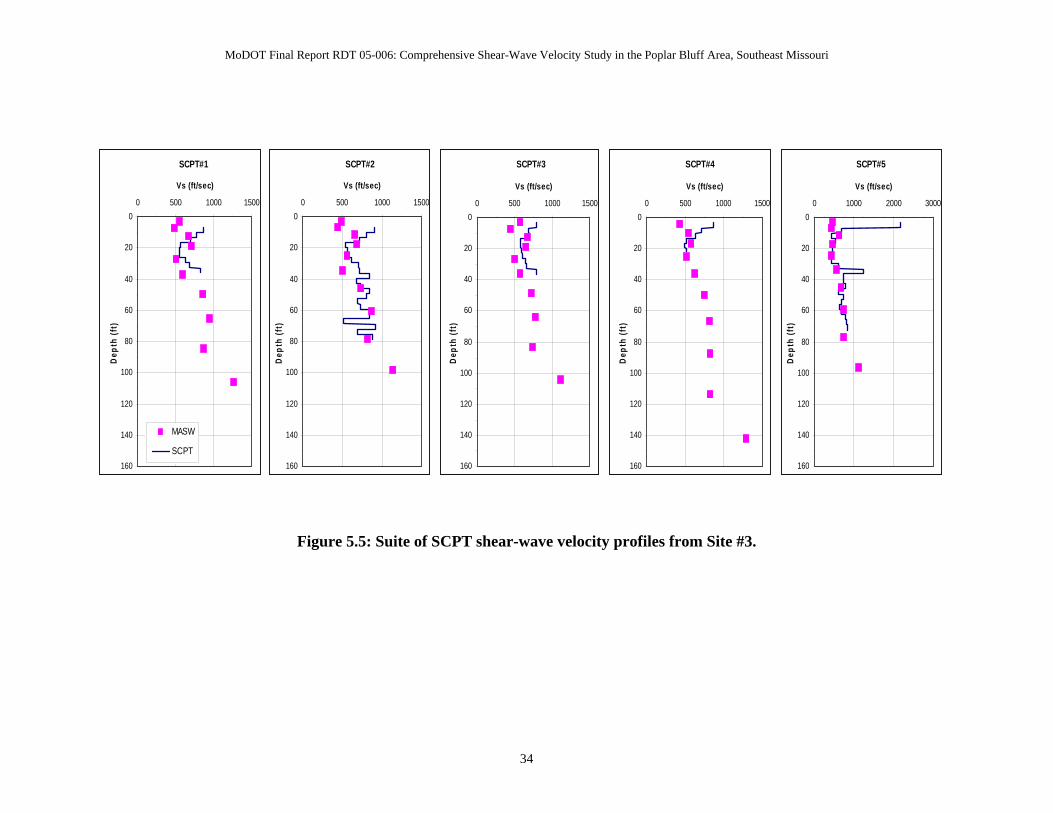
MoDOT Final Report RDT 05-006: Comprehensive Shear-Wave Velocity Study in the Poplar Bluff Area, Southeast Missouri
Figure 5.5: Suite of SCPT shear-wave velocity profiles from Site #3.
SCPT#1
0
20
40
60
80
100
120
140
160
0 500 1000 1500
Vs (ft/sec)
Dep
th (f
t)
MASW
SCPT
SCPT#2
0
20
40
60
80
100
120
140
160
0 500 1000 1500
Vs (ft/sec)
Dep
th (f
t)
SCPT#3
0
20
40
60
80
100
120
140
160
0 500 1000 1500
Vs (ft/sec)
Dep
th (f
t)
SCPT#4
0
20
40
60
80
100
120
140
160
0 500 1000 1500
Vs (ft/sec)
Dep
th (f
t)
SCPT#5
0
20
40
60
80
100
120
140
160
0 1000 2000 3000
Vs (ft/sec)
Dep
th (f
t)
34
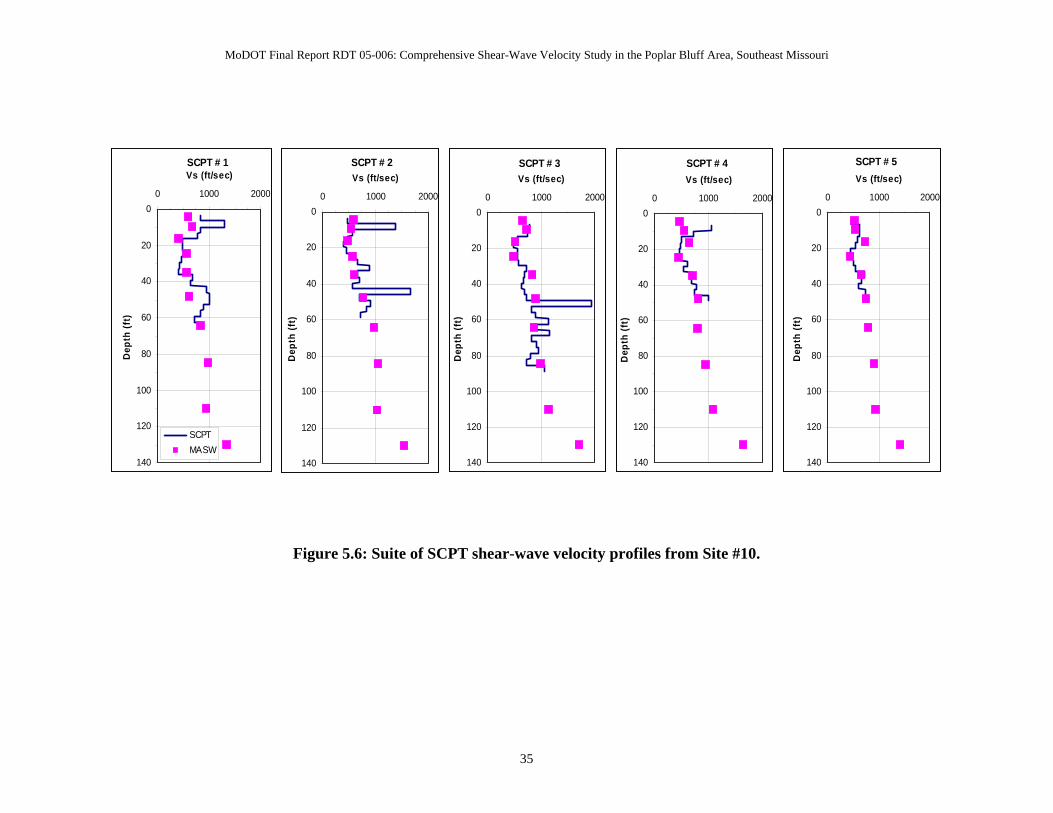
MoDOT Final Report RDT 05-006: Comprehensive Shear-Wave Velocity Study in the Poplar Bluff Area, Southeast Missouri
SCPT # 1
0
20
40
60
80
100
120
140
0 1000 2000
Vs (ft/sec)
Dep
th (f
t)
SCPTMASW
SCPT # 2
0
20
40
60
80
100
120
140
0 1000 2000
Vs (ft/sec)
Dep
th (f
t)
SCPT # 3
0
20
40
60
80
100
120
140
0 1000 2000
Vs (ft/sec)
Dep
th (f
t)
SCPT # 4
0
20
40
60
80
100
120
140
0 1000 2000
Vs (ft/sec)
Dep
th (f
t)
SCPT # 5
0
20
40
60
80
100
120
140
0 1000 2000
Vs (ft/sec)
Dep
th (f
t)
Figure 5.6: Suite of SCPT shear-wave velocity profiles from Site #10.
35
MoDOT Final Report RDT 05-006: Comprehensive Shear-Wave Velocity Study in the Poplar Bluff Area, Southeast Missouri
SCPT # 1
0
20
40
60
80
100
120
0 1000 2000 3000 4000
Vs (ft/sec)
Dep
th (f
t)
SCPT
MASW
SCPT # 2
0
20
40
60
80
100
120
0 1000 2000 3000
Vs (ft/sec)
Dep
th (f
t)
SCPT # 4
0
20
40
60
80
100
120
0 500 1000 1500 2000
Vs (ft/sec)
Dep
th (f
t/sec
)
SCPT # 5
0
20
40
60
80
100
120
0 500 1000 1500 2000
Vs (ft/sec)
Dep
th (f
t)
SCPT # 3
0
20
40
60
80
100
120
0 1000 2000 3000
Vs (ft/sec)
Dep
th (f
t)
Figure 5.7: Suite of SCPT shear-wave velocity profiles from Site #13.
36
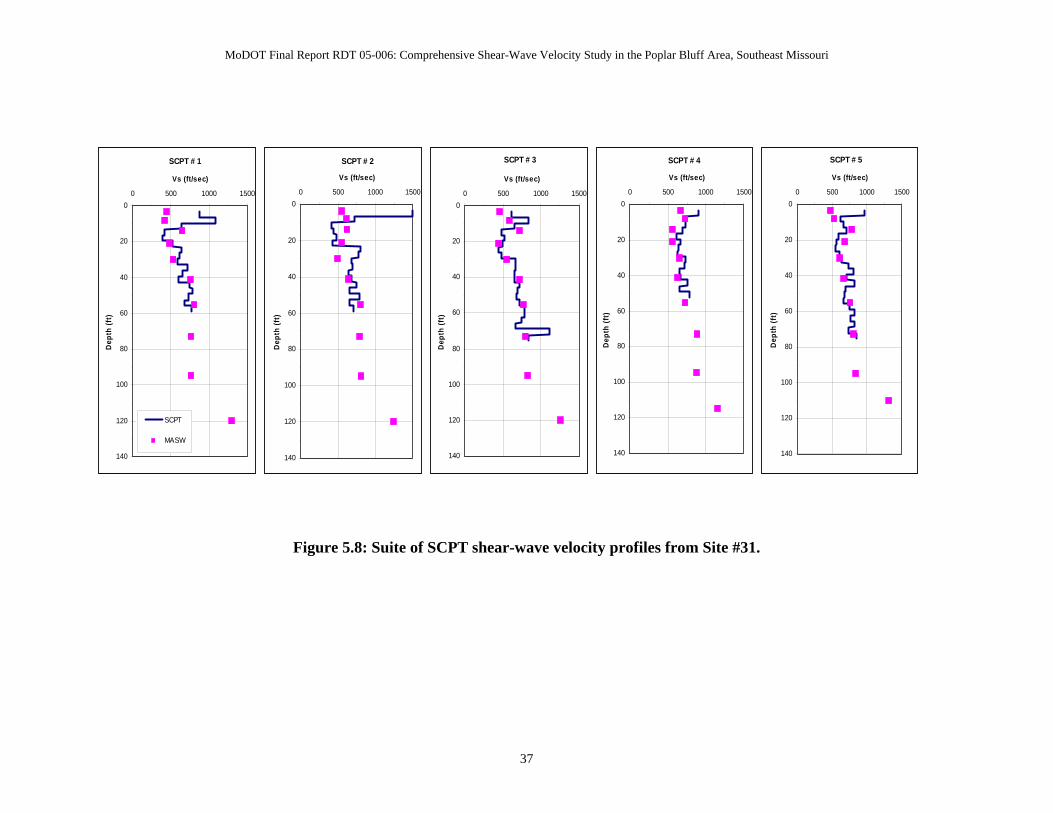
MoDOT Final Report RDT 05-006: Comprehensive Shear-Wave Velocity Study in the Poplar Bluff Area, Southeast Missouri
SCPT # 1
0
20
40
60
80
100
120
140
0 500 1000 1500
Vs (ft/sec)
Dep
th (f
t)
SCPT
MASW
SCPT # 2
0
20
40
60
80
100
120
140
0 500 1000 1500
Vs (ft/sec)
Dep
th (f
t)
SCPT # 3
0
20
40
60
80
100
120
140
0 500 1000 1500
Vs (ft/sec)
Dep
th (f
t)
SCPT # 4
0
20
40
60
80
100
120
140
0 500 1000 1500
Vs (ft/sec)
Dep
th (f
t)
SCPT # 5
0
20
40
60
80
100
120
140
0 500 1000 1500
Vs (ft/sec)
Dep
th (f
t)
Figure 5.8: Suite of SCPT shear-wave velocity profiles from Site #31.
37
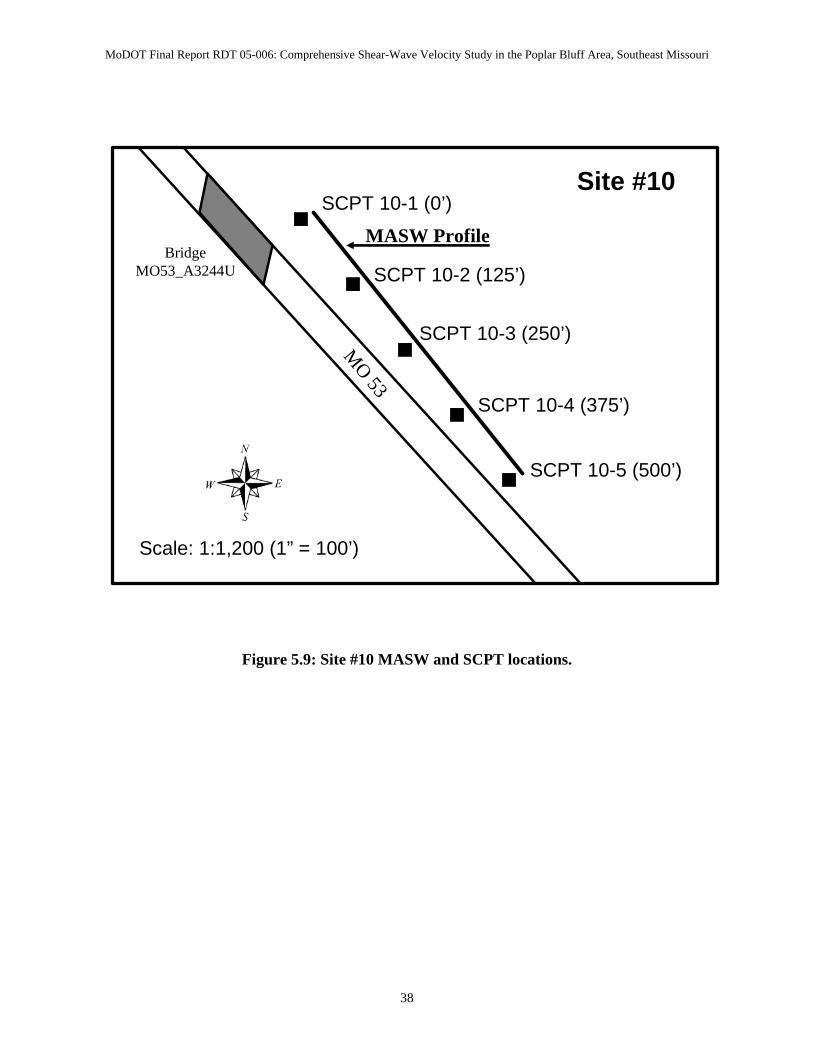
MoDOT Final Report RDT 05-006: Comprehensive Shear-Wave Velocity Study in the Poplar Bluff Area, Southeast Missouri
MASW ProfileBridge
MO53_A3244U
SCPT 10-1 (0’)
SCPT 10-2 (125’)
SCPT 10-3 (250’)
SCPT 10-4 (375’)
SCPT 10-5 (500’)M
O 53
Scale: 1:1,200 (1” = 100’)
Site #10
Figure 5.9: Site #10 MASW and SCPT locations.
38
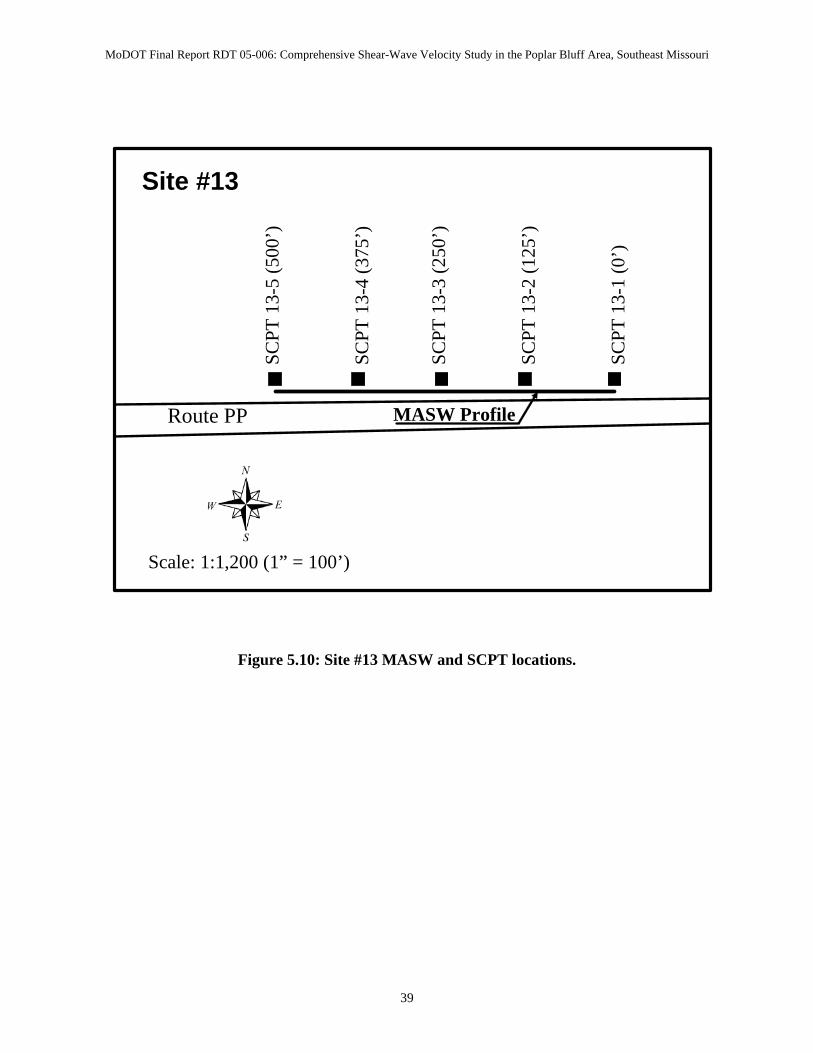
MoDOT Final Report RDT 05-006: Comprehensive Shear-Wave Velocity Study in the Poplar Bluff Area, Southeast Missouri
MASW ProfileRoute PP
Site #13
SCPT
13-
5 (5
00’)
SCPT
13-
4 (3
75’)
SCPT
13-
3 (2
50’)
SCPT
13-
2 (1
25’)
SCPT
13-
1 (0
’)
Scale: 1:1,200 (1” = 100’)
Figure 5.10: Site #13 MASW and SCPT locations.
39
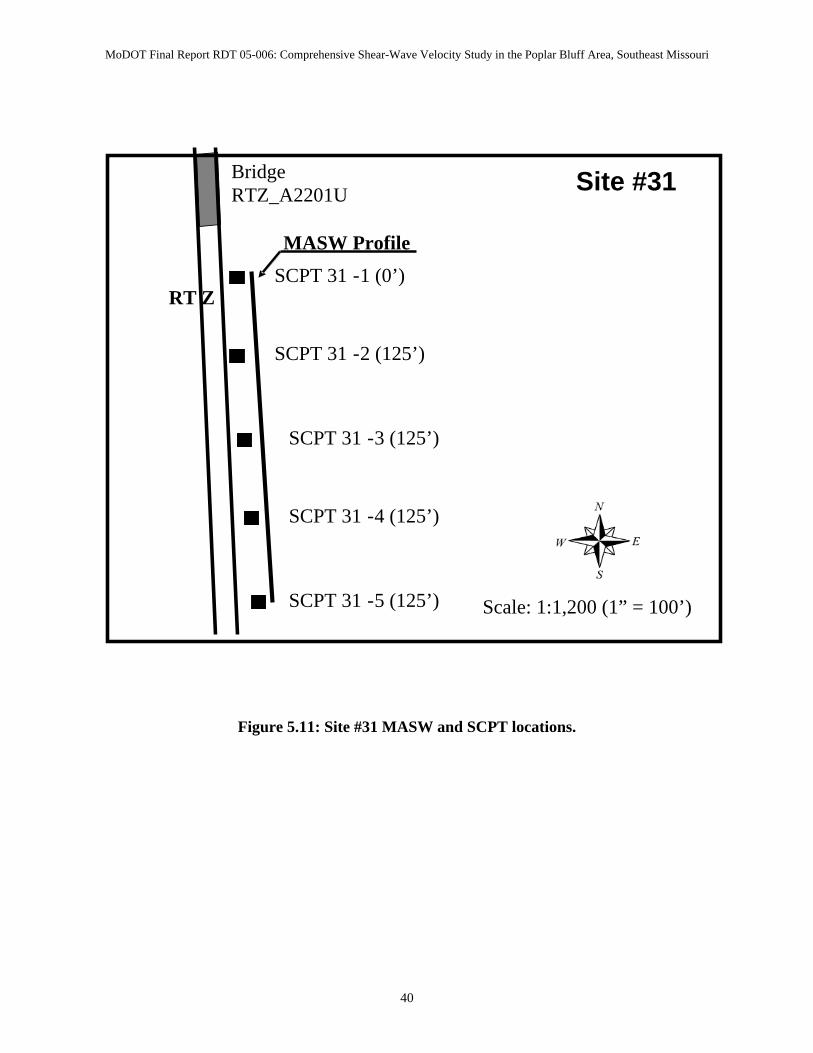
MoDOT Final Report RDT 05-006: Comprehensive Shear-Wave Velocity Study in the Poplar Bluff Area, Southeast Missouri
MASW ProfileSCPT 31 -1 (0’)
1 125’)
1 125’)
1 125’)
1 125’)
SCPT 3 -2 (
SCPT 3 -3 (
SCPT 3 -4 (
SCPT 3 -5 (
Site #31
RT Z
Bridge RTZ_A2201U
Scale: 1:1,200 (1” = 100’)
Figure 5.11: Site #31 MASW and SCPT locations.
40
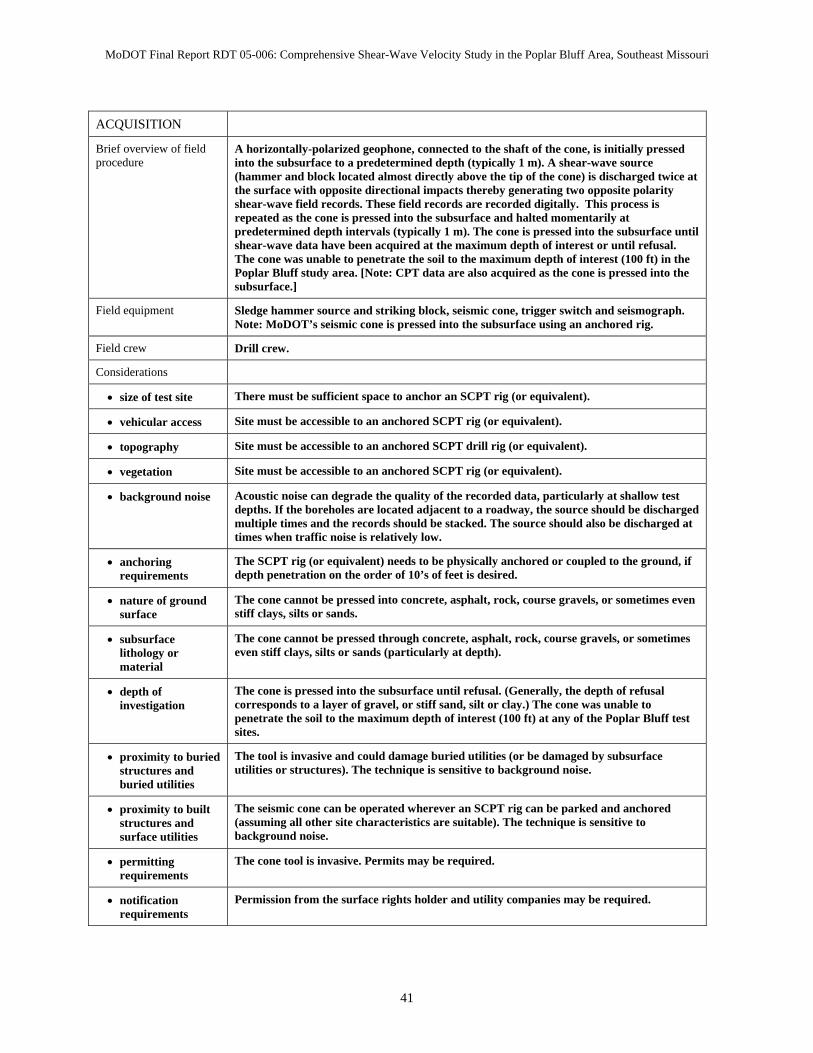
MoDOT Final Report RDT 05-006: Comprehensive Shear-Wave Velocity Study in the Poplar Bluff Area, Southeast Missouri
ACQUISITION
Brief overview of field procedure
A horizontally-polarized geophone, connected to the shaft of the cone, is initially pressed into the subsurface to a predetermined depth (typically 1 m). A shear-wave source (hammer and block located almost directly above the tip of the cone) is discharged twice at the surface with opposite directional impacts thereby generating two opposite polarity shear-wave field records. These field records are recorded digitally. This process is repeated as the cone is pressed into the subsurface and halted momentarily at predetermined depth intervals (typically 1 m). The cone is pressed into the subsurface until shear-wave data have been acquired at the maximum depth of interest or until refusal. The cone was unable to penetrate the soil to the maximum depth of interest (100 ft) in the Poplar Bluff study area. [Note: CPT data are also acquired as the cone is pressed into the subsurface.]
Field equipment Sledge hammer source and striking block, seismic cone, trigger switch and seismograph. Note: MoDOT’s seismic cone is pressed into the subsurface using an anchored rig.
Field crew Drill crew.
Considerations
• size of test site There must be sufficient space to anchor an SCPT rig (or equivalent).
• vehicular access Site must be accessible to an anchored SCPT rig (or equivalent).
• topography Site must be accessible to an anchored SCPT drill rig (or equivalent).
• vegetation Site must be accessible to an anchored SCPT rig (or equivalent).
• background noise Acoustic noise can degrade the quality of the recorded data, particularly at shallow test depths. If the boreholes are located adjacent to a roadway, the source should be discharged multiple times and the records should be stacked. The source should also be discharged at times when traffic noise is relatively low.
• anchoring requirements
The SCPT rig (or equivalent) needs to be physically anchored or coupled to the ground, if depth penetration on the order of 10’s of feet is desired.
• nature of ground surface
The cone cannot be pressed into concrete, asphalt, rock, course gravels, or sometimes even stiff clays, silts or sands.
• subsurface lithology or material
The cone cannot be pressed through concrete, asphalt, rock, course gravels, or sometimes even stiff clays, silts or sands (particularly at depth).
• depth of investigation
The cone is pressed into the subsurface until refusal. (Generally, the depth of refusal corresponds to a layer of gravel, or stiff sand, silt or clay.) The cone was unable to penetrate the soil to the maximum depth of interest (100 ft) at any of the Poplar Bluff test sites.
• proximity to buried structures and buried utilities
The tool is invasive and could damage buried utilities (or be damaged by subsurface utilities or structures). The technique is sensitive to background noise.
• proximity to built structures and surface utilities
The seismic cone can be operated wherever an SCPT rig can be parked and anchored (assuming all other site characteristics are suitable). The technique is sensitive to background noise.
• permitting requirements
The cone tool is invasive. Permits may be required.
• notification requirements
Permission from the surface rights holder and utility companies may be required.
41
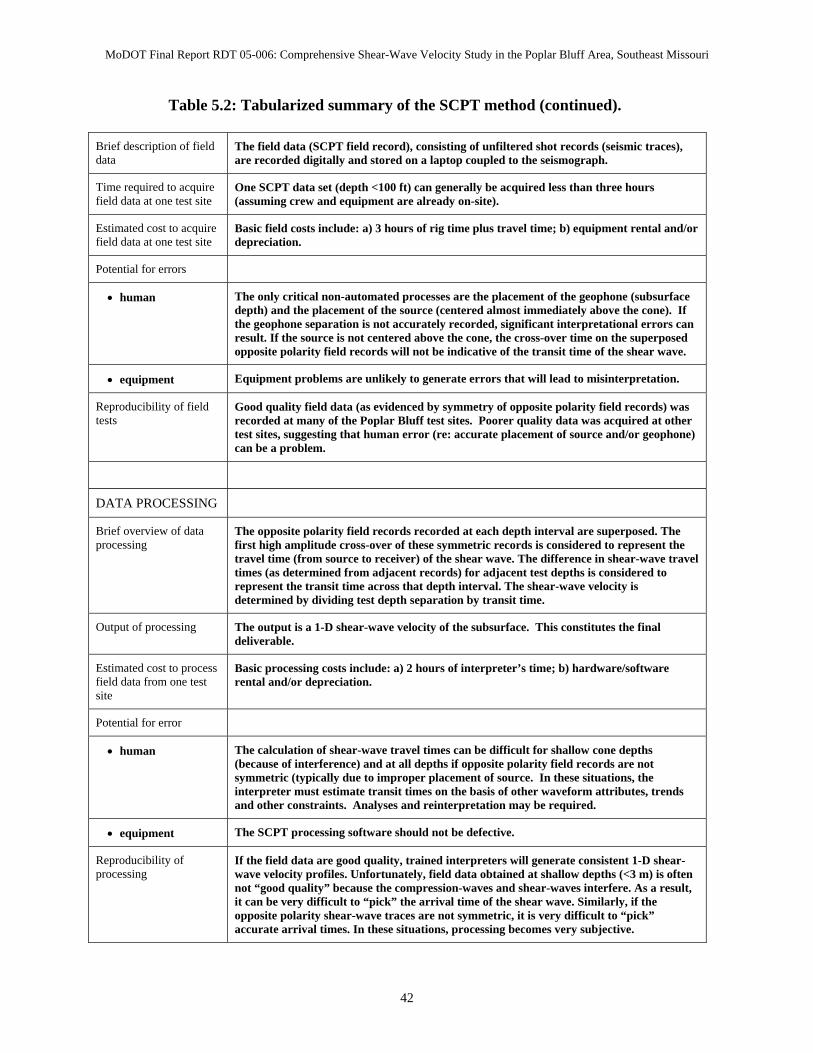
MoDOT Final Report RDT 05-006: Comprehensive Shear-Wave Velocity Study in the Poplar Bluff Area, Southeast Missouri
Table 5.2: Tabularized summary of the SCPT method (continued).
Brief description of field data
The field data (SCPT field record), consisting of unfiltered shot records (seismic traces), are recorded digitally and stored on a laptop coupled to the seismograph.
Time required to acquire field data at one test site
One SCPT data set (depth <100 ft) can generally be acquired less than three hours (assuming crew and equipment are already on-site).
Estimated cost to acquire field data at one test site
Basic field costs include: a) 3 hours of rig time plus travel time; b) equipment rental and/or depreciation.
Potential for errors
• human The only critical non-automated processes are the placement of the geophone (subsurface depth) and the placement of the source (centered almost immediately above the cone). If the geophone separation is not accurately recorded, significant interpretational errors can result. If the source is not centered above the cone, the cross-over time on the superposed opposite polarity field records will not be indicative of the transit time of the shear wave.
• equipment Equipment problems are unlikely to generate errors that will lead to misinterpretation.
Reproducibility of field tests
Good quality field data (as evidenced by symmetry of opposite polarity field records) was recorded at many of the Poplar Bluff test sites. Poorer quality data was acquired at other test sites, suggesting that human error (re: accurate placement of source and/or geophone) can be a problem.
DATA PROCESSING
Brief overview of data processing
The opposite polarity field records recorded at each depth interval are superposed. The first high amplitude cross-over of these symmetric records is considered to represent the travel time (from source to receiver) of the shear wave. The difference in shear-wave travel times (as determined from adjacent records) for adjacent test depths is considered to represent the transit time across that depth interval. The shear-wave velocity is determined by dividing test depth separation by transit time.
Output of processing The output is a 1-D shear-wave velocity of the subsurface. This constitutes the final deliverable.
Estimated cost to process field data from one test site
Basic processing costs include: a) 2 hours of interpreter’s time; b) hardware/software rental and/or depreciation.
Potential for error
• human The calculation of shear-wave travel times can be difficult for shallow cone depths (because of interference) and at all depths if opposite polarity field records are not symmetric (typically due to improper placement of source. In these situations, the interpreter must estimate transit times on the basis of other waveform attributes, trends and other constraints. Analyses and reinterpretation may be required.
• equipment The SCPT processing software should not be defective.
Reproducibility of processing
If the field data are good quality, trained interpreters will generate consistent 1-D shear-wave velocity profiles. Unfortunately, field data obtained at shallow depths (<3 m) is often not “good quality” because the compression-waves and shear-waves interfere. As a result, it can be very difficult to “pick” the arrival time of the shear wave. Similarly, if the opposite polarity shear-wave traces are not symmetric, it is very difficult to “pick” accurate arrival times. In these situations, processing becomes very subjective.
42
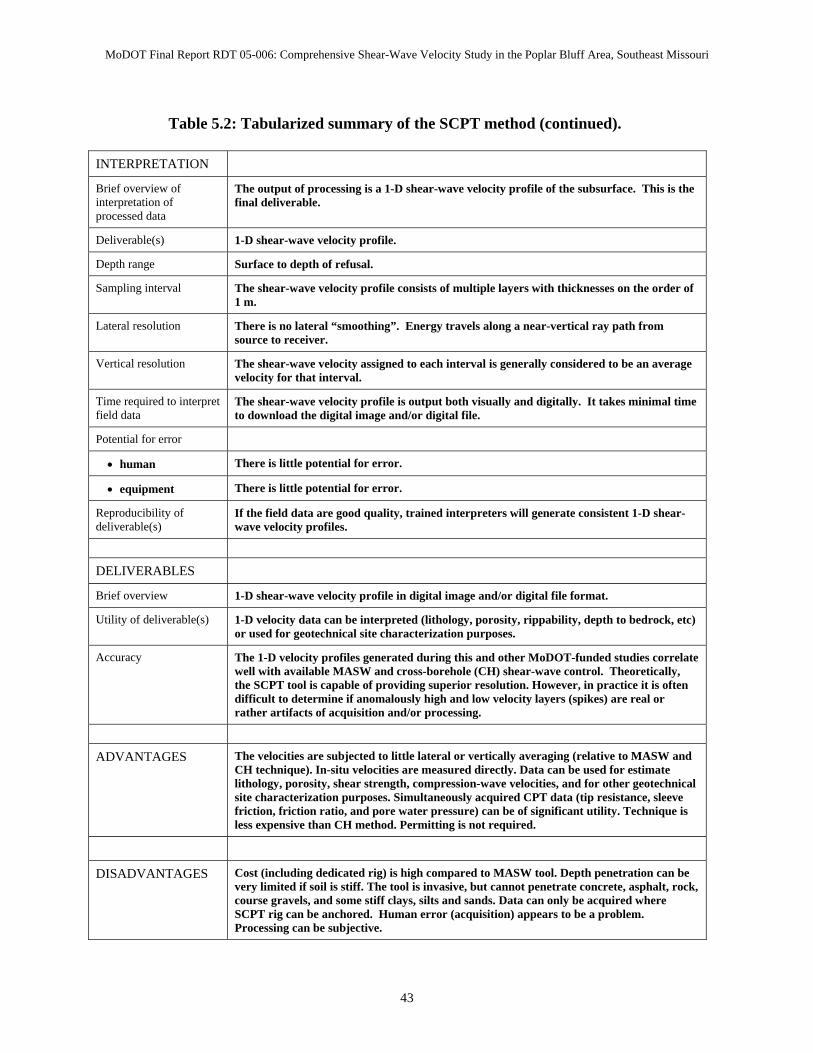
MoDOT Final Report RDT 05-006: Comprehensive Shear-Wave Velocity Study in the Poplar Bluff Area, Southeast Missouri
Table 5.2: Tabularized summary of the SCPT method (continued).
INTERPRETATION
Brief overview of interpretation of processed data
The output of processing is a 1-D shear-wave velocity profile of the subsurface. This is the final deliverable.
Deliverable(s) 1-D shear-wave velocity profile.
Depth range Surface to depth of refusal.
Sampling interval The shear-wave velocity profile consists of multiple layers with thicknesses on the order of 1 m.
Lateral resolution There is no lateral “smoothing”. Energy travels along a near-vertical ray path from source to receiver.
Vertical resolution The shear-wave velocity assigned to each interval is generally considered to be an average velocity for that interval.
Time required to interpret field data
The shear-wave velocity profile is output both visually and digitally. It takes minimal time to download the digital image and/or digital file.
Potential for error
• human There is little potential for error.
• equipment There is little potential for error.
Reproducibility of deliverable(s)
If the field data are good quality, trained interpreters will generate consistent 1-D shear-wave velocity profiles.
DELIVERABLES
Brief overview 1-D shear-wave velocity profile in digital image and/or digital file format.
Utility of deliverable(s) 1-D velocity data can be interpreted (lithology, porosity, rippability, depth to bedrock, etc) or used for geotechnical site characterization purposes.
Accuracy The 1-D velocity profiles generated during this and other MoDOT-funded studies correlate well with available MASW and cross-borehole (CH) shear-wave control. Theoretically, the SCPT tool is capable of providing superior resolution. However, in practice it is often difficult to determine if anomalously high and low velocity layers (spikes) are real or rather artifacts of acquisition and/or processing.
ADVANTAGES The velocities are subjected to little lateral or vertically averaging (relative to MASW and CH technique). In-situ velocities are measured directly. Data can be used for estimate lithology, porosity, shear strength, compression-wave velocities, and for other geotechnical site characterization purposes. Simultaneously acquired CPT data (tip resistance, sleeve friction, friction ratio, and pore water pressure) can be of significant utility. Technique is less expensive than CH method. Permitting is not required.
DISADVANTAGES Cost (including dedicated rig) is high compared to MASW tool. Depth penetration can be very limited if soil is stiff. The tool is invasive, but cannot penetrate concrete, asphalt, rock, course gravels, and some stiff clays, silts and sands. Data can only be acquired where SCPT rig can be anchored. Human error (acquisition) appears to be a problem. Processing can be subjective.
43
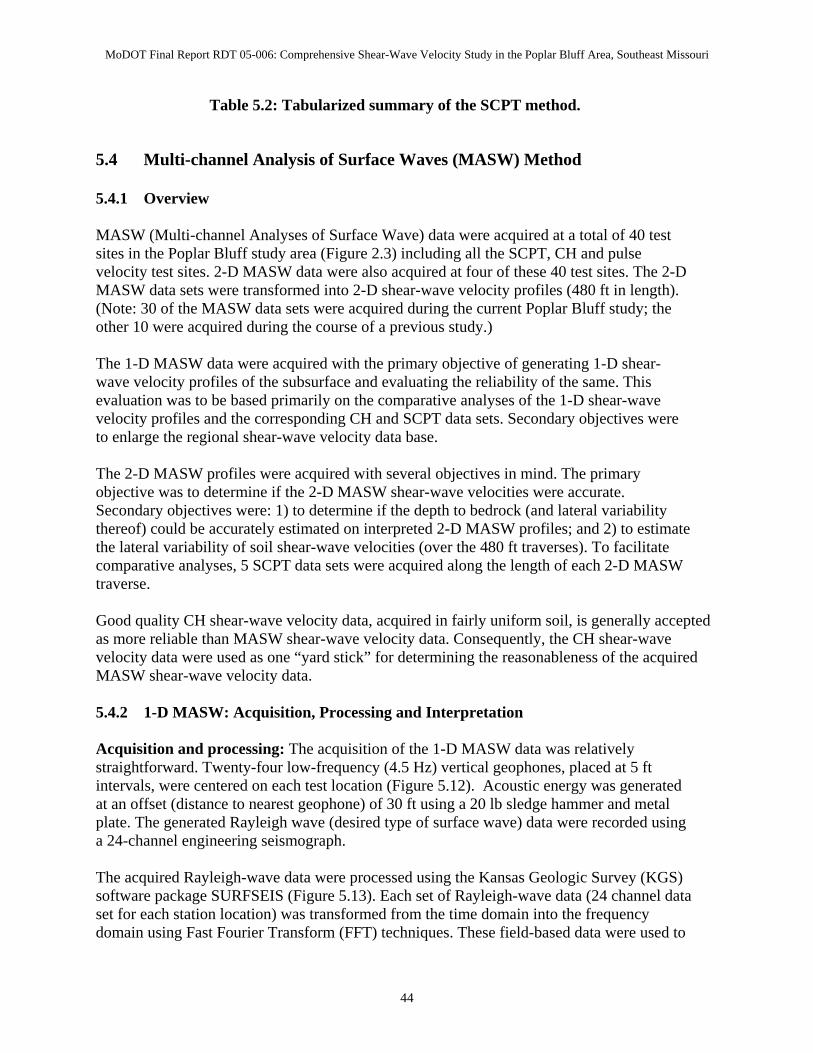
MoDOT Final Report RDT 05-006: Comprehensive Shear-Wave Velocity Study in the Poplar Bluff Area, Southeast Missouri
Table 5.2: Tabularized summary of the SCPT method.
5.4 Multi-channel Analysis of Surface Waves (MASW) Method 5.4.1 Overview MASW (Multi-channel Analyses of Surface Wave) data were acquired at a total of 40 test sites in the Poplar Bluff study area (Figure 2.3) including all the SCPT, CH and pulse velocity test sites. 2-D MASW data were also acquired at four of these 40 test sites. The 2-D MASW data sets were transformed into 2-D shear-wave velocity profiles (480 ft in length). (Note: 30 of the MASW data sets were acquired during the current Poplar Bluff study; the other 10 were acquired during the course of a previous study.) The 1-D MASW data were acquired with the primary objective of generating 1-D shear-wave velocity profiles of the subsurface and evaluating the reliability of the same. This evaluation was to be based primarily on the comparative analyses of the 1-D shear-wave velocity profiles and the corresponding CH and SCPT data sets. Secondary objectives were to enlarge the regional shear-wave velocity data base. The 2-D MASW profiles were acquired with several objectives in mind. The primary objective was to determine if the 2-D MASW shear-wave velocities were accurate. Secondary objectives were: 1) to determine if the depth to bedrock (and lateral variability thereof) could be accurately estimated on interpreted 2-D MASW profiles; and 2) to estimate the lateral variability of soil shear-wave velocities (over the 480 ft traverses). To facilitate comparative analyses, 5 SCPT data sets were acquired along the length of each 2-D MASW traverse. Good quality CH shear-wave velocity data, acquired in fairly uniform soil, is generally accepted as more reliable than MASW shear-wave velocity data. Consequently, the CH shear-wave velocity data were used as one “yard stick” for determining the reasonableness of the acquired MASW shear-wave velocity data. 5.4.2 1-D MASW: Acquisition, Processing and Interpretation
Acquisition and processing: The acquisition of the 1-D MASW data was relatively straightforward. Twenty-four low-frequency (4.5 Hz) vertical geophones, placed at 5 ft intervals, were centered on each test location (Figure 5.12). Acoustic energy was generated at an offset (distance to nearest geophone) of 30 ft using a 20 lb sledge hammer and metal plate. The generated Rayleigh wave (desired type of surface wave) data were recorded using a 24-channel engineering seismograph. The acquired Rayleigh-wave data were processed using the Kansas Geologic Survey (KGS) software package SURFSEIS (Figure 5.13). Each set of Rayleigh-wave data (24 channel data set for each station location) was transformed from the time domain into the frequency domain using Fast Fourier Transform (FFT) techniques. These field-based data were used to
44
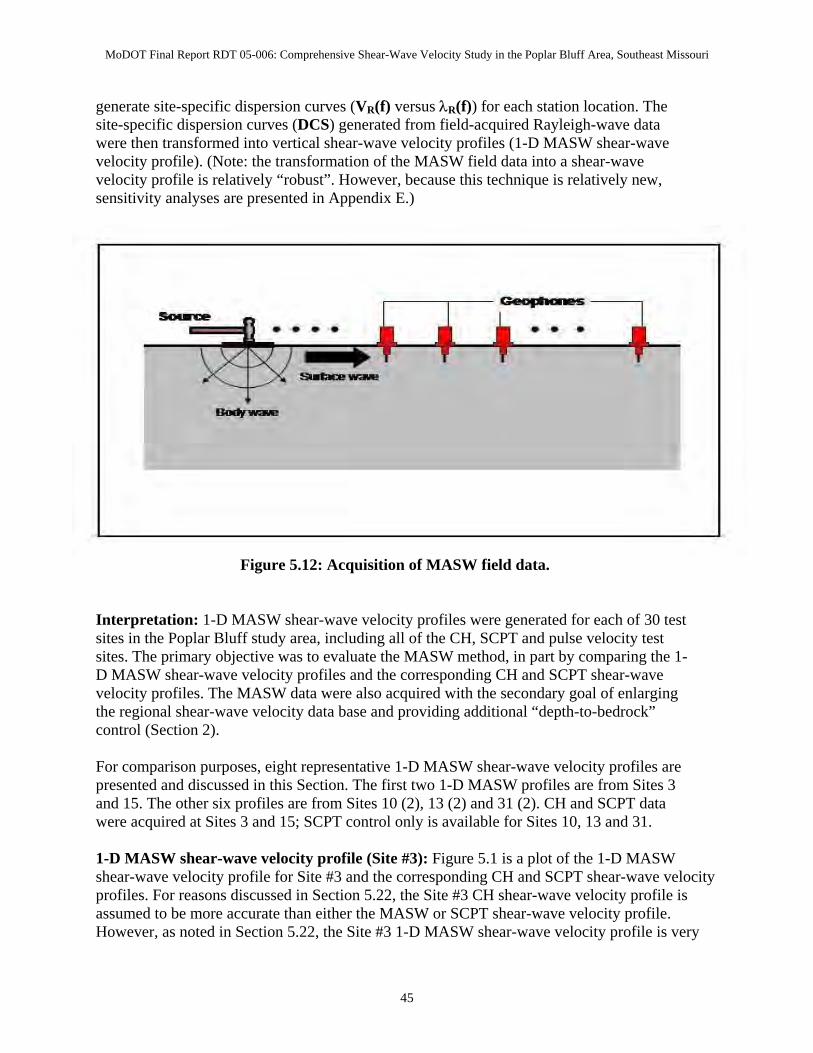
MoDOT Final Report RDT 05-006: Comprehensive Shear-Wave Velocity Study in the Poplar Bluff Area, Southeast Missouri
generate site-specific dispersion curves (VR(f) versus λR(f)) for each station location. The site-specific dispersion curves (DCS) generated from field-acquired Rayleigh-wave data were then transformed into vertical shear-wave velocity profiles (1-D MASW shear-wave velocity profile). (Note: the transformation of the MASW field data into a shear-wave velocity profile is relatively “robust”. However, because this technique is relatively new, sensitivity analyses are presented in Appendix E.)
Figure 5.12: Acquisition of MASW field data.
Interpretation: 1-D MASW shear-wave velocity profiles were generated for each of 30 test sites in the Poplar Bluff study area, including all of the CH, SCPT and pulse velocity test sites. The primary objective was to evaluate the MASW method, in part by comparing the 1-D MASW shear-wave velocity profiles and the corresponding CH and SCPT shear-wave velocity profiles. The MASW data were also acquired with the secondary goal of enlarging the regional shear-wave velocity data base and providing additional “depth-to-bedrock” control (Section 2). For comparison purposes, eight representative 1-D MASW shear-wave velocity profiles are presented and discussed in this Section. The first two 1-D MASW profiles are from Sites 3 and 15. The other six profiles are from Sites 10 (2), 13 (2) and 31 (2). CH and SCPT data were acquired at Sites 3 and 15; SCPT control only is available for Sites 10, 13 and 31. 1-D MASW shear-wave velocity profile (Site #3): Figure 5.1 is a plot of the 1-D MASW shear-wave velocity profile for Site #3 and the corresponding CH and SCPT shear-wave velocity profiles. For reasons discussed in Section 5.22, the Site #3 CH shear-wave velocity profile is assumed to be more accurate than either the MASW or SCPT shear-wave velocity profile. However, as noted in Section 5.22, the Site #3 1-D MASW shear-wave velocity profile is very
45
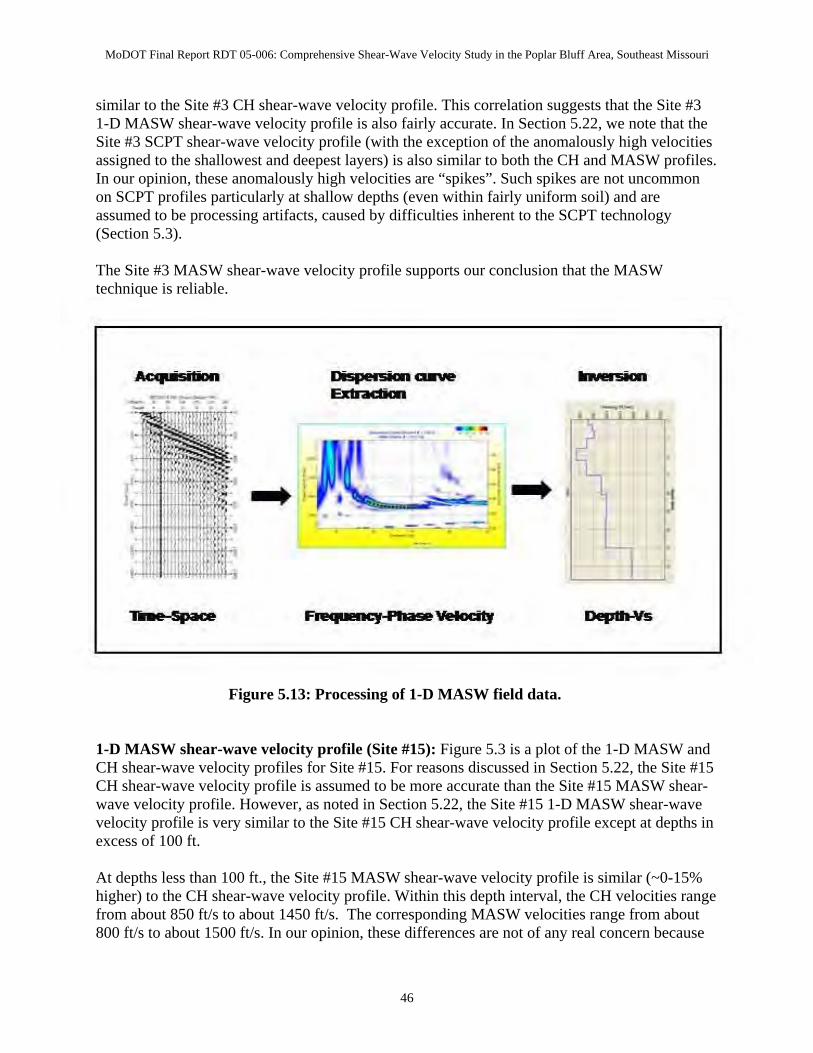
MoDOT Final Report RDT 05-006: Comprehensive Shear-Wave Velocity Study in the Poplar Bluff Area, Southeast Missouri
similar to the Site #3 CH shear-wave velocity profile. This correlation suggests that the Site #3 1-D MASW shear-wave velocity profile is also fairly accurate. In Section 5.22, we note that the Site #3 SCPT shear-wave velocity profile (with the exception of the anomalously high velocities assigned to the shallowest and deepest layers) is also similar to both the CH and MASW profiles. In our opinion, these anomalously high velocities are “spikes”. Such spikes are not uncommon on SCPT profiles particularly at shallow depths (even within fairly uniform soil) and are assumed to be processing artifacts, caused by difficulties inherent to the SCPT technology (Section 5.3). The Site #3 MASW shear-wave velocity profile supports our conclusion that the MASW technique is reliable.
Figure 5.13: Processing of 1-D MASW field data.
1-D MASW shear-wave velocity profile (Site #15): Figure 5.3 is a plot of the 1-D MASW and CH shear-wave velocity profiles for Site #15. For reasons discussed in Section 5.22, the Site #15 CH shear-wave velocity profile is assumed to be more accurate than the Site #15 MASW shear-wave velocity profile. However, as noted in Section 5.22, the Site #15 1-D MASW shear-wave velocity profile is very similar to the Site #15 CH shear-wave velocity profile except at depths in excess of 100 ft. At depths less than 100 ft., the Site #15 MASW shear-wave velocity profile is similar (~0-15% higher) to the CH shear-wave velocity profile. Within this depth interval, the CH velocities range from about 850 ft/s to about 1450 ft/s. The corresponding MASW velocities range from about 800 ft/s to about 1500 ft/s. In our opinion, these differences are not of any real concern because
46
MoDOT Final Report RDT 05-006: Comprehensive Shear-Wave Velocity Study in the Poplar Bluff Area, Southeast Missouri
the MASW and CH data were acquired at slightly different locations (~100 ft separation), and because the nature of the residium soils and the depth to bedrock can vary significantly over short lateral distances in the upland areas. The MASW velocity value (~2000 ft/s) plotted at a depth of 110 ft is significantly higher than the corresponding CH velocity value (~1550 ft/s). It is possible that this difference is due to the fact that MASW velocities are laterally and vertically averaged. However, it is more probable that bedrock is deeper at the CH test location than at the MASW test location. (Indeed, the interpretation of the 2-D MASW profile acquired at Site #13 suggests that acoustic transition bedrock in the uplands area is characterized by shear-wave velocities on the order of 2000 ft/s; Section 5.4.3.) The Site #15 MASW shear-wave velocity profile supports our conclusion that the MASW technique is reliable. 5.4.3 2-D MASW: Acquisition, Processing and Interpretation Acquisition and processing: 2-D MASW shear-wave velocity profiles were generated for 4 of the 30 test sites in the Poplar Bluff study area (Sites 3, 10, 13 and 31). The acquisition of each of the 2-D MASW data sets was relatively straightforward. Basically, at each 2-D MASW test site, forty-nine (49) 1-D MASW shear-wave velocity data sets were acquired (at 10 ft intervals) along a 480 ft traverse (Figures 5.2, 5.14 and 5.15). The acquisition of each of these1-D data sets was similar to the acquisition of the 1-D MASW data sets described in Section 5.4.2. Each of the forty-nine (49) 1-D data sets was independently transformed into a vertical shear-wave velocity curve (1-D MASW shear-wave velocity profile) following the process described in Section 5.4.2. Each of these 1-D shear-wave velocity curves was then placed and plotted at its appropriate station location, thereby generating a 480 ft 2-D shear-wave velocity profile (Figures 5.14 and 5.15). To facilitate the evaluation of the MSAW method and for comparative analyses purposes, five SCPT data sets were acquired along each of the 2-D MASW traverses (Figure 5.5). Interpretation: The 2-D MASW profiles were acquired with several objectives in mind. The primary objective was to determine if the 2-D MASW shear-wave velocities were accurate. Secondary objectives were 1) to determine if the depth to bedrock (and lateral variability thereof) could be accurately estimated on interpreted 2-D MASW profiles, and 2) to estimate the lateral variability of soil shear-wave velocities (over the 480 ft traverses). For interpretational and comparison purposes, all four representative 2-D MASW shear-wave velocity profiles are presented and discussed herein. Site #3 2-D MASW profile: The 2-D MASW shear-wave velocity profile acquired at Site #3 is shown as Figure 5.15. Five SCPT and one CH shear-wave velocity profiles were acquired along the MASW traverse (Figures 5.1 and 5.5).
47
MoDOT Final Report RDT 05-006: Comprehensive Shear-Wave Velocity Study in the Poplar Bluff Area, Southeast Missouri
In Section 5.4.2, the Site #3 CH shear-wave velocity profile is shown to correlate closely to the closest 1-D MASW profile. (The 1-D profile shown in Figure 5.1 was extracted from the 2-D MASW data set.) The fact that the CH and 1-D MASW shear-wave velocity profiles are similar supports the conclusion that the Site #3 MASW shear-wave velocity data are reliable. In Section 5.3.2, the suite of Site #3 SCPT shear-wave velocity profiles and the corresponding 1-D MASW profiles (extracted from the 2-D MASW profile) are evaluated. While we cannot determine with complete confidence which shear-wave velocity data set is more reliable, we believe that the MASW shear-wave velocity curves are more reasonable for several reasons. First, the Site #3 CH data match the Site #3 MASW data better than the Site #3 SCPT data (Section 5.2). Second, the shallowest layer on each SCPT profile has been assigned an anomalously high velocity (albeit slightly) irrespective of its depth. We believe this is an artifact of processing rather than an indication of near surface conditions. Third, the high velocity spike that is present on SCPT profile #5 at a depth of ~35 ft is not present on any of the other SCPT profiles (or on either the CH and/or MASW profiles). Inasmuch as the soil is fairly uniform at Site #3, we conclude that the isolated high velocity spike on SCPT profile #5 is an artifact of processing rather than indicative of variable subsurface conditions. We note that high and low velocity “spikes” are not uncommon on SCPT profiles particularly at shallow depths. Generally, such “spikes” are not “real”. Rather, they are assumed to be processing artifacts, caused by difficulties inherent to the technology (Section 5.3.1). If these conclusions are valid, then the Site #3 MASW can be considered to be reliable, and can be interpreted in terms of lateral and vertical velocity variations, and variations in the depth to bedrock. Bedrock, on the Site #3 2-D MASW (Figure 5.15) is thought to correlate reasonably well with the 1200 ft/s contour. This interpretation is based on several observations. First, bedrock at the Site #3 CH location is at a depth of ~113 ft. Second, a depth of ~113 ft on the closest tie point on the 2-D MASW profile corresponds reasonably well to the 1200 ft/s contour interval. Third the highest velocity recorded for soil on the Site # 3 CH shear-wave velocity profile is ~1000 ft/s. Inasmuch as MASW data are laterally averaged, it is expected that the soil/bedrock contact would correspond to a velocity greater than that of soil, but less than that of bedrock. If the 1200 ft/s contour correlates reasonably well with the top of bedrock, then the depth to bedrock along the Site #3 MASW profile varies by 50 ft (low: 90 ft; high:140 ft). This variation is not unexpected as Site #3 is situated in the lowlands at the mouth of one of the larger drainage features in the Poplar Bluff study area (Figure 2.3). The soil velocity on the Site #3 MASW profile increases fairly uniformly from a low of ~450 ft/s to a high of about 1000 ft/s. Laterally, velocities do not vary appreciably except in proximity to bedrock. Site #10 2-D MASW profile: The 2-D MASW shear-wave velocity profile acquired at Site #10 is shown as Figure 5.16. Five SCPT shear-wave velocity profiles were acquired along the MASW traverse (Figures 5.6 and 5.9).
48
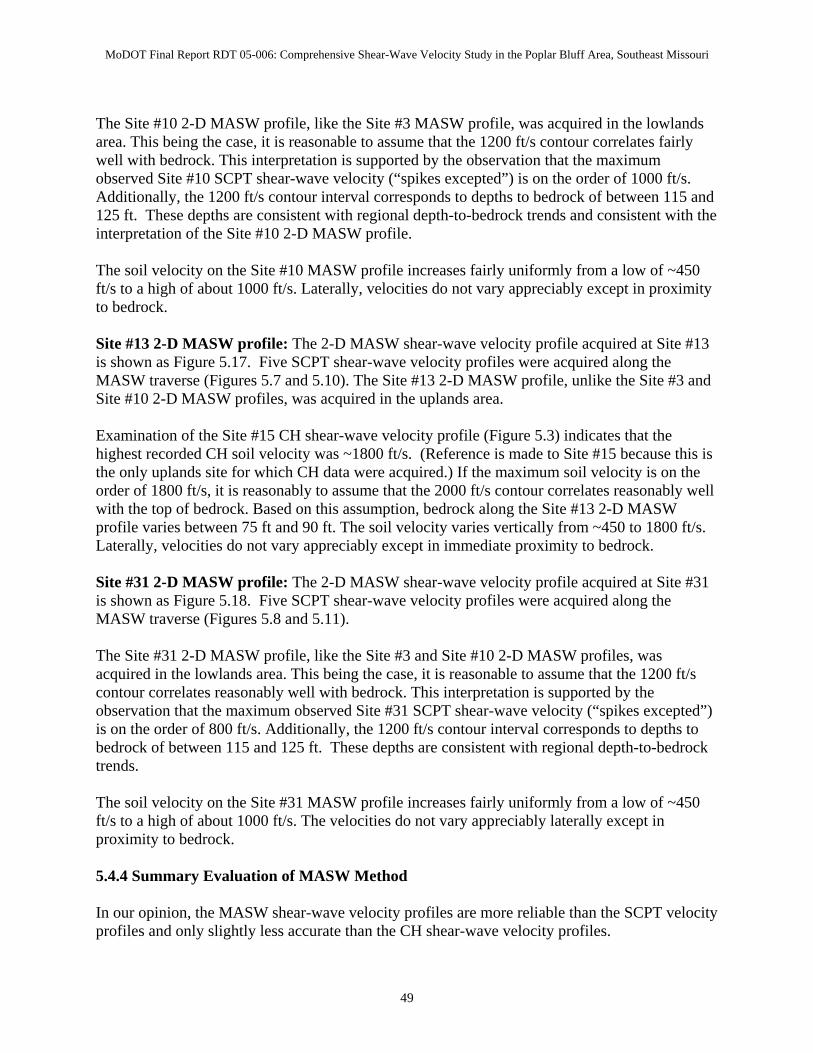
MoDOT Final Report RDT 05-006: Comprehensive Shear-Wave Velocity Study in the Poplar Bluff Area, Southeast Missouri
The Site #10 2-D MASW profile, like the Site #3 MASW profile, was acquired in the lowlands area. This being the case, it is reasonable to assume that the 1200 ft/s contour correlates fairly well with bedrock. This interpretation is supported by the observation that the maximum observed Site #10 SCPT shear-wave velocity (“spikes excepted”) is on the order of 1000 ft/s. Additionally, the 1200 ft/s contour interval corresponds to depths to bedrock of between 115 and 125 ft. These depths are consistent with regional depth-to-bedrock trends and consistent with the interpretation of the Site #10 2-D MASW profile. The soil velocity on the Site #10 MASW profile increases fairly uniformly from a low of ~450 ft/s to a high of about 1000 ft/s. Laterally, velocities do not vary appreciably except in proximity to bedrock. Site #13 2-D MASW profile: The 2-D MASW shear-wave velocity profile acquired at Site #13 is shown as Figure 5.17. Five SCPT shear-wave velocity profiles were acquired along the MASW traverse (Figures 5.7 and 5.10). The Site #13 2-D MASW profile, unlike the Site #3 and Site #10 2-D MASW profiles, was acquired in the uplands area. Examination of the Site #15 CH shear-wave velocity profile (Figure 5.3) indicates that the highest recorded CH soil velocity was ~1800 ft/s. (Reference is made to Site #15 because this is the only uplands site for which CH data were acquired.) If the maximum soil velocity is on the order of 1800 ft/s, it is reasonably to assume that the 2000 ft/s contour correlates reasonably well with the top of bedrock. Based on this assumption, bedrock along the Site #13 2-D MASW profile varies between 75 ft and 90 ft. The soil velocity varies vertically from ~450 to 1800 ft/s. Laterally, velocities do not vary appreciably except in immediate proximity to bedrock. Site #31 2-D MASW profile: The 2-D MASW shear-wave velocity profile acquired at Site #31 is shown as Figure 5.18. Five SCPT shear-wave velocity profiles were acquired along the MASW traverse (Figures 5.8 and 5.11). The Site #31 2-D MASW profile, like the Site #3 and Site #10 2-D MASW profiles, was acquired in the lowlands area. This being the case, it is reasonable to assume that the 1200 ft/s contour correlates reasonably well with bedrock. This interpretation is supported by the observation that the maximum observed Site #31 SCPT shear-wave velocity (“spikes excepted”) is on the order of 800 ft/s. Additionally, the 1200 ft/s contour interval corresponds to depths to bedrock of between 115 and 125 ft. These depths are consistent with regional depth-to-bedrock trends. The soil velocity on the Site #31 MASW profile increases fairly uniformly from a low of ~450 ft/s to a high of about 1000 ft/s. The velocities do not vary appreciably laterally except in proximity to bedrock. 5.4.4 Summary Evaluation of MASW Method In our opinion, the MASW shear-wave velocity profiles are more reliable than the SCPT velocity profiles and only slightly less accurate than the CH shear-wave velocity profiles.
49

MoDOT Final Report RDT 05-006: Comprehensive Shear-Wave Velocity Study in the Poplar Bluff Area, Southeast Missouri
The biggest advantages of the MASW method in comparison to the CH method are related to cost, site accessibility and the fact that the MASW technique can be used to map the top of bedrock. The MASW tool is superior to the SCPT tool in terms of cost, site accessibility, depth of investigation and capability to map bedrock. A tabularized summary of the MASW method is presented as Table 5.3.
50
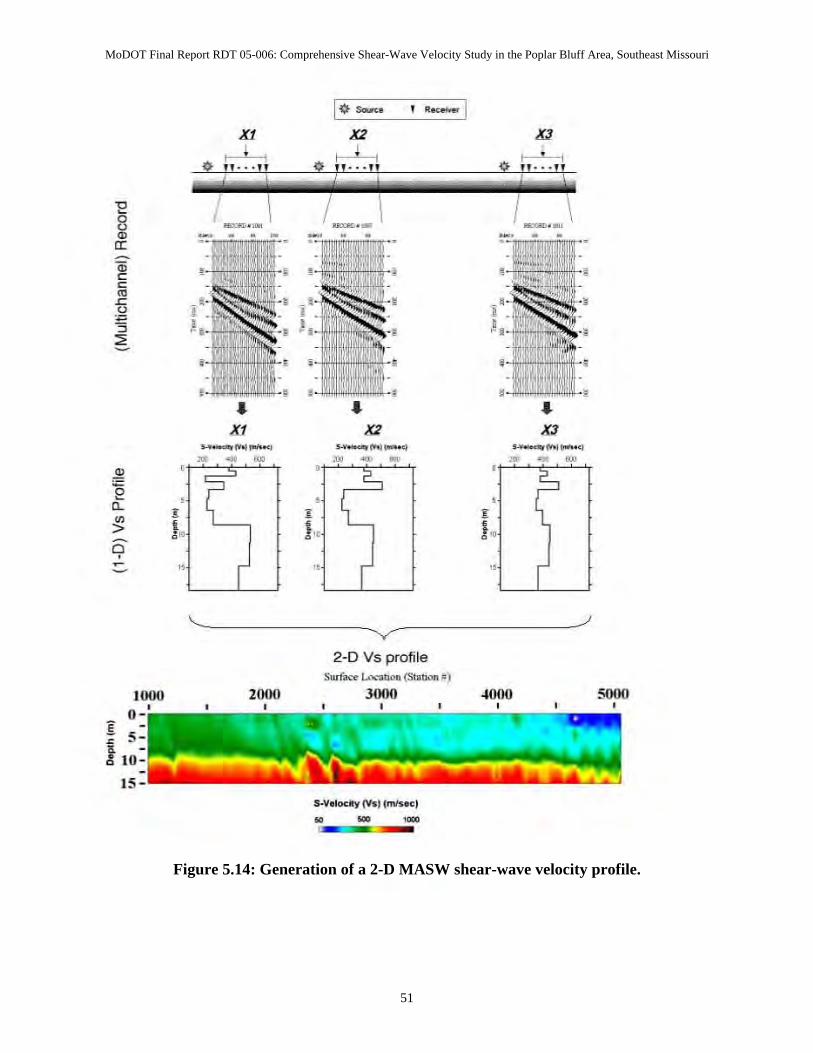
MoDOT Final Report RDT 05-006: Comprehensive Shear-Wave Velocity Study in the Poplar Bluff Area, Southeast Missouri
Figure 5.14: Generation of a 2-D MASW shear-wave velocity profile.
51
Xi xz I j. I
, I • I
" 1', .. :\ I • I
-- - -- - --- ..
" / - .- C J I \ il _ .,., _. '" ~ .. • • c c • ~ .' u L ~
"S ,
" . ,. "
• • • • • XI XZ X3
-~-...-_"",-, ----- ~ n Q - - ~ ~
~ ? c ? e "- • • • • '--> ,. I" I. ~
" ,
" I " I "
'- y-
2-D Vs profi le SurIK. l.o<aoon (St.",,", i)
2000 3000 4000 5000 ,
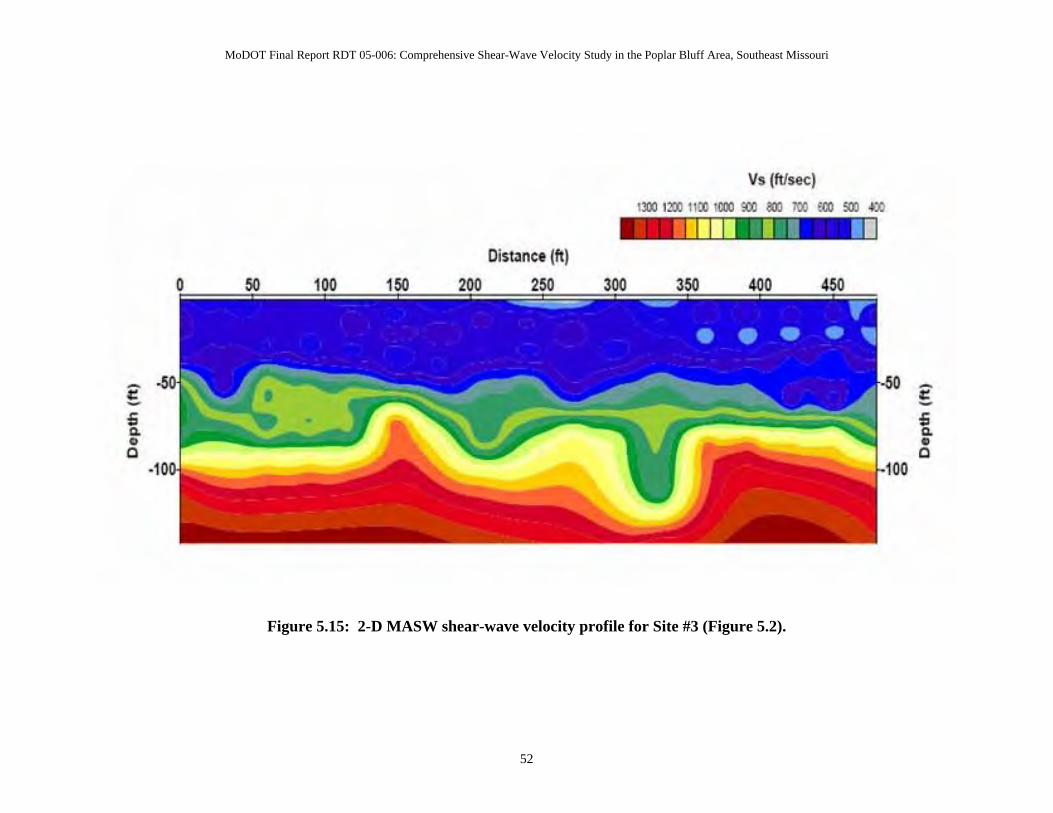
MoDOT Final Report RDT 05-006: Comprehensive Shear-Wave Velocity Study in the Poplar Bluff Area, Southeast Missouri
Figure 5.15: 2-D MASW shear-wave velocity profile for Site #3 (Figure 5.2).
52
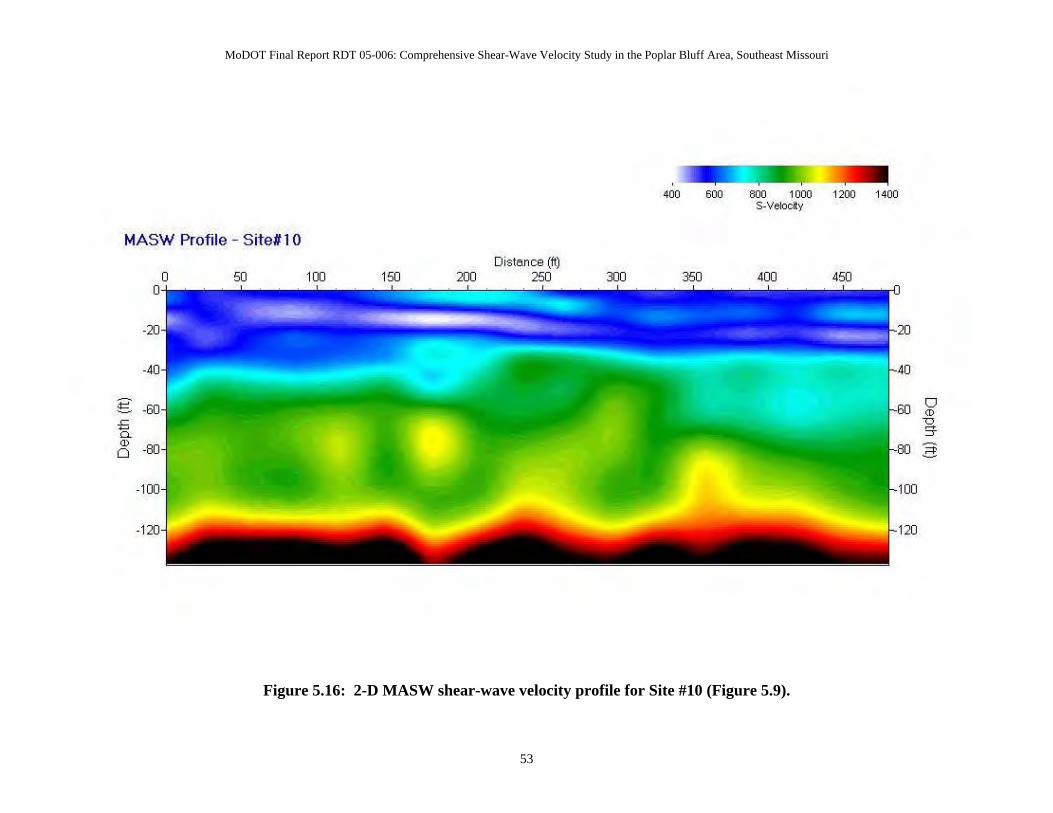
MoDOT Final Report RDT 05-006: Comprehensive Shear-Wave Velocity Study in the Poplar Bluff Area, Southeast Missouri
Figure 5.16: 2-D MASW shear-wave velocity profile for Site #10 (Figure 5.9).
53
!'OJ 1000 1200 1400 S_Yebol y
MASW Profile - Site#l 0
g 0 ro
5 " rr ro 3 0
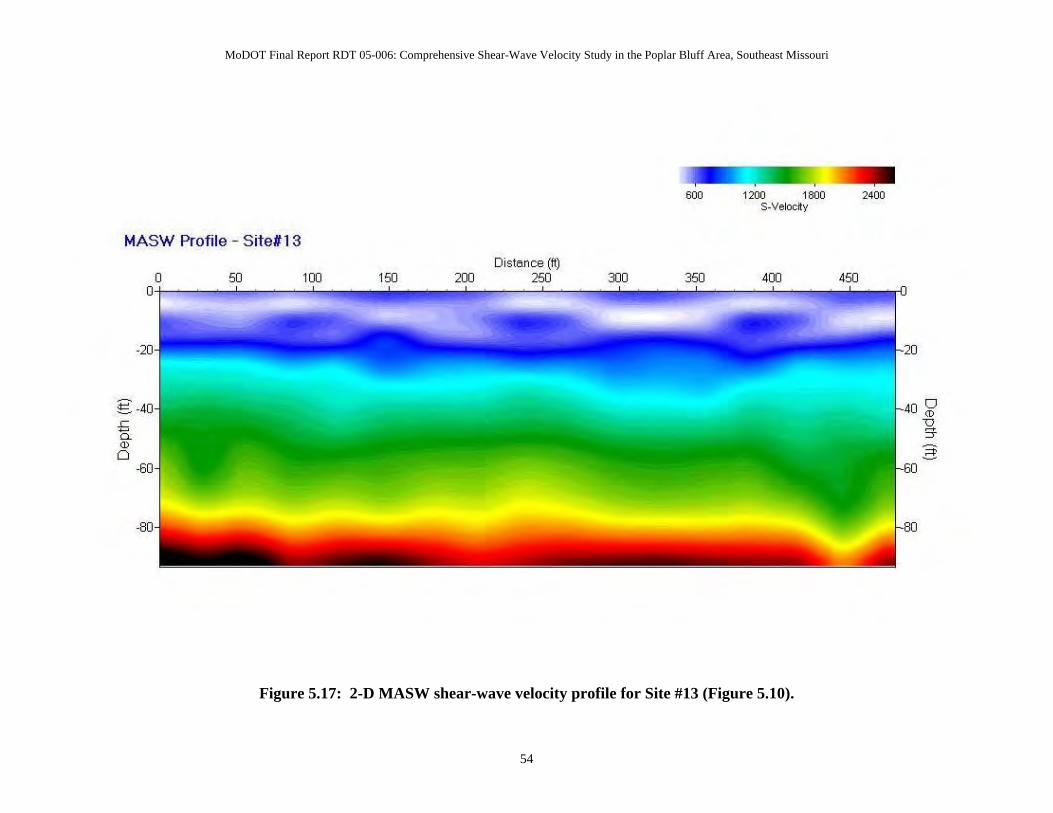
MoDOT Final Report RDT 05-006: Comprehensive Shear-Wave Velocity Study in the Poplar Bluff Area, Southeast Missouri
Figure 5.17: 2-D MASW shear-wave velocity profile for Site #13 (Figure 5.10).
54
MASW Prof ile - Sit e#13

MoDOT Final Report RDT 05-006: Comprehensive Shear-Wave Velocity Study in the Poplar Bluff Area, Southeast Missouri
Figure 5.18: 2-D MASW shear-wave velocity profile for Site #31 (Figure 5.11)
55
BOO 800 100.J S_Vebol y
MASW Profile - Site.31
g 0 ro
5 " rr ro 3 0
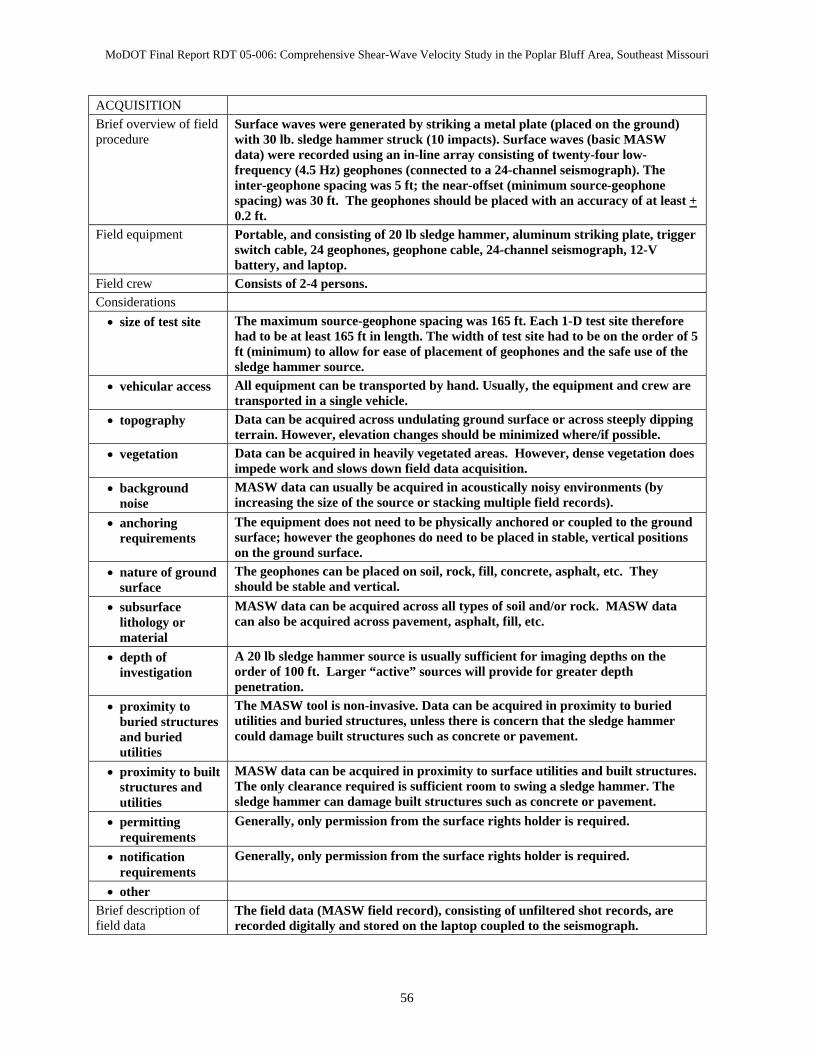
MoDOT Final Report RDT 05-006: Comprehensive Shear-Wave Velocity Study in the Poplar Bluff Area, Southeast Missouri
ACQUISITION Brief overview of field procedure
Surface waves were generated by striking a metal plate (placed on the ground) with 30 lb. sledge hammer struck (10 impacts). Surface waves (basic MASW data) were recorded using an in-line array consisting of twenty-four low-frequency (4.5 Hz) geophones (connected to a 24-channel seismograph). The inter-geophone spacing was 5 ft; the near-offset (minimum source-geophone spacing) was 30 ft. The geophones should be placed with an accuracy of at least + 0.2 ft.
Field equipment Portable, and consisting of 20 lb sledge hammer, aluminum striking plate, trigger switch cable, 24 geophones, geophone cable, 24-channel seismograph, 12-V battery, and laptop.
Field crew Consists of 2-4 persons. Considerations
• size of test site The maximum source-geophone spacing was 165 ft. Each 1-D test site therefore had to be at least 165 ft in length. The width of test site had to be on the order of 5 ft (minimum) to allow for ease of placement of geophones and the safe use of the sledge hammer source.
• vehicular access All equipment can be transported by hand. Usually, the equipment and crew are transported in a single vehicle.
• topography Data can be acquired across undulating ground surface or across steeply dipping terrain. However, elevation changes should be minimized where/if possible.
• vegetation Data can be acquired in heavily vegetated areas. However, dense vegetation does impede work and slows down field data acquisition.
• background noise
MASW data can usually be acquired in acoustically noisy environments (by increasing the size of the source or stacking multiple field records).
• anchoring requirements
The equipment does not need to be physically anchored or coupled to the ground surface; however the geophones do need to be placed in stable, vertical positions on the ground surface.
• nature of ground surface
The geophones can be placed on soil, rock, fill, concrete, asphalt, etc. They should be stable and vertical.
• subsurface lithology or material
MASW data can be acquired across all types of soil and/or rock. MASW data can also be acquired across pavement, asphalt, fill, etc.
• depth of investigation
A 20 lb sledge hammer source is usually sufficient for imaging depths on the order of 100 ft. Larger “active” sources will provide for greater depth penetration.
• proximity to buried structures and buried utilities
The MASW tool is non-invasive. Data can be acquired in proximity to buried utilities and buried structures, unless there is concern that the sledge hammer could damage built structures such as concrete or pavement.
• proximity to built structures and utilities
MASW data can be acquired in proximity to surface utilities and built structures. The only clearance required is sufficient room to swing a sledge hammer. The sledge hammer can damage built structures such as concrete or pavement.
• permitting requirements
Generally, only permission from the surface rights holder is required.
• notification requirements
Generally, only permission from the surface rights holder is required.
• other Brief description of field data
The field data (MASW field record), consisting of unfiltered shot records, are recorded digitally and stored on the laptop coupled to the seismograph.
56
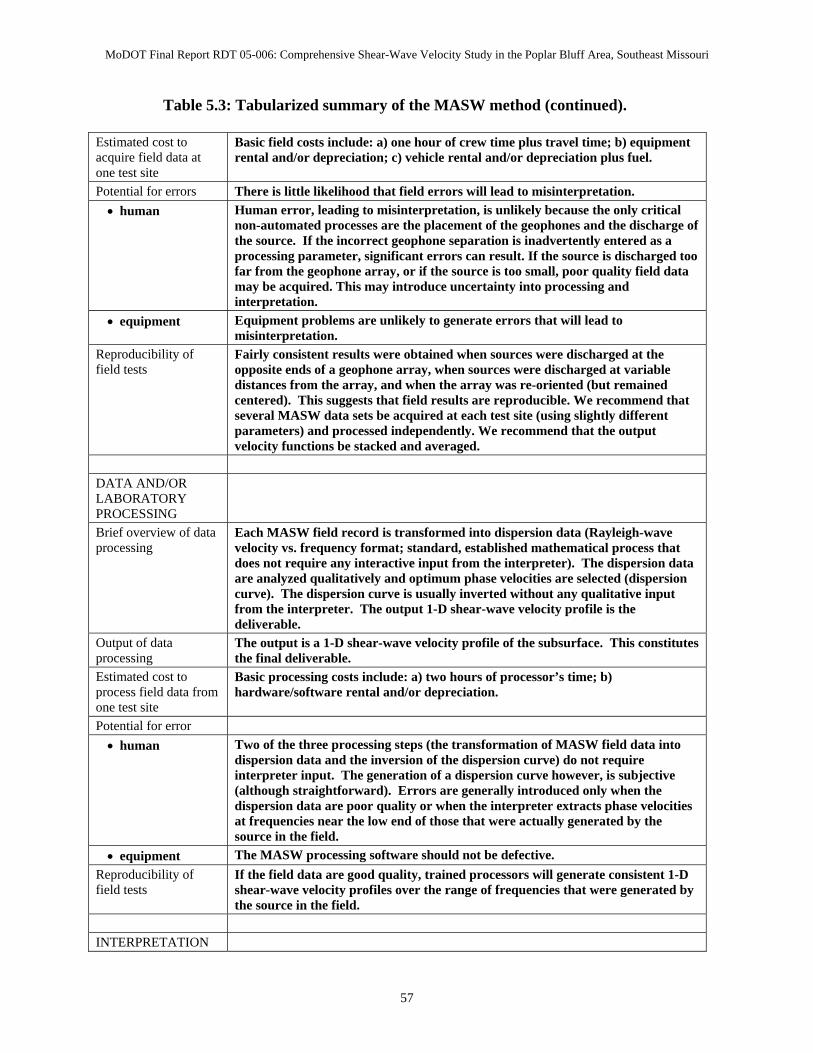
MoDOT Final Report RDT 05-006: Comprehensive Shear-Wave Velocity Study in the Poplar Bluff Area, Southeast Missouri
Table 5.3: Tabularized summary of the MASW method (continued).
Estimated cost to acquire field data at one test site
Basic field costs include: a) one hour of crew time plus travel time; b) equipment rental and/or depreciation; c) vehicle rental and/or depreciation plus fuel.
Potential for errors There is little likelihood that field errors will lead to misinterpretation. • human Human error, leading to misinterpretation, is unlikely because the only critical
non-automated processes are the placement of the geophones and the discharge of the source. If the incorrect geophone separation is inadvertently entered as a processing parameter, significant errors can result. If the source is discharged too far from the geophone array, or if the source is too small, poor quality field data may be acquired. This may introduce uncertainty into processing and interpretation.
• equipment Equipment problems are unlikely to generate errors that will lead to misinterpretation.
Reproducibility of field tests
Fairly consistent results were obtained when sources were discharged at the opposite ends of a geophone array, when sources were discharged at variable distances from the array, and when the array was re-oriented (but remained centered). This suggests that field results are reproducible. We recommend that several MASW data sets be acquired at each test site (using slightly different parameters) and processed independently. We recommend that the output velocity functions be stacked and averaged.
DATA AND/OR LABORATORY PROCESSING
Brief overview of data processing
Each MASW field record is transformed into dispersion data (Rayleigh-wave velocity vs. frequency format; standard, established mathematical process that does not require any interactive input from the interpreter). The dispersion data are analyzed qualitatively and optimum phase velocities are selected (dispersion curve). The dispersion curve is usually inverted without any qualitative input from the interpreter. The output 1-D shear-wave velocity profile is the deliverable.
Output of data processing
The output is a 1-D shear-wave velocity profile of the subsurface. This constitutes the final deliverable.
Estimated cost to process field data from one test site
Basic processing costs include: a) two hours of processor’s time; b) hardware/software rental and/or depreciation.
Potential for error • human Two of the three processing steps (the transformation of MASW field data into
dispersion data and the inversion of the dispersion curve) do not require interpreter input. The generation of a dispersion curve however, is subjective (although straightforward). Errors are generally introduced only when the dispersion data are poor quality or when the interpreter extracts phase velocities at frequencies near the low end of those that were actually generated by the source in the field.
• equipment The MASW processing software should not be defective. Reproducibility of field tests
If the field data are good quality, trained processors will generate consistent 1-D shear-wave velocity profiles over the range of frequencies that were generated by the source in the field.
INTERPRETATION
57

MoDOT Final Report RDT 05-006: Comprehensive Shear-Wave Velocity Study in the Poplar Bluff Area, Southeast Missouri
Brief overview of interpretation of processed data
The output of processing is a 1-D shear-wave velocity profile of the subsurface. This is the final deliverable.
Table 5.3: Tabularized summary of the MASW method (continued).
Deliverable(s) 1-D shear-wave velocity profile. Depth range (top/bottom)
Surface to depths on the order of 100-120 ft. Greater depths of investigation can be achieved if a larger source is employed.
Sampling interval The shear-wave velocity profile consists of 10 layers with progressively greater thickness (top to bottom). Each layer is assigned a shear-wave velocity.
Lateral resolution The MASW array is typically 115 ft in length. It is generally assumed that the output shear-wave velocity values have been averaged over that interval. However, there is some weighting involved as the source/receiver separation is generally selected such that high frequencies are excessively attenuated at the farthest geophones and low frequencies are not be recorded on the closest geophones.
Vertical resolution The shear-wave velocity assigned to each interval is generally considered to be an average shear-wave velocity for that interval.
Time required to interpret field data (one test site)
The shear-wave velocity profile is output both visually and digitally. It takes minimal time to download the digital image and/or digital file.
Potential for error
• human There is little potential for error.
• equipment There is little potential for error.
Reproducibility of deliverable
N/A
DELIVERABLES Brief overview of deliverable(s)
1-D shear-wave velocity profile in digital image and/or digital file format.
Utility of deliverable(s)
1-D velocity data can be interpreted (lithology, porosity, rippability, depth to bedrock, etc) or used for geotechnical site characterization purposes.
Accuracy The 1-D velocity profiles generated during this and other MoDOT-funded studies correlate well with available borehole (depth to bedrock), SCPT and CH shear-wave control. In general, the MASW shear-wave velocity profiles represent “smoothed” versions of the SCPT shear-wave velocity profiles acquired at the same location.
ADVANTAGES Advantages include relatively low cost, portability of equipment, rapid processing
of field data, few restrictions with respect to surface conditions (soil, rock, pavement, etc), non-invasive, limited potential for human error, reproducibility of field data and processing results, and depth penetration (in all types of soil and/or rock) on the order of 100+ ft using only a sledge hammer source. The method has multiple applications (determination of lithology, porosity, rippability, depth to bedrock, location of voids, shear strength). Additionally, permitting is not required, and the tool can be used across and in proximity to utilities and built structures as the method is fairly insensitive to background acoustic noise.
58

MoDOT Final Report RDT 05-006: Comprehensive Shear-Wave Velocity Study in the Poplar Bluff Area, Southeast Missouri
DISADVANTAGES Velocities are smoothed: both laterally and vertically. Shear-wave velocities are
not measured directly. Ground truth is not acquired by tool. However ground truth is required to accurately constrain geologic correlations and estimations of depth to bedrock. Accuracy decreases with depth. Reliability of tool decreases as lateral and vertical heterogeneity of soil/rock increases.
Table 5.3: Tabularized summary of the MASW method.
59
MoDOT Final Report RDT 05-006: Comprehensive Shear-Wave Velocity Study in the Poplar Bluff Area, Southeast Missouri
6. LABORATORY DYNAMIC SOIL TESTING 6.1 Overview All tests or test procedures that characterize soil behavior need to apply the initial stress conditions and anticipated cyclic loading as closely as possible. Field or in-situ tests have the advantage that the state of stress is inherently included in the procedure. However, laboratory tests need to confine and consolidate the soil sample back to the state of stress to replicate field conditions. The geophysical field tests have the advantage of testing undisturbed soil in the actual field condition with the actual effective stress and drainage conditions. Additionally, what is being tested is a volume or average condition of the material between the source and receiver. Dynamic soil properties also require an active source of energy to excite the soil mass and/or induce a measurable wave. Geophysical tests propagate seismic waves through soil at a very low strain level (less than 10-3 percent), making practically impossible the measurement of strain. This low level of strain allows the use of elastic theory to associate measurements with mechanical properties and for the most part the response is linear. At intermediate levels of strain (~10-2 percent) this response starts becoming non-linear. At large strains (~10-1 to 5 percent) the dynamic behavior of soils remains non-linear and will begin experiencing permanent deformation (plastic) and eventually reach an unstable condition. For intermediate and large strains, geophysical properties are not applicable anymore and specialized laboratory soil tests such as cyclic triaxial shear tests are used (Figure 6.1). In summary, dynamic soil properties are strain-dependant and one of the challenges is having compatibility in the results of the different methods when the strain level overlaps. The hysteresis loop produced from the cyclic loading of a typical soil can be described by the path of the loop itself or by two parameters that describe its general shape. These parameters are the inclination and the breath of the hysteresis loop; shear modulus and damping, respectively. Figure 6.1 is a simplified schematic showing one loop of symmetric cyclic loading and its corresponding parameters. As the strain amplitude is varied, different size loops will be developed and the locus of the points corresponding to the tips of these loops is called the backbone curve (or skeleton). As the strain increases the secant shear modulus will decrease. Therefore, the maximum shear modulus is developed at low shear strain where geophysical tests are used. Another way to represent this shear modulus degradation with cyclic strain is by means of the modulus reduction curve. The modulus reduction curve normalizes the shear modulus (G) with respect of the maximum shear modulus (Gmax) and is commonly referred to as the modulus ratio. Figure 6.2 shows a schematic of the typical cyclic behavior of soils. As the soil element loses stiffness with strain amplitude, its ability to dampen dynamic forces increases. This is due to the energy dissipated in the soil by friction, heat or plastic yielding. The relationship of shear strain to damping is inversely proportional to the modulus reduction curve. Damping is often expressed as the damping ratio (D), which is defined as the damping coefficient divided by the critical damping coefficient. D can be obtained from the hysteresis loop by dividing the area of the loop by the triangle defined by the secant modulus and the maximum strain (energy dissipated in one cycle by the peak energy during a cycle) multiplying with a factor of 1/4π. Values less than one are under-damped,
60
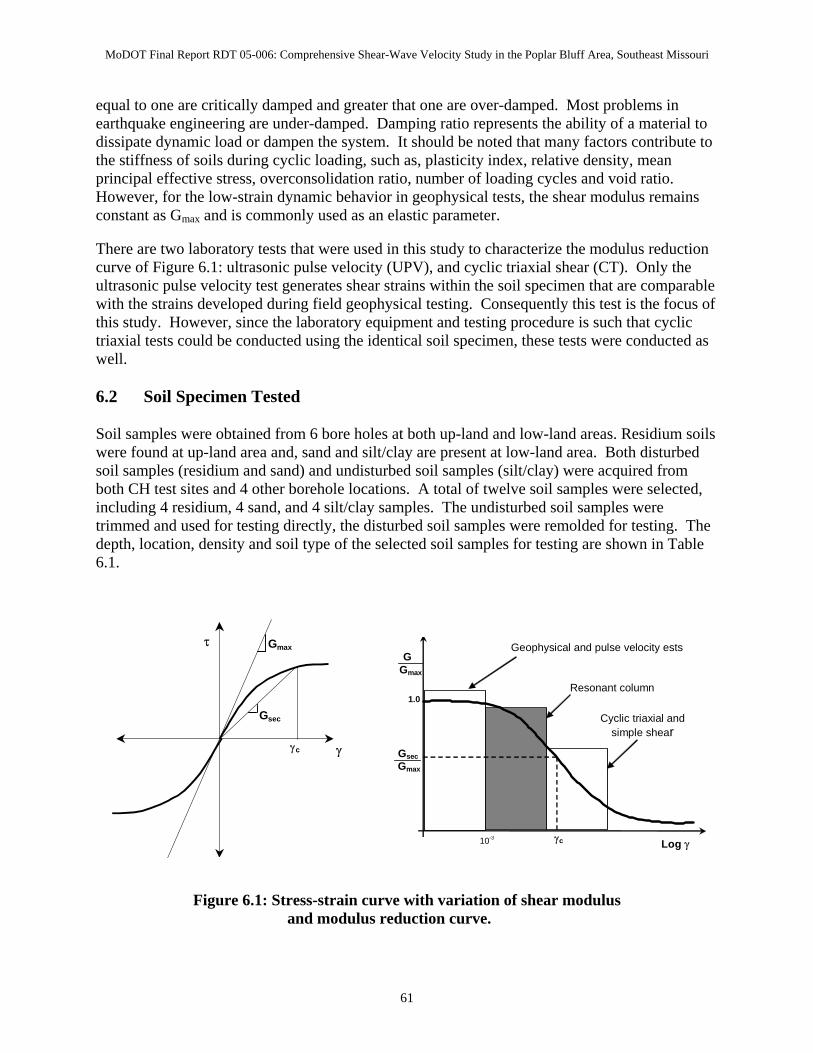
MoDOT Final Report RDT 05-006: Comprehensive Shear-Wave Velocity Study in the Poplar Bluff Area, Southeast Missouri
equal to one are critically damped and greater that one are over-damped. Most problems in earthquake engineering are under-damped. Damping ratio represents the ability of a material to dissipate dynamic load or dampen the system. It should be noted that many factors contribute to the stiffness of soils during cyclic loading, such as, plasticity index, relative density, mean principal effective stress, overconsolidation ratio, number of loading cycles and void ratio. However, for the low-strain dynamic behavior in geophysical tests, the shear modulus remains constant as Gmax and is commonly used as an elastic parameter. There are two laboratory tests that were used in this study to characterize the modulus reduction curve of Figure 6.1: ultrasonic pulse velocity (UPV), and cyclic triaxial shear (CT). Only the ultrasonic pulse velocity test generates shear strains within the soil specimen that are comparable with the strains developed during field geophysical testing. Consequently this test is the focus of this study. However, since the laboratory equipment and testing procedure is such that cyclic triaxial tests could be conducted using the identical soil specimen, these tests were conducted as well. 6.2 Soil Specimen Tested Soil samples were obtained from 6 bore holes at both up-land and low-land areas. Residium soils were found at up-land area and, sand and silt/clay are present at low-land area. Both disturbed soil samples (residium and sand) and undisturbed soil samples (silt/clay) were acquired from both CH test sites and 4 other borehole locations. A total of twelve soil samples were selected, including 4 residium, 4 sand, and 4 silt/clay samples. The undisturbed soil samples were trimmed and used for testing directly, the disturbed soil samples were remolded for testing. The depth, location, density and soil type of the selected soil samples for testing are shown in Table 6.1.
τ
γ
Gmax
Gsec
γc
Cyclic triaxial and simple shear
Resonant column
Geophysical and pulse velocity ests G
Gmax
Gsec Gmax
γc
1.0
Log γ 10-3
Figure 6.1: Stress-strain curve with variation of shear modulus and modulus reduction curve.
61
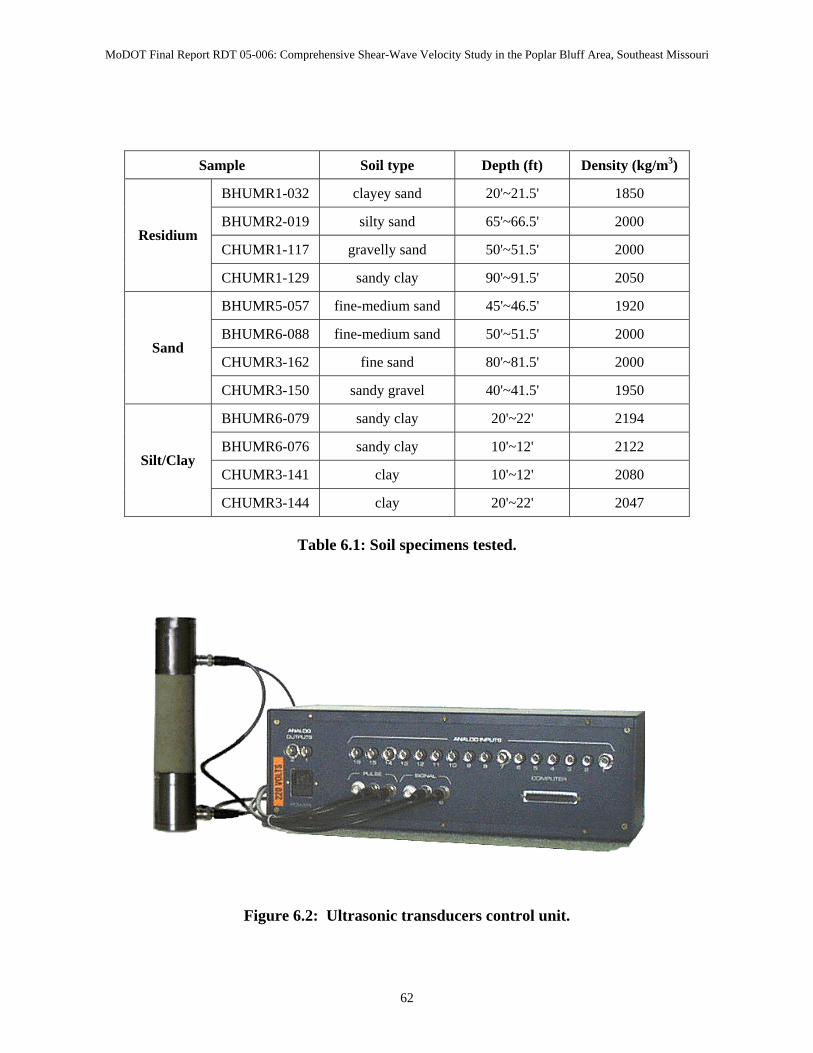
MoDOT Final Report RDT 05-006: Comprehensive Shear-Wave Velocity Study in the Poplar Bluff Area, Southeast Missouri
Sample Soil type Depth (ft) Density (kg/m3)
BHUMR1-032 clayey sand 20'~21.5' 1850
BHUMR2-019 silty sand 65'~66.5' 2000
CHUMR1-117 gravelly sand 50'~51.5' 2000 Residium
CHUMR1-129 sandy clay 90'~91.5' 2050
BHUMR5-057 fine-medium sand 45'~46.5' 1920
BHUMR6-088 fine-medium sand 50'~51.5' 2000
CHUMR3-162 fine sand 80'~81.5' 2000 Sand
CHUMR3-150 sandy gravel 40'~41.5' 1950
BHUMR6-079 sandy clay 20'~22' 2194
BHUMR6-076 sandy clay 10'~12' 2122
CHUMR3-141 clay 10'~12' 2080 Silt/Clay
CHUMR3-144 clay 20'~22' 2047
Table 6.1: Soil specimens tested.
Figure 6.2: Ultrasonic transducers control unit.
62
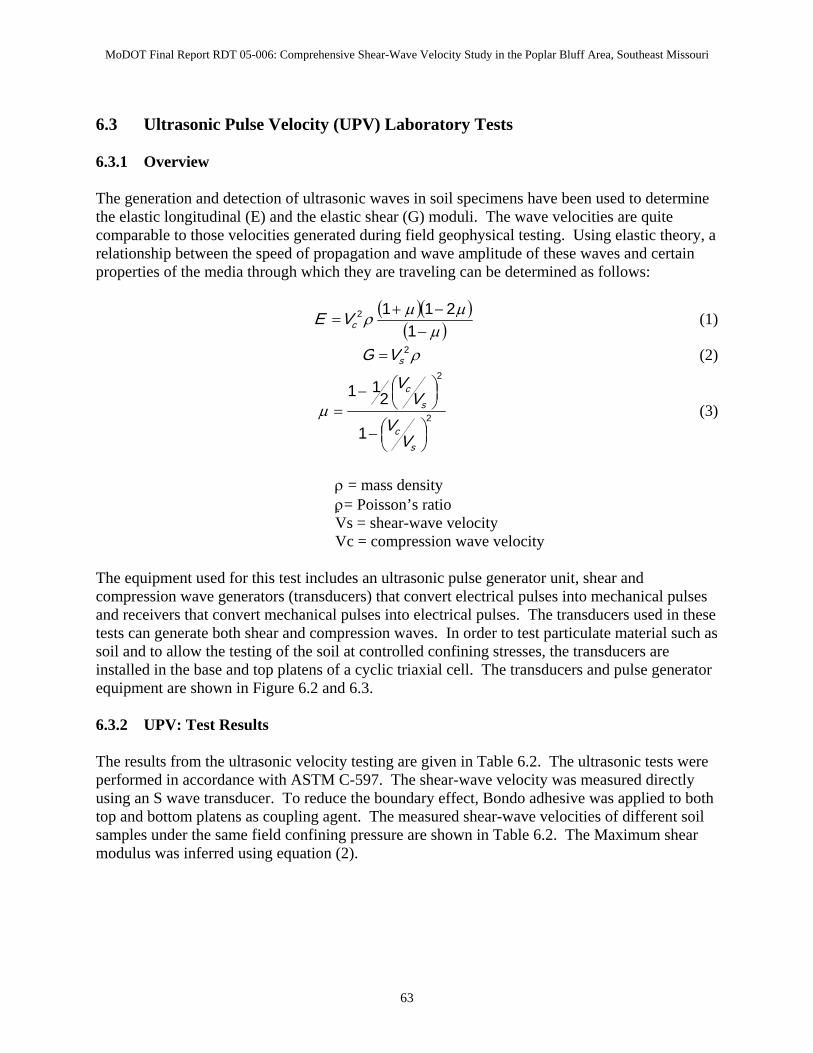
MoDOT Final Report RDT 05-006: Comprehensive Shear-Wave Velocity Study in the Poplar Bluff Area, Southeast Missouri
6.3 Ultrasonic Pulse Velocity (UPV) Laboratory Tests 6.3.1 Overview The generation and detection of ultrasonic waves in soil specimens have been used to determine the elastic longitudinal (E) and the elastic shear (G) moduli. The wave velocities are quite comparable to those velocities generated during field geophysical testing. Using elastic theory, a relationship between the speed of propagation and wave amplitude of these waves and certain properties of the media through which they are traveling can be determined as follows:
( )( )( )µ
µµρ−
−+=
12112
cVE (1)
ρ2sVG = (2)
2
2
1
211
⎟⎠⎞⎜
⎝⎛−
⎟⎠⎞⎜
⎝⎛−
=
sc
sc
VV
VV
µ (3)
ρ = mass density ρ = Poisson’s ratio Vs = shear-wave velocity Vc = compression wave velocity
The equipment used for this test includes an ultrasonic pulse generator unit, shear and compression wave generators (transducers) that convert electrical pulses into mechanical pulses and receivers that convert mechanical pulses into electrical pulses. The transducers used in these tests can generate both shear and compression waves. In order to test particulate material such as soil and to allow the testing of the soil at controlled confining stresses, the transducers are installed in the base and top platens of a cyclic triaxial cell. The transducers and pulse generator equipment are shown in Figure 6.2 and 6.3. 6.3.2 UPV: Test Results The results from the ultrasonic velocity testing are given in Table 6.2. The ultrasonic tests were performed in accordance with ASTM C-597. The shear-wave velocity was measured directly using an S wave transducer. To reduce the boundary effect, Bondo adhesive was applied to both top and bottom platens as coupling agent. The measured shear-wave velocities of different soil samples under the same field confining pressure are shown in Table 6.2. The Maximum shear modulus was inferred using equation (2).
63
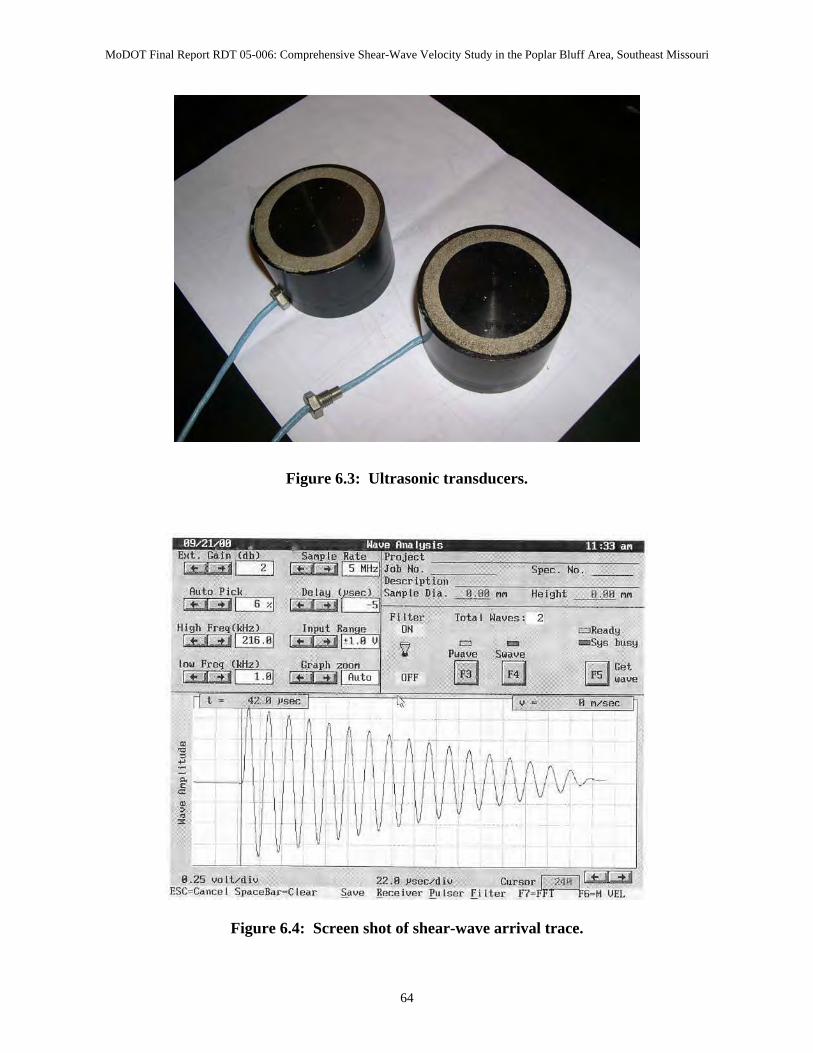
MoDOT Final Report RDT 05-006: Comprehensive Shear-Wave Velocity Study in the Poplar Bluff Area, Southeast Missouri
Figure 6.3: Ultrasonic transducers.
Figure 6.4: Screen shot of shear-wave arrival trace.
64
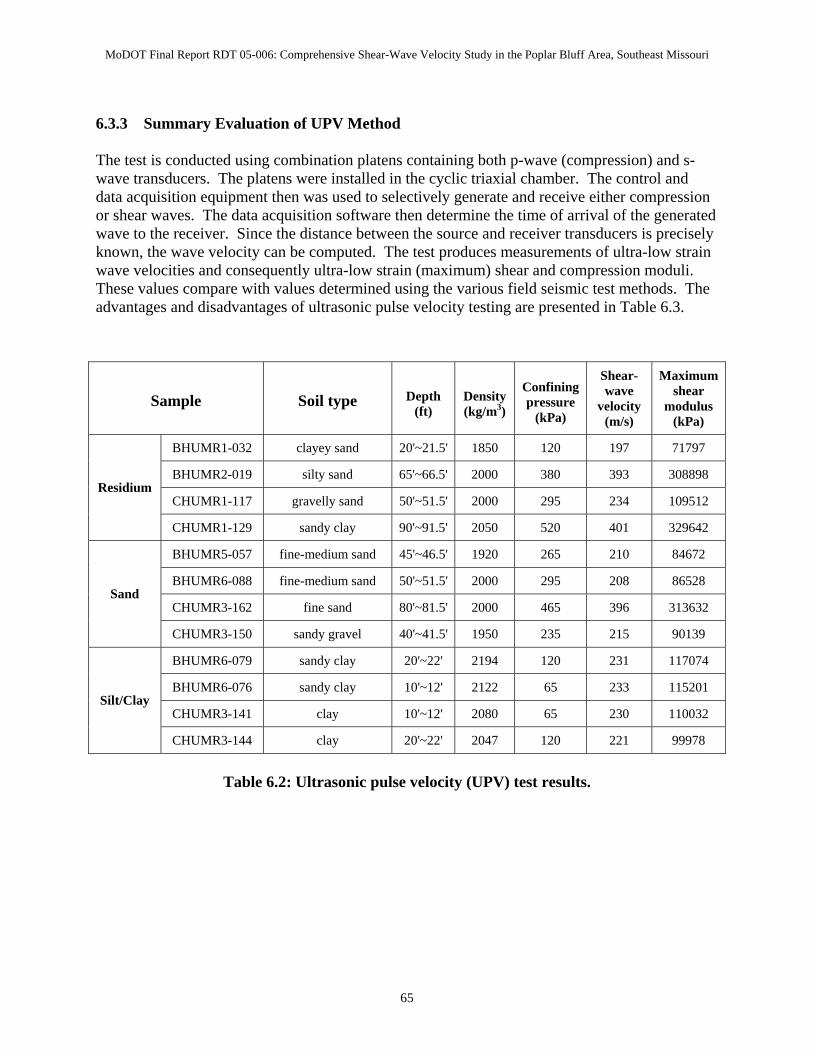
MoDOT Final Report RDT 05-006: Comprehensive Shear-Wave Velocity Study in the Poplar Bluff Area, Southeast Missouri
6.3.3 Summary Evaluation of UPV Method The test is conducted using combination platens containing both p-wave (compression) and s-wave transducers. The platens were installed in the cyclic triaxial chamber. The control and data acquisition equipment then was used to selectively generate and receive either compression or shear waves. The data acquisition software then determine the time of arrival of the generated wave to the receiver. Since the distance between the source and receiver transducers is precisely known, the wave velocity can be computed. The test produces measurements of ultra-low strain wave velocities and consequently ultra-low strain (maximum) shear and compression moduli. These values compare with values determined using the various field seismic test methods. The advantages and disadvantages of ultrasonic pulse velocity testing are presented in Table 6.3.
Sample
Soil type
Depth
(ft)
Density (kg/m3)
Confining pressure
(kPa)
Shear-wave
velocity (m/s)
Maximum shear
modulus (kPa)
BHUMR1-032 clayey sand 20'~21.5' 1850 120 197 71797
BHUMR2-019 silty sand 65'~66.5' 2000 380 393 308898
CHUMR1-117 gravelly sand 50'~51.5' 2000 295 234 109512 Residium
CHUMR1-129 sandy clay 90'~91.5' 2050 520 401 329642
BHUMR5-057 fine-medium sand 45'~46.5' 1920 265 210 84672
BHUMR6-088 fine-medium sand 50'~51.5' 2000 295 208 86528
CHUMR3-162 fine sand 80'~81.5' 2000 465 396 313632 Sand
CHUMR3-150 sandy gravel 40'~41.5' 1950 235 215 90139
BHUMR6-079 sandy clay 20'~22' 2194 120 231 117074
BHUMR6-076 sandy clay 10'~12' 2122 65 233 115201
CHUMR3-141 clay 10'~12' 2080 65 230 110032 Silt/Clay
CHUMR3-144 clay 20'~22' 2047 120 221 99978
Table 6.2: Ultrasonic pulse velocity (UPV) test results.
65

MoDOT Final Report RDT 05-006: Comprehensive Shear-Wave Velocity Study in the Poplar Bluff Area, Southeast Missouri
SAMPLE ACQUISITION
Brief overview of field procedure
Laboratory testing of field soils requires the acquisition of field specimens. Therefore field drilling and sampling is required.
Field equipment Drilling rig capable of recovering relatively undisturbed soil specimen at depth. Field crew Drill crew. Considerations
• size of test site There must be sufficient space to anchor a drill rig (or equivalent). • vehicular access Site must be accessible to a drill rig (or equivalent). • topography Site must be accessible to a drill rig (or equivalent). • vegetation Site must be accessible to a drill rig (or equivalent). • background
noise Not applicable
• anchoring requirements
The drill rig (or equivalent) s to be physically anchored or coupled to the ground, if depth penetration on the order of 10’s of feet is desired.
• nature of ground surface
Ground must be penetrable by drilling and soil sampling equipment.
• subsurface lithology or material
Ground must be penetrable by drilling and soil sampling equipment.
• depth of investigation
The depth of soil sampling is limited only by the capabilities of the drilling equipment.
• proximity to buried structures and buried utilities
Subsurface drilling is invasive. Drilling and sampling could damage buried utilities or subsurface structures.
• proximity to built structures and surface utilities
Sampling can be conducted wherever a rig can be anchored (assuming all other site characteristics are suitable).
• permitting requirements
Permits may be required.
• notification requirements
Permission from the surface rights holder and utility companies may be required.
• other Brief description of field sample
Typical subsurface boring records (logs) and associated soil classification and soil property data (unit weight, etc.) is required.
Time required to acquire field sample at one test site
One field boring and sampling hole (depth <100 ft) can generally be completed in 2 to 4 hours depending upon the nature of the subsurface soils and assuming crew and equipment are on-site.
Estimated cost to sample at one test site
Basic field costs include: a) 4 hours of rig time plus travel time; b) equipment rental and/or depreciation.
Potential for errors • human Errors are associated with improper sampling, sample extrusion, handling,
transportation, and storage procedures. • equipment Equipment problems are unlikely to generate errors that will lead to
misinterpretation. Reproducibility of field tests
NA
66
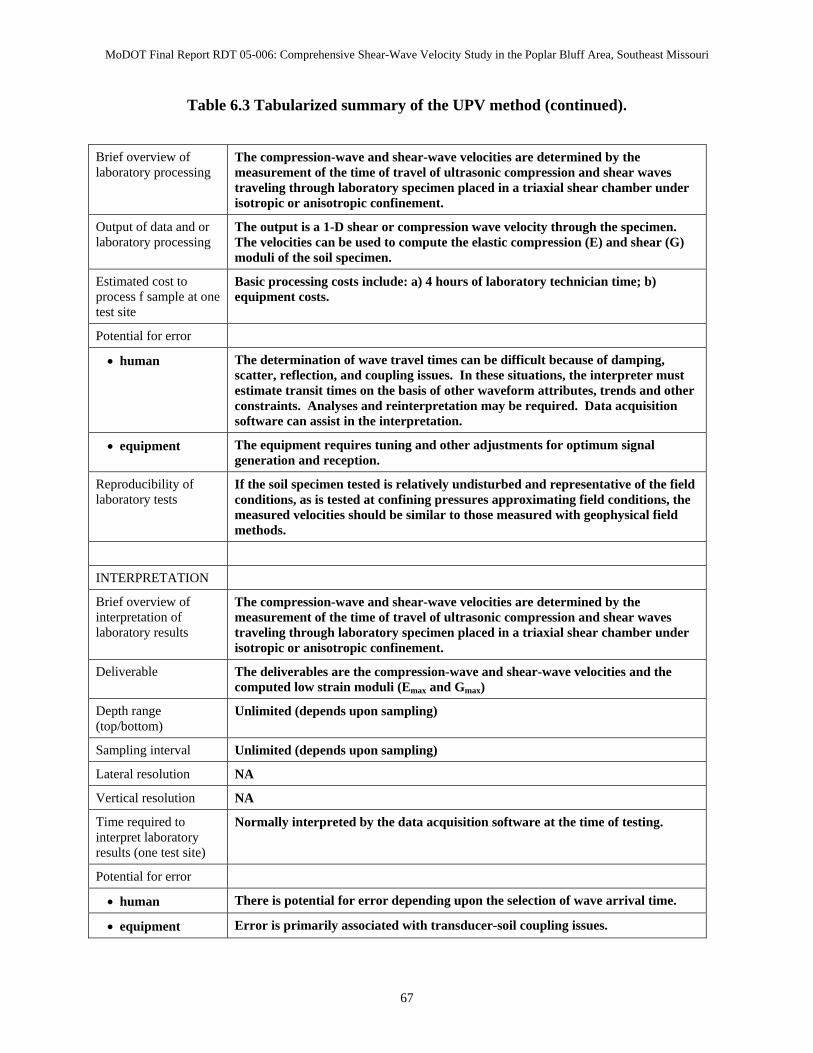
MoDOT Final Report RDT 05-006: Comprehensive Shear-Wave Velocity Study in the Poplar Bluff Area, Southeast Missouri
Table 6.3 Tabularized summary of the UPV method (continued).
Brief overview of laboratory processing
The compression-wave and shear-wave velocities are determined by the measurement of the time of travel of ultrasonic compression and shear waves traveling through laboratory specimen placed in a triaxial shear chamber under isotropic or anisotropic confinement.
Output of data and or laboratory processing
The output is a 1-D shear or compression wave velocity through the specimen. The velocities can be used to compute the elastic compression (E) and shear (G) moduli of the soil specimen.
Estimated cost to process f sample at one test site
Basic processing costs include: a) 4 hours of laboratory technician time; b) equipment costs.
Potential for error
• human The determination of wave travel times can be difficult because of damping, scatter, reflection, and coupling issues. In these situations, the interpreter must estimate transit times on the basis of other waveform attributes, trends and other constraints. Analyses and reinterpretation may be required. Data acquisition software can assist in the interpretation.
• equipment The equipment requires tuning and other adjustments for optimum signal generation and reception.
Reproducibility of laboratory tests
If the soil specimen tested is relatively undisturbed and representative of the field conditions, as is tested at confining pressures approximating field conditions, the measured velocities should be similar to those measured with geophysical field methods.
INTERPRETATION
Brief overview of interpretation of laboratory results
The compression-wave and shear-wave velocities are determined by the measurement of the time of travel of ultrasonic compression and shear waves traveling through laboratory specimen placed in a triaxial shear chamber under isotropic or anisotropic confinement.
Deliverable The deliverables are the compression-wave and shear-wave velocities and the computed low strain moduli (Emax and Gmax)
Depth range (top/bottom)
Unlimited (depends upon sampling)
Sampling interval Unlimited (depends upon sampling)
Lateral resolution NA
Vertical resolution NA
Time required to interpret laboratory results (one test site)
Normally interpreted by the data acquisition software at the time of testing.
Potential for error
• human There is potential for error depending upon the selection of wave arrival time.
• equipment Error is primarily associated with transducer-soil coupling issues.
67
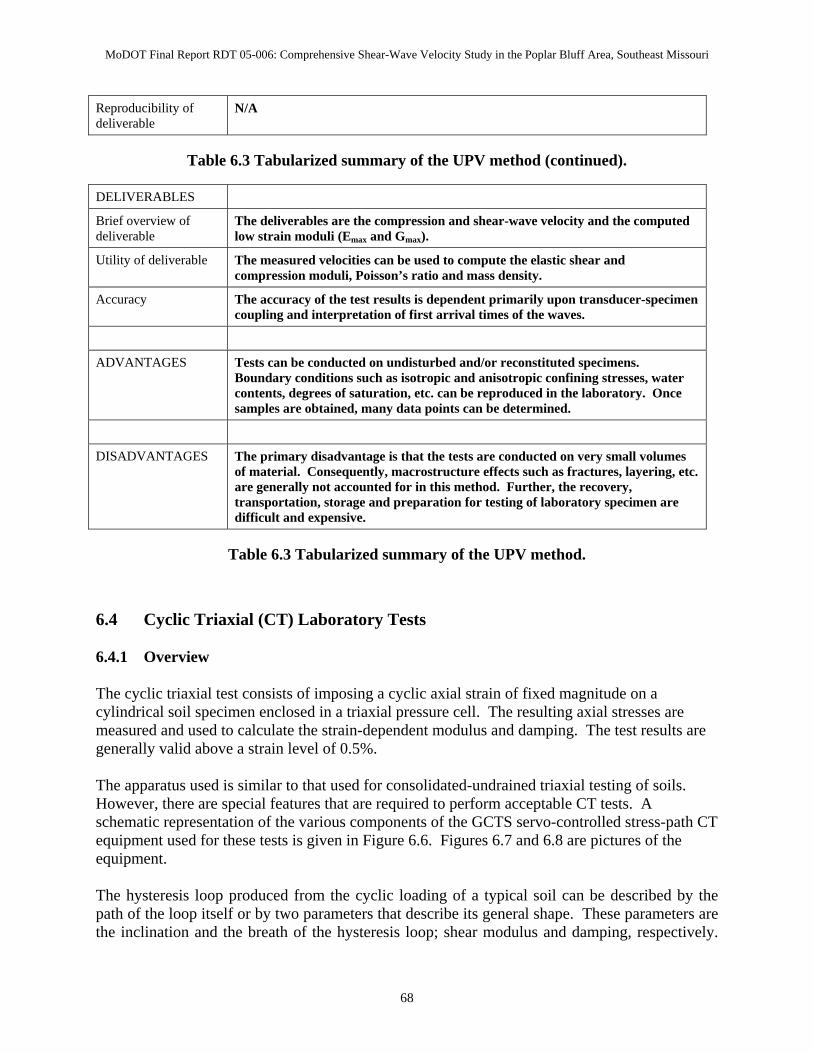
MoDOT Final Report RDT 05-006: Comprehensive Shear-Wave Velocity Study in the Poplar Bluff Area, Southeast Missouri
Reproducibility of deliverable
N/A
Table 6.3 Tabularized summary of the UPV method (continued).
DELIVERABLES
Brief overview of deliverable
The deliverables are the compression and shear-wave velocity and the computed low strain moduli (Emax and Gmax).
Utility of deliverable The measured velocities can be used to compute the elastic shear and compression moduli, Poisson’s ratio and mass density.
Accuracy The accuracy of the test results is dependent primarily upon transducer-specimen coupling and interpretation of first arrival times of the waves.
ADVANTAGES Tests can be conducted on undisturbed and/or reconstituted specimens. Boundary conditions such as isotropic and anisotropic confining stresses, water contents, degrees of saturation, etc. can be reproduced in the laboratory. Once samples are obtained, many data points can be determined.
DISADVANTAGES The primary disadvantage is that the tests are conducted on very small volumes of material. Consequently, macrostructure effects such as fractures, layering, etc. are generally not accounted for in this method. Further, the recovery, transportation, storage and preparation for testing of laboratory specimen are difficult and expensive.
Table 6.3 Tabularized summary of the UPV method.
6.4 Cyclic Triaxial (CT) Laboratory Tests 6.4.1 Overview The cyclic triaxial test consists of imposing a cyclic axial strain of fixed magnitude on a cylindrical soil specimen enclosed in a triaxial pressure cell. The resulting axial stresses are measured and used to calculate the strain-dependent modulus and damping. The test results are generally valid above a strain level of 0.5%. The apparatus used is similar to that used for consolidated-undrained triaxial testing of soils. However, there are special features that are required to perform acceptable CT tests. A schematic representation of the various components of the GCTS servo-controlled stress-path CT equipment used for these tests is given in Figure 6.6. Figures 6.7 and 6.8 are pictures of the equipment. The hysteresis loop produced from the cyclic loading of a typical soil can be described by the path of the loop itself or by two parameters that describe its general shape. These parameters are the inclination and the breath of the hysteresis loop; shear modulus and damping, respectively.
68
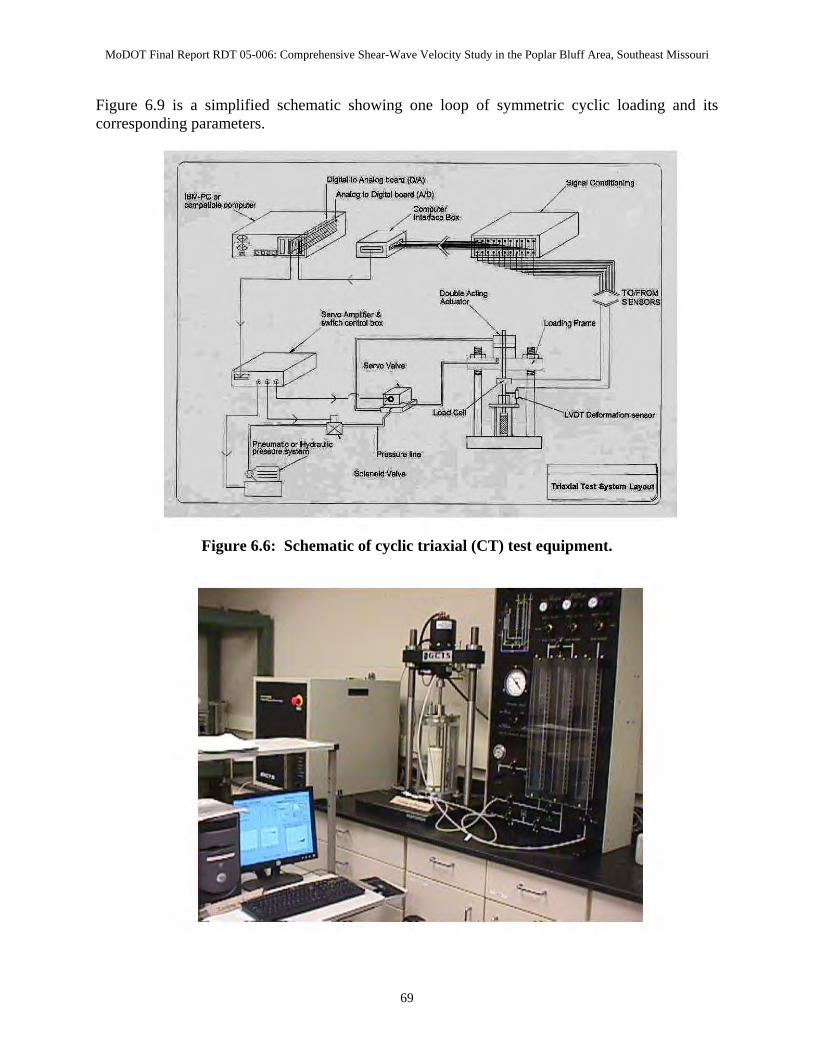
MoDOT Final Report RDT 05-006: Comprehensive Shear-Wave Velocity Study in the Poplar Bluff Area, Southeast Missouri
Figure 6.9 is a simplified schematic showing one loop of symmetric cyclic loading and its corresponding parameters.
Figure 6.6: Schematic of cyclic triaxial (CT) test equipment.
69
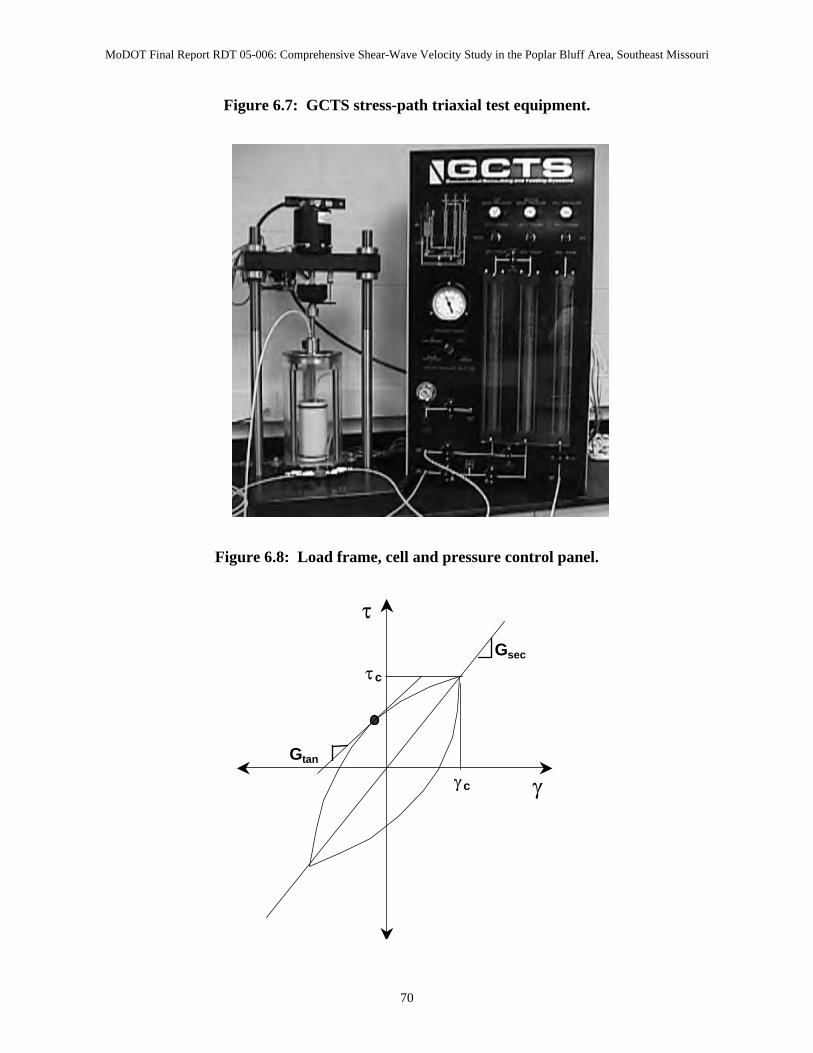
MoDOT Final Report RDT 05-006: Comprehensive Shear-Wave Velocity Study in the Poplar Bluff Area, Southeast Missouri
Figure 6.7: GCTS stress-path triaxial test equipment.
Figure 6.8: Load frame, cell and pressure control panel.
τ
γ
τc
γc
Gsec
Gtan
70
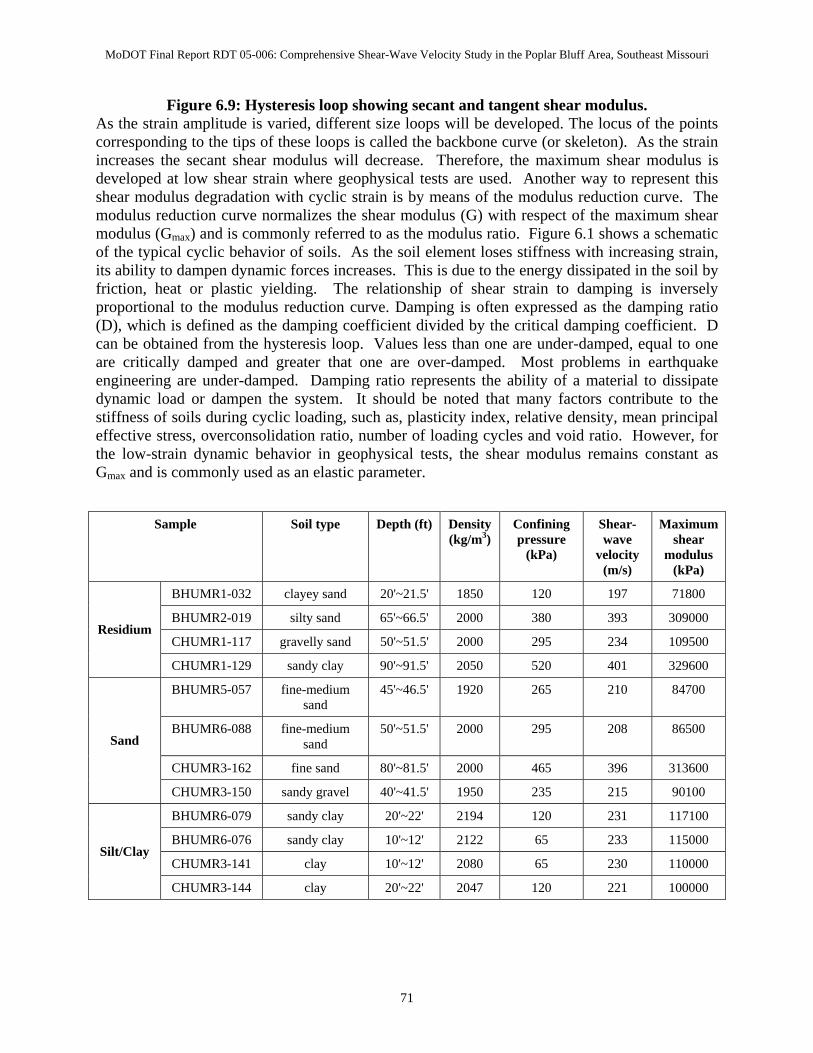
MoDOT Final Report RDT 05-006: Comprehensive Shear-Wave Velocity Study in the Poplar Bluff Area, Southeast Missouri
Figure 6.9: Hysteresis loop showing secant and tangent shear modulus. As the strain amplitude is varied, different size loops will be developed. The locus of the points corresponding to the tips of these loops is called the backbone curve (or skeleton). As the strain increases the secant shear modulus will decrease. Therefore, the maximum shear modulus is developed at low shear strain where geophysical tests are used. Another way to represent this shear modulus degradation with cyclic strain is by means of the modulus reduction curve. The modulus reduction curve normalizes the shear modulus (G) with respect of the maximum shear modulus (Gmax) and is commonly referred to as the modulus ratio. Figure 6.1 shows a schematic of the typical cyclic behavior of soils. As the soil element loses stiffness with increasing strain, its ability to dampen dynamic forces increases. This is due to the energy dissipated in the soil by friction, heat or plastic yielding. The relationship of shear strain to damping is inversely proportional to the modulus reduction curve. Damping is often expressed as the damping ratio (D), which is defined as the damping coefficient divided by the critical damping coefficient. D can be obtained from the hysteresis loop. Values less than one are under-damped, equal to one are critically damped and greater that one are over-damped. Most problems in earthquake engineering are under-damped. Damping ratio represents the ability of a material to dissipate dynamic load or dampen the system. It should be noted that many factors contribute to the stiffness of soils during cyclic loading, such as, plasticity index, relative density, mean principal effective stress, overconsolidation ratio, number of loading cycles and void ratio. However, for the low-strain dynamic behavior in geophysical tests, the shear modulus remains constant as Gmax and is commonly used as an elastic parameter.
Sample Soil type Depth (ft) Density (kg/m3)
Confining pressure
(kPa)
Shear-wave
velocity (m/s)
Maximum shear
modulus (kPa)
BHUMR1-032 clayey sand 20'~21.5' 1850 120 197 71800
BHUMR2-019 silty sand 65'~66.5' 2000 380 393 309000
CHUMR1-117 gravelly sand 50'~51.5' 2000 295 234 109500 Residium
CHUMR1-129 sandy clay 90'~91.5' 2050 520 401 329600
BHUMR5-057 fine-medium sand
45'~46.5' 1920 265 210 84700
BHUMR6-088 fine-medium sand
50'~51.5' 2000 295 208 86500
CHUMR3-162 fine sand 80'~81.5' 2000 465 396 313600
Sand
CHUMR3-150 sandy gravel 40'~41.5' 1950 235 215 90100
BHUMR6-079 sandy clay 20'~22' 2194 120 231 117100
BHUMR6-076 sandy clay 10'~12' 2122 65 233 115000
CHUMR3-141 clay 10'~12' 2080 65 230 110000 Silt/Clay
CHUMR3-144 clay 20'~22' 2047 120 221 100000
71
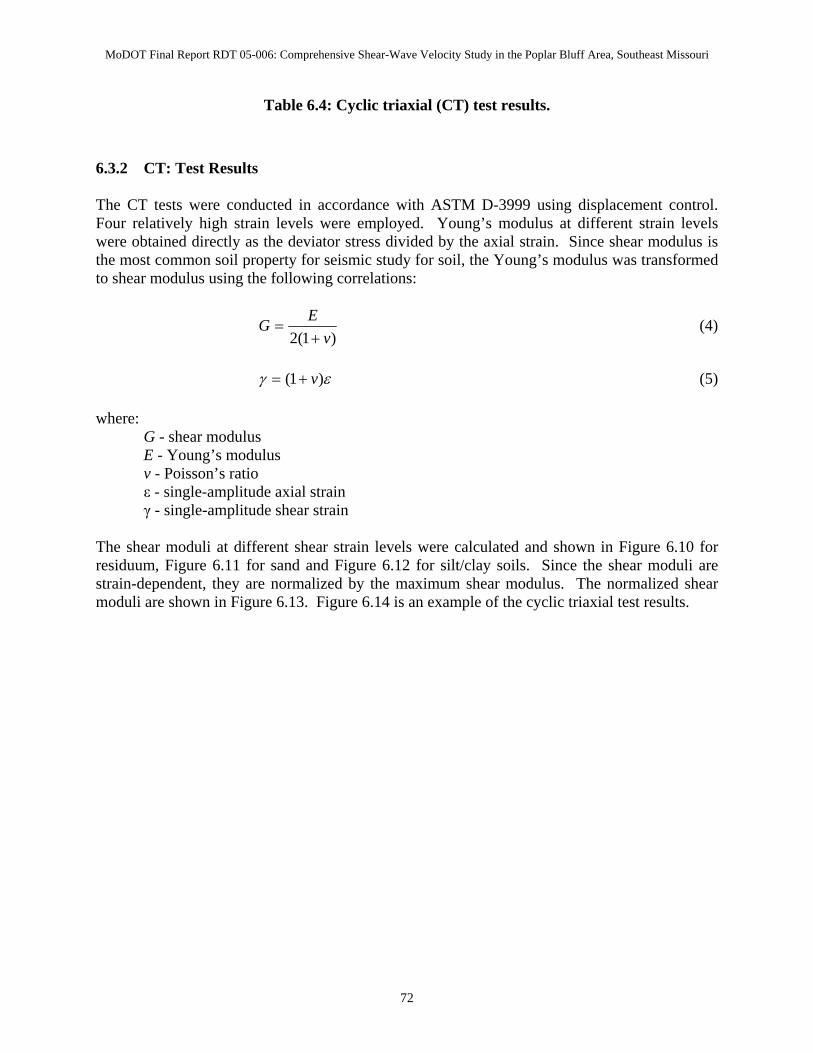
MoDOT Final Report RDT 05-006: Comprehensive Shear-Wave Velocity Study in the Poplar Bluff Area, Southeast Missouri
Table 6.4: Cyclic triaxial (CT) test results. 6.3.2 CT: Test Results The CT tests were conducted in accordance with ASTM D-3999 using displacement control. Four relatively high strain levels were employed. Young’s modulus at different strain levels were obtained directly as the deviator stress divided by the axial strain. Since shear modulus is the most common soil property for seismic study for soil, the Young’s modulus was transformed to shear modulus using the following correlations:
)1(2 vEG+
= (4)
εγ )1( v+= (5)
where:
G - shear modulus E - Young’s modulus v - Poisson’s ratio ε - single-amplitude axial strain γ - single-amplitude shear strain
The shear moduli at different shear strain levels were calculated and shown in Figure 6.10 for residuum, Figure 6.11 for sand and Figure 6.12 for silt/clay soils. Since the shear moduli are strain-dependent, they are normalized by the maximum shear modulus. The normalized shear moduli are shown in Figure 6.13. Figure 6.14 is an example of the cyclic triaxial test results.
72
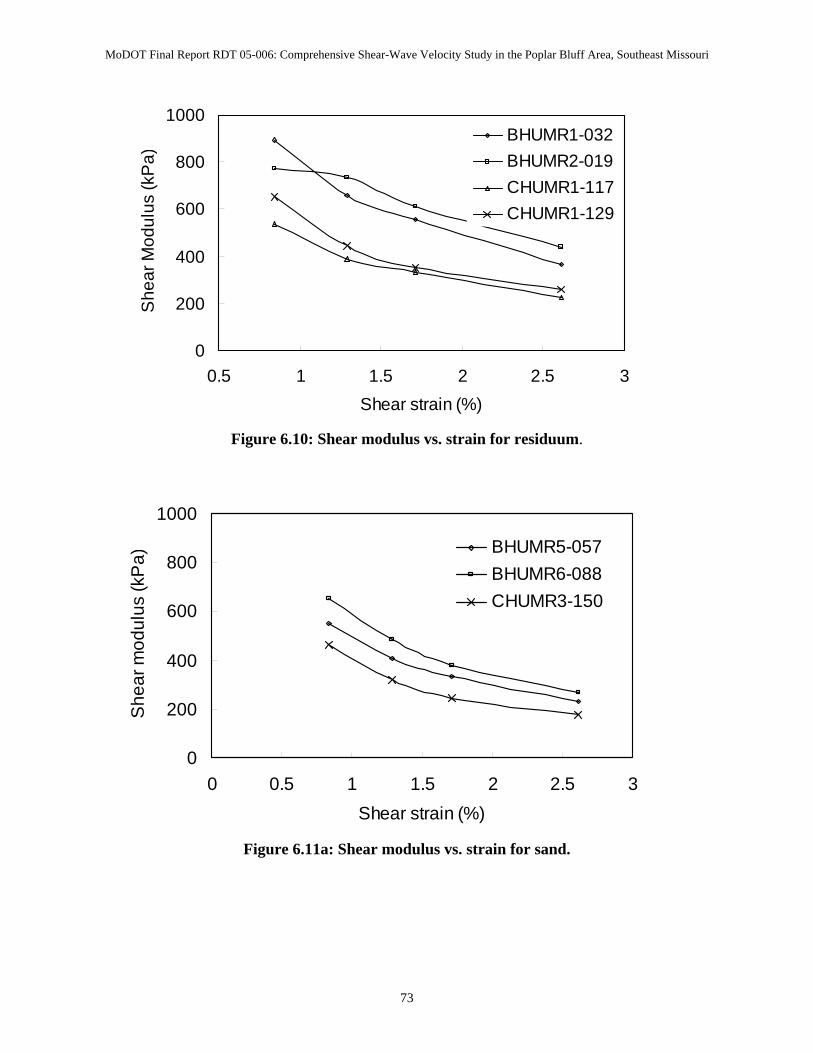
MoDOT Final Report RDT 05-006: Comprehensive Shear-Wave Velocity Study in the Poplar Bluff Area, Southeast Missouri
0
200
400
600
800
1000
0.5 1 1.5 2 2.5 3Shear strain (%)
She
ar M
odul
us (k
Pa)
BHUMR1-032BHUMR2-019CHUMR1-117CHUMR1-129
Figure 6.10: Shear modulus vs. strain for residuum.
0
200
400
600
800
1000
0 0.5 1 1.5 2 2.5 3Shear strain (%)
She
ar m
odul
us (k
Pa)
BHUMR5-057BHUMR6-088CHUMR3-150
Figure 6.11a: Shear modulus vs. strain for sand.
73
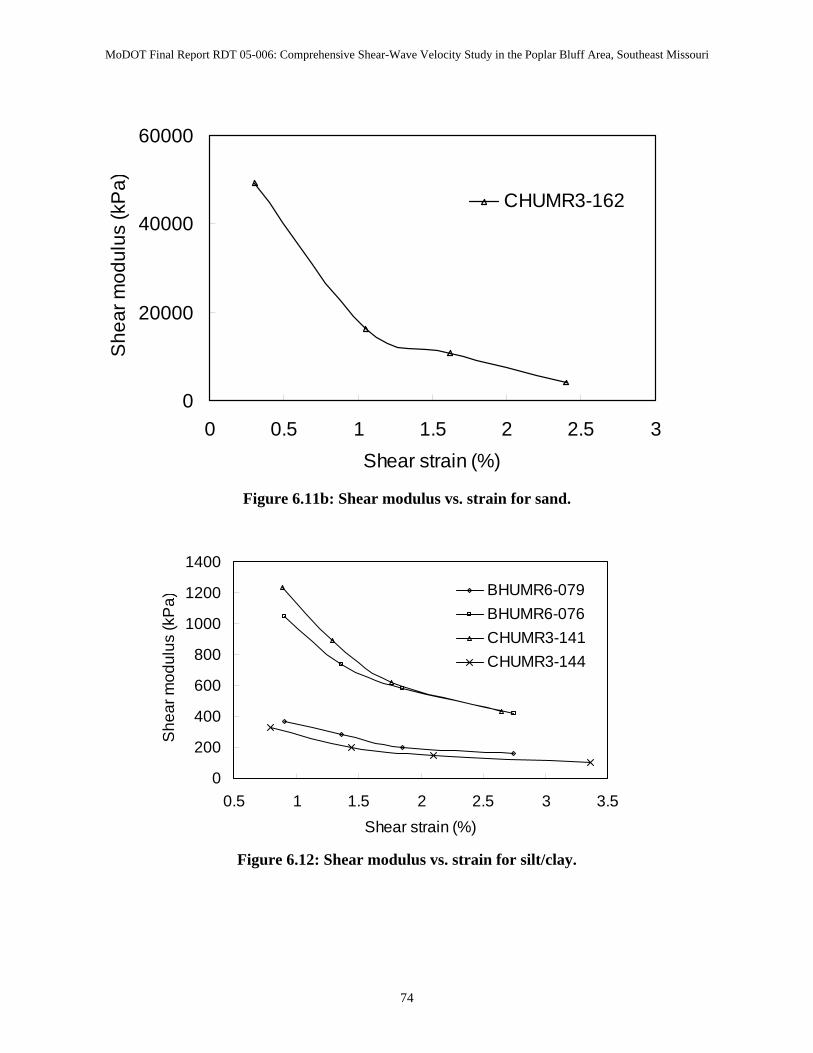
MoDOT Final Report RDT 05-006: Comprehensive Shear-Wave Velocity Study in the Poplar Bluff Area, Southeast Missouri
0
20000
40000
60000
0 0.5 1 1.5 2 2.5 3Shear strain (%)
She
ar m
odul
us (k
Pa)
CHUMR3-162
Figure 6.11b: Shear modulus vs. strain for sand.
0
200
400
600
800
1000
1200
1400
0.5 1 1.5 2 2.5 3 3.5Shear strain (%)
She
ar m
odul
us (k
Pa)
BHUMR6-079BHUMR6-076CHUMR3-141CHUMR3-144
Figure 6.12: Shear modulus vs. strain for silt/clay.
74
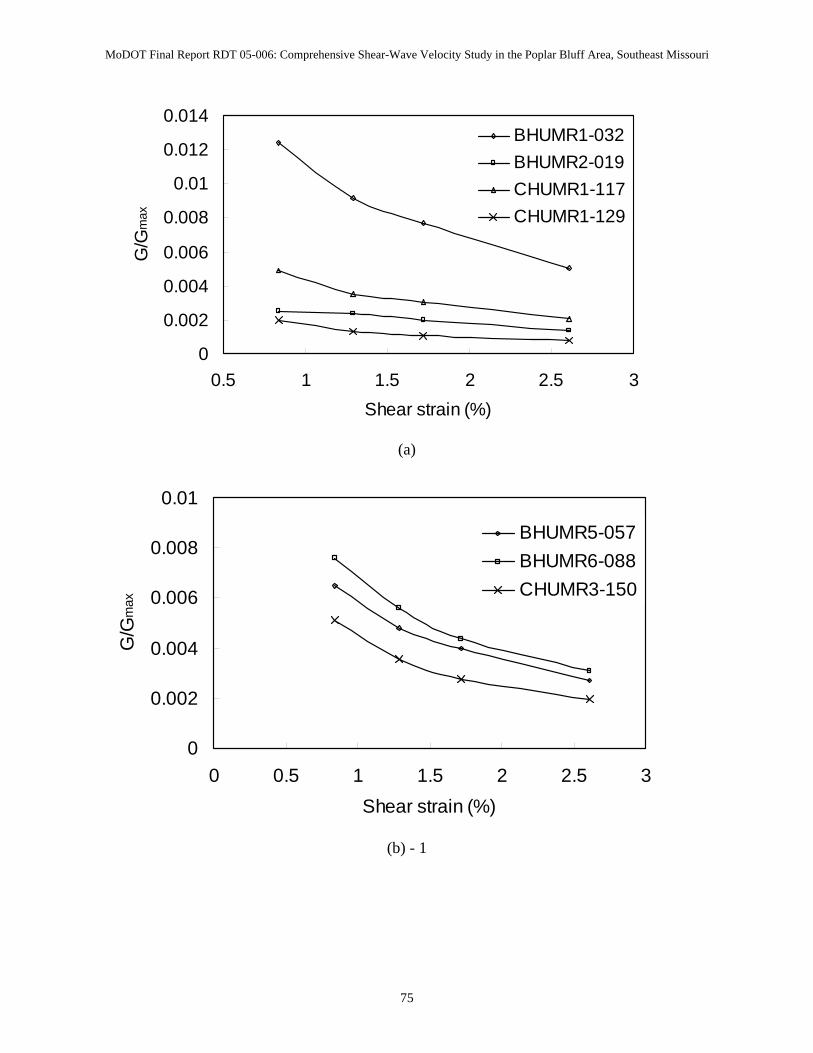
MoDOT Final Report RDT 05-006: Comprehensive Shear-Wave Velocity Study in the Poplar Bluff Area, Southeast Missouri
0
0.002
0.004
0.006
0.008
0.01
0.012
0.014
0.5 1 1.5 2 2.5 3Shear strain (%)
G/G
max
BHUMR1-032BHUMR2-019CHUMR1-117CHUMR1-129
(a)
0
0.002
0.004
0.006
0.008
0.01
0 0.5 1 1.5 2 2.5 3Shear strain (%)
G/G
max
BHUMR5-057BHUMR6-088CHUMR3-150
(b) - 1
75
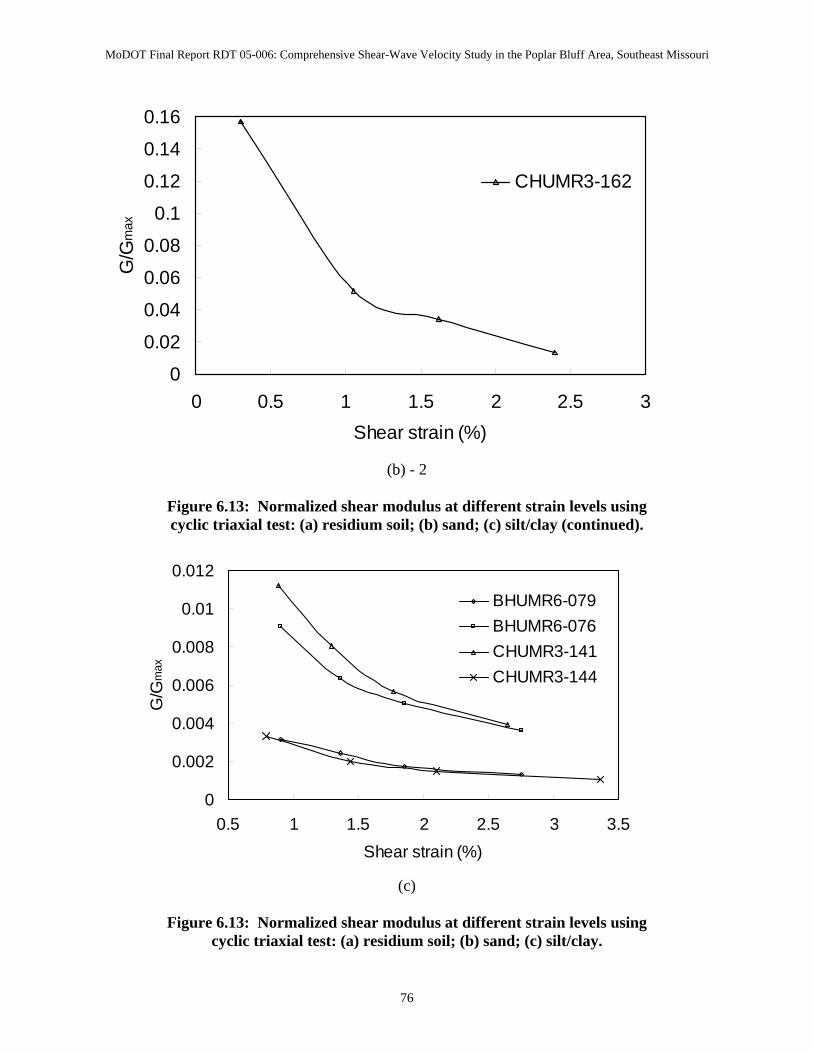
MoDOT Final Report RDT 05-006: Comprehensive Shear-Wave Velocity Study in the Poplar Bluff Area, Southeast Missouri
0
0.02
0.04
0.06
0.08
0.1
0.12
0.14
0.16
0 0.5 1 1.5 2 2.5 3Shear strain (%)
G/G
max
CHUMR3-162
(b) - 2
Figure 6.13: Normalized shear modulus at different strain levels using cyclic triaxial test: (a) residium soil; (b) sand; (c) silt/clay (continued).
0
0.002
0.004
0.006
0.008
0.01
0.012
0.5 1 1.5 2 2.5 3 3.5Shear strain (%)
G/G
max
BHUMR6-079BHUMR6-076CHUMR3-141CHUMR3-144
(c)
Figure 6.13: Normalized shear modulus at different strain levels using
cyclic triaxial test: (a) residium soil; (b) sand; (c) silt/clay.
76
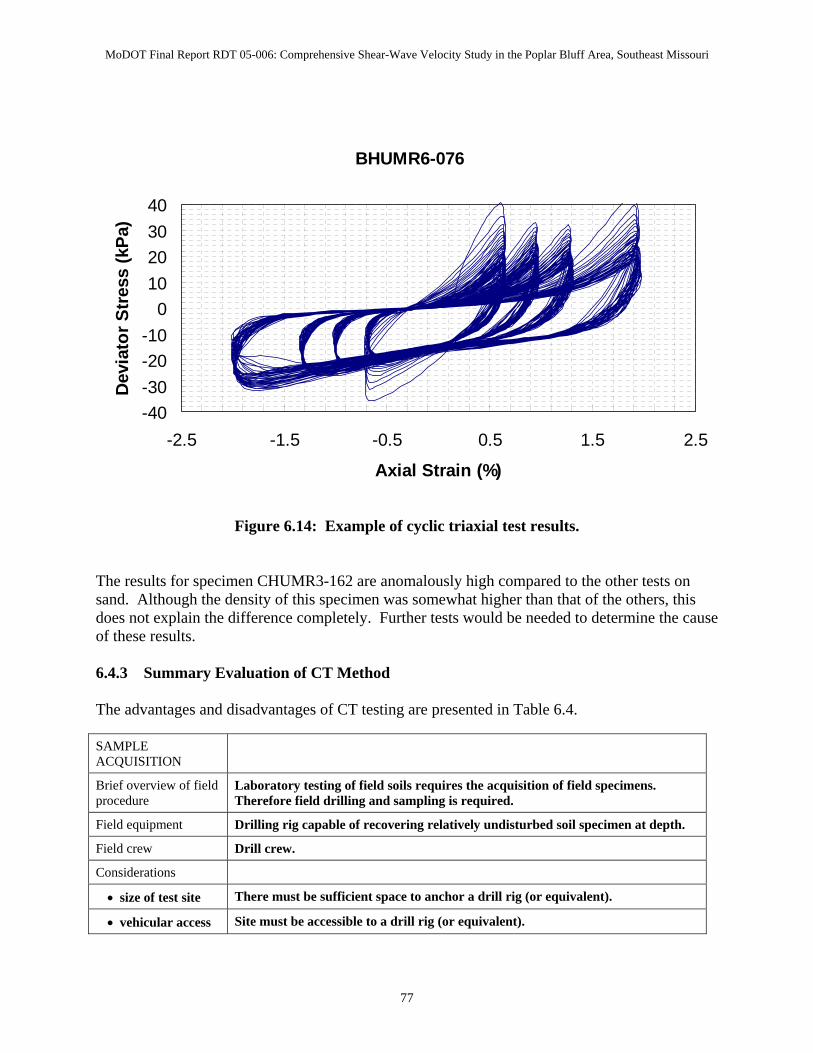
MoDOT Final Report RDT 05-006: Comprehensive Shear-Wave Velocity Study in the Poplar Bluff Area, Southeast Missouri
BHUMR6-076
-40-30-20-10
010203040
-2.5 -1.5 -0.5 0.5 1.5 2.5
Axial Strain (%)
Dev
iato
r Str
ess
(kPa
)
Figure 6.14: Example of cyclic triaxial test results. The results for specimen CHUMR3-162 are anomalously high compared to the other tests on sand. Although the density of this specimen was somewhat higher than that of the others, this does not explain the difference completely. Further tests would be needed to determine the cause of these results. 6.4.3 Summary Evaluation of CT Method The advantages and disadvantages of CT testing are presented in Table 6.4. SAMPLE ACQUISITION
Brief overview of field procedure
Laboratory testing of field soils requires the acquisition of field specimens. Therefore field drilling and sampling is required.
Field equipment Drilling rig capable of recovering relatively undisturbed soil specimen at depth.
Field crew Drill crew.
Considerations
• size of test site There must be sufficient space to anchor a drill rig (or equivalent).
• vehicular access Site must be accessible to a drill rig (or equivalent).
77
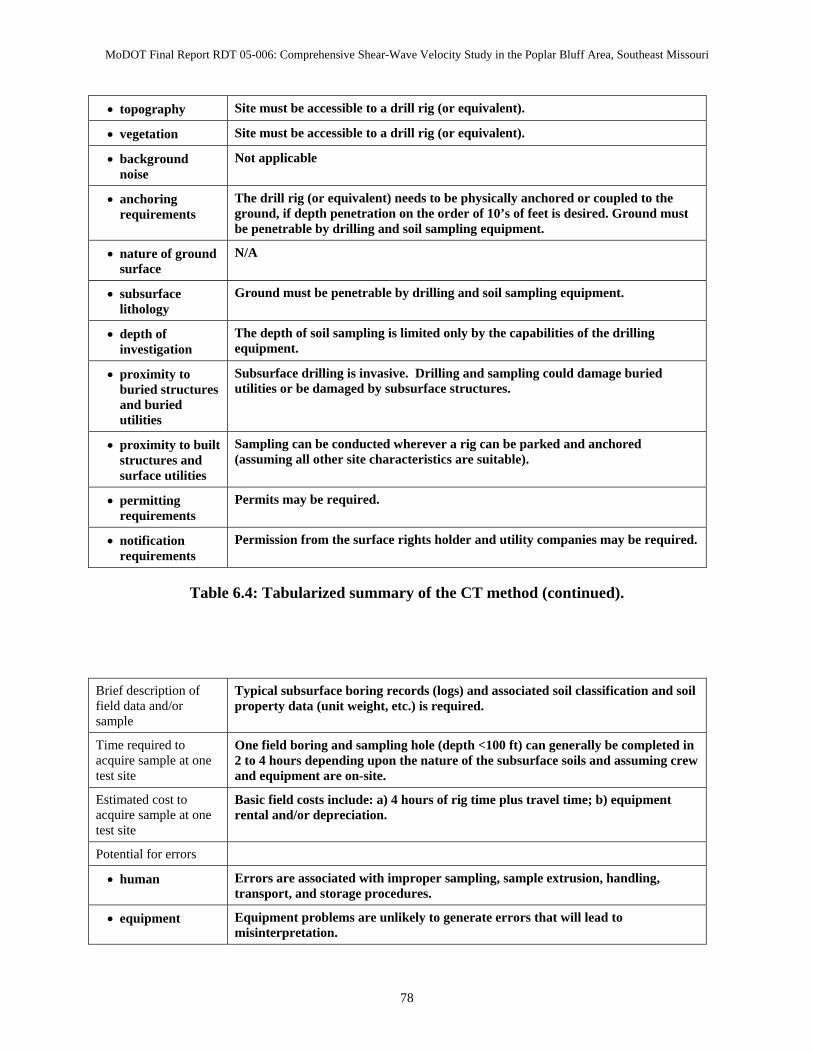
MoDOT Final Report RDT 05-006: Comprehensive Shear-Wave Velocity Study in the Poplar Bluff Area, Southeast Missouri
• topography Site must be accessible to a drill rig (or equivalent).
• vegetation Site must be accessible to a drill rig (or equivalent).
• background noise
Not applicable
• anchoring requirements
The drill rig (or equivalent) needs to be physically anchored or coupled to the ground, if depth penetration on the order of 10’s of feet is desired. Ground must be penetrable by drilling and soil sampling equipment.
• nature of ground surface
N/A
• subsurface lithology
Ground must be penetrable by drilling and soil sampling equipment.
• depth of investigation
The depth of soil sampling is limited only by the capabilities of the drilling equipment.
• proximity to buried structures and buried utilities
Subsurface drilling is invasive. Drilling and sampling could damage buried utilities or be damaged by subsurface structures.
• proximity to built structures and surface utilities
Sampling can be conducted wherever a rig can be parked and anchored (assuming all other site characteristics are suitable).
• permitting requirements
Permits may be required.
• notification requirements
Permission from the surface rights holder and utility companies may be required.
Table 6.4: Tabularized summary of the CT method (continued).
Brief description of field data and/or sample
Typical subsurface boring records (logs) and associated soil classification and soil property data (unit weight, etc.) is required.
Time required to acquire sample at one test site
One field boring and sampling hole (depth <100 ft) can generally be completed in 2 to 4 hours depending upon the nature of the subsurface soils and assuming crew and equipment are on-site.
Estimated cost to acquire sample at one test site
Basic field costs include: a) 4 hours of rig time plus travel time; b) equipment rental and/or depreciation.
Potential for errors
• human Errors are associated with improper sampling, sample extrusion, handling, transport, and storage procedures.
• equipment Equipment problems are unlikely to generate errors that will lead to misinterpretation.
78
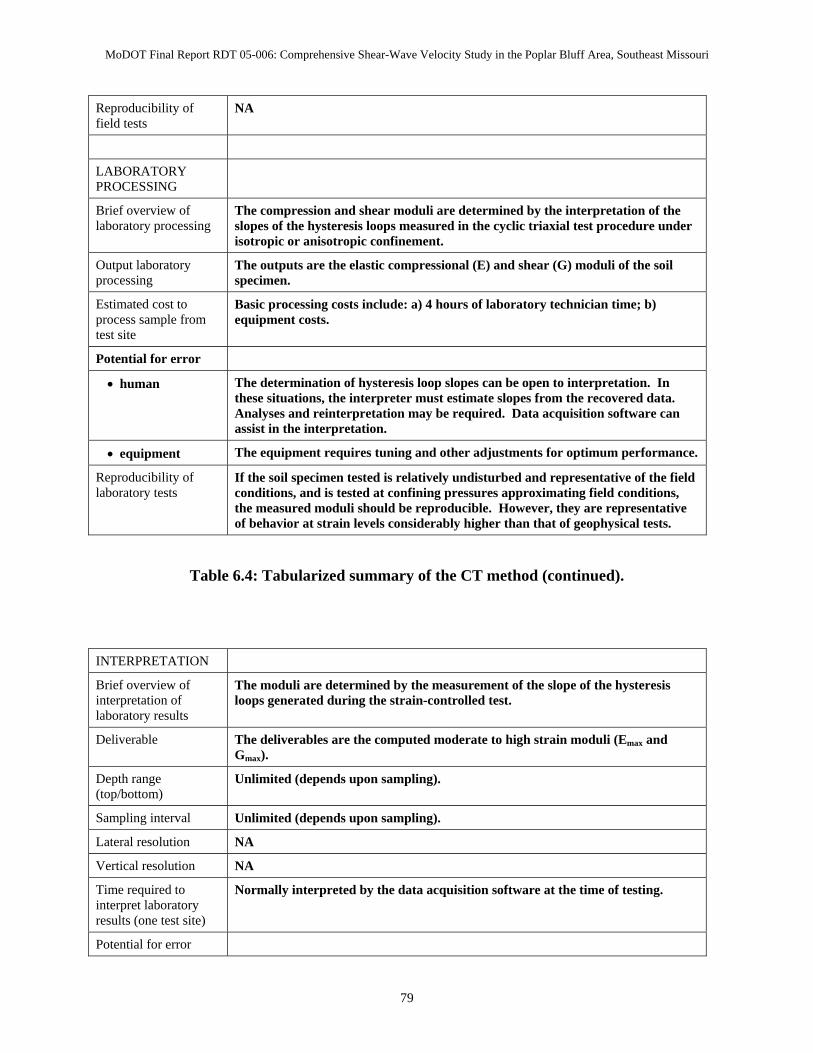
MoDOT Final Report RDT 05-006: Comprehensive Shear-Wave Velocity Study in the Poplar Bluff Area, Southeast Missouri
Reproducibility of field tests
NA
LABORATORY PROCESSING
Brief overview of laboratory processing
The compression and shear moduli are determined by the interpretation of the slopes of the hysteresis loops measured in the cyclic triaxial test procedure under isotropic or anisotropic confinement.
Output laboratory processing
The outputs are the elastic compressional (E) and shear (G) moduli of the soil specimen.
Estimated cost to process sample from test site
Basic processing costs include: a) 4 hours of laboratory technician time; b) equipment costs.
Potential for error
• human The determination of hysteresis loop slopes can be open to interpretation. In these situations, the interpreter must estimate slopes from the recovered data. Analyses and reinterpretation may be required. Data acquisition software can assist in the interpretation.
• equipment The equipment requires tuning and other adjustments for optimum performance.
Reproducibility of laboratory tests
If the soil specimen tested is relatively undisturbed and representative of the field conditions, and is tested at confining pressures approximating field conditions, the measured moduli should be reproducible. However, they are representative of behavior at strain levels considerably higher than that of geophysical tests.
Table 6.4: Tabularized summary of the CT method (continued).
INTERPRETATION
Brief overview of interpretation of laboratory results
The moduli are determined by the measurement of the slope of the hysteresis loops generated during the strain-controlled test.
Deliverable The deliverables are the computed moderate to high strain moduli (Emax and Gmax).
Depth range (top/bottom)
Unlimited (depends upon sampling).
Sampling interval Unlimited (depends upon sampling).
Lateral resolution NA
Vertical resolution NA
Time required to interpret laboratory results (one test site)
Normally interpreted by the data acquisition software at the time of testing.
Potential for error
79
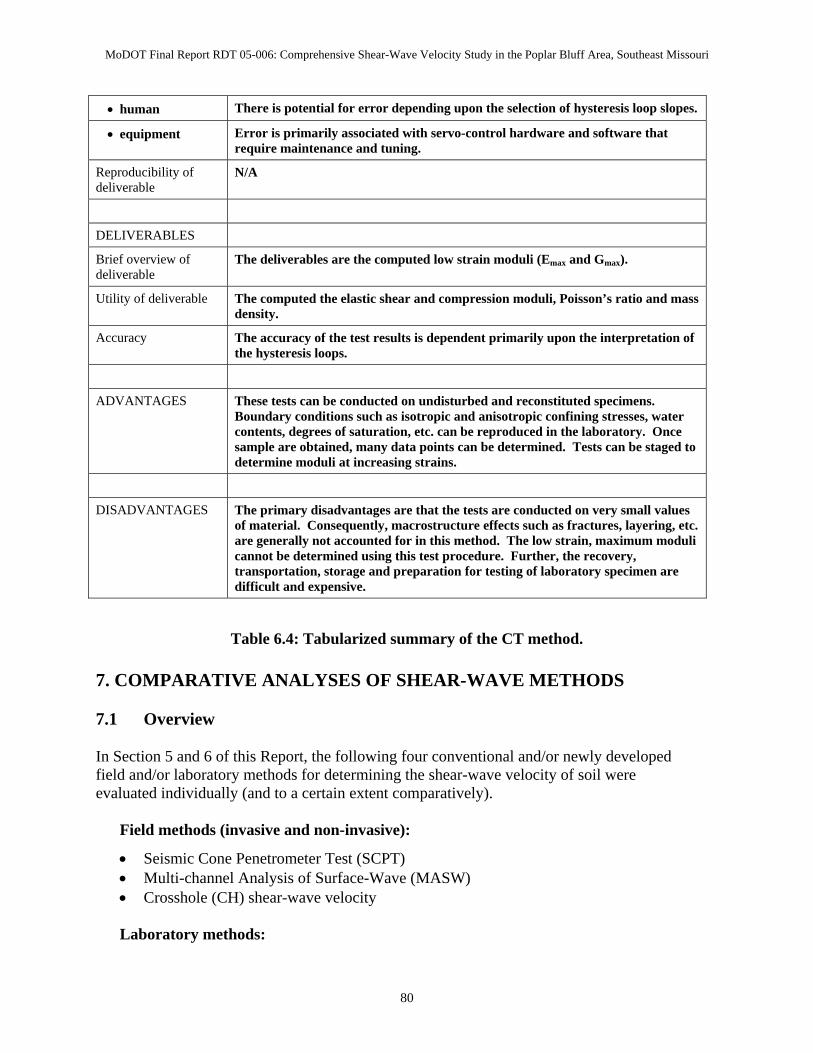
MoDOT Final Report RDT 05-006: Comprehensive Shear-Wave Velocity Study in the Poplar Bluff Area, Southeast Missouri
• human There is potential for error depending upon the selection of hysteresis loop slopes.
• equipment Error is primarily associated with servo-control hardware and software that require maintenance and tuning.
Reproducibility of deliverable
N/A
DELIVERABLES
Brief overview of deliverable
The deliverables are the computed low strain moduli (Emax and Gmax).
Utility of deliverable The computed the elastic shear and compression moduli, Poisson’s ratio and mass density.
Accuracy The accuracy of the test results is dependent primarily upon the interpretation of the hysteresis loops.
ADVANTAGES These tests can be conducted on undisturbed and reconstituted specimens. Boundary conditions such as isotropic and anisotropic confining stresses, water contents, degrees of saturation, etc. can be reproduced in the laboratory. Once sample are obtained, many data points can be determined. Tests can be staged to determine moduli at increasing strains.
DISADVANTAGES The primary disadvantages are that the tests are conducted on very small values of material. Consequently, macrostructure effects such as fractures, layering, etc. are generally not accounted for in this method. The low strain, maximum moduli cannot be determined using this test procedure. Further, the recovery, transportation, storage and preparation for testing of laboratory specimen are difficult and expensive.
Table 6.4: Tabularized summary of the CT method. 7. COMPARATIVE ANALYSES OF SHEAR-WAVE METHODS 7.1 Overview In Section 5 and 6 of this Report, the following four conventional and/or newly developed field and/or laboratory methods for determining the shear-wave velocity of soil were evaluated individually (and to a certain extent comparatively).
Field methods (invasive and non-invasive):
• Seismic Cone Penetrometer Test (SCPT) • Multi-channel Analysis of Surface-Wave (MASW) • Crosshole (CH) shear-wave velocity Laboratory methods:
80
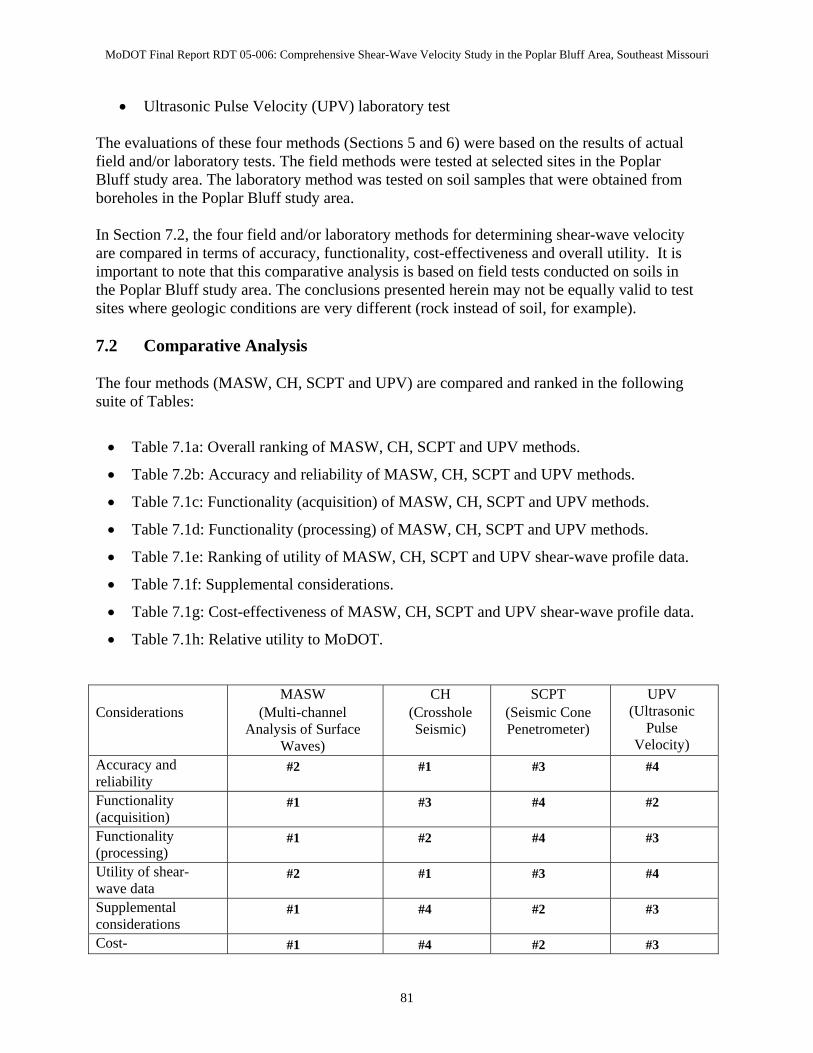
MoDOT Final Report RDT 05-006: Comprehensive Shear-Wave Velocity Study in the Poplar Bluff Area, Southeast Missouri
• Ultrasonic Pulse Velocity (UPV) laboratory test
The evaluations of these four methods (Sections 5 and 6) were based on the results of actual field and/or laboratory tests. The field methods were tested at selected sites in the Poplar Bluff study area. The laboratory method was tested on soil samples that were obtained from boreholes in the Poplar Bluff study area. In Section 7.2, the four field and/or laboratory methods for determining shear-wave velocity are compared in terms of accuracy, functionality, cost-effectiveness and overall utility. It is important to note that this comparative analysis is based on field tests conducted on soils in the Poplar Bluff study area. The conclusions presented herein may not be equally valid to test sites where geologic conditions are very different (rock instead of soil, for example). 7.2 Comparative Analysis The four methods (MASW, CH, SCPT and UPV) are compared and ranked in the following suite of Tables:
• Table 7.1a: Overall ranking of MASW, CH, SCPT and UPV methods.
• Table 7.2b: Accuracy and reliability of MASW, CH, SCPT and UPV methods.
• Table 7.1c: Functionality (acquisition) of MASW, CH, SCPT and UPV methods.
• Table 7.1d: Functionality (processing) of MASW, CH, SCPT and UPV methods.
• Table 7.1e: Ranking of utility of MASW, CH, SCPT and UPV shear-wave profile data.
• Table 7.1f: Supplemental considerations.
• Table 7.1g: Cost-effectiveness of MASW, CH, SCPT and UPV shear-wave profile data.
• Table 7.1h: Relative utility to MoDOT. Considerations
MASW (Multi-channel
Analysis of Surface Waves)
CH (Crosshole Seismic)
SCPT (Seismic Cone Penetrometer)
UPV (Ultrasonic
Pulse Velocity)
Accuracy and reliability
#2 #1 #3 #4
Functionality (acquisition)
#1 #3 #4 #2
Functionality (processing)
#1 #2 #4 #3
Utility of shear-wave data
#2 #1 #3 #4
Supplemental considerations
#1 #4 #2 #3
Cost- #1 #4 #2 #3
81
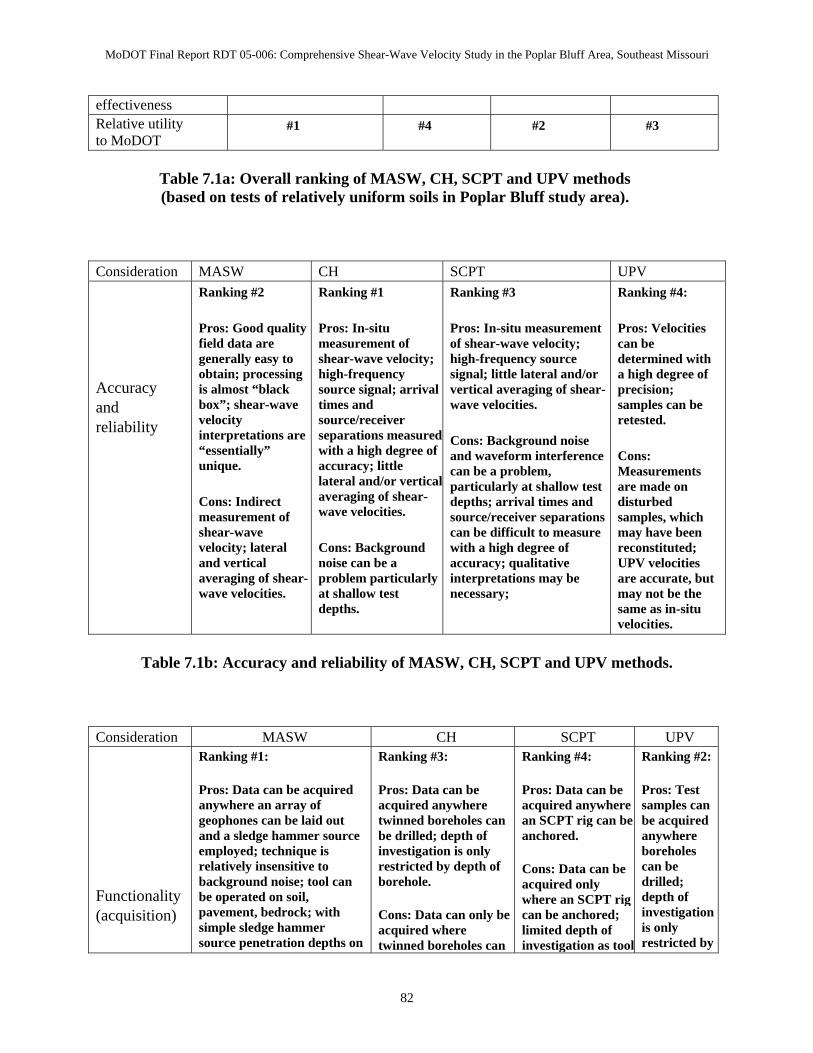
MoDOT Final Report RDT 05-006: Comprehensive Shear-Wave Velocity Study in the Poplar Bluff Area, Southeast Missouri
effectiveness Relative utility to MoDOT
#1 #4 #2 #3
Table 7.1a: Overall ranking of MASW, CH, SCPT and UPV methods (based on tests of relatively uniform soils in Poplar Bluff study area).
Consideration MASW CH SCPT UPV Accuracy and reliability
Ranking #2 Pros: Good quality field data are generally easy to obtain; processing is almost “black box”; shear-wave velocity interpretations are “essentially” unique. Cons: Indirect measurement of shear-wave velocity; lateral and vertical averaging of shear-wave velocities.
Ranking #1 Pros: In-situ measurement of shear-wave velocity; high-frequency source signal; arrival times and source/receiver separations measured with a high degree of accuracy; little lateral and/or vertical averaging of shear-wave velocities. Cons: Background noise can be a problem particularly at shallow test depths.
Ranking #3 Pros: In-situ measurement of shear-wave velocity; high-frequency source signal; little lateral and/or vertical averaging of shear-wave velocities. Cons: Background noise and waveform interference can be a problem, particularly at shallow test depths; arrival times and source/receiver separations can be difficult to measure with a high degree of accuracy; qualitative interpretations may be necessary;
Ranking #4: Pros: Velocities can be determined with a high degree of precision; samples can be retested. Cons: Measurements are made on disturbed samples, which may have been reconstituted; UPV velocities are accurate, but may not be the same as in-situ velocities.
Table 7.1b: Accuracy and reliability of MASW, CH, SCPT and UPV methods.
Consideration MASW CH SCPT UPV Functionality (acquisition)
Ranking #1: Pros: Data can be acquired anywhere an array of geophones can be laid out and a sledge hammer source employed; technique is relatively insensitive to background noise; tool can be operated on soil, pavement, bedrock; with simple sledge hammer source penetration depths on
Ranking #3: Pros: Data can be acquired anywhere twinned boreholes can be drilled; depth of investigation is only restricted by depth of borehole. Cons: Data can only be acquired where twinned boreholes can
Ranking #4: Pros: Data can be acquired anywhere an SCPT rig can be anchored. Cons: Data can be acquired only where an SCPT rig can be anchored; limited depth of investigation as tool
Ranking #2: Pros: Test samples can be acquired anywhere boreholes can be drilled; depth of investigation is only restricted by
82
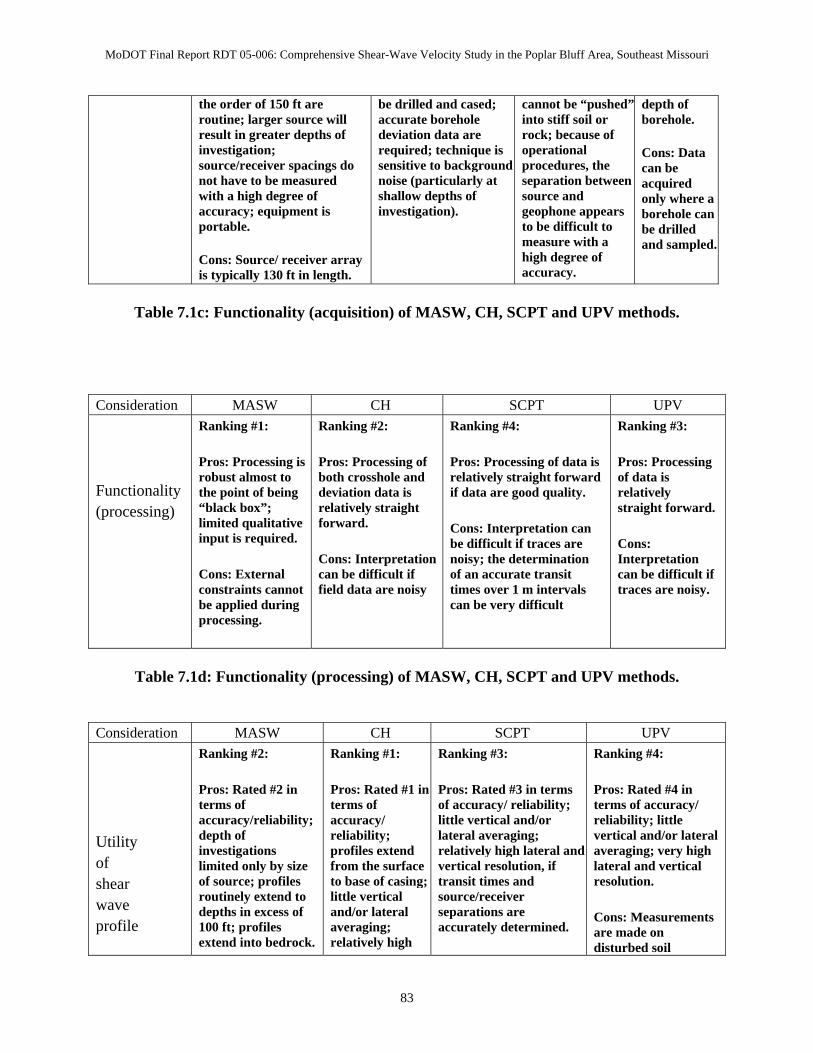
MoDOT Final Report RDT 05-006: Comprehensive Shear-Wave Velocity Study in the Poplar Bluff Area, Southeast Missouri
the order of 150 ft are routine; larger source will result in greater depths of investigation; source/receiver spacings do not have to be measured with a high degree of accuracy; equipment is portable. Cons: Source/ receiver array is typically 130 ft in length.
be drilled and cased; accurate borehole deviation data are required; technique is sensitive to background noise (particularly at shallow depths of investigation).
cannot be “pushed”into stiff soil or rock; because of operational procedures, the separation between source and geophone appears to be difficult to measure with a high degree of accuracy.
depth of borehole. Cons: Data can be acquired only where a borehole can be drilled and sampled.
Table 7.1c: Functionality (acquisition) of MASW, CH, SCPT and UPV methods.
Consideration MASW CH SCPT UPV Functionality (processing)
Ranking #1: Pros: Processing is robust almost to the point of being “black box”; limited qualitative input is required. Cons: External constraints cannot be applied during processing.
Ranking #2: Pros: Processing of both crosshole and deviation data is relatively straight forward. Cons: Interpretation can be difficult if field data are noisy
Ranking #4: Pros: Processing of data is relatively straight forward if data are good quality. Cons: Interpretation can be difficult if traces are noisy; the determination of an accurate transit times over 1 m intervals can be very difficult
Ranking #3: Pros: Processing of data is relatively straight forward. Cons: Interpretation can be difficult if traces are noisy.
Table 7.1d: Functionality (processing) of MASW, CH, SCPT and UPV methods.
Consideration MASW CH SCPT UPV
Utility of shear wave profile
Ranking #2: Pros: Rated #2 in terms of accuracy/reliability; depth of investigations limited only by size of source; profiles routinely extend to depths in excess of 100 ft; profiles extend into bedrock.
Ranking #1: Pros: Rated #1 in terms of accuracy/ reliability; profiles extend from the surface to base of casing; little vertical and/or lateral averaging; relatively high
Ranking #3: Pros: Rated #3 in terms of accuracy/ reliability; little vertical and/or lateral averaging; relatively high lateral and vertical resolution, if transit times and source/receiver separations are accurately determined.
Ranking #4: Pros: Rated #4 in terms of accuracy/ reliability; little vertical and/or lateral averaging; very high lateral and vertical resolution. Cons: Measurements are made on disturbed soil
83
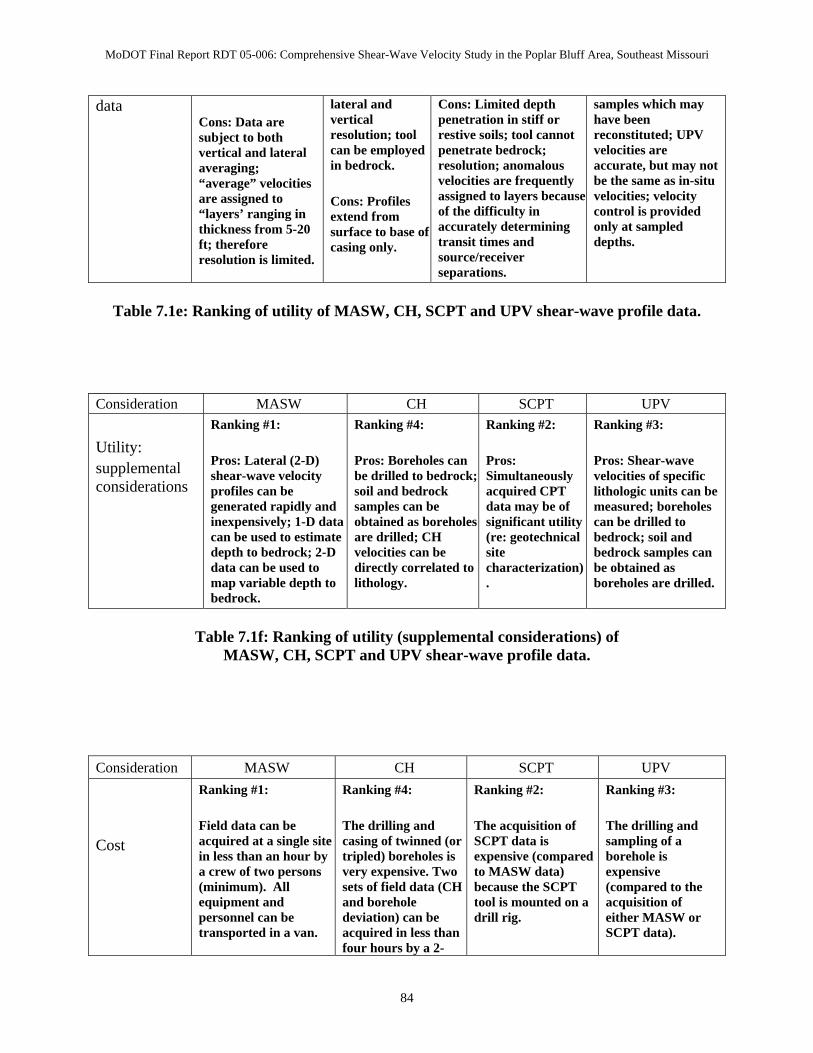
MoDOT Final Report RDT 05-006: Comprehensive Shear-Wave Velocity Study in the Poplar Bluff Area, Southeast Missouri
data Cons: Data are subject to both vertical and lateral averaging; “average” velocities are assigned to “layers’ ranging in thickness from 5-20 ft; therefore resolution is limited.
lateral and vertical resolution; tool can be employed in bedrock. Cons: Profiles extend from surface to base of casing only.
Cons: Limited depth penetration in stiff or restive soils; tool cannot penetrate bedrock; resolution; anomalous velocities are frequently assigned to layers because of the difficulty in accurately determining transit times and source/receiver separations.
samples which may have been reconstituted; UPV velocities are accurate, but may not be the same as in-situ velocities; velocity control is provided only at sampled depths.
Table 7.1e: Ranking of utility of MASW, CH, SCPT and UPV shear-wave profile data.
Consideration MASW CH SCPT UPV Utility: supplemental considerations
Ranking #1:
Pros: Lateral (2-D) shear-wave velocity profiles can be generated rapidly and inexpensively; 1-D data can be used to estimate depth to bedrock; 2-D data can be used to map variable depth to bedrock.
Ranking #4: Pros: Boreholes can be drilled to bedrock; soil and bedrock samples can be obtained as boreholes are drilled; CH velocities can be directly correlated to lithology.
Ranking #2:
Pros: Simultaneously acquired CPT data may be of significant utility (re: geotechnical site characterization).
Ranking #3: Pros: Shear-wave velocities of specific lithologic units can be measured; boreholes can be drilled to bedrock; soil and bedrock samples can be obtained as boreholes are drilled.
Table 7.1f: Ranking of utility (supplemental considerations) of
MASW, CH, SCPT and UPV shear-wave profile data. Consideration MASW CH SCPT UPV Cost
Ranking #1: Field data can be acquired at a single site in less than an hour by a crew of two persons (minimum). All equipment and personnel can be transported in a van.
Ranking #4: The drilling and casing of twinned (or tripled) boreholes is very expensive. Two sets of field data (CH and borehole deviation) can be acquired in less than four hours by a 2-
Ranking #2: The acquisition of SCPT data is expensive (compared to MASW data) because the SCPT tool is mounted on a drill rig.
Ranking #3: The drilling and sampling of a borehole is expensive (compared to the acquisition of either MASW or SCPT data).
84

MoDOT Final Report RDT 05-006: Comprehensive Shear-Wave Velocity Study in the Poplar Bluff Area, Southeast Missouri
MASW data are less expensive than SCPT data, and much less expensive than either CH or UPV data.
person (minimum) field crew. CH data are the most expensive to acquire.
SCPT data are more expensive than MASW data, but much less expensive than either CH or UPV data.
UPV data are much more expensive than either MASW data, but much less expensive than CH data.
Table 7.1g: Cost-effectiveness of MASW, CH, SCPT and UPV shear-wave profile data.
Consideration MASW CH SCPT UPV Utility to MoDOT
Ranking #1: MASW is the most cost-effective tool for accurately determining the shear-wave velocity of the subsurface. The tool can also be used to map the top of bedrock.
Ranking #4: CH is not normally a cost-effective tool for determining the shear-wave velocity of the subsurface. However, the cost-effectiveness of this tool is greatly increased if the boreholes are utilized for other purposes (e.g. sampling, accurate determination of depth to bedrock, borehole logging, etc.).
Ranking #2: SCPT is less cost-effective than the MASW tool because it is more expensive, much more limited (re: site accessibility and depth of investigation), and cannot be used to map bedrock. However, the cost-effectiveness of this tool is greatly increased if the simultaneously acquired CPT data is in itself of significant utility.
Ranking #3: UPV is not normally a cost-effective tool for determining the shear-wave velocity of the subsurface. However, the cost-effectiveness of this tool is greatly increased if the boreholes are utilized for other purposes (e.g. sampling, accurate determination of depth to bedrock, borehole logging, etc.).
Table 7.1h: Relative utility to MoDOT (for determination of
the shear-wave velocity of soil in Mississippi Embayment)
8. MODIFIED GEOLOGIC AND EARTHQUAKE HAZARDS MAPS 8.1 Overview In order to demonstrate the utility of shear-wave velocity data, a suite of 3-D maps depicting spatial variations in thickness, stratigraphy and shear-wave velocity of soils in the Poplar Bluff area were prepared. A 3-D shallow subsurface materials map, complete with shear-wave velocity test data (suitable for preparation of an earthquake soil amplification map) was also generated.
85

MoDOT Final Report RDT 05-006: Comprehensive Shear-Wave Velocity Study in the Poplar Bluff Area, Southeast Missouri
The generation of the suite of maps for the Poplar Bluff study area involved the following:
• Collection of readily available existing and newly generated digital data, databases and maps with information on soil stratigraphy, and shear-wave velocity from the following sources.
o Missouri Department of Natural Resources (MoDNR), Geological Survey and Resource Assessment Division LOGMAIN stratigraphic well log database WIMS water well drillers well log database Public water supply well log database Digital surficial materials maps of the study area Shear-wave velocity database for study area
o Missouri Department of Transportation, Geotechnical Section MoDOT geotechnical database New SCPT shear-wave velocity data from this study
o University of Missouri – Rolla New MASW shear-wave velocity data from this study New CH shear-wave velocity data from this study New borings stratigraphic data from this study New laboratory UPV shear-wave velocity data from this study
o Other public and commercial sources Digital Raster Graphic (DRG) topographic map images Digital Orthophoto Quarter Quadrangle (DOQQ) airphoto images Digital Elevation Model (DEM) elevation data Highway data Topographic map boundaries Urban boundaries
• Evaluation of these data for problems and determination of usefulness (re: planned
mapping). • Sorting, converting, formating and, where necessary, modifying the digital data used to
make the maps. This involved entering some new data into tables or databases.
• Using a geographic information system (GIS), specifically ArcView with the 3-D Analyst’s Extension, to manipulate the digital data and make the suite of maps.
Inherent problems in the various data sources limited their usefulness. Most of these problems were in one of the following categories.
• Inadequate location coordinates • Limited stratigraphic information • Limited depth penetration • Inadequate elevation information
86
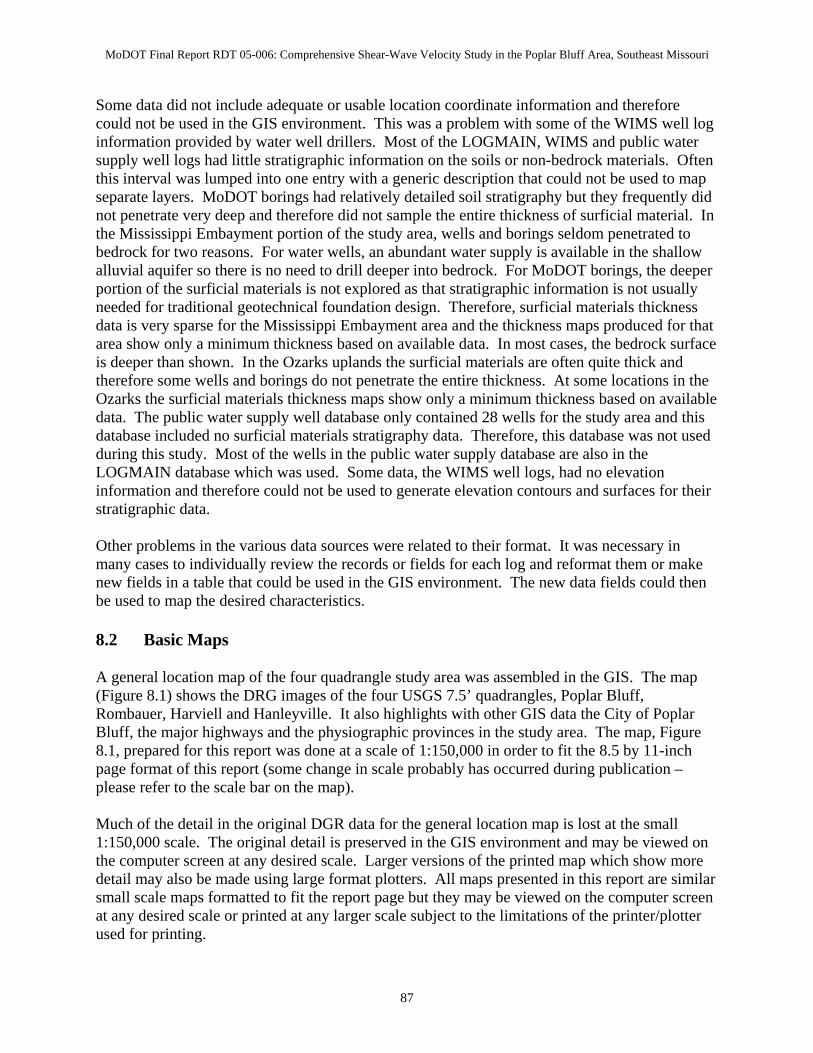
MoDOT Final Report RDT 05-006: Comprehensive Shear-Wave Velocity Study in the Poplar Bluff Area, Southeast Missouri
Some data did not include adequate or usable location coordinate information and therefore could not be used in the GIS environment. This was a problem with some of the WIMS well log information provided by water well drillers. Most of the LOGMAIN, WIMS and public water supply well logs had little stratigraphic information on the soils or non-bedrock materials. Often this interval was lumped into one entry with a generic description that could not be used to map separate layers. MoDOT borings had relatively detailed soil stratigraphy but they frequently did not penetrate very deep and therefore did not sample the entire thickness of surficial material. In the Mississippi Embayment portion of the study area, wells and borings seldom penetrated to bedrock for two reasons. For water wells, an abundant water supply is available in the shallow alluvial aquifer so there is no need to drill deeper into bedrock. For MoDOT borings, the deeper portion of the surficial materials is not explored as that stratigraphic information is not usually needed for traditional geotechnical foundation design. Therefore, surficial materials thickness data is very sparse for the Mississippi Embayment area and the thickness maps produced for that area show only a minimum thickness based on available data. In most cases, the bedrock surface is deeper than shown. In the Ozarks uplands the surficial materials are often quite thick and therefore some wells and borings do not penetrate the entire thickness. At some locations in the Ozarks the surficial materials thickness maps show only a minimum thickness based on available data. The public water supply well database only contained 28 wells for the study area and this database included no surficial materials stratigraphy data. Therefore, this database was not used during this study. Most of the wells in the public water supply database are also in the LOGMAIN database which was used. Some data, the WIMS well logs, had no elevation information and therefore could not be used to generate elevation contours and surfaces for their stratigraphic data.
Other problems in the various data sources were related to their format. It was necessary in many cases to individually review the records or fields for each log and reformat them or make new fields in a table that could be used in the GIS environment. The new data fields could then be used to map the desired characteristics. 8.2 Basic Maps A general location map of the four quadrangle study area was assembled in the GIS. The map (Figure 8.1) shows the DRG images of the four USGS 7.5’ quadrangles, Poplar Bluff, Rombauer, Harviell and Hanleyville. It also highlights with other GIS data the City of Poplar Bluff, the major highways and the physiographic provinces in the study area. The map, Figure 8.1, prepared for this report was done at a scale of 1:150,000 in order to fit the 8.5 by 11-inch page format of this report (some change in scale probably has occurred during publication – please refer to the scale bar on the map). Much of the detail in the original DGR data for the general location map is lost at the small 1:150,000 scale. The original detail is preserved in the GIS environment and may be viewed on the computer screen at any desired scale. Larger versions of the printed map which show more detail may also be made using large format plotters. All maps presented in this report are similar small scale maps formatted to fit the report page but they may be viewed on the computer screen at any desired scale or printed at any larger scale subject to the limitations of the printer/plotter used for printing.
87
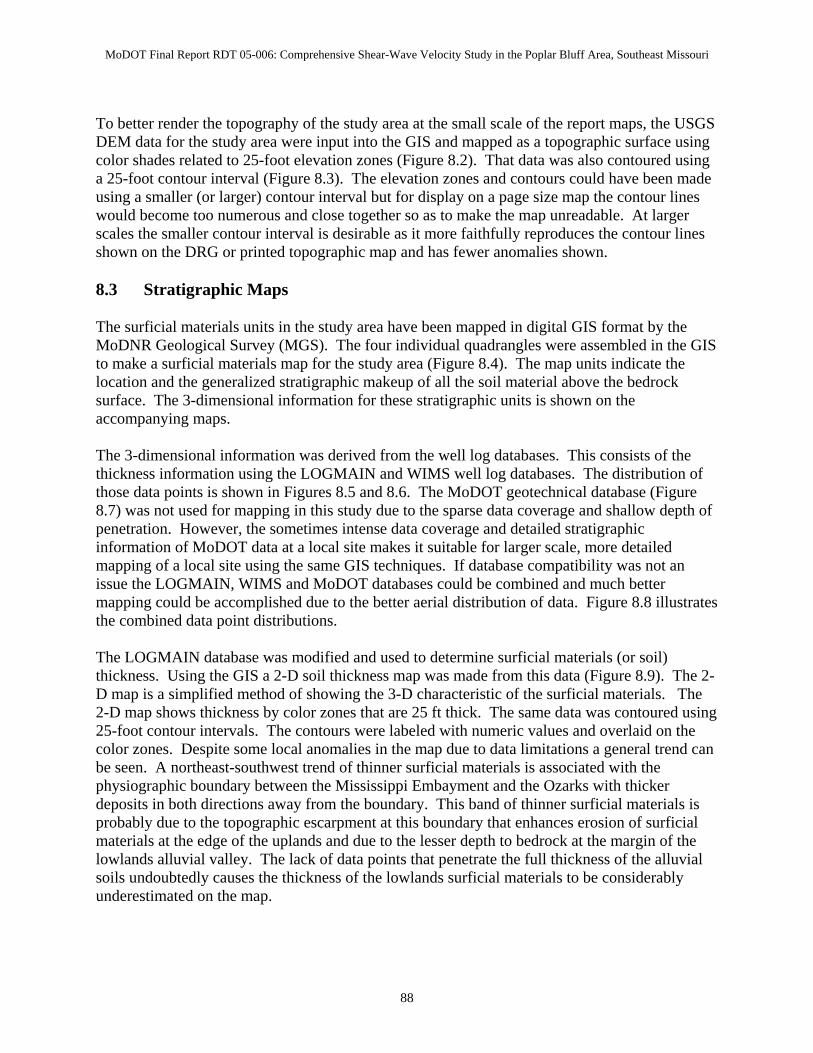
MoDOT Final Report RDT 05-006: Comprehensive Shear-Wave Velocity Study in the Poplar Bluff Area, Southeast Missouri
To better render the topography of the study area at the small scale of the report maps, the USGS DEM data for the study area were input into the GIS and mapped as a topographic surface using color shades related to 25-foot elevation zones (Figure 8.2). That data was also contoured using a 25-foot contour interval (Figure 8.3). The elevation zones and contours could have been made using a smaller (or larger) contour interval but for display on a page size map the contour lines would become too numerous and close together so as to make the map unreadable. At larger scales the smaller contour interval is desirable as it more faithfully reproduces the contour lines shown on the DRG or printed topographic map and has fewer anomalies shown. 8.3 Stratigraphic Maps The surficial materials units in the study area have been mapped in digital GIS format by the MoDNR Geological Survey (MGS). The four individual quadrangles were assembled in the GIS to make a surficial materials map for the study area (Figure 8.4). The map units indicate the location and the generalized stratigraphic makeup of all the soil material above the bedrock surface. The 3-dimensional information for these stratigraphic units is shown on the accompanying maps. The 3-dimensional information was derived from the well log databases. This consists of the thickness information using the LOGMAIN and WIMS well log databases. The distribution of those data points is shown in Figures 8.5 and 8.6. The MoDOT geotechnical database (Figure 8.7) was not used for mapping in this study due to the sparse data coverage and shallow depth of penetration. However, the sometimes intense data coverage and detailed stratigraphic information of MoDOT data at a local site makes it suitable for larger scale, more detailed mapping of a local site using the same GIS techniques. If database compatibility was not an issue the LOGMAIN, WIMS and MoDOT databases could be combined and much better mapping could be accomplished due to the better aerial distribution of data. Figure 8.8 illustrates the combined data point distributions. The LOGMAIN database was modified and used to determine surficial materials (or soil) thickness. Using the GIS a 2-D soil thickness map was made from this data (Figure 8.9). The 2-D map is a simplified method of showing the 3-D characteristic of the surficial materials. The 2-D map shows thickness by color zones that are 25 ft thick. The same data was contoured using 25-foot contour intervals. The contours were labeled with numeric values and overlaid on the color zones. Despite some local anomalies in the map due to data limitations a general trend can be seen. A northeast-southwest trend of thinner surficial materials is associated with the physiographic boundary between the Mississippi Embayment and the Ozarks with thicker deposits in both directions away from the boundary. This band of thinner surficial materials is probably due to the topographic escarpment at this boundary that enhances erosion of surficial materials at the edge of the uplands and due to the lesser depth to bedrock at the margin of the lowlands alluvial valley. The lack of data points that penetrate the full thickness of the alluvial soils undoubtedly causes the thickness of the lowlands surficial materials to be considerably underestimated on the map.
88
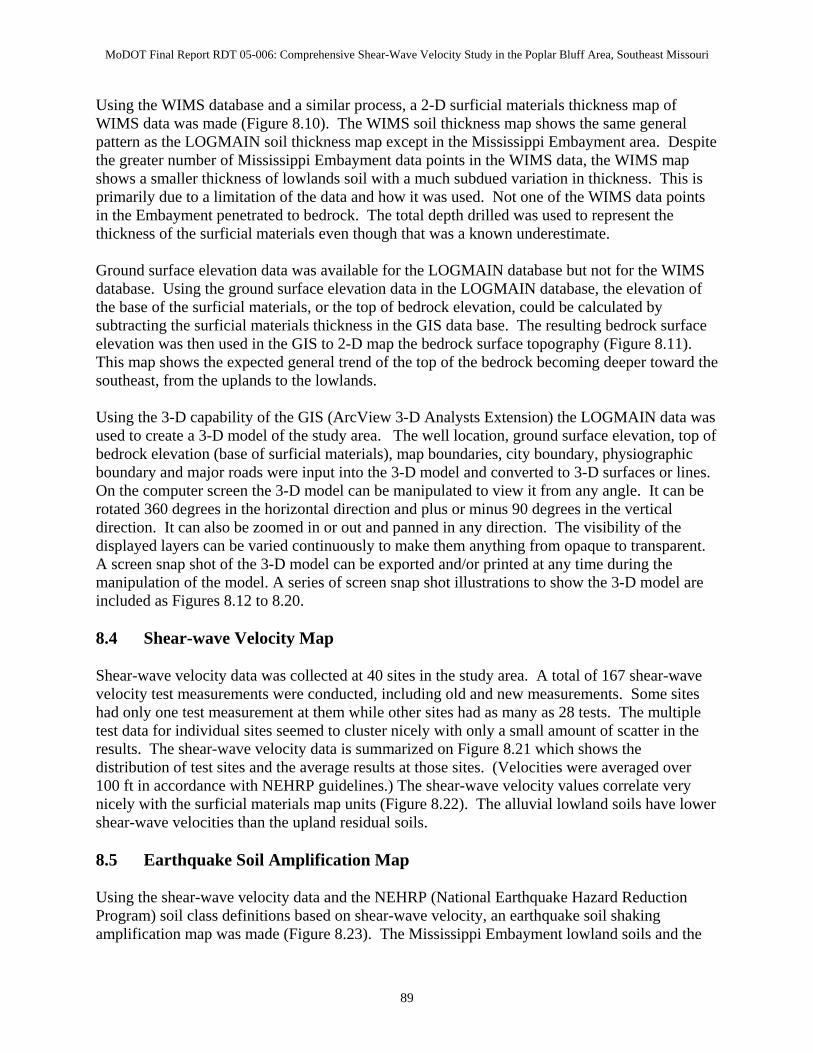
MoDOT Final Report RDT 05-006: Comprehensive Shear-Wave Velocity Study in the Poplar Bluff Area, Southeast Missouri
Using the WIMS database and a similar process, a 2-D surficial materials thickness map of WIMS data was made (Figure 8.10). The WIMS soil thickness map shows the same general pattern as the LOGMAIN soil thickness map except in the Mississippi Embayment area. Despite the greater number of Mississippi Embayment data points in the WIMS data, the WIMS map shows a smaller thickness of lowlands soil with a much subdued variation in thickness. This is primarily due to a limitation of the data and how it was used. Not one of the WIMS data points in the Embayment penetrated to bedrock. The total depth drilled was used to represent the thickness of the surficial materials even though that was a known underestimate. Ground surface elevation data was available for the LOGMAIN database but not for the WIMS database. Using the ground surface elevation data in the LOGMAIN database, the elevation of the base of the surficial materials, or the top of bedrock elevation, could be calculated by subtracting the surficial materials thickness in the GIS data base. The resulting bedrock surface elevation was then used in the GIS to 2-D map the bedrock surface topography (Figure 8.11). This map shows the expected general trend of the top of the bedrock becoming deeper toward the southeast, from the uplands to the lowlands. Using the 3-D capability of the GIS (ArcView 3-D Analysts Extension) the LOGMAIN data was used to create a 3-D model of the study area. The well location, ground surface elevation, top of bedrock elevation (base of surficial materials), map boundaries, city boundary, physiographic boundary and major roads were input into the 3-D model and converted to 3-D surfaces or lines. On the computer screen the 3-D model can be manipulated to view it from any angle. It can be rotated 360 degrees in the horizontal direction and plus or minus 90 degrees in the vertical direction. It can also be zoomed in or out and panned in any direction. The visibility of the displayed layers can be varied continuously to make them anything from opaque to transparent. A screen snap shot of the 3-D model can be exported and/or printed at any time during the manipulation of the model. A series of screen snap shot illustrations to show the 3-D model are included as Figures 8.12 to 8.20. 8.4 Shear-wave Velocity Map Shear-wave velocity data was collected at 40 sites in the study area. A total of 167 shear-wave velocity test measurements were conducted, including old and new measurements. Some sites had only one test measurement at them while other sites had as many as 28 tests. The multiple test data for individual sites seemed to cluster nicely with only a small amount of scatter in the results. The shear-wave velocity data is summarized on Figure 8.21 which shows the distribution of test sites and the average results at those sites. (Velocities were averaged over 100 ft in accordance with NEHRP guidelines.) The shear-wave velocity values correlate very nicely with the surficial materials map units (Figure 8.22). The alluvial lowland soils have lower shear-wave velocities than the upland residual soils. 8.5 Earthquake Soil Amplification Map Using the shear-wave velocity data and the NEHRP (National Earthquake Hazard Reduction Program) soil class definitions based on shear-wave velocity, an earthquake soil shaking amplification map was made (Figure 8.23). The Mississippi Embayment lowland soils and the
89

MoDOT Final Report RDT 05-006: Comprehensive Shear-Wave Velocity Study in the Poplar Bluff Area, Southeast Missouri
Ozarks alluvial valley soils have shear-wave velocity values in the 600 to 1200 ft/s range which puts them into the NEHRP soil class of D. The Ozark upland residual soils have shear-wave velocity values in the 1200 to 2500 range which puts them into the NEHRP soil class of C. The soils with the lower shear-wave velocity values, or the NEHRP soil class letter further from A, will experience more earthquake ground shaking than the bedrock due to the wave amplifying properties of the soil.
90
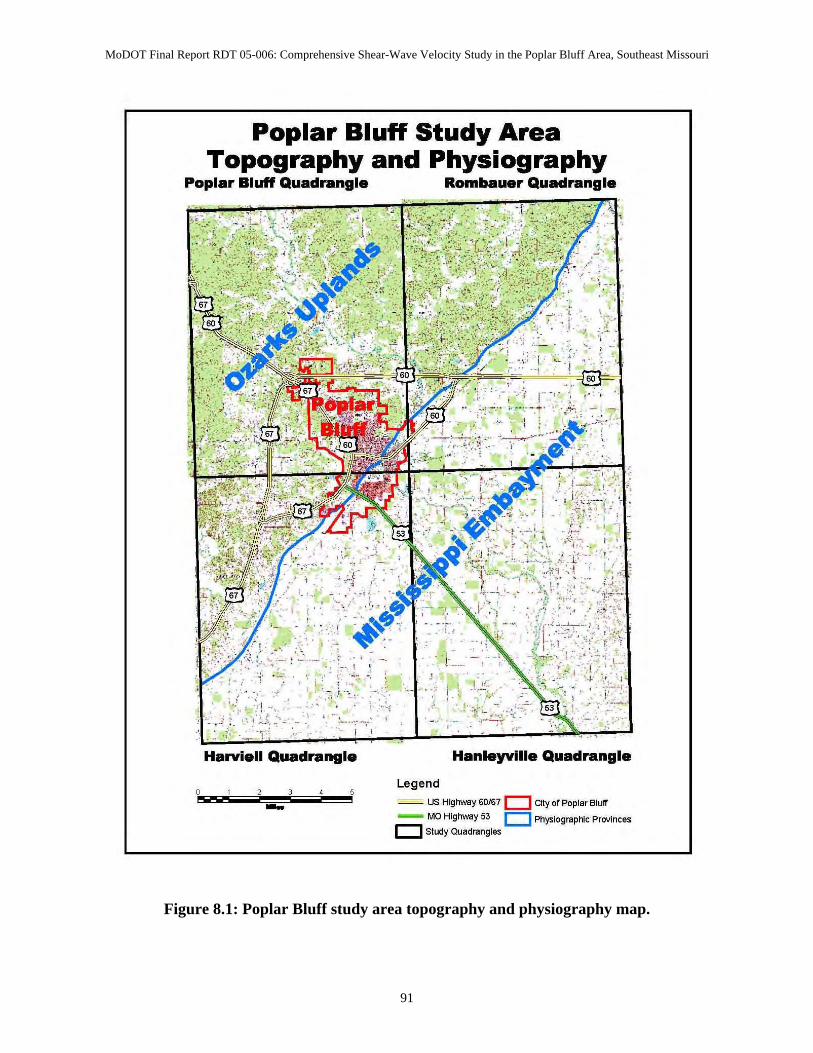
MoDOT Final Report RDT 05-006: Comprehensive Shear-Wave Velocity Study in the Poplar Bluff Area, Southeast Missouri
Figure 8.1: Poplar Bluff study area topography and physiography map.
91
Poplar Bluff Study Area Topography and Physiography
Poplar Bluff Quadrangle Rombauer Quadrangle
r "
, ;,~
:j.
, -.. '-
'- ' -'.-"'7
Harviell Quadrangle
-
. ; :~. ;:... . 1'.
"
Hanleyville Quadrangle
Legend
- us Highway 60/67 c::J City of Poplar Bluff
- MO Highway 53 c::J Physiographic Provinces
c::J Study Quadrangles
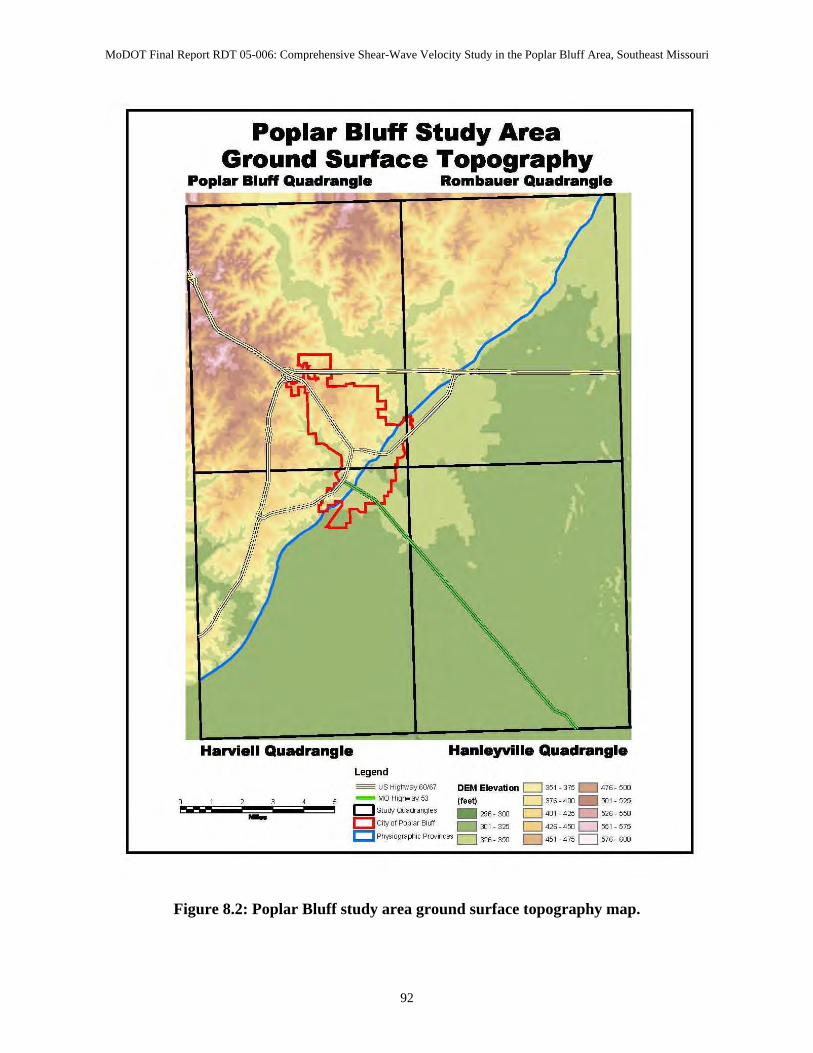
MoDOT Final Report RDT 05-006: Comprehensive Shear-Wave Velocity Study in the Poplar Bluff Area, Southeast Missouri
Figure 8.2: Poplar Bluff study area ground surface topography map.
92
Poplar Bluff Study Area Ground Surface Topography
Poplar Bluff Quadrangle Rombauer Quadrangle
Harviell Quadrangle Hanleyville Quadrangle Legend
- us Higrl/oiay6Q/67 OEM Elevation D 351 -375 476- 500
- MO Higrl/oiay53 (feet) D 376-400 _ 501- 525
Dstuc!yOJaa-31ld IeS _ 296- 300 D 401 -425 D 526- 550
c:J City of Poplar BILIf _ 3] 1- 325 D 426-450 D 551- 575
c::J Phy3 iogra!=tlic Prav llces D 326- 350 D 451 -475 D 576- 600 -
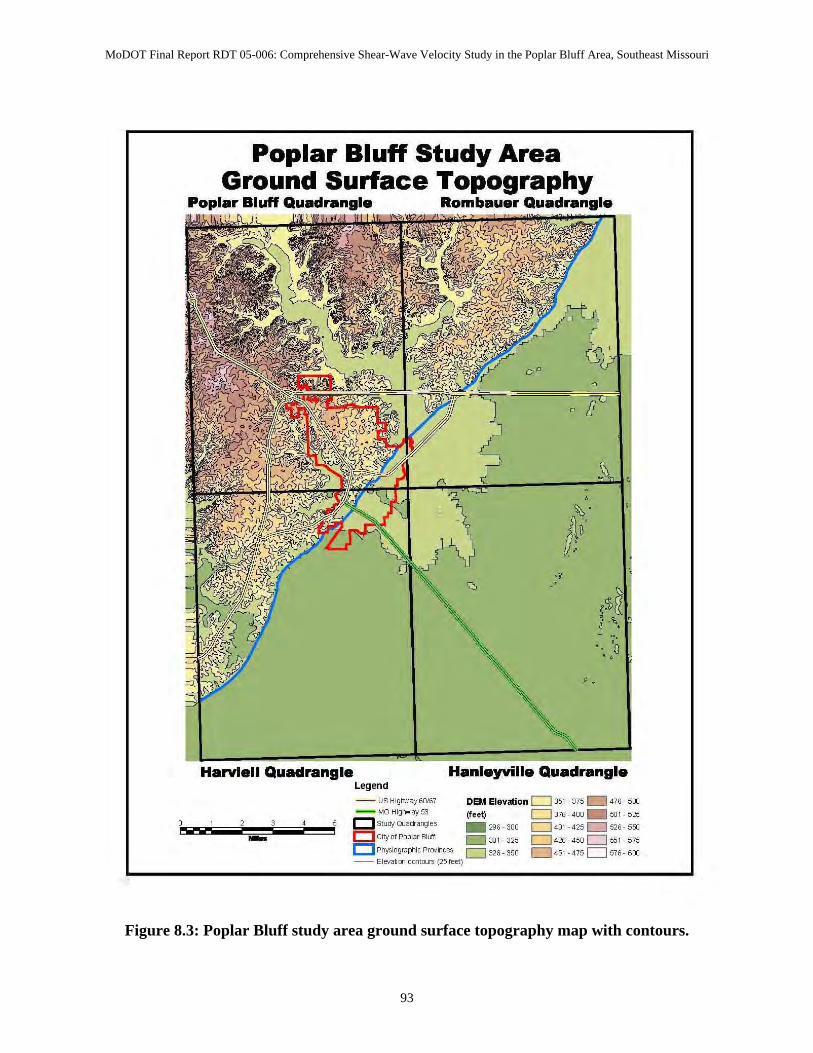
MoDOT Final Report RDT 05-006: Comprehensive Shear-Wave Velocity Study in the Poplar Bluff Area, Southeast Missouri
Figure 8.3: Poplar Bluff study area ground surface topography map with contours.
93
Poplar Bluff Study Area Ground Surface Topography
Poplar Bluff Quadrangle Rombauer Quadrangle
Harviell Quadrangle Legend
-- US Hig rl/oi ay 60167
_ MO HighN ay 53
c::J Stu c!y OJactar.;J les
D City 01 Pop lar BILIf
o
., ,
- ' . •. '0 , ,
Hanleyville Quadrangle
OEM Elevation D 351 - 375 476 - 5 00
(feet) D 376- 4 00 _ 501 - 525
_ 296 - 300 D 4 01 - 425 c=J 526 - 5 50
_ 3J 1 - 325 D 426 - 450 D 551- 5 75
c:J Phys io gra!=tl ic PrCtV Il Ce5 D 326 -350 0 451 - 4 75 D 576 - 6 00 - E l eva~Cl:l crntru rs (25 feet)
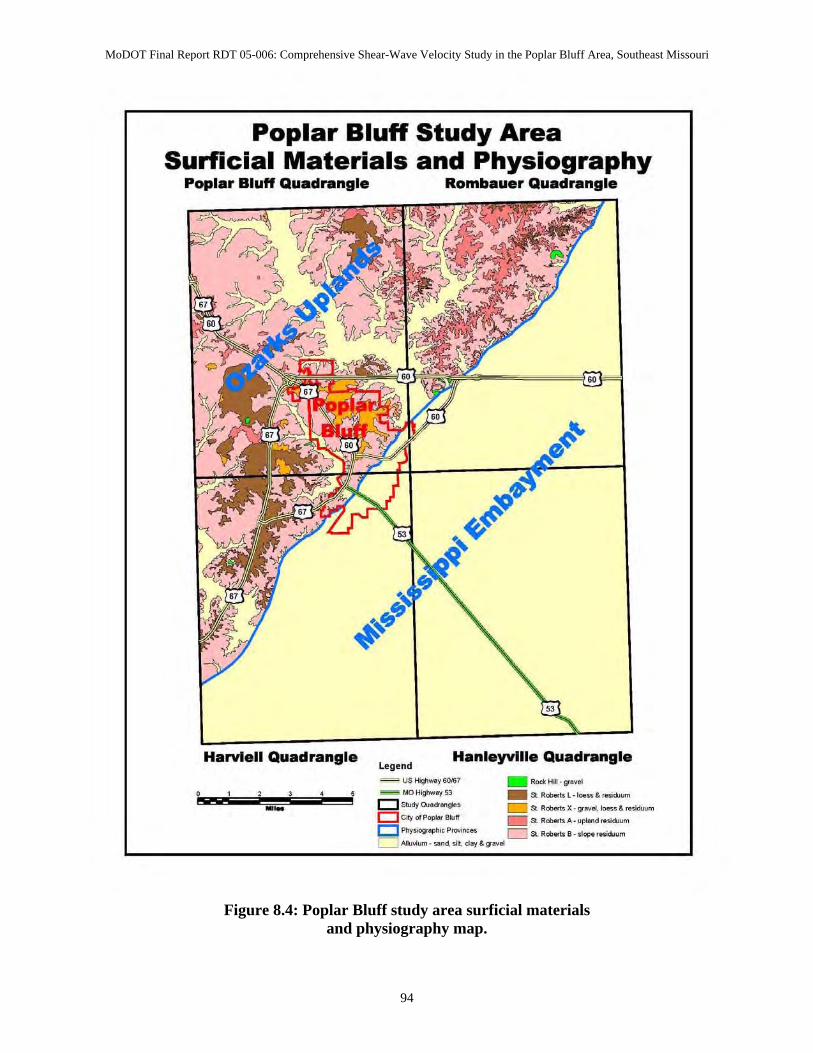
MoDOT Final Report RDT 05-006: Comprehensive Shear-Wave Velocity Study in the Poplar Bluff Area, Southeast Missouri
Figure 8.4: Poplar Bluff study area surficial materials
and physiography map.
94
Poplar Bluff Study Area Surficial Materials and Physiography
Poplar Bluff Quadrangle Rombauer Quadrangle
Harviell Quadrangle
-. Legend
Hanleyvllle Quadrangle
...... us I-tghwoy roos7 _ Rock HI - lI"'veI
- MO HigI1woy 53 _ a. R_ l_loea &. "';<1>"",
D stud'fCUoctonl/M 51. R_ X - 9' ........... ' ..-...m Dc.yolpopl«~W _ s , R_A_uplood,";cb>m
c:J Phy~ographi<: P_es 0 St. R_ B _.IOpo, .. joi,"m D AkM....,- .. nd. ... ,doy&g ....
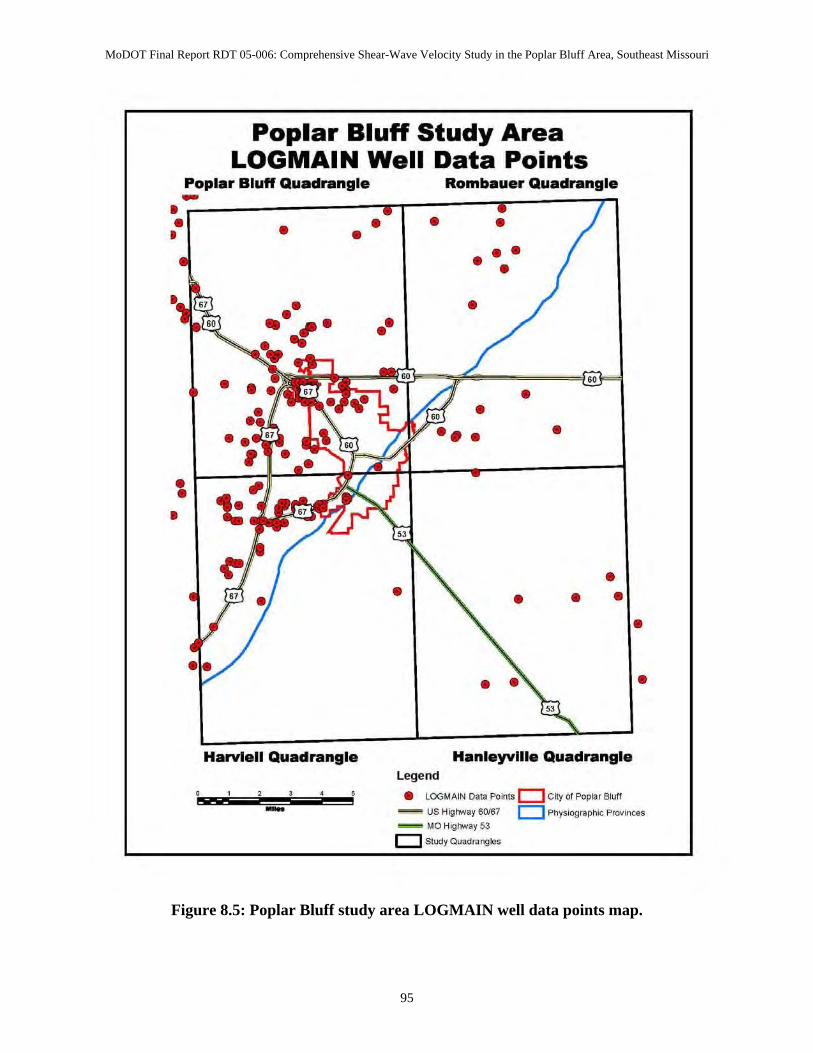
MoDOT Final Report RDT 05-006: Comprehensive Shear-Wave Velocity Study in the Poplar Bluff Area, Southeast Missouri
Figure 8.5: Poplar Bluff study area LOGMAIN well data points map.
95
Poplar Bluff Study Area LOGMAIN Well Data Points
Poplar Bluff Quadrangle Rombauer Quadrangle
'-~----------TT-----'~--~~ • • •
•• ~.3
•
• \----=f ....... =-• •
Harviell Quadrangle
•
••
•
legend
• • • • •
•
• •
•
•
•
• • •
Hanleyville Quadrangle
• LOGMAIN Data Po ints D C~ of Poplar Bluff
•
•
- US Higt'/Nay 60167 D Physlographk PrOllinCfls _ '-40 Highway 53
D Study Quadrangles
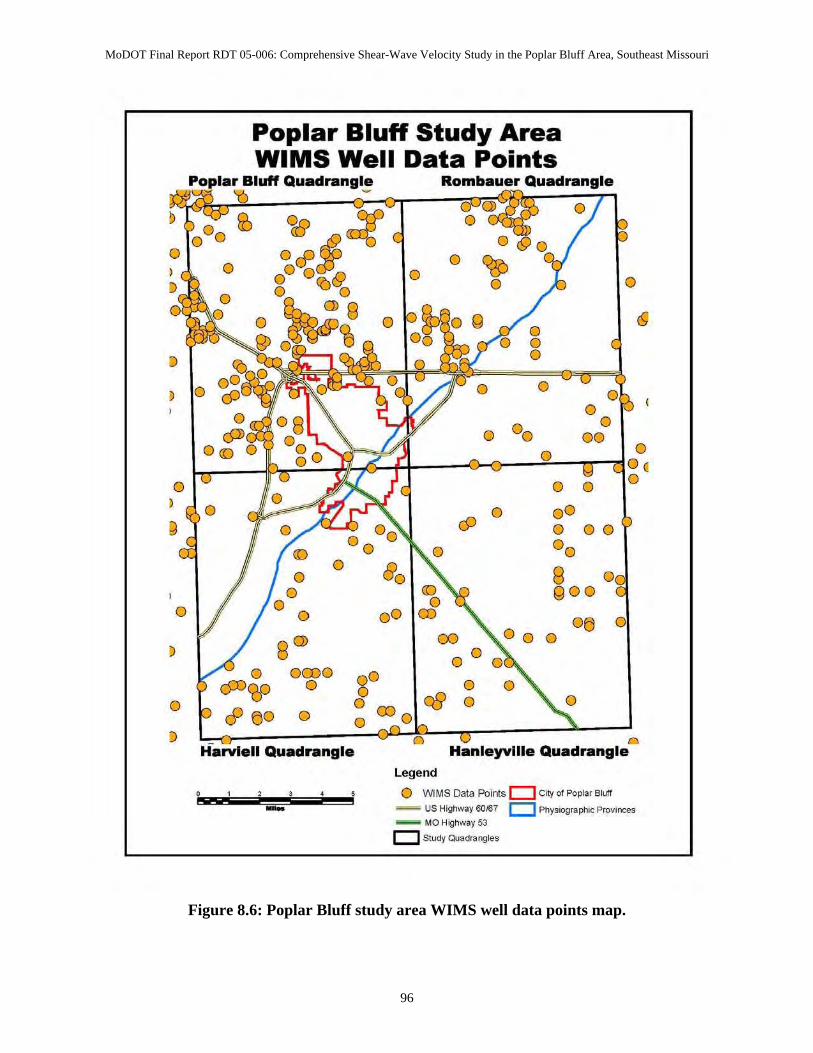
MoDOT Final Report RDT 05-006: Comprehensive Shear-Wave Velocity Study in the Poplar Bluff Area, Southeast Missouri
Figure 8.6: Poplar Bluff study area WIMS well data points map.
96
I>
0
D
,
0
g
o
o
D
Poplar Bluff Study Area WIMS Well Data Points
Poplar BluH Quadrangl~ '0
<e «f (0 000 O&:i: 0 000 r9 o <0 0
~8 0
.~~ 0 '?:l
0
0 0
Harviell Quadrangle
-
Rombauer Quadrangle
(J) 0
0<90 0 ~ 0
0 0
<9
0 0
0
0 00 0
00 0 0
0 0
0 0 0
c9 0 00 0 00 00
8 0 goo
0(:) 0 0
a c Hanleyville Quadrangle
Legend
o W1MS Data Points D City 01 Poplar Bluff
- US Highway 60~7 D Physiographic Provil'lCf:s _ MO Highway 53
D Study QJadranglO!5
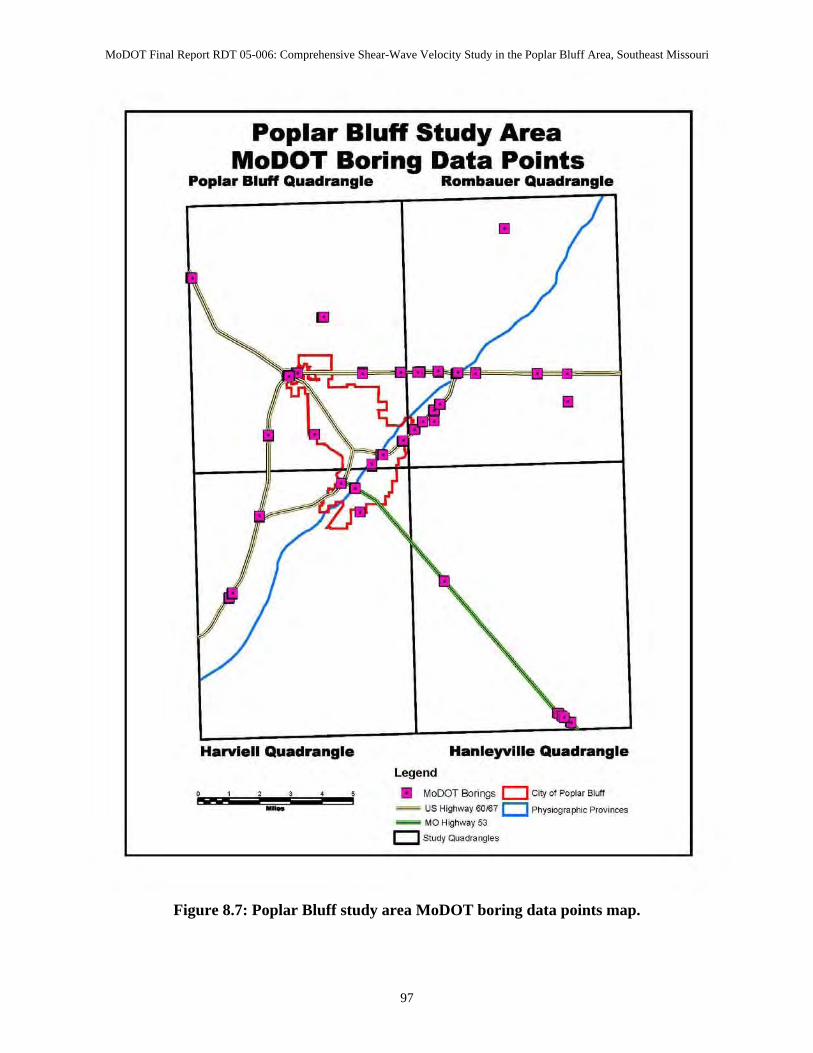
MoDOT Final Report RDT 05-006: Comprehensive Shear-Wave Velocity Study in the Poplar Bluff Area, Southeast Missouri
Figure 8.7: Poplar Bluff study area MoDOT boring data points map.
97
Poplar Bluff Study Area MoDOT Boring Data Points
Poplar BluH Quadrangle Rombauer Quadrangle
Harviell Quadrangle
-Hanleyville Quadrangle
Legend
• MoOOT Borings D City of Poplar Blut!
- US Highway 60~7 D Physiographic Provinces _ MO Highway 53
D Study QJadranglO!5
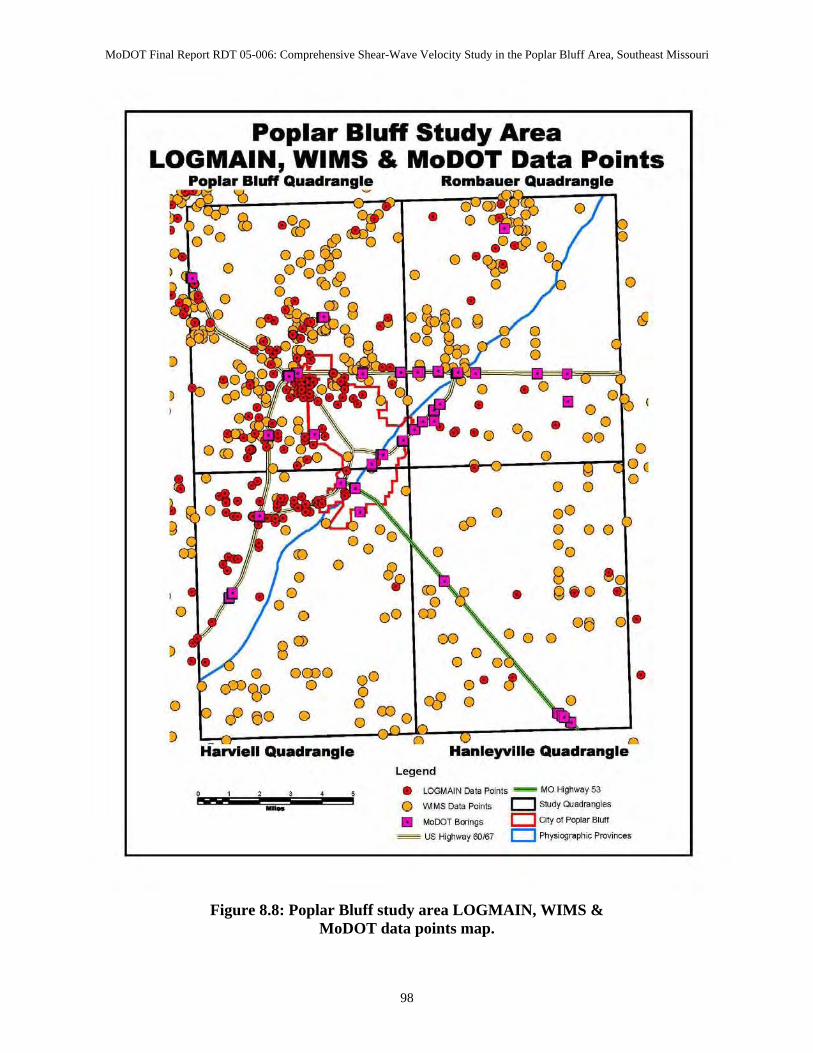
MoDOT Final Report RDT 05-006: Comprehensive Shear-Wave Velocity Study in the Poplar Bluff Area, Southeast Missouri
Figure 8.8: Poplar Bluff study area LOGMAIN, WIMS &
MoDOT data points map.
98
Poplar Bluff Study Area LOGMAIN, WIMS & MoDOT Data Points
D
o
D
BluH Quadrangl~ Rombauer Quadrangle
omo o
o
Quadrangle
-
00
8 ro o
o
• • 00 •
0 a
0 0 0
c9 0 00
0 00 00
8 • g . O
0(:) 0
•
Lege nd
'" Hanleyville Quadrangle
• lOGMAlN Data POnts _ MO Highway ~
o WMSData Poinl5 D Study Cliadrangles
• MoOOT Baings D a ry of Popl~ r BI,,"
~ US Hi!,11Way &J/ISl D Physiogrllphic Provinces
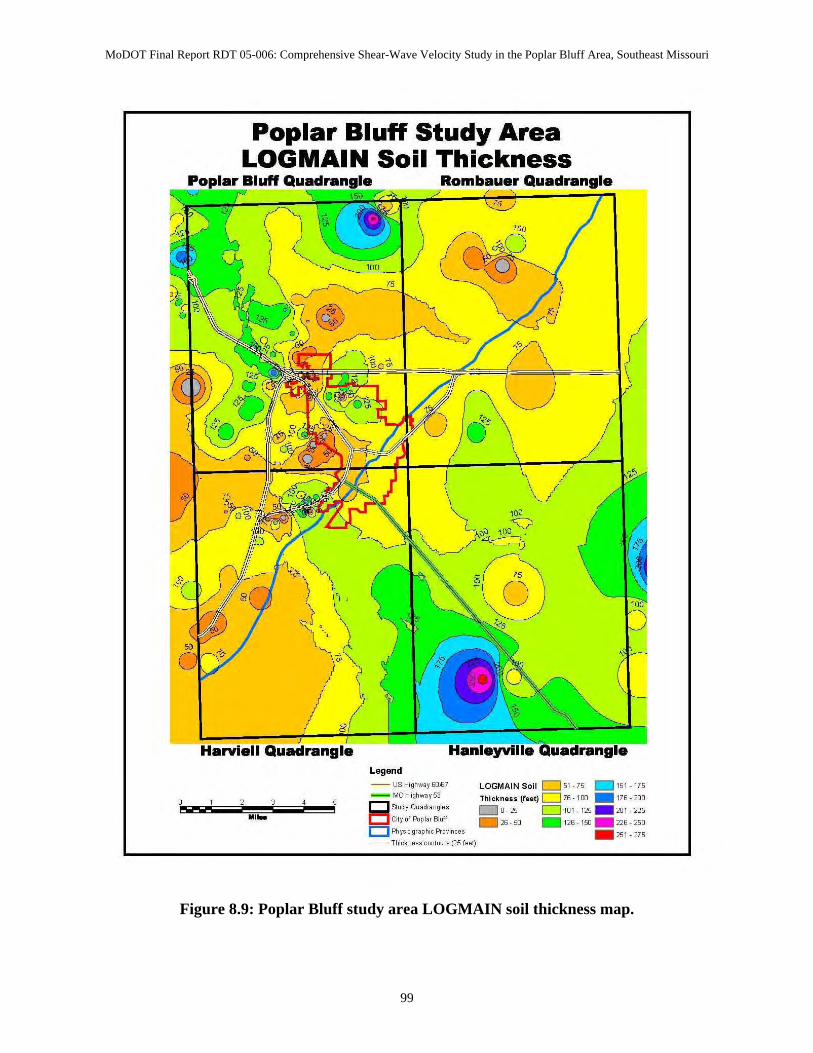
MoDOT Final Report RDT 05-006: Comprehensive Shear-Wave Velocity Study in the Poplar Bluff Area, Southeast Missouri
Figure 8.9: Poplar Bluff study area LOGMAIN soil thickness map.
99
Poplar Bluff Study Area LOGMAIN Soil Thickness
Harviell
., ...
Legend
- us Highway 60.67 _ MO Highway 53
c:::J &udy Quadrangles
c::J Cit y of Popla r Bluff
c::J Physo graphic Pr ovinces
- Th iekn ess co ntours (2 5 feet)
LOGMAIN Soil D 51 - 75 _ 151 - 175
Thickness(feetl D 76-1 00 _ 176 200
0-25 0 101-125 _ 201-225
_ 25 -50 _ 126-150 _ 226250
_ 251- 275
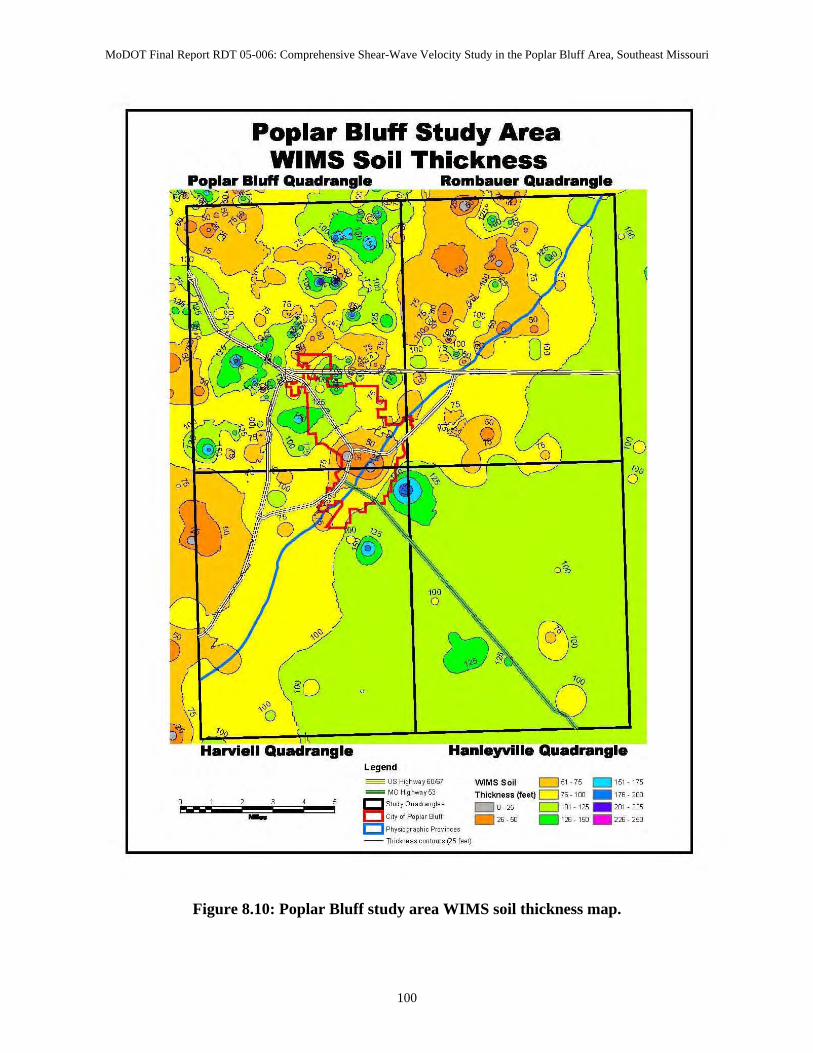
MoDOT Final Report RDT 05-006: Comprehensive Shear-Wave Velocity Study in the Poplar Bluff Area, Southeast Missouri
Figure 8.10: Poplar Bluff study area WIMS soil thickness map.
100
Poplar Bluff Study Area WIMS Soil Thickness
Poplar Bluff Quadrangle Rombauer Quadrangle 'IijI!!J ~ ~ 8 - 0
, o lb
70
Harviell Quadrangle Hanleyville Quadrangle
-Legend _ us H ig hw.y60~7
IiiiiiI MO Highway53
c::J Stud), Quadrangles
D CityofPoplar EJ uff
D Physiograph ic Provinces
-Thic knesscontours(25fee tj
VIJIMSSoil 0 51-75 _ 151-175
Thickness (feet) D 76 - 100 _ 176 - 200
D O-25 0 101-125 _ 201-225
_ 26-50 _ 126 -1 W . 226-250
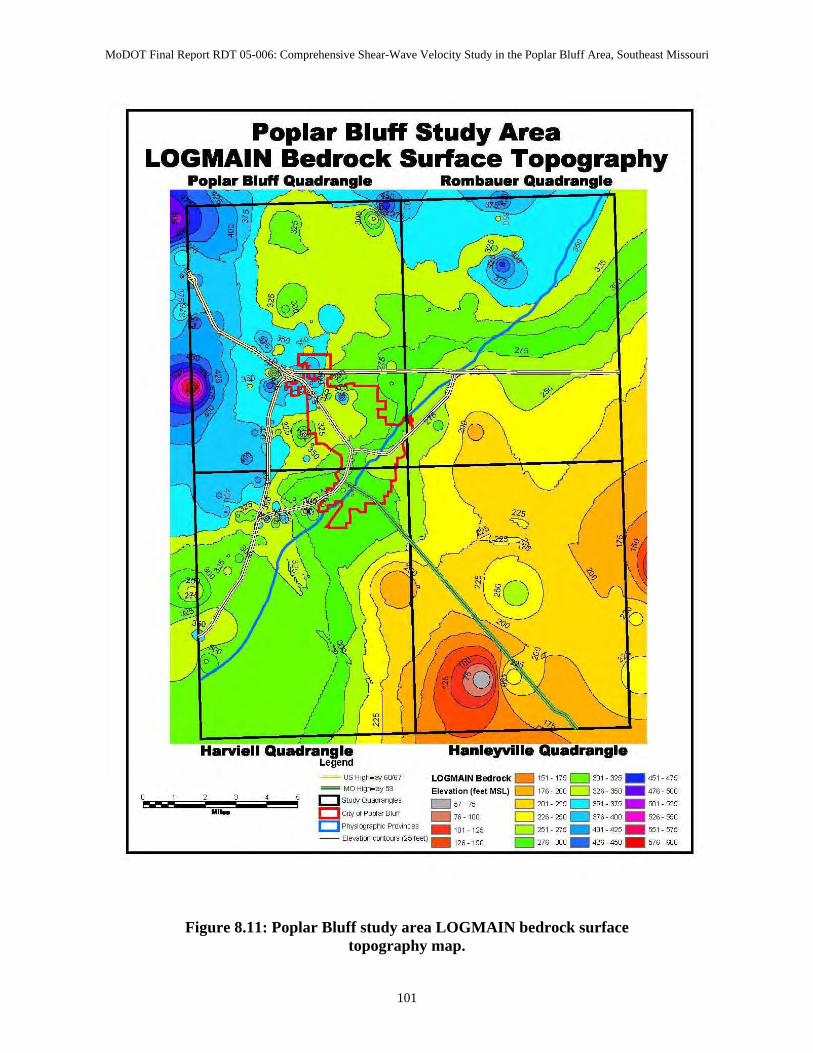
MoDOT Final Report RDT 05-006: Comprehensive Shear-Wave Velocity Study in the Poplar Bluff Area, Southeast Missouri
Figure 8.11: Poplar Bluff study area LOGMAIN bedrock surface topography map.
101
Poplar Bluff Study Area LOGMAIN Bedrock Surface Topography
Bluff
- u s Highway 6[1'67 LOGMAIN Bedrock _ 151- m '" 325 _ 451 '" _ MO Higrl/oiay 53 Elevation (feet MSL) 0 176 ::TIO D 326 350 _ 476 me c::J Slucly Qu3:1rang es 57 - 75 D "" '" "" 375 _ 501
'" ., ... D City ct P O~3" B luff _ 76 - 100 D ", 25 0 _ 376 400 _ 526
'" c::J PhysiCJ;lraph c Pro'.1nc es _ 101 - 125 D '" 275 _ 401 425 _ 551
'" -- Elevab m cmtOlr s (25 feet) _ 126 - 150
'" 3]0 _ 426 450 _ 576 me
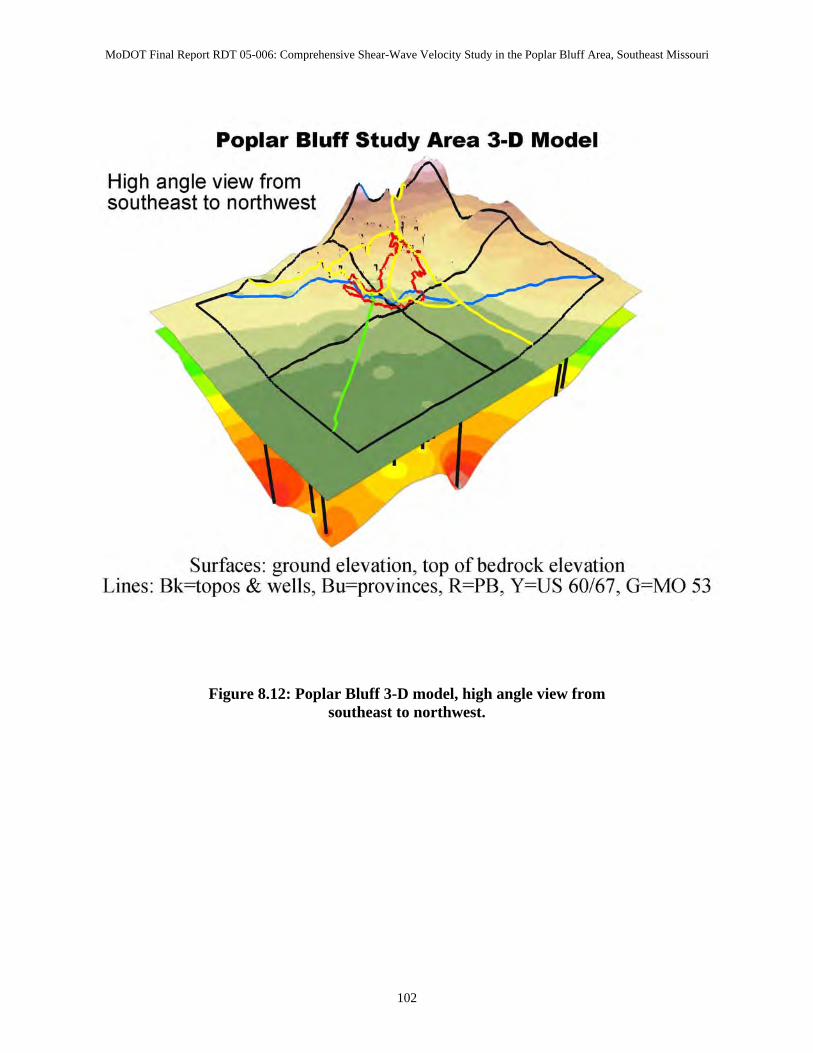
MoDOT Final Report RDT 05-006: Comprehensive Shear-Wave Velocity Study in the Poplar Bluff Area, Southeast Missouri
Figure 8.12: Poplar Bluff 3-D model, high angle view from southeast to northwest.
102
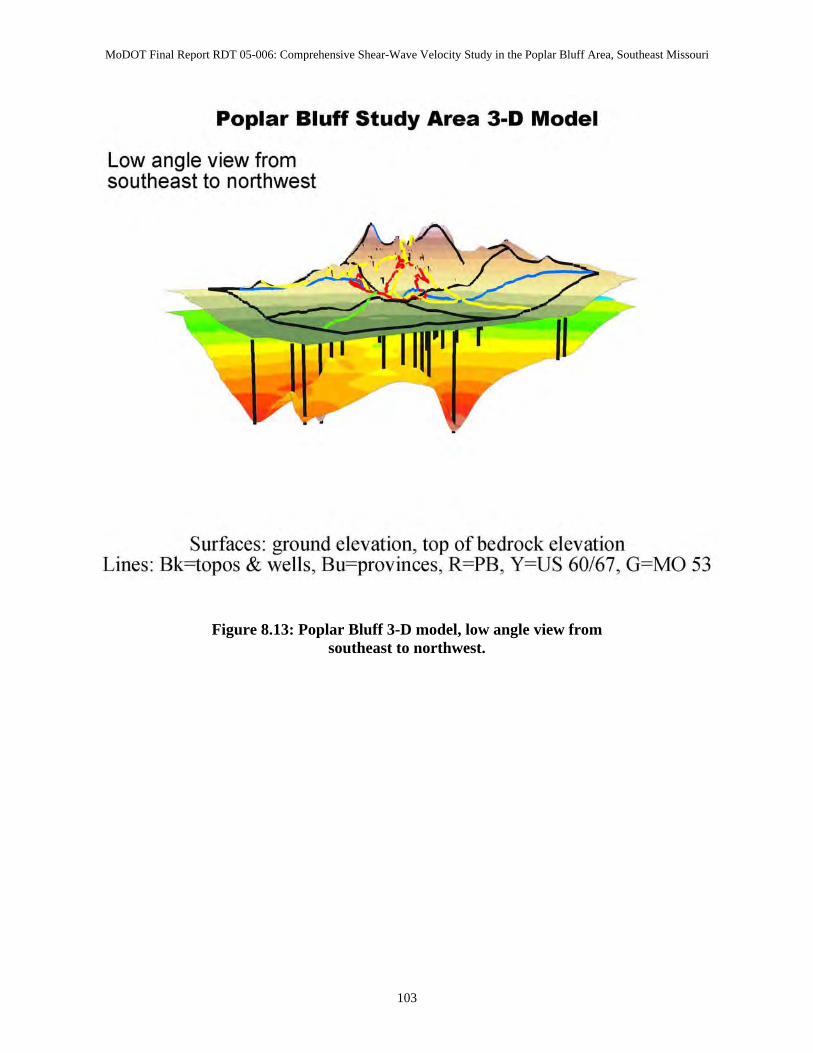
MoDOT Final Report RDT 05-006: Comprehensive Shear-Wave Velocity Study in the Poplar Bluff Area, Southeast Missouri
Figure 8.13: Poplar Bluff 3-D model, low angle view from southeast to northwest.
103
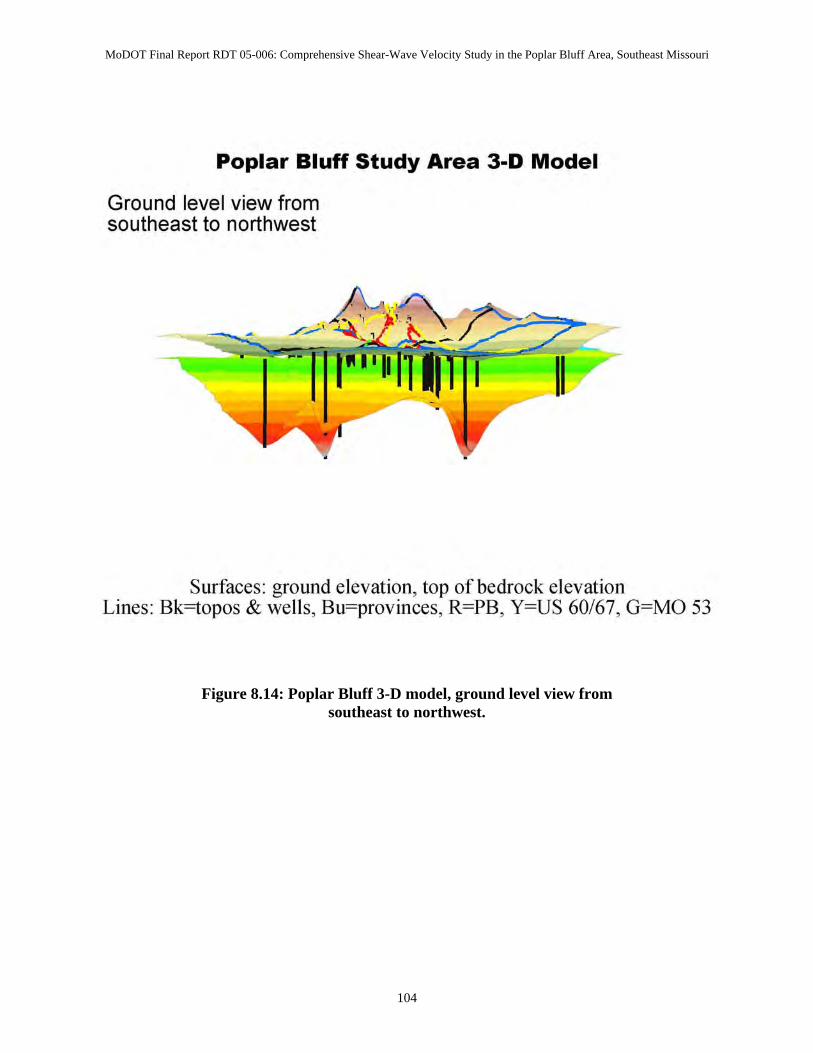
MoDOT Final Report RDT 05-006: Comprehensive Shear-Wave Velocity Study in the Poplar Bluff Area, Southeast Missouri
Figure 8.14: Poplar Bluff 3-D model, ground level view from
southeast to northwest.
104
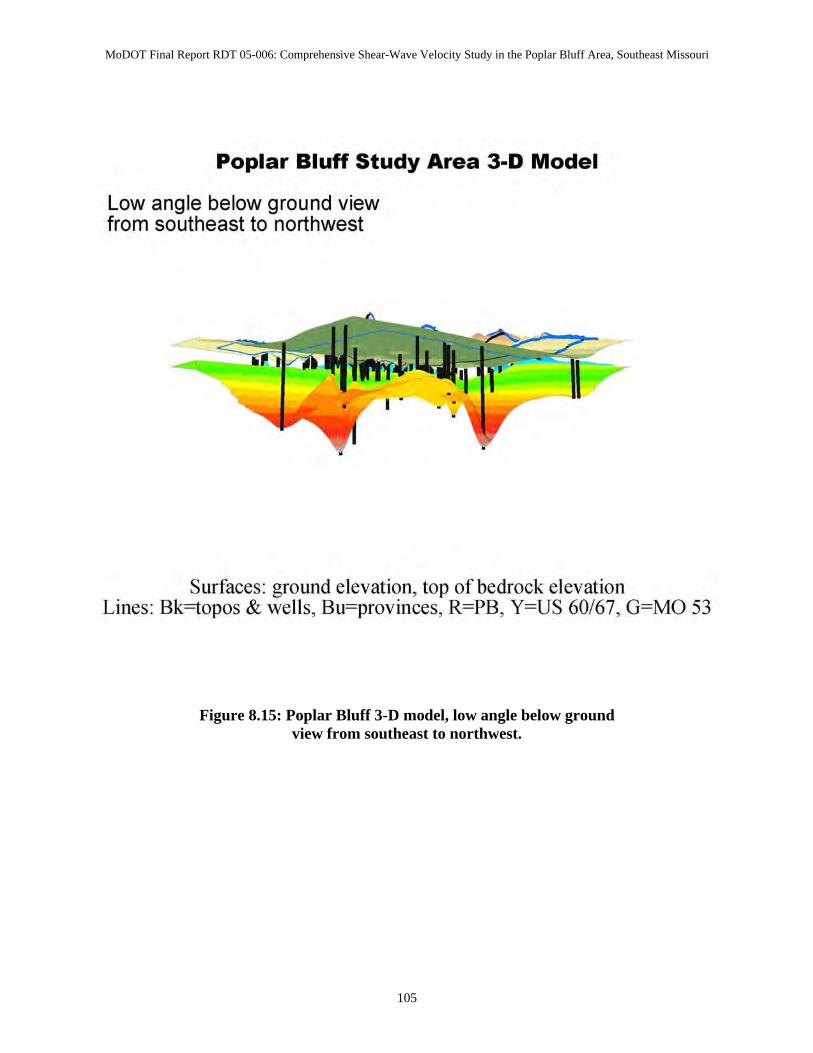
MoDOT Final Report RDT 05-006: Comprehensive Shear-Wave Velocity Study in the Poplar Bluff Area, Southeast Missouri
Figure 8.15: Poplar Bluff 3-D model, low angle below ground view from southeast to northwest.
105
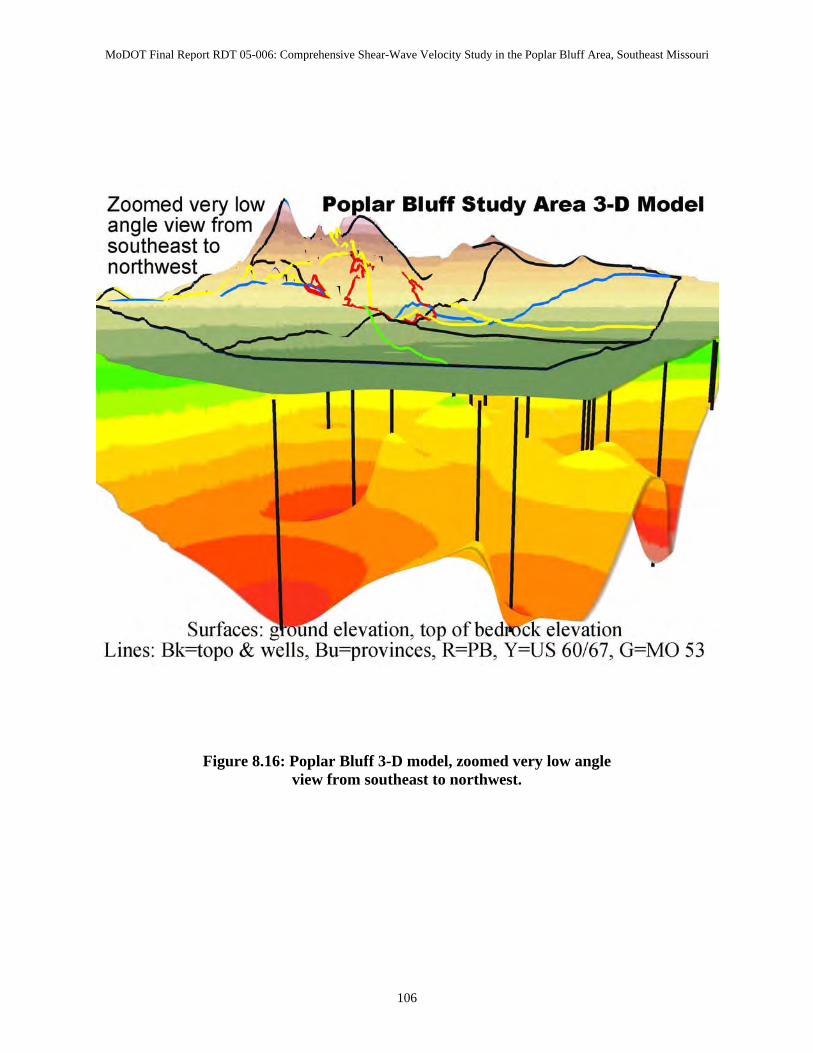
MoDOT Final Report RDT 05-006: Comprehensive Shear-Wave Velocity Study in the Poplar Bluff Area, Southeast Missouri
Figure 8.16: Poplar Bluff 3-D model, zoomed very low angle view from southeast to northwest.
106
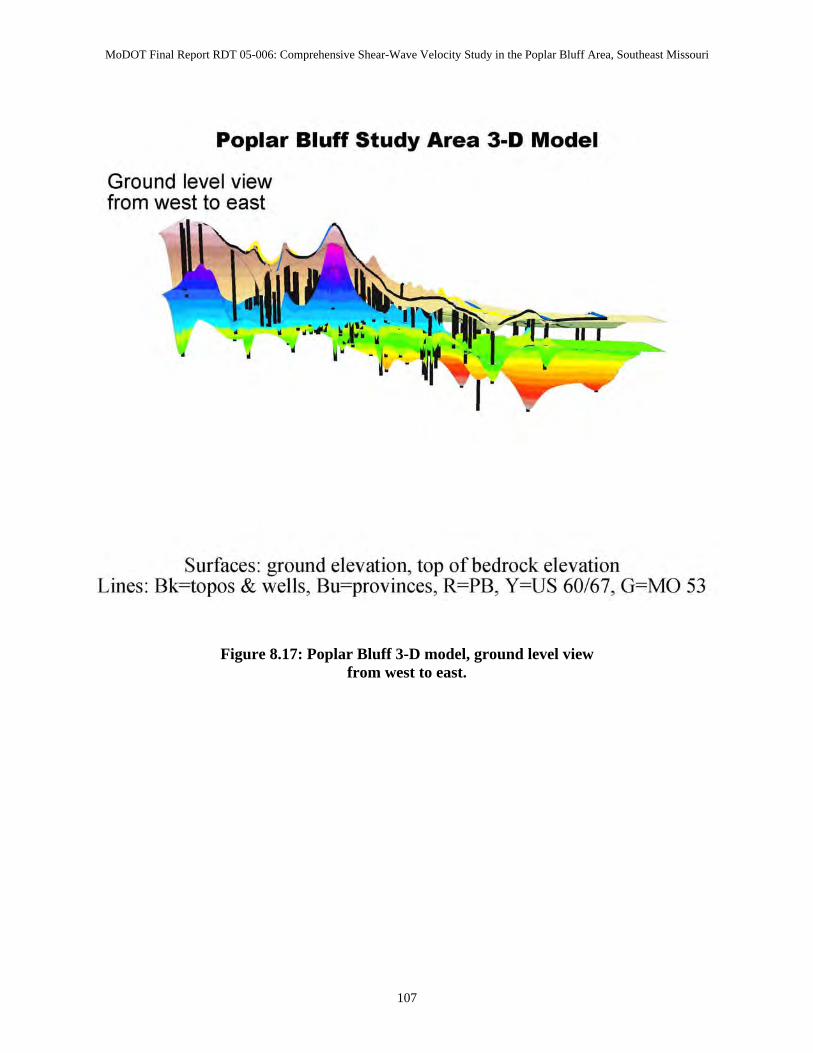
MoDOT Final Report RDT 05-006: Comprehensive Shear-Wave Velocity Study in the Poplar Bluff Area, Southeast Missouri
Figure 8.17: Poplar Bluff 3-D model, ground level view from west to east.
107
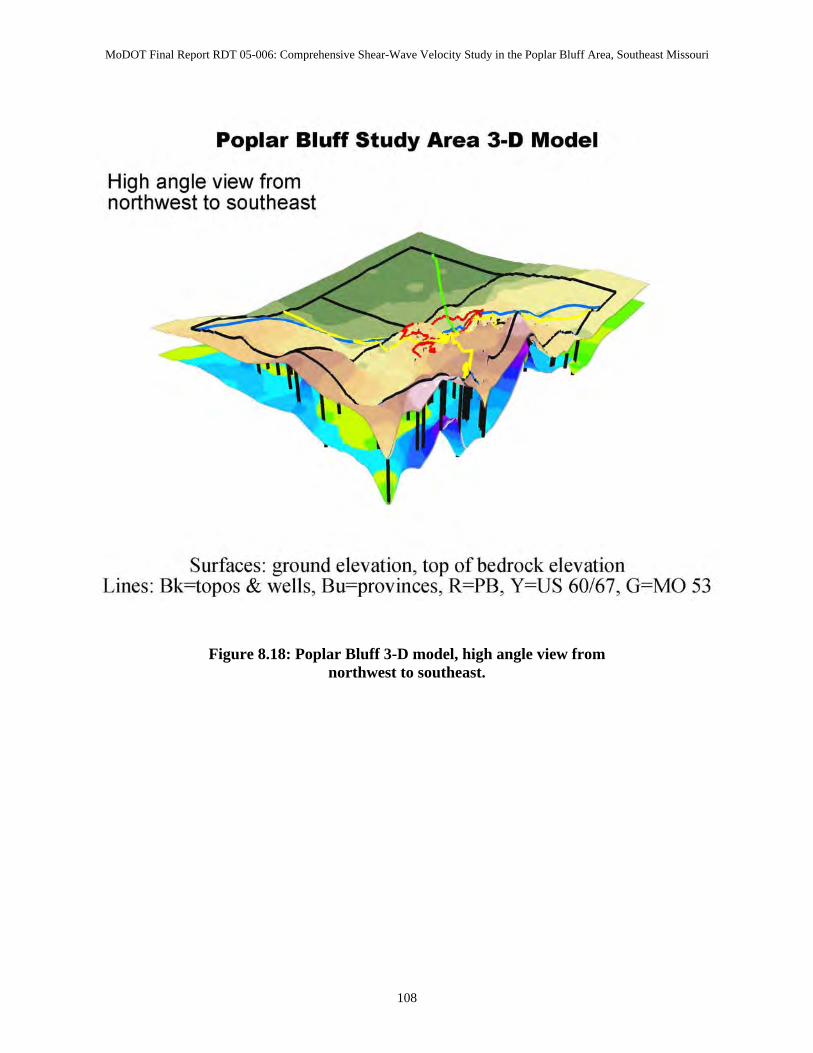
MoDOT Final Report RDT 05-006: Comprehensive Shear-Wave Velocity Study in the Poplar Bluff Area, Southeast Missouri
Figure 8.18: Poplar Bluff 3-D model, high angle view from northwest to southeast.
108
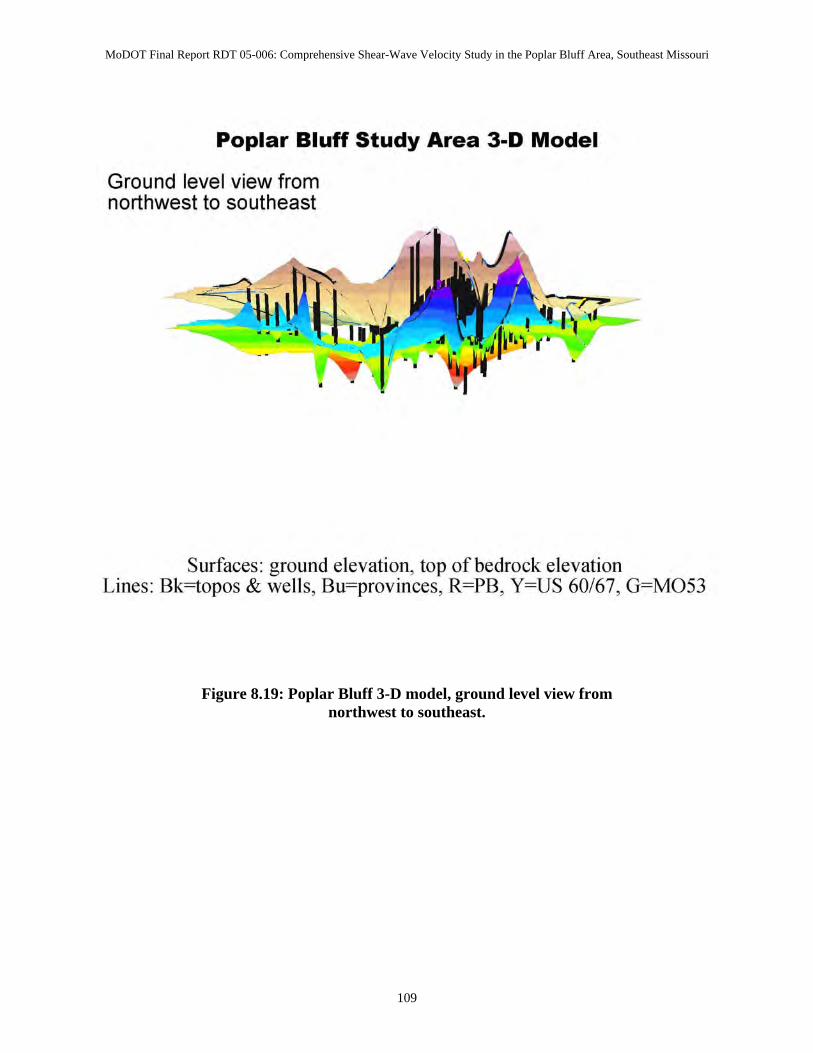
MoDOT Final Report RDT 05-006: Comprehensive Shear-Wave Velocity Study in the Poplar Bluff Area, Southeast Missouri
Figure 8.19: Poplar Bluff 3-D model, ground level view from northwest to southeast.
109
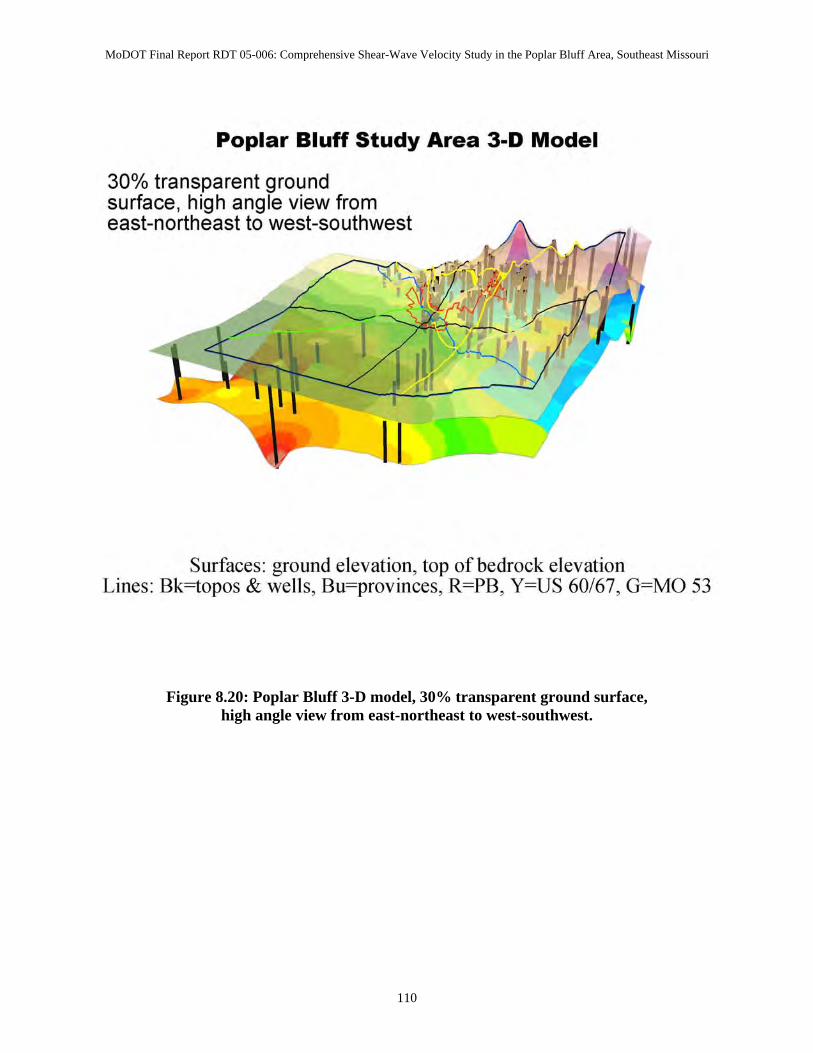
MoDOT Final Report RDT 05-006: Comprehensive Shear-Wave Velocity Study in the Poplar Bluff Area, Southeast Missouri
Figure 8.20: Poplar Bluff 3-D model, 30% transparent ground surface, high angle view from east-northeast to west-southwest.
110
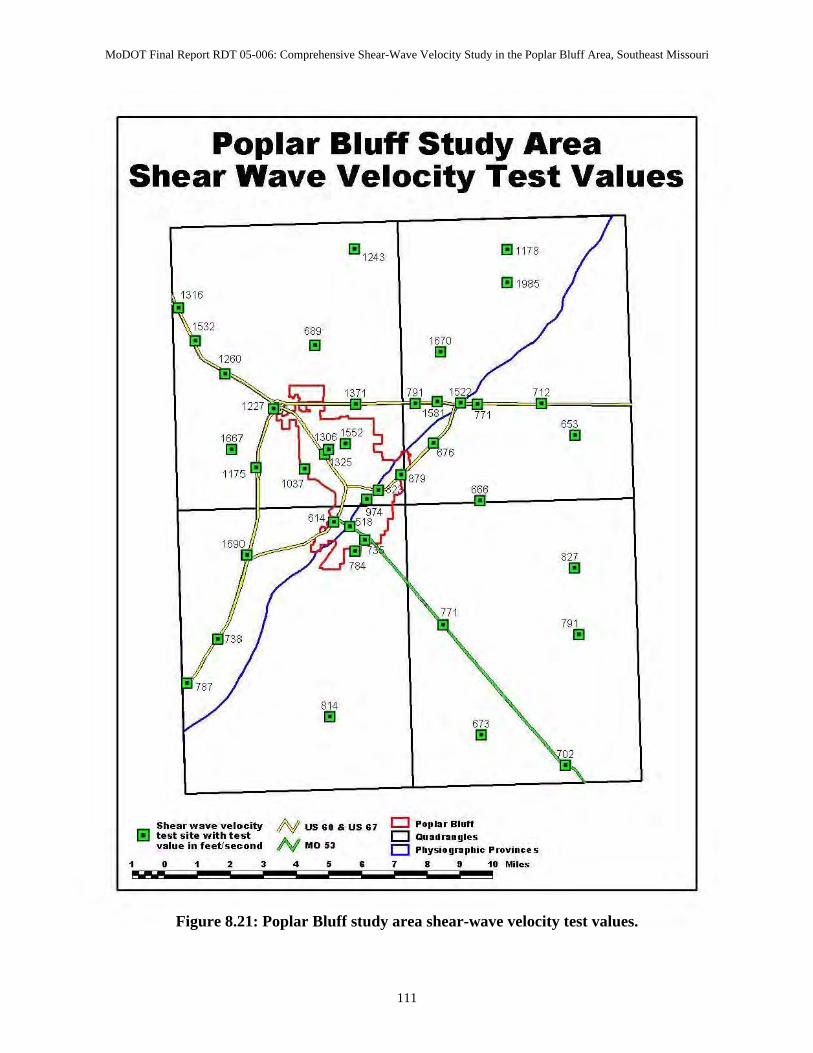
MoDOT Final Report RDT 05-006: Comprehensive Shear-Wave Velocity Study in the Poplar Bluff Area, Southeast Missouri
Figure 8.21: Poplar Bluff study area shear-wave velocity test values.
111
Poplar Bluff Study Area Shear Wave Velocity Test Values
,
1316
1667 I!I
• 1175
Shear wave velocity I!l test site with test
value in feet/second , , , , 1"Iw.-.-
689 I!I
81 4 I!I
1!11243
1371 •
N us GO &. US &7
N M053
4 , ,
1!11178
1670 I!I
791 712 • •
771
666 •
673 I!I
D Poplu Bluff
D QUlldnlngles
D Physiographic Provinces
7 I 9 10 Miles
• 653 I!I
827 I!I
791 I!I
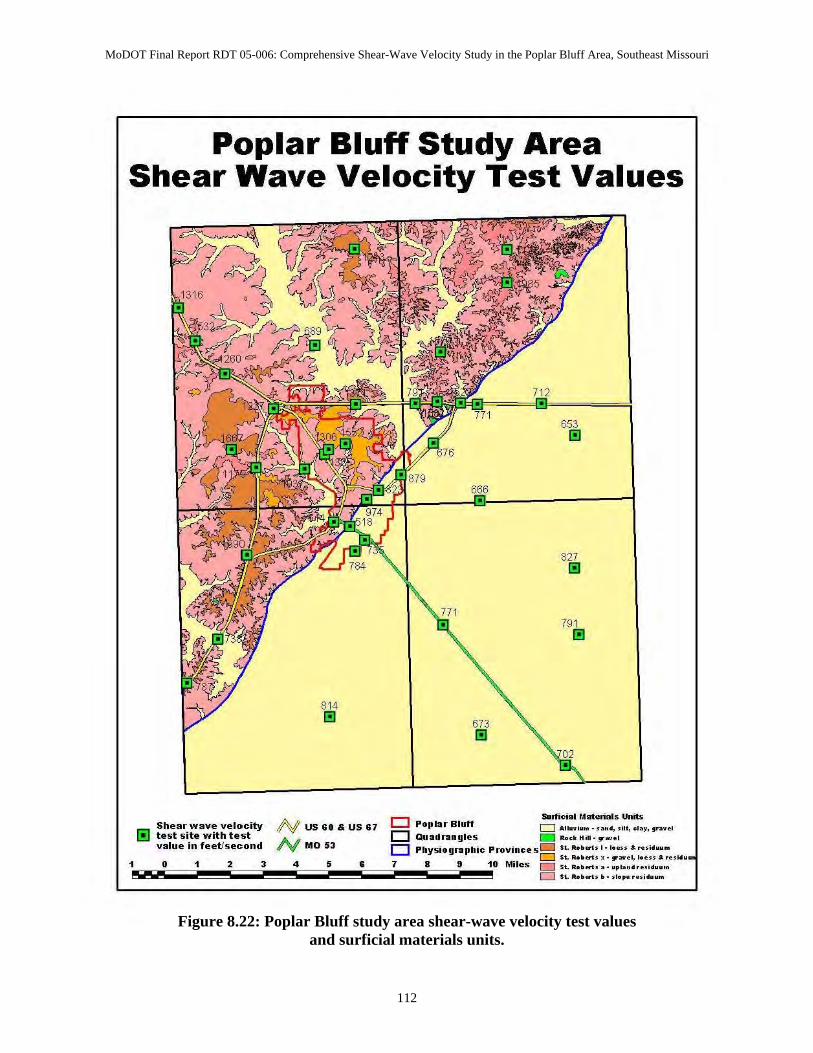
MoDOT Final Report RDT 05-006: Comprehensive Shear-Wave Velocity Study in the Poplar Bluff Area, Southeast Missouri
Figure 8.22: Poplar Bluff study area shear-wave velocity test values
and surficial materials units.
112
Poplar Bluff Study Area Shear Wave Velocity Test Values
, Shear wave velocity
I!l test site with test value in feet/second , , , ,
1"Iw.-.-
814 I!I
N us GO &. US &7
N M053
4 , , D D D ,
673 I!I
653 I!I
827 I!I
79 1 I!I
SlIme;,,' Materials Units Poplar Bluff D ... , ........ . ... , •• t, ., •• , , •• V O'
Quadnmgles _ Rook HOI· ..... , Physiographic Province s . st. Ro. ort. ,- I . . .. ...... HI.u ..
D st ..... ort. X· .... . " I . . ........ ; •••
I 9 10 Miles D st ..... ort ••••• , •••• • • ; ... ..
D st ..... ort •• • . .... . . . ; ... ..
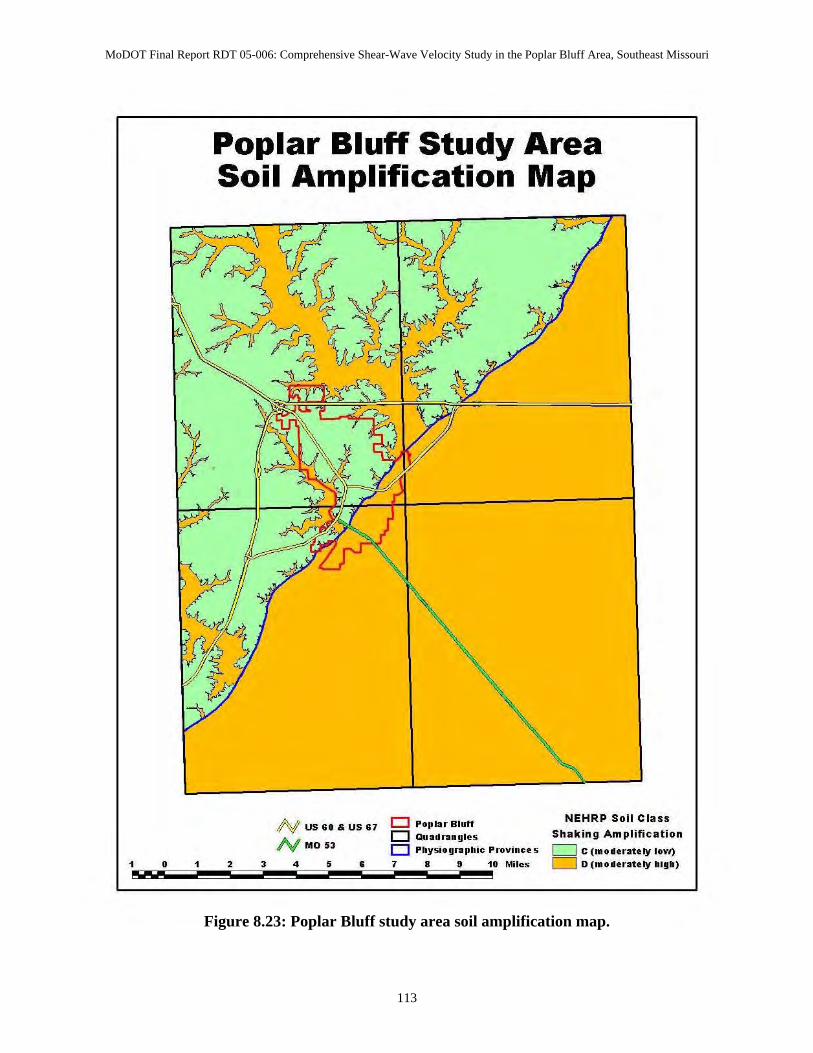
MoDOT Final Report RDT 05-006: Comprehensive Shear-Wave Velocity Study in the Poplar Bluff Area, Southeast Missouri
Figure 8.23: Poplar Bluff study area soil amplification map.
113
, , 1"Iw.-.-
,
Poplar Bluff Study Area Soil Amplification Map
, , N us GO &. us &7
N M053
4 , , D Poplu Bluff
D QUlldnlngles
D Physiographic Provinces
7 I 9 10 Miles
NEHRP Soil Class
Shaking Amplification
D C (moderately low)
D D (moderately high)
MoDOT Final Report RDT 05-006: Comprehensive Shear-Wave Velocity Study in the Poplar Bluff Area, Southeast Missouri
9. DISCUSSION AND RECOMMENDATIONS 9.1 Overview Multi-channel Analysis of Surface Waves (MASW), Seismic Cone Penetrometer (SCPT) Crosshole Shear-wave velocity (CH) and Ultrasonic Pulse Velocity Laboratory Test (UPV) data sets were acquired in the Poplar Bluff study area. The primary objective was to evaluate (individually and comparatively) the utility of these methods for determining the shear-wave velocity of surficial soils. These four methods were evaluated individually and comparatively in terms of accuracy, functionality, cost-effectiveness and overall utility. In addition, a suite of 3-D maps depicting spatial variations in thickness, stratigraphy and shear-wave velocity of soils in Poplar Bluff area were prepared as well as a revised 3-D shallow subsurface materials map complete with shear-wave velocity test data (suitable for preparation of an earthquake soil amplification map). These maps depict the lateral variability of the shallow subsurface materials' shear-wave velocity and stratigraphy, and their range of values or properties. Individual tabularized summaries of each of the four methods (CH, SCPT, MASW and UPV) are presented as Table 5.1, 5.2, 5.3 and 6.3, respectively. Tabularized comparative analyses are presented in Table 7. 9.2 Conclusions and Recommendations Our conclusions with respect to the utility of each of the four methods to MoDOT are summarized below. CH shear-wave velocity data are much more reliable than SCPT and UPV data and slightly more reliable than MASW data. However, in our opinion, the cost of acquiring CH data generally does not justify the expense associated with drilling and casing twinned (or tripled) boreholes down to the base of the zone of interest. We do not recommend the acquisition of CH shear-wave velocity data as part of routine geotechnical site investigation work. UPV shear-wave velocity data are comparable to CH, SCPT and MASW. Unfortunately, UPV data are expensive to acquire as the laboratory tests are performed on borehole soil samples. We do not recommend that UPV data be acquired during routine geotechnical site characterization. However, if soil samples are being collected for other geotechnical laboratory analysis purposes, we recommend that UPV tests be performed on such samples. SCPT shear-wave data are less reliable than either CH or MASW data. The SCPT tool also suffers from significant operational limitations. For examples, SCPT data cannot normally be acquired in areas inaccessible to drill rigs, on paved roadway, in bedrock, or in dense or rocky soil. Indeed, most of the SCPT shear-wave velocity profiles acquired in the Poplar Bluff study area were terminated (because of penetration limitations) at depths much shallower than 100 ft (base depth of interest). On the upside, the CPT data (acquired
114
MoDOT Final Report RDT 05-006: Comprehensive Shear-Wave Velocity Study in the Poplar Bluff Area, Southeast Missouri
simultaneously with SCPT data) may have significant benefit to MoDOT. We recommend that MoDOT acquire SCPT data only when/where CPT control is required. MASW shear-wave velocity data are more reliable than SCPT and UPV data and only slightly less reliable than CH data. The MASW tool has significant advantages over both the CH, UPV and SCPT tools. MASW data are much less expensive than CH and UPV data and can normally be acquired in areas inaccessible to drill rigs. MASW data are less expensive than SCPT data and can normally be acquired in areas inaccessible to SCPT rigs such as on paved roadway, within bedrock or dense or rocky soil. Indeed, the MASW shear-wave velocity data acquired in the Poplar Bluff study area routinely extended to depths below 100 ft. One other real advantage the MASW tool has over both the CH and SCPT tools is that it can be used to map variable depth to bedrock. On the basis of the comparative analyses of the shear-wave velocity data acquired in the Poplar Bluff study area, we conclude that the MASW method is by far the most cost-effective tool for determining the shear-wave velocity of soils for geotechnical site investigation purposes. We recommend that MoDOT employ MASW technology routinely at geotechnical sites where shear-wave velocity control and/or information regarding variable depth to bedrock control is required. While MASW control is not a substitute for conventional borings, the tool (when used to supplement conventional borehole data) can reduce costs and/or increase the reliability/utility of the geotechnical site investigation. Improved site characterization means improved safety. 10. REFERENCES Campanella, R.G., Davies, M.P., 1994, The Seismic Piezocone: A Practical Site Investigation
Tool: Geophysical Characterization of Sites, Volume prepared by ISSMFE, Technical Committee # 10, XIII ICSMFE, New Delhi, India, Richard Woods, Editor, 49-55
Gazetas, G., 1991, Foundation Vibrations: Foundation Engineering Handbook, 2nd Edition, Hsai-
Yang Fang, and Editor, 553-593. Woods, R.D., 1978, Measurement of Dynamic Soil Properties, State of the Art Report:
Proceedings of the ASCE Geotechnical Engineering Division Specialty Conference, Earthquake Engineering and Soil Dynamics, Pasadena, CA. 1, 91-178.
Woods, R.D., 1994, Borehole Methods in Shallow Seismic Exploration: Geophysical
Characterization of Sites, Volume prepared by ISSMFE, Technical Committee # 10, XIII ICSMFE, New Delhi, India, Richard Woods, Editor, 91-100.
Liu, H.P., Boore, D.M., Joyner, W.B., Oppenheimer, D.H., Warrick, R.E., Zhang, W., Hamilton,
J.C., and Brown, L.T., 2000, Comparison of phase velocities from array measurements of Rayleigh waves associated with micro-tremor and results calculated from borehole shear-wave velocity profiles: Bulletin Seismological Society of America, 90, 666-678.
115
MoDOT Final Report RDT 05-006: Comprehensive Shear-Wave Velocity Study in the Poplar Bluff Area, Southeast Missouri
Miller, R.D., Xia, J., Park, C.B., and Ivanov, J., 2000, Shear-wave velocity field from surface waves to detect anomalies in the subsurface: Geophysics 2000, FHWA and MoDOT Special Publication, 4:8.1–4:8.10.
Nazarian, S., Stokoe, K.H., and Hudson, W.R., 1983, Use of spectral analysis of surface waves
method for determination of moduli and thicknesses of pavement systems: Transportation Research Record, 930, 38-45.
Park, C.B., Miller, R.D., and Xia, J., 1999, Multi-channel analysis of surface waves: Geophysics,
64, 800-808. Park C.B., Miller, R.D., and Xia J., 1999, Multimodal analysis of high frequency surface waves:
Proceeding of the Symposium on the Application of Geophysics to Engineering and Environmental Problems, 115-121.
Park, C.B., Miller, R.D., Xia, J., and Ivanov, J., 2000, Multi-channel seismic surface-wave
methods for geotechnical applications: Geophysics 2000, FHWA and MoDOT Special Publication, 4:7.1-4:7.11.
Stokoe, K.H., Wright, G.W., James, A.B., and Jose, M.R., 1994, Characterization of
geotechnical sites by SASW method, in Geophysical Characterization of Sites ISSMFE Technical Committee #10, edited by R.D. Woods: Oxford Publishers, New Delhi
Xia, J., Miller, R.D., and Park, C.B., 1999, Estimation of near-surface velocity by inversion of
Rayleigh waves: Geophysics, 64, 691-700. Zywicki, D.J., and Rix, G.J., 1999, Frequency-wavenumber analysis of passive surface waves:
Proceeding of the Symposium on the Application of Geophysics to Engineering and Environmental Problems, 75-84.
116
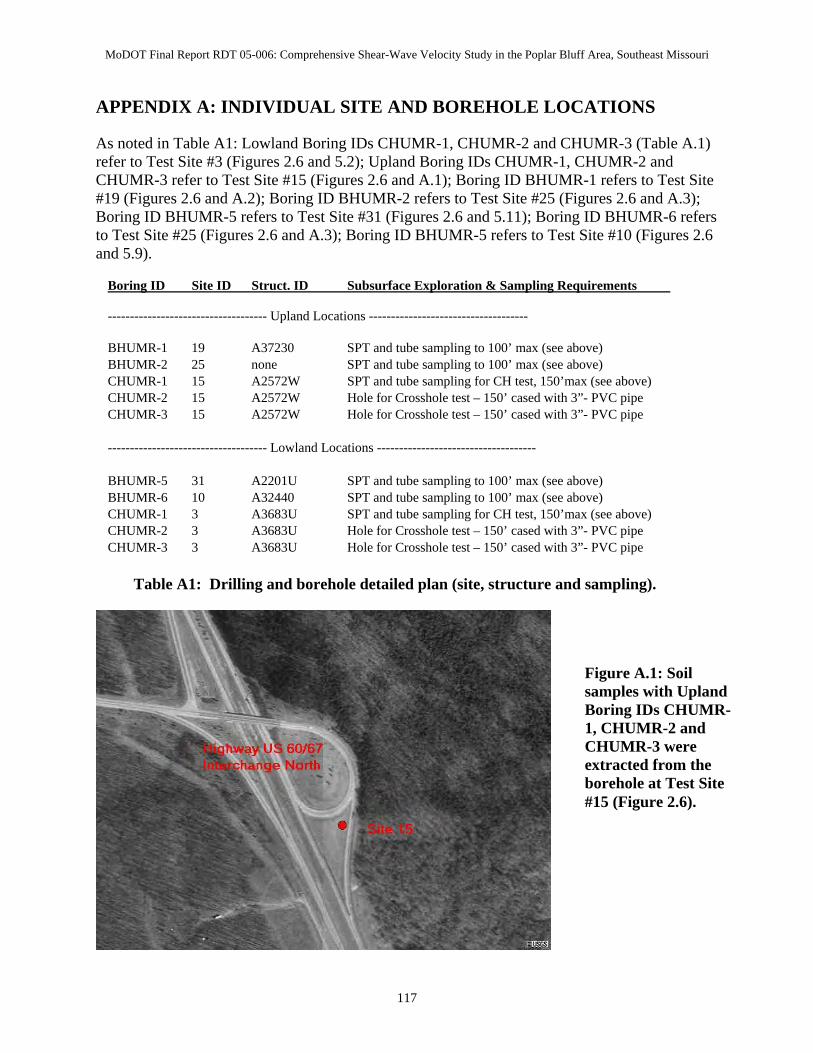
MoDOT Final Report RDT 05-006: Comprehensive Shear-Wave Velocity Study in the Poplar Bluff Area, Southeast Missouri
APPENDIX A: INDIVIDUAL SITE AND BOREHOLE LOCATIONS As noted in Table A1: Lowland Boring IDs CHUMR-1, CHUMR-2 and CHUMR-3 (Table A.1) refer to Test Site #3 (Figures 2.6 and 5.2); Upland Boring IDs CHUMR-1, CHUMR-2 and CHUMR-3 refer to Test Site #15 (Figures 2.6 and A.1); Boring ID BHUMR-1 refers to Test Site #19 (Figures 2.6 and A.2); Boring ID BHUMR-2 refers to Test Site #25 (Figures 2.6 and A.3); Boring ID BHUMR-5 refers to Test Site #31 (Figures 2.6 and 5.11); Boring ID BHUMR-6 refers to Test Site #25 (Figures 2.6 and A.3); Boring ID BHUMR-5 refers to Test Site #10 (Figures 2.6 and 5.9).
Boring ID Site ID Struct. ID Subsurface Exploration & Sampling Requirements ------------------------------------ Upland Locations ------------------------------------ BHUMR-1 19 A37230 SPT and tube sampling to 100’ max (see above) BHUMR-2 25 none SPT and tube sampling to 100’ max (see above) CHUMR-1 15 A2572W SPT and tube sampling for CH test, 150’max (see above) CHUMR-2 15 A2572W Hole for Crosshole test – 150’ cased with 3”- PVC pipe CHUMR-3 15 A2572W Hole for Crosshole test – 150’ cased with 3”- PVC pipe ------------------------------------ Lowland Locations ------------------------------------ BHUMR-5 31 A2201U SPT and tube sampling to 100’ max (see above) BHUMR-6 10 A32440 SPT and tube sampling to 100’ max (see above) CHUMR-1 3 A3683U SPT and tube sampling for CH test, 150’max (see above) CHUMR-2 3 A3683U Hole for Crosshole test – 150’ cased with 3”- PVC pipe CHUMR-3 3 A3683U Hole for Crosshole test – 150’ cased with 3”- PVC pipe
Table A1: Drilling and borehole detailed plan (site, structure and sampling).
Figure A.1: Soil samples with Upland Boring IDs CHUMR-1, CHUMR-2 and CHUMR-3 were extracted from the borehole at Test Site #15 (Figure 2.6).
117
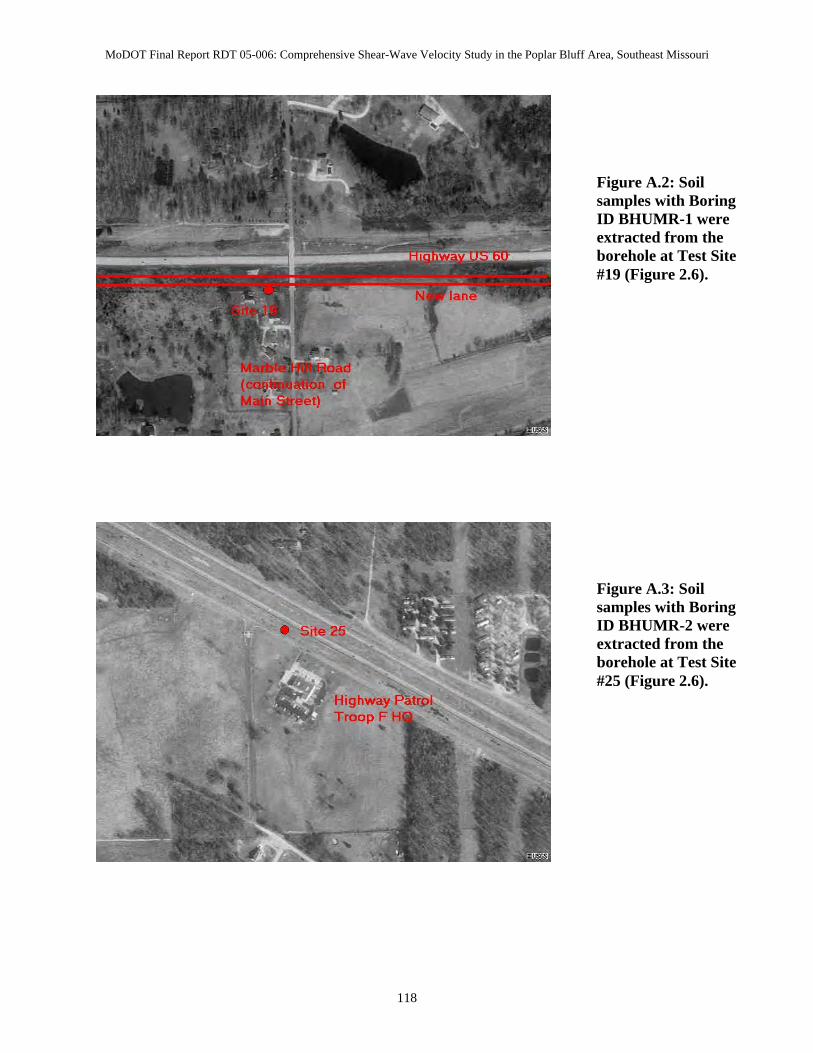
MoDOT Final Report RDT 05-006: Comprehensive Shear-Wave Velocity Study in the Poplar Bluff Area, Southeast Missouri
Figure A.2: Soil samples with Boring ID BHUMR-1 were extracted from the borehole at Test Site #19 (Figure 2.6).
Figure A.3: Soil samples with Boring ID BHUMR-2 were extracted from the borehole at Test Site #25 (Figure 2.6).
118
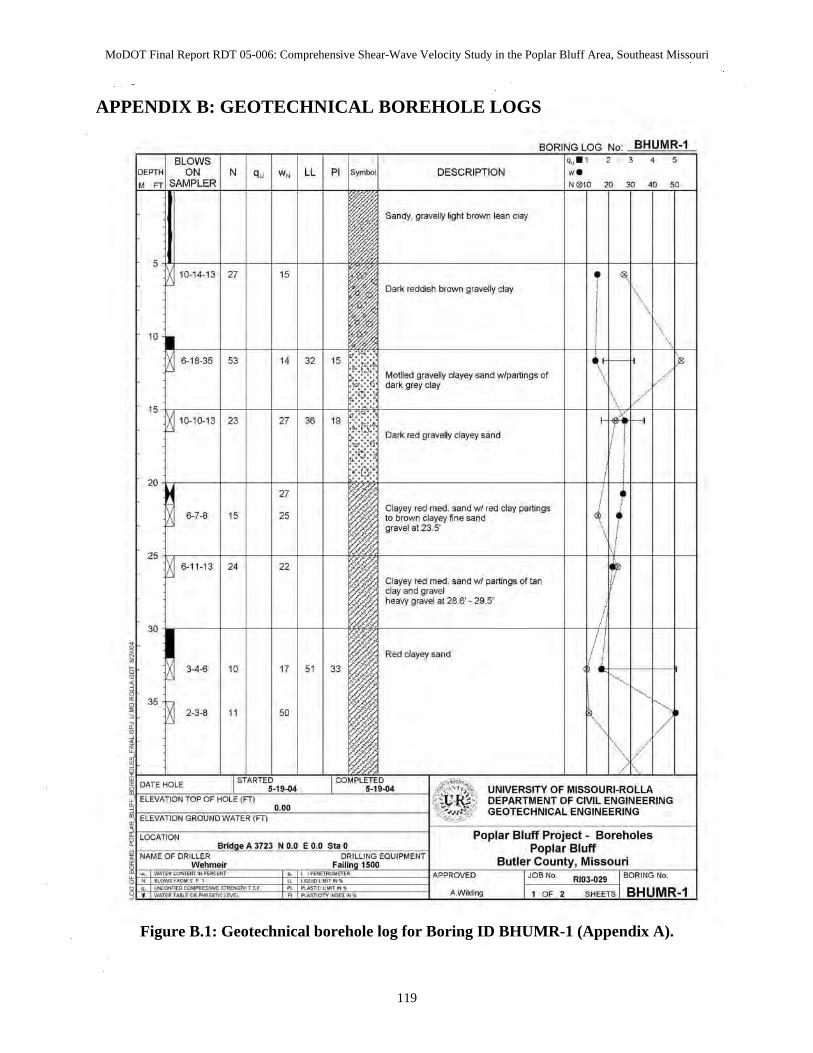
MoDOT Final Report RDT 05-006: Comprehensive Shear-Wave Velocity Study in the Poplar Bluff Area, Southeast Missouri
APPENDIX B: GEOTECHNICAL BOREHOLE LOGS
Figure B.1: Geotechnical borehole log for Boring ID BHUMR-1 (Appendix A).
119
N q, w,
5 10-14_13 " "
" 6-18-35 " "
" 10-10-13 23 "
20
" 6-7·8 " 25
25 6-11-13 " 22
30
H~ " " 35
2-3-8 " "
LL
32
36
"
DESCRIPTION
Sandy, gravel!y i gh( brown lean clay
Dark reddish brown gravely clay
Moiled gravelly clayey sand wlpartings of dark grey day
Dark red gravelly clayey sand
Clayey red me<!. sand wi red day paltingS to brown clayey fine sand gravel at 23.S'
Clayey red moo. sand wi partings of tan day and gravel heavy gravel at 28.6' - 29.5'
Red clayey sand
UNIVERSITY OF MISSOURI-ROLLA DEPARTMENT OF CIVIL ENGINEERING GEOTEC HNICAL ENGINEERING
Poplar Bluff Proj ect. Boreholes Popla r Bluff
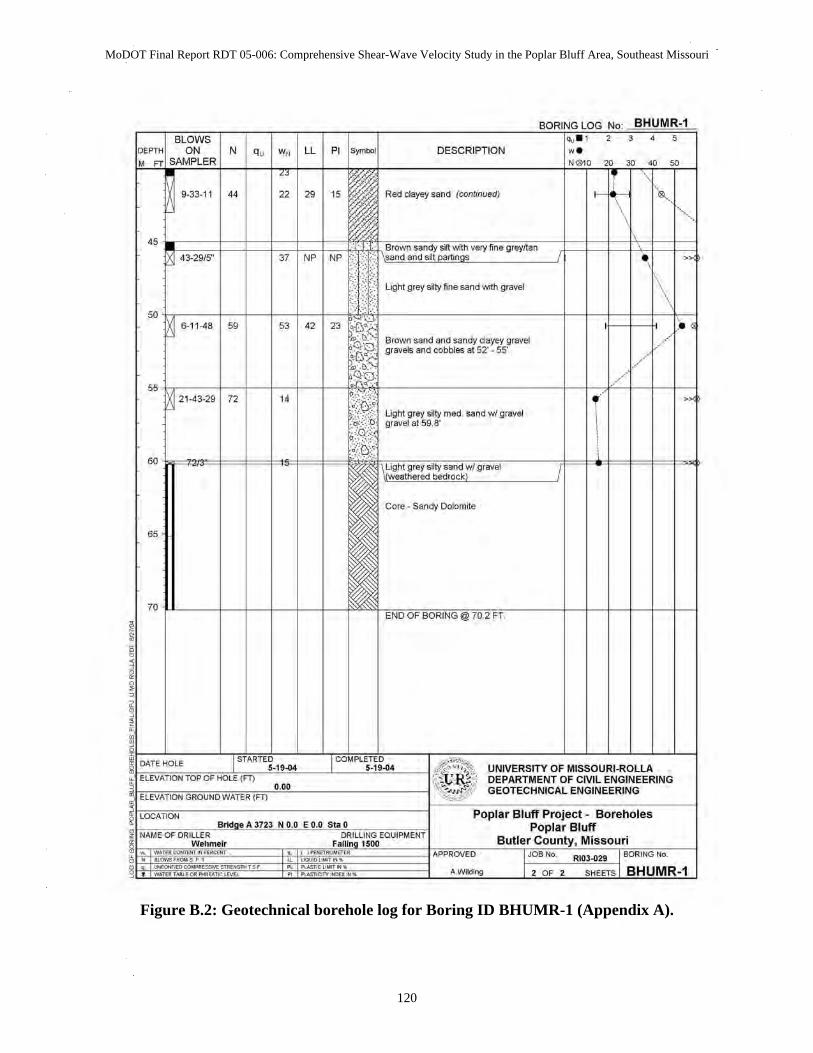
MoDOT Final Report RDT 05-006: Comprehensive Shear-Wave Velocity Study in the Poplar Bluff Area, Southeast Missouri
Figure B.2: Geotechnical borehole log for Boring ID BHUMR-1 (Appendix A).
120
N q, w, LL PI
9-33-11 44 22 29 "
"
50 6-11-48 59 53 " 23
55 21.43-29 " "
60
65
7O f-'-__ j-+-+-j-+-
DESCRIPTION ro ~ ~
Red davey sand (continued)
Light grey silty fine sand with gra~eI
Brown sand and sandy dayey gravel gravels and cobbles at 52' - 55'
Light grey silty med. sand wi gra'/el gravel at 598'
Core· Sandy Dolomrte
UNIVERSITY OF MISSOURI·ROLLA DEPARTMENT OF CIVIL ENGINEERING GEOTECHNICAL ENGINEERING
Poplar Bluff Project. Boreholes Poplar Bluff
Butler , Missouri
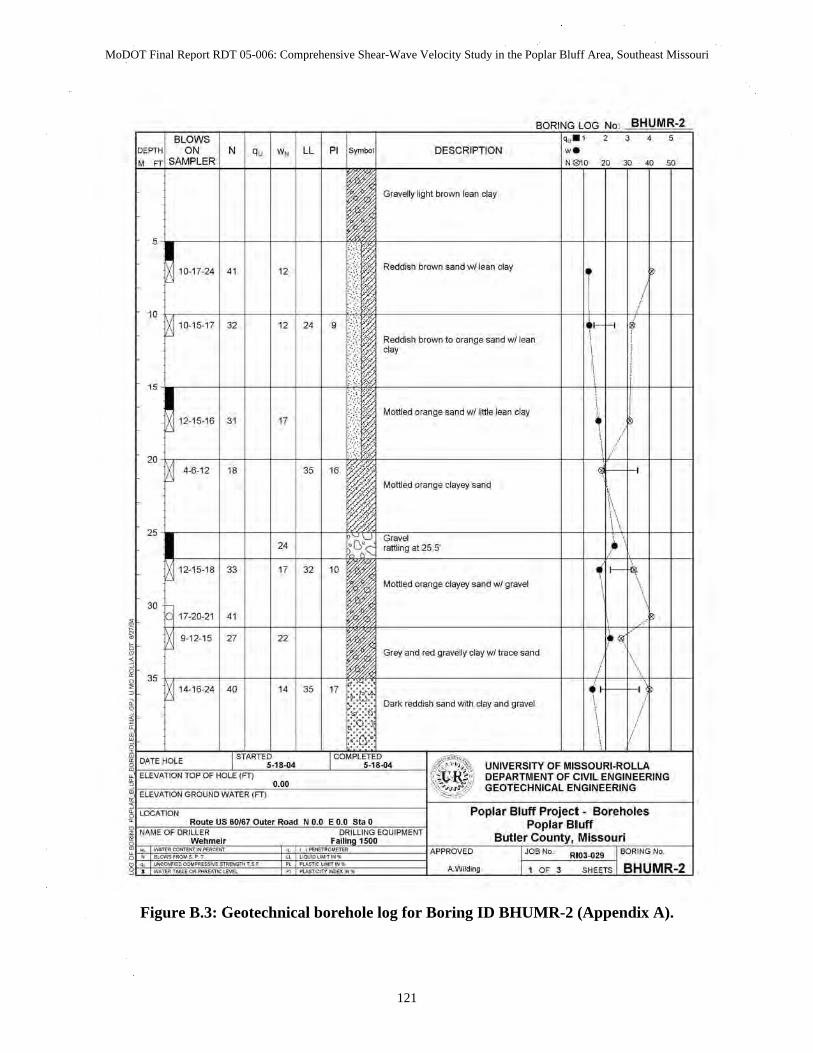
MoDOT Final Report RDT 05-006: Comprehensive Shear-Wave Velocity Study in the Poplar Bluff Area, Southeast Missouri
121
Figure B.3: Geotechnical borehole log for Boring ID BHUMR-2 (Appendix A).
BORING LOG No ~
"'~" <:~F:o N 0" w" LL PI DESCRIPTION I:~< ' , Gra~eIy ight brown lean clay
5
10-17_24 " " Reddish brown sand w/lean day
" /
~ 1()..15-17 32 " " 9 --< Reddish brown to ora nge sand wl lean , cl.y
, , I
" , 12·15-16 " "
Mottled orange sand wi kttJe lean d ay
20
,./ ~ 4-t\-12 " 35 " Mottled orange clayey sand
\.
25 II
~~i~~ al 25.5'
, " ,
12·15-18 33 " 32 " r\ Mottled orange clayey sand wI g,avel "
, 30
! 17·20·21 " 9-12·15 " 22 ~ ~
Grey and red gravefy day wi trace sand
1\ 35
! ~ 14-16-24 " " 35 " ~;:;
Oarll reddish sand with d ay and gravel
1/ , , "
.... ~ 8 UNIVERSITY OF MISSOURI-ROLLA ' . . ,,1 DEPARTMENT OF CIVIL ENGINEERING
. GEOTECHNICAL ENGINEERING
~" " .0 " .. Poplar Bluff Project - Boreholes
Poplar Bluff , ~"
, Butler r:.; n h Missouri
I " , I ~'"o. R.,." I';;:,~~~_?
'w.,~
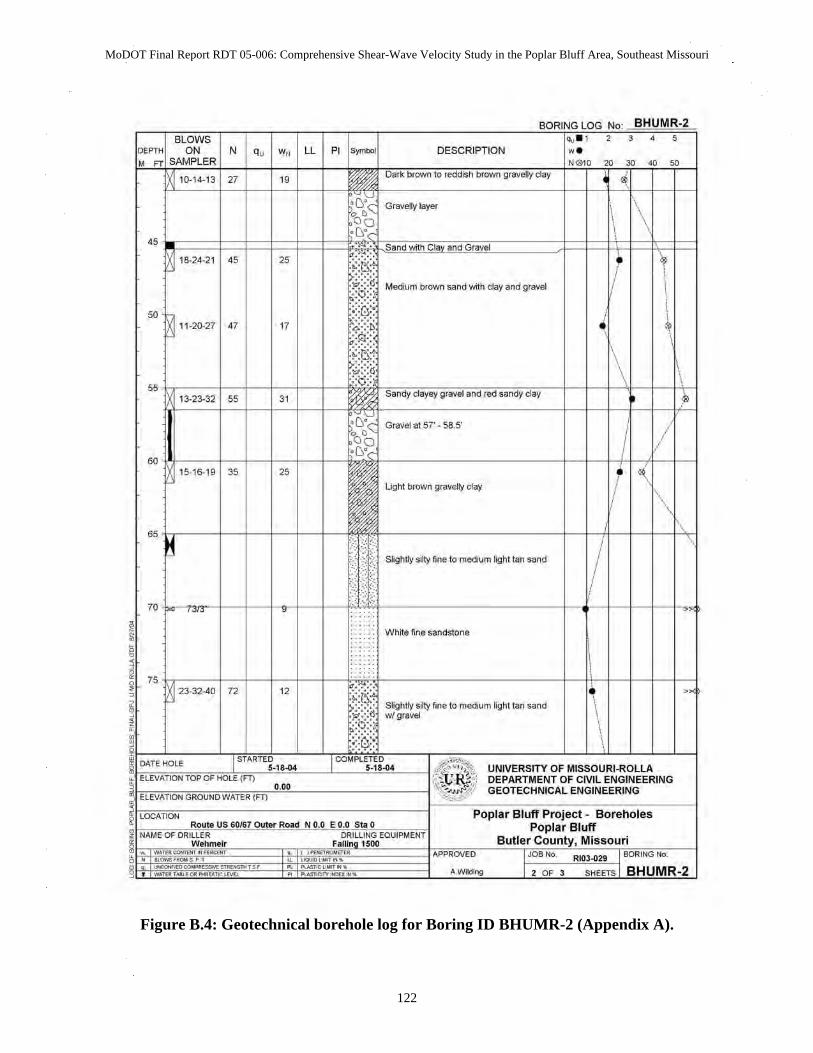
MoDOT Final Report RDT 05-006: Comprehensive Shear-Wave Velocity Study in the Poplar Bluff Area, Southeast Missouri
122
Figure B.4: Geotechnical borehole log for Boring ID BHUMR-2 (Appendix A).
I": :::;: NO~
N q, w, LL p,. DESCRIPTION ~. ' , ,." ro ~ ~
00 '0-14-13 27 " b~1 G,~." ,~:o , ' " ! \ ,
" ;D' , ,
~ 18·24·21 " 25 , , Medium brown sand with day and gravel !
50 ~ 11·20-27
, ! " " ~
\ , 55
13·23-32 55 " ''"'Y ' f
~ Gravel at 57' - 58.5'
, , 1/ , 60
15-16-19 35 25 i
"' Light brown gravely clay !
, 1\ 65
~ II Slightly ~ fine to medium ~ht tan sand
, 70
I ! WMe fine sandstone I: , I ,
75 ,
~ 23·3240 72 " »
Slightly ~ fine to medium ~ht tan sand , wi gravel
i ,
I' "" ' ..... ~~)
UNIVERSITY OF MISSOURI·ROLLA
,~"'" 0,00 ' , DEPARTMENT OF CIVIL ENGINEERING GEOTECHNICAL ENGINEERING
'"''
!~ ~ Poplar Bluff Project. Boreholes
Poplar Bluff , , , Butler , Missouri " , I '0'"' RIO'." I ro"'G"
.,W'"" I R~IIMI>-?
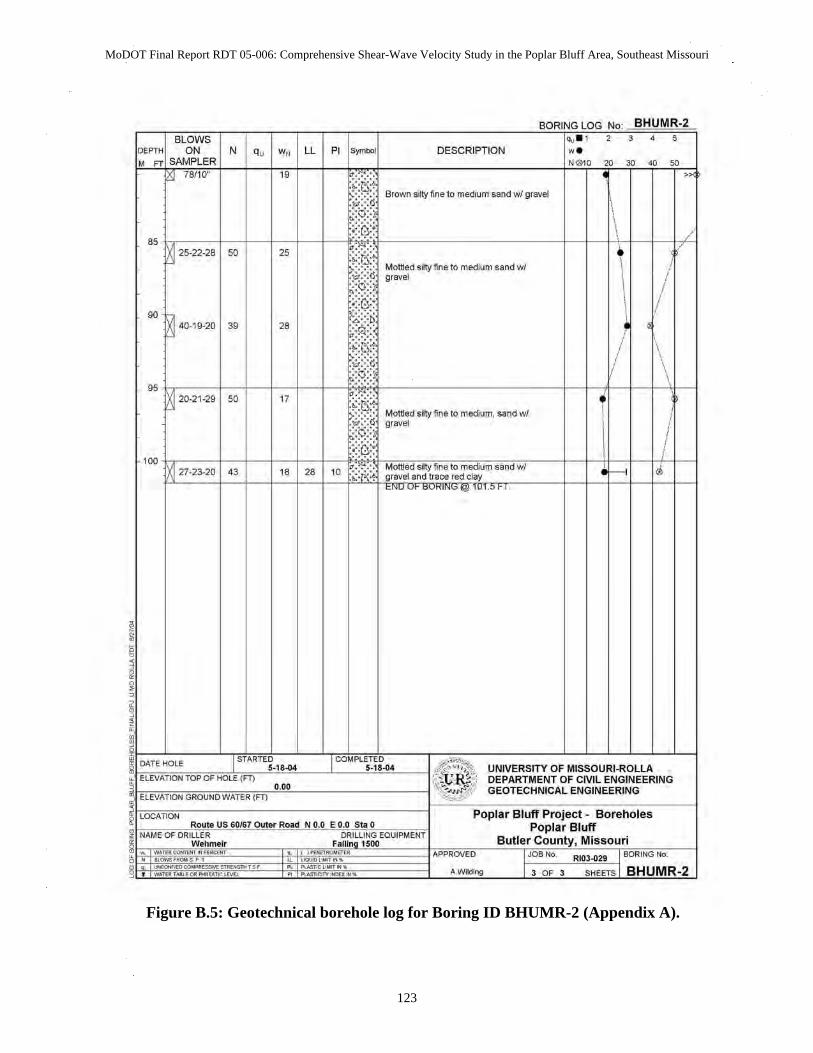
MoDOT Final Report RDT 05-006: Comprehensive Shear-Wave Velocity Study in the Poplar Bluff Area, Southeast Missouri
123
Figure B.5: Geotechnical borehole log for Boring ID BHUMR-2 (Appendix A).
DESCRIPTION
No~ ~. ' ,----.----,----N010 20 40 50
:~'j Brown silty fine to medium sand wi gravel
»
i '5 ~----+--+--+-~--~~~~------------------~-+--~+-~-+~ M 25·22·28 50 25 ~~i :
P Motlled silty fine to medium sand wi gravel
90 Ivl . r 40·19-20 39 28
95 tr----~1--+--~1-_i~ ~ 20-21·29 50 17
Motlled silty fine to medium, sand wi gravel
II / 1\
I iARTI :'1 8-44 ~ I ~ ' )" _ UNIVERSITY OF MISSOURI.ROLLA FHOLE (FT) 0.00 . ' ,! DEPARTMENT OF CIVIL ENGINEERING
, . GEOTECHNICAL ENGINEERING
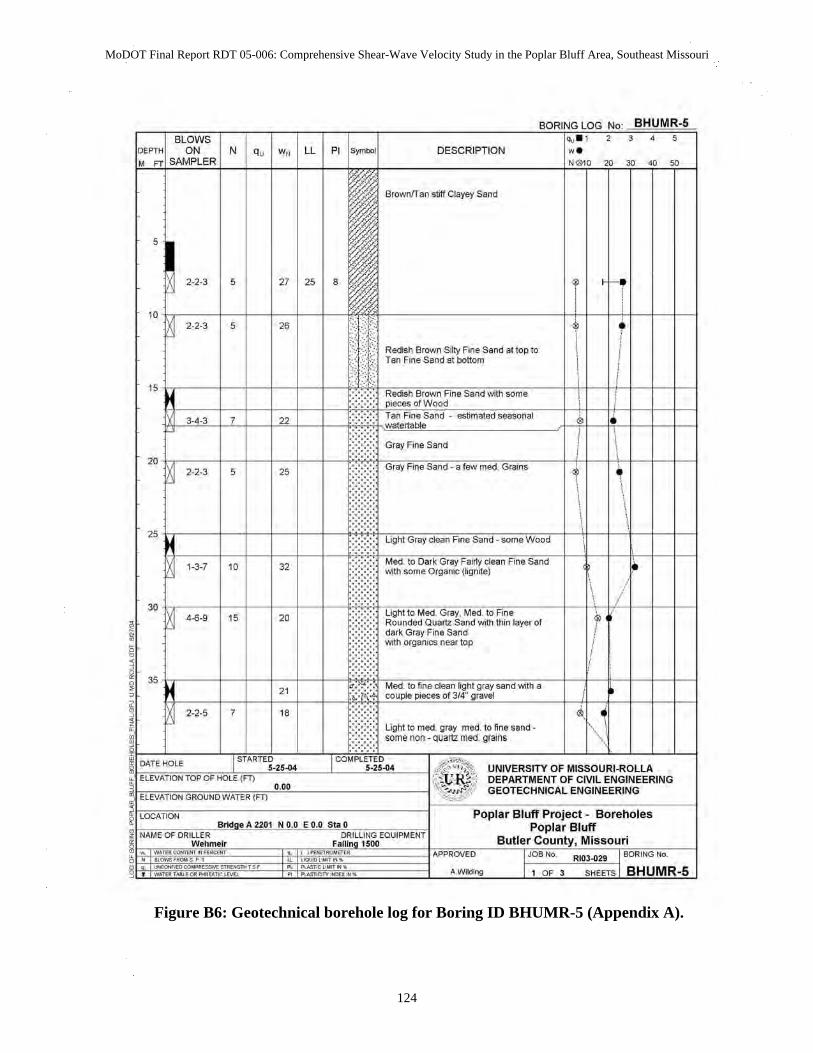
MoDOT Final Report RDT 05-006: Comprehensive Shear-Wave Velocity Study in the Poplar Bluff Area, Southeast Missouri
124
Figure B6: Geotechnical borehole log for Boring ID BHUMR-5 (Appendix A).
I": :::;: N'~
N q, w, LL p, DESCRIPTION ~. ' , , ." ro ~ ~
Brown/T an stiff Clayey Sand
5
2·2<) 5 " " 8 , , , , 10 ~ 2-2-3 5 26
i Redish Brown Silty Fine Sand at top to , Tan Fine Sand at bottom , , , , , , ,
" ; , I,::, ,wm.
"., , " : ", "'.~:"d . ~'m'''d ~~,,'
Gray Fine Sand , \ , 20
~ 2-2-3 5 " : G,,, "" , i , ':
" I::" ,d"""" • woo, , ; ,
1_3_7 10 " , .,,", , ""'" , / ,
" ~ 4-6-9 ;
~~,'~~,'J: - ", '"'' " ~ .
! " 20 , , ."" ,
" r~:; , "",, " ,
2-2-5 , " ~
light to med. gray mea. to ~ne sand· 1\' some non - quartz med. grains
I iARTI :-2S-44~ I ~ ' )" _ UNIVERSITY OF MISSOURI-ROLLA FHOLE (FT) 0.00 . ' ,! DEPARTMENT OF CIVIL ENGINEERING
_ ' GEOTEC HNICAL ENGINEERING
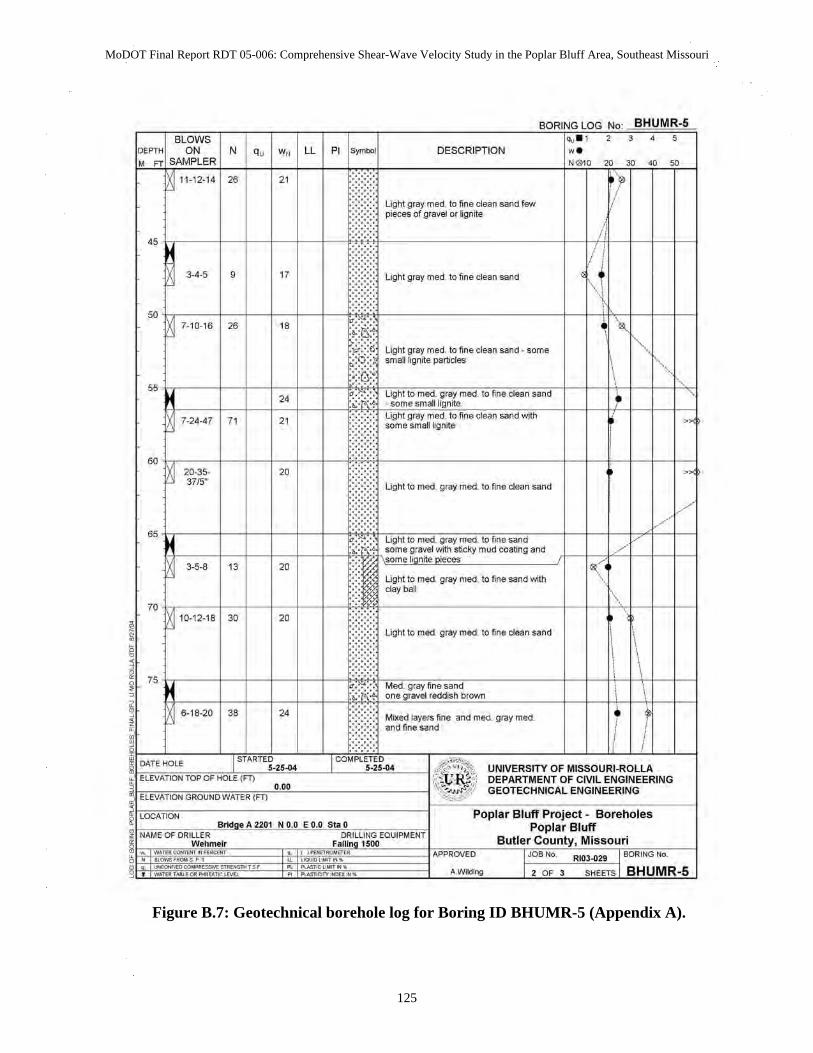
MoDOT Final Report RDT 05-006: Comprehensive Shear-Wave Velocity Study in the Poplar Bluff Area, Southeast Missouri
125
Figure B.7: Geotechnical borehole log for Boring ID BHUMR-5 (Appendix A).
I": :::;: N'~
N q, w, LL PI I'~oo DESCRIPTION ~. ' , , . " ro ~ ~
~ 11·12·14 26 " I: if Ugh! gray me<:!. to fine dean sand few pieces of gravel or lign ~e , ,
"
I111
II i 34·5 9 " Light gray meet to fine dean sand
1\ 50
!" ~ 7·10·16 26 " \ ~
" Ugh! gray me<:!. to fine dean sand· some small ,gn~e particles ,
~ \ 55
~ " ~ 7·24-47 " " Iii
. I ... '" »
i
60
~ 20-35- 20
I1I1I
» 3715" Light to met!. gray moo. to fine dean sand
f------./
65
r:~ : 3-5·8 " 20 I "'''''mod ""mod "'",,,"'w," 1<:
.: daybal '.
70 '.
I ~ 10-12-18 30 20
II11 : ,_""mod ""mod "'",d,,",,"' ! , , \ , ,
75 \
r:~ ,
i \
6-18·20 38 " I:: Mi>:ed layers fine and me<:! gray med and fine sand i
i ! ,
I' "" .. "",
~~) UNIVERSITY OF MISSOURI·ROLLA
,~"'" ' .00 . , DEPARTMENT OF CIVIL ENGINEERING GEOTECHNICAL ENGINEERING
'"'' I coe,no,
"~ Poplar Bluff Project. Boreholes
!~ , Poplar Bluff
" Butler , Missouri , I '0'"" RIO'." I ro,,," '"
'w,." I R~IIM"_'
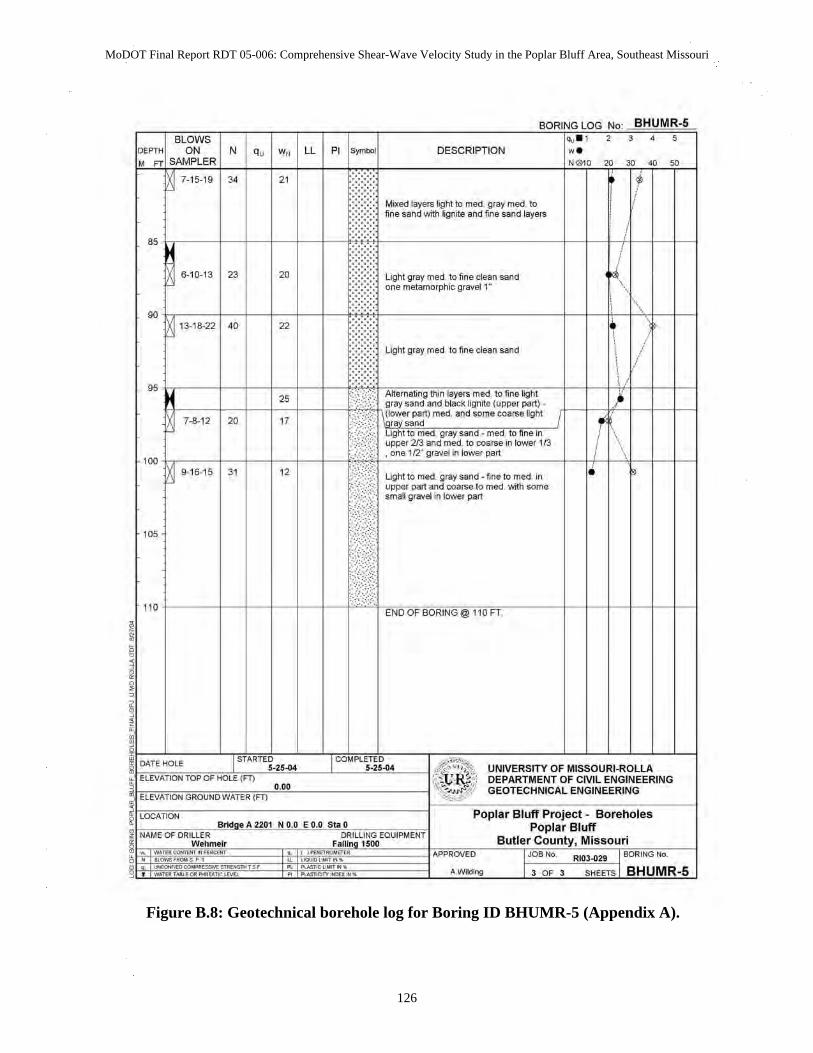
MoDOT Final Report RDT 05-006: Comprehensive Shear-Wave Velocity Study in the Poplar Bluff Area, Southeast Missouri
126
Figure B.8: Geotechnical borehole log for Boring ID BHUMR-5 (Appendix A).
I": :::;: NO~
N q, w, LL PI I'~oo DESCRIPTION ~. ' , ,." ro ~ ~
~ 7-15-19 " " t ! Mixed layef5 ~ght to med. gray moo. to i , fine sand with lign ~e and fine sand laye.s
85
~, 6-10-13 23 20 Light gray mect to fine dean sand one metamorphic gravel 1" , ,
90 ,
~ 13-18-22 " 22 \ / Ugh! gray me<:!. to fine dean sand , ,
95 ,
25
7-8-12 20 " I ,," , I
::::::',~ :;,~~" 10_ ", in~i~/3 ,
\ ", ~ 9-16·15 " " Light to med. gray sand - fine to mad. in
upper part and coarse 10 mecl. with some small gravel in lower part
",
'" ONUU' , , "OFT
!
I' "" '."", ~~) UNIVERSITY OF MISSOURI·ROLLA
,~"'" ' .00 " ,! DEPARTMENT OF CIVIL ENGINEERING
'"'' . GEOTECHNICAL ENGINEERING
I ",c,no,
"~ Poplar Bluff Project. Boreholes
!~ , Poplar Bluff
" Butler , Missouri , I""" RIO'." I ro,,," "
'w •• " I R~IIM"_'
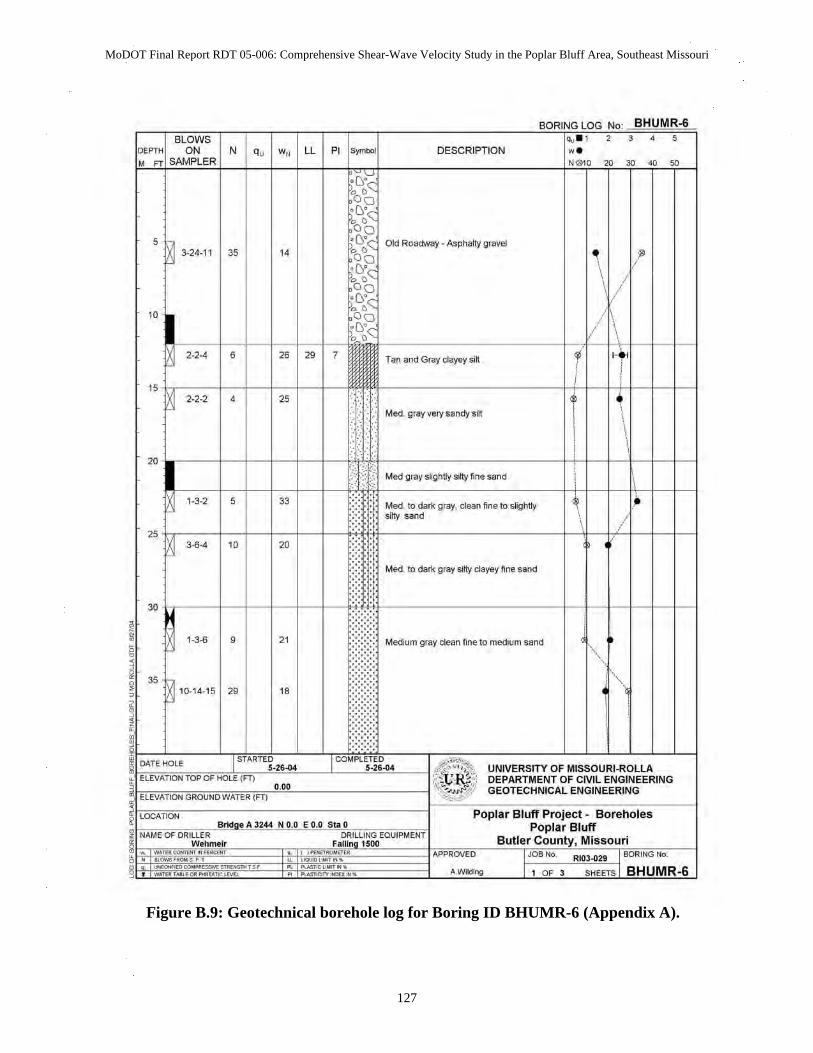
MoDOT Final Report RDT 05-006: Comprehensive Shear-Wave Velocity Study in the Poplar Bluff Area, Southeast Missouri
127
Figure B.9: Geotechnical borehole log for Boring ID BHUMR-6 (Appendix A).
I": :::;: NO~
N q, w, LL PI I'~oo DESCRIPTION ~. ' , ,." ro ~ ~
5 ~ 3-24.11
r.~ Old Roadway - Asphaity gravel 35 " 1\/ ! 1.)\
10 ~/". ~,
2-2-4 6 26 29 7 Tan and Gray clayey ~k , , i
,
" ~ 2-2-2 , 25
Moo. gray very sandy Yt i , ,
20
,iff!! M~,,~.,h~.~fi",~"d i i
1-3-2 5 33 '~i .:. '- Moo. to dark gray, dean ~ne to slightly ,. ~? silty sand
\
/ 25 ~ ,.~ 10 20
I::: I, Moo. to dark gray Yty clayey fine sand
:. !I:Il .' 30
! 1-3-6 , " Meoum gray clean ~ne 10 medium sand
I', 35 ~ 1(}.14-15
i\ 29 " , , , ,
I' "" '."", ~~) UNIVERSITY OF MISSOURI·ROLLA
,~"'" ' .00 , - ,! DEPARTMENT OF CIVIL ENGINEERING
'"'' ' GEOTECHNICAL ENGINEERING
I coe,no,
"~ Poplar Bluff Project. Boreholes
!~ , Poplar Bluff
" Butler , Missouri , 1'°'"' . ",." I ro'''G'' ,.w,." I R~IIMI,-"
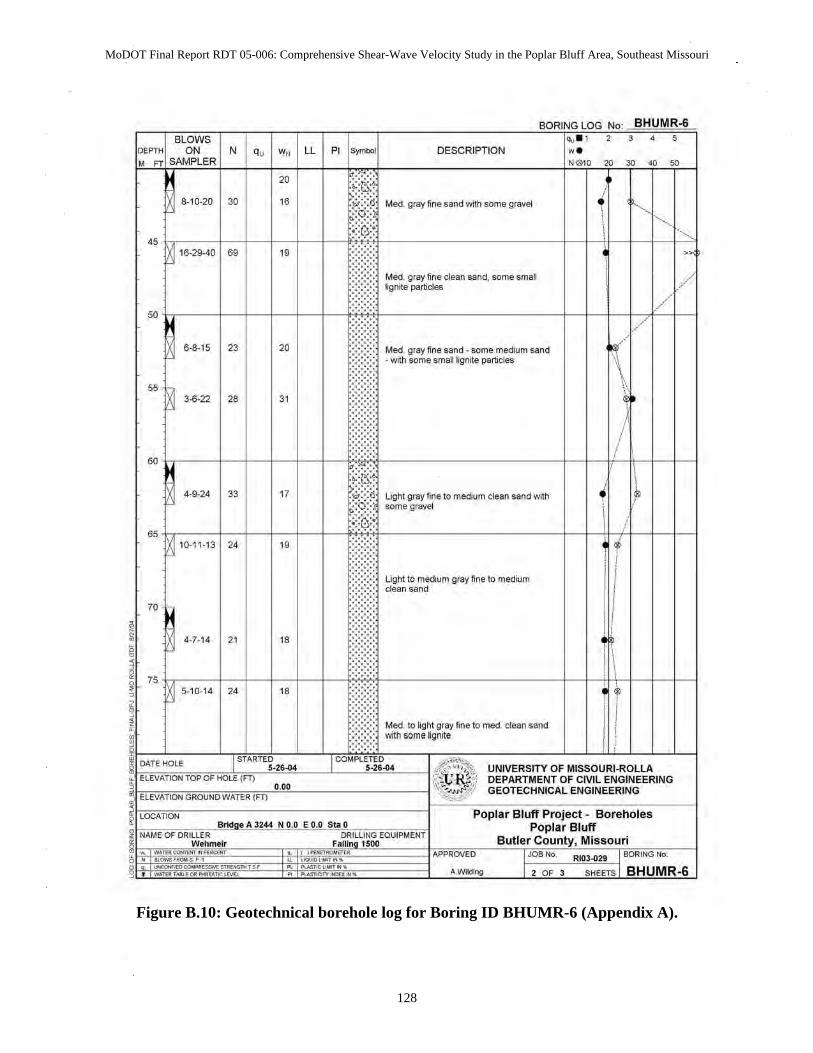
MoDOT Final Report RDT 05-006: Comprehensive Shear-Wave Velocity Study in the Poplar Bluff Area, Southeast Missouri
128
Figure B.10: Geotechnical borehole log for Boring ID BHUMR-6 (Appendix A).
lo,,~~ N q, w,
20
8-10·20 30 "
" ~16.29-40 69 "
50
6·8·15 23 20
55 o 3-8-22 28 "
LL PI I'~oo DESCRIPTION
.M Mod. ,coy'""'" "'" .om, "~.
I111
Me(t g ray~ne clean santi, some small Ifgn~e particles
Moo. griIY~ne sand - some medium sand • with some smal hgn~e partides
No~ :; , ,----.-----,---~01O 20 40 50
/'
»
/ 1/
60+.----+--+--+--+--~~~~------------------_+_+--~~~_+~
~~R~ Light gray fine to medium dean sand with ~t~:~ "m",~. 65 +.----+-_+--+--+--~~~~------------------_+_+_+~+_~_+~ ~ 10.11·13 24 19
"
" I!!
I .,,' :.,.~
~ ' .00
Light to medium gray fine to medium dean sand
Moo. to ~ht gray fine to "led. clean sand >MIh same IignHe
~,~~, ~~(J%i'
UNIVERSITY OF MISSOURI·ROLLA DEPARTMENT OF CIVIL ENGINEERING GEOTECHNICAL ENGINEERING
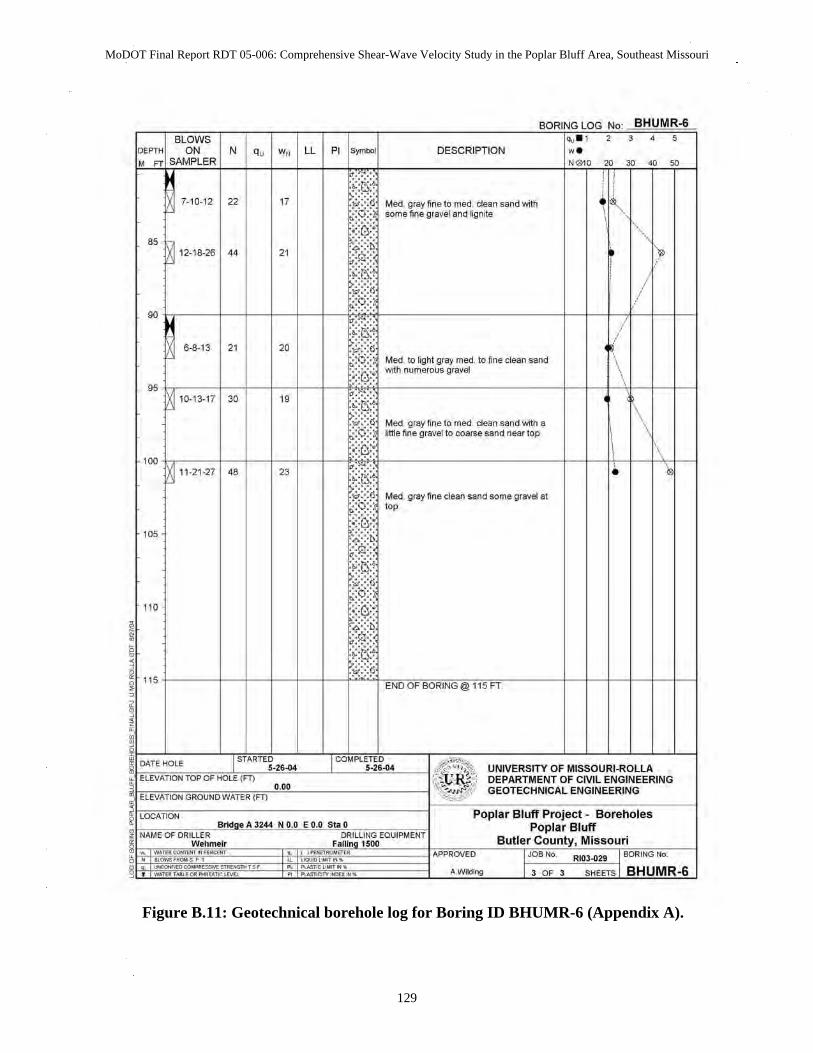
MoDOT Final Report RDT 05-006: Comprehensive Shear-Wave Velocity Study in the Poplar Bluff Area, Southeast Missouri
129
Figure B.11: Geotechnical borehole log for Boring ID BHUMR-6 (Appendix A).
7.10·12 22
DESCRIPTION
:jllj Moo. g ray~ne to moo. dean sand vmn some fine gravel and ig n~e
No~ ~. ' ,----.----,----N010 20 40 50
85 ~ f01 12.18-26 44
20 Moo. to ~ht gray moo. to fine clean sand with numerous gravel
9' tr----~1-_+--~1-_t~ ~ 10-13-17 30 19
Me(t gray-fine to moo dean sand wittl a little fine gravel to coarse sand near top
,oo ,,----~--~_+--+-_+--~~~--------------------+__+~+_+_~~~
~ "·"·27" 23 ;·11· :: : Moo. gray fine dean sand some gravel at ", lop .:
'" ..
'"
~i~ US t----I--r-I--tl--I~Ie;'ID15FEK5RiliNG<i,>Ti1 ",,51,'",.------111--1111
I iARTI :-26-44~ I ~ ' )" _ UNIVERSITY OF MISSOURI.ROLLA FHOLE (FT) 0.00 . ' ,! DEPARTMENT OF CIVIL ENGINEERING
. . GEOTECHNICAL ENGINEERING
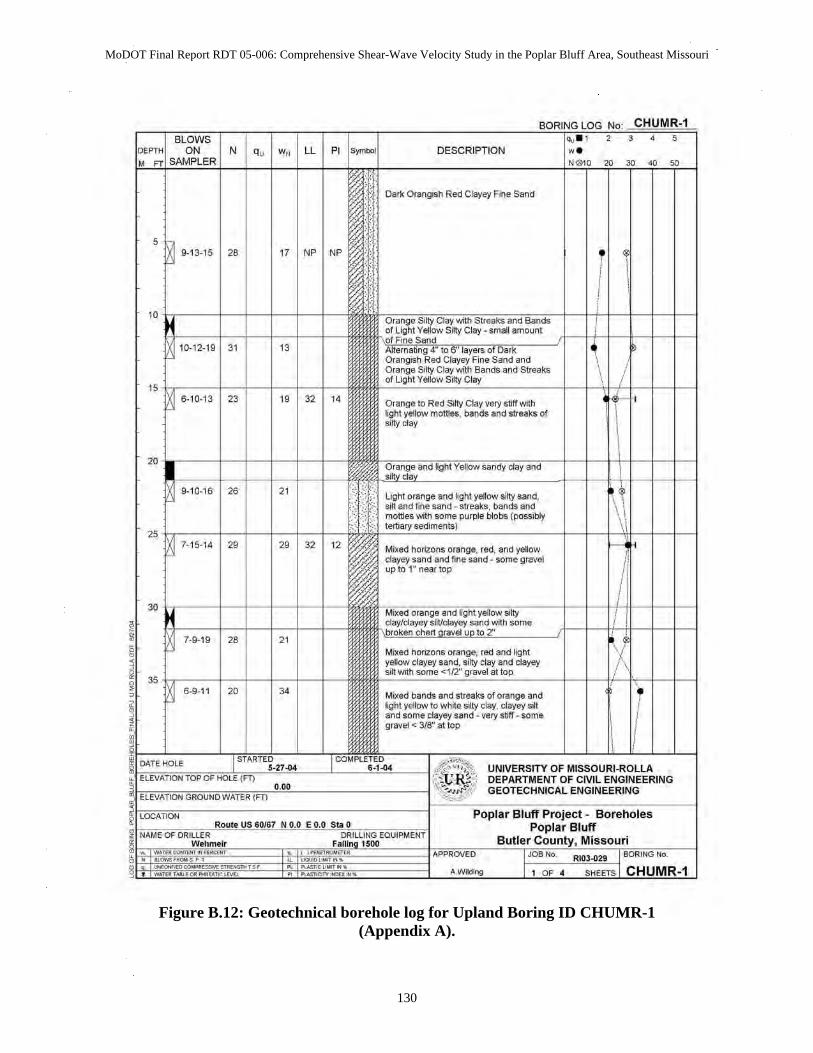
MoDOT Final Report RDT 05-006: Comprehensive Shear-Wave Velocity Study in the Poplar Bluff Area, Southeast Missouri
DESCRIPTION
Oark Orangish Red Ctayey Fine Sand
5 9-13-15 28 17 NP
10
1(}.12_19 " " '"' and Streaks
" 6-10-13 23 " 32 Orange to Red Sitty Clay vel)l sliffwith light yellow mottles, bands and streaks of silty ctay
20
9-10.16 26 21 Light orange and i ght yellow sJlty sand, si~ and fine sand - streaks, bands and . , mott1es with some purple blobs (possibly
25 tertiary sediments)
7-15-14 29 29 32 Mixed horizons orange, red, and yellow clayey sand and fine sand - some gravel upto l "near top
30
7,9-19 " 21 red and light
and clayey
35 6-9-11 20 " Mixed bands and streaks of orange and
light yellow to wh~e ~ clay, clayey si~ and some clayey sand - very stiff - some gravel '" 318" at top
UNIVERSITY OF MISSOURI-R OL LA DEPART MENT OF CIVIL ENGINEERING GEOTECHNICAL ENGINEERING
Poplar Bluff Project. Boreholes Poplar Bluff
Butler , Missouri
Figure B.12: Geotechnical borehole log for Upland Boring ID CHUMR-1(Appendix A).
130
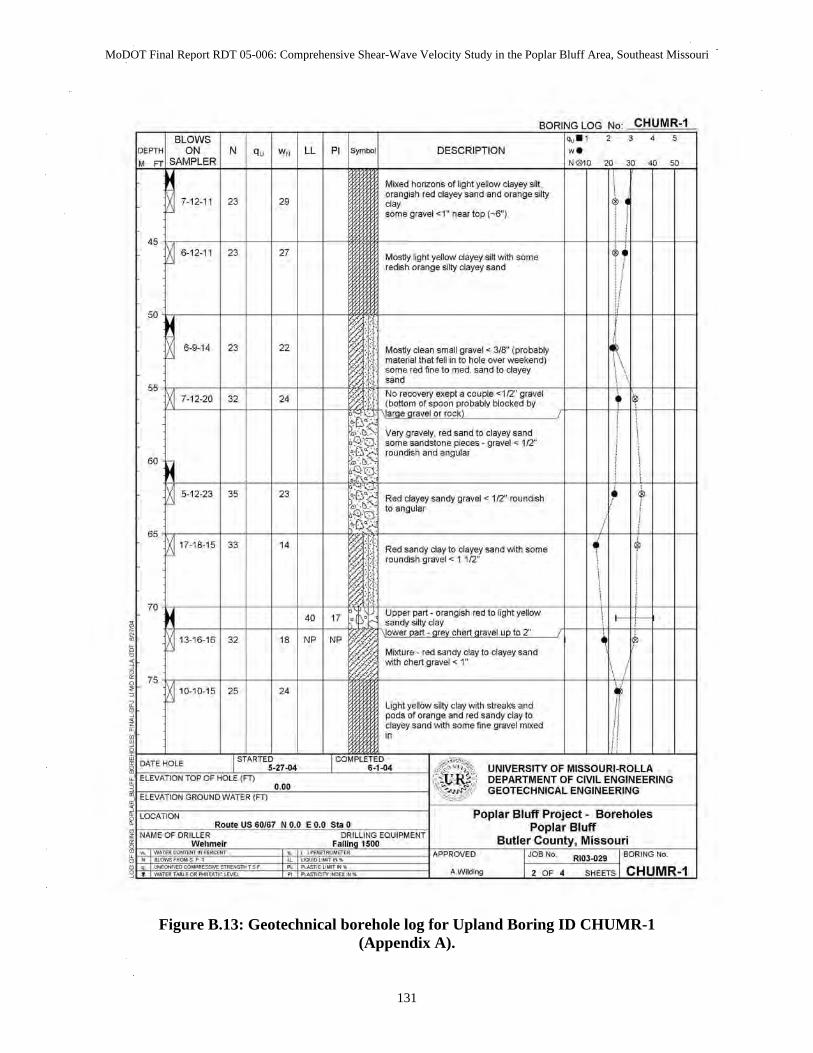
MoDOT Final Report RDT 05-006: Comprehensive Shear-Wave Velocity Study in the Poplar Bluff Area, Southeast Missouri
131
Figure B.13: Geotechnical borehole log for Upland Boring ID CHUMR-1 (Appendix A).
N q, w, LL DESCRIPTION ro ~ ~
Mixed horizons of Wght y~low clayey si~,
7.12·11 23 29 orangish red dayey sand and orange s.fty
cl" some gravel <1" near lop (-{I")
" 6-12·11 23 " Mostly i ght yellow clayey si~ with some redish orange silty clayey sand
50
6·9·14 23 22
55 7-12-20 32 "
Very gravely, red sand to clayey sand some sandstone pieces - gravel" 112"
60 roundish and angular
~12·23 " 23 Red clayey sandy gravel" lfZ' roundish to angular
65 17·18-15 33 " Red sandy clay to clayey sand with some
roundish gravel < 1112"
70
" 13-16-16 32 " NP
Mixture· red sandy clay to clayey sand with chert gravel < 1"
75 1(}.11).15 25 " Light yellow silty clay with streaks and
ii
" pods 01 orange and red sandy clay to , ,
dayey sand with some fine gravel mixed ;"
UNIVERSITY OF MISSOURI-ROLLA DEPARTMENT OF CIVIL ENGINEERING GEOTECHNICAL ENGINEERING
Poplar Bluff Project. Boreholes Poplar Bluff
Butler , Missouri
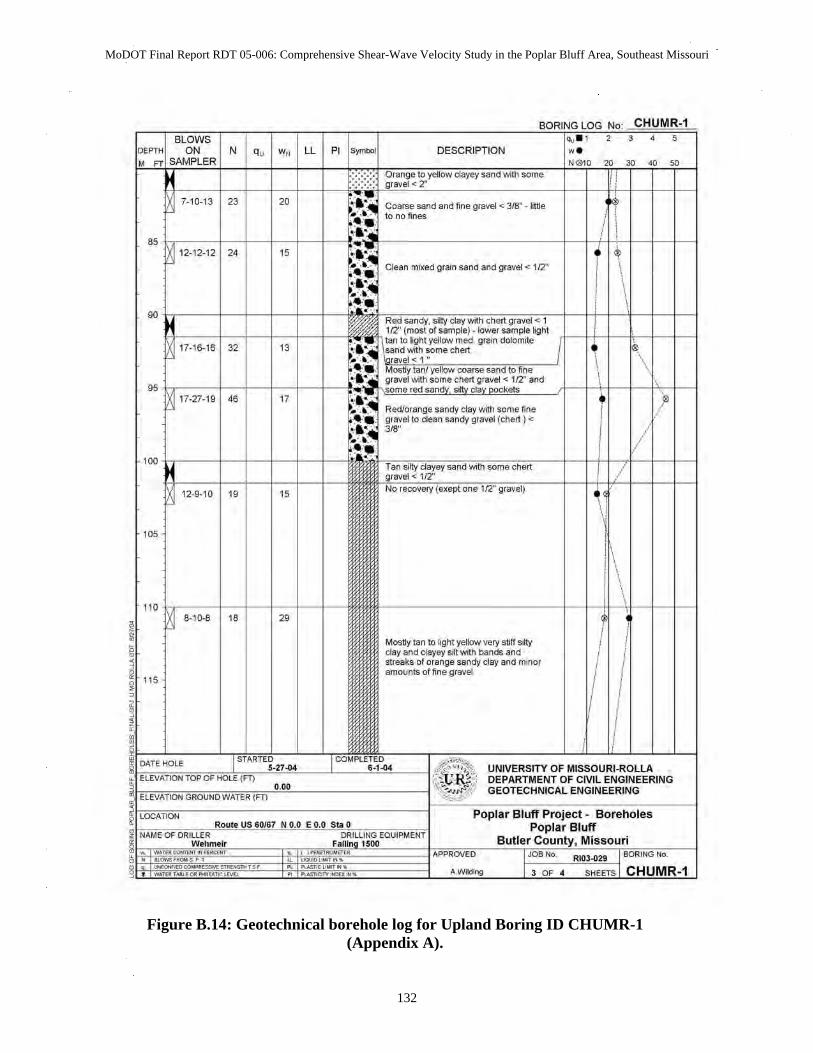
MoDOT Final Report RDT 05-006: Comprehensive Shear-Wave Velocity Study in the Poplar Bluff Area, Southeast Missouri
I": :::;: NO~
N LL p, I'~oo DESCRIPTION ~. ' ,
q, '. ,." ro ~ ~
'I 7.10·13 23 20 Coarse sand and fine gravel <: 3/8" little
to no fines
85 ,
~ 12·12·12 " " , Clean mixed grain sand and gravel <: 112"
i I ,
i I 90
~ ""'m'''' , grain dolomrte 17.16-16 32 " I \ I~ i
i . ,,, .•. , ~ ~ ~fZ' and
" ~ 17·27.19 " " 1/ Red/orange sandy clay with some fine , gravel to clean sandy gravel (chert) <: , ,,.. ,
/ ,
'" ::.~~ < ,," / !
12·9·10 " " " ., , ; ' .'
'OS , i \
.\ '" ~ 8·10-8
! " 29
, , Mostly tan to ~ht yellow very slifl silly , clay and clayey siH with bands and ! , streaks 01 orange sandy day and minor ,
'" amounts of fine gravel , , , ,
!
i !
I' "" .~"'" ~~) UNIVERSITY OF MISSOURI·ROLLA
,~"'" g." . , DEPARTMENT OF CIVIL ENGINEERING GEOTECHNICAL ENGINEERING .,,"
I ",c,no,
"~ Poplar Bluff Project. Boreholes
!~ Poplar Bluff , , ,
Butler , Missouri " , 1'°' ", RIO'." I ro""G" 'W,"" I "~II''''~
Figure B.14: Geotechnical borehole log for Upland Boring ID CHUMR-1(Appendix A).
132
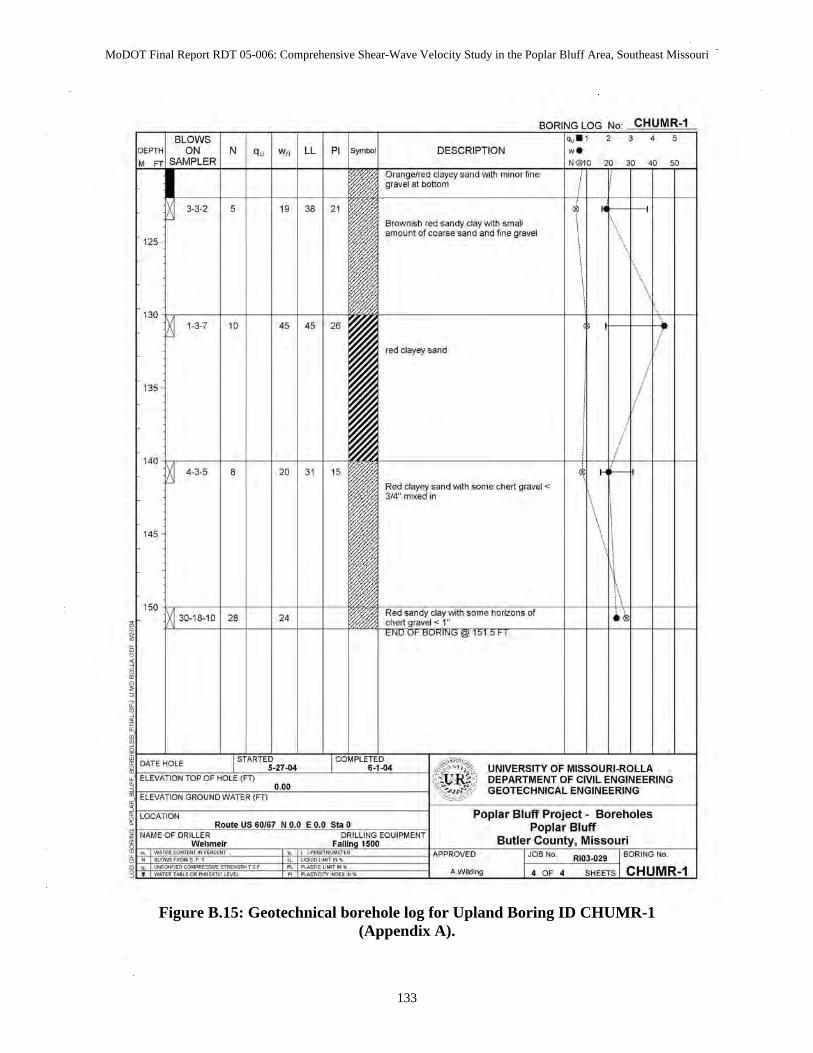
MoDOT Final Report RDT 05-006: Comprehensive Shear-Wave Velocity Study in the Poplar Bluff Area, Southeast Missouri
133
Figure B.15: Geotechnical borehole log for Upland Boring ID CHUMR-1 (Appendix A).
N q, w, LL PI
•• 2 5 " 38 " '"
no h --+-I--+-+---1-1-3-7 45 45 26
'" h ----1-+ - +---1-+-4-3-5 8 20 31 15
'"
,so h --+-I--+-+---1-30-18-10 28 24
DESCRIPTION
8rowni$h red sandy day with sman amount of coarse sand and fine gravel
Red davey sand with some chert gravel.: 314" mixed in
ro ~ ~
UNIVERSITY OF MISSOURI-ROLLA DEPARTMENT OF CIVIL ENGINEERING GEOTECHNICAL ENGINEERING
Poplar Bluff Project. Boreholes Poplar Bluff
Butler , Missouri
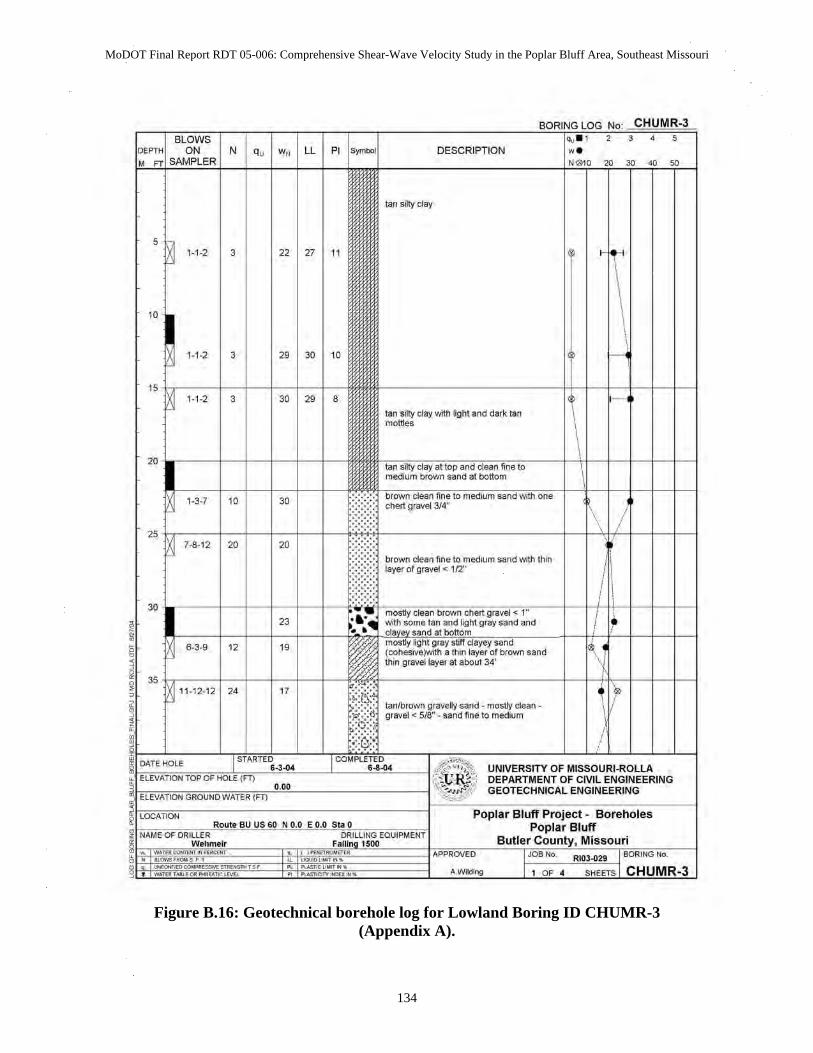
MoDOT Final Report RDT 05-006: Comprehensive Shear-Wave Velocity Study in the Poplar Bluff Area, Southeast Missouri
Nqu w"LlPI
5 1_1_2 3 22 27 11
10
1-1-2 3 29 30 10
" 1_1_2 3 30 29 8
20
1_3_7 10 30
25 7-8-12 20 20
30
23
6-3-9 " " 35
11-12-12 " "
DESCRIPTION
tan silly clay with ~ght and dark Ian mO!ljes
brown clean fine to medium sand with thin Ii layer of gra~eI <; 112"
,
oed
(an/brown g ravelly sand - mostly clean -gravel < 5/8" - sand fine to medium
UNIVERSITY OF MISSOURI-ROLLA DEPARTMENT OF CIVIL ENGINEERING GEOTECHNICAL ENGINEERING
Poplar Bluff Project. Boreholes Poplar Bluff
Butler , Missouri
Figure B.16: Geotechnical borehole log for Lowland Boring ID CHUMR-3(Appendix A).
134
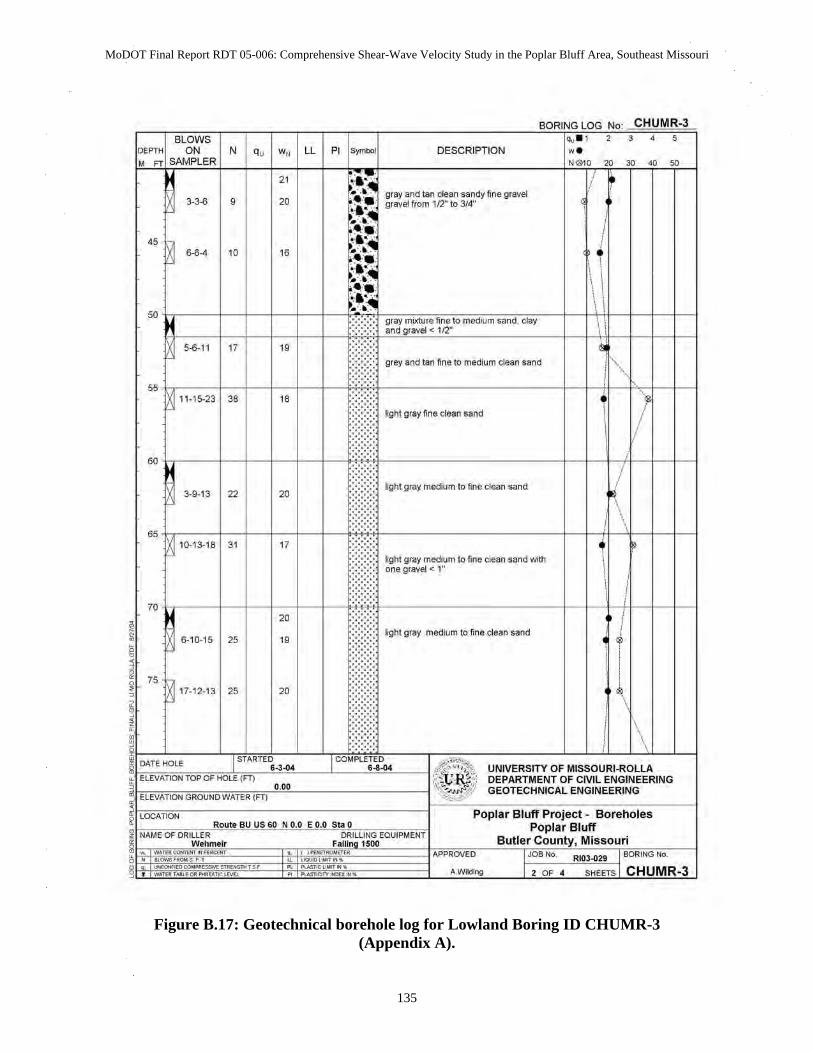
MoDOT Final Report RDT 05-006: Comprehensive Shear-Wave Velocity Study in the Poplar Bluff Area, Southeast Missouri
135
Figure B.17: Geotechnical borehole log for Lowland Boring ID CHUMR-3 (Appendix A).
I": :::;: N'~
N LL PI I'~oo DESCRIPTION ::" ' ,
q, w, ro ~ ~
II ,
" , >J~ , 20
gray and tan clean sandy fine gravel gravel from 1(2:' to 314"
, " ~ ~~ ,
" " i I
I I \ \
50
I:::: , , I, "" I ,
I: , ,..." " " grey and tan fine to medium dean sand I"~
55 ~ 11.1S-23 38 "
11 1 Itghl gray fine clean sand
I
i !
60
IIIII
, 3·9·13 22 20
~ht gray medium to fine clean sand
,\ 65 ~ 10.13-18
III " " light gray medium to fine clean sand with \ one gravel <; 1" ,
, ! , 70 ,
! 20
~ht gray medium to fine dean sand I 6-10·15 25 " ! i , ,
, 75 ~ 17·12·13 25 20
i I
! \ I' "" ;~ ..
~~) UNIVERSITY OF MISSOURI·ROLLA
,~"'" ""
. , DEPARTMENT OF CIVIL ENGINEERING GEOTECHNICAL ENGINEERING
'"''
~'""'''''~ Poplar Bluff Project. Boreholes
, Poplar Bluff Butler , Missouri
! ' 1'°'"' R"'." I ro"'G" .,W'"" I "~II''''_'
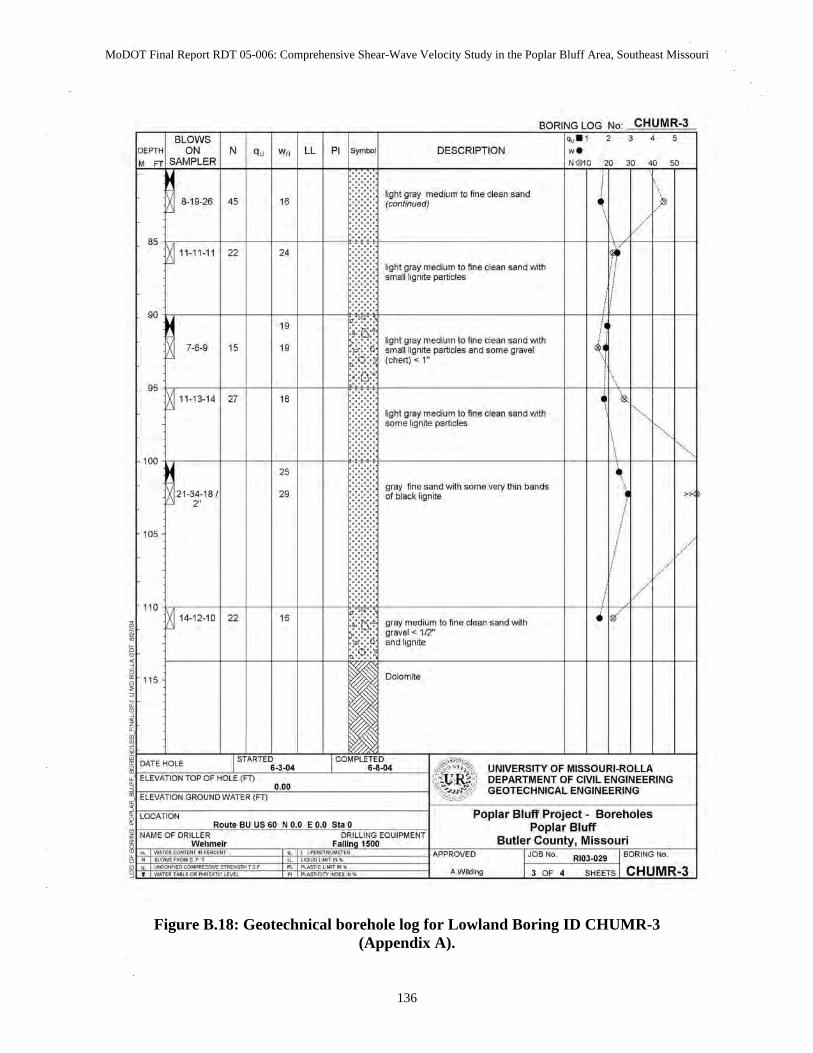
MoDOT Final Report RDT 05-006: Comprehensive Shear-Wave Velocity Study in the Poplar Bluff Area, Southeast Missouri
I": :::;: NO~
N LL PI I'~oo DESCRIPTION ::" ' ,
q, w, ro ~ ~
I: ~ht gray medium to fin e dean sand , l> 8-19·26 " " (conlinu"dj , , /
85 ~ II_II_II
I111
22 " Itghl gray medium to fine clean sand with !i
small 'gMe particles i
" "
90 ,
" ! ~ht gray medium to fine clean sand with ,
7-6·9 " " small ign~e particles and some gravel (chert) <: 1"
,
95 ~ 11.1)..14 " "
11
.. Itghl gray medium to fine clean sand with
, ", some lign ~e particles 1" ,. , '" '" 25 ~. 29
gray fine sand with some very thin bands »
,- of black ~gn~e ,
'" I / 1/ , /
'" ~ 14-12-10 ~ 0 /
! 22 " ~i gray medium 10 fine dean sand with
gravel '" 112" and lign~e
'" OoIomrte
I' "" ;~ .. ~~) UNIVERSITY OF MISSOURI-ROLLA '~'''n ' .00 0" ,! DEPARTMENT OF CIVIL ENGINEERING
'"'' . GEOTECHNICAL ENGINEERING
~'"""' ''~ Poplar Bluff Project. Boreholes
, Poplar Bluff Butler , Missouri
! ' 1'°'"' .",." I ro"'G" .,W'"" I "~II''''_'
Figure B.18: Geotechnical borehole log for Lowland Boring ID CHUMR-3(Appendix A).
136
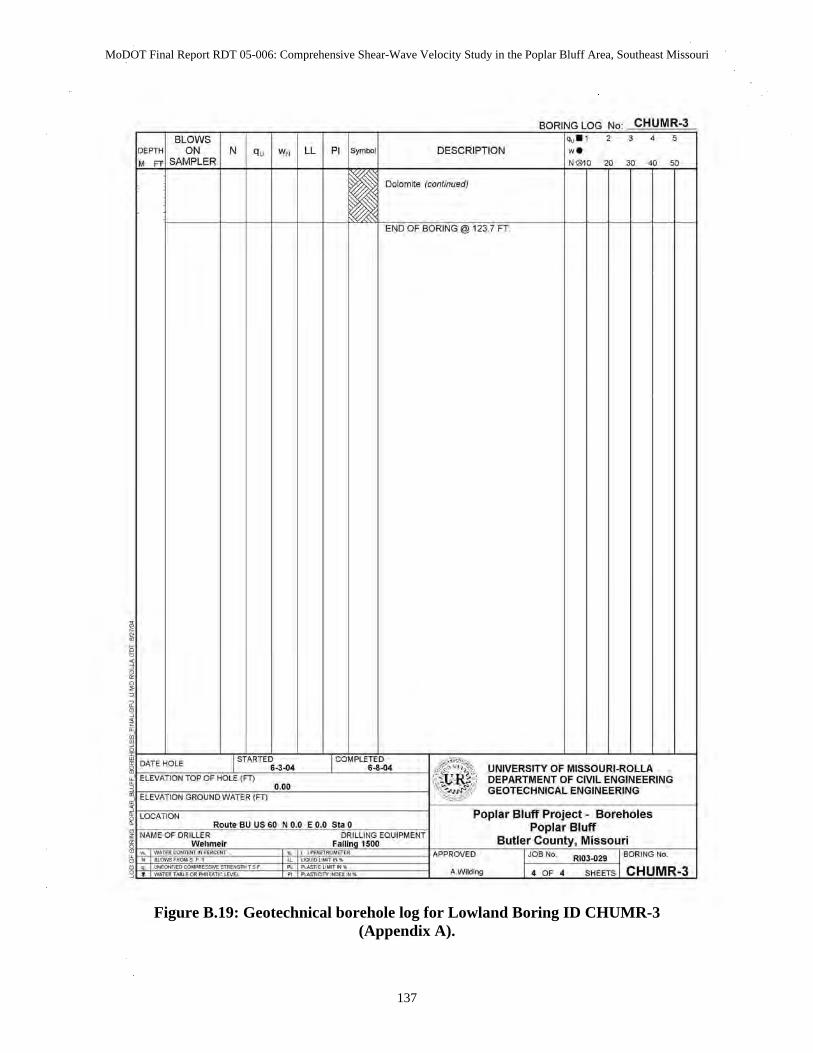
MoDOT Final Report RDT 05-006: Comprehensive Shear-Wave Velocity Study in the Poplar Bluff Area, Southeast Missouri
137
Figure B.19: Geotechnical borehole log for Lowland Boring ID CHUMR-3 (Appendix A).
Nqu w" LLPI DESCRIPTION
UNIVERSITY OF MISSOURI-ROLLA DEPARTMENT OF CIVIL ENGINEERING GEOTECHNICAL ENGINEERING
Poplar Bluff Project. Boreholes Poplar Bluff
Butler , Missouri
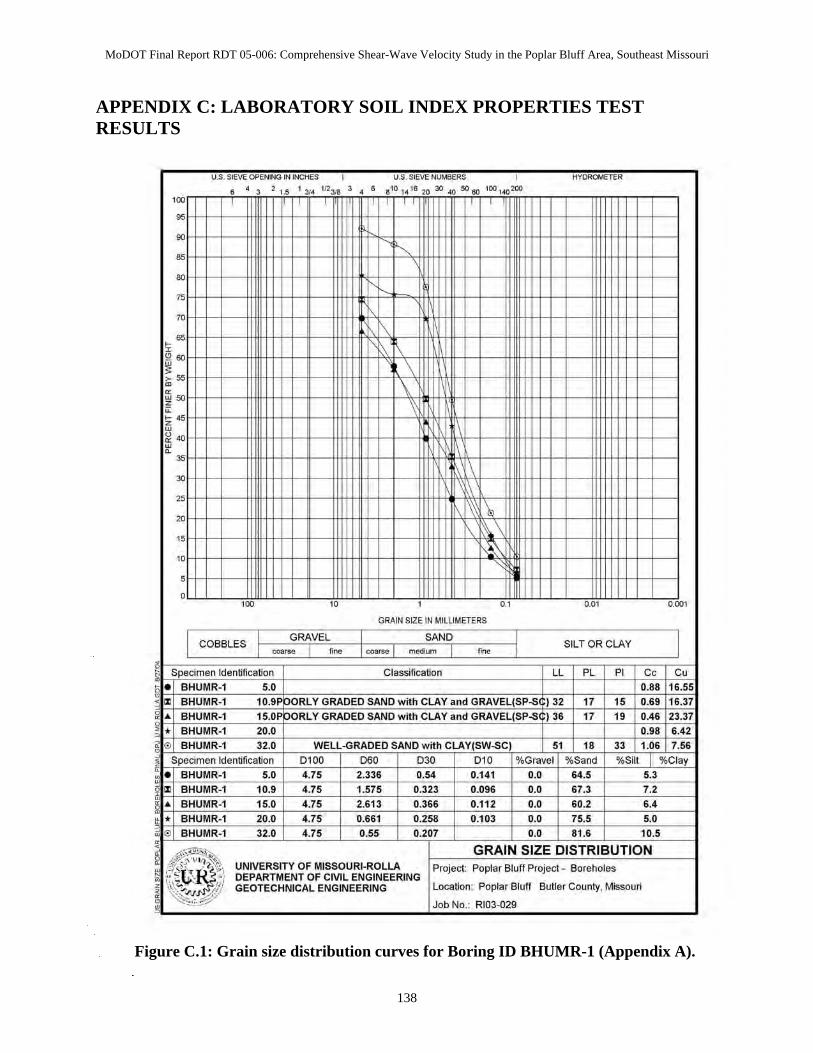
MoDOT Final Report RDT 05-006: Comprehensive Shear-Wave Velocity Study in the Poplar Bluff Area, Southeast Missouri
APPENDIX C: LABORATORY SOIL INDEX PROPERTIES TEST RESULTS
Figure C.1: Grain size distribution curves for Boring ID BHUMR-1 (Appendix A).
138
"'., , U.S. 51_EVE NIJMI!ER~ I
• . , 2 1.5 I 3/. 112315 3 • • S 10 ,. 16 20 XI 00 50 60 100'00200
'00 , ~
'" M " '" " " M I I ~~
'" "
\
'" \ II~ ~I
" ~
9", ~
I " '" " '" "
. \
" ~\.
1 , 0
'00 " , 0.' 0.01 0,001
GRAIN SIZE IN MILLIMETERS
I COBBLES GRAVEL SAND
SILT OR CLAY ~~ ,~ ~~ medium ,~
i 1 , i LL PL P' Co
~ i~ ~ i ~ 1* i '" 11 " ," I~
20.'
~ ~ 1 '.98 I ~
, I I
5.' 4.75 2.336 ' .54 ' .141 •• 64.5 5.3
. 10.' . 4.75 . 1.575 . ' .323 ...... •••• -".3 . 7.2
20.0 4.75 ' .661 ' .258 ' .1" ••• 75.5 5.' 32.' 4.75 ' .55 ' .207 ••• 81 .' 10.5
l'.e:Z;.~ I SIZE UTION ,~'f ' \I~~~\ UNIVERSITY OF MISSOURI-ROLLA : Poplar Bluff Project - Boreholes "sGl{ DEPARTMENT OF CIVIL ENGINEERING ~ , \. I" \1~ ~'~I GEOTECHNICAL ENGINEERING Poplar Bluff Butler County. Missouri ~~~/if! Job No.: RIOJ-029
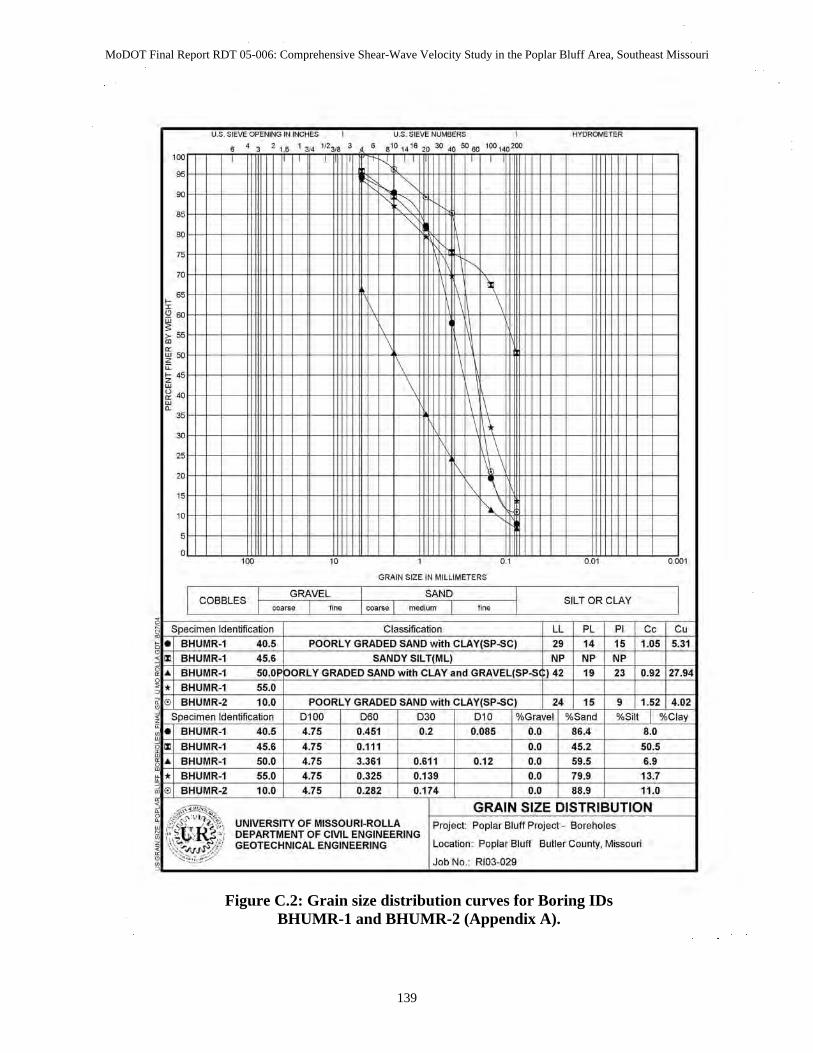
MoDOT Final Report RDT 05-006: Comprehensive Shear-Wave Velocity Study in the Poplar Bluff Area, Southeast Missouri
"'., , U.S. SIEVE NUMBERS ,
• • , 2 1.5 I 31. 112318 3 • 8 , 0 ,. 16 2(1 XI 00 50 60 100 100 200
' 00 ,
" ~
" '" M '" " '\ '" " "
'" M
\ ~'" §" II "' II: \
'" I \
" " '\ " "
>. , 0
'00 " , 0.' 0.01 0,001
GRAIN SIZE IN MILLIMETERS
I COBBLES GRAVEL SAND
SILT OR CLAY ~~ ,~ ~~ medium ,~
i
~ LL PL PI Co C,
i~ --Me , 142 " 23 1 ' .92 121.94
I~ 55.'
~ ~ ~ ~I • .• ,
4O.S ' .75 ' .451 ' .2 ' .• 85 • • .. .• 45.' ' .75 ' .11 ••• 45.2 SO.S
~ 10.0 ' .75 ~ .ilil: ••• .... 11.'
l'.~~ 1 SIZE UTION ~"'''~'$&, i ~~, . ~~\ UNIVERSITY OF MISSOURI-ROLLA : Poplar Bluff Project - Boreholes " G:R DEPARTMENT OF CIVIL ENGINEERING ~ , \. I" I')..'t. ~'~! GEOTECHNICAL ENGINEERING Poplar Bluff Butler County. Missouri ~~~'<f;jf Job No __ RIOJ-029
Figure C.2: Grain size distribution curves for Boring IDs BHUMR-1 and BHUMR-2 (Appendix A).
139
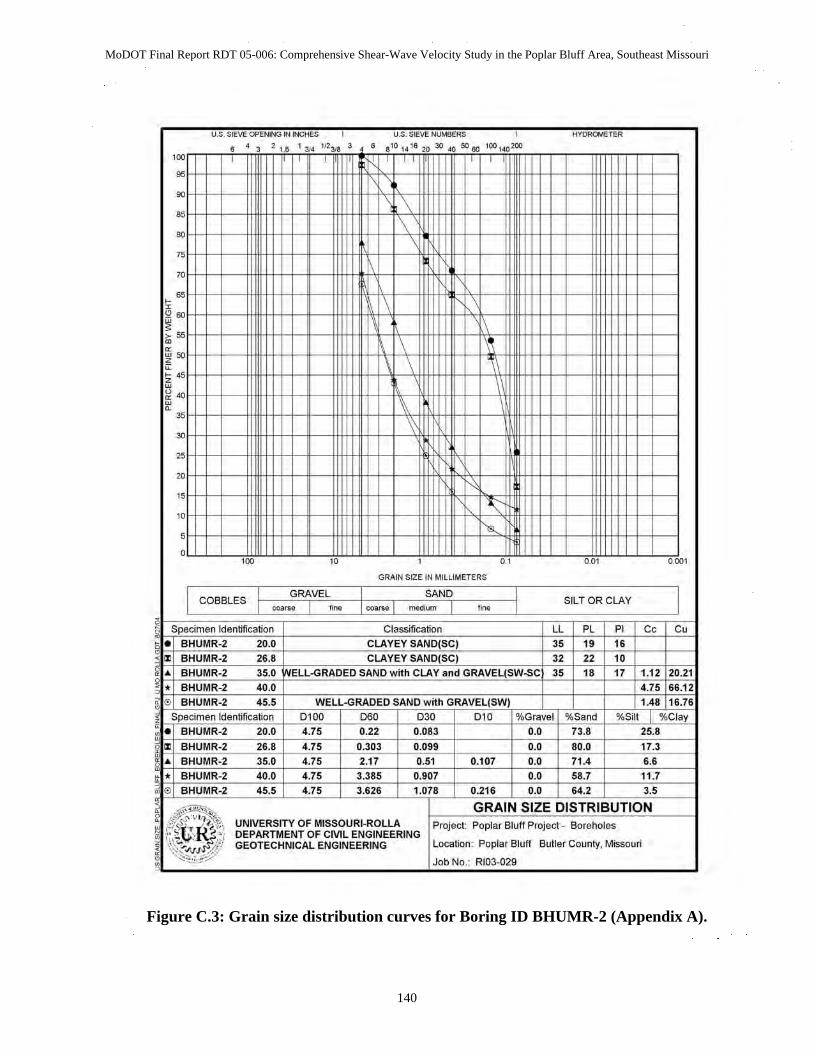
MoDOT Final Report RDT 05-006: Comprehensive Shear-Wave Velocity Study in the Poplar Bluff Area, Southeast Missouri
140
Figure C.3: Grain size distribution curves for Boring ID BHUMR-2 (Appendix A).
"'., I U.S. SIEVE NUMBERS I
• • , 2 1.5 I 31. 112318 3 • • 8 ,0 ,. 16 2(1 XI 00 50 60 100 100 200
'00 , ~
'" M
\
'" \
" " M
\ ~'" §" \ II "' \ \
II: " '\- HIli '" " " " "
>::: , '&.
0 '00 "
, 0.' 0.01 0,001
GRAIN SIZE IN MILLIMETERS
I COBBLES GRAVEL SAND
SILT OR CLAY ~~ ,~ ~~ medium ,~
i
= LL PL PI Co C,
i~. =*= ~ 17 11.1: 120.21
I~ .... ~~~,
14.75 I" .E
~I I
4.75 ' .22 0.083 ~. 20.0 73.' 25.' 26.' 4.75 ' .303 0.099 0.0 80.0 17.3
~ 45.' 4.75 !* Wi 0.216 0.0 64.2 3.'
l'.~~ I SIZE UTION ~"'''~'$&, i ~~ , . ~~\ UNIVERSITY OF MISSOURI-ROLLA : Poplar Bluff Project - Boreholes " G:R DEPARTMENT OF CIVIL ENGINEERING ~ , \. I" I')..'t. ~'~! GEOTECHNICAL ENGINEERING Poplar Bluff Butler County. Missouri ~~~'<f;jf Job No __ RIOJ-029
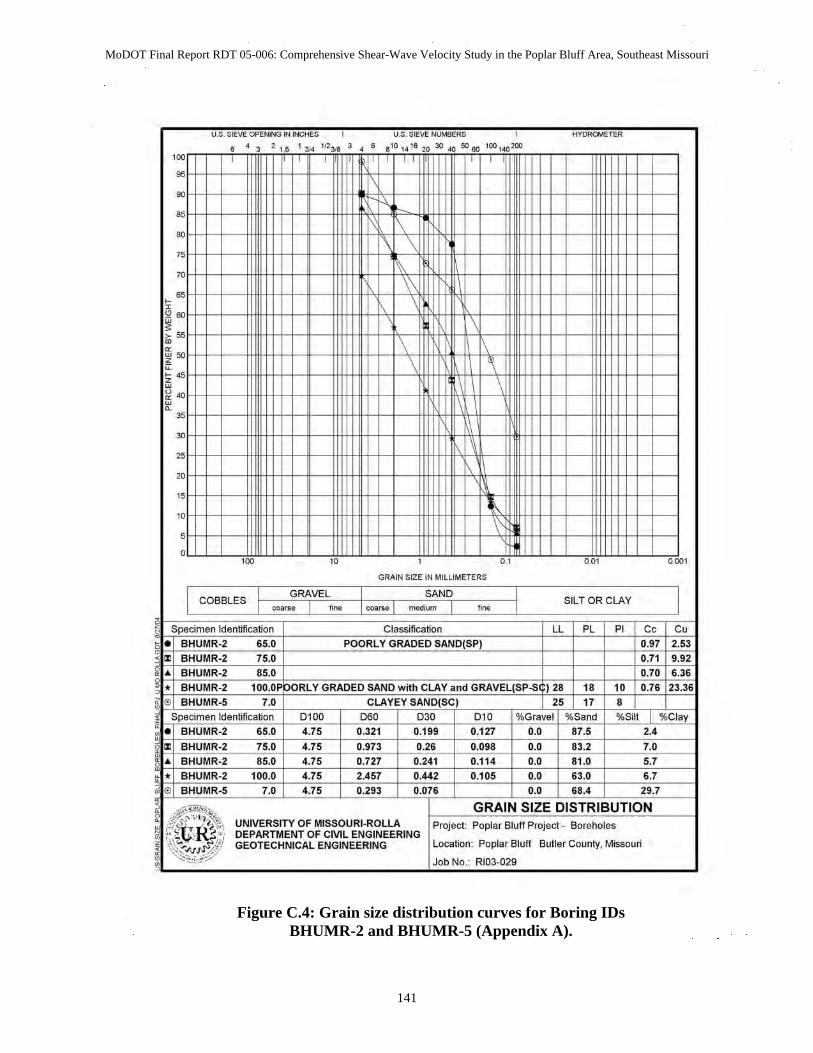
MoDOT Final Report RDT 05-006: Comprehensive Shear-Wave Velocity Study in the Poplar Bluff Area, Southeast Missouri
"'., I U.S. SIEVE NUMBERS I
• • , 2 1.5 I 31. 112318 3 • • 8 ,0 ,. 16 2(1 XI 00 50 60 100 100 200
'00 , ~
'" '\ M
'" "
\ \
" '" \\ M
~'" §" \ II "' \
ffi '\
II: \
'" " " " "
~
, \' 0
'00 " , 0.' 0.01 0,001
GRAIN SIZE IN MILLIMETERS
I COBBLES GRAVEL SAND
SILT OR CLAY ~~ ,~ ~~ medium ,~
i
~ LL PL PI Co C,
i~ 1* .... 1' ·70
I~ ~ 12' 18 10 1' ·76 L3S
~I ~I 2.' I
65.' ' .75 ' .321 ' .199 0.127 87.' 75.' 4.7. ' .973 0.26 0.098 0.0 83.2 7.'
~. g ~ 4.7. ' .293 '.' 0.0 .... 29.
l'.~~ I SIZE UTION ~"'''~'$&, i ~~, .~~\ UNIVERSITY OF MISSOURI-ROLLA : Poplar Bluff Project - Boreholes " G:R DEPARTMENT OF CIVIL ENGINEERING ~ , \. I" I')..'t. ~'~! GEOTECHNICAL ENGINEERING Poplar Bluff Butler County. Missouri ~~~'<f;jf Job No __ RIOJ-029
Figure C.4: Grain size distribution curves for Boring IDs BHUMR-2 and BHUMR-5 (Appendix A).
141
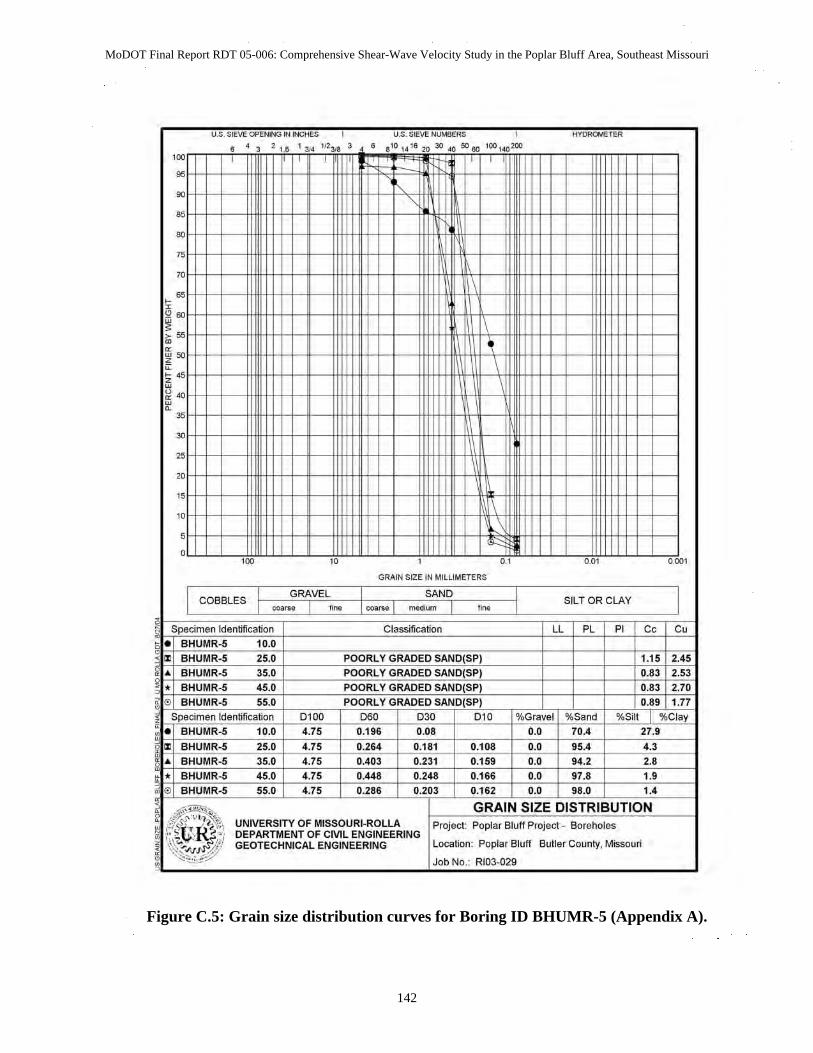
MoDOT Final Report RDT 05-006: Comprehensive Shear-Wave Velocity Study in the Poplar Bluff Area, Southeast Missouri
142
Figure C.5: Grain size distribution curves for Boring ID BHUMR-5 (Appendix A).
"'., I U.S. SIEVE NUMBERS I
• • , 2 1.5 I 31. 112318 3 • • 8 ,0 ,. 16 2(1 XI 00 50 60 100 100 200
'00 , ~
'" M
'" ~\\I
" III' III
" M
~ '" §" , II "' 111\\1 \
II: '" " " " " ,
"" 0 ' 00 "
, 0.' 0.01 0,001
GRAI N SIZE IN MILLIMETERS
I COBBLES GRAVEL SAND
SILT OR CLAY ~~ ,~ ~~ medium ,~
i I i LL PL PI Co C,
i~. ~ I •. " I 2.53
I~ 45.'
~~ 1' ·83 12.70
~I 27.' I I
10.0 ' .75 ' .196 ' .08 •• 70.'
25.' ' .75 ' .264 ' .181 ' .108 ••• 95.' ' .3
~ 55.' ' .75 ' .286 •• '~62 ••• 98.' 1.'
l'.~~ I SIZE UTION ~"'''~'$&, i ~~, . ~~\ UNIVERSITY OF MISSOURI-ROLLA : Poplar Bluff Project - Boreholes " G:R DEPARTMENT OF CIVIL ENGINEERING ~ , \. I" I')..'t. ~'~! GEOTECHNICAL ENGINEERING Poplar Bluff Butler County. Missouri ~~~'<f;jf Job No __ RIOJ-029
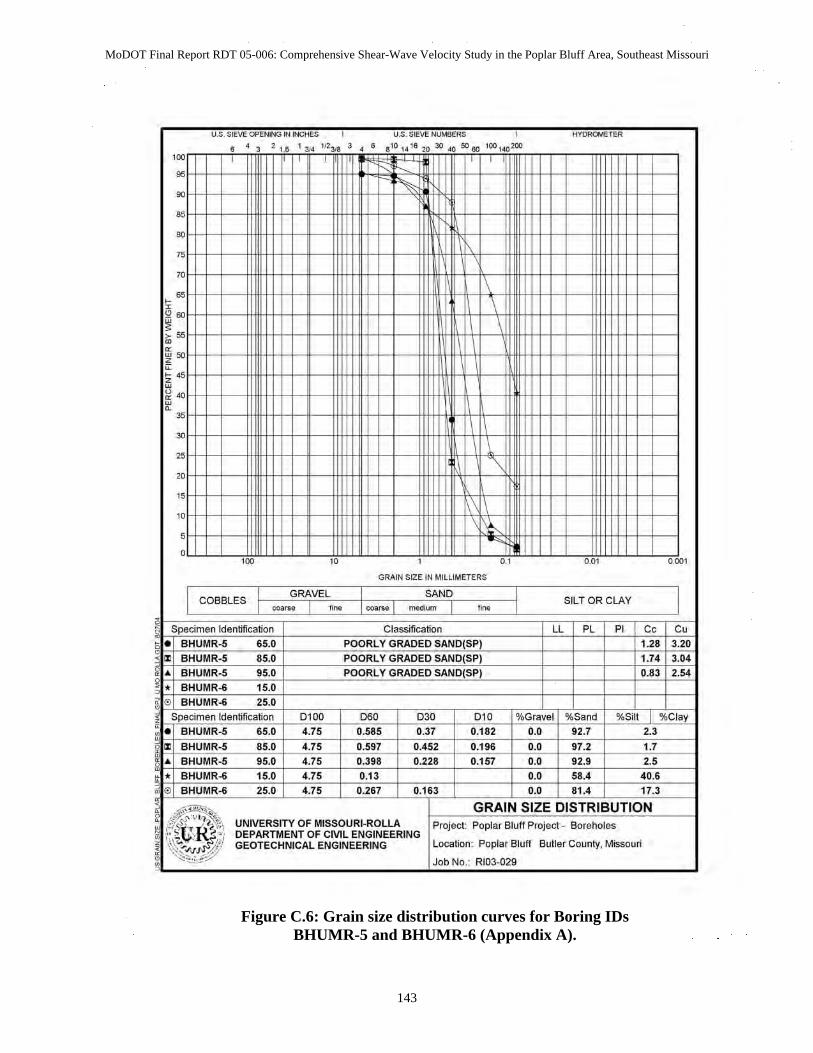
MoDOT Final Report RDT 05-006: Comprehensive Shear-Wave Velocity Study in the Poplar Bluff Area, Southeast Missouri
"'.'" ' . I ,::.~~~":-:'~ . '00" ,;" , , , ,
,
-lmt
\ \
~. \
Ii II I
flit- '" ,
GRAIN SIZE IN MILLIMETERS
I COBBLES GRAVEL SAND
SILT OR CLAY ~~ ,~ ~~ medium ,~
i
~ LL PL PI Co C,
i~. I •. " I 2.54
I~ 15.'
~I 2.3 I I
65.' 4.75 ' .58S ' .37 ' .182 •• 92.
85.' 4.7S ' .59; ' .452 ' .196 ••• 97.2 1.7
~ @ 25.' 4.7S ' .261 •• ••• 81.4 17.3
l"~~ I SIZE UTION ~"'''~'$&, i ~~, . ~~\ UNIVERSITY OF MISSOURI-ROLLA : Poplar Bluff Project - Boreholes " :(;:R DEPARTMENT OF CIVIL ENGINEERING ~ , \. I" I')..'t. ~'~! GEOTECHNICAL ENGINEERING Poplar Bluff Butler County. Missouri ~~~'<f;jf Job No. _ RIOJ-029
Figure C.6: Grain size distribution curves for Boring IDs BHUMR-5 and BHUMR-6 (Appendix A).
143
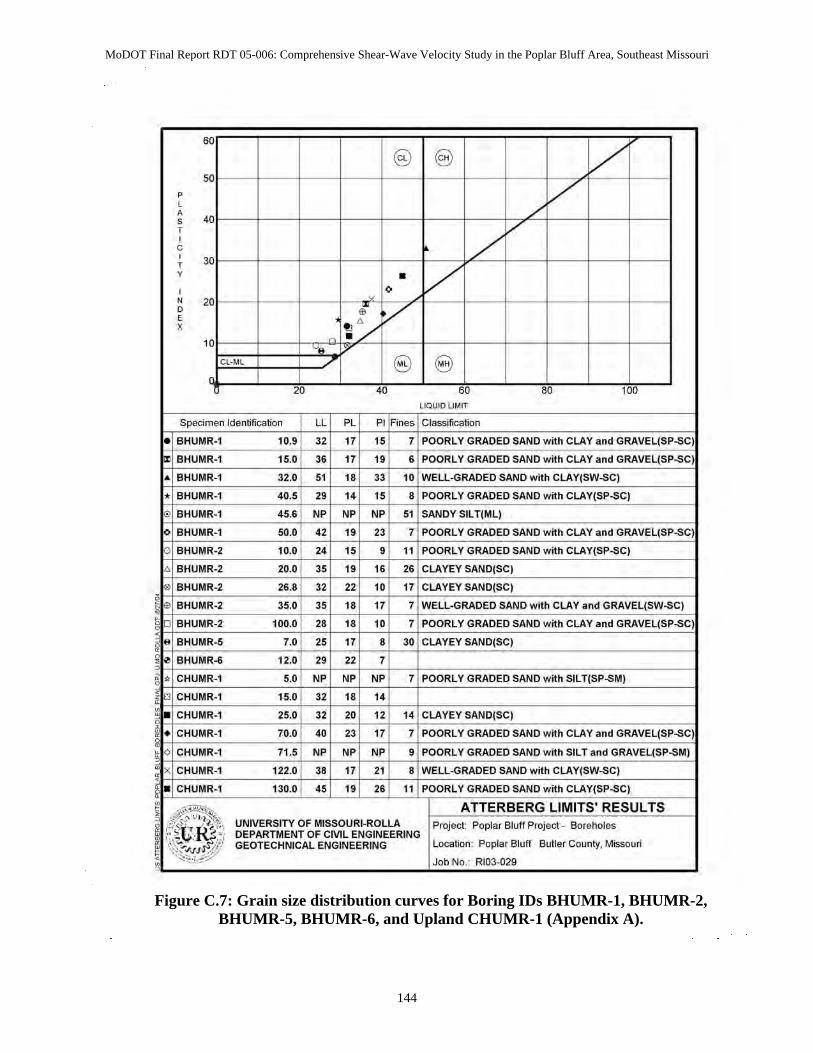
MoDOT Final Report RDT 05-006: Comprehensive Shear-Wave Velocity Study in the Poplar Bluff Area, Southeast Missouri
144
Figure C.7: Grain size distribution curves for Boring IDs BHUMR-1, BHUMR-2, BHUMR-5, BHUMR-6, and Upland CHUMR-1 (Appendix A).
60
/ @ @ 50
e / , /' , , 40 , ,/ ,
/ c , 30 ,
V , • , • , 20 0 • V ,
1i / , 10
CL-ML 6> 8 20 40 60 80 100
LIQUIO LIMIT
SpeCimen Identification LL PL PI Fines ClasSification
• BHUMR-1 10.9 32 17 15 7 POORLY GRADED SAND with CLAY and GRAVEL(SP-SC)
!Zl BHUMR·1 15.0 36 17 19 • POORLY GRADED SAND with CLAY and GRAVEL(SP-SC)
... BHUMR-1 32.0 51 ,. 33 10 WELL-GRAOED SAND with CLAY(SW-SC)
1< BHUMR-1 40.5 29 14 15 8 POORLY GRADED SAND w ith CLAY(SP-SC)
BHUMR-1 45.6 NP NP NP 51 SANDY SIL T(ML)
o BHUMR-1 50.0 42 19 23 7 POORLY GRADED SAND with CLAY and GRAVEL(SP-SC)
BHUMR·2 10.0 24 15 9 11 POORL. Y GRADED SAND with CLAY(SP-SC)
t>. B HUMR-2 20.0 35 19 16 26 CLAYEY SAND(SC)
B HUMR-2 26.8 32 22 10 17 CLAYEY SAND(SC)
! BHUMR·2 35.0 35 ,. 17 7 WELL-GRAOED SAND with CLAY and GRAVEL(SW-SC) , 0 B HUMR-2 100.0 28 ,. 10 7 POORLY GRADED SAND with CLAY and GRAVEL(SP-SC) 0
~ 8 BHUMR-5 7.0 " 17 8 30 CLAYEY SAND(SC)
~ ., B HUMR-6 12.0 29 22 7 , ~ '" CHUMR-1 5.0 NP NP NP 7 POORLY GRADED SAND with Sil T(SP-SM)
~ CHUMR·1 15.0 32 18 14 i. CHUMR·1 25.0 32 20 12 14 CLAYEY SAND(SC)
• CHUMR·1 70.0 40 23 17 7 POORLY GRADED SAND w ith CLAY and GRAVEl(SP-SC) , ~ 0 CHUMR·1 71 .5 NP NP NP 9 POORLY GRADED SAND with SilT and GRAVEl(SP-SM)
~ x CHUMR·1 122.0 J8 17 21 8 WEll-GRAOED SAND with CLAY(SW-SC)
~ • CHUMR·1 130.0 " 19 26 11 POORLY GRADED SAND with CLAY(SP-SC)
" l'otti;.~ ATTERBERG LIMITS' RESULTS ~ ~~' \I "l~\ UNIVERSITY OF MISSOURI-ROLLA Project: Poplar Bluff Project - Boreholes ~ i' ¢M~\i\ ~ ~ , \. I" DEPARTMENT OF CIVIL ENGINEERING ~ \\t.. ~'~! GEOTECHNICAL ENGINEERING Location: Poplar Bluff Butler County. Missouri ~ ~J<I Jf ~ ""~:,f."-' Job No. _ RI03-029 ,
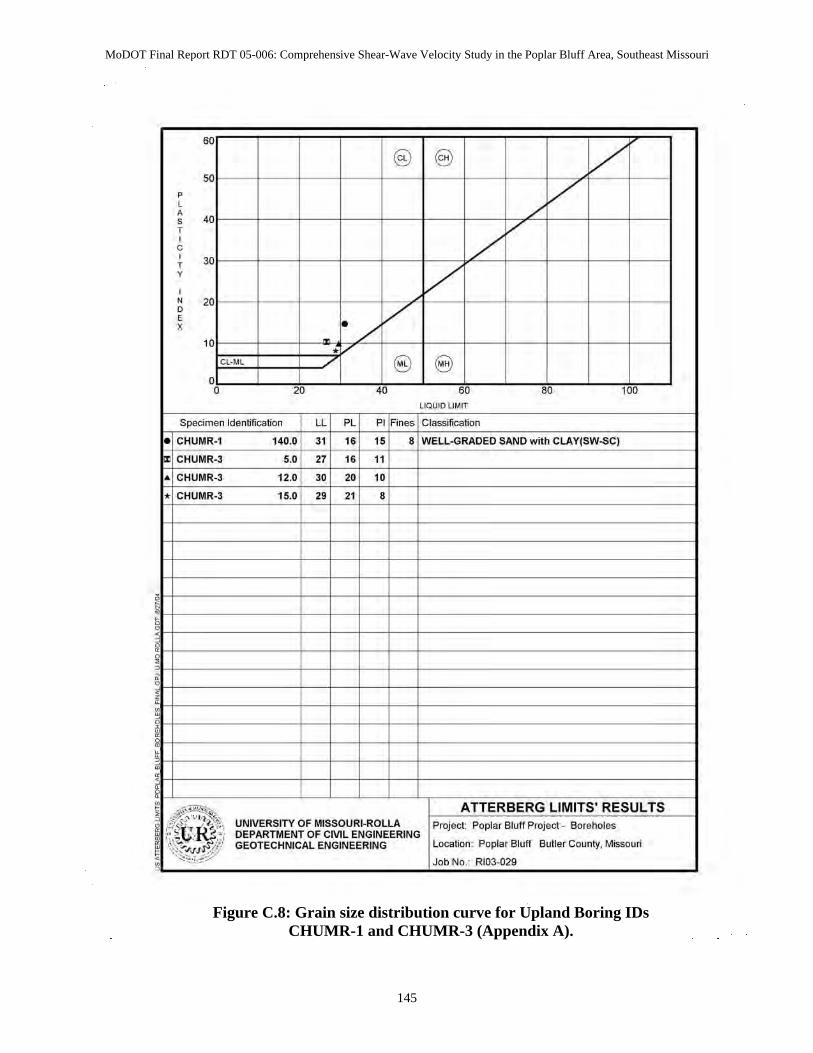
MoDOT Final Report RDT 05-006: Comprehensive Shear-Wave Velocity Study in the Poplar Bluff Area, Southeast Missouri
60
/ @ @ 50
e / , /' , , 40 , ,/ ,
/ c , 30 ,
V , , , 20 0 V , , • /' 10 •
CL-ML 6> 8 0 0 20 40 60 80 100
LIQUIO LIMIT
SpeCimen Identification LL PL PI Fines ClasSification
• CHUMR-1 140.0 31 16 15 8 WELL-GRAOED SAND with CLAY(SW-SC)
!Zl CHUMR·3 5.0 27 16 11
... CHUMR-J 12.0 30 20 10
1< CHUMR-3 15.0 29 21 8
! , 0 0
i ! , , 0
~ , I , ! , • i " l'e:i;.~ ATTERBERG LIMITS' RESULTS ~ ~~' \I "l~\ UNIVERSITY OF MISSOURI-ROLLA Project: Poplar Bluff Project - Boreholes ~ i' ¢M~\i\ ~ ~ , \. I" DEPARTMENT OF CIVIL ENGINEERING ~ \\t.. ~'~! GEOTECHNICAL ENGINEERING location: Poplar Bluff Butler County. Missouri ~ ~J<I Jf ~ ""~:,f."-' Job No._ RIOJ-029 ,
Figure C.8: Grain size distribution curve for Upland Boring IDs CHUMR-1 and CHUMR-3 (Appendix A).
145
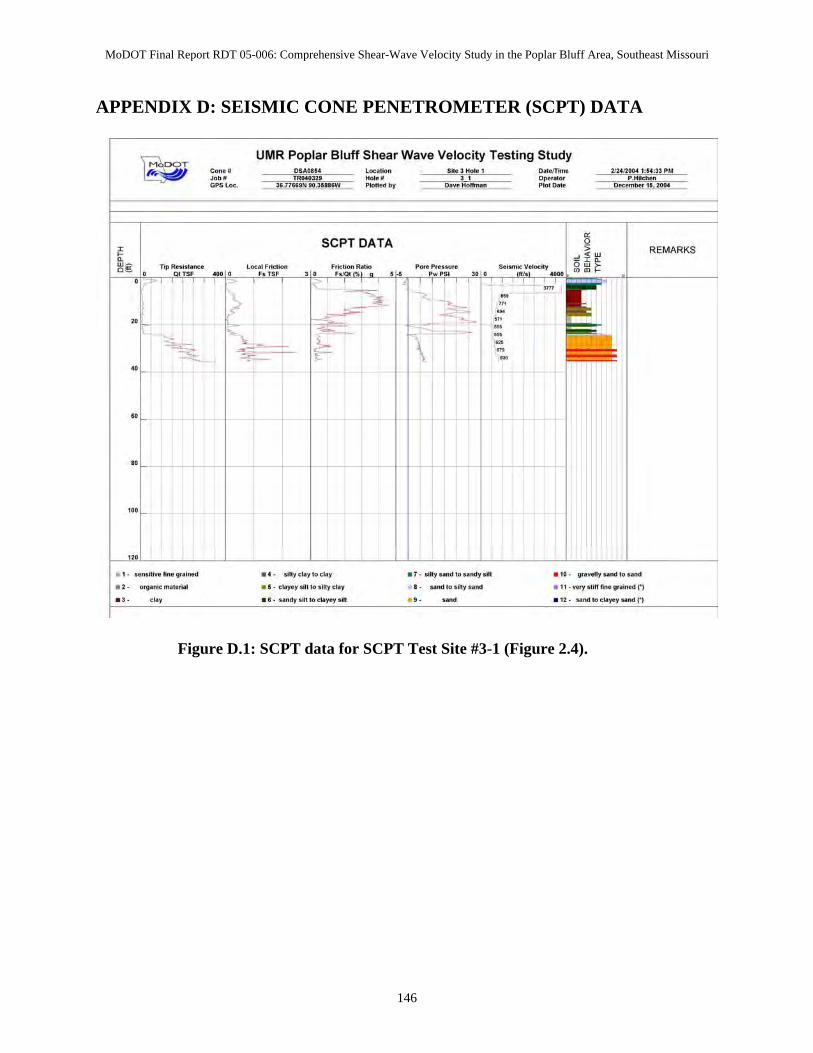
MoDOT Final Report RDT 05-006: Comprehensive Shear-Wave Velocity Study in the Poplar Bluff Area, Southeast Missouri
APPENDIX D: SEISMIC CONE PENETROMETER (SCPT) DATA
Figure D.1: SCPT data for SCPT Test Site #3-1 (Figure 2.4).
146
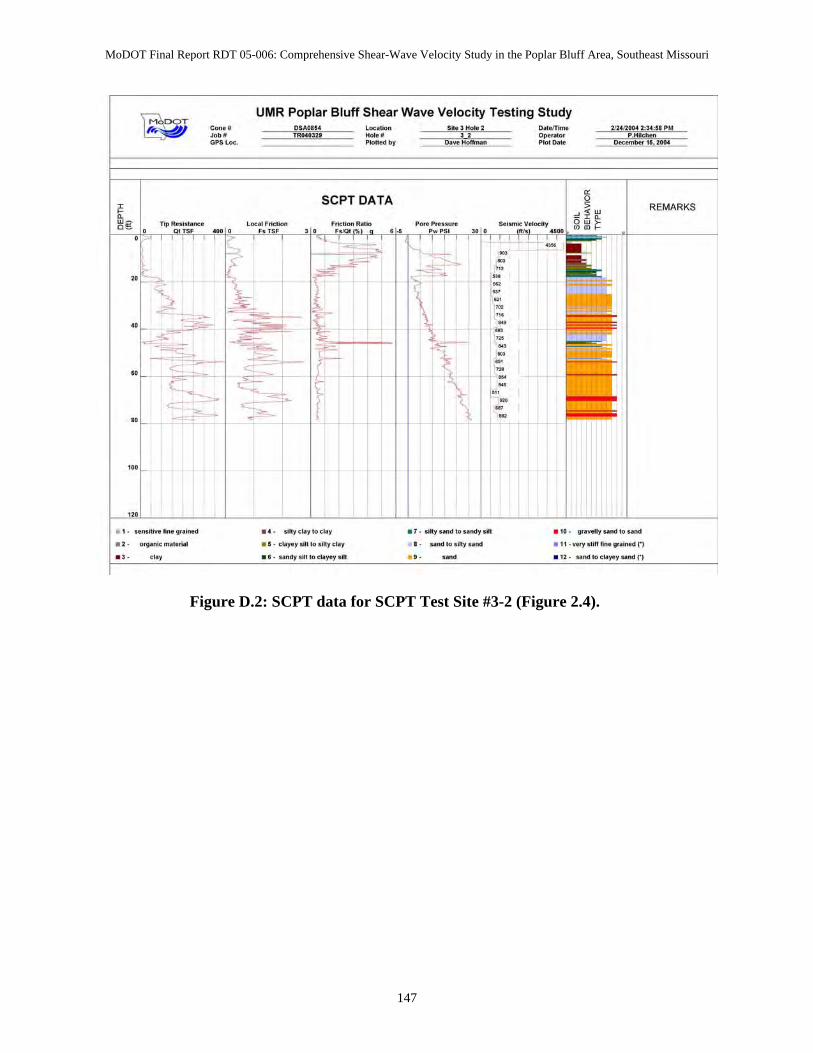
MoDOT Final Report RDT 05-006: Comprehensive Shear-Wave Velocity Study in the Poplar Bluff Area, Southeast Missouri
147
Figure D.2: SCPT data for SCPT Test Site #3-2 (Figure 2.4).
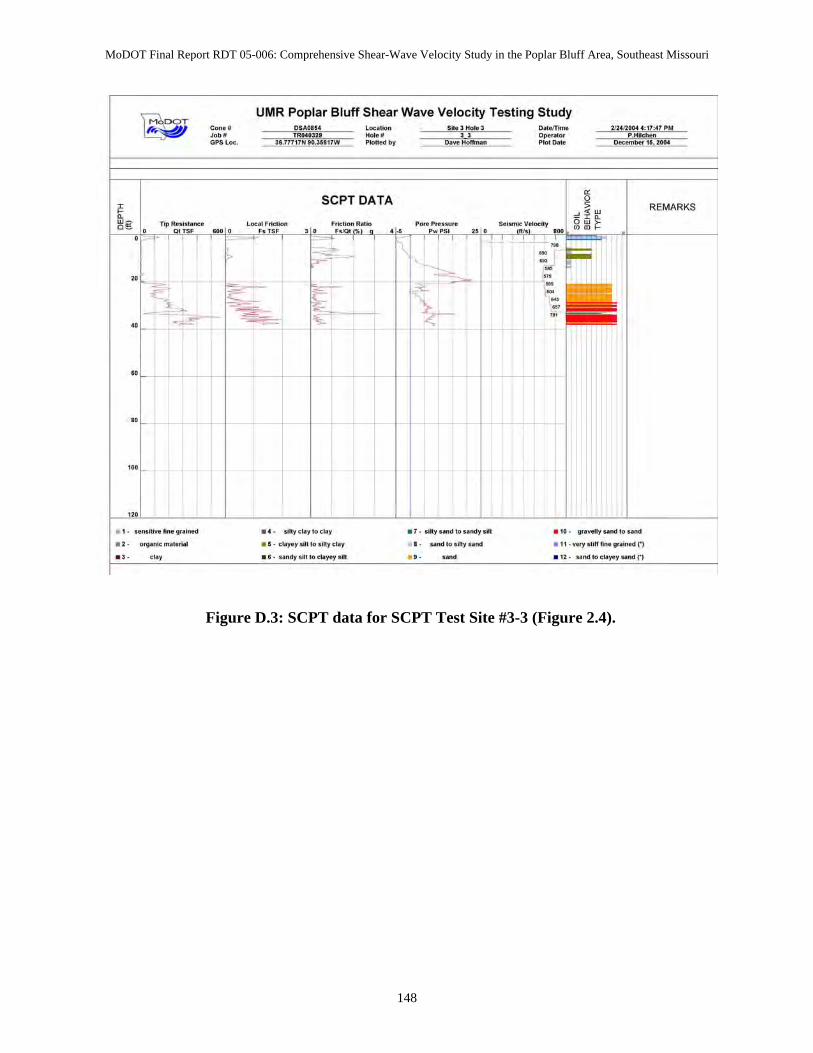
MoDOT Final Report RDT 05-006: Comprehensive Shear-Wave Velocity Study in the Poplar Bluff Area, Southeast Missouri
148
Figure D.3: SCPT data for SCPT Test Site #3-3 (Figure 2.4).

MoDOT Final Report RDT 05-006: Comprehensive Shear-Wave Velocity Study in the Poplar Bluff Area, Southeast Missouri
149
Figure D.4: SCPT data for SCPT Test Site #3-4 (Figure 2.4).
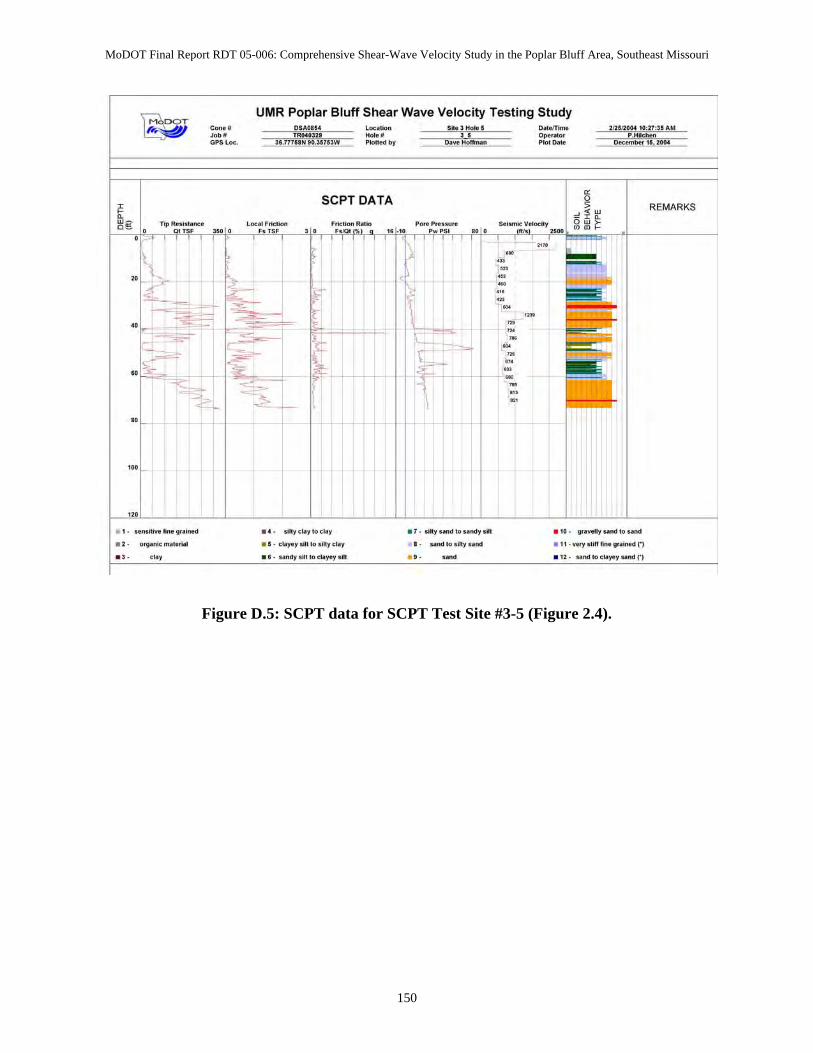
MoDOT Final Report RDT 05-006: Comprehensive Shear-Wave Velocity Study in the Poplar Bluff Area, Southeast Missouri
150
Figure D.5: SCPT data for SCPT Test Site #3-5 (Figure 2.4).
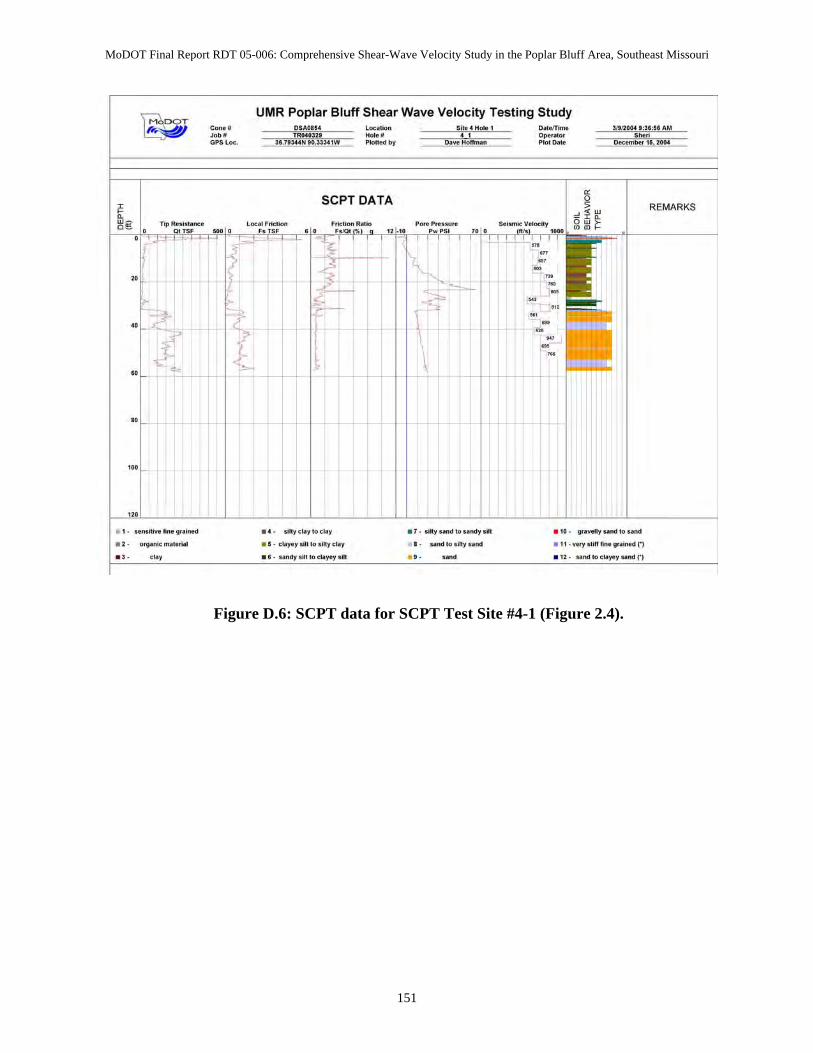
MoDOT Final Report RDT 05-006: Comprehensive Shear-Wave Velocity Study in the Poplar Bluff Area, Southeast Missouri
151
Figure D.6: SCPT data for SCPT Test Site #4-1 (Figure 2.4).
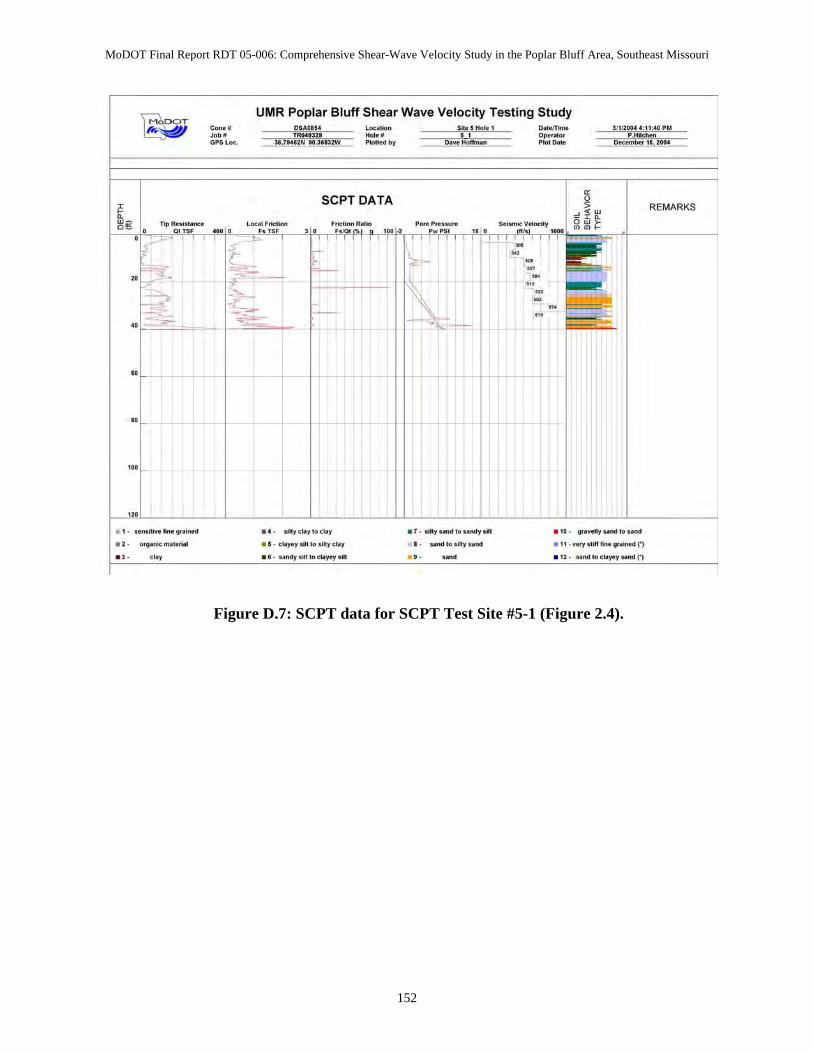
MoDOT Final Report RDT 05-006: Comprehensive Shear-Wave Velocity Study in the Poplar Bluff Area, Southeast Missouri
152
Figure D.7: SCPT data for SCPT Test Site #5-1 (Figure 2.4).
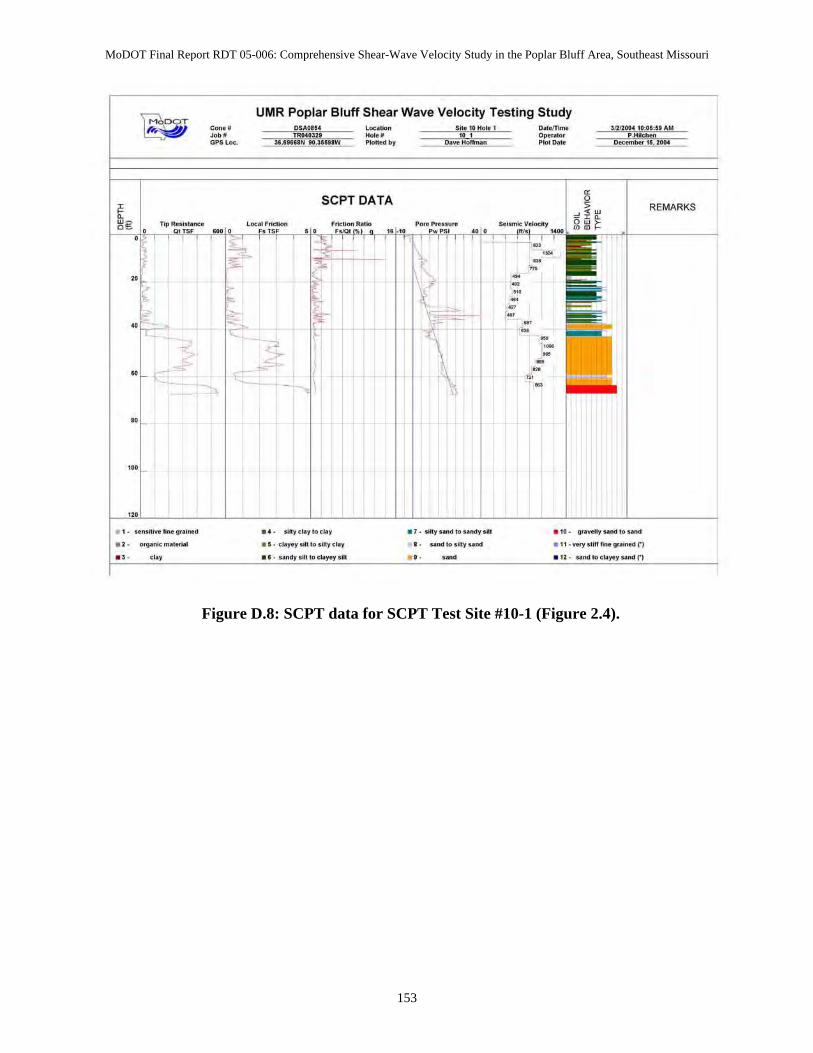
MoDOT Final Report RDT 05-006: Comprehensive Shear-Wave Velocity Study in the Poplar Bluff Area, Southeast Missouri
153
Figure D.8: SCPT data for SCPT Test Site #10-1 (Figure 2.4).
. , .... _-",.-• % • 0<0I'Ii< .........
UMR Poplar Bluff Shear Wave Velocity Testing Study
sePT DATA
••. Il.,< .. ,,,,< .. , . 1· <10\'0, .... "'.-.,< .. ,
____ ""_'!..I:!!!!.L"-'---
~-.
.'·Il.' ..... ' ... "",.~ t· """""*I"""
--
m.100< '."'~'!.",~"'-_ ~11li<_
_1I~
REMARKS
. 11· "' ...... 'Y ..... , ......
• "·...., .. iII_"'·_n
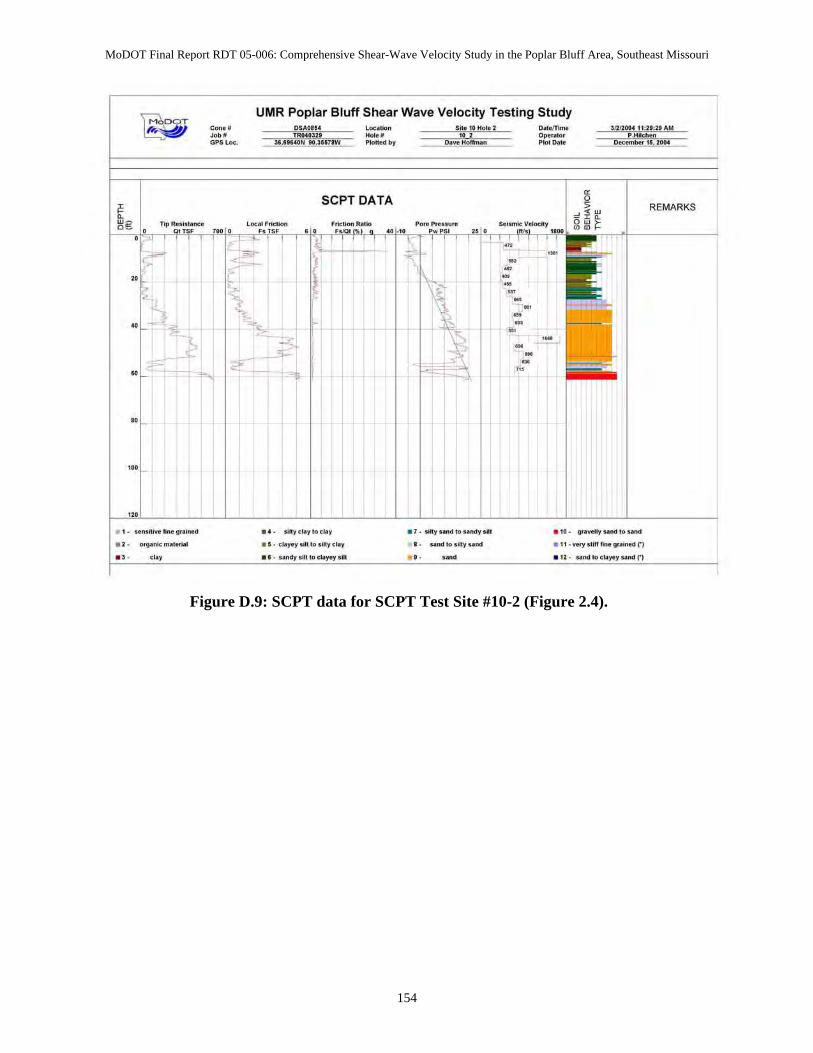
MoDOT Final Report RDT 05-006: Comprehensive Shear-Wave Velocity Study in the Poplar Bluff Area, Southeast Missouri
154
Figure D.9: SCPT data for SCPT Test Site #10-2 (Figure 2.4).
~ UMR Poplar Bluff Shear Wave Veloc ity Testing Study _. --~=t--
1.0< .. .,., __ ""_'!..I:!!!!.L- ~~- m.100< " ·n 'zt ..... _. ..._N-:~"'rw
_. ., _ .. ,--Gf'S l o<. - .. ~-. ~"" ..... -,,~
~g SePT DATA
REMARKS . l g i ~ r ~ . , '.' '-f 1"'- --•
~ l-
~\.~~ +
-., '~"'" ---
~ --
r~ *1 ,-
~ -"'" -- ;:!. -• " ~"\; .,.
• r r :
,. + + +
.,. "._-11"- • •. Il.,o,., ,,", .. , • ,. oI.' ..... 'o .. ""ys~ . ". II' . ..... 'Y ..... , ...... ... 0<0I'!i< ......... ••. <10\'01 01." •• __ ,clo, t· ..... IO • ., .... • " · ...., .. iII """ gr._n ... ,., .,. ... om . n · • • ,
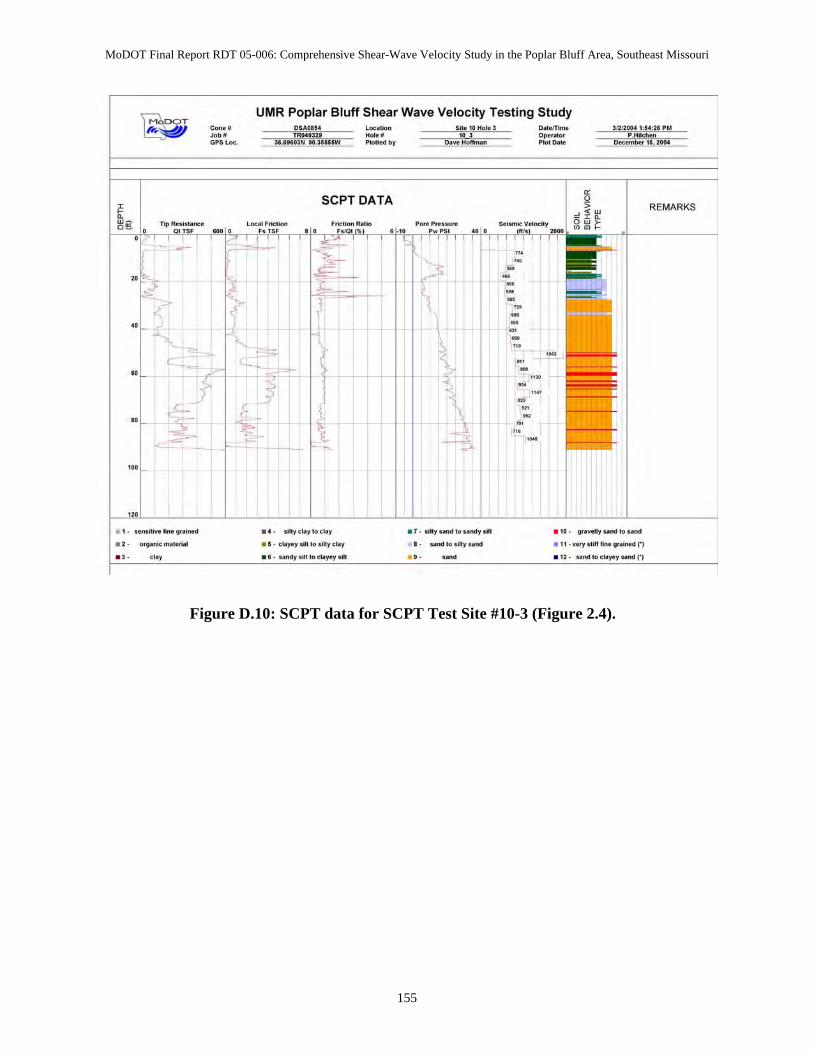
MoDOT Final Report RDT 05-006: Comprehensive Shear-Wave Velocity Study in the Poplar Bluff Area, Southeast Missouri
155
Figure D.10: SCPT data for SCPT Test Site #10-3 (Figure 2.4).
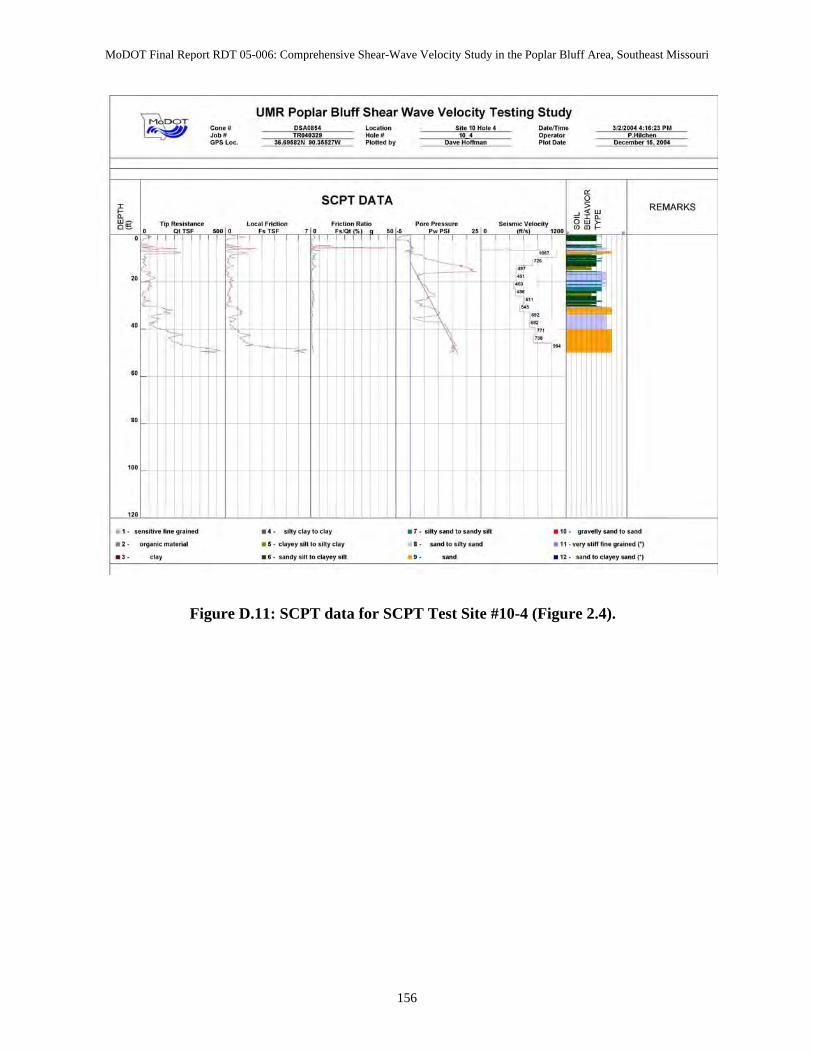
MoDOT Final Report RDT 05-006: Comprehensive Shear-Wave Velocity Study in the Poplar Bluff Area, Southeast Missouri
156
Figure D.11: SCPT data for SCPT Test Site #10-4 (Figure 2.4).
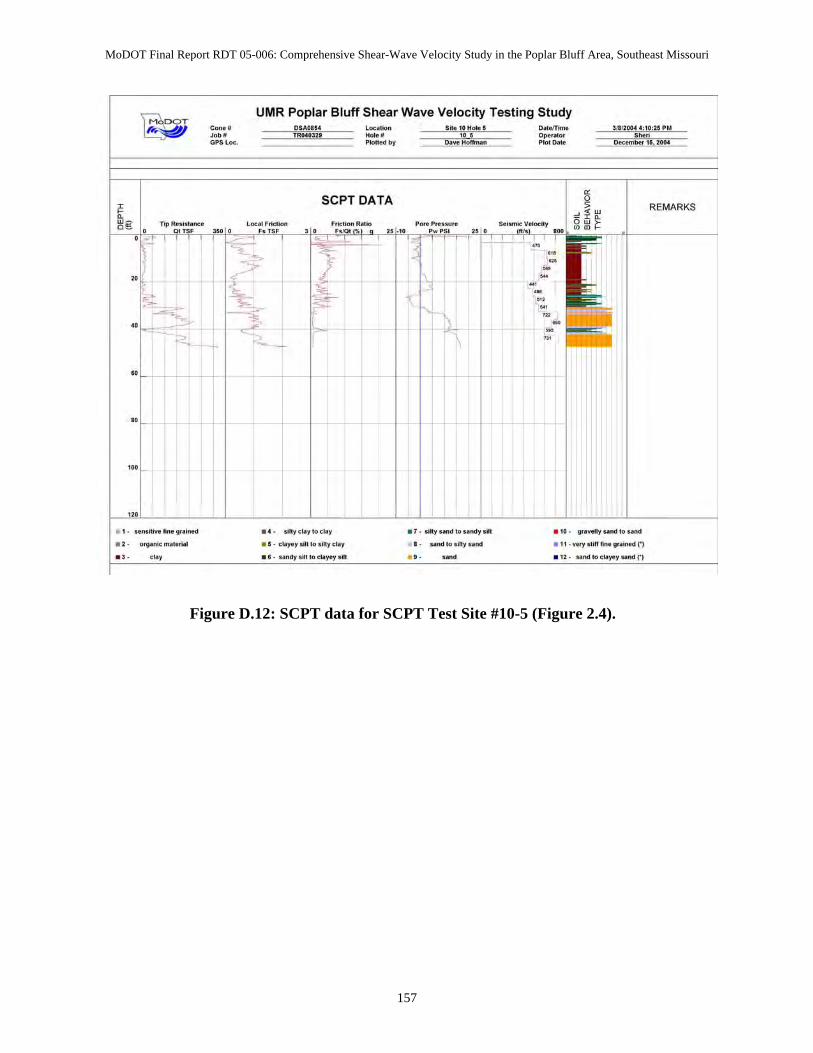
MoDOT Final Report RDT 05-006: Comprehensive Shear-Wave Velocity Study in the Poplar Bluff Area, Southeast Missouri
157
Figure D.12: SCPT data for SCPT Test Site #10-5 (Figure 2.4).
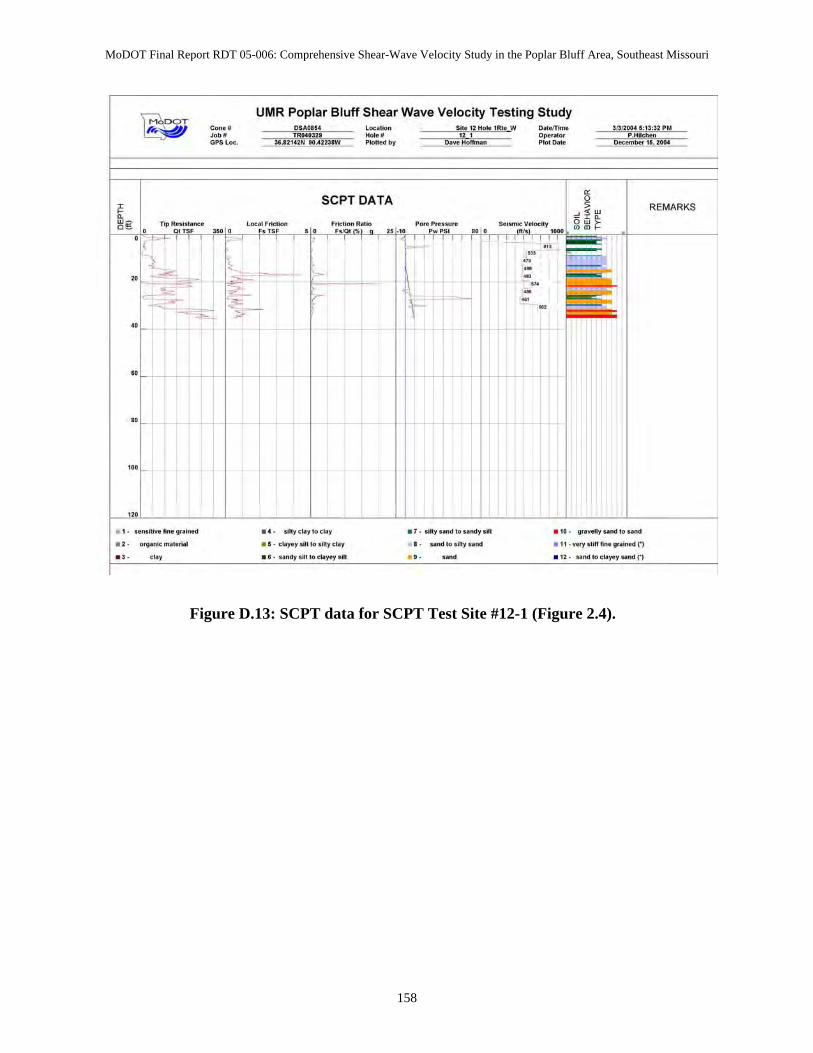
MoDOT Final Report RDT 05-006: Comprehensive Shear-Wave Velocity Study in the Poplar Bluff Area, Southeast Missouri
158
Figure D.13: SCPT data for SCPT Test Site #12-1 (Figure 2.4).
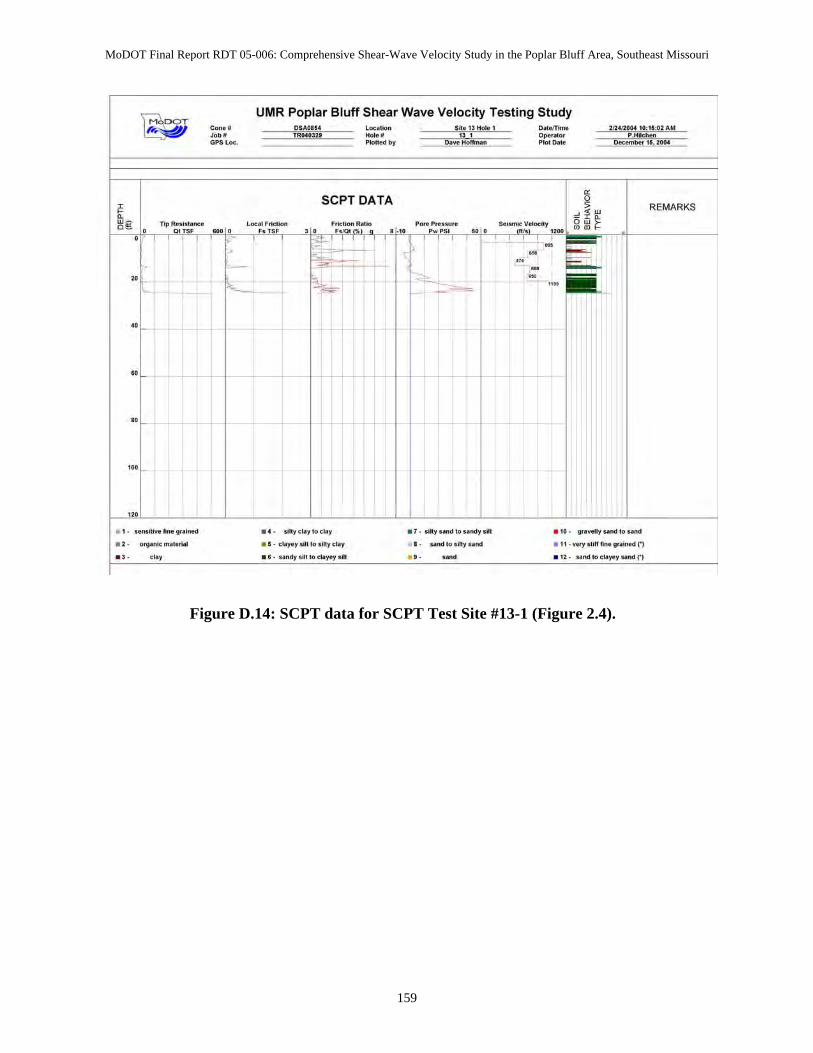
MoDOT Final Report RDT 05-006: Comprehensive Shear-Wave Velocity Study in the Poplar Bluff Area, Southeast Missouri
159
Figure D.14: SCPT data for SCPT Test Site #13-1 (Figure 2.4).
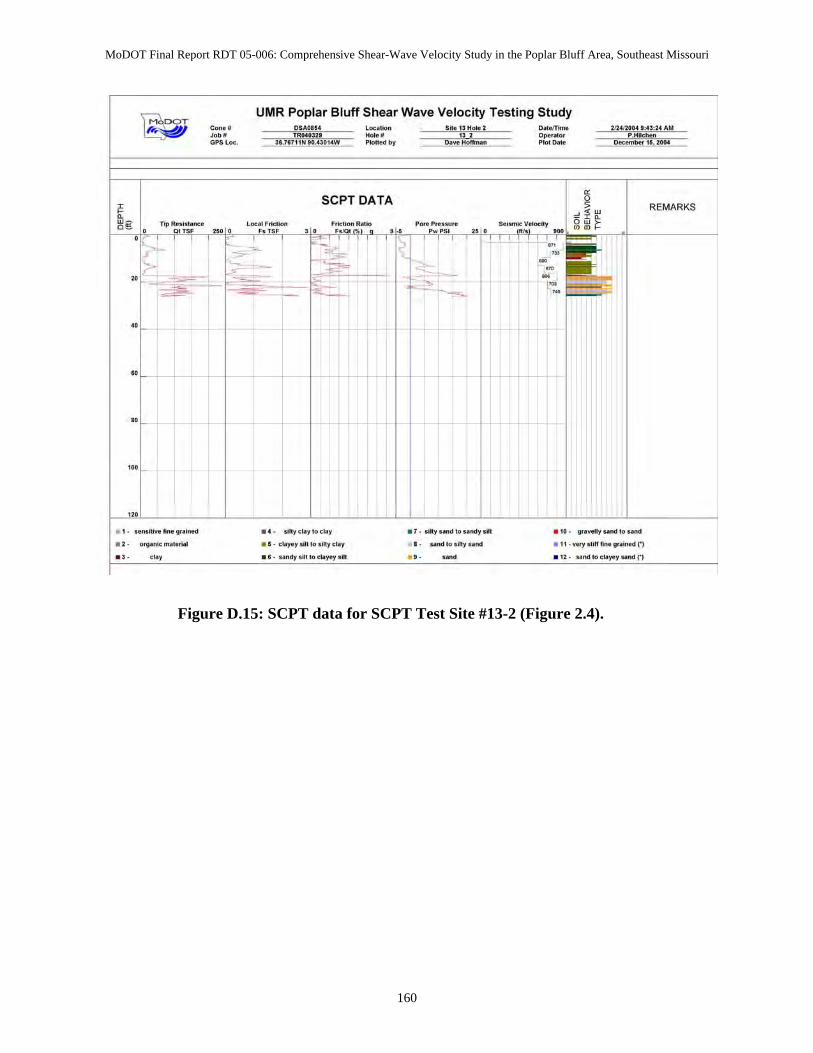
MoDOT Final Report RDT 05-006: Comprehensive Shear-Wave Velocity Study in the Poplar Bluff Area, Southeast Missouri
160
Figure D.15: SCPT data for SCPT Test Site #13-2 (Figure 2.4).
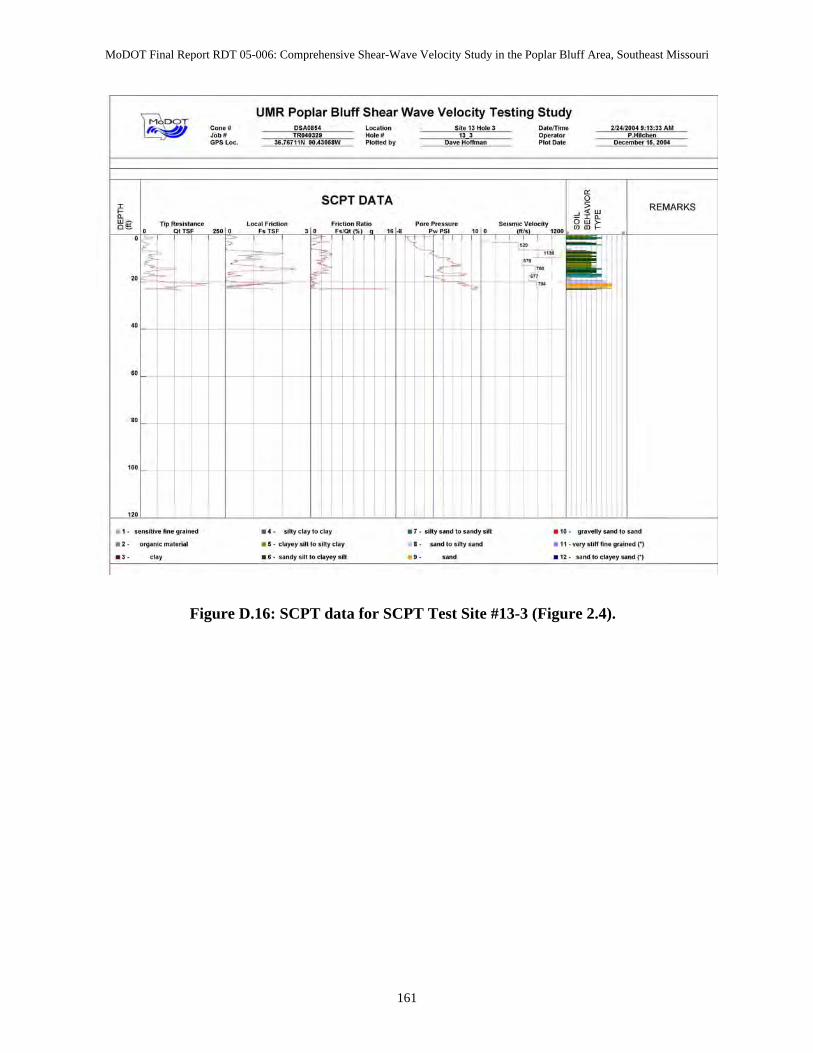
MoDOT Final Report RDT 05-006: Comprehensive Shear-Wave Velocity Study in the Poplar Bluff Area, Southeast Missouri
161
Figure D.16: SCPT data for SCPT Test Site #13-3 (Figure 2.4).
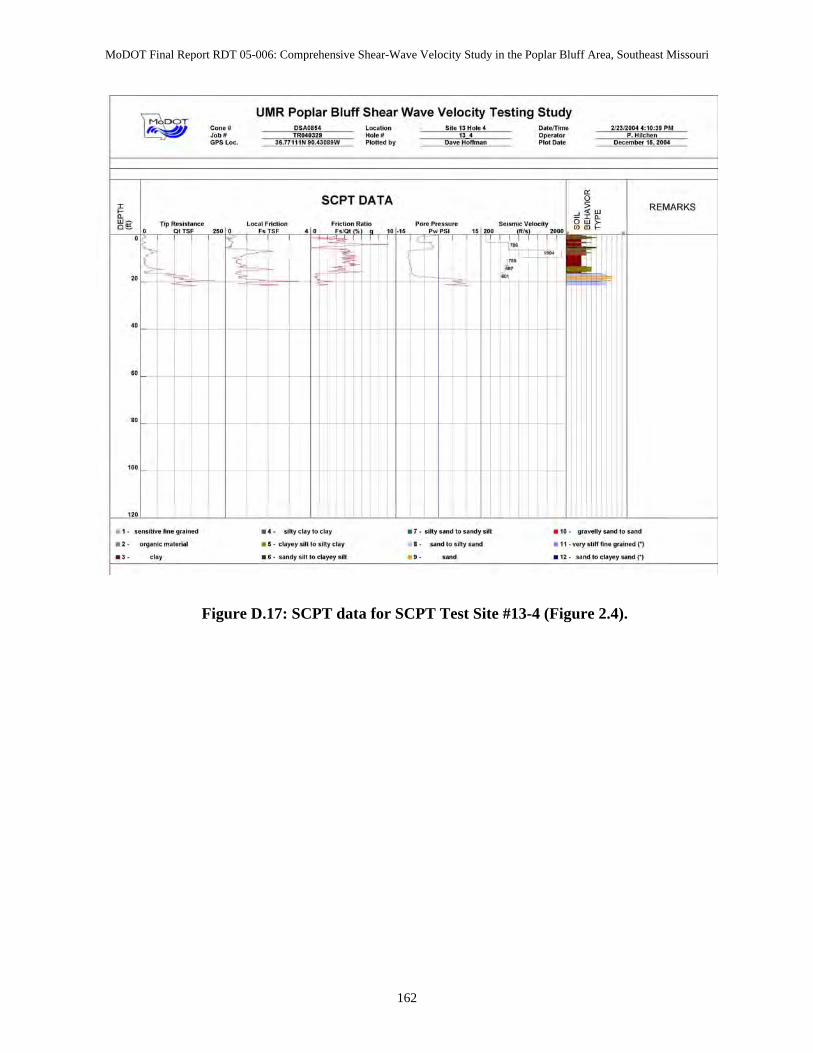
MoDOT Final Report RDT 05-006: Comprehensive Shear-Wave Velocity Study in the Poplar Bluff Area, Southeast Missouri
162
Figure D.17: SCPT data for SCPT Test Site #13-4 (Figure 2.4).
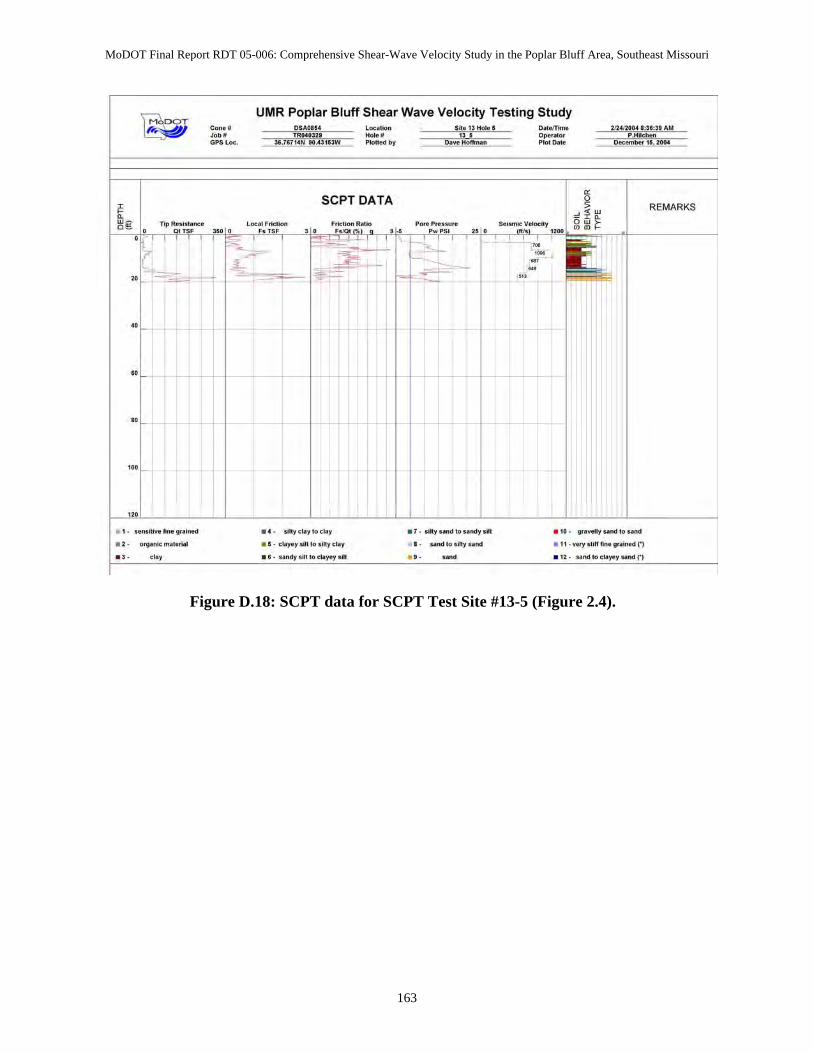
MoDOT Final Report RDT 05-006: Comprehensive Shear-Wave Velocity Study in the Poplar Bluff Area, Southeast Missouri
163
Figure D.18: SCPT data for SCPT Test Site #13-5 (Figure 2.4).
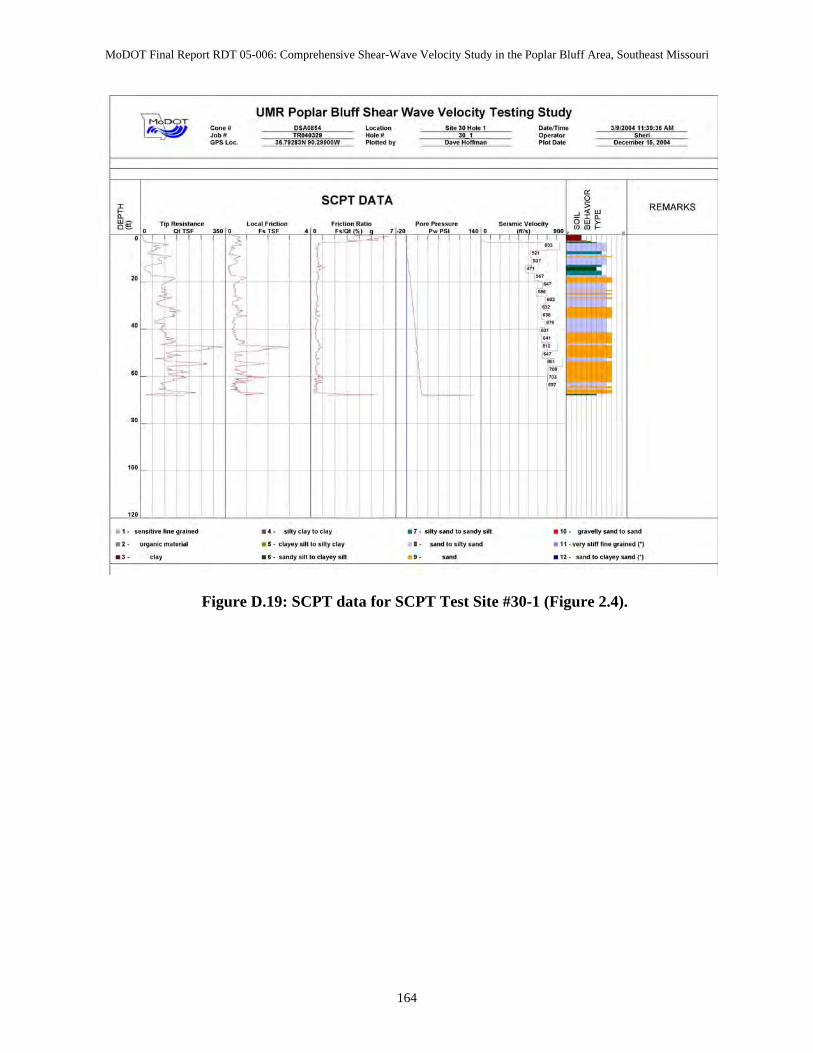
MoDOT Final Report RDT 05-006: Comprehensive Shear-Wave Velocity Study in the Poplar Bluff Area, Southeast Missouri
164
Figure D.19: SCPT data for SCPT Test Site #30-1 (Figure 2.4).
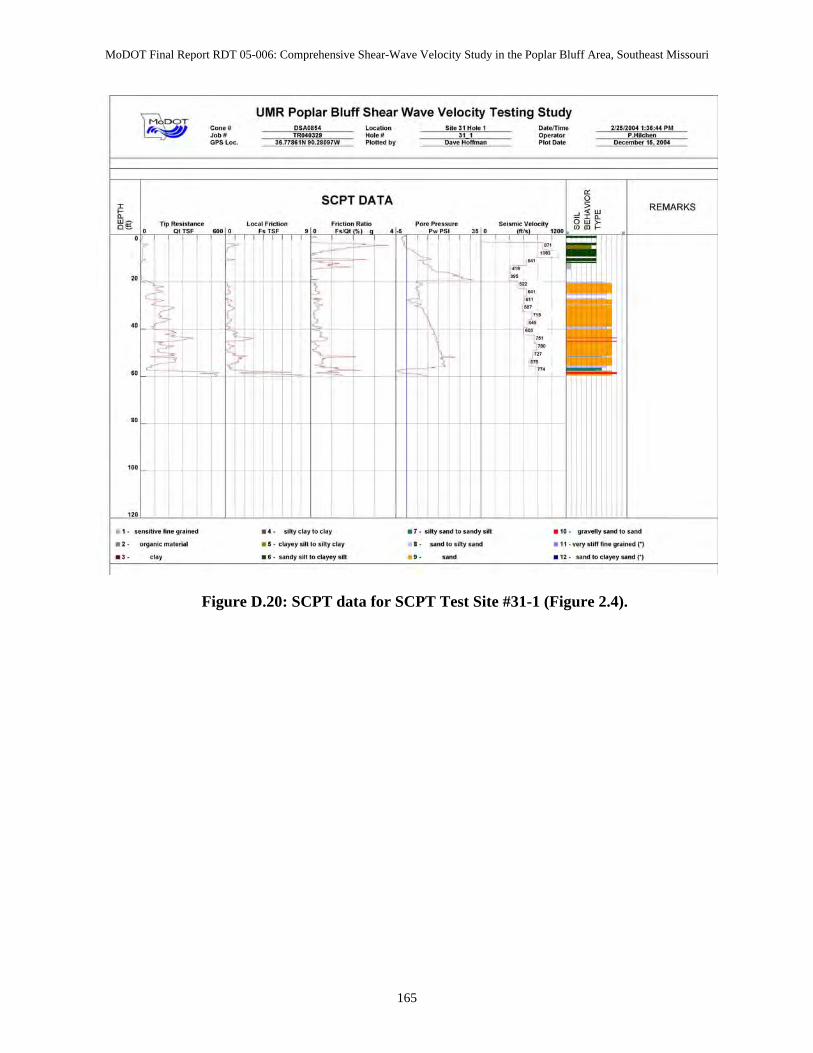
MoDOT Final Report RDT 05-006: Comprehensive Shear-Wave Velocity Study in the Poplar Bluff Area, Southeast Missouri
165
Figure D.20: SCPT data for SCPT Test Site #31-1 (Figure 2.4).
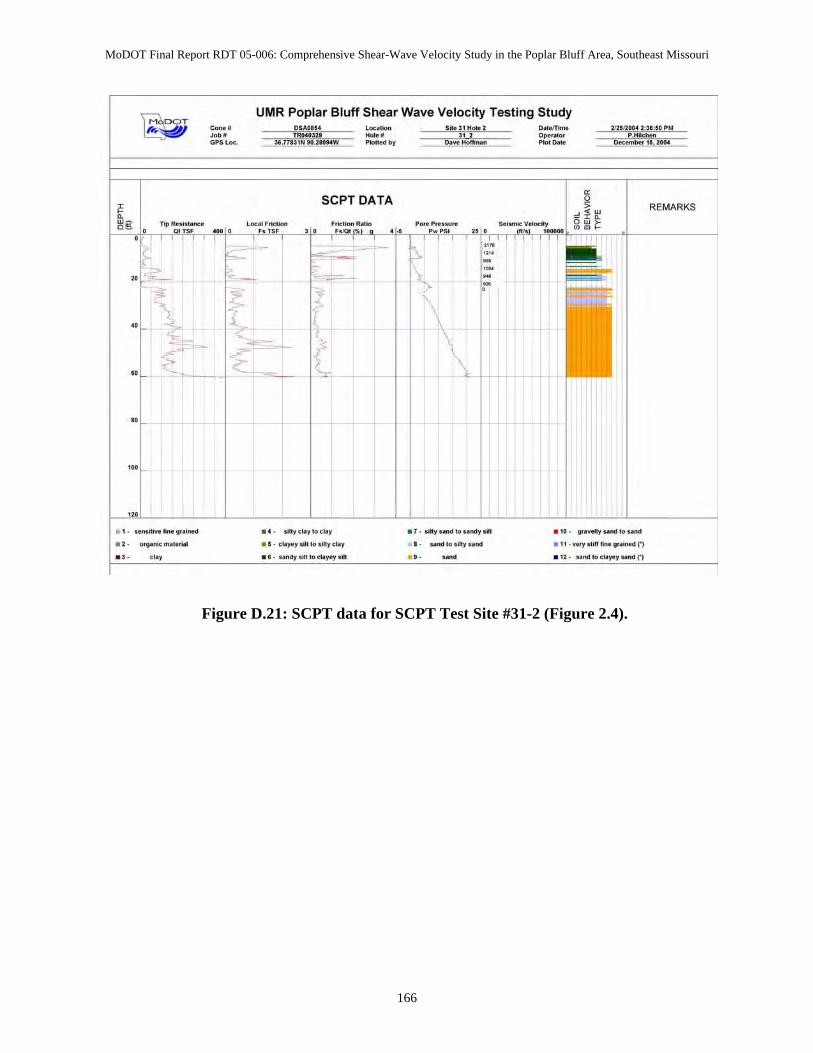
MoDOT Final Report RDT 05-006: Comprehensive Shear-Wave Velocity Study in the Poplar Bluff Area, Southeast Missouri
166
Figure D.21: SCPT data for SCPT Test Site #31-2 (Figure 2.4).
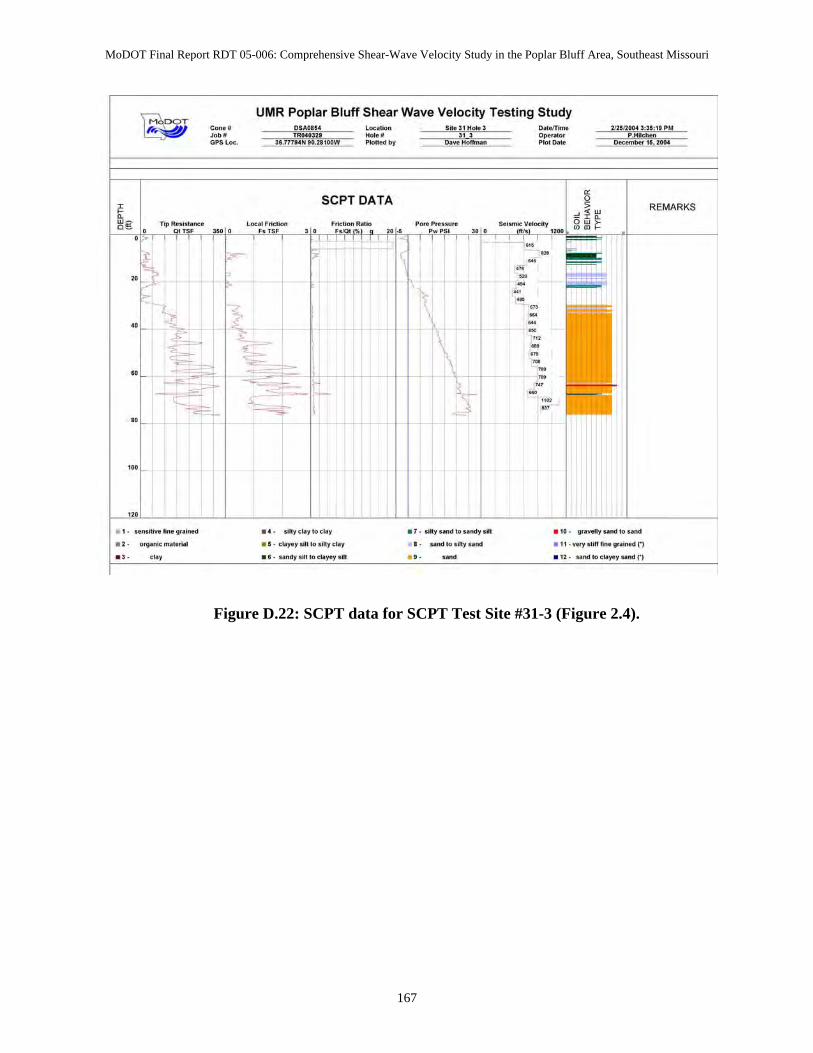
MoDOT Final Report RDT 05-006: Comprehensive Shear-Wave Velocity Study in the Poplar Bluff Area, Southeast Missouri
167
Figure D.22: SCPT data for SCPT Test Site #31-3 (Figure 2.4).

MoDOT Final Report RDT 05-006: Comprehensive Shear-Wave Velocity Study in the Poplar Bluff Area, Southeast Missouri
168
Figure D.23: SCPT data for SCPT Test Site #31-4 (Figure 2.4).
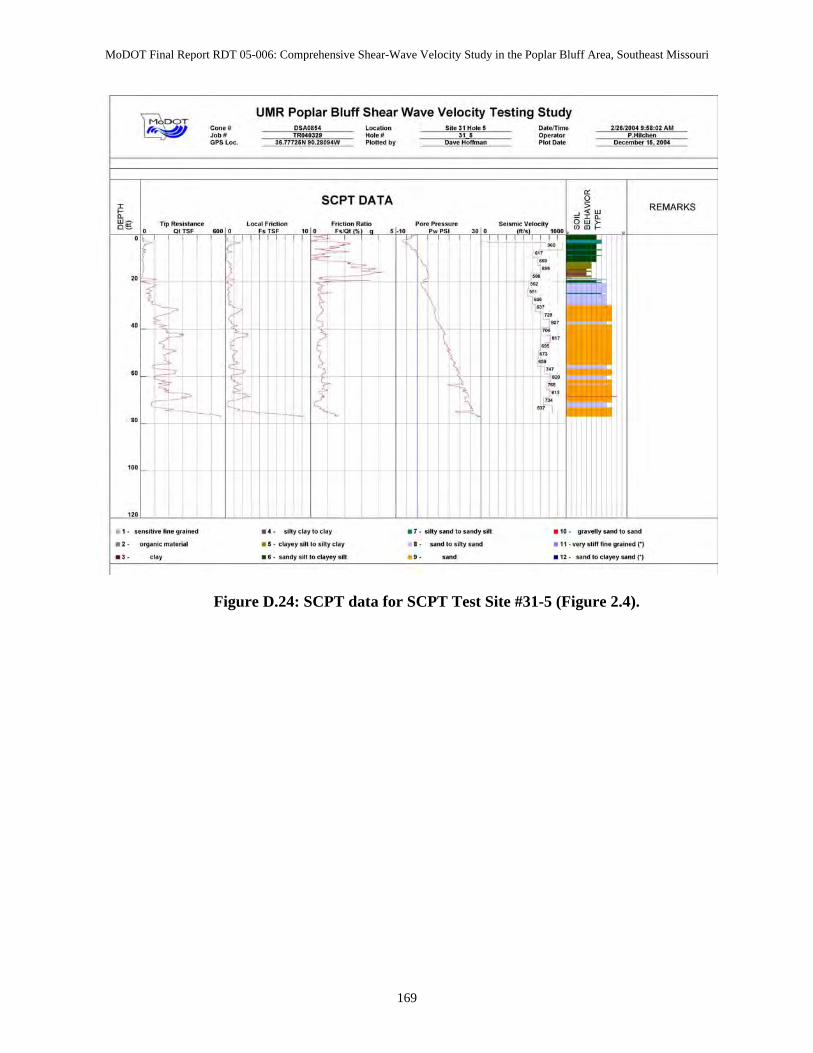
MoDOT Final Report RDT 05-006: Comprehensive Shear-Wave Velocity Study in the Poplar Bluff Area, Southeast Missouri
169
Figure D.24: SCPT data for SCPT Test Site #31-5 (Figure 2.4).
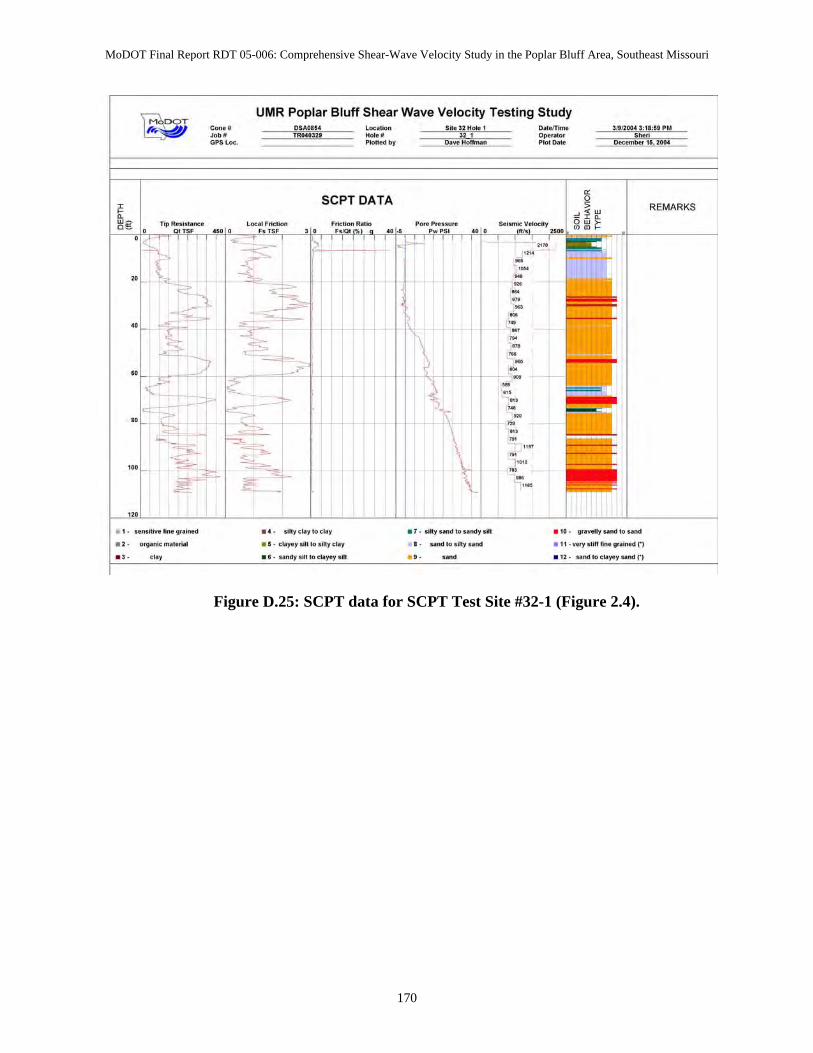
MoDOT Final Report RDT 05-006: Comprehensive Shear-Wave Velocity Study in the Poplar Bluff Area, Southeast Missouri
170
Figure D.25: SCPT data for SCPT Test Site #32-1 (Figure 2.4).
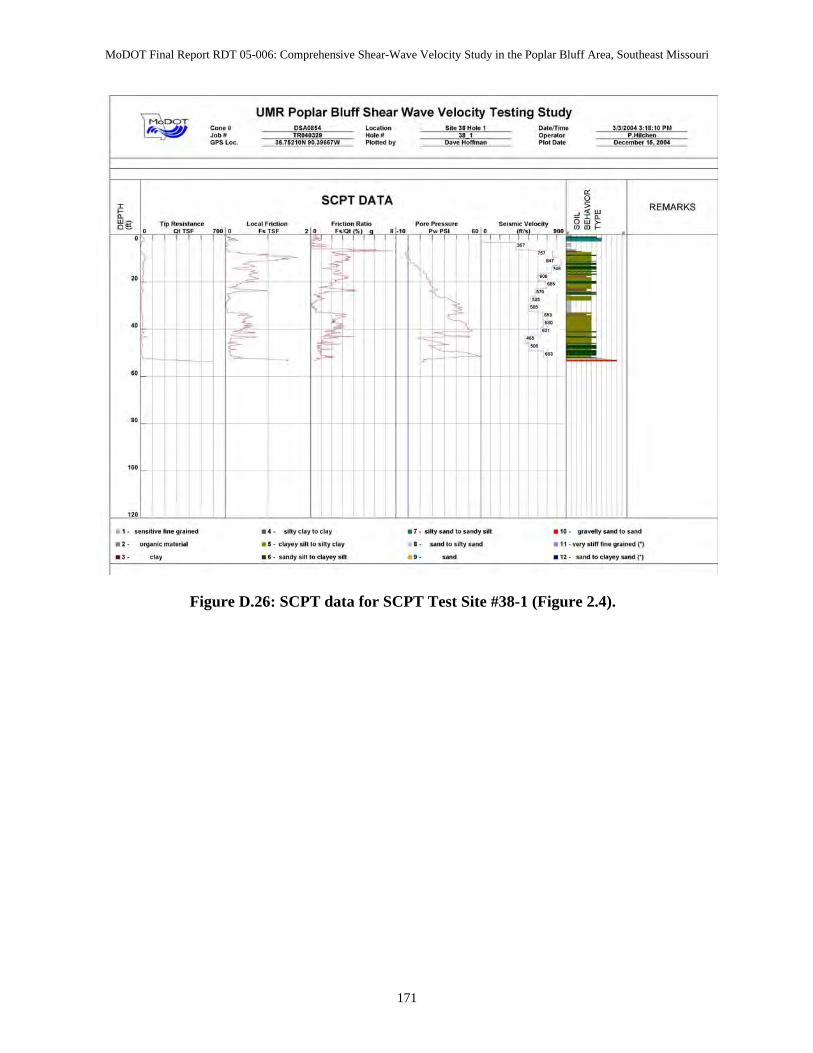
MoDOT Final Report RDT 05-006: Comprehensive Shear-Wave Velocity Study in the Poplar Bluff Area, Southeast Missouri
171
Figure D.26: SCPT data for SCPT Test Site #38-1 (Figure 2.4).
MoDOT Final Report RDT 05-006: Comprehensive Shear-Wave Velocity Study in the Poplar Bluff Area, Southeast Missouri
APPENDIX E: MASW SENSITIVITY ANALYSES E.1 Overview The transformation of field-recorded Rayleigh-wave data into shear-wave velocity data is based on two fundamental assumptions. The first assumption is that a reliable dispersion curve can be extracted from the field-recorded Rayleigh-wave data. The second assumption is that reliable shear-wave velocities can be extracted from a Rayleigh-wave dispersion curve, even though the dispersion curve is principally a function of two unknowns: the shear-wave velocity of the subsurface and the compression-wave velocity of the subsurface. In order to evaluate the reasonableness of these two assumptions, we conducted two sensitivity analyses. In the first sensitivity study, we analyzed the qualitative processes involved in the extraction of a dispersion curve from field-recorded Rayleigh-wave data. We concluded that a trained interpreter will consistently extract reliable dispersion curve data from good-quality field-recorded Rayleigh-wave data. In the second sensitivity study, we examined the inter-relationships between Rayleigh-wave velocities, shear-wave velocities and compression-wave velocities. We concluded that the inversion of Rayleigh-wave dispersion data (i.e., generation of a shear-wave velocity curve) is a robust and reliable process even though Rayleigh-wave velocities are also a function of compression-wave velocities. This is because the velocities of high-frequency (5 Hz+) Rayleigh waves are relatively insensitive to variations in the compression-wave velocity of the subsurface. E.2 Sensitivity Study #1: Extraction of Dispersion Curve Data The extraction of dispersion data from field-recorded Rayleigh-wave data is a standard, established mathematical process that does not require any interactive input from the interpreter (Figure E.1). The analysis of the output dispersion data and the selection of optimum phase velocities (dispersion curve), in contrast, requires qualitative input from the interpreter. Hence, there is potential for human error. The selection of optimum phase velocities from dispersion data is usually straightforward if good quality Rayleigh-wave data are acquired in the field. If the field data are good quality, the dispersion data will be characterized by a narrow, well-defined peak (Figure E.1). In this case, the interpreter merely selects phase velocities that fall along the well-defined peak. Numerous modeling studies and field tests have confirmed that these phase velocities are “optimum” (Xia et al., 1999). The “optimum” dispersion curve has been superposed on the dispersion data of Figure E.1c and plotted separately in Figure E.2a. The corresponding 1-D shear-wave velocity curve is plotted in Figure E.2b. This shear-wave velocity curve is also considered to be “optimum”. In order to demonstrate the sensitivity of the dispersion curve extraction process, we intentionally extracted two non-optimum dispersion curves (Figures E.1b and E.1d). These two curves are non-optimum because their phase velocities do not fall on the well-defined peak on the dispersion data. More specifically, the phase velocities selected in Figure E.1b are greater than optimum; the phase velocities selected in Figure E.1d are lower than optimum (Figures E.1
172
MoDOT Final Report RDT 05-006: Comprehensive Shear-Wave Velocity Study in the Poplar Bluff Area, Southeast Missouri
and E.2). The velocity values on the corresponding 1-D shear-wave velocity curves are similarly too low and too high, respectively (Figure E.2). As previously mentioned, the selection of optimum phase velocities from good quality dispersion data is usually straightforward over the dominant bandwidth of the data. Trained interpreters will usually select similar phase velocities and generate similar 1-D shear-wave velocity profiles. However, difficulties (and differences of opinion) can arise when the interpreter selects phase velocities at frequencies near the low end of those that were actually generated by the source in the field. The nature of this problem is illustrated by the dispersion data in Figure E1. These dispersion data are characterized by a well-defined peak at frequencies above 7 Hz. This “peak” has widened considerably at 6 Hz and is almost absent at 5 Hz. (Data quality at low frequencies is variable being a function of both source size and ground conditions.) The selection of phase velocities at the low frequency 5-6 Hz range (in a genuine attempt to extract velocity control at greater depth) requires judicious extrapolation. If the selected phase velocities are too low, the *shear-wave velocities assigned to the deepest layers in the output model will be too low. Conversely, if the selected phase velocities are too high, the assigned shear-wave velocities will also be too high. This can also result in the underestimation or overestimation of depths, respectively. E.3 Sensitivity Study #2: Inversion of Surface (Rayleigh) Wave Data Rayleigh-wave velocities are a function of both the shear-wave velocity of the subsurface and the compression-wave velocity of the subsurface. The inter-relationships between Rayleigh-wave velocities, shear-wave velocities and compression-wave velocities in a uniform half-space are expressed in Equation 1.
VR6 - 8β2VR
4 + (24 - 16β2 /α2)β4VR2 + 16(β2/α2 – 1)β6 = 0 Equation 1
where:
VR is the Rayleigh-wave velocity within the uniform medium, β is the shear-wave velocity within the uniform medium (also denoted Vs), α is the compression-wave velocity within the uniform medium (also denoted Vp).
As indicated in Equation 1, Rayleigh-wave velocities are a function of both the shear-wave velocity of the subsurface and the compression-wave velocity of the subsurface. This fact that Equation 1 contains two unknowns (shear and compression-wave velocities) might initially suggest that it would be difficult to extract reliable shear-wave velocity information from field-recorded Rayleigh waves. Fortunately, this is not the case. Sensitivity studies conducted by several authors including Xia et al. (1999) and Stokoe et al. (1994) have concluded that Rayleigh-wave phase velocities are influenced much less by changes in compression-wave velocity than by changes in shear-wave velocity. Stokoe (1994), for
173
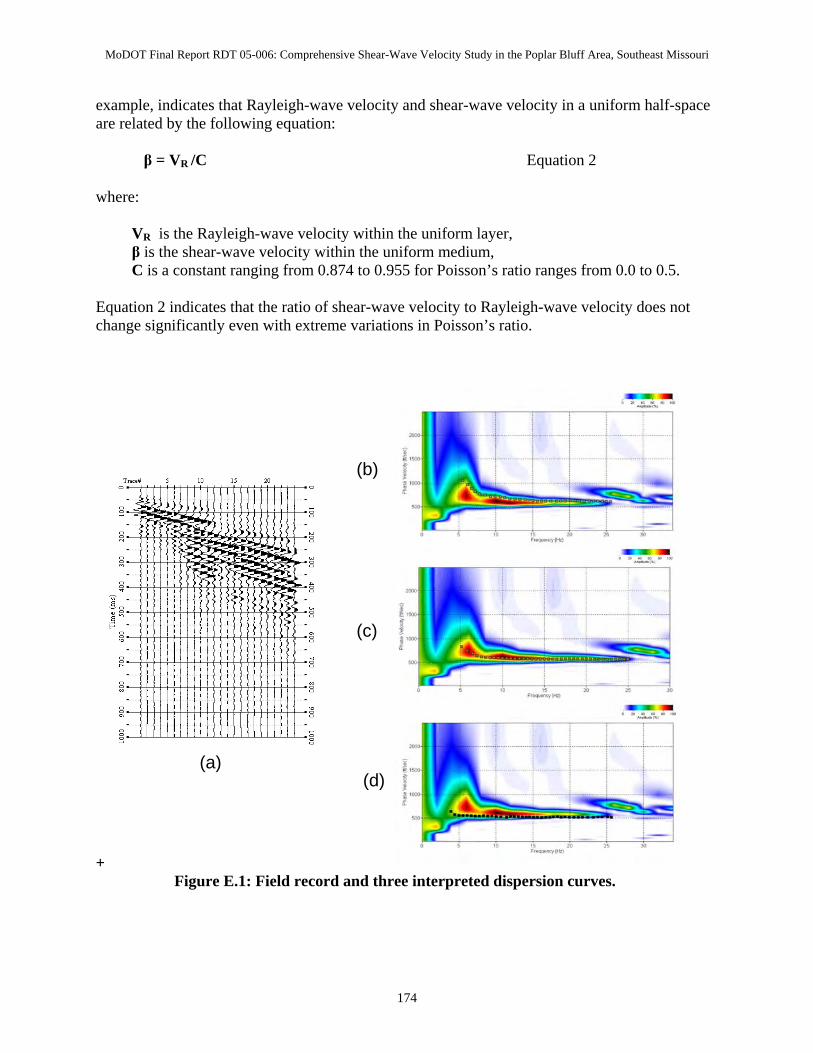
MoDOT Final Report RDT 05-006: Comprehensive Shear-Wave Velocity Study in the Poplar Bluff Area, Southeast Missouri
example, indicates that Rayleigh-wave velocity and shear-wave velocity in a uniform half-space are related by the following equation: β = VR /C Equation 2 where:
VR is the Rayleigh-wave velocity within the uniform layer, β is the shear-wave velocity within the uniform medium, C is a constant ranging from 0.874 to 0.955 for Poisson’s ratio ranges from 0.0 to 0.5.
Equation 2 indicates that the ratio of shear-wave velocity to Rayleigh-wave velocity does not change significantly even with extreme variations in Poisson’s ratio.
+
(b)
(c)
(a) (d)
Figure E.1: Field record and three interpreted dispersion curves.
174
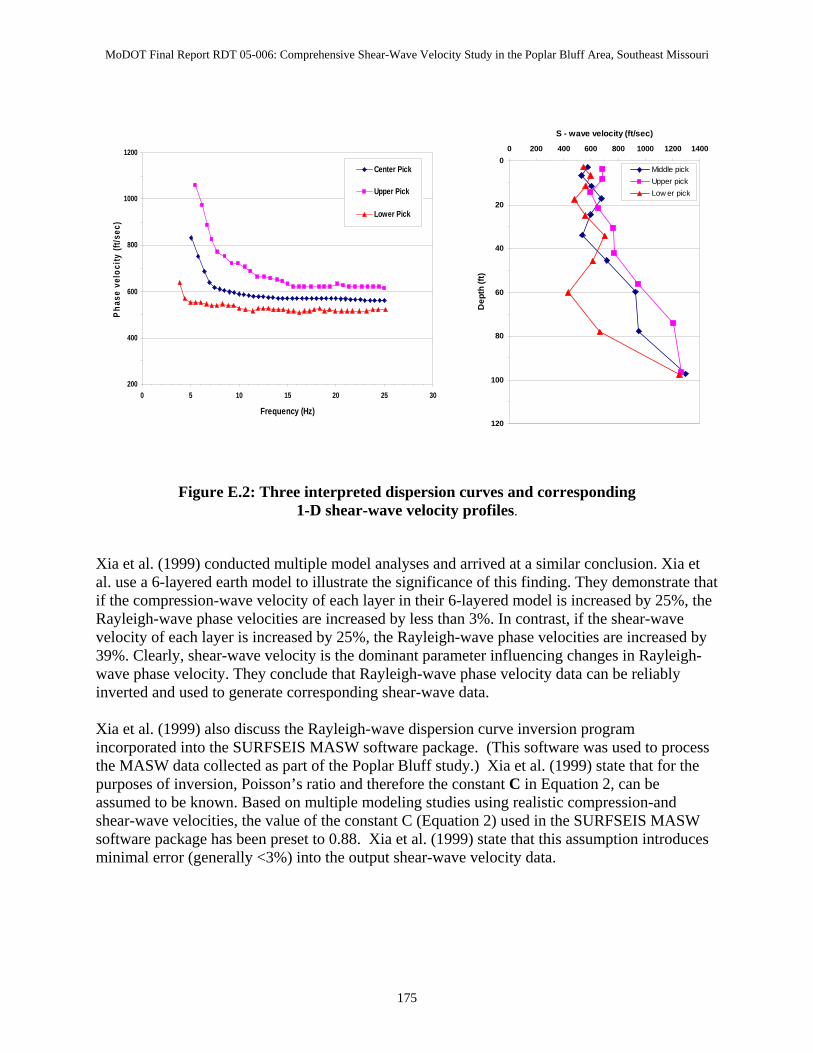
MoDOT Final Report RDT 05-006: Comprehensive Shear-Wave Velocity Study in the Poplar Bluff Area, Southeast Missouri
200
400
600
800
1000
1200
0 5
Phas
e ve
loci
ty (f
t/sec
)
10 15 20 25 30
Frequency (Hz)
Center Pick
Upper Pick
Lower Pick
0
20
40
60
80
100
120
0 200 400 600 800 1000 1200 1400
S - wave velocity (ft/sec)
Dep
th (f
t)
Middle pickUpper pickLow er pick
Figure E.2: Three interpreted dispersion curves and corresponding 1-D shear-wave velocity profiles.
Xia et al. (1999) conducted multiple model analyses and arrived at a similar conclusion. Xia et al. use a 6-layered earth model to illustrate the significance of this finding. They demonstrate that if the compression-wave velocity of each layer in their 6-layered model is increased by 25%, the Rayleigh-wave phase velocities are increased by less than 3%. In contrast, if the shear-wave velocity of each layer is increased by 25%, the Rayleigh-wave phase velocities are increased by 39%. Clearly, shear-wave velocity is the dominant parameter influencing changes in Rayleigh-wave phase velocity. They conclude that Rayleigh-wave phase velocity data can be reliably inverted and used to generate corresponding shear-wave data. Xia et al. (1999) also discuss the Rayleigh-wave dispersion curve inversion program incorporated into the SURFSEIS MASW software package. (This software was used to process the MASW data collected as part of the Poplar Bluff study.) Xia et al. (1999) state that for the purposes of inversion, Poisson’s ratio and therefore the constant C in Equation 2, can be assumed to be known. Based on multiple modeling studies using realistic compression-and shear-wave velocities, the value of the constant C (Equation 2) used in the SURFSEIS MASW software package has been preset to 0.88. Xia et al. (1999) state that this assumption introduces minimal error (generally <3%) into the output shear-wave velocity data.
175
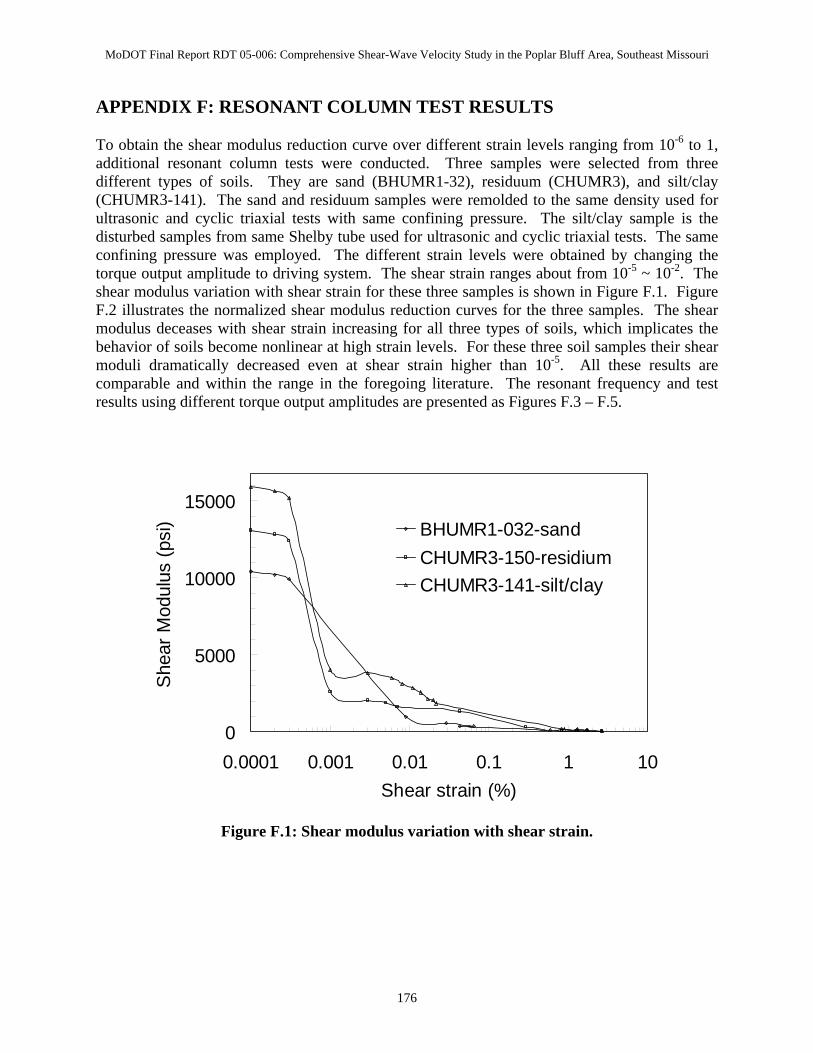
MoDOT Final Report RDT 05-006: Comprehensive Shear-Wave Velocity Study in the Poplar Bluff Area, Southeast Missouri
APPENDIX F: RESONANT COLUMN TEST RESULTS To obtain the shear modulus reduction curve over different strain levels ranging from 10-6 to 1, additional resonant column tests were conducted. Three samples were selected from three different types of soils. They are sand (BHUMR1-32), residuum (CHUMR3), and silt/clay (CHUMR3-141). The sand and residuum samples were remolded to the same density used for ultrasonic and cyclic triaxial tests with same confining pressure. The silt/clay sample is the disturbed samples from same Shelby tube used for ultrasonic and cyclic triaxial tests. The same confining pressure was employed. The different strain levels were obtained by changing the torque output amplitude to driving system. The shear strain ranges about from 10-5 ~ 10-2. The shear modulus variation with shear strain for these three samples is shown in Figure F.1. Figure F.2 illustrates the normalized shear modulus reduction curves for the three samples. The shear modulus deceases with shear strain increasing for all three types of soils, which implicates the behavior of soils become nonlinear at high strain levels. For these three soil samples their shear moduli dramatically decreased even at shear strain higher than 10-5. All these results are comparable and within the range in the foregoing literature. The resonant frequency and test results using different torque output amplitudes are presented as Figures F.3 – F.5.
0
5000
10000
15000
0.0001 0.001 0.01 0.1 1 10Shear strain (%)
She
ar M
odul
us (p
si) BHUMR1-032-sand
CHUMR3-150-residiumCHUMR3-141-silt/clay
Figure F.1: Shear modulus variation with shear strain.
176
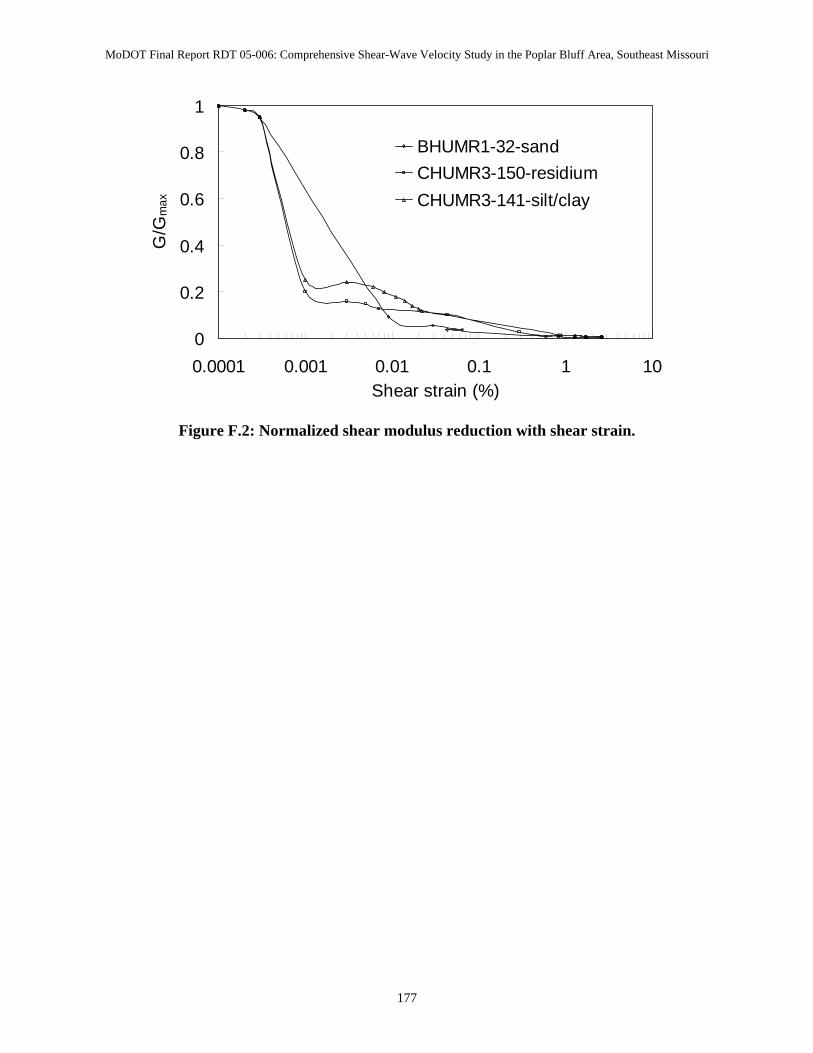
MoDOT Final Report RDT 05-006: Comprehensive Shear-Wave Velocity Study in the Poplar Bluff Area, Southeast Missouri
0
0.2
0.4
0.6
0.8
1
0.0001 0.001 0.01 0.1 1 10Shear strain (%)
G/G
max
BHUMR1-32-sandCHUMR3-150-residiumCHUMR3-141-silt/clay
Figure F.2: Normalized shear modulus reduction with shear strain.
177
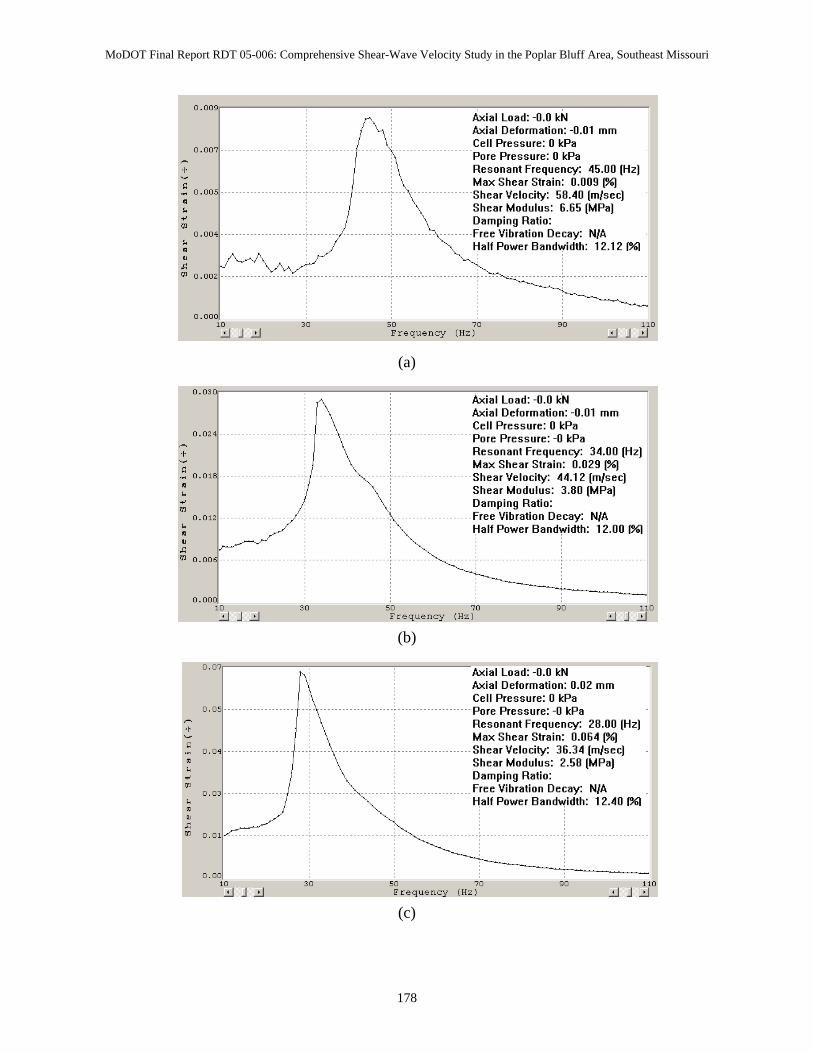
MoDOT Final Report RDT 05-006: Comprehensive Shear-Wave Velocity Study in the Poplar Bluff Area, Southeast Missouri
(a)
(b)
(c)
178
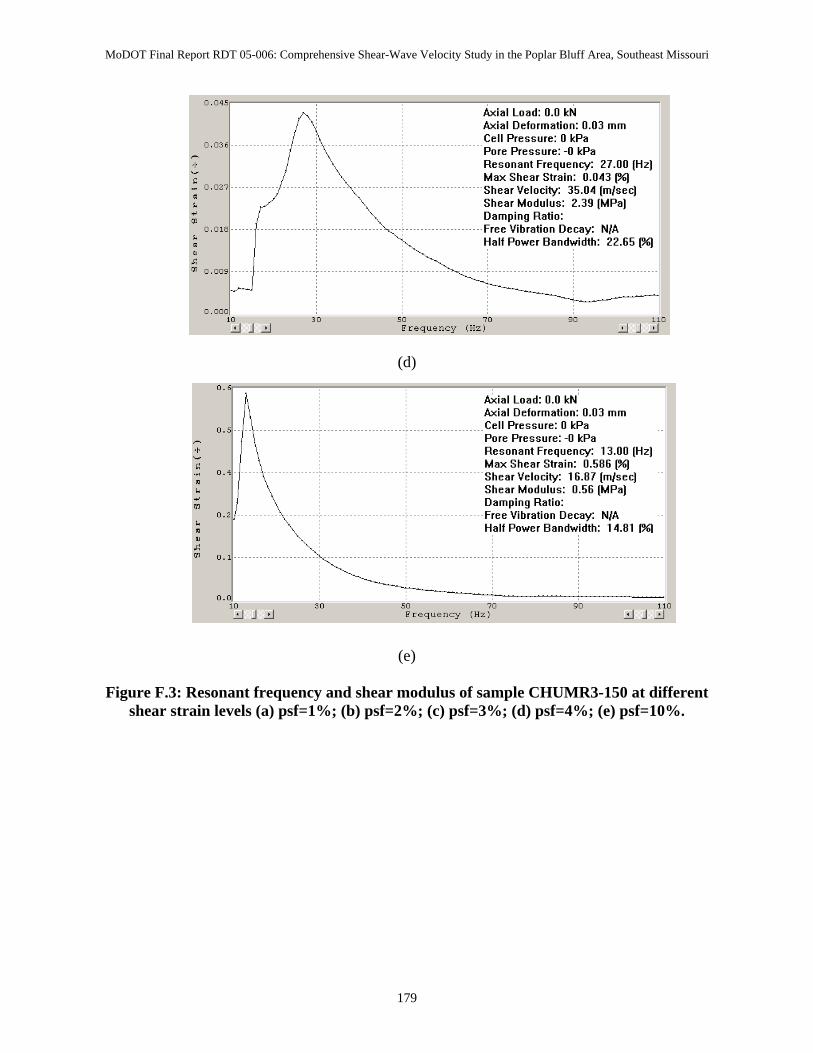
MoDOT Final Report RDT 05-006: Comprehensive Shear-Wave Velocity Study in the Poplar Bluff Area, Southeast Missouri
(d)
(e)
Figure F.3: Resonant frequency and shear modulus of sample CHUMR3-150 at different shear strain levels (a) psf=1%; (b) psf=2%; (c) psf=3%; (d) psf=4%; (e) psf=10%.
179
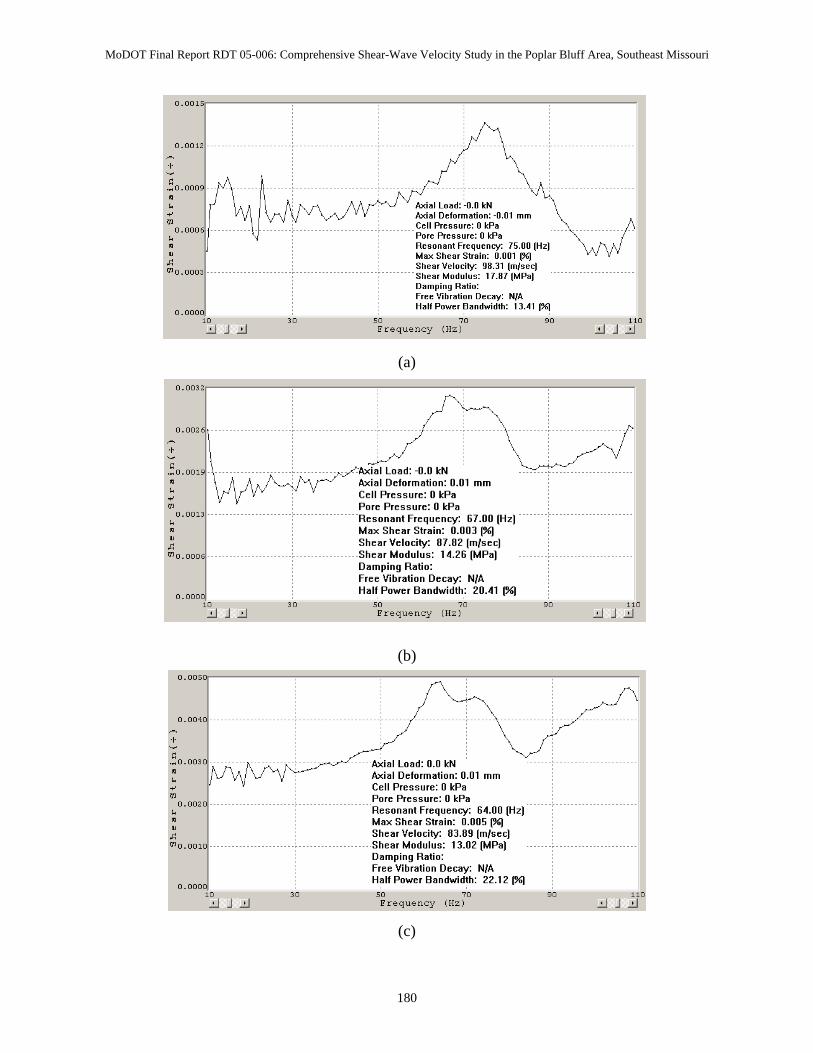
MoDOT Final Report RDT 05-006: Comprehensive Shear-Wave Velocity Study in the Poplar Bluff Area, Southeast Missouri
(a)
(b)
(c)
180
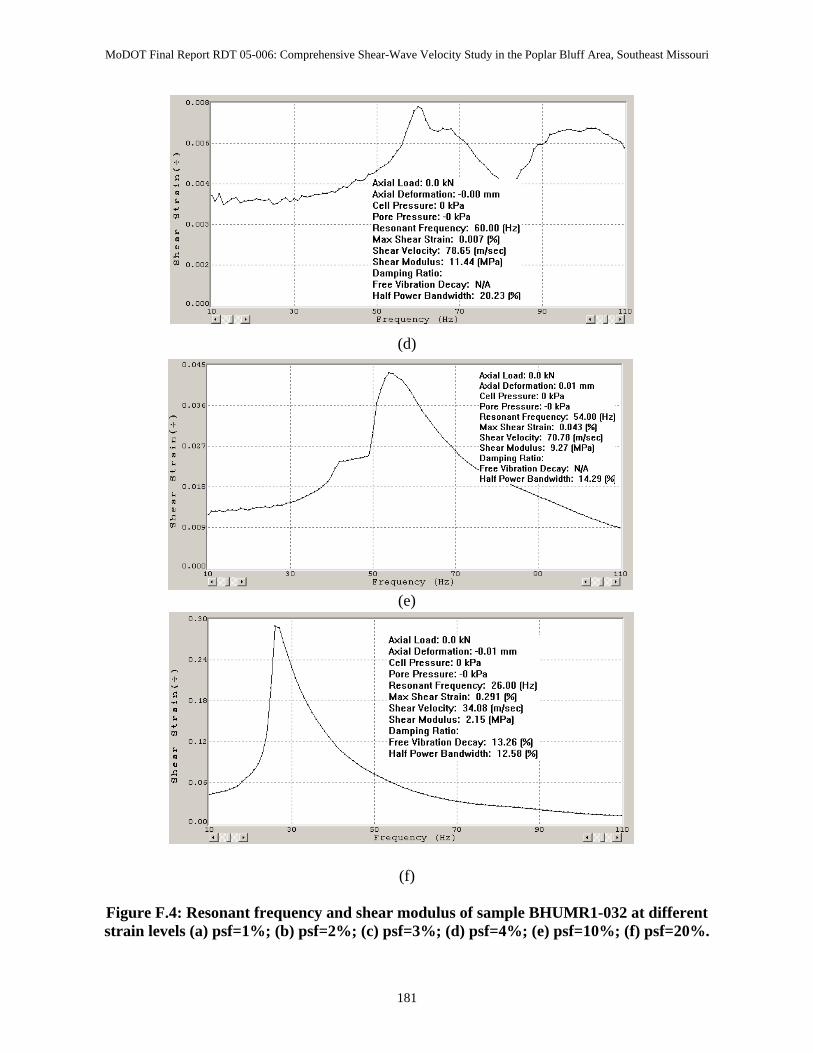
MoDOT Final Report RDT 05-006: Comprehensive Shear-Wave Velocity Study in the Poplar Bluff Area, Southeast Missouri
(d)
(e)
(f)
Figure F.4: Resonant frequency and shear modulus of sample BHUMR1-032 at different strain levels (a) psf=1%; (b) psf=2%; (c) psf=3%; (d) psf=4%; (e) psf=10%; (f) psf=20%.
181
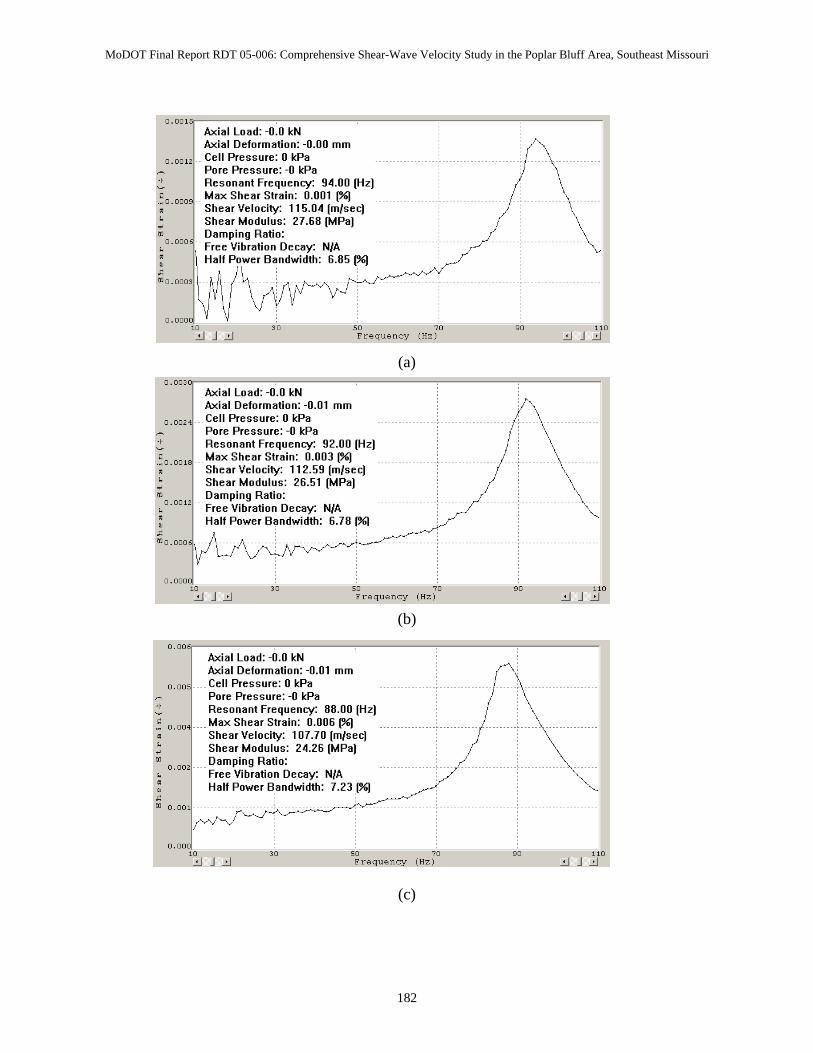
MoDOT Final Report RDT 05-006: Comprehensive Shear-Wave Velocity Study in the Poplar Bluff Area, Southeast Missouri
(a)
(b)
(c)
182
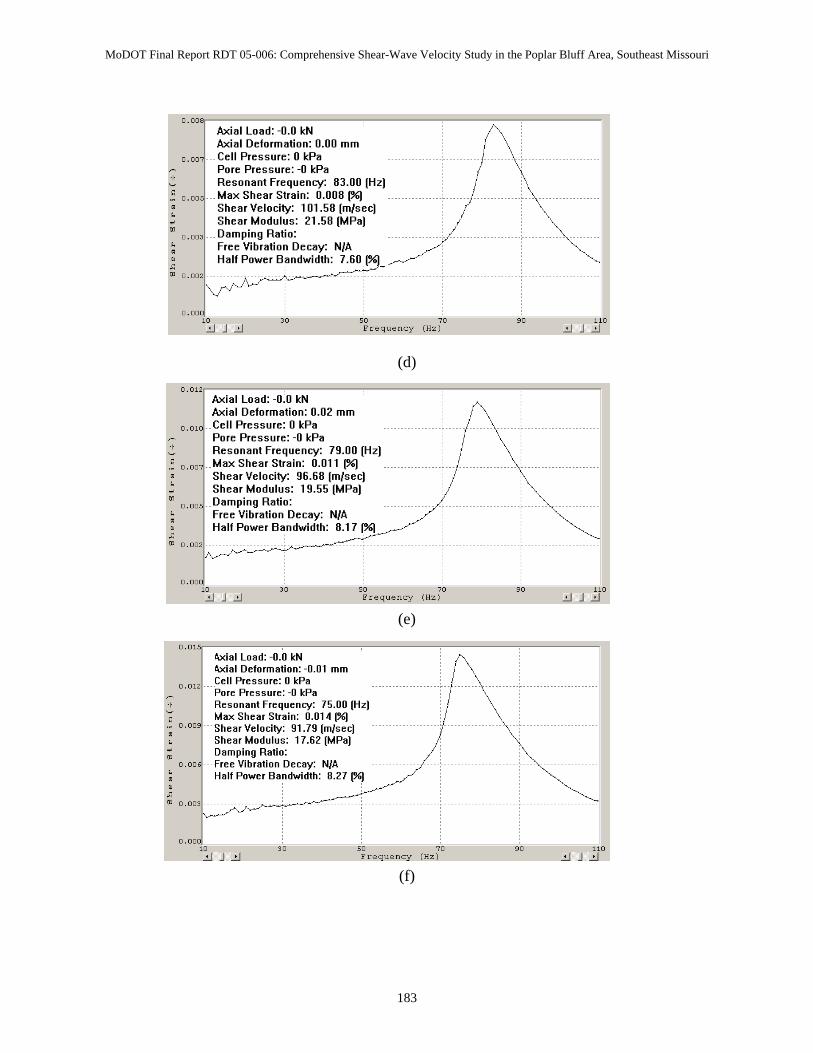
MoDOT Final Report RDT 05-006: Comprehensive Shear-Wave Velocity Study in the Poplar Bluff Area, Southeast Missouri
(d)
(e)
(f)
183
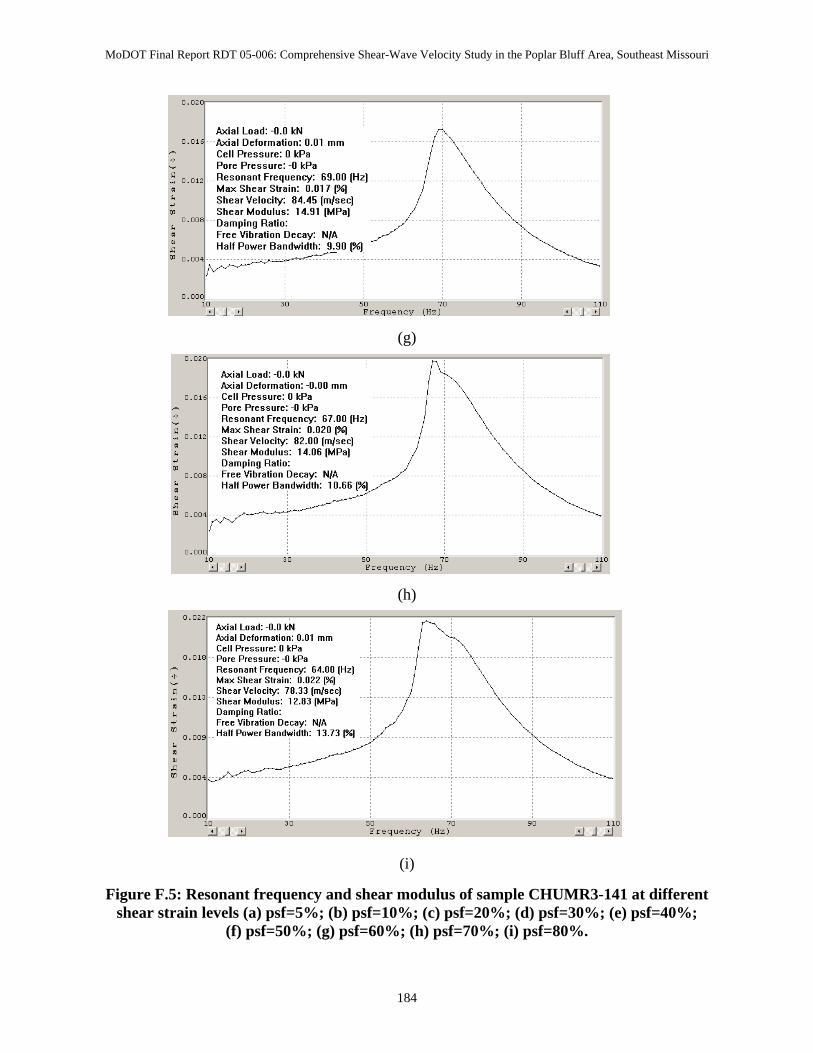
MoDOT Final Report RDT 05-006: Comprehensive Shear-Wave Velocity Study in the Poplar Bluff Area, Southeast Missouri
(g)
(h)
(i)
Figure F.5: Resonant frequency and shear modulus of sample CHUMR3-141 at different shear strain levels (a) psf=5%; (b) psf=10%; (c) psf=20%; (d) psf=30%; (e) psf=40%;
(f) psf=50%; (g) psf=60%; (h) psf=70%; (i) psf=80%.
184