comprehensive transport emission reduction planning
TRANSCRIPT
www.vtpi.org
250-508-5150
Todd Alexander Litman © 2021 You are welcome and encouraged to copy, distribute, share and excerpt this document and its ideas, provided
the author is given attribution. Please send your corrections, comments and suggestions for improvement.
Comprehensive Transport Emission Reduction Planning Guidelines for Evaluating Transportation Emission Reduction Strategies
3 March 2022
Todd Litman Victoria Transport Policy Institute
Most current emission reduction plans devote far more funding to electric vehicle subsidies than to active and public transport improvements, despite these modes’ large co-benefits. That is inefficient and unfair.
Abstract Many jurisdictions have ambitious greenhouse gas emission reduction targets and plans. This study critically evaluates the methods used to develop these plans. It finds that the evaluation process is often biased in ways that exaggerate the benefits of clean vehicles such as hybrid and electric automobiles, and undervalue vehicle travel reduction strategies such as transportation demand management (TDM) programs and Smart Growth policies. Many plans are overly-optimistic about clean vehicle fleet implementation speed and effectiveness, and underestimate TDM effectiveness. They often overlook the slow pace of fleet electrification (particularly by the larger, fuel intensive vehicle types such as SUVs and light trucks), clean vehicle lifecycle emissions, rebound effects, plus the high costs and inequities of clean vehicle subsidies. Most plans overlook some of the most effective TDM strategies and their co-benefits, and underestimate the price elasticity of vehicle travel. As a result of these biases, most current emission reduction plans overemphasize clean vehicles and underemphasize vehicle travel reductions compared with what is optimal. This study suggests that to be efficient and equitable, transportation emission reduction plans should rely at least as much on vehicle travel reductions as on clean vehicle strategies, with particular emphasis on “quick win” strategies. It provides recommendations for improving analysis methods.
Comprehensive Transportation Emission Reduction Planning Victoria Transport Policy Institute
2
Introduction Many jurisdictions and organizations have ambitious climate change (also called Greenhouse Gas or GHG) emission reduction goals and targets, and are developing plans to achieve them (1, 2). For example, President Biden recently established a target to reduce U.S. GHG emissions 50-52% by 2030 (3). Since transportation is one of the largest emission sources, it is a major component of such plans. There are many possible ways to reduce transportation emissions. These include “clean vehicle” strategies that reduce emission rates, and transportation demand management (TDM) and Smart Growth policies that reduce total vehicle travel, as summarized in Table 1. Table 1 Examples of Emission Reduction Strategies (4, 5, 6, 7, 8, 9)
Clean Vehicles Vehicle Travel Reductions
Technologies and policies that reduce emission rates per vehicle-mile
TDM and Smart Growth policies that reduce total vehicle travel
Shifts to more efficient and alternative fuel vehicles (e.g., hybrid, electric and hydrogen).
High emitting vehicle scrapage programs.
Efficient driving and anti-idling campaigns.
Switching to lower carbon and cleaner fuels.
Inspection and maintenance programs.
Resurface highways.
Roadside “high emitter” identification
Multimodal planning (improve walking, bicycling, public transit, ridesharing, etc.)
Smart Growth policies that create more compact and multimodal communities.
Transportation Demand Management programs (commute trip reduction, freight transport management, etc.)
More efficient road, parking and vehicle pricing.
Vehicle parking policy reforms.
Increase fuel prices by reducing subsidies and increasing taxes (encourages both types of strategies)
“Cleaner vehicles” reduce per-mile emission rates. Vehicle travel reductions reduce total motor vehicle travel. Fuel price increases help achieve both. Which strategies are most effective and beneficial overall? That depends on how they are analyzed. This study critically evaluates the analysis methods used in typical emission reduction plans, including the types of strategies considered, models used to predict their effects on travel and emissions, and the scope of benefits and costs considered in analysis. This is an important and timely issue. Large and rapid emission reductions are needed to protect the world’s climate. It is important to identify the most effective and beneficial ways to achieve these goals. Transportation policies have broad economic, social and environmental effects; it is important that emission reduction analysis be comprehensive, accounting for all impacts. This study provides specific recommendations for improving emission reduction planning methods.
Comprehensive Transportation Emission Reduction Planning Victoria Transport Policy Institute
3
Emission Reductions Plans Reviewed Below are summaries of emission reduction plans evaluated in this study.
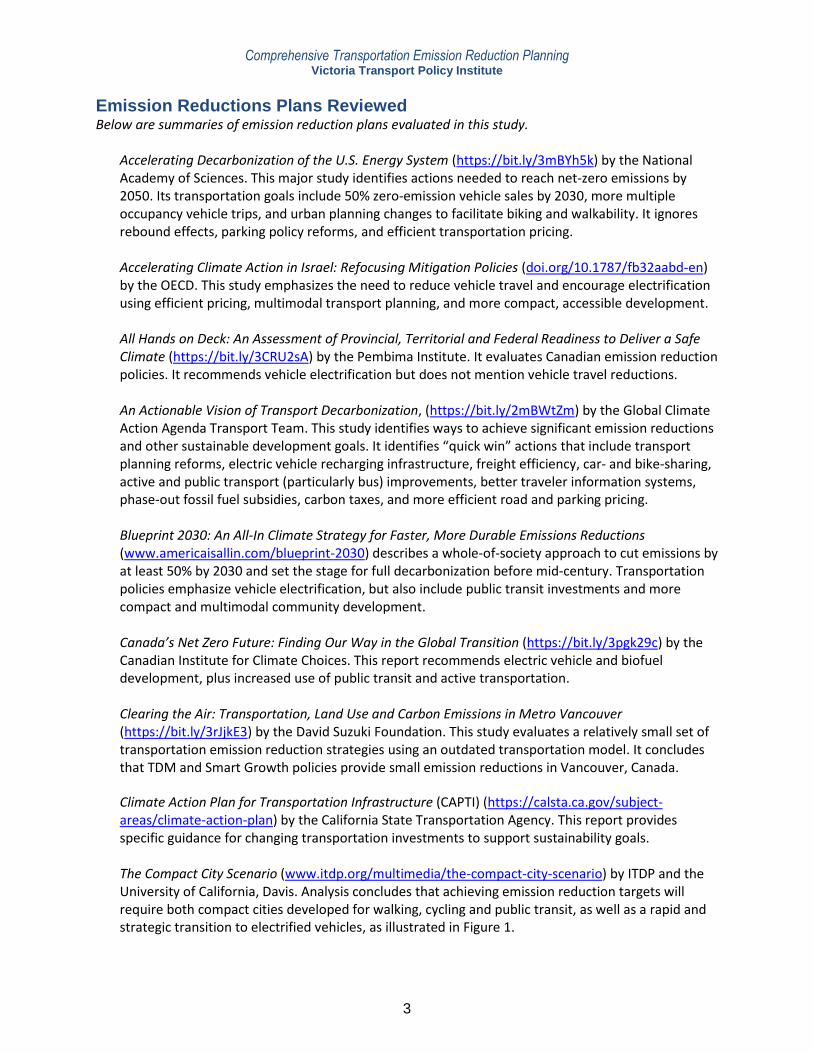
Accelerating Decarbonization of the U.S. Energy System (https://bit.ly/3mBYh5k) by the National Academy of Sciences. This major study identifies actions needed to reach net-zero emissions by 2050. Its transportation goals include 50% zero-emission vehicle sales by 2030, more multiple occupancy vehicle trips, and urban planning changes to facilitate biking and walkability. It ignores rebound effects, parking policy reforms, and efficient transportation pricing. Accelerating Climate Action in Israel: Refocusing Mitigation Policies (doi.org/10.1787/fb32aabd-en) by the OECD. This study emphasizes the need to reduce vehicle travel and encourage electrification using efficient pricing, multimodal transport planning, and more compact, accessible development. All Hands on Deck: An Assessment of Provincial, Territorial and Federal Readiness to Deliver a Safe Climate (https://bit.ly/3CRU2sA) by the Pembima Institute. It evaluates Canadian emission reduction policies. It recommends vehicle electrification but does not mention vehicle travel reductions. An Actionable Vision of Transport Decarbonization, (https://bit.ly/2mBWtZm) by the Global Climate Action Agenda Transport Team. This study identifies ways to achieve significant emission reductions and other sustainable development goals. It identifies “quick win” actions that include transport planning reforms, electric vehicle recharging infrastructure, freight efficiency, car- and bike-sharing, active and public transport (particularly bus) improvements, better traveler information systems, phase-out fossil fuel subsidies, carbon taxes, and more efficient road and parking pricing. Blueprint 2030: An All-In Climate Strategy for Faster, More Durable Emissions Reductions (www.americaisallin.com/blueprint-2030) describes a whole-of-society approach to cut emissions by at least 50% by 2030 and set the stage for full decarbonization before mid-century. Transportation policies emphasize vehicle electrification, but also include public transit investments and more compact and multimodal community development. Canada’s Net Zero Future: Finding Our Way in the Global Transition (https://bit.ly/3pgk29c) by the Canadian Institute for Climate Choices. This report recommends electric vehicle and biofuel development, plus increased use of public transit and active transportation. Clearing the Air: Transportation, Land Use and Carbon Emissions in Metro Vancouver (https://bit.ly/3rJjkE3) by the David Suzuki Foundation. This study evaluates a relatively small set of transportation emission reduction strategies using an outdated transportation model. It concludes that TDM and Smart Growth policies provide small emission reductions in Vancouver, Canada. Climate Action Plan for Transportation Infrastructure (CAPTI) (https://calsta.ca.gov/subject-areas/climate-action-plan) by the California State Transportation Agency. This report provides specific guidance for changing transportation investments to support sustainability goals. The Compact City Scenario (www.itdp.org/multimedia/the-compact-city-scenario) by ITDP and the University of California, Davis. Analysis concludes that achieving emission reduction targets will require both compact cities developed for walking, cycling and public transit, as well as a rapid and strategic transition to electrified vehicles, as illustrated in Figure 1.
Comprehensive Transportation Emission Reduction Planning Victoria Transport Policy Institute
4
Figure 1 The Compact City Scenario, The Only Way to 1.5° (https://bit.ly/33LCy45)
Draft Advice for Consultation (https://bit.ly/3jQJTDC) by the New Zealand Climate Change Commission. This study evaluates emission reduction strategies based on the degree they support other strategic goals. It recommends urban planning reforms, active mode improvements, freight management, reliable and affordable shared transport, plus electric or low-emission vehicles. Driving Down Emissions: Transportation, Land Use and Climate Change, (https://bit.ly/3tLZBEw) by Transportation for America and Smart Growth America. This report argues that large emission reductions are possible by meeting the demand for housing in accessible, multimodal communities. Driving California’s Transportation Emissions to Zero (https://escholarship.org/uc/item/3np3p2t0) by the University of California’s Institute of Transportation Studies. This study identifies ways that California can achieve carbon-neutral transportation by 2045. It states that, “Reducing VMT in California from light, medium, and heavy-duty vehicles is a critical part of reducing transportation system GHG emissions.” It identifies some TDM strategies such as carsharing and ridehailing, public transit improvements and road pricing, but overlooks parking reforms and Smart Growth policies. Halfway There: Energy Efficiency Can Cut Energy Use and Greenhouse Gas Emissions in Half by 2050, (https://bit.ly/3yiQuwM) by the American Council for an Energy-Efficient Economy. This report identifies ways to halve pollution emissions through various government policies and investments. It concludes that the largest transportation savings come from more efficient and electric vehicles, plus new mobility options including ride sharing, car sharing, public transit improvements, telework, pedestrian- and bike-friendly streets, and more compact development. Better Access to Urban Opportunities: Accessibility Policy for Cities in the 2020s (https://bit.ly/3mBCf2B) by the LSE Cities and the OECD for the Coalition for Urban Transitions. This report identifies public policies to integrate climate emission reduction and social equity goals into pandemic recovery programs by creating more accessible and efficient cities.
Comprehensive Transportation Emission Reduction Planning Victoria Transport Policy Institute
5
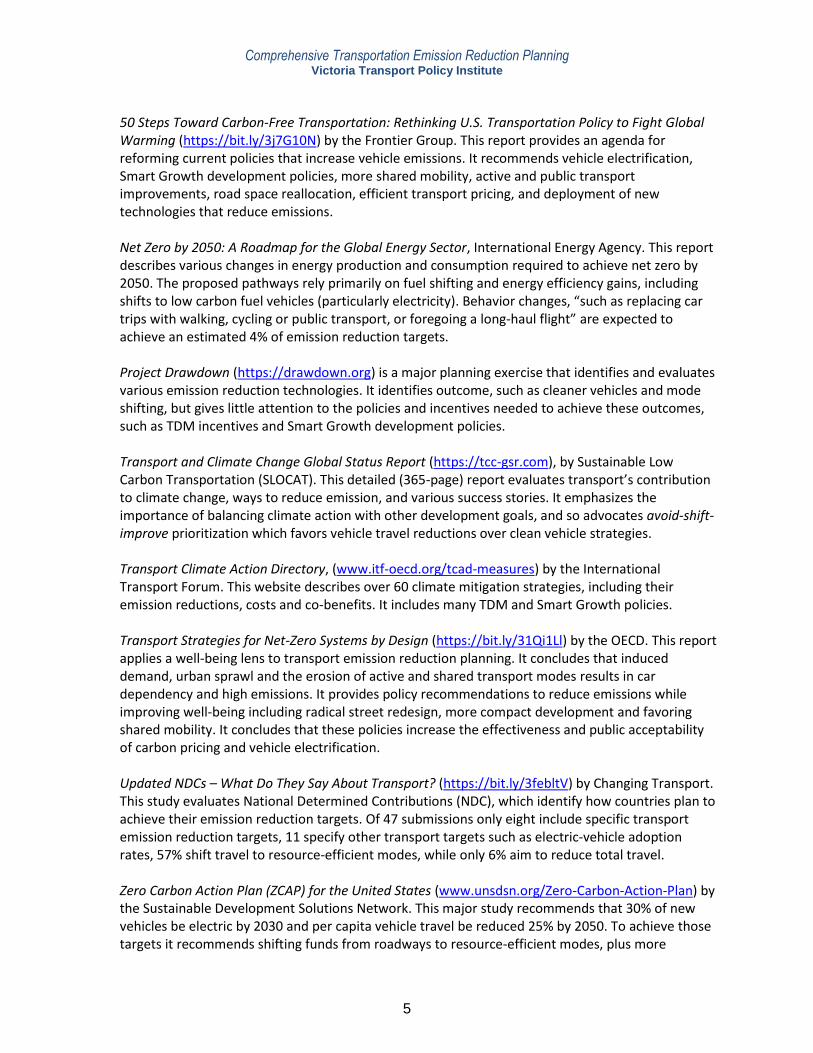
50 Steps Toward Carbon-Free Transportation: Rethinking U.S. Transportation Policy to Fight Global Warming (https://bit.ly/3j7G10N) by the Frontier Group. This report provides an agenda for reforming current policies that increase vehicle emissions. It recommends vehicle electrification, Smart Growth development policies, more shared mobility, active and public transport improvements, road space reallocation, efficient transport pricing, and deployment of new technologies that reduce emissions. Net Zero by 2050: A Roadmap for the Global Energy Sector, International Energy Agency. This report describes various changes in energy production and consumption required to achieve net zero by 2050. The proposed pathways rely primarily on fuel shifting and energy efficiency gains, including shifts to low carbon fuel vehicles (particularly electricity). Behavior changes, “such as replacing car trips with walking, cycling or public transport, or foregoing a long‐haul flight” are expected to achieve an estimated 4% of emission reduction targets. Project Drawdown (https://drawdown.org) is a major planning exercise that identifies and evaluates various emission reduction technologies. It identifies outcome, such as cleaner vehicles and mode shifting, but gives little attention to the policies and incentives needed to achieve these outcomes, such as TDM incentives and Smart Growth development policies. Transport and Climate Change Global Status Report (https://tcc-gsr.com), by Sustainable Low Carbon Transportation (SLOCAT). This detailed (365-page) report evaluates transport’s contribution to climate change, ways to reduce emission, and various success stories. It emphasizes the importance of balancing climate action with other development goals, and so advocates avoid-shift-improve prioritization which favors vehicle travel reductions over clean vehicle strategies. Transport Climate Action Directory, (www.itf-oecd.org/tcad-measures) by the International Transport Forum. This website describes over 60 climate mitigation strategies, including their emission reductions, costs and co-benefits. It includes many TDM and Smart Growth policies. Transport Strategies for Net-Zero Systems by Design (https://bit.ly/31Qi1Ll) by the OECD. This report applies a well-being lens to transport emission reduction planning. It concludes that induced demand, urban sprawl and the erosion of active and shared transport modes results in car dependency and high emissions. It provides policy recommendations to reduce emissions while improving well-being including radical street redesign, more compact development and favoring shared mobility. It concludes that these policies increase the effectiveness and public acceptability of carbon pricing and vehicle electrification. Updated NDCs – What Do They Say About Transport? (https://bit.ly/3febltV) by Changing Transport. This study evaluates National Determined Contributions (NDC), which identify how countries plan to achieve their emission reduction targets. Of 47 submissions only eight include specific transport emission reduction targets, 11 specify other transport targets such as electric-vehicle adoption rates, 57% shift travel to resource-efficient modes, while only 6% aim to reduce total travel. Zero Carbon Action Plan (ZCAP) for the United States (www.unsdsn.org/Zero-Carbon-Action-Plan) by the Sustainable Development Solutions Network. This major study recommends that 30% of new vehicles be electric by 2030 and per capita vehicle travel be reduced 25% by 2050. To achieve those targets it recommends shifting funds from roadways to resource-efficient modes, plus more
Comprehensive Transportation Emission Reduction Planning Victoria Transport Policy Institute
6
compact development. It recommends linking transportation funding to VMT reductions. It states, “Transportation is generally seen as the most challenging sector to decarbonize, but it may also prove one of the least costly—even eventually providing large economic saving. It is also the sector with the greatest opportunity to provide a large number of associated co-benefits to travelers and society and to create a more environmentally sustainable and equitable society.”
The report, Changing Transport, Summary Analysis evaluated the commitments and goals to decarbonise transport in the Nationally Determined Contributions (NDCs) submitted to the United Nations Framework Convention on Climate Change found that more than half of emission reduction actions encourage fuel shifting and less than a quarter encourage vehicle travel reductions.10 Most studies focus on technical solutions, such as shifts to hydrogen and electric vehicles, with the assumption that these fuels will be produced by renewable electricity. Many mention transportation demand management, such as active and public transport improvements, but they are often assumed to have limited potential, high costs, and little public support. A few of these studies recognize other sustainable development goals and co-benefits of vehicle travel reduction strategies, such as social equity (and therefore improving accessibility for non-drivers), public health and safety, and reducing sprawl-related costs. A few support for vehicle travel reduction strategies (i.e., avoid-shift-improve prioritization) over other emission reduction strategies. Few recognize rebound effects (the additional vehicle travel) caused by energy efficient and alternative fueled vehicles. Some such as California’s Climate Action Plan for Transportation Infrastructure, describe major planning and funding reforms to achieve sustainability goals.11 These studies also vary in the perspective and scope of strategies that are considered. Some only consider outcomes, such as people driving less or using electric vehicles, while others consider the policy reforms and incentives that will required to motivate these changes, such as more multimodal transportation planning, carbon taxes, road pricing and parking policy reforms.
Comprehensive Transportation Emission Reduction Planning Victoria Transport Policy Institute
7
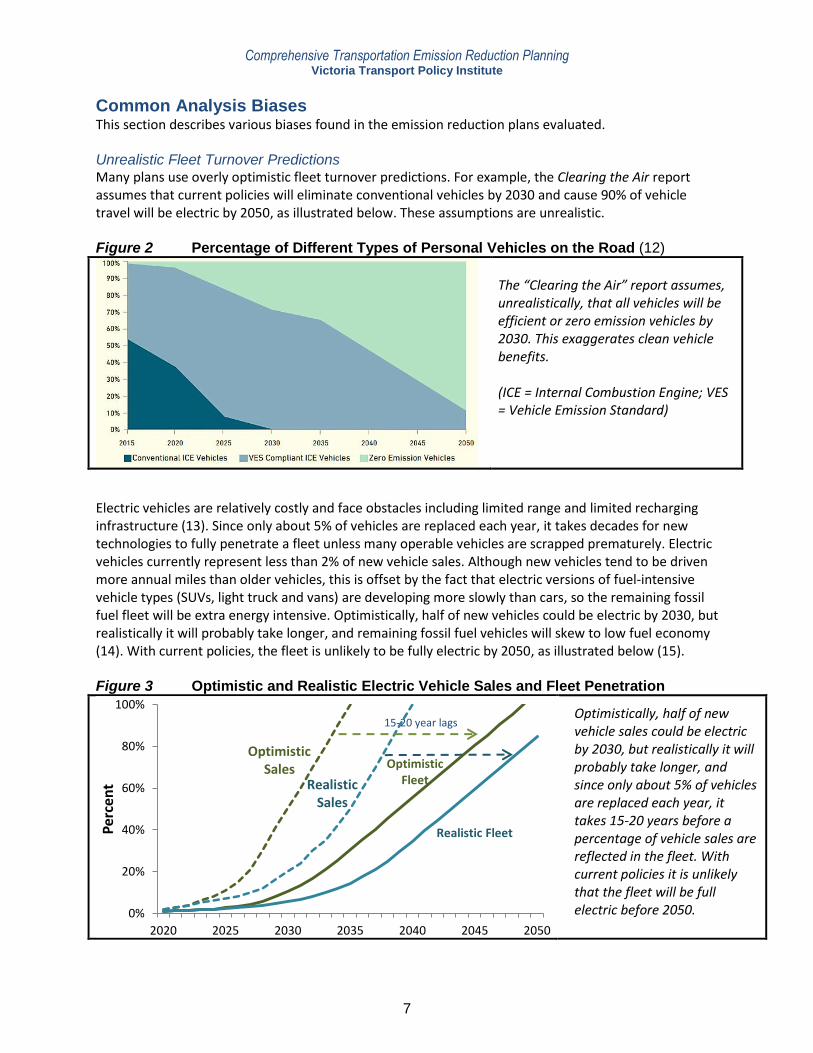
Common Analysis Biases This section describes various biases found in the emission reduction plans evaluated. Unrealistic Fleet Turnover Predictions Many plans use overly optimistic fleet turnover predictions. For example, the Clearing the Air report assumes that current policies will eliminate conventional vehicles by 2030 and cause 90% of vehicle travel will be electric by 2050, as illustrated below. These assumptions are unrealistic. Figure 2 Percentage of Different Types of Personal Vehicles on the Road (12)
The “Clearing the Air” report assumes, unrealistically, that all vehicles will be efficient or zero emission vehicles by 2030. This exaggerates clean vehicle benefits. (ICE = Internal Combustion Engine; VES = Vehicle Emission Standard)
Electric vehicles are relatively costly and face obstacles including limited range and limited recharging infrastructure (13). Since only about 5% of vehicles are replaced each year, it takes decades for new technologies to fully penetrate a fleet unless many operable vehicles are scrapped prematurely. Electric vehicles currently represent less than 2% of new vehicle sales. Although new vehicles tend to be driven more annual miles than older vehicles, this is offset by the fact that electric versions of fuel-intensive vehicle types (SUVs, light truck and vans) are developing more slowly than cars, so the remaining fossil fuel fleet will be extra energy intensive. Optimistically, half of new vehicles could be electric by 2030, but realistically it will probably take longer, and remaining fossil fuel vehicles will skew to low fuel economy (14). With current policies, the fleet is unlikely to be fully electric by 2050, as illustrated below (15). Figure 3 Optimistic and Realistic Electric Vehicle Sales and Fleet Penetration
Optimistically, half of new vehicle sales could be electric by 2030, but realistically it will probably take longer, and since only about 5% of vehicles are replaced each year, it takes 15-20 years before a percentage of vehicle sales are reflected in the fleet. With current policies it is unlikely that the fleet will be full electric before 2050.
Optimistic Sales Optimistic
Fleet
Realistic Fleet
Realistic Sales
0%
20%
40%
60%
80%
100%
2020 2025 2030 2035 2040 2045 2050
Per
cen
t
15-20 year lags

Comprehensive Transportation Emission Reduction Planning Victoria Transport Policy Institute
8
A recent study by the Carnegie Mellon University, Decarbonizing US Passenger Vehicle Transport Under Electrification and Automation Uncertainty has a Travel Budget, also concluded that vehicle travel reductions are needed to reduce automobile emissions 80% by 2050 (16). Similarly, detailed analysis by the State Smart Transportation Initiative predicts that current vehicle electrification efforts will fail to achieve emission reduction targets, particularly if vehicle travel continues to grow, as illustrated below. Figure 4 Predicted Emissions Based on U.S. EIA’s Annual Energy Outlook (17)
With current vehicle travel growth, due in part to rebound effects from vehicle electrification and automation, fleet electrification will not achieve 2050 emission reduction targets. Outdated Transportation Models Emission reduction plans use transportation models to predict how a policy will affect vehicle travel and emissions. Many of these models are outdated and inaccurate. For example, a major study, The Impacts of Land Use and Pricing in Reducing Vehicle Miles Traveled, predicted that a 25₵ per mile VMT fee, equivalent to a $5 per gallon fuel tax, would reduce affected vehicle travel just 15% (18). It explains, “This is due to the low price-elasticity of vehicle travel demand – a known feature of travel behavior that can be attributed partially to the lack of competitive alternative modes of travel in much of the region.” Such low elasticity values are based on studies performed in the U.S. during the last quarter of the Twentieth Century when employment rates and wages were increasing, and fuel prices were relatively low, which showed very low price elasticities (19). More recent studies indicate that vehicle travel is two or three times more price sensitive than older models assume (20, 21). These biases can significantly affect analysis results. For example, if an older model predicts that a price change will reduce vehicle travel 5%, the actual long-term impact is likely to be 10-15%. Similarly, if it predicts that electric vehicles will be driven 10% more annual miles than comparable fossil fuel vehicles, the true rebound effect is probably 20-30%. Older models also underestimate TDM and Smart Growth emission reductions (22).
Comprehensive Transportation Emission Reduction Planning Victoria Transport Policy Institute
9
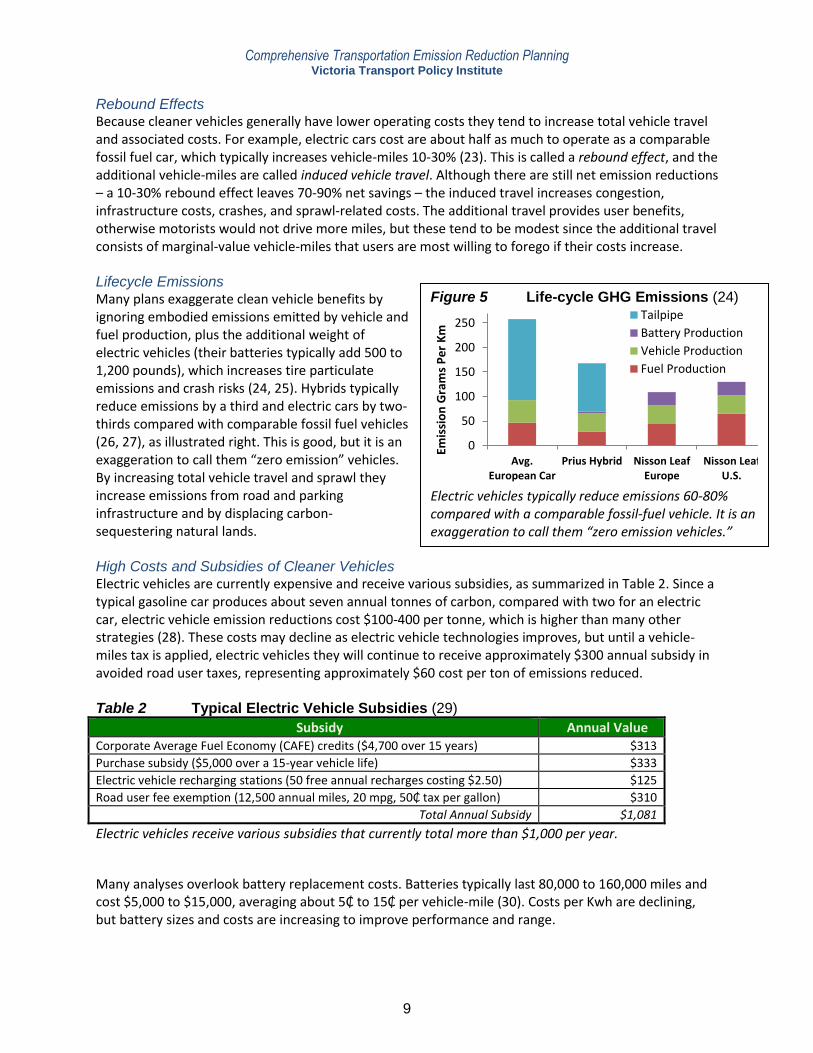
Rebound Effects Because cleaner vehicles generally have lower operating costs they tend to increase total vehicle travel and associated costs. For example, electric cars cost are about half as much to operate as a comparable fossil fuel car, which typically increases vehicle-miles 10-30% (23). This is called a rebound effect, and the additional vehicle-miles are called induced vehicle travel. Although there are still net emission reductions – a 10-30% rebound effect leaves 70-90% net savings – the induced travel increases congestion, infrastructure costs, crashes, and sprawl-related costs. The additional travel provides user benefits, otherwise motorists would not drive more miles, but these tend to be modest since the additional travel consists of marginal-value vehicle-miles that users are most willing to forego if their costs increase. Lifecycle Emissions Many plans exaggerate clean vehicle benefits by ignoring embodied emissions emitted by vehicle and fuel production, plus the additional weight of electric vehicles (their batteries typically add 500 to 1,200 pounds), which increases tire particulate emissions and crash risks (24, 25). Hybrids typically reduce emissions by a third and electric cars by two-thirds compared with comparable fossil fuel vehicles (26, 27), as illustrated right. This is good, but it is an exaggeration to call them “zero emission” vehicles. By increasing total vehicle travel and sprawl they increase emissions from road and parking infrastructure and by displacing carbon-sequestering natural lands. High Costs and Subsidies of Cleaner Vehicles Electric vehicles are currently expensive and receive various subsidies, as summarized in Table 2. Since a typical gasoline car produces about seven annual tonnes of carbon, compared with two for an electric car, electric vehicle emission reductions cost $100-400 per tonne, which is higher than many other strategies (28). These costs may decline as electric vehicle technologies improves, but until a vehicle-miles tax is applied, electric vehicles they will continue to receive approximately $300 annual subsidy in avoided road user taxes, representing approximately $60 cost per ton of emissions reduced. Table 2 Typical Electric Vehicle Subsidies (29)
Subsidy Annual Value Corporate Average Fuel Economy (CAFE) credits ($4,700 over 15 years) $313
Purchase subsidy ($5,000 over a 15-year vehicle life) $333
Electric vehicle recharging stations (50 free annual recharges costing $2.50) $125
Road user fee exemption (12,500 annual miles, 20 mpg, 50₵ tax per gallon) $310
Total Annual Subsidy $1,081
Electric vehicles receive various subsidies that currently total more than $1,000 per year.
Many analyses overlook battery replacement costs. Batteries typically last 80,000 to 160,000 miles and cost $5,000 to $15,000, averaging about 5₵ to 15₵ per vehicle-mile (30). Costs per Kwh are declining, but battery sizes and costs are increasing to improve performance and range.
Figure 5 Life-cycle GHG Emissions (24)
Electric vehicles typically reduce emissions 60-80% compared with a comparable fossil-fuel vehicle. It is an exaggeration to call them “zero emission vehicles.”
0
50
100
150
200
250
Avg.European Car
Prius Hybrid Nisson LeafEurope
Nisson LeafU.S.
Emis
sio
n G
ram
s P
er
Km
Tailpipe
Battery Production
Vehicle Production
Fuel Production
Comprehensive Transportation Emission Reduction Planning Victoria Transport Policy Institute
10
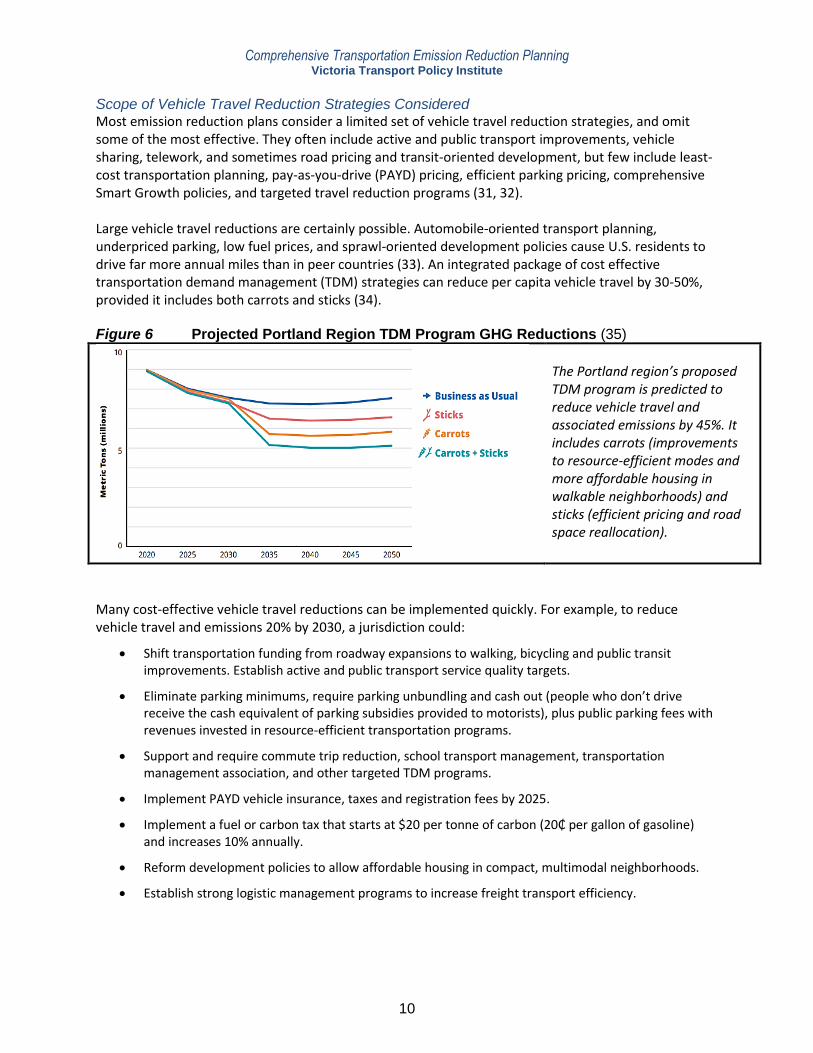
Scope of Vehicle Travel Reduction Strategies Considered Most emission reduction plans consider a limited set of vehicle travel reduction strategies, and omit some of the most effective. They often include active and public transport improvements, vehicle sharing, telework, and sometimes road pricing and transit-oriented development, but few include least-cost transportation planning, pay-as-you-drive (PAYD) pricing, efficient parking pricing, comprehensive Smart Growth policies, and targeted travel reduction programs (31, 32). Large vehicle travel reductions are certainly possible. Automobile-oriented transport planning, underpriced parking, low fuel prices, and sprawl-oriented development policies cause U.S. residents to drive far more annual miles than in peer countries (33). An integrated package of cost effective transportation demand management (TDM) strategies can reduce per capita vehicle travel by 30-50%, provided it includes both carrots and sticks (34). Figure 6 Projected Portland Region TDM Program GHG Reductions (35)
The Portland region’s proposed TDM program is predicted to reduce vehicle travel and associated emissions by 45%. It includes carrots (improvements to resource-efficient modes and more affordable housing in walkable neighborhoods) and sticks (efficient pricing and road space reallocation).
Many cost-effective vehicle travel reductions can be implemented quickly. For example, to reduce vehicle travel and emissions 20% by 2030, a jurisdiction could:
Shift transportation funding from roadway expansions to walking, bicycling and public transit improvements. Establish active and public transport service quality targets.
Eliminate parking minimums, require parking unbundling and cash out (people who don’t drive receive the cash equivalent of parking subsidies provided to motorists), plus public parking fees with revenues invested in resource-efficient transportation programs.
Support and require commute trip reduction, school transport management, transportation management association, and other targeted TDM programs.
Implement PAYD vehicle insurance, taxes and registration fees by 2025.
Implement a fuel or carbon tax that starts at $20 per tonne of carbon (20₵ per gallon of gasoline) and increases 10% annually.
Reform development policies to allow affordable housing in compact, multimodal neighborhoods.
Establish strong logistic management programs to increase freight transport efficiency.

Comprehensive Transportation Emission Reduction Planning Victoria Transport Policy Institute
11
Co-Benefits Cleaner vehicles conserve fossil fuel and reduce emissions but provide few other benefits, and by inducing additional vehicle travel they can increase external costs such as congestion, infrastructure cost, crashes and sprawl-related costs. Vehicle travel reductions and Smart Growth provide a far greater range of benefits, as illustrated below. For example, Maizlish, Rudolph and Jiang (2022) conclude that active transportation improvements could reduce transportation emissions 24% and by reducing local pollution and increasing physical activity cold avoid 167,000 deaths, providing $1.6 trillion in monetized health benefits, compared with 1,400 deaths avoided and $13 billion health benefits from fleet electrification (36). Few emission reduction plans consider all of these impacts. Table 3 Comparing Impacts
Planning Objectives Clean Vehicles TDM and Smart Growth
Vehicle Travel Impacts Increased Reduced
Congestion reduction
Roadway cost savings
Parking cost savings
Consumer savings and affordability Higher purchase, lower operating
Traffic safety
Improved mobility for non-drivers
Fossil fuel conservation
Pollution reduction
Physical fitness and health
Strategic development objectives (reduced sprawl)
(= Achieve objectives. = Contradicts objective.) Cleaner vehicles help conserve fossil fuel and reduce pollution emissions but provide few other benefits. Vehicle travel reductions and more compact, accessible community development provide far greater ranges of benefits. Latent Demand for Less Automobile-Dependent Lifestyles Some emission reduction plans assume that most people want to live automobile-dependent lifestyles, so vehicle travel reductions harm consumers and are difficult to implement (37). For example, the Clearing the Air report implies that Smart Growth may reduce livability for families with children, and mode shifts are difficult and costly to achieve. There are good reasons to be skeptical of such claims. Surveys indicate that many North Americans would like to drive less, rely more on non-auto modes, and live in more multimodal communities, provided that these alternatives are convenient, comfortable and affordable (38). TDM and Smart Growth respond to those demands. There are many examples of integrated TDM and Smart Growth programs that provide large travel reductions and benefits (39, 40). Of course, TDM and Smart Growth face obstacles, costs and uncertainties, but so do clean vehicle strategies. As previously discussed, electric vehicles, particularly larger types such as SUVs, light trucks and vans, are currently costly and will require decades to fully penetrate fleets. They receive large and regressive subsidies, and by encouraging more driving and sprawl they exacerbate traffic problems and sprawl. Their emission reductions are difficult to predict due to uncertainties concerning their future performance and costs, market penetration, rebound effects, annual mileage and scrapage rates.
Comprehensive Transportation Emission Reduction Planning Victoria Transport Policy Institute
12
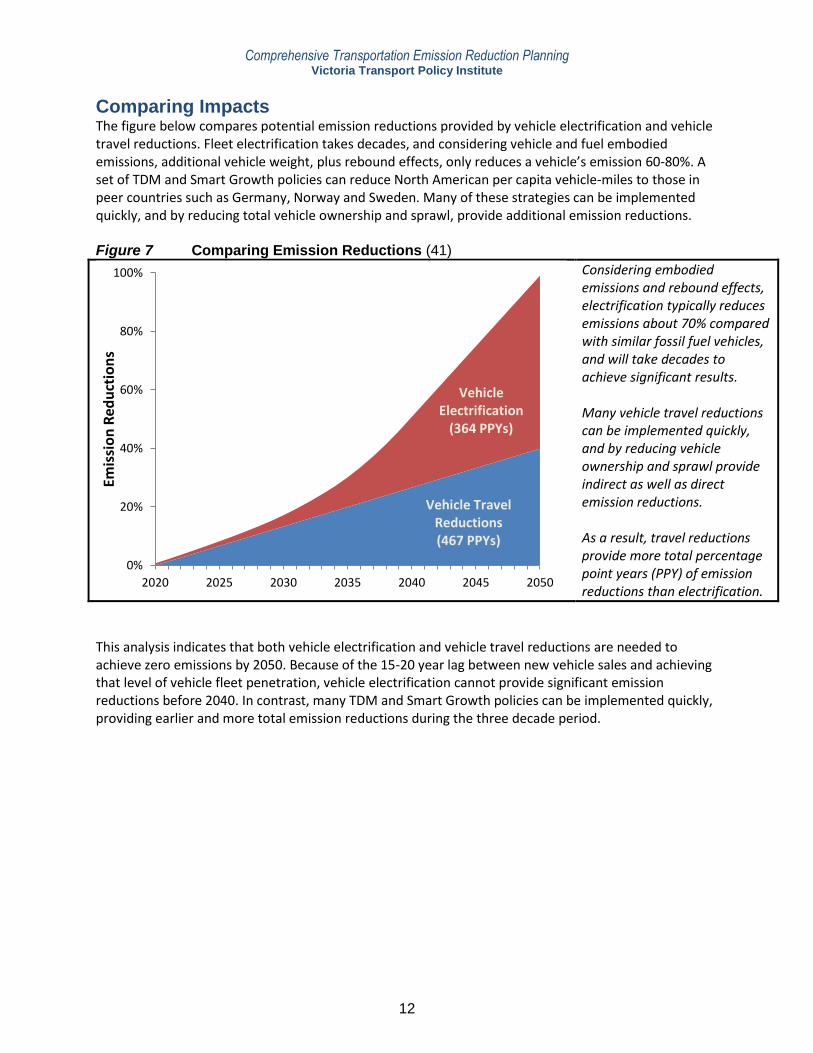
Comparing Impacts The figure below compares potential emission reductions provided by vehicle electrification and vehicle travel reductions. Fleet electrification takes decades, and considering vehicle and fuel embodied emissions, additional vehicle weight, plus rebound effects, only reduces a vehicle’s emission 60-80%. A set of TDM and Smart Growth policies can reduce North American per capita vehicle-miles to those in peer countries such as Germany, Norway and Sweden. Many of these strategies can be implemented quickly, and by reducing total vehicle ownership and sprawl, provide additional emission reductions. Figure 7 Comparing Emission Reductions (41)
Considering embodied emissions and rebound effects, electrification typically reduces emissions about 70% compared with similar fossil fuel vehicles, and will take decades to achieve significant results. Many vehicle travel reductions can be implemented quickly, and by reducing vehicle ownership and sprawl provide indirect as well as direct emission reductions. As a result, travel reductions provide more total percentage point years (PPY) of emission reductions than electrification.
This analysis indicates that both vehicle electrification and vehicle travel reductions are needed to achieve zero emissions by 2050. Because of the 15-20 year lag between new vehicle sales and achieving that level of vehicle fleet penetration, vehicle electrification cannot provide significant emission reductions before 2040. In contrast, many TDM and Smart Growth policies can be implemented quickly, providing earlier and more total emission reductions during the three decade period.
Vehicle Travel Reductions (467 PPYs)
Vehicle Electrification
(364 PPYs)
0%
20%
40%
60%
80%
100%
2020 2025 2030 2035 2040 2045 2050
Emis
sio
n R
edu
ctio
ns
Comprehensive Transportation Emission Reduction Planning Victoria Transport Policy Institute
13
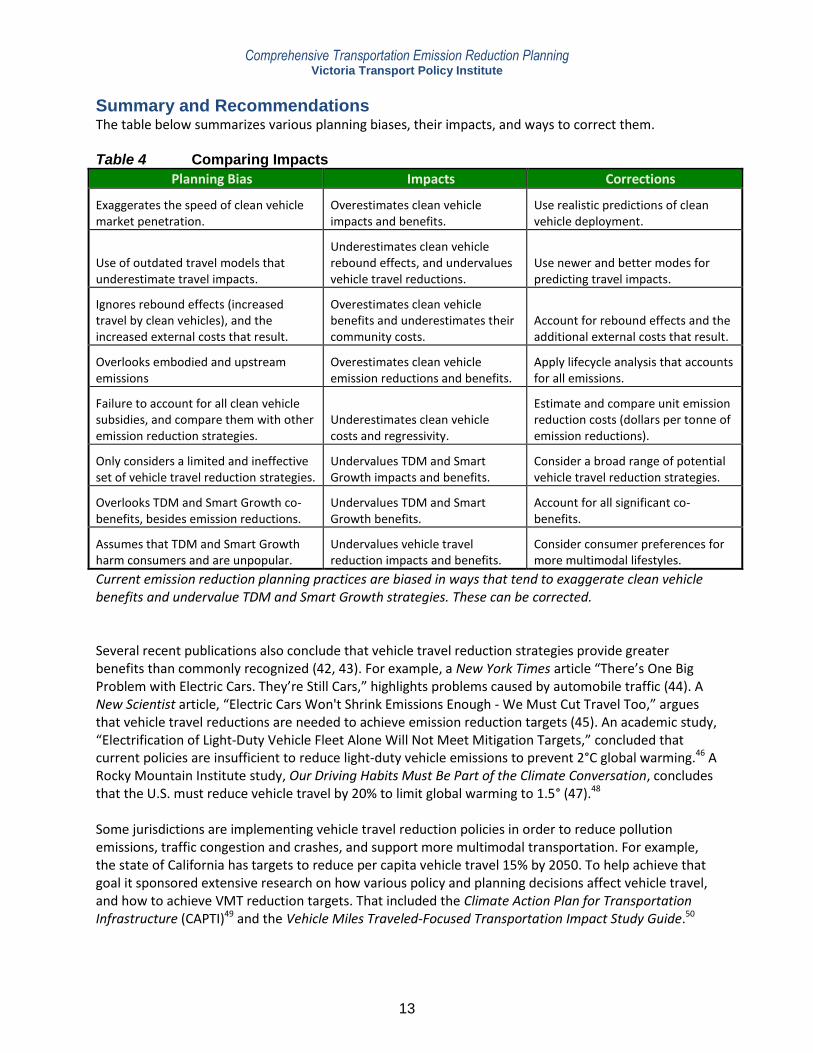
Summary and Recommendations The table below summarizes various planning biases, their impacts, and ways to correct them. Table 4 Comparing Impacts
Planning Bias Impacts Corrections
Exaggerates the speed of clean vehicle market penetration.
Overestimates clean vehicle impacts and benefits.
Use realistic predictions of clean vehicle deployment.
Use of outdated travel models that underestimate travel impacts.
Underestimates clean vehicle rebound effects, and undervalues vehicle travel reductions.
Use newer and better modes for predicting travel impacts.
Ignores rebound effects (increased travel by clean vehicles), and the increased external costs that result.
Overestimates clean vehicle benefits and underestimates their community costs.
Account for rebound effects and the additional external costs that result.
Overlooks embodied and upstream emissions
Overestimates clean vehicle emission reductions and benefits.
Apply lifecycle analysis that accounts for all emissions.
Failure to account for all clean vehicle subsidies, and compare them with other emission reduction strategies.
Underestimates clean vehicle costs and regressivity.
Estimate and compare unit emission reduction costs (dollars per tonne of emission reductions).
Only considers a limited and ineffective set of vehicle travel reduction strategies.
Undervalues TDM and Smart Growth impacts and benefits.
Consider a broad range of potential vehicle travel reduction strategies.
Overlooks TDM and Smart Growth co-benefits, besides emission reductions.
Undervalues TDM and Smart Growth benefits.
Account for all significant co-benefits.
Assumes that TDM and Smart Growth harm consumers and are unpopular.
Undervalues vehicle travel reduction impacts and benefits.
Consider consumer preferences for more multimodal lifestyles.
Current emission reduction planning practices are biased in ways that tend to exaggerate clean vehicle benefits and undervalue TDM and Smart Growth strategies. These can be corrected. Several recent publications also conclude that vehicle travel reduction strategies provide greater benefits than commonly recognized (42, 43). For example, a New York Times article “There’s One Big Problem with Electric Cars. They’re Still Cars,” highlights problems caused by automobile traffic (44). A New Scientist article, “Electric Cars Won't Shrink Emissions Enough - We Must Cut Travel Too,” argues that vehicle travel reductions are needed to achieve emission reduction targets (45). An academic study, “Electrification of Light-Duty Vehicle Fleet Alone Will Not Meet Mitigation Targets,” concluded that current policies are insufficient to reduce light-duty vehicle emissions to prevent 2°C global warming.46 A Rocky Mountain Institute study, Our Driving Habits Must Be Part of the Climate Conversation, concludes that the U.S. must reduce vehicle travel by 20% to limit global warming to 1.5° (47).48 Some jurisdictions are implementing vehicle travel reduction policies in order to reduce pollution emissions, traffic congestion and crashes, and support more multimodal transportation. For example, the state of California has targets to reduce per capita vehicle travel 15% by 2050. To help achieve that goal it sponsored extensive research on how various policy and planning decisions affect vehicle travel, and how to achieve VMT reduction targets. That included the Climate Action Plan for Transportation Infrastructure (CAPTI)49 and the Vehicle Miles Traveled-Focused Transportation Impact Study Guide.50

Comprehensive Transportation Emission Reduction Planning Victoria Transport Policy Institute
14
Conclusions Many jurisdictions and organizations have ambitious emission reduction targets and are developing plans to achieve them. This study finds that the analysis methods used to develop these plans are often biased in ways that favor clean vehicles (e.g., hybrid, electric and hydrogen) over vehicle travel reduction strategies (i.e. transportation demand management [TDM] and Smart Growth policies). Some of these biases have been identified in previous publications but this study is more comprehensive and systematic. It identifies eight common biases and ways to correct them. Many plans assume that clean vehicle strategies are more effective, cost effective, fast, reliable, and popular than vehicle travel reductions. This study challenges those assumptions. Optimistically, half of new vehicles could have zero tailpipe emissions 2030, but these will primarily be cars; SUV, light trucks and van electrification is likely to lag by several years, and without strong scrapage programs many high-emitting vehicles will continue to operate for decades. As a result, clean vehicle programs will not provide large emission reductions before 2040, and are unlikely to be complete by 2050. On the other hand, an integrated set of TDM and Smart Growth strategies could reduce transportation emissions by 40% in ways that are cost-effective overall, considering all impacts. Many current policies favor automobile travel over more resource-efficient modes. In most communities, the majority of transportation resources – money and roadway space – are devoted to automobile facilities to the detriment of other modes; most roads and parking facilities are unpriced; fuel prices are low; and development policies discourage infill. These policies cause people to own more vehicles, drive more, and spend more time and money on transport than they would if given better accessibility options and efficient incentives. Although few motorists want to give up driving altogether, surveys indicate that many would like to drive less, rely more on alternative modes, and live in more walkable communities, provided that they are convenient, safe and affordable. TDM and Smart Growth respond to those demands, and increase rewards to travellers for choosing more resource-efficient options. Many TDM strategies can be implemented quickly, reducing emissions far faster than shifts to clean vehicles. The assumption that clean vehicle solutions are superior to vehicle travel reductions reflects an old planning paradigm which assumed that vehicle travel reductions are harmful (51, 52). A new paradigm recognizes that there is significant latent consumer demand for non-auto modes and living in more compact, multimodal communities, and serving these demands provides many direct and indirect benefits. This new perspective is particularly important for achieving social equity goals. Clean vehicle strategies tend to be unfair and regressive because they depend on large subsidies to car buyers, and exacerbate automobile dependency which harms people who rely on other modes (53). In contrast, many TDM and Smart Growth strategies improve affordable mobility options and reduce the external costs that driving imposes on other people. This analysis suggests that to be efficient and equitable transportation emission reduction plans should rely at least as much on vehicle travel reductions as on clean vehicle strategies, with particular emphasis on “quick win” strategies that can be implemented in a few years. There is a positive message here. With better analysis we can identify true win-win emission reduction strategies that also help achieve other economic, social and environmental goals.
Comprehensive Transportation Emission Reduction Planning Victoria Transport Policy Institute
15
References 1 ACEEE (2019), Sustainable Transportation Planning, American Council for an Energy Efficient Economy
(www.aceee.org); at https://database.aceee.org/city/sustainable-transportation-planning.
2 Tammy Klein (2019), “What U.S. Cities Are Doing to Decarbonize Transport: Focus on Fuels & VMT Reduction,”
Future Fuel Strategies (https://futurefuelstrategies.com); at https://bit.ly/3jOiRM0.
3 White House (2021), President Biden Sets 2030 Greenhouse Gas Pollution Reduction Target,
(www.whitehouse.gov); at https://bit.ly/3if0cei.
4 IEA (2021), Net Zero by 2050: A Roadmap for the Global Energy Sector, International Energy Agency
(https://iea.net); at https://bit.ly/3hEsBdz.
5 ITF (2021), Transport Climate Action Directory, In. Transport Forum (www.itf-oecd.org); at https://bit.ly/3jiyHzy.
6 Todd Litman (2021), Win-Win Transportation Emission Reduction Strategies, Victoria Transport Policy Institute
(www.vtpi.org); at www.vtpi.org/wwclimate.pdf.
7 SUM4All (2019), Catalogue of Policy Measures Toward Sustainable Mobility, Sustainable Mobility for All
(www.sum4all.org); at https://sum4all.org/key-products. Also see Global Roadmap of Action.
8 TfA and SGA (2020), Driving Down Emissions: Transportation, Land Use and Climate Change, Transportation for
America (https://t4america.org) and Smart Growth America; at https://bit.ly/3tLZBEw.
9 TUMI (2020) Climate-friendly Transport Initiative, Transformative Urban Mobility Initiative (www.transformative-
mobility.org); at https://bit.ly/3rxSoWG.
10 SLOCAT (2021), Changing Transport, Summary Analysis, Sustainable Low Carbon Transportation
(https://slocat.net); at https://changing-transport.org/summary-analysis%e2%80%8b.
11 CalSTA (2021), Climate Action Plan for Transportation Infrastructure (CAPTI), California State Transportation
Agency (https://calsta.ca.gov); at https://calsta.ca.gov/subject-areas/climate-action-plan.
12 DSF (2021), Clearing the Air: Transportation, Land Use and Carbon Emissions in Metro Vancouver, David Suzuki
Foundation (https://davidsuzuki.org); at https://bit.ly/2TILO4m.
13 CUB Ohio (2022), The ABCs of Ohio EVs: A Policy Guide to Electrify Ohio, Citizens Utility Board of Ohio
(www.cuboh.org); at www.cuboh.org/reports/the-abcs-of-ohio-evs-a-policy-guide-to-electrify-ohio.
14 ICF (2021), TPB Climate Change Mitigation Study of 2021, National Capital Region Transportation Planning
Board (www.mwcog.org); at https://bit.ly/3zTSueR.
15 Kea Wilson (2021), Reconciliation Bill Will Go Big on EVs, Still Won’t Meet Climate Goals, Streetblog USA
(https://usa.streetsblog.org); at https://bit.ly/3Bl19rQ.
16 Abdullah F Alarfaj, W. Michael Griffin and Constantine Samaras (2021), “Decarbonizing US Passenger Vehicle
Transport Under Electrification and Automation Uncertainty has a Travel Budget,” Environmental Research Letters, Vo. 15, No. 9 (https://iopscience.iop.org/article/10.1088/1748-9326/ab7c89).
17 Chris McCahill (2021), The Amount We Drive Could Make or Break Clean Energy Plans, State Smart
Transportation Initiative (https://ssti.us); at https://bit.ly/3ifHouH.
18 MAPC (2021), The Impacts of Land Use and Pricing in Reducing Vehicle Miles Traveled, Boston Region
Metropolitan Areas Planning Council (www.mapc.org); at https://bit.ly/3jigbHw.
19 Jonathan E. Hughes, Christopher R. Knittel and Daniel Sperling (2006), Evidence of a Shift in the Short-Run Price
Elasticity of Gasoline Demand, National Bureau of Economic Research (http://papers.nber.org/papers/W12530).
20 Lutz Kilian and Xiaoqing Zhou (2020), Gasoline Demand More Responsive to Price Changes than Economists Once
Thought, Federal Reserve Bank of Dallas (www.dallasfed.org); at https://bit.ly/3fk1GBW.
Comprehensive Transportation Emission Reduction Planning Victoria Transport Policy Institute
16
21
Todd Litman (2013), “Changing North American Vehicle-Travel Price Sensitivities: Implications for Transport and Energy Policy,” Transport Policy, Vo. 28, pp. 2-10 (https://bit.ly/3fnaKGq); at www.vtpi.org/VMT_Elasticities.pdf.
22 Robert J. Schneider, Susan L. Handy and Kevan Shafizadeh (2014), “Trip Generation for Smart Growth Projects,”
ACCESS 45, pp. 10-15; at http://tinyurl.com/oye8aqj.
23 Saeed Moshiri and Kamil Aliyev (2017), “Rebound Effect of Efficiency Improvement in Passenger Cars on
Gasoline Consumption,” Ecological Economics, Vo. 131, pp. 330-341 (doi.org/10.1016/j.ecolecon.2016.09.018).
24 ITF (2020), Good to Go? Assessing the Environmental Performance of New Mobility, International Transport
Forum (www.itf-oecd.org); at https://bit.ly/34WWTAy.
25 Blake Shaffer, Maximilian Auffhammer and Constantine Samaras (2021), “Make Electric Vehicles Lighter to
Maximize Climate and Safety Benefits,” Nature (www.nature.com); at www.nature.com/articles/d41586-021-02760-8.
26 Zeke Hausfather (2020), Factcheck: How Electric Vehicles Help to Tackle Climate Change, Carbon Brief
(www.carbonbrief.org); at https://bit.ly/36VQMhK.
27 Georg Bieker (2021), A Global Comparison of the Life-Cycle Greenhouse Gas Emissions of Combustion Engine and
Electric Passenger Cars, International Council on Clean Transportation (https://theicct.org); at https://bit.ly/3rQGd8Y.
28 Kenneth Gillingham and James H. Stock (2018), “The Cost of Reducing Greenhouse Gas Emissions,” Journal of
Economic Perspectives, Vo. 32/4, pp. 53–72 (www.aeaweb.org/articles?id=10.1257/jep.32.4.53).
29 Litman (2021).
30 Charlotte Argue (2020), What can 6,000 electric vehicles tell us about EV battery health?, GeoTab
(www.geotab.com); at www.geotab.com/blog/ev-battery-health.
31 Allen Greenberg and Jay Evans (2017), Comparing Greenhouse Gas Reductions and Legal Implementation
Possibilities for Pay-to-Save Transportation Price-shifting, VTPI (www.vtpi.org); at www.vtpi.org/G&E_GHG.pdf.
32 Litman (2021).
33 Gregory H. Shill (2020), “Should Law Subsidize Driving?” University 0f Iowa Legal Studies Research Paper No.
2019-03, New York University Law Review, (http://dx.doi.org/10.2139/ssrn.3345366).
34 Todd Litman (2014), Economically Optimal Transport Prices and Markets: What Would Happen If Rational
Policies Prevailed? International Transportation Economic Development Conference; at www.vtpi.org/sotpm.pdf.
35 PBOT (2021), The Way to Go Plan: Moving People in Portland. A TDM Strategy to Advance Our Mobility, Climate,
and Equity Goals, Portland Bureau of Transportation (www.portland.gov); at https://bit.ly/2YTvuAo.
36 Neil Maizlish, Linda Rudolph and Chengsheng Jiang (2022), “Health Benefits of Strategies for Carbon Mitigation
in US Transportation, 2017‒2050”, American Journal of Public Health, Vo. 112, no. 3, pp. 426-433 (https://doi.org/10.2105/AJPH.2021.306600).
37 Andrew Salzberg (2021), Dan Sperling and the Zero Carbon Action Plan. An interview with the Godfather of
Transportation Decarbonization, Decarbonizing Transportation (https://bit.ly/2V7OU2L); at https://bit.ly/2WArRxH.
38 NAR (2020), National Community Preference Survey, National Association of Realtors (www.realtor.org); at
https://bit.ly/379n5cv.
39 EPOMM Case Studies (https://epomm.eu/archive/maxlupo/case-studies), European Platform on Mobility Mngt.
40 STTI (2018), Modernizing Mitigation: A Demand-Centered Approach, Smart State Transportation Initiative
(www.ssti.us); at https://bit.ly/2Nri7Ok.
41 Based on Figure 2 “Realistic” electrification prediction, assuming electric vehicles reduce emissions 70%, and
comprehensive TDM and Smart Growth policies can reduce per capita vehicle travel linearly, achieving 40% by 2050.
Comprehensive Transportation Emission Reduction Planning Victoria Transport Policy Institute
17
42
Carlton Reid (2021), “Don’t Despair Over Climate Report’s Horrors, There Are Fixes — But Electric Cars Not One of Them,” Forbes (www.forbes.com); at https://bit.ly/2U69Zd9.
43 Kea Wilson (2021), Biden’s Climate Vision is Too Focused on EVs — Again, Streetsblog USA
(https://usa.streetsblog.org); at https://bit.ly/3lRISy3.
44 Farhad Manjoo (2021), “There’s One Big Problem with Electric Cars. They’re Still Cars,” New York Times
(www.nytimes.com); at www.nytimes.com/2021/02/18/opinion/electric-cars-SUV.html.
45 Adam Vaughan (2019), Electric Cars Won't Shrink Emissions Enough - We Must Cut Travel Too,” New Scientist
(www.newscientist.com); at https://bit.ly/3b3Kyh5.
46 Alexandre Milovanoff, I. Daniel Posen and Heather L. MacLean (2020), “Electrification of Light-Duty Vehicle Fleet
Alone Will Not Meet Mitigation Targets,” Nature Climate Change, Vo. 10, pp. 1102–1107 (https://doi.org/10.1038/s41558-020-00921-7).
47 Brian Yudkin, et al. (2021), Our Driving Habits Must Be Part of the Climate Conversation, Rocky Mountain
Institute (https://rmi.org); at https://bit.ly/2Y10Fco.
48 Blake, Auffhammer and Samaras (2021).
49 CalSTA (2021), Climate Action Plan for Transportation Infrastructure (CAPTI), California State Transportation
Agency (https://calsta.ca.gov); at https://calsta.ca.gov/subject-areas/climate-action-plan.
50 Caltrans (2020), Vehicle Miles Traveled-Focused Transportation Impact Study Guide, California Department of
Transportation (https://dot.ca.gov); at https://bit.ly/3DDSm5H.
51 Marlon G. Boarnet (2013), “The Declining Role of the Automobile and the Re-Emergence of Place in Urban
Transportation,” Regional Science Policy & Practice, Vol. 5/2, pp. 237–253 (DOI: 10.1111/rsp3.12007).
52 Todd Litman (2013), “The New Transportation Planning Paradigm,” ITE Journal (www.ite.org), Vo. 83, No. 6, pp.
20-28; at www.vtpi.org/paradigm.
53 Shill (2020).
www.vtpi.org/cterp.pdf