comprehensivecapitalanalysis andreview2014 ... · introduction...
TRANSCRIPT

Comprehensive Capital Analysisand Review 2014:
Assessment Framework and Results
March 2014
BOARD OF GOVERNOR S O F THE F EDERAL R E S ERV E SY S T EM


Comprehensive Capital Analysisand Review 2014:
Assessment Framework and Results
March 2014
BOARD OF GOVERNOR S O F THE F EDERAL R E S ERV E SY S T EM

This and other Federal Reserve Board reports and publications are available online at
www.federalreserve.gov/publications/default.htm.
To order copies of Federal Reserve Board publications offered in print,
see the Board’s Publication Order Form (www.federalreserve.gov/pubs/orderform.pdf)
or contact:
Publications Fulfillment
Mail Stop N-127
Board of Governors of the Federal Reserve System
Washington, DC 20551
(ph) 202-452-3245
(fax) 202-728-5886
(e-mail) [email protected]

Introduction ............................................................................................................................... 1
Summary of Results ................................................................................................................ 5Reasons for Objections to Specific BHCs’ Capital Plans ............................................................... 7
Results of Quantitative Assessment ............................................................................................. 8
Assessment Framework ....................................................................................................... 17
Capital Plan Assessment Factors ...................................................................................... 19
Qualitative Assessments ........................................................................................................... 19
Quantitative Assessment ........................................................................................................... 19
Resubmissions and Feedback ............................................................................................ 23
Appendix A: Disclosure Tables ......................................................................................... 25
iii
Contents


Introduction
The Federal Reserve’s annual Comprehensive Capital
Analysis and Review (CCAR) is an intensive assess-
ment of the capital adequacy of large, complex U.S.
bank holding companies (BHCs) and of the practices
these BHCs use to manage their capital. This process
helps ensure that these BHCs have sufficient capital
to withstand highly stressful operating environments
and be able to continue operations, maintain ready
access to funding, meet obligations to creditors and
counterparties, and serve as credit intermediaries.
Capital is central to a BHC’s ability to absorb losses
and continue to lend to creditworthy businesses and
consumers. The 2007–09 financial crisis illustrated
that confidence in the capitalization and overall
financial strength of a BHC can erode rapidly in the
face of changes in current or expected economic and
financial conditions. More importantly, the crisis
illustrated that a loss of investor and counterparty
confidence in the financial strength of a BHC might
not only imperil that BHC’s viability, but also harm
the broader financial system.
Large BHCs have built a significant amount of capi-
tal since the crisis, in part due to supervisory pro-
grams like CCAR. (For more information on recent
trends in capital levels, see box 1.) All but two BHCs
participating in this year’s CCAR are expected to
build capital between the second quarter of 2014 and
the first quarter of 2015, based on their planned
capital actions, under their baseline scenario. In the
aggregate, BHCs would distribute 40 percent less
than their projected net income over the same period.
In November 2011, the Federal Reserve adopted the
capital plan rule, which requires BHCs with consoli-
dated assets of $50 billion or more to submit annual
capital plans to the Federal Reserve for review.1
Under the rule, these capital plans must include
detailed descriptions of the following: the BHC’s
internal processes for assessing capital adequacy; the
policies governing capital actions such as common
stock issuance, dividends, and share repurchases; and
all planned capital actions over a nine-quarter plan-
ning horizon. Further, each BHC must also report to
the Federal Reserve the results of stress tests con-
ducted by the BHC under a number of scenarios
(company-run stress tests) that assess the sources and
uses of capital under baseline and stressed economic
and financial conditions.
Through CCAR, the Federal Reserve seeks to ensure
that large BHCs have thorough and robust processes
for managing their capital resources. Such processes
should be supported by effective firm-wide risk-
identification, risk-measurement, and risk-
management practices and ongoing consideration of
the potential for stressful outcomes, with strong over-
sight by boards of directors and senior management.
The Federal Reserve expects each BHC to incorpo-
rate, as part of its capital-planning process, analysis
of the potential for significant and rapid changes in
the risks it faces, including risks generated by a
marked deterioration in the economic and financial
environment as well as pressures that may stem from
firm-specific events. Sufficient capital to continue to
operate through such environments is critical to
enhancing the resiliency of the largest BHCs and to
promoting a more stable financial system that is
strong enough to weather stressful events in the
future.
CCAR is also designed to help both the BHC and the
Federal Reserve evaluate whether a BHC’s capital
accretion and distribution decisions are prudent,
given inherent uncertainty about the future. The
CCAR process also can help act as a counterweight
to pressures that a BHC may face to use capital dis-
tributions to signal financial strength, even in a
highly stressful environment.
CCAR is a key element of the Federal Reserve’s
approach to the supervision of the largest BHCs,
1 The capital plan rule is codified at 12 CFR 225.8. Asset size ismeasured over the previous four calendar quarters as reportedon the Consolidated Financial Statements for Bank HoldingCompanies (FR Y-9C) regulatory report (www.federalreserve.gov/apps/reportforms/default.aspx).
1

focusing on the financial resiliency of the BHCs and
an assessment of their capacity to continue to func-
tion throughout periods of severe stress. Through
CCAR, a BHC’s capital adequacy is evaluated on a
forward-looking, post-stress basis as the BHCs are
required to demonstrate in their capital plans how
they will maintain, throughout a very stressful
period, capital above a tier 1 common ratio of 5 per-
cent and above minimum regulatory capital require-
ments. Additionally, in CCAR the Federal Reserve
expands upon its firm-specific supervisory practices
by undertaking a simultaneous, horizontal assess-
ment of capital adequacy and capital planning prac-
tices at the largest U.S. BHCs, thus allowing the pro-
cess to be informed by assessments of these BHCs
individually and as a group.
CCAR 2014 incorporated the transition arrange-
ments and minimum capital requirements from the
revised regulatory capital framework implementing
the Basel III regulatory capital reforms the Board
finalized in July 2013.2 (See box 2 for more on the
incorporation of the revised capital framework into
CCAR).
This year’s CCAR covered 30 large BHCs, including
12 BHCs that did not participate in previous CCAR
exercises.3 (See table 1 for a list of the BHCs partici-
pating in CCAR 2014).
2 See 12 CFR part 217.3 Eleven of the 12 new participants in CCAR 2014 were previ-
ously subject to the capital plan rule and the Federal Reserve’s
Box 1. Overview of Trends in Capital Levels for Large U.S. BHCs
The 30 BHCs that are part of this year’s CCAR hold80 percent of the total assets of all U.S. BHCs. Theamount and quality of capital held by these institu-tions have continued to improve, contributing toincreased resilience of the banking sector and astrengthening of the financial system more broadly.One of the initial driving forces behind theseimprovements was the 2009 Supervisory CapitalAssessment Program (SCAP), which was led by theFederal Reserve, and included a stress test of the19 largest domestic BHCs. Building on the SCAP,the Federal Reserve conducted the first annualCCAR in 2011 and in the same year issued thecapital plan rule. Since the Board issued the capitalplan rule in 2011, CCAR has become an annualexercise and is the cornerstone of the FederalReserve’s supervisory program for the largestBHCs, which has as its key area of focus the finan-cial resiliency of these firms under stress. The pro-gram has led to stronger capital at BHCs and signifi-cant improvements in risk-measurement and risk-management capabilities across the firms.
As shown in figure A, the aggregate tier 1 commonequity ratio of the 30 BHCs in the 2014 CCAR hasmore than doubled from 5.5 percent in the first quar-ter of 2009 to 11.6 percent in the fourth quarter of2013.1 That gain reflects a total increase of morethan $511 billion in tier 1 common equity from thebeginning of 2009 among these BHCs to $971 bil-lion in the fourth quarter of 2013. BHCs have raisedequity from external sources, including the equityraised in connection with the redemption of U.S.
government investments under the Troubled AssetRelief Program and requirements to raise capital fol-lowing the SCAP in 2009. Much of the additionalincrease in recent years is attributable to a signifi-cant accretion of common equity through retainedearnings as capital growth has been supported bygeneral improvements in profitability across thebanking system.
1 Santander Holdings USA, Inc. was not included in this analysisof capital accretion because Santander did not file the FR Y-9Cfinancial report before 2012. Including Santander would add$8.8 billion of tier 1 common capital in the fourth quarter of 2013and increase the aggregate tier 1 level of the CCAR participantsin 2012 and 2013 approximately 1 to 2 basis points.
Figure A. Tier 1 common ratio of CCAR 2014 BHCs
0.0
2.0
4.0
6.0
8.0
10.0
12.0
0.0
2.0
4.0
6.0
8.0
10.0
12.0
Q1
20
09
Q3
20
09
Q1 2
010
Q3
20
10
Q1
20
11
Q3
20
11
Q1
20
12
Q3
20
12
Q1
20
13
Q3
20
13
Percent Percent
Note: The dip in the aggregate tier 1 common ratio in the first quarter of2013 was due to an increase in risk-weighted assets, not a decrease incapital. At the start of 2013, new market risk rules (sometimes known asBasel II.5) took effect, changing the process for calculating market risk-weighted assets. See 12 CFR part 217, subpart F. Between the fourthquarter of 2012 and the first quarter of 2013, aggregate market risk-weighted assets increased by $518 billion, representing more than 97 per-cent of the total increase in aggregate risk-weighted assets. Without theincrease in market risk-weighted assets, the aggregate tier 1 common ratiowould have been about 70 basis points higher in the first quarter in 2013.
2 CCAR 2014: Assessment Framework and Results

The remainder of this report summarizes the results
of CCAR 2014, including supervisory estimates of
each BHC’s post-stress capital ratios under the super-
visory severely adverse and supervisory adverse sce-
narios and the Federal Reserve’s objection and non-
objection decisions on the BHC’s 2014 capital plans
and associated capital actions. It also describes the
assessment framework that the Federal Reserve used
in reviewing the capital plans from both quantitative
and qualitative perspectives.4
capital plan review. However, last year, in order to allow aphase-in of the provisions of the Board’s Dodd-Frank Actstress test rules, these BHCs were not subject to certain aspectsof CCAR, including the supervisory stress test. This capital-plan cycle is the first time Santander Holdings USA, Inc. hasbeen subject to the capital plan rule or required to file a capitalplan with the Federal Reserve.
4 For additional information on the supervisory adverse andseverely adverse scenarios, see Board of Governors of the Fed-eral Reserve System (2013), “2014 Supervisory Scenarios forAnnual Stress Tests Required under the Dodd-Frank Act StressTesting Rules and the Capital Plan Rule” (Washington: Boardof Governors, November 1), www.federalreserve.gov/bankinforeg/bcreg20131101a1.pdf.
Table 1. CCAR 2014 BHC names and new participants
BHCs in bold italics are new CCAR participants in 2014
Bank holding company BHC short name
Ally Financial Inc. Ally
American Express Company American Express
Bank of America Corporation Bank of America
The Bank of New York Mellon Corporation Bank of NY-Mellon
BB&T Corporation BB&T
BBVA Compass Bancshares, Inc. BBVA Compass
BMO Financial Corp. BMO
Capital One Financial Corporation Capital One
Citigroup Inc. Citigroup
Comerica Incorporated Comerica
Discover Financial Services Discover
Fifth Third Bancorp Fifth Third
The Goldman Sachs Group, Inc. Goldman Sachs
HSBC North America Holdings Inc. HSBC
Huntington Bancshares Incorporated Huntington
JPMorgan Chase & Co. JPMorgan Chase
KeyCorp KeyCorp
M&T Bank Corporation M&T
Morgan Stanley Morgan Stanley
Northern Trust Corporation Northern Trust
The PNC Financial Services Group, Inc. PNC
RBS Citizens Financial Group, Inc. RBS Citizens
Regions Financial Corporation Regions
Santander Holdings USA, Inc. Santander
State Street Corporation State Street
SunTrust Banks, Inc. SunTrust
U.S. Bancorp U.S. Bancorp
UnionBanCal Corporation UnionBanCal
Wells Fargo & Company Wells Fargo
Zions Bancorporation Zions
March 2014 3


Summary of Results
The Board conducted qualitative and quantitative
assessments of a firm’s capital plan and either
objected to, or provided a non-objection to, each of
the 30 BHCs’ capital plans. The qualitative assess-
ment focuses on the strength of the BHCs’ capital
plans and supporting practices.5 The Federal Reserve
conducts its quantitative assessment based on the
supervisory stress test conducted under the Board’s
rules implementing the stress tests required under the
Dodd-Frank Wall Street Reform and Consumer Pro-
tection Act (Dodd-Frank Act stress tests), combined
with the BHCs’ planned capital actions under the
BHC baseline scenario. (For a comparison of the
Dodd-Frank Act stress tests and CCAR, see box 3).
The qualitative assessments carried out by the Fed-
eral Reserve are a critical component of the CCAR
review. BHCs that were part of CCAR this year dif-
fer significantly in their size, complexity, geographic
footprint, and business models. Reflecting these dif-
ferences, each firm is expected to focus on the idio-
syncratic risks it faces when conducting its internal
stress tests and capital planning. Such a focus on
individual risks is not something that can be fully
captured when running a standardized stress test.
Therefore, even if the supervisory stress test for a
given BHC results in a post-stress tier 1 common
ratio exceeding 5 percent and post-stress regulatory
capital ratios above the minimum requirements, the
Federal Reserve could object to that BHC’s capital
plan based on a qualitative assessment of the prac-
tices supporting its capital planning.6 In the CCAR
qualitative assessment, the Federal Reserve evaluated
• the extent to which the analysis underlying each
BHC’s capital plan captured and appropriately
addressed potential risks stemming from all activi-
ties across the consolidated institution under base-
line and stressed operating conditions;
• the robustness of the BHC’s capital planning pro-
cess, including supporting risk-identification, risk-
measurement, and risk-management practices; the
reasonableness of the assumptions and analysis
underlying the capital plan; and
• corporate governance and internal controls over
the capital-planning process, including the BHC’s
capital policies as approved by its board of
directors.
The Federal Reserve’s qualitative assessment of
BHCs’ capital plans in CCAR 2014 reflects differing
expectations across the various aspects of BHCs’
capital planning processes for BHCs of different
sizes, scopes of operations, activities, and systemic
importance. For example, the Federal Reserve has
significantly heightened supervisory expectations for
the largest and most complex BHCs—in all aspects
of capital planning—and expects these BHCs to have
the most sophisticated, comprehensive, and robust
capital planning practices.
In the CCAR quantitative assessment, the Federal
Reserve evaluated each BHC’s ability to take all capi-
tal actions detailed in the BHC baseline scenario in
its capital plan while maintaining post-stress capital
ratios of greater than 5 percent tier 1 common capital
and above the applicable required regulatory mini-
mum levels in effect during each of the nine quarters
of the planning horizon. The CCAR quantitative
assessment is based on the results of the BHCs’
company-run stress tests and post-stress capital ratios
estimated by the Federal Reserve (CCAR post-stress
capital analysis).
In this cycle, as in CCAR 2013, the Federal Reserve
provided each BHC with an opportunity to adjust its
planned capital distributions after receiving the Fed-
eral Reserve’s preliminary estimates of the BHC’s
post-stress capital ratios. The only adjustment per-
5 For a more detailed discussion of the Federal Reserve’s supervi-sory expectations for capital planning at CCAR BHCs, seeBoard of Governors of the Federal Reserve System (2013),Capital Planning at Large Bank Holding Companies: Supervi-sory Expectations and Current Range of Practice (Washington:Board of Governors, August 19), www.federalreserve.gov/bankinforeg/bcreg20130819a1.pdf.
6 See 12 CFR 225.8(e)(2)(ii).
5

mitted was a reduction of the planned capital distri-
butions that were submitted by the BHCs in their
January 2014 capital plans. These adjusted capital
actions, where applicable, were then incorporated
into the Federal Reserve’s projections to calculate the
adjusted post-stress capital levels and ratios. For
BHCs that submitted an adjusted capital distribu-
tion, the Federal Reserve is disclosing the minimum
projected capital ratios using both the originally sub-
mitted planned capital actions and the adjusted
planned capital actions. (See tables 6.A, 6.B, 7.A, and
7.B for the projected capital ratios for all BHCs
under the supervisory severely adverse and supervi-
sory adverse scenarios.)
When the Federal Reserve objects to a BHC’s capital
plan, the BHC may not make any capital distribution
unless the Federal Reserve indicates in writing that it
does not object to the distribution.7 Typically in the
past when the Federal Reserve has objected to a
BHC’s capital plan, it has denied any increase in a
BHC’s capital distributions from the prior year but
has not required a reduction in distributions, reflect-
ing the modest amount of capital distributions from
BHCs in recent years. However, the Federal Reserve
could require a BHC to reduce or cease all capital
distributions if it felt that the weaknesses in the
BHC’s capital planning warranted such a response.
This year, as in past cases in which there have been
objections to capital plans, the Federal Reserve did
not object to a continuation of the BHCs’ current
capital distributions.
While the nine-quarter planning horizon contained
in the 2014 capital plans extends through the end of
2015, the Federal Reserve’s decision to object or not
object to BHCs’ planned capital actions is carried out
annually and applies only to the four quarters begin-
ning with the second quarter of the current year and
running through the end of the first quarter of the
following year.8 The Federal Reserve evaluates
7 See 12 CFR 225.8(e)(2)(iv).
8 For CCAR 2014, the nine-quarter planning horizon covered inthe capital plans begins with the fourth quarter of 2013 andends with the close of the fourth quarter of 2015. If the FederalReserve does not object to a BHC’s capital plan, the BHC maymake its planned capital distributions for the four-quarterperiod beginning with the second quarter of 2014 and runningthrough the end of the first quarter of 2015. Capital distribu-tions in the fourth quarter of 2013 and the first quarter of 2014were addressed in capital plans submitted in connection withCCAR 2013, and capital distributions for the four-quarterperiod beginning with the second quarter of 2015 and runningthrough the end of the first quarter of 2016 will be addressed inthe BHCs’ 2015 capital plans.
Table 2. Summary of the Federal Reserve’s actions on capital plans in CCAR 2014
Non-objection to capital plan Objection to capital plan
Ally Financial Inc. Citigroup Inc.
American Express Company HSBC North America Holdings Inc.
Bank of America Corporation RBS Citizens Financial Group, Inc.
The Bank of New York Mellon Corporation Santander Holdings USA, Inc.
BB&T Corporation Zions Bancorporation
BBVA Compass Bancshares, Inc.
BMO Financial Corp.
Capital One Financial Corporation
Comerica Incorporated
Discover Financial Services
Fifth Third Bancorp
The Goldman Sachs Group, Inc.
Huntington Bancshares Incorporated
JPMorgan Chase & Co.
KeyCorp
M&T Bank Corporation
Morgan Stanley
Northern Trust Corporation
The PNC Financial Services Group, Inc.
Regions Financial Corporation
State Street Corporation
SunTrust Banks, Inc.
U.S. Bancorp
UnionBanCal Corporation
Wells Fargo & Company
6 CCAR 2014: Assessment Framework and Results

planned capital actions for the full nine-quarter plan-
ning horizon to better understand each BHC’s
longer-term capital management strategy and to
assess post-stress capital levels over the full planning
horizon.9
The Federal Reserve did not object to the capital plan
and planned capital distributions for BHCs listed in
the “Non-objection to capital plan” column in table 2.
The Federal Reserve objected to the capital plans of
each BHC listed in the “Objection to capital plan”
column in the table. Each of these BHCs either did
not meet the CCAR minimum post-stress capital
ratio requirements or had deficiencies in its capital
planning process that undermine the overall reliabil-
ity of the BHC’s capital planning process.
The Board of Governors objected to the capital plans
of Citigroup Inc.; HSBC North America Holdings
Inc.; RBS Citizens Financial Group, Inc.; and San-
tander Holdings USA, Inc. based on the qualitative
assessments conducted by the Federal Reserve in
CCAR 2014. Zions Bancorporation’s capital plan
received an objection from the Federal Reserve based
on the quantitative assessment. These BHCs are not
permitted to implement their requested plans for
increased capital distributions, and are required to
resubmit their capital plans to the Federal Reserve
following substantial remediation of the issues that
led to the objections, consistent with the require-
ments in the Federal Reserve’s capital plan rule.10
Reasons for Objections to SpecificBHCs’ Capital Plans
The Federal Reserve’s objection to Citigroup’s
CCAR 2014 capital plan in part reflects significantly
heightened supervisory expectations for the largest
and most complex BHCs in all aspects of capital
planning.11 While Citigroup has made considerable
progress in improving its general risk-management
and control practices over the past several years, its
2014 capital plan reflected a number of deficiencies
in its capital planning practices, including in some
areas that had been previously identified by supervi-
sors as requiring attention, but for which there was
not sufficient improvement. Practices with specific
deficiencies included Citigroup’s ability to project
revenue and losses under a stressful scenario for
material parts of the firm’s global operations, and its
ability to develop scenarios for its internal stress test-
ing that adequately reflect and stress its full range of
business activities and exposures. Taken in isolation,
each of the deficiencies would not have been deemed
critical enough to warrant an objection, but, when
viewed together, they raise sufficient concerns regard-
ing the overall reliability of Citigroup’s capital plan-
ning process to warrant an objection to the capital
plan and require a resubmission.
The Federal Reserve also objected on qualitative
grounds to the capital plans of three institutions—
HSBC, RBS Citizens, and Santander—that are all
new to CCAR in 2014. As the Federal Reserve has
noted previously, BHCs that are new to CCAR may
face challenges in developing appropriate capital
planning processes that meet the Federal Reserve’s
high expectations. Although the Federal Reserve has
different expectations for BHCs new to CCAR,
weaknesses at HSBC, RBS Citizens, and Santander
were considered significant enough to warrant an
objection based on the Federal Reserve’s qualitative
assessment.
The Federal Reserve objected to the capital plans
from HSBC and RBS Citizens due to significant defi-
ciencies in their capital planning processes, including
inadequate governance and weak internal controls
around the processes. The Federal Reserve identified
deficiencies in RBS Citizens’s practices for estimating
revenue and losses under a stress scenario and for
ensuring the appropriateness of loss estimates across
business lines given a specific stress scenario. With
regard to HSBC, the Federal Reserve found specific
deficiencies in HSBC’s practices for estimating rev-
enue and losses for material aspects of its operations
under a stress scenario.
The Federal Reserve objected to the capital plan from
Santander due to widespread and significant defi-
ciencies across the BHC’s capital planning processes.
Specific deficiencies were identified in several areas,
including governance, internal controls, risk-
identification and risk-management, management
information system (MIS), and assumptions and
analysis that support the BHC’s capital planning
processes.
9 See Board of Governors of the Federal Reserve System (2013),“Comprehensive Capital Analysis and Review 2014: SummaryInstructions and Guidance” (Washington: Board of Governors,November 1), www.federalreserve.gov/newsevents/press/bcreg/bcreg20131101a2.pdf.
10 See 12 CFR 225.8(d)(4).11 See SR letter 12-17 (December 17, 2012), www.federalreserve
.gov/bankinforeg/srletters/sr1217.htm.
March 2014 7

With regard to HSBC, RBS Citizens, and Santander,
the identified deficiencies in their capital planning
processes are sufficiently material to call into ques-
tion the overall reliability of their capital planning
processes and raise concerns that warrant an objec-
tion and require resubmission of the capital plan.
The Federal Reserve objected to the capital plan from
Zions Bancorporation on quantitative grounds. More
specifically, the BHC’s minimum post-stress tier 1
common ratio under the supervisory post-stress capi-
tal analysis fell below the required 5 percent mini-
mum. The firm is required to submit a new capital
plan based on the quantitative results of the stress
test. No critical qualitative deficiencies in the firm’s
capital planning processes were identified.
Results of Quantitative Assessment
In July 2013, the Board adopted a revised regulatory
capital framework that implements the Basel III
regulatory capital reforms and certain changes
required by the Dodd-Frank Wall Street Reform and
Consumer Protection Act (revised capital frame-
work).12 The phase-in for the revised capital frame-
work begins during the 2014 CCAR planning hori-
zon and therefore affects the calculation and appli-
cable minimum requirements for regulatory capital
ratios and also introduces a new common equity tier
1 ratio. Each BHC must meet the regulatory capital
requirements for each projected quarter of the plan-
ning horizon in accordance with the capital require-
ments that will be in effect during that quarter.13
As in previous years, BHCs must also maintain a
post-stress tier 1 common capital ratio of 5 percent
over all quarters of the planning horizon, which pro-
vides comparability with the quantitative assessment
in previous CCAR exercises.14 See table 3 for the
minimum capital ratios in effect for the period cov-
ered by CCAR 2014 for large BHCs and those with
significant foreign exposures (advanced approaches
BHCs) and for other BHCs.15 As the revised capital
framework phases in, BHCs must have higher post-
stress capital ratios in the later quarters of the plan-
ning horizon to meet higher minimum regulatory
requirements. (See box 2 for examples of how the
minimum capital requirements from revised capital
framework affect BHCs in CCAR 2014.)
Tables 4 and 5 contain minimum post-stress tier 1
common ratios for each of the 30 BHCs under the
supervisory severely adverse and supervisory adverse
scenarios. The middle column of the table incorpo-
rates the original planned capital distributions
included in the capital plans submitted by the BHCs
in January 2014. The ratios reported in the right-
hand column of the table incorporate any adjusted
capital distributions submitted by a BHC after
receiving the Federal Reserve’s preliminary CCAR
post-stress capital analysis. Each BHC in CCAR
2014 must maintain a minimum post-stress tier 1
common ratio of 5 percent in each quarter of the
planning horizon in the supervisory severely adverse
and supervisory adverse scenarios.
Tables 6.A and 6.B report minimum capital ratios
under the supervisory severely adverse scenario based
on both the original and adjusted planned capital
actions. The ratios based on adjusted capital actions
are only reported for those BHCs that submitted
adjustments. In the aggregate, the minimum level of
each of the five capital ratios falls throughout the
planning horizon, with the minimum level of each
capital ratio occurring in 2015. In the aggregate, the
projected minimum post-stress capital ratios, based
on the original planned capital actions, fell between
3.1 and 5.3 percentage points from the third-quarter
2013 starting values (see table A.1.A). There is con-
siderable variation across BHCs in the extent of the
12 The revised capital framework introduces a new minimum ratioof common equity tier 1 capital to risk-weighted assets of4.5 percent and a common equity tier 1 capital conservationbuffer of 2.5 percent of risk-weighted assets that will apply toall supervised financial institutions. The framework raises theminimum ratio of tier 1 capital to risk-weighted assets from4 percent to 6 percent and includes a minimum leverage ratio of4 percent for all banking organizations. For the largest, mostinternationally active banking organizations, the revised capitalframework includes a new minimum supplementary leverageratio that takes into account off-balance sheet exposures. Therevised capital framework also requires firms to hold higher-quality capital, implementing strict eligibility criteria for regula-tory capital instruments. See 12 CFR part 217.
13 For more on the effect of the revised capital framework on thecalculation of the regulatory capital ratios, see the Revised Capi-tal Framework section starting on page 19 of Board of Gover-nors of the Federal Reserve Board (2014), “Dodd-Frank ActStress Test 2014: Supervisory Stress Test Methodology andResults,” (Washington: Board of Governors, March 20),www.federalreserve.gov/newsevents/press/bcreg/bcreg20140320a1.pdf.
14 See 79 Federal Register 13498 (March 11, 2014). The projectedtier 1 common capital ratio is calculated using the definitions oftier 1 capital and total risk-weighted assets in effect beforeimplementation of the revised capital framework (see 12 CFRpart 225, appendix A).
15 For purposes of CCAR 2014, an advanced approaches BHCincludes any BHC that has consolidated assets greater than orequal to $250 billion or total consolidated on-balance sheet for-eign exposure of at least $10 billion as of December 31, 2013.
8 CCAR 2014: Assessment Framework and Results

decline in capital ratios under the severely adverse
scenario: for example, based on tables 6.A. and 6.B.,
the change in the tier 1 common ratio from start to
minimum varies between -1.3 and -8.5 percentage
points under the severely adverse scenario incorpo-
rating the original capital actions submitted in the
BHCs’ capital plans.
In the supervisory severely adverse scenario, three
BHCs—Bank of America Corporation; The Gold-
man Sachs Group, Inc.; and Zions Bancorporation—
were projected to have at least one minimum post-
stress capital ratio fall below regulatory minimum
levels based on their original planned capital actions.
Zions fell below the minimum required post-stress
tier 1 common ratio; Goldman Sachs fell below the
required post-stress tier 1 leverage ratio; and Bank of
America fell below both the required post-stress tier 1
risk-based capital ratio and the tier 1 leverage ratio.
(See the applicable minimum capital ratios for
advanced approaches BHCs provided in table 6.A
and the applicable capital ratios for other BHCs pro-
vide in table 6.B.) Bank of America and Goldman
Sachs were able to maintain post-stress regulatory
capital ratios above minimum requirements in the
severely adverse scenario after submitting adjusted
capital actions. Zions did not submit adjusted capital
actions.
Tables 7.A and 7.B report minimum capital ratios in
the supervisory adverse scenario based on both the
original and adjusted planned capital actions. Similar
to the supervisory severely adverse scenario, the
aggregate post-stress capital ratios declined through
the planning horizon in the supervisory adverse sce-
nario, with the minimum for each of the aggregate
Table 3. 2014 CCAR BHCs and minimum capital ratios
Advanced approaches BHCs for CCAR 20141
American Express Bank of America Bank of NY-Mellon Capital One
Citigroup Goldman Sachs HSBC JPMorgan Chase
Morgan Stanley Northern Trust PNC State Street
U.S. Bancorp Wells Fargo
Minimum capital ratios for advanced approaches BHCs in CCAR 20142
Q4 2013 2014 2015
Tier 1 common ratio 5 percent 5 percent 5 percent
Common equity tier 1 ratio n/a 4 percent 4.5 percent
Tier 1 risk-based capital ratio 4 percent 5.5 percent 6 percent
Total risk-based capital ratio 8 percent 8 percent 8 percent
Tier 1 leverage ratio 3 or 4 percent 4 percent 4 percent
Other BHCs for CCAR 2014
Ally BB&T BBVA Compass BMO
Comerica Discover Fifth Third Huntington
KeyCorp M&T RBS Citizens Regions
Santander SunTrust UnionBanCal Zions
Minimum capital ratios for other BHCs in CCAR 2014
Q4 2013 2014 2015
Tier 1 common ratio 5 percent 5 percent 5 percent
Common equity tier 1 ratio n/a n/a 4.5 percent
Tier 1 risk-based capital ratio 4 percent 4 percent 6 percent
Total risk-based capital ratio 8 percent 8 percent 8 percent
Tier 1 leverage ratio 3 or 4 percent 3 or 4 percent 4 percent
1 For purposes of CCAR 2014, an advanced approaches BHC includes any BHC that has consolidated assets greater than or equal to $250 billion or total consolidatedon-balance sheet foreign exposure of at least $10 billion as of December 31, 2013. See 12 CFR 217.100(b)(1); 12 CFR part 225, appendix G, section 1(b). Other BHCs includeany BHC that is subject to 12 CFR 225.8 and is not an advanced approaches BHC.
2 The tier 1 common ratio is calculated for each quarter of the planning horizon using the definition of tier 1 capital and total risk-weighted assets in effect as of October 1,2013. All other ratios are calculated using the definitions of capital and approaches to risk weighting assets that are in effect during a particular planning horizon quarter. See“Regulations Y and YY: Application of the Revised Capital Framework to the Capital Plan and Stress Test Rules,” 79 Federal Register 13498 (March 11, 2014).
n/a Not applicable.
March 2014 9

capital ratios occurring in 2015. The minimum capi-
tal ratios were generally higher in the supervisory
adverse scenario than in the supervisory severely
adverse scenario. The capital ratios generally declined
in the adverse scenario, but there was considerable
variation across the BHCs.
Box 2. Incorporation of Revised Regulatory Capital Framework into CCAR
In CCAR, a BHC’s projected capital ratios are inter-preted relative to the minimum capital requirementsin effect for each quarter of the planning horizon. InCCAR 2014, the regulatory minimum requirementsmay vary in each year of the planning horizon dueto the phase-in of the revised capital framework. Forexample, the required minimum tier 1 ratio foradvanced approaches BHCs is different for eachyear of the CCAR 2014 projections. For this reason,the Federal Reserve is disclosing post-stress mini-mum ratios for each year of the planning horizon,rather than disclosing only the minimum ratio overthe entire planning horizon, as in previous disclo-sures of CCAR post-stress results. Below are someexamples of how the phase-in of the revised capitalframework may affect BHCs’ post-stress minimumregulatory requirements in CCAR 2014.
Figure A provides an example of how the new com-mon equity tier 1 ratio, which is different than thetier 1 common ratio that banks have been measuredagainst for a number of years, could affect a BHC inCCAR 2014. In the example, a hypotheticaladvanced approaches BHC is projected to satisfy itsrequired minimum common equity tier 1 ratio of4 percent in 2014. However, even though the BHC’scommon equity tier 1 ratio is projected to be higherin 2015 than in 2014, its projected ratio in the firsthalf of 2015 is below the minimum ratio of 4.5 per-cent that comes into effect beginning in 2015 for allBHCs. This example would not apply to a BHC thatwas not subject to the advanced approaches rule
because those BHCs are not subject to a minimumtier 1 requirement in 2014. It is important to notethat institutions must maintain capital levels aboveminimum requirements for five capital ratios inCCAR: tier 1 common, common equity tier 1, tier 1risk-based, total risk-based, and tier 1 leverageratios.
Figure A. Tier 1 capital ratio transition in CCAR 2014
0
2
4
6
ActualQ3 2013
ProjectedQ1 2014
ProjectedQ3 2014
ProjectedQ1 2015
ProjectedQ3 2015
Minimum CET1 ratio for advanced approaches BHCs
Minimum CET1 ratio for all BHCs
Advanced approaches BHC’s common equity tier 1 ratio
Percent
10 CCAR 2014: Assessment Framework and Results

Table 4. Projected minimum tier 1 common ratio, Q4 2013–Q4 2015
Federal Reserve estimates in the severely adverse scenario
Bank holding companyStressed ratio with originalplanned capital actions
Stressed ratio with adjustedplanned capital actions
Ally 6.3
American Express 8.4
Bank of America 5.0 5.3
The Bank of NY-Mellon 12.7
BB&T 8.1
BBVA Compass 8.1
BMO 7.6
Capital One 5.6
Citigroup 6.5
Comerica 7.8
Discover 8.7
Fifth Third 7.5
Goldman Sachs 5.7 6.1
HSBC 6.6
Huntington 6.0
JPMorgan Chase 5.5
KeyCorp 8.0
M&T 6.7
Morgan Stanley 5.9
Northern Trust 10.0
PNC 8.1
RBS Citizens 9.0
Regions 8.2
Santander 7.9
State Street 11.4
SunTrust 8.0
U.S. Bancorp 6.6
UnionBanCal 9.7
Wells Fargo 6.1
Zions 4.4
Note: These projections represent hypothetical estimates that involve an economic outcome that is more adverse than expected. These estimates are not forecasts of capitalratios. The tables include the minimum ratios assuming the capital actions originally submitted in January 2014 by the BHCs in their annual capital plans and the minimumratios incorporating any adjustments to capital distributions made by BHCs after reviewing the Federal Reserve’s stress test projections.
The projected tier 1 common ratio is calculated using the definitions of tier 1 capital and total risk-weighted assets in effect at the start of the capital planning cycle in 2013,without incorporating the new definitions from the revised capital framework issued in July 2013.
March 2014 11

Table 5. Projected minimum tier 1 common ratio, Q4 2013–Q4 2015
Federal Reserve estimates in the adverse scenario
Bank holding companyStressed ratio with originalplanned capital actions
Stressed ratio with adjustedplanned capital actions
Ally 7.6
American Express 10.6
Bank of America 8.4 8.4
Bank of NY Mellon 13.5
BB&T 9.1
BBVA Compass 10.9
BMO 9.9
Capital One 10.1
Citigroup 9.3
Comerica 9.7
Discover 11.0
Fifth Third 8.9
Goldman Sachs 7.2 8.0
HSBC 11.1
Huntington 8.6
JPMorgan Chase 8.3
KeyCorp 9.8
M&T 8.7
Morgan Stanley 8.5
Northern Trust 11.4
PNC 9.9
RBS Citizens 11.5
Regions 10.5
Santander 10.5
State Street 13.4
SunTrust 9.6
U.S. Bancorp 8.6
UnionBanCal 11.5
Wells Fargo 8.7
Zions 8.1
Note: These projections represent hypothetical estimates that involve an economic outcome that is more adverse than expected. These estimates are not forecasts of capitalratios. The tables include the minimum ratios assuming the capital actions originally submitted in January 2014 by the BHCs in their annual capital plans and the minimumratios incorporating any adjustments to capital distributions made by BHCs after reviewing the Federal Reserve’s stress test projections.
The projected tier 1 common ratio is calculated using the definitions of tier 1 capital and total risk-weighted assets in effect at the start of the capital planning cycle in 2013,without incorporating the new definitions from the revised capital framework issued in July 2013.
12 CCAR 2014: Assessment Framework and Results

Table 6.A. Actual Q3 2013 and projected minimum regulatory capital ratios and tier 1 common ratios for advanced approachesBHCs, Q4 2013–Q4 2015
Federal Reserve estimates in the severely adverse scenario
Bank holdingcompany
Capitalactions
Tier 1common ratio (%)
Common equitytier 1 ratio (%)
Tier 1 risk-basedcapital ratio (%)
Total risk-basedcapital ratio (%)
Tier 1leverage ratio (%)
ActualQ3 2013
Projectedminimum
Projected2014
minimum
Projected2015
minimum
ActualQ3 2013
ProjectedQ4 2013
Projected2014
minimum
Projected2015
minimum
ActualQ3 2013
Projectedminimum
ActualQ3 2013
Projectedminimum
American ExpressOriginal 12.8 8.4 10.6 8.9 12.8 12.3 11.2 10.2 14.7 12.0 10.7 8.5
Adjusted
Bank of AmericaOriginal 11.1 5.0 8.0 6.0 12.3 9.5 8.0 6.0* 15.4 8.4 7.8 3.9
Adjusted 11.1 5.3 8.0 6.3 12.3 9.5 8.0 6.3 15.4 8.7 7.8 4.1
Bank of NY-MellonOriginal 14.1 12.7 14.8 12.3 15.8 14.7 15.9 13.3 16.8 13.7 5.6 5.3
Adjusted
Capital OneOriginal 12.7 5.6 9.1 6.1 13.1 11.8 9.7 7.4 15.3 9.2 10.1 6.0
Adjusted
CitigroupOriginal 12.7 6.5 10.8 9.1 13.6 10.5 10.8 9.1 16.7 11.6 8.1 5.6
Adjusted
Goldman SachsOriginal 14.2 5.7 7.5 5.0 16.3 10.3 8.2 6.0 19.4 8.0 7.9 3.9
Adjusted 14.2 6.1 7.8 5.6 16.3 10.3 8.6 6.4 19.4 8.4 7.9 4.2
HSBCOriginal 14.7 6.6 12.6 9.4 17.1 15.6 12.6 9.4 26.5 18.2 7.8 4.4
Adjusted
JPMorgan ChaseOriginal 10.5 5.5 6.9 5.4 11.7 9.2 8.1 6.6 14.3 8.7 6.9 4.2
Adjusted
Morgan StanleyOriginal 12.6 5.9 8.5 6.8 15.3 10.8 8.8 7.2 16.1 9.4 7.3 4.6
Adjusted
Northern TrustOriginal 13.1 10.0 11.2 9.1 13.6 13.1 11.4 9.2 14.9 12.1 8.3 6.0
Adjusted
PNCOriginal 10.3 8.1 8.8 6.7 12.2 12.0 10.5 8.2 15.6 11.4 11.1 8.0
Adjusted
State StreetOriginal 15.5 11.4 13.9 9.4 17.3 15.0 16.1 11.5 19.8 13.5 7.2 6.3
Adjusted
U.S. BancorpOriginal 9.3 6.6 7.6 6.0 11.2 10.8 9.3 7.8 13.3 10.0 9.6 6.9
Adjusted
Wells FargoOriginal 10.6 6.1 7.7 5.2 12.1 11.3 9.2 6.9 15.1 10.9 9.8 5.6
Adjusted
Note: These projections represent hypothetical estimates that involve an economic outcome that is more adverse than expected. These estimates are not forecasts of capitalratios. The tables include the minimum ratios assuming the capital actions originally submitted in January 2014 by the BHCs in their annual capital plans and the minimumratios incorporating any adjustments to capital distributions made by BHCs after reviewing the Federal Reserve’s stress test projections.
* Bank of America’s minimum tier 1 risk-based capital ratio in 2015 was below 6.0 percent before rounding.
Required minimum capital ratios for advanced approaches BHCs in CCAR 2014
Regulatory ratio Q4 2013 2014 2015
Tier 1 common ratio 5 percent 5 percent 5 percent
Common equity tier 1 ratio N/A 4 percent 4.5 percent
Tier 1 risk-based capital ratio 4 percent 5.5 percent 6 percent
Total risk-based capital ratio 8 percent 8 percent 8 percent
Tier 1 leverage ratio 3 or 4 percent 4 percent 4 percent
Note: For purposes of CCAR 2014, an advanced approaches BHC includes any BHC that has consolidated assets greater than or equal to $250 billion or total consolidatedon-balance sheet foreign exposure of at least $10 billion as of December 31, 2013. See 12 CFR 217.100(b)(1); 12 CFR part 225, appendix G, section 1(b). Other BHCs includeany BHC that is subject to 12 CFR 225.8 and is not an advanced approaches BHC.
The projected tier 1 common ratio is calculated using the definitions of tier 1 capital and total risk-weighted assets in effect at the start of the capital planning cycle in 2013,without incorporating the new definitions from the revised capital framework issued in July 2013. All other ratios are calculated in accordance with the transition arrangementsprovided in the Board's revised capital framework.
March 2014 13

Table 6.B. Actual Q3 2013 and projected minimum regulatory capital ratios and tier 1 common ratios for other BHCs, Q4 2013–Q4 2015
Federal Reserve estimates in the severely adverse scenario
Bank holdingcompany
Capitalactions
Tier 1common ratio (%)
Common equitytier 1 ratio (%)
Tier 1 risk-based capital ratio (%)Total risk-basedcapital ratio (%)
Tier 1leverage ratio (%)
ActualQ3 2013
Projectedminimum
Projected2014
minimum
Projected2015
minimum
ActualQ3 2013
ProjectedQ4 2013
Projected2014
minimum
Projected2015
minimum
ActualQ3 2013
Projectedminimum
ActualQ3 2013
Projectedminimum
AllyOriginal 7.9 6.3 7.3 15.4 10.5 9.4 9.1 16.4 10.6 13.2 7.9
Adjusted
BB&TOriginal 9.4 8.1 7.8 11.3 11.1 10.4 9.6 13.9 12.0 9.0 7.8
Adjusted
BBVA CompassOriginal 11.6 8.1 8.2 11.8 11.4 9.6 8.2 14.1 10.2 10.2 7.1
Adjusted
BMOOriginal 10.8 7.6 8.9 10.8 10.0 8.5 8.9 15.2 12.3 7.9 6.0
Adjusted
ComericaOriginal 10.7 7.8 7.6 10.7 10.3 9.0 7.6 13.4 10.1 10.9 7.8
Adjusted
DiscoverOriginal 14.7 8.7 8.4 15.6 14.5 11.5 9.2 17.9 11.2 13.7 8.0
Adjusted
Fifth ThirdOriginal 9.9 7.5 6.9 11.1 10.1 9.2 8.0 14.3 11.1 10.6 7.8
Adjusted
HuntingtonOriginal 10.9 6.0 6.6 12.4 11.2 8.7 7.2 14.7 9.5 10.9 6.4
Adjusted
KeyCorpOriginal 11.2 8.0 8.0 11.9 10.9 9.3 8.3 14.4 10.6 11.3 7.9
Adjusted
M&TOriginal 9.1 6.7 7.2 11.9 11.3 9.6 8.7 15.1 11.5 10.7 7.8
Adjusted
RBS CitizensOriginal 13.9 9.0 9.1 14.0 13.2 10.6 10.3 16.3 13.9 12.1 9.0
Adjusted
RegionsOriginal 11.0 8.2 8.5 11.5 10.7 9.7 9.1 14.5 11.4 9.9 7.8
Adjusted
SantanderOriginal 13.7 7.9 7.3 14.4 13.4 11.4 11.8 16.5 13.1 12.4 10.1
Adjusted
SunTrustOriginal 9.9 8.0 7.5 11.0 10.6 9.5 8.3 13.0 10.2 9.5 7.3
Adjusted
UnionBanCalOriginal 11.1 9.7 9.7 11.2 11.8 10.2 9.7 13.1 11.9 10.2 9.0
Adjusted
ZionsOriginal 10.5 4.4 5.5 13.1 11.8 9.5 6.3 14.8 8.1 10.6 5.2
Adjusted
Note: These projections represent hypothetical estimates that involve an economic outcome that is more adverse than expected. These estimates are not forecasts of capitalratios. The tables include the minimum ratios assuming the capital actions originally submitted in January 2014 by the BHCs in their annual capital plans and the minimumratios incorporating any adjustments to capital distributions made by BHCs after reviewing the Federal Reserve’s stress test projections.
Required minimum capital ratios for other BHCs in CCAR 2014
Regulatory ratio Q4 2013 2014 2015
Tier 1 common ratio 5 percent 5 percent 5 percent
Common equity tier 1 ratio N/A N/A 4.5 percent
Tier 1 risk-based capital ratio 4 percent 4 percent 6 percent
Total risk-based capital ratio 8 percent 8 percent 8 percent
Tier 1 leverage ratio 3 or 4 percent 3 or 4 percent 4 percent
Note: For purposes of CCAR 2014, an advanced approaches BHC includes any BHC that has consolidated assets greater than or equal to $250 billion or total consolidatedon-balance sheet foreign exposure of at least $10 billion as of December 31, 2013. See 12 CFR 217.100(b)(1); 12 CFR part 225, appendix G, section 1(b). Other BHCs includeany BHC that is subject to 12 CFR 225.8 and is not an advanced approaches BHC.
The projected tier 1 common ratio is calculated using the definitions of tier 1 capital and total risk-weighted assets in effect at the start of the capital planning cycle in 2013,without incorporating the new definitions from the revised capital framework issued in July 2013. All other ratios are calculated in accordance with the transition arrangementsprovided in the Board's revised capital framework.
14 CCAR 2014: Assessment Framework and Results

Table 7.A. Actual Q3 2013 and projected minimum regulatory capital ratios and tier 1 common ratios for advanced approachesBHCs, Q4 2013–Q4 2015
Federal Reserve estimates in the adverse scenario
Bank holdingcompany
Capitalactions
Tier 1common ratio (%)
Common equitytier 1 ratio (%)
Tier 1 risk-basedcapital ratio (%)
Total risk-basedcapital ratio (%)
Tier 1leverage ratio (%)
ActualQ3 2013
Projectedminimum
Projected2014
minimum
Projected2015
minimum
ActualQ3 2013
ProjectedQ4 2013
Projected2014
minimum
Projected2015
minimum
ActualQ3 2013
Projectedminimum
ActualQ3 2013
Projectedminimum
American ExpressOriginal 12.8 10.6 11.8 10.7 12.8 12.6 12.2 11.9 14.7 13.8 10.7 9.9
Adjusted
Bank of AmericaOriginal 11.1 8.4 9.5 7.9 12.3 10.4 9.8 8.4 15.4 11.0 7.8 5.4
Adjusted 11.1 8.4 9.5 8.0 12.3 10.4 9.8 8.4 15.4 11.1 7.8 5.5
Bank of NY-MellonOriginal 14.1 13.5 14.7 11.8 15.8 15.2 15.7 12.8 16.8 13.1 5.6 5.3
Adjusted
Capital OneOriginal 12.7 10.1 10.6 8.8 13.1 12.3 11.2 9.5 15.3 11.4 10.1 7.7
Adjusted
CitigroupOriginal 12.7 9.3 12.5 10.8 13.6 11.5 12.5 10.8 16.7 13.2 8.1 6.6
Adjusted
Goldman SachsOriginal 14.2 7.2 9.7 5.8 16.3 12.4 11.1 7.1 19.4 9.2 7.9 4.4
Adjusted 14.2 8.0 10.1 6.5 16.3 12.4 11.5 7.8 19.4 9.9 7.9 4.8
HSBCOriginal 14.7 11.1 13.6 11.6 17.1 16.3 14.2 12.2 26.5 20.7 7.8 5.6
Adjusted
JPMorgan ChaseOriginal 10.5 8.3 8.3 7.1 11.7 10.5 9.6 8.4 14.3 10.5 6.9 5.4
Adjusted
Morgan StanleyOriginal 12.6 8.5 10.9 8.0 15.3 12.6 11.6 8.7 16.1 11.0 7.3 4.9
Adjusted
Northern TrustOriginal 13.1 11.4 11.6 10.0 13.6 13.2 11.8 10.1 14.9 12.7 8.3 6.6
Adjusted
PNCOriginal 10.3 9.9 9.6 8.2 12.2 12.2 11.3 9.8 15.6 12.9 11.1 9.5
Adjusted
State StreetOriginal 15.5 13.4 14.0 9.7 17.3 15.7 15.6 11.2 19.8 13.2 7.2 6.1
Adjusted
U.S. BancorpOriginal 9.3 8.6 8.6 7.8 11.2 11.0 10.3 9.4 13.3 11.6 9.6 8.2
Adjusted
Wells FargoOriginal 10.6 8.7 9.0 7.4 12.1 11.6 10.4 9.0 15.1 13.1 9.8 7.3
Adjusted
Note: These projections represent hypothetical estimates that involve an economic outcome that is more adverse than expected. These estimates are not forecasts of capitalratios. The tables include the minimum ratios assuming the capital actions originally submitted in January 2014 by the BHCs in their annual capital plans and the minimumratios incorporating any adjustments to capital distributions made by BHCs after reviewing the Federal Reserve’s stress test projections.
Required minimum capital ratios for advanced approaches BHCs in CCAR 2014
Regulatory ratio Q4 2013 2014 2015
Tier 1 common ratio 5 percent 5 percent 5 percent
Common equity tier 1 ratio N/A 4 percent 4.5 percent
Tier 1 risk-based capital ratio 4 percent 5.5 percent 6 percent
Total risk-based capital ratio 8 percent 8 percent 8 percent
Tier 1 leverage ratio 3 or 4 percent 4 percent 4 percent
Note: For purposes of CCAR 2014, an advanced approaches BHC includes any BHC that has consolidated assets greater than or equal to $250 billion or total consolidatedon-balance sheet foreign exposure of at least $10 billion as of December 31, 2013. See 12 CFR 217.100(b)(1); 12 CFR part 225, appendix G, section 1(b). Other BHCs includeany BHC that is subject to 12 CFR 225.8 and is not an advanced approaches BHC.
The projected tier 1 common ratio is calculated using the definitions of tier 1 capital and total risk-weighted assets in effect at the start of the capital planning cycle in 2013,without incorporating the new definitions from the revised capital framework issued in July 2013. All other ratios are calculated in accordance with the transition arrangementsprovided in the Board's revised capital framework.
March 2014 15

Table 7.B. Actual Q3 2013 and projected minimum regulatory capital ratios and tier 1 common ratios for other BHCs, Q4 2013–Q4 2015
Federal Reserve estimates in the adverse scenario
Bank holdingcompany
Capitalactions
Tier 1common ratio (%)
Common equitytier 1 ratio (%)
Tier 1 risk-based capital ratio (%)Total risk-basedcapital ratio (%)
Tier 1leverage ratio (%)
ActualQ3 2013
Projectedminimum
Projected2014
minimum
Projected2015
minimum
ActualQ3 2013
ProjectedQ4 2013
Projected2014
minimum
Projected2015
minimum
ActualQ3 2013
Projectedminimum
ActualQ3 2013
Projectedminimum
AllyOriginal 7.9 7.6 8.8 15.4 10.8 10.6 10.8 16.4 11.8 13.2 8.9
Adjusted
BB&TOriginal 9.4 9.1 9.4 11.3 11.2 11.0 11.1 13.9 13.1 9.0 8.7
Adjusted
BBVA CompassOriginal 11.6 10.9 10.6 11.8 11.6 11.1 10.6 14.1 12.4 10.2 9.2
Adjusted
BMOOriginal 10.8 9.9 11.1 10.8 10.3 9.9 11.1 15.2 13.6 7.9 6.9
Adjusted
ComericaOriginal 10.7 9.7 9.4 10.7 10.4 9.9 9.4 13.4 11.3 10.9 9.5
Adjusted
DiscoverOriginal 14.7 11.0 10.7 15.6 14.7 12.9 11.5 17.9 13.4 13.7 9.8
Adjusted
Fifth ThirdOriginal 9.9 8.9 8.4 11.1 10.3 9.9 9.5 14.3 12.1 10.6 9.3
Adjusted
HuntingtonOriginal 10.9 8.6 8.3 12.4 11.4 10.4 9.2 14.7 11.5 10.9 8.1
Adjusted
KeyCorpOriginal 11.2 9.8 9.6 11.9 11.3 10.6 10.0 14.4 12.0 11.3 9.5
Adjusted
M&TOriginal 9.1 8.7 8.9 11.9 11.7 11.5 10.5 15.1 13.3 10.7 9.2
Adjusted
RBS CitizensOriginal 13.9 11.5 11.0 14.0 13.3 12.0 11.6 16.3 15.2 12.1 10.2
Adjusted
RegionsOriginal 11.0 10.5 10.3 11.5 11.3 11.2 11.1 14.5 13.5 9.9 9.5
Adjusted
SantanderOriginal 13.7 10.5 9.2 14.4 14.3 13.2 13.6 16.5 14.9 12.4 11.7
Adjusted
SunTrustOriginal 9.9 9.6 9.5 11.0 10.8 10.6 10.1 13.0 12.1 9.5 8.8
Adjusted
UnionBanCalOriginal 11.1 11.5 12.0 11.2 12.1 11.5 12.0 13.1 13.8 10.2 10.5
Adjusted
ZionsOriginal 10.5 8.1 8.3 13.1 12.1 11.4 9.7 14.8 11.6 10.6 7.9
Adjusted
Note: These projections represent hypothetical estimates that involve an economic outcome that is more adverse than expected. These estimates are not forecasts of capitalratios. The tables include the minimum ratios assuming the capital actions originally submitted in January 2014 by the BHCs in their annual capital plans and the minimumratios incorporating any adjustments to capital distributions made by BHCs after reviewing the Federal Reserve’s stress test projections.
Required minimum capital ratios for other BHCs in CCAR 2014
Regulatory ratio Q4 2013 2014 2015
Tier 1 common ratio 5 percent 5 percent 5 percent
Common equity tier 1 ratio N/A N/A 4.5 percent
Tier 1 risk-based capital ratio 4 percent 4 percent 6 percent
Total risk-based capital ratio 8 percent 8 percent 8 percent
Tier 1 leverage ratio 3 or 4 percent 3 or 4 percent 4 percent
Note: For purposes of CCAR 2014, an advanced approaches BHC includes any BHC that has consolidated assets greater than or equal to $250 billion or total consolidatedon-balance sheet foreign exposure of at least $10 billion as of December 31, 2013. See 12 CFR 217.100(b)(1); 12 CFR part 225, appendix G, section 1(b). Other BHCs includeany BHC that is subject to 12 CFR 225.8 and is not an advanced approaches BHC.
The projected tier 1 common ratio is calculated using the definitions of tier 1 capital and total risk-weighted assets in effect at the start of the capital planning cycle in 2013,without incorporating the new definitions from the revised capital framework issued in July 2013. All other ratios are calculated in accordance with the transition arrangementsprovided in the Board's revised capital framework.
16 CCAR 2014: Assessment Framework and Results

Assessment Framework
On November 1, 2013, the Federal Reserve issued
instructions for the CCAR 2014 exercise, and on
January 6, 2014, the Federal Reserve received capital
plans from 30 BHCs.16 BHCs that participated in
CCAR were required to include in their capital analy-
sis and capital plans the results of their company-run
stress tests based on three supervisory scenarios as
required by the Board’s Dodd-Frank Act stress test
rules: the supervisory baseline, supervisory adverse,
and supervisory severely adverse scenarios.17 While
the same supervisory scenarios generally applied to
all BHCs, a subset of BHCs was subject to additional
scenario components—the trading and counterparty
component (global market shock) and counterparty
default component. Six BHCs with large trading and
private equity exposures were required to include a
global market shock component as part of their
supervisory severely adverse and adverse scenarios,
and to conduct a stress test of those exposures.18 The
same six BHCs, and two other BHCs with substantial
custodial operations, were also required to incorpo-
rate a counterparty default component into their
supervisory severely adverse and supervisory adverse
scenarios.19 In addition to the three supervisory sce-
narios, BHCs were also required to conduct a stress
test using at least one stress scenario developed by
the BHC (BHC stress) and a BHC baseline scenario.
The CCAR review was conducted by a broad range
of Federal Reserve staff, including senior bank super-
visors, financial analysts, accounting and legal
experts, economists, risk-management specialists,
financial-risk modelers, regulatory capital analysts,
and the on-site examiners responsible for each of the
30 BHCs. This multidisciplinary approach brings
diverse perspectives to the Federal Reserve’s assess-
ment of the BHCs’ capital plans. As in previous
years, the Federal Reserve also worked and consulted
with the primary federal banking agencies for the
BHCs’ subsidiary insured depository institutions—
the Office of the Comptroller of the Currency and
the Federal Deposit Insurance Corporation.
The annual CCAR exercise continues to enhance
supervisors’ understanding of the underlying pro-
cesses used by each BHC to assess the adequacy of
the size and composition of capital relative to the
risks faced by the BHC. The results of these compre-
hensive capital plan reviews also serve as inputs into
other aspects of the Federal Reserve’s development
of its supervisory strategy for these BHCs, and factor
into supervisory assessments of each BHC’s risk
management, corporate governance and control pro-
cesses, and financial condition.
16 See Board of Governors of the Federal Reserve System (2013),“Comprehensive Capital Analysis and Review 2014: SummaryInstructions and Guidance” (Washington: Board of Governors,November 2013), www.federalreserve.gov/newsevents/press/bcreg/bcreg20131101a2.pdf
17 12 U.S.C. 5365(i)(2); 12 CFR part 252, subpart E. The FederalReserve published a summary of the results of the Dodd-FrankAct supervisory stress test on March 20, 2014. See Board ofGovernors of the Federal Reserve Board (2014), “Dodd-FrankAct Stress Test 2014: Supervisory Stress Test Methodology andResults” (Washington: Board of Governors, March 24),www.federalreserve.gov/newsevents/press/bcreg/bcreg20140320a1.pdf.
18 The six BHCs subject to the global market shock are Bank ofAmerica Corporation; Citigroup Inc.; The Goldman SachsGroup, Inc.; JPMorgan Chase & Co.; Morgan Stanley; andWells Fargo & Company. See 12 CFR 252.134(b); see also12 CFR 252.144(b)(2)(i).
19 Specifically, these eight BHCs were required to estimate andreport the potential losses and related effects on capital associ-
ated with the instantaneous and unexpected default of theirlargest counterparty across their derivatives, securities lending,and repurchase/reverse repurchase agreement (collectively, Secu-rities Financing Transactions or SFT) activities. The eightBHCs subject to the counterparty default component are Bankof America Corporation; The Bank of New York Mellon Cor-poration; Citigroup Inc.; The Goldman Sachs Group, Inc.;JPMorgan Chase & Co.; Morgan Stanley; State StreetCorporation; and Wells Fargo & Company. See 12 CFR252.144(b)(2)(ii).
17


Capital Plan Assessment Factors
To support its assessment of the capital plans, the
Federal Reserve reviews the supporting analyses in a
BHC’s capital plan, including the BHC’s own stress
test results, and uses the results of the supervisory
stress test conducted under the Board's Dodd-Frank
Act stress test rules as the basis for the quantitative
analysis.
Qualitative Assessments
Qualitative assessments are a critical component of
the CCAR review.20 Even if a BHC meets required
capital ratios, the Federal Reserve could nonetheless
object to that BHC’s capital plan for other reasons.
As described in the Board’s capital plan rule, the rea-
sons for an objection on qualitative grounds could
include any of the following:
• The BHC’s capital-adequacy assessment process—
including the corporate governance and controls
around the process, as well as risk-identification,
risk-measurement, and risk-management practices
supporting the process—are not sufficiently robust.
• The assumptions and analyses underlying the
BHC’s capital plan are inadequate.
• A BHC’s capital adequacy process or proposed
capital distributions would constitute an unsafe or
unsound practice, or would violate any law, regula-
tion, Board order, directive, or any condition
imposed by, or written agreement with, the Board.
• There are outstanding material, unresolved super-
visory issues.21
During CCAR, the Federal Reserve evaluates each
BHC’s risk-identification, risk-measurement, and
risk-management practices supporting the capital
planning process, including estimation practices used
to produce stressed loss, revenue, and capital ratios,
as well as the governance and controls around these
practices. In conducting the qualitative assessment,
supervisors focus in particular on the internal prac-
tices a BHC uses in its internal determination of the
amount and composition of capital needed to con-
tinue operations under a stressful environment.
The Federal Reserve expects BHCs to effectively cap-
ture BHC-specific factors in their internal capital
planning processes, modeling practices, and scenario
development. Accordingly, the Federal Reserve’s
qualitative assessment of the capital plans focused on
the robustness of a BHC’s internal capital adequacy
processes, including each BHC’s stress test under its
own internally designed stress scenario. Particular
attention was given to the processes surrounding the
development and implementation of the BHC stress
scenario to ensure that these processes are robust and
capture firm-specific vulnerabilities and risks, and
that the translation of the scenario into loss, revenue,
and capital projections was sound in both concept
and implementation. There was also an assessment of
whether the broader capital planning process is over-
seen by a robust governance process and is conducted
in a well-controlled manner.
Quantitative Assessment
As noted above, in CCAR, each BHC is required in
its capital plan to demonstrate that it can maintain a
tier 1 common ratio greater than 5 percent and capi-
tal ratios above the minimum regulatory require-
ments in effect during each quarter of the planning
horizon under stressed economic and financial mar-
20 For more on Federal Reserve expectations for capital planningat CCAR BHCs, see Board of Governors of the FederalReserve System (2013), Capital Planning at Large Bank HoldingCompanies: Supervisory Expectations and Current Range ofPractice (Washington: Board of Governors, August 19), www.federalreserve.gov/bankinforeg/bcreg20130819a1.pdf.
21 See 12 CFR 225.8(e)(2)(ii). In determining whether a capitalplan or any proposed capital distribution would constitute anunsafe or unsound practice, the Board or the appropriateReserve Bank would consider whether the BHC is and wouldremain in sound financial condition after effecting the capital
plan and all proposed capital distributions. 12 CFR225.8(e)(2)(ii)(D).
19

ket conditions.22 The Federal Reserve’s assessment of
this requirement is based on post-stress capital analy-
sis generated by the BHCs, as well as on supervisory
post-stress capital analysis.
The CCAR post-stress capital analysis measures the
resiliency of each BHC’s current capital and the
assumed path of its capital actions to potential
changes in the economic and financial market envi-
ronment.23 Thus, the Federal Reserve evaluates a
BHC’s nine-quarter, post-stress capital ratio using
supervisory projections under severely adverse and
adverse scenarios combined with the path of the
BHC’s capital actions included in its capital plan
under its BHC baseline scenario. In reality, BHCs
would be expected to reduce distributions, especially
share repurchases, under stressful conditions. How-
ever, the goal of the CCAR post-stress capital analy-
sis is to provide a rigorous test of a BHC’s health
even if the economy deteriorated and the BHC con-
tinued to make its planned capital distributions.
The CCAR post-stress capital analysis arrives at pro-
jected capital levels and ratios by combining each
BHC’s planned capital actions with the estimates of
revenues, losses, and expenses from the Federal
Reserve’s supervisory stress test conducted under the
Dodd-Frank Act.24 (For a comparison of the Dodd-
Frank Act stress tests and CCAR, see box 3). As
described in the overview of methodology for the
Dodd-Frank Act supervisory stress tests published
on March 20, 2014, the Federal Reserve makes pro-
jections over the nine-quarter planning horizon,
using input data provided by the 30 BHCs and a set
of models developed or selected by the Federal
Reserve.25 This year, the supervisory stress test
included certain new elements, most notably, inde-
pendent projections of balances and risk-weighted
assets and the incorporation of certain capital calcu-
lation changes from the revised regulatory capital
framework (including projections of accumulated
other comprehensive income). The supervisory pro-
jections of pre-provision net revenue also incorpo-
rated an assumption that the elevated litigation risk
and the associated increase in legal reserves observed
in recent years will continue under supervisory
scenarios.
The supervisory projections of losses, revenues, and
expenses are based on hypothetical, severely adverse
and adverse macroeconomic and financial market
scenarios developed by the Federal Reserve. This
year, the severely adverse scenario is characterized by
a substantial weakening in economic activity across
all of the economies included in the scenario. In addi-
tion, the scenario features a significant reversal of
recent improvements to the U.S. housing market and
the euro area outlook. The adverse scenario is char-
acterized by a weakening in economic activity across
all of the economies included in the scenario com-
bined with a global aversion to long-term fixed-
income assets that brings about rapid rises in long-
term rates and steepening yield curves in the United
States and the four countries/country blocks. As
noted earlier, eight BHCs with substantial trading,
private equity, derivatives, and custodial activities
were subject to additional scenario components in
the supervisory severely adverse and supervisory
adverse scenarios.
22 Common equity tier 1 capital includes common stock instru-ments and related surplus, retained earnings, accumulated othercomprehensive income (AOCI), and limited amounts of com-mon equity tier 1 minority interest, minus applicable regulatoryadjustments and deductions. Items that are fully deducted fromcommon equity tier 1 capital include goodwill, other intangibleassets (excluding mortgage servicing assets) and certain deferredtax assets; items that are subject to limits in common equity tier1 capital include mortgage servicing assets, eligible deferred taxassets, and certain significant investments. See 12 CFR part 225,appendix A; 12 CFR 217. 20(b), 217.22(a), and 217.22(d). Tier1 capital consists of common equity tier 1 capital and additionaltier 1 capital, which includes additional tier 1 capital instru-ments (including qualifying non-cumulative perpetual preferredstock instruments), related surplus, and limited amounts of tier1 minority interest, minus applicable regulatory adjustmentsand deductions. See 12 CFR part 225, appendix A; 12 CFR217.2 and 217.20(c). Total capital consists of tier 1 and tier 2capital, which includes tier 2 capital instruments (includingqualifying subordinated debt instruments), related surplus, andlimited amounts of total capital minority interest and the allow-ance for loan and lease losses. See 12 CFR 217.2 and 217.20(d).Tier 1 common capital is calculated as tier 1 capital less the non-common elements of tier 1 capital, including non-cumulativeperpetual preferred stock and related surplus, and minorityinterest in subsidiaries. In CCAR 2014, tier 1 common is calcu-lated under the definition of capital in effect as of the beginningof the stress test and capital plan cycle in 2013. See 12 CFR225.8(c)(8); 12 CFR part 225, appendix A.
23 For more on the methodology of the Federal Reserve’s supervi-sory stress test, see Board of Governors of the Federal ReserveBoard (2014), “Dodd-Frank Act Stress Test 2014: SupervisoryStress Test Methodology and Results” (Washington: Board ofGovernors, March 24), www.federalreserve.gov/newsevents/press/bcreg/bcreg20140320a1.pdf.
24 12 CFR 252.44.25 In connection with CCAR 2014, and in addition to the models
developed and data collected by the Federal Reserve, the Fed-eral Reserve used proprietary models or data licensed from cer-tain third-party providers. These providers are identified inappendix B: Models to Project Net Income and Stressed Capitalof Board of Governors of the Federal Reserve Board (2014),“Dodd-Frank Act Stress Test 2014: Supervisory Stress TestMethodology and Results,” (Washington: Board of Governors,March 24), www.federalreserve.gov/newsevents/press/bcreg/bcreg20140320a1.pdf (see page 65, footnote 43).
20 CCAR 2014: Assessment Framework and Results

In CCAR 2014, the Federal Reserve also assessed
each BHC’s plans for meeting the revised regulatory
capital rule requirements approved by the Board in
July 2013. All 30 BHCs demonstrated the ability to
successfully meet the fully phased-in capital require-
ments of the revised capital framework by no later
than the end of 2015 under the supervisory baseline
scenario.
Each BHC’s own stress test analysis was expected to
encompass all potential losses and other impacts to net
income that the BHC might experience under each of
the three supervisory scenarios, as well as under base-
line and stress scenarios developed by the BHC.
The Federal Reserve may object to the capital plan of
any BHC with post-stress capital ratios below the
minimum requirements. Both the BHC’s internal
stress test results and the Federal Reserve’s CCAR
post-stress capital analysis are critical parts of the
Federal Reserve’s determination as to whether to
object or not object to a capital plan; however, they
are not the only consideration and not in all cases the
most important consideration in this determination.
For example, a BHC could have stressed capital
ratios that remain well above regulatory minimum
levels, and the Federal Reserve could still object to its
capital plan and, thus, to the planned capital distribu-
tions in the plan, based on qualitative factors.
For some BHCs, the Federal Reserve may require, as
a condition of its non-objection to a capital plan,
that the BHCs remediate certain weaknesses in their
capital plans and capital planning processes identi-
fied during CCAR 2014, and resubmit their capital
plans.
Box 3. Dodd-Frank Act Supervisory Stress Tests and the CCAR Post-StressCapital Analysis
While closely related, there are some important dif-ferences between the Dodd-Frank Act supervisorystress tests and the CCAR post-stress capital analy-sis. The Dodd-Frank Act supervisory stress testsand the CCAR quantitative assessment incorporatethe same projections of pre-tax net income. The pri-mary difference between the Dodd-Frank Act super-visory stress tests and the CCAR quantitativeassessment is the capital action assumptions thatare combined with these projections to estimatepost-stress capital levels and ratios.
Capital Action Assumptions for the Dodd-FrankAct Supervisory Stress Tests
To project post-stress capital ratios for the Dodd-Frank Act supervisory stress tests, the FederalReserve uses a standardized set of capital actionassumptions that are specified in the Dodd-FrankAct stress test rules.1 Common stock dividend pay-ments are assumed to continue at the same level asthe previous year. Scheduled dividend, interest, orprincipal payments on any other capital instrumenteligible for inclusion in the numerator of a regulatorycapital ratio are assumed to be paid. The assump-tions are that repurchases of common stock arezero. The capital action assumptions do not includeissuance of new common stock, preferred stock, orother instruments that would be included in regula-
tory capital, except for common stock issuanceassociated with expensed employee compensation.2
Capital Actions for CCAR
In contrast, for the CCAR post-stress capital analy-sis, the Federal Reserve uses BHCs’ planned capi-tal actions, and assesses whether a BHC would becapable of meeting supervisory expectations forminimum capital ratios even if stressful conditionsemerged and the BHC did not reduce planned capi-tal distributions.
As a result, post-stress capital ratios projected forthe Dodd-Frank Act supervisory stress tests oftendiffer significantly from those for the CCAR post-stress capital analysis. For example, if a BHCincludes a dividend cut in its planned capital actions,its post-stress capital ratios projected for the CCARcapital analysis could be higher than those projectedfor the Dodd-Frank Act supervisory stress tests.Conversely, if a BHC includes significant dividendincreases, repurchases, or other actions that depletecapital in its planned capital actions, the post-stresscapital ratios for the CCAR could be lower.
1 To make the results of its supervisory stress test comparable tothe company-run stress tests, the Federal Reserve uses thesame capital action assumptions as those required for thecompany-run stress tests, outlined in the Dodd-Frank Act stresstest rules. See 12 CFR 252.56(b)(2).
2 The Dodd-Frank Act stress test rule for covered companiesassumes that future capital actions that are subject to futureadjustment, market conditions, or other regulatory approvals willnot be reflected in a company’s projected regulatory capital forthe purpose of the company-run stress tests because of theuncertainty of these actions. Thus, it was assumed that BHCsdo not make repurchases, redeem, or issue any new commonstock, preferred stock, or other instrument that would beincluded in regulatory capital in the second through ninth quar-ters of the planning horizon, except for common stock issuancesassociated with expensed employee compensation. See 12 CFR252.56(b)(2).
March 2014 21


Resubmissions and Feedback
Consistent with the capital plan rule, the BHCs with
capital plans that the Federal Reserve objected to are
required to resubmit their capital plans following
substantial remediation of the issues that led to the
objection. In addition, the Federal Reserve may
require a capital plan resubmission in future quarters
if a BHC exhibits a material decline in performance
or if a deteriorating outlook materially increases
BHC-specific risks.26 As detailed in the capital plan
rule, a BHC must update and resubmit its capital
plan if it determines there has been or will be a mate-
rial change in the BHC’s risk profile (including a
material change in its business strategy or any mate-
rial risk exposures), financial condition, or corporate
structure since the BHC adopted the capital plan.27
Further, the Federal Reserve may direct a BHC to
revise and resubmit its capital plan for a number of
reasons, including if changes in the macroeconomic
outlook that could have a material impact on a
BHC’s risk profile and financial condition require the
use of updated scenarios.28
Following the conclusion of CCAR, all 30 BHCs will
receive detailed assessments of their capital plans and
the full range of practices supporting their internal
capital assessment processes, including feedback on
areas where the plans and processes need to be
strengthened. This feedback will be based on assess-
ments of all major elements of the 2014 capital plans.
These assessments will provide detailed discussions
of how each BHC is progressing in efforts to meet
the Federal Reserve’s supervisory expectations for
capital planning, and will clarify specific areas that
each BHC must address in order to strengthen their
capital planning processes.26 See 12 CFR 225.8(d)(4)(i).27 See 12 CFR 225.8(d)(4)(i)(A). 28 See 12 CFR 225.8(d)(4)(i)(C).
23

Appendix A: Disclosure Tables
These tables provide projections that represent hypo-
thetical estimates involving an economic outcome
that is more adverse than expected. These estimates
are not forecasts of capital ratios. The tables include
the minimum ratios assuming the capital actions
originally submitted in January 2014 by the BHCs in
their annual capital plans and the minimum ratios
incorporating any adjustments to capital distribu-
tions made by BHCs after reviewing the Federal
Reserve’s stress test projections. The minimum capi-
tal ratios are for the period Q4 2013 to Q4 2015 and
do not necessarily occur in the same quarter.
25

Table A.1.A. 30 participating bank holding companies
Actual Q3 2013 and projected minimum regulatory capital ratios and tier 1 common ratios,Q4 2013–Q4 2015Federal Reserve estimates in the severely adverse scenario
Projected capital ratios through Q4 2015 in the severely adverse scenario
ActualQ3 2013
Minimum stressed ratioswith original planned capital actions
Minimum stressed ratioswith adjusted planned capital actions
Q4 2013 2014 2015 Q4 2013 2014 2015
Tier 1 common ratio (%) 11.5 9.3 7.2 6.5 9.3 7.2 6.6
Common equity tier 1 ratio (%) 6.8 6.9
Tier 1 capital ratio (%) 12.9 10.7 9.4 7.7 10.7 9.4 7.8
Total risk-based capital ratio (%) 15.6 13.5 12.1 10.3 13.5 12.2 10.4
Tier 1 leverage ratio (%) 8.4 6.9 6.2 5.3 6.9 6.2 5.4
Note: These projections represent hypothetical estimates that involve an economic outcome that is more adverse than expected. These estimates are not forecasts of capitalratios. The tables include the minimum ratios assuming the capital actions originally submitted in January 2014 by the BHCs in their annual capital plans and the minimumratios incorporating any adjustments to capital distributions made by BHCs after reviewing the Federal Reserve’s stress test projections and original planned capital distributionsfor those BHCs that did not make adjustments. The minimum capital ratios are for the period Q4 2013 to Q4 2015 and do not necessarily occur in the same quarter.
The projected tier 1 common ratio is calculated using the definitions of tier 1 capital and total risk-weighted assets in effect at the start of the capital planning cycle in 2013,without incorporating the new definitions from the revised capital framework issued in July 2013. All other ratios are calculated in accordance with the transition arrangementsprovided in the Board's revised capital framework. In 2014, the definition of regulatory capital is different for advanced approaches BHCs and other BHCs. Both definitions ofcapital are included in the numerator of projected aggregate regulatory capital ratios in 2014.
26 CCAR 2014: Assessment Framework and Results

Table A.1.B. 30 participating bank holding companies
Actual Q3 2013 and projected minimum regulatory capital ratios and tier 1 common ratios,Q4 2013–Q4 2015Federal Reserve estimates in the adverse scenario
Projected capital ratios through Q4 2015 in the adverse scenario
ActualQ3 2013
Minimum stressed ratioswith original planned capital actions
Minimum stressed ratioswith adjusted planned capital actions
Q4 2013 2014 2015 Q4 2013 2014 2015
Tier 1 common ratio (%) 11.5 10.1 9.3 9.3 10.1 9.3 9.3
Common equity tier 1 ratio (%) 8.6 8.6
Tier 1 capital ratio (%) 12.9 11.5 11.0 9.5 11.5 11.0 9.5
Total risk-based capital ratio (%) 15.6 14.3 13.8 12.2 14.3 13.8 12.2
Tier 1 leverage ratio (%) 8.4 7.4 7.0 6.5 7.4 7.0 6.6
Note: These projections represent hypothetical estimates that involve an economic outcome that is more adverse than expected. These estimates are not forecasts of capitalratios. The tables include the minimum ratios assuming the capital actions originally submitted in January 2014 by the BHCs in their annual capital plans and the minimumratios incorporating any adjustments to capital distributions made by BHCs after reviewing the Federal Reserve’s stress test projections and original planned capital distributionsfor those BHCs that did not make adjustments. The minimum capital ratios are for the period Q4 2013 to Q4 2015 and do not necessarily occur in the same quarter.
The projected tier 1 common ratio is calculated using the definitions of tier 1 capital and total risk-weighted assets in effect at the start of the capital planning cycle in 2013,without incorporating the new definitions from the revised capital framework issued in July 2013. All other ratios are calculated in accordance with the transition arrangementsprovided in the Board's revised capital framework. In 2014, the definition of regulatory capital is different for advanced approaches BHCs and other BHCs. Both definitions ofcapital are included in the numerator of projected aggregate regulatory capital ratios in 2014.
March 2014 27

Table A.2.A. Ally Financial Inc.
Actual Q3 2013 and projected minimum regulatory capital ratios and tier 1 common ratios,Q4 2013–Q4 2015Federal Reserve estimates in the severely adverse scenario
Projected capital ratios through Q4 2015 in the severely adverse scenario
ActualQ3 2013
Minimum stressed ratios with originalplanned capital actions
Minimum stressed ratios with adjustedplanned capital actions
Q4 2013 2014 2015 Q4 2013 2014 2015
Tier 1 common ratio (%) 7.9 7.6 6.5 6.3
Common equity tier 1 ratio (%) 7.3
Tier 1 capital ratio (%) 15.4 10.5 9.4 9.1
Total risk-based capital ratio (%) 16.4 11.8 10.9 10.6
Tier 1 leverage ratio (%) 13.2 8.9 7.9 7.9
Note: These projections represent hypothetical estimates that involve an economic outcome that is more adverse than expected. These estimates are not forecasts of capitalratios. The tables include the minimum ratios assuming the capital actions originally submitted in January 2014 by the BHCs in their annual capital plans and the minimumratios incorporating any adjustments to capital distributions made by BHCs after reviewing the Federal Reserve’s stress test projections and original planned capital distributionsfor those BHCs that did not make adjustments. The minimum capital ratios are for the period Q4 2013 to Q4 2015 and do not necessarily occur in the same quarter.
Required minimum capital ratios for other BHCs in CCAR 2014
Regulatory ratio Q4 2013 2014 2015
Tier 1 common ratio 5 percent 5 percent 5 percent
Common equity tier 1 ratio N/A N/A 4.5 percent
Tier 1 risk-based capital ratio 4 percent 4 percent 6 percent
Total risk-based capital ratio 8 percent 8 percent 8 percent
Tier 1 leverage ratio 3 or 4 percent 3 or 4 percent 4 percent
Note: For purposes of CCAR 2014, an advanced approaches BHC includes any BHC that has consolidated assets greater than or equal to $250 billion or total consolidatedon-balance sheet foreign exposure of at least $10 billion as of December 31, 2013. See 12 CFR 217.100(b)(1); 12 CFR part 225, appendix G, section 1(b). Other BHCs includeany BHC that is subject to 12 CFR 225.8 and is not an advanced approaches BHC.
The tier 1 common ratio is to be calculated using the definitions of tier 1 capital and total risk-weighted assets as currently in effect in 2013. All other ratios are calculatedin accordance with the transition arrangements provided in the Board's revised capital framework, issued in July 2013.
28 CCAR 2014: Assessment Framework and Results

Table A.2.B. Ally Financial Inc.
Actual Q3 2013 and projected minimum regulatory capital ratios and tier 1 common ratios,Q4 2013–Q4 2015Federal Reserve estimates in the adverse scenario
Projected capital ratios through Q4 2015 in the adverse scenario
ActualQ3 2013
Minimum stressed ratios with originalplanned capital actions
Minimum stressed ratios with adjustedplanned capital actions
Q4 2013 2014 2015 Q4 2013 2014 2015
Tier 1 common ratio (%) 7.9 7.9 7.6 8.4
Common equity tier 1 ratio (%) 8.8
Tier 1 capital ratio (%) 15.4 10.8 10.6 10.8
Total risk-based capital ratio (%) 16.4 12.0 11.8 12.2
Tier 1 leverage ratio (%) 13.2 9.1 8.9 9.4
Note: These projections represent hypothetical estimates that involve an economic outcome that is more adverse than expected. These estimates are not forecasts of capitalratios. The tables include the minimum ratios assuming the capital actions originally submitted in January 2014 by the BHCs in their annual capital plans and the minimumratios incorporating any adjustments to capital distributions made by BHCs after reviewing the Federal Reserve’s stress test projections and original planned capital distributionsfor those BHCs that did not make adjustments. The minimum capital ratios are for the period Q4 2013 to Q4 2015 and do not necessarily occur in the same quarter.
Required minimum capital ratios for other BHCs in CCAR 2014
Regulatory ratio Q4 2013 2014 2015
Tier 1 common ratio 5 percent 5 percent 5 percent
Common equity tier 1 ratio N/A N/A 4.5 percent
Tier 1 risk-based capital ratio 4 percent 4 percent 6 percent
Total risk-based capital ratio 8 percent 8 percent 8 percent
Tier 1 leverage ratio 3 or 4 percent 3 or 4 percent 4 percent
Note: For purposes of CCAR 2014, an advanced approaches BHC includes any BHC that has consolidated assets greater than or equal to $250 billion or total consolidatedon-balance sheet foreign exposure of at least $10 billion as of December 31, 2013. See 12 CFR 217.100(b)(1); 12 CFR part 225, appendix G, section 1(b). Other BHCs includeany BHC that is subject to 12 CFR 225.8 and is not an advanced approaches BHC.
The tier 1 common ratio is to be calculated using the definitions of tier 1 capital and total risk-weighted assets as currently in effect in 2013. All other ratios are calculatedin accordance with the transition arrangements provided in the Board's revised capital framework, issued in July 2013.
March 2014 29

Table A.3.A. American Express Company
Actual Q3 2013 and projected minimum regulatory capital ratios and tier 1 common ratios,Q4 2013–Q4 2015Federal Reserve estimates in the severely adverse scenario
Projected capital ratios through Q4 2015 in the severely adverse scenario
ActualQ3 2013
Minimum stressed ratios with originalplanned capital actions
Minimum stressed ratios with adjustedplanned capital actions
Q4 2013 2014 2015 Q4 2013 2014 2015
Tier 1 common ratio (%) 12.8 12.3 9.6 8.4
Common equity tier 1 ratio (%) 10.6 8.9
Tier 1 capital ratio (%) 12.8 12.3 11.2 10.2
Total risk-based capital ratio (%) 14.7 14.2 12.9 12.0
Tier 1 leverage ratio (%) 10.7 10.2 9.1 8.5
Note: These projections represent hypothetical estimates that involve an economic outcome that is more adverse than expected. These estimates are not forecasts of capitalratios. The tables include the minimum ratios assuming the capital actions originally submitted in January 2014 by the BHCs in their annual capital plans and the minimumratios incorporating any adjustments to capital distributions made by BHCs after reviewing the Federal Reserve’s stress test projections and original planned capital distributionsfor those BHCs that did not make adjustments. The minimum capital ratios are for the period Q4 2013 to Q4 2015 and do not necessarily occur in the same quarter.
Required minimum capital ratios for advanced approaches BHCs in CCAR 2014
Regulatory ratio Q4 2013 2014 2015
Tier 1 common ratio 5 percent 5 percent 5 percent
Common equity tier 1 ratio N/A 4 percent 4.5 percent
Tier 1 risk-based capital ratio 4 percent 5.5 percent 6 percent
Total risk-based capital ratio 8 percent 8 percent 8 percent
Tier 1 leverage ratio 3 or 4 percent 4 percent 4 percent
Note: For purposes of CCAR 2014, an advanced approaches BHC includes any BHC that has consolidated assets greater than or equal to $250 billion or total consolidatedon-balance sheet foreign exposure of at least $10 billion as of December 31, 2013. See 12 CFR 217.100(b)(1); 12 CFR part 225, appendix G, section 1(b). Other BHCs includeany BHC that is subject to 12 CFR 225.8 and is not an advanced approaches BHC.
The tier 1 common ratio is to be calculated using the definitions of tier 1 capital and total risk-weighted assets as currently in effect in 2013. All other ratios are calculatedin accordance with the transition arrangements provided in the Board's revised capital framework, issued in July 2013.
30 CCAR 2014: Assessment Framework and Results

Table A.3.B. American Express Company
Actual Q3 2013 and projected minimum regulatory capital ratios and tier 1 common ratios,Q4 2013–Q4 2015Federal Reserve estimates in the adverse scenario
Projected capital ratios through Q4 2015 in the adverse scenario
ActualQ3 2013
Minimum stressed ratios with originalplanned capital actions
Minimum stressed ratios with adjustedplanned capital actions
Q4 2013 2014 2015 Q4 2013 2014 2015
Tier 1 common ratio (%) 12.8 12.6 11.0 10.6
Common equity tier 1 ratio (%) 11.8 10.7
Tier 1 capital ratio (%) 12.8 12.6 12.2 11.9
Total risk-based capital ratio (%) 14.7 14.4 13.8 13.8
Tier 1 leverage ratio (%) 10.7 10.4 9.9 9.9
Note: These projections represent hypothetical estimates that involve an economic outcome that is more adverse than expected. These estimates are not forecasts of capitalratios. The tables include the minimum ratios assuming the capital actions originally submitted in January 2014 by the BHCs in their annual capital plans and the minimumratios incorporating any adjustments to capital distributions made by BHCs after reviewing the Federal Reserve’s stress test projections and original planned capital distributionsfor those BHCs that did not make adjustments. The minimum capital ratios are for the period Q4 2013 to Q4 2015 and do not necessarily occur in the same quarter.
Required minimum capital ratios for advanced approaches BHCs in CCAR 2014
Regulatory ratio Q4 2013 2014 2015
Tier 1 common ratio 5 percent 5 percent 5 percent
Common equity tier 1 ratio N/A 4 percent 4.5 percent
Tier 1 risk-based capital ratio 4 percent 5.5 percent 6 percent
Total risk-based capital ratio 8 percent 8 percent 8 percent
Tier 1 leverage ratio 3 or 4 percent 4 percent 4 percent
Note: For purposes of CCAR 2014, an advanced approaches BHC includes any BHC that has consolidated assets greater than or equal to $250 billion or total consolidatedon-balance sheet foreign exposure of at least $10 billion as of December 31, 2013. See 12 CFR 217.100(b)(1); 12 CFR part 225, appendix G, section 1(b). Other BHCs includeany BHC that is subject to 12 CFR 225.8 and is not an advanced approaches BHC.
The tier 1 common ratio is to be calculated using the definitions of tier 1 capital and total risk-weighted assets as currently in effect in 2013. All other ratios are calculatedin accordance with the transition arrangements provided in the Board's revised capital framework, issued in July 2013.
March 2014 31

Table A.4.A. Bank of America Corporation
Actual Q3 2013 and projected minimum regulatory capital ratios and tier 1 common ratios,Q4 2013–Q4 2015Federal Reserve estimates in the severely adverse scenario
Projected capital ratios through Q4 2015 in the severely adverse scenario
ActualQ3 2013
Minimum stressed ratios with originalplanned capital actions
Minimum stressed ratios with adjustedplanned capital actions
Q4 2013 2014 2015 Q4 2013 2014 2015
Tier 1 common ratio (%) 11.1 8.0 5.8 5.0 8.0 5.8 5.3
Common equity tier 1 ratio (%) 8.0 6.0 8.0 6.3
Tier 1 capital ratio (%) 12.3 9.5 8.0 6.0* 9.5 8.0 6.3
Total risk-based capital ratio (%) 15.4 12.3 10.7 8.4 12.3 10.7 8.7
Tier 1 leverage ratio (%) 7.8 5.9 5.0 3.9 5.9 5.0 4.1
Note: These projections represent hypothetical estimates that involve an economic outcome that is more adverse than expected. These estimates are not forecasts of capitalratios. The tables include the minimum ratios assuming the capital actions originally submitted in January 2014 by the BHCs in their annual capital plans and the minimumratios incorporating any adjustments to capital distributions made by BHCs after reviewing the Federal Reserve’s stress test projections and original planned capital distributionsfor those BHCs that did not make adjustments. The minimum capital ratios are for the period Q4 2013 to Q4 2015 and do not necessarily occur in the same quarter.
* Bank of America’s minimum tier 1 risk-based capital ratio in 2015 was below 6.0 percent before rounding.
Required minimum capital ratios for advanced approaches BHCs in CCAR 2014
Regulatory ratio Q4 2013 2014 2015
Tier 1 common ratio 5 percent 5 percent 5 percent
Common equity tier 1 ratio N/A 4 percent 4.5 percent
Tier 1 risk-based capital ratio 4 percent 5.5 percent 6 percent
Total risk-based capital ratio 8 percent 8 percent 8 percent
Tier 1 leverage ratio 3 or 4 percent 4 percent 4 percent
Note: For purposes of CCAR 2014, an advanced approaches BHC includes any BHC that has consolidated assets greater than or equal to $250 billion or total consolidatedon-balance sheet foreign exposure of at least $10 billion as of December 31, 2013. See 12 CFR 217.100(b)(1); 12 CFR part 225, appendix G, section 1(b). Other BHCs includeany BHC that is subject to 12 CFR 225.8 and is not an advanced approaches BHC.
The tier 1 common ratio is to be calculated using the definitions of tier 1 capital and total risk-weighted assets as currently in effect in 2013. All other ratios are calculatedin accordance with the transition arrangements provided in the Board's revised capital framework, issued in July 2013.
32 CCAR 2014: Assessment Framework and Results

Table A.4.B. Bank of America Corporation
Actual Q3 2013 and projected minimum regulatory capital ratios and tier 1 common ratios,Q4 2013–Q4 2015Federal Reserve estimates in the adverse scenario
Projected capital ratios through Q4 2015 in the adverse scenario
ActualQ3 2013
Minimum stressed ratios with originalplanned capital actions
Minimum stressed ratios with adjustedplanned capital actions
Q4 2013 2014 2015 Q4 2013 2014 2015
Tier 1 common ratio (%) 11.1 9.0 8.4 8.8 9.0 8.4 8.8
Common equity tier 1 ratio (%) 9.5 7.9 9.5 8.0
Tier 1 capital ratio (%) 12.3 10.4 9.8 8.4 10.4 9.8 8.4
Total risk-based capital ratio (%) 15.4 13.2 12.5 11.0 13.2 12.5 11.1
Tier 1 leverage ratio (%) 7.8 6.5 6.0 5.4 6.5 6.0 5.5
Note: These projections represent hypothetical estimates that involve an economic outcome that is more adverse than expected. These estimates are not forecasts of capitalratios. The tables include the minimum ratios assuming the capital actions originally submitted in January 2014 by the BHCs in their annual capital plans and the minimumratios incorporating any adjustments to capital distributions made by BHCs after reviewing the Federal Reserve’s stress test projections and original planned capital distributionsfor those BHCs that did not make adjustments. The minimum capital ratios are for the period Q4 2013 to Q4 2015 and do not necessarily occur in the same quarter.
Required minimum capital ratios for advanced approaches BHCs in CCAR 2014
Regulatory ratio Q4 2013 2014 2015
Tier 1 common ratio 5 percent 5 percent 5 percent
Common equity tier 1 ratio N/A 4 percent 4.5 percent
Tier 1 risk-based capital ratio 4 percent 5.5 percent 6 percent
Total risk-based capital ratio 8 percent 8 percent 8 percent
Tier 1 leverage ratio 3 or 4 percent 4 percent 4 percent
Note: For purposes of CCAR 2014, an advanced approaches BHC includes any BHC that has consolidated assets greater than or equal to $250 billion or total consolidatedon-balance sheet foreign exposure of at least $10 billion as of December 31, 2013. See 12 CFR 217.100(b)(1); 12 CFR part 225, appendix G, section 1(b). Other BHCs includeany BHC that is subject to 12 CFR 225.8 and is not an advanced approaches BHC.
The tier 1 common ratio is to be calculated using the definitions of tier 1 capital and total risk-weighted assets as currently in effect in 2013. All other ratios are calculatedin accordance with the transition arrangements provided in the Board's revised capital framework, issued in July 2013.
March 2014 33

Table A.5.A. The Bank of New York Mellon Corporation
Actual Q3 2013 and projected minimum regulatory capital ratios and tier 1 common ratios,Q4 2013–Q4 2015Federal Reserve estimates in the severely adverse scenario
Projected capital ratios through Q4 2015 in the severely adverse scenario
ActualQ3 2013
Minimum stressed ratios with originalplanned capital actions
Minimum stressed ratios with adjustedplanned capital actions
Q4 2013 2014 2015 Q4 2013 2014 2015
Tier 1 common ratio (%) 14.1 13.1 12.7 12.9
Common equity tier 1 ratio (%) 14.8 12.3
Tier 1 capital ratio (%) 15.8 14.7 15.9 13.3
Total risk-based capital ratio (%) 16.8 15.5 16.4 13.7
Tier 1 leverage ratio (%) 5.6 5.3 5.8 5.6
Note: These projections represent hypothetical estimates that involve an economic outcome that is more adverse than expected. These estimates are not forecasts of capitalratios. The tables include the minimum ratios assuming the capital actions originally submitted in January 2014 by the BHCs in their annual capital plans and the minimumratios incorporating any adjustments to capital distributions made by BHCs after reviewing the Federal Reserve’s stress test projections and original planned capital distributionsfor those BHCs that did not make adjustments. The minimum capital ratios are for the period Q4 2013 to Q4 2015 and do not necessarily occur in the same quarter.
Required minimum capital ratios for advanced approaches BHCs in CCAR 2014
Regulatory ratio Q4 2013 2014 2015
Tier 1 common ratio 5 percent 5 percent 5 percent
Common equity tier 1 ratio N/A 4 percent 4.5 percent
Tier 1 risk-based capital ratio 4 percent 5.5 percent 6 percent
Total risk-based capital ratio 8 percent 8 percent 8 percent
Tier 1 leverage ratio 3 or 4 percent 4 percent 4 percent
Note: For purposes of CCAR 2014, an advanced approaches BHC includes any BHC that has consolidated assets greater than or equal to $250 billion or total consolidatedon-balance sheet foreign exposure of at least $10 billion as of December 31, 2013. See 12 CFR 217.100(b)(1); 12 CFR part 225, appendix G, section 1(b). Other BHCs includeany BHC that is subject to 12 CFR 225.8 and is not an advanced approaches BHC.
The tier 1 common ratio is to be calculated using the definitions of tier 1 capital and total risk-weighted assets as currently in effect in 2013. All other ratios are calculatedin accordance with the transition arrangements provided in the Board's revised capital framework, issued in July 2013.
34 CCAR 2014: Assessment Framework and Results

Table A.5.B. The Bank of New York Mellon Corporation
Actual Q3 2013 and projected minimum regulatory capital ratios and tier 1 common ratios,Q4 2013–Q4 2015Federal Reserve estimates in the adverse scenario
Projected capital ratios through Q4 2015 in the adverse scenario
ActualQ3 2013
Minimum stressed ratios with originalplanned capital actions
Minimum stressed ratios with adjustedplanned capital actions
Q4 2013 2014 2015 Q4 2013 2014 2015
Tier 1 common ratio (%) 14.1 13.6 13.5 14.0
Common equity tier 1 ratio (%) 14.7 11.8
Tier 1 capital ratio (%) 15.8 15.2 15.7 12.8
Total risk-based capital ratio (%) 16.8 16.0 16.2 13.1
Tier 1 leverage ratio (%) 5.6 5.4 5.7 5.3
Note: These projections represent hypothetical estimates that involve an economic outcome that is more adverse than expected. These estimates are not forecasts of capitalratios. The tables include the minimum ratios assuming the capital actions originally submitted in January 2014 by the BHCs in their annual capital plans and the minimumratios incorporating any adjustments to capital distributions made by BHCs after reviewing the Federal Reserve’s stress test projections and original planned capital distributionsfor those BHCs that did not make adjustments. The minimum capital ratios are for the period Q4 2013 to Q4 2015 and do not necessarily occur in the same quarter.
Required minimum capital ratios for advanced approaches BHCs in CCAR 2014
Regulatory ratio Q4 2013 2014 2015
Tier 1 common ratio 5 percent 5 percent 5 percent
Common equity tier 1 ratio N/A 4 percent 4.5 percent
Tier 1 risk-based capital ratio 4 percent 5.5 percent 6 percent
Total risk-based capital ratio 8 percent 8 percent 8 percent
Tier 1 leverage ratio 3 or 4 percent 4 percent 4 percent
Note: For purposes of CCAR 2014, an advanced approaches BHC includes any BHC that has consolidated assets greater than or equal to $250 billion or total consolidatedon-balance sheet foreign exposure of at least $10 billion as of December 31, 2013. See 12 CFR 217.100(b)(1); 12 CFR part 225, appendix G, section 1(b). Other BHCs includeany BHC that is subject to 12 CFR 225.8 and is not an advanced approaches BHC.
The tier 1 common ratio is to be calculated using the definitions of tier 1 capital and total risk-weighted assets as currently in effect in 2013. All other ratios are calculatedin accordance with the transition arrangements provided in the Board's revised capital framework, issued in July 2013.
March 2014 35

Table A.6.A. BB&T Corporation
Actual Q3 2013 and projected minimum regulatory capital ratios and tier 1 common ratios,Q4 2013–Q4 2015Federal Reserve estimates in the severely adverse scenario
Projected capital ratios through Q4 2015 in the severely adverse scenario
ActualQ3 2013
Minimum stressed ratios with originalplanned capital actions
Minimum stressed ratios with adjustedplanned capital actions
Q4 2013 2014 2015 Q4 2013 2014 2015
Tier 1 common ratio (%) 9.4 9.2 8.6 8.1
Common equity tier 1 ratio (%) 7.8
Tier 1 capital ratio (%) 11.3 11.1 10.4 9.6
Total risk-based capital ratio (%) 13.9 13.6 12.5 12.0
Tier 1 leverage ratio (%) 9.0 8.8 8.2 7.8
Note: These projections represent hypothetical estimates that involve an economic outcome that is more adverse than expected. These estimates are not forecasts of capitalratios. The tables include the minimum ratios assuming the capital actions originally submitted in January 2014 by the BHCs in their annual capital plans and the minimumratios incorporating any adjustments to capital distributions made by BHCs after reviewing the Federal Reserve’s stress test projections and original planned capital distributionsfor those BHCs that did not make adjustments. The minimum capital ratios are for the period Q4 2013 to Q4 2015 and do not necessarily occur in the same quarter.
Required minimum capital ratios for other BHCs in CCAR 2014
Regulatory ratio Q4 2013 2014 2015
Tier 1 common ratio 5 percent 5 percent 5 percent
Common equity tier 1 ratio N/A N/A 4.5 percent
Tier 1 risk-based capital ratio 4 percent 4 percent 6 percent
Total risk-based capital ratio 8 percent 8 percent 8 percent
Tier 1 leverage ratio 3 or 4 percent 3 or 4 percent 4 percent
Note: For purposes of CCAR 2014, an advanced approaches BHC includes any BHC that has consolidated assets greater than or equal to $250 billion or total consolidatedon-balance sheet foreign exposure of at least $10 billion as of December 31, 2013. See 12 CFR 217.100(b)(1); 12 CFR part 225, appendix G, section 1(b). Other BHCs includeany BHC that is subject to 12 CFR 225.8 and is not an advanced approaches BHC.
The tier 1 common ratio is to be calculated using the definitions of tier 1 capital and total risk-weighted assets as currently in effect in 2013. All other ratios are calculatedin accordance with the transition arrangements provided in the Board's revised capital framework, issued in July 2013.
36 CCAR 2014: Assessment Framework and Results

Table A.6.B. BB&T Corporation
Actual Q3 2013 and projected minimum regulatory capital ratios and tier 1 common ratios,Q4 2013–Q4 2015Federal Reserve estimates in the adverse scenario
Projected capital ratios through Q4 2015 in the adverse scenario
ActualQ3 2013
Minimum stressed ratios with originalplanned capital actions
Minimum stressed ratios with adjustedplanned capital actions
Q4 2013 2014 2015 Q4 2013 2014 2015
Tier 1 common ratio (%) 9.4 9.4 9.1 9.7
Common equity tier 1 ratio (%) 9.4
Tier 1 capital ratio (%) 11.3 11.2 11.0 11.1
Total risk-based capital ratio (%) 13.9 13.7 13.4 13.1
Tier 1 leverage ratio (%) 9.0 8.9 8.7 9.1
Note: These projections represent hypothetical estimates that involve an economic outcome that is more adverse than expected. These estimates are not forecasts of capitalratios. The tables include the minimum ratios assuming the capital actions originally submitted in January 2014 by the BHCs in their annual capital plans and the minimumratios incorporating any adjustments to capital distributions made by BHCs after reviewing the Federal Reserve’s stress test projections and original planned capital distributionsfor those BHCs that did not make adjustments. The minimum capital ratios are for the period Q4 2013 to Q4 2015 and do not necessarily occur in the same quarter.
Required minimum capital ratios for other BHCs in CCAR 2014
Regulatory ratio Q4 2013 2014 2015
Tier 1 common ratio 5 percent 5 percent 5 percent
Common equity tier 1 ratio N/A N/A 4.5 percent
Tier 1 risk-based capital ratio 4 percent 4 percent 6 percent
Total risk-based capital ratio 8 percent 8 percent 8 percent
Tier 1 leverage ratio 3 or 4 percent 3 or 4 percent 4 percent
Note: For purposes of CCAR 2014, an advanced approaches BHC includes any BHC that has consolidated assets greater than or equal to $250 billion or total consolidatedon-balance sheet foreign exposure of at least $10 billion as of December 31, 2013. See 12 CFR 217.100(b)(1); 12 CFR part 225, appendix G, section 1(b). Other BHCs includeany BHC that is subject to 12 CFR 225.8 and is not an advanced approaches BHC.
The tier 1 common ratio is to be calculated using the definitions of tier 1 capital and total risk-weighted assets as currently in effect in 2013. All other ratios are calculatedin accordance with the transition arrangements provided in the Board's revised capital framework, issued in July 2013.
March 2014 37

Table A.7.A. BBVA Compass Bancshares, Inc.
Actual Q3 2013 and projected minimum regulatory capital ratios and tier 1 common ratios,Q4 2013–Q4 2015Federal Reserve estimates in the severely adverse scenario
Projected capital ratios through Q4 2015 in the severely adverse scenario
ActualQ3 2013
Minimum stressed ratios with originalplanned capital actions
Minimum stressed ratios with adjustedplanned capital actions
Q4 2013 2014 2015 Q4 2013 2014 2015
Tier 1 common ratio (%) 11.6 11.2 9.4 8.1
Common equity tier 1 ratio (%) 8.2
Tier 1 capital ratio (%) 11.8 11.4 9.6 8.2
Total risk-based capital ratio (%) 14.1 13.6 11.7 10.2
Tier 1 leverage ratio (%) 10.2 9.7 8.1 7.1
Note: These projections represent hypothetical estimates that involve an economic outcome that is more adverse than expected. These estimates are not forecasts of capitalratios. The tables include the minimum ratios assuming the capital actions originally submitted in January 2014 by the BHCs in their annual capital plans and the minimumratios incorporating any adjustments to capital distributions made by BHCs after reviewing the Federal Reserve’s stress test projections and original planned capital distributionsfor those BHCs that did not make adjustments. The minimum capital ratios are for the period Q4 2013 to Q4 2015 and do not necessarily occur in the same quarter.
Required minimum capital ratios for other BHCs in CCAR 2014
Regulatory ratio Q4 2013 2014 2015
Tier 1 common ratio 5 percent 5 percent 5 percent
Common equity tier 1 ratio N/A N/A 4.5 percent
Tier 1 risk-based capital ratio 4 percent 4 percent 6 percent
Total risk-based capital ratio 8 percent 8 percent 8 percent
Tier 1 leverage ratio 3 or 4 percent 3 or 4 percent 4 percent
Note: For purposes of CCAR 2014, an advanced approaches BHC includes any BHC that has consolidated assets greater than or equal to $250 billion or total consolidatedon-balance sheet foreign exposure of at least $10 billion as of December 31, 2013. See 12 CFR 217.100(b)(1); 12 CFR part 225, appendix G, section 1(b). Other BHCs includeany BHC that is subject to 12 CFR 225.8 and is not an advanced approaches BHC.
The tier 1 common ratio is to be calculated using the definitions of tier 1 capital and total risk-weighted assets as currently in effect in 2013. All other ratios are calculatedin accordance with the transition arrangements provided in the Board's revised capital framework, issued in July 2013.
38 CCAR 2014: Assessment Framework and Results

Table A.7.B. BBVA Compass Bancshares, Inc.
Actual Q3 2013 and projected minimum regulatory capital ratios and tier 1 common ratios,Q4 2013–Q4 2015Federal Reserve estimates in the adverse scenario
Projected capital ratios through Q4 2015 in the adverse scenario
ActualQ3 2013
Minimum stressed ratios with originalplanned capital actions
Minimum stressed ratios with adjustedplanned capital actions
Q4 2013 2014 2015 Q4 2013 2014 2015
Tier 1 common ratio (%) 11.6 11.4 10.9 10.9
Common equity tier 1 ratio (%) 10.6
Tier 1 capital ratio (%) 11.8 11.6 11.1 10.6
Total risk-based capital ratio (%) 14.1 13.8 13.2 12.4
Tier 1 leverage ratio (%) 10.2 9.9 9.4 9.2
Note: These projections represent hypothetical estimates that involve an economic outcome that is more adverse than expected. These estimates are not forecasts of capitalratios. The tables include the minimum ratios assuming the capital actions originally submitted in January 2014 by the BHCs in their annual capital plans and the minimumratios incorporating any adjustments to capital distributions made by BHCs after reviewing the Federal Reserve’s stress test projections and original planned capital distributionsfor those BHCs that did not make adjustments. The minimum capital ratios are for the period Q4 2013 to Q4 2015 and do not necessarily occur in the same quarter.
Required minimum capital ratios for other BHCs in CCAR 2014
Regulatory ratio Q4 2013 2014 2015
Tier 1 common ratio 5 percent 5 percent 5 percent
Common equity tier 1 ratio N/A N/A 4.5 percent
Tier 1 risk-based capital ratio 4 percent 4 percent 6 percent
Total risk-based capital ratio 8 percent 8 percent 8 percent
Tier 1 leverage ratio 3 or 4 percent 3 or 4 percent 4 percent
Note: For purposes of CCAR 2014, an advanced approaches BHC includes any BHC that has consolidated assets greater than or equal to $250 billion or total consolidatedon-balance sheet foreign exposure of at least $10 billion as of December 31, 2013. See 12 CFR 217.100(b)(1); 12 CFR part 225, appendix G, section 1(b). Other BHCs includeany BHC that is subject to 12 CFR 225.8 and is not an advanced approaches BHC.
The tier 1 common ratio is to be calculated using the definitions of tier 1 capital and total risk-weighted assets as currently in effect in 2013. All other ratios are calculatedin accordance with the transition arrangements provided in the Board's revised capital framework, issued in July 2013.
March 2014 39

Table A.8.A. BMO Financial Corp.
Actual Q3 2013 and projected minimum regulatory capital ratios and tier 1 common ratios,Q4 2013–Q4 2015Federal Reserve estimates in the severely adverse scenario
Projected capital ratios through Q4 2015 in the severely adverse scenario
ActualQ3 2013
Minimum stressed ratios with originalplanned capital actions
Minimum stressed ratios with adjustedplanned capital actions
Q4 2013 2014 2015 Q4 2013 2014 2015
Tier 1 common ratio (%) 10.8 10.0 8.5 7.6
Common equity tier 1 ratio (%) 8.9
Tier 1 capital ratio (%) 10.8 10.0 8.5 8.9
Total risk-based capital ratio (%) 15.2 14.2 12.3 12.4
Tier 1 leverage ratio (%) 7.9 7.1 6.0 6.5
Note: These projections represent hypothetical estimates that involve an economic outcome that is more adverse than expected. These estimates are not forecasts of capitalratios. The tables include the minimum ratios assuming the capital actions originally submitted in January 2014 by the BHCs in their annual capital plans and the minimumratios incorporating any adjustments to capital distributions made by BHCs after reviewing the Federal Reserve’s stress test projections and original planned capital distributionsfor those BHCs that did not make adjustments. The minimum capital ratios are for the period Q4 2013 to Q4 2015 and do not necessarily occur in the same quarter.
Required minimum capital ratios for other BHCs in CCAR 2014
Regulatory ratio Q4 2013 2014 2015
Tier 1 common ratio 5 percent 5 percent 5 percent
Common equity tier 1 ratio N/A N/A 4.5 percent
Tier 1 risk-based capital ratio 4 percent 4 percent 6 percent
Total risk-based capital ratio 8 percent 8 percent 8 percent
Tier 1 leverage ratio 3 or 4 percent 3 or 4 percent 4 percent
Note: For purposes of CCAR 2014, an advanced approaches BHC includes any BHC that has consolidated assets greater than or equal to $250 billion or total consolidatedon-balance sheet foreign exposure of at least $10 billion as of December 31, 2013. See 12 CFR 217.100(b)(1); 12 CFR part 225, appendix G, section 1(b). Other BHCs includeany BHC that is subject to 12 CFR 225.8 and is not an advanced approaches BHC.
The tier 1 common ratio is to be calculated using the definitions of tier 1 capital and total risk-weighted assets as currently in effect in 2013. All other ratios are calculatedin accordance with the transition arrangements provided in the Board's revised capital framework, issued in July 2013.
40 CCAR 2014: Assessment Framework and Results

Table A.8.B. BMO Financial Corp.
Actual Q3 2013 and projected minimum regulatory capital ratios and tier 1 common ratios,Q4 2013–Q4 2015Federal Reserve estimates in the adverse scenario
Projected capital ratios through Q4 2015 in the adverse scenario
ActualQ3 2013
Minimum stressed ratios with originalplanned capital actions
Minimum stressed ratios with adjustedplanned capital actions
Q4 2013 2014 2015 Q4 2013 2014 2015
Tier 1 common ratio (%) 10.8 10.3 9.9 10.0
Common equity tier 1 ratio (%) 11.1
Tier 1 capital ratio (%) 10.8 10.3 9.9 11.1
Total risk-based capital ratio (%) 15.2 14.5 13.6 14.4
Tier 1 leverage ratio (%) 7.9 7.3 6.9 8.1
Note: These projections represent hypothetical estimates that involve an economic outcome that is more adverse than expected. These estimates are not forecasts of capitalratios. The tables include the minimum ratios assuming the capital actions originally submitted in January 2014 by the BHCs in their annual capital plans and the minimumratios incorporating any adjustments to capital distributions made by BHCs after reviewing the Federal Reserve’s stress test projections and original planned capital distributionsfor those BHCs that did not make adjustments. The minimum capital ratios are for the period Q4 2013 to Q4 2015 and do not necessarily occur in the same quarter.
Required minimum capital ratios for other BHCs in CCAR 2014
Regulatory ratio Q4 2013 2014 2015
Tier 1 common ratio 5 percent 5 percent 5 percent
Common equity tier 1 ratio N/A N/A 4.5 percent
Tier 1 risk-based capital ratio 4 percent 4 percent 6 percent
Total risk-based capital ratio 8 percent 8 percent 8 percent
Tier 1 leverage ratio 3 or 4 percent 3 or 4 percent 4 percent
Note: For purposes of CCAR 2014, an advanced approaches BHC includes any BHC that has consolidated assets greater than or equal to $250 billion or total consolidatedon-balance sheet foreign exposure of at least $10 billion as of December 31, 2013. See 12 CFR 217.100(b)(1); 12 CFR part 225, appendix G, section 1(b). Other BHCs includeany BHC that is subject to 12 CFR 225.8 and is not an advanced approaches BHC.
The tier 1 common ratio is to be calculated using the definitions of tier 1 capital and total risk-weighted assets as currently in effect in 2013. All other ratios are calculatedin accordance with the transition arrangements provided in the Board's revised capital framework, issued in July 2013.
March 2014 41

Table A.9.A. Capital One Financial Corporation
Actual Q3 2013 and projected minimum regulatory capital ratios and tier 1 common ratios,Q4 2013–Q4 2015Federal Reserve estimates in the severely adverse scenario
Projected capital ratios through Q4 2015 in the severely adverse scenario
ActualQ3 2013
Minimum stressed ratios with originalplanned capital actions
Minimum stressed ratios with adjustedplanned capital actions
Q4 2013 2014 2015 Q4 2013 2014 2015
Tier 1 common ratio (%) 12.7 11.4 8.0 5.6
Common equity tier 1 ratio (%) 9.1 6.1
Tier 1 capital ratio (%) 13.1 11.8 9.7 7.4
Total risk-based capital ratio (%) 15.3 14.0 11.7 9.2
Tier 1 leverage ratio (%) 10.1 8.9 7.2 6.0
Note: These projections represent hypothetical estimates that involve an economic outcome that is more adverse than expected. These estimates are not forecasts of capitalratios. The tables include the minimum ratios assuming the capital actions originally submitted in January 2014 by the BHCs in their annual capital plans and the minimumratios incorporating any adjustments to capital distributions made by BHCs after reviewing the Federal Reserve’s stress test projections and original planned capital distributionsfor those BHCs that did not make adjustments. The minimum capital ratios are for the period Q4 2013 to Q4 2015 and do not necessarily occur in the same quarter.
Required minimum capital ratios for advanced approaches BHCs in CCAR 2014
Regulatory ratio Q4 2013 2014 2015
Tier 1 common ratio 5 percent 5 percent 5 percent
Common equity tier 1 ratio N/A 4 percent 4.5 percent
Tier 1 risk-based capital ratio 4 percent 5.5 percent 6 percent
Total risk-based capital ratio 8 percent 8 percent 8 percent
Tier 1 leverage ratio 3 or 4 percent 4 percent 4 percent
Note: For purposes of CCAR 2014, an advanced approaches BHC includes any BHC that has consolidated assets greater than or equal to $250 billion or total consolidatedon-balance sheet foreign exposure of at least $10 billion as of December 31, 2013. See 12 CFR 217.100(b)(1); 12 CFR part 225, appendix G, section 1(b). Other BHCs includeany BHC that is subject to 12 CFR 225.8 and is not an advanced approaches BHC.
The tier 1 common ratio is to be calculated using the definitions of tier 1 capital and total risk-weighted assets as currently in effect in 2013. All other ratios are calculatedin accordance with the transition arrangements provided in the Board's revised capital framework, issued in July 2013.
42 CCAR 2014: Assessment Framework and Results

Table A.9.B. Capital One Financial Corporation
Actual Q3 2013 and projected minimum regulatory capital ratios and tier 1 common ratios,Q4 2013–Q4 2015Federal Reserve estimates in the adverse scenario
Projected capital ratios through Q4 2015 in the adverse scenario
ActualQ3 2013
Minimum stressed ratios with originalplanned capital actions
Minimum stressed ratios with adjustedplanned capital actions
Q4 2013 2014 2015 Q4 2013 2014 2015
Tier 1 common ratio (%) 12.7 11.9 10.7 10.1
Common equity tier 1 ratio (%) 10.6 8.8
Tier 1 capital ratio (%) 13.1 12.3 11.2 9.5
Total risk-based capital ratio (%) 15.3 14.5 13.1 11.4
Tier 1 leverage ratio (%) 10.1 9.3 8.3 7.7
Note: These projections represent hypothetical estimates that involve an economic outcome that is more adverse than expected. These estimates are not forecasts of capitalratios. The tables include the minimum ratios assuming the capital actions originally submitted in January 2014 by the BHCs in their annual capital plans and the minimumratios incorporating any adjustments to capital distributions made by BHCs after reviewing the Federal Reserve’s stress test projections and original planned capital distributionsfor those BHCs that did not make adjustments. The minimum capital ratios are for the period Q4 2013 to Q4 2015 and do not necessarily occur in the same quarter.
Required minimum capital ratios for advanced approaches BHCs in CCAR 2014
Regulatory ratio Q4 2013 2014 2015
Tier 1 common ratio 5 percent 5 percent 5 percent
Common equity tier 1 ratio N/A 4 percent 4.5 percent
Tier 1 risk-based capital ratio 4 percent 5.5 percent 6 percent
Total risk-based capital ratio 8 percent 8 percent 8 percent
Tier 1 leverage ratio 3 or 4 percent 4 percent 4 percent
Note: For purposes of CCAR 2014, an advanced approaches BHC includes any BHC that has consolidated assets greater than or equal to $250 billion or total consolidatedon-balance sheet foreign exposure of at least $10 billion as of December 31, 2013. See 12 CFR 217.100(b)(1); 12 CFR part 225, appendix G, section 1(b). Other BHCs includeany BHC that is subject to 12 CFR 225.8 and is not an advanced approaches BHC.
The tier 1 common ratio is to be calculated using the definitions of tier 1 capital and total risk-weighted assets as currently in effect in 2013. All other ratios are calculatedin accordance with the transition arrangements provided in the Board's revised capital framework, issued in July 2013.
March 2014 43

Table A.10.A. Citigroup Inc.
Actual Q3 2013 and projected minimum regulatory capital ratios and tier 1 common ratios,Q4 2013–Q4 2015Federal Reserve estimates in the severely adverse scenario
Projected capital ratios through Q4 2015 in the severely adverse scenario
ActualQ3 2013
Minimum stressed ratios with originalplanned capital actions
Minimum stressed ratios with adjustedplanned capital actions
Q4 2013 2014 2015 Q4 2013 2014 2015
Tier 1 common ratio (%) 12.7 9.5 7.1 6.5
Common equity tier 1 ratio (%) 10.8 9.1
Tier 1 capital ratio (%) 13.6 10.5 10.8 9.1
Total risk-based capital ratio (%) 16.7 13.5 13.4 11.6
Tier 1 leverage ratio (%) 8.1 6.2 6.6 5.6
Note: These projections represent hypothetical estimates that involve an economic outcome that is more adverse than expected. These estimates are not forecasts of capitalratios. The tables include the minimum ratios assuming the capital actions originally submitted in January 2014 by the BHCs in their annual capital plans and the minimumratios incorporating any adjustments to capital distributions made by BHCs after reviewing the Federal Reserve’s stress test projections and original planned capital distributionsfor those BHCs that did not make adjustments. The minimum capital ratios are for the period Q4 2013 to Q4 2015 and do not necessarily occur in the same quarter.
Required minimum capital ratios for advanced approaches BHCs in CCAR 2014
Regulatory ratio Q4 2013 2014 2015
Tier 1 common ratio 5 percent 5 percent 5 percent
Common equity tier 1 ratio N/A 4 percent 4.5 percent
Tier 1 risk-based capital ratio 4 percent 5.5 percent 6 percent
Total risk-based capital ratio 8 percent 8 percent 8 percent
Tier 1 leverage ratio 3 or 4 percent 4 percent 4 percent
Note: For purposes of CCAR 2014, an advanced approaches BHC includes any BHC that has consolidated assets greater than or equal to $250 billion or total consolidatedon-balance sheet foreign exposure of at least $10 billion as of December 31, 2013. See 12 CFR 217.100(b)(1); 12 CFR part 225, appendix G, section 1(b). Other BHCs includeany BHC that is subject to 12 CFR 225.8 and is not an advanced approaches BHC.
The tier 1 common ratio is to be calculated using the definitions of tier 1 capital and total risk-weighted assets as currently in effect in 2013. All other ratios are calculatedin accordance with the transition arrangements provided in the Board's revised capital framework, issued in July 2013.
44 CCAR 2014: Assessment Framework and Results

Table A.10.B. Citigroup Inc.
Actual Q3 2013 and projected minimum regulatory capital ratios and tier 1 common ratios,Q4 2013–Q4 2015Federal Reserve estimates in the adverse scenario
Projected capital ratios through Q4 2015 in the adverse scenario
ActualQ3 2013
Minimum stressed ratios with originalplanned capital actions
Minimum stressed ratios with adjustedplanned capital actions
Q4 2013 2014 2015 Q4 2013 2014 2015
Tier 1 common ratio (%) 12.7 10.4 9.3 9.3
Common equity tier 1 ratio (%) 12.5 10.8
Tier 1 capital ratio (%) 13.6 11.5 12.5 10.8
Total risk-based capital ratio (%) 16.7 14.5 15.1 13.2
Tier 1 leverage ratio (%) 8.1 6.6 7.2 6.6
Note: These projections represent hypothetical estimates that involve an economic outcome that is more adverse than expected. These estimates are not forecasts of capitalratios. The tables include the minimum ratios assuming the capital actions originally submitted in January 2014 by the BHCs in their annual capital plans and the minimumratios incorporating any adjustments to capital distributions made by BHCs after reviewing the Federal Reserve’s stress test projections and original planned capital distributionsfor those BHCs that did not make adjustments. The minimum capital ratios are for the period Q4 2013 to Q4 2015 and do not necessarily occur in the same quarter.
Required minimum capital ratios for advanced approaches BHCs in CCAR 2014
Regulatory ratio Q4 2013 2014 2015
Tier 1 common ratio 5 percent 5 percent 5 percent
Common equity tier 1 ratio N/A 4 percent 4.5 percent
Tier 1 risk-based capital ratio 4 percent 5.5 percent 6 percent
Total risk-based capital ratio 8 percent 8 percent 8 percent
Tier 1 leverage ratio 3 or 4 percent 4 percent 4 percent
Note: For purposes of CCAR 2014, an advanced approaches BHC includes any BHC that has consolidated assets greater than or equal to $250 billion or total consolidatedon-balance sheet foreign exposure of at least $10 billion as of December 31, 2013. See 12 CFR 217.100(b)(1); 12 CFR part 225, appendix G, section 1(b). Other BHCs includeany BHC that is subject to 12 CFR 225.8 and is not an advanced approaches BHC.
The tier 1 common ratio is to be calculated using the definitions of tier 1 capital and total risk-weighted assets as currently in effect in 2013. All other ratios are calculatedin accordance with the transition arrangements provided in the Board's revised capital framework, issued in July 2013.
March 2014 45

Table A.11.A. Comerica Incorporated
Actual Q3 2013 and projected minimum regulatory capital ratios and tier 1 common ratios,Q4 2013–Q4 2015Federal Reserve estimates in the severely adverse scenario
Projected capital ratios through Q4 2015 in the severely adverse scenario
ActualQ3 2013
Minimum stressed ratios with originalplanned capital actions
Minimum stressed ratios with adjustedplanned capital actions
Q4 2013 2014 2015 Q4 2013 2014 2015
Tier 1 common ratio (%) 10.7 10.3 9.0 7.8
Common equity tier 1 ratio (%) 7.6
Tier 1 capital ratio (%) 10.7 10.3 9.0 7.6
Total risk-based capital ratio (%) 13.4 13.0 11.3 10.1
Tier 1 leverage ratio (%) 10.9 10.4 9.0 7.8
Note: These projections represent hypothetical estimates that involve an economic outcome that is more adverse than expected. These estimates are not forecasts of capitalratios. The tables include the minimum ratios assuming the capital actions originally submitted in January 2014 by the BHCs in their annual capital plans and the minimumratios incorporating any adjustments to capital distributions made by BHCs after reviewing the Federal Reserve’s stress test projections and original planned capital distributionsfor those BHCs that did not make adjustments. The minimum capital ratios are for the period Q4 2013 to Q4 2015 and do not necessarily occur in the same quarter.
Required minimum capital ratios for other BHCs in CCAR 2014
Regulatory ratio Q4 2013 2014 2015
Tier 1 common ratio 5 percent 5 percent 5 percent
Common equity tier 1 ratio N/A N/A 4.5 percent
Tier 1 risk-based capital ratio 4 percent 4 percent 6 percent
Total risk-based capital ratio 8 percent 8 percent 8 percent
Tier 1 leverage ratio 3 or 4 percent 3 or 4 percent 4 percent
Note: For purposes of CCAR 2014, an advanced approaches BHC includes any BHC that has consolidated assets greater than or equal to $250 billion or total consolidatedon-balance sheet foreign exposure of at least $10 billion as of December 31, 2013. See 12 CFR 217.100(b)(1); 12 CFR part 225, appendix G, section 1(b). Other BHCs includeany BHC that is subject to 12 CFR 225.8 and is not an advanced approaches BHC.
The tier 1 common ratio is to be calculated using the definitions of tier 1 capital and total risk-weighted assets as currently in effect in 2013. All other ratios are calculatedin accordance with the transition arrangements provided in the Board's revised capital framework, issued in July 2013.
46 CCAR 2014: Assessment Framework and Results

Table A.11.B. Comerica Incorporated
Actual Q3 2013 and projected minimum regulatory capital ratios and tier 1 common ratios,Q4 2013–Q4 2015Federal Reserve estimates in the adverse scenario
Projected capital ratios through Q4 2015 in the adverse scenario
ActualQ3 2013
Minimum stressed ratios with originalplanned capital actions
Minimum stressed ratios with adjustedplanned capital actions
Q4 2013 2014 2015 Q4 2013 2014 2015
Tier 1 common ratio (%) 10.7 10.4 9.9 9.7
Common equity tier 1 ratio (%) 9.4
Tier 1 capital ratio (%) 10.7 10.4 9.9 9.4
Total risk-based capital ratio (%) 13.4 13.0 12.0 11.3
Tier 1 leverage ratio (%) 10.9 10.5 9.8 9.5
Note: These projections represent hypothetical estimates that involve an economic outcome that is more adverse than expected. These estimates are not forecasts of capitalratios. The tables include the minimum ratios assuming the capital actions originally submitted in January 2014 by the BHCs in their annual capital plans and the minimumratios incorporating any adjustments to capital distributions made by BHCs after reviewing the Federal Reserve’s stress test projections and original planned capital distributionsfor those BHCs that did not make adjustments. The minimum capital ratios are for the period Q4 2013 to Q4 2015 and do not necessarily occur in the same quarter.
Required minimum capital ratios for other BHCs in CCAR 2014
Regulatory ratio Q4 2013 2014 2015
Tier 1 common ratio 5 percent 5 percent 5 percent
Common equity tier 1 ratio N/A N/A 4.5 percent
Tier 1 risk-based capital ratio 4 percent 4 percent 6 percent
Total risk-based capital ratio 8 percent 8 percent 8 percent
Tier 1 leverage ratio 3 or 4 percent 3 or 4 percent 4 percent
Note: For purposes of CCAR 2014, an advanced approaches BHC includes any BHC that has consolidated assets greater than or equal to $250 billion or total consolidatedon-balance sheet foreign exposure of at least $10 billion as of December 31, 2013. See 12 CFR 217.100(b)(1); 12 CFR part 225, appendix G, section 1(b). Other BHCs includeany BHC that is subject to 12 CFR 225.8 and is not an advanced approaches BHC.
The tier 1 common ratio is to be calculated using the definitions of tier 1 capital and total risk-weighted assets as currently in effect in 2013. All other ratios are calculatedin accordance with the transition arrangements provided in the Board's revised capital framework, issued in July 2013.
March 2014 47

Table A.12.A. Discover Financial Services
Actual Q3 2013 and projected minimum regulatory capital ratios and tier 1 common ratios,Q4 2013–Q4 2015Federal Reserve estimates in the severely adverse scenario
Projected capital ratios through Q4 2015 in the severely adverse scenario
ActualQ3 2013
Minimum stressed ratios with originalplanned capital actions
Minimum stressed ratios with adjustedplanned capital actions
Q4 2013 2014 2015 Q4 2013 2014 2015
Tier 1 common ratio (%) 14.7 13.6 10.7 8.7
Common equity tier 1 ratio (%) 8.4
Tier 1 capital ratio (%) 15.6 14.5 11.5 9.2
Total risk-based capital ratio (%) 17.9 16.8 13.9 11.2
Tier 1 leverage ratio (%) 13.7 12.6 9.7 8.0
Note: These projections represent hypothetical estimates that involve an economic outcome that is more adverse than expected. These estimates are not forecasts of capitalratios. The tables include the minimum ratios assuming the capital actions originally submitted in January 2014 by the BHCs in their annual capital plans and the minimumratios incorporating any adjustments to capital distributions made by BHCs after reviewing the Federal Reserve’s stress test projections and original planned capital distributionsfor those BHCs that did not make adjustments. The minimum capital ratios are for the period Q4 2013 to Q4 2015 and do not necessarily occur in the same quarter.
Required minimum capital ratios for other BHCs in CCAR 2014
Regulatory ratio Q4 2013 2014 2015
Tier 1 common ratio 5 percent 5 percent 5 percent
Common equity tier 1 ratio N/A N/A 4.5 percent
Tier 1 risk-based capital ratio 4 percent 4 percent 6 percent
Total risk-based capital ratio 8 percent 8 percent 8 percent
Tier 1 leverage ratio 3 or 4 percent 3 or 4 percent 4 percent
Note: For purposes of CCAR 2014, an advanced approaches BHC includes any BHC that has consolidated assets greater than or equal to $250 billion or total consolidatedon-balance sheet foreign exposure of at least $10 billion as of December 31, 2013. See 12 CFR 217.100(b)(1); 12 CFR part 225, appendix G, section 1(b). Other BHCs includeany BHC that is subject to 12 CFR 225.8 and is not an advanced approaches BHC.
The tier 1 common ratio is to be calculated using the definitions of tier 1 capital and total risk-weighted assets as currently in effect in 2013. All other ratios are calculatedin accordance with the transition arrangements provided in the Board's revised capital framework, issued in July 2013.
48 CCAR 2014: Assessment Framework and Results

Table A.12.B. Discover Financial Services
Actual Q3 2013 and projected minimum regulatory capital ratios and tier 1 common ratios,Q4 2013–Q4 2015Federal Reserve estimates in the adverse scenario
Projected capital ratios through Q4 2015 in the adverse scenario
ActualQ3 2013
Minimum stressed ratios with originalplanned capital actions
Minimum stressed ratios with adjustedplanned capital actions
Q4 2013 2014 2015 Q4 2013 2014 2015
Tier 1 common ratio (%) 14.7 13.9 12.1 11.0
Common equity tier 1 ratio (%) 10.7
Tier 1 capital ratio (%) 15.6 14.7 12.9 11.5
Total risk-based capital ratio (%) 17.9 17.1 15.2 13.4
Tier 1 leverage ratio (%) 13.7 12.9 10.9 9.8
Note: These projections represent hypothetical estimates that involve an economic outcome that is more adverse than expected. These estimates are not forecasts of capitalratios. The tables include the minimum ratios assuming the capital actions originally submitted in January 2014 by the BHCs in their annual capital plans and the minimumratios incorporating any adjustments to capital distributions made by BHCs after reviewing the Federal Reserve’s stress test projections and original planned capital distributionsfor those BHCs that did not make adjustments. The minimum capital ratios are for the period Q4 2013 to Q4 2015 and do not necessarily occur in the same quarter.
Required minimum capital ratios for other BHCs in CCAR 2014
Regulatory ratio Q4 2013 2014 2015
Tier 1 common ratio 5 percent 5 percent 5 percent
Common equity tier 1 ratio N/A N/A 4.5 percent
Tier 1 risk-based capital ratio 4 percent 4 percent 6 percent
Total risk-based capital ratio 8 percent 8 percent 8 percent
Tier 1 leverage ratio 3 or 4 percent 3 or 4 percent 4 percent
Note: For purposes of CCAR 2014, an advanced approaches BHC includes any BHC that has consolidated assets greater than or equal to $250 billion or total consolidatedon-balance sheet foreign exposure of at least $10 billion as of December 31, 2013. See 12 CFR 217.100(b)(1); 12 CFR part 225, appendix G, section 1(b). Other BHCs includeany BHC that is subject to 12 CFR 225.8 and is not an advanced approaches BHC.
The tier 1 common ratio is to be calculated using the definitions of tier 1 capital and total risk-weighted assets as currently in effect in 2013. All other ratios are calculatedin accordance with the transition arrangements provided in the Board's revised capital framework, issued in July 2013.
March 2014 49

Table A.13.A. Fifth Third Bancorp
Actual Q3 2013 and projected minimum regulatory capital ratios and tier 1 common ratios,Q4 2013–Q4 2015Federal Reserve estimates in the severely adverse scenario
Projected capital ratios through Q4 2015 in the severely adverse scenario
ActualQ3 2013
Minimum stressed ratios with originalplanned capital actions
Minimum stressed ratios with adjustedplanned capital actions
Q4 2013 2014 2015 Q4 2013 2014 2015
Tier 1 common ratio (%) 9.9 9.1 8.0 7.5
Common equity tier 1 ratio (%) 6.9
Tier 1 capital ratio (%) 11.1 10.1 9.2 8.0
Total risk-based capital ratio (%) 14.3 14.1 12.7 11.1
Tier 1 leverage ratio (%) 10.6 9.5 8.6 7.8
Note: These projections represent hypothetical estimates that involve an economic outcome that is more adverse than expected. These estimates are not forecasts of capitalratios. The tables include the minimum ratios assuming the capital actions originally submitted in January 2014 by the BHCs in their annual capital plans and the minimumratios incorporating any adjustments to capital distributions made by BHCs after reviewing the Federal Reserve’s stress test projections and original planned capital distributionsfor those BHCs that did not make adjustments. The minimum capital ratios are for the period Q4 2013 to Q4 2015 and do not necessarily occur in the same quarter.
Required minimum capital ratios for other BHCs in CCAR 2014
Regulatory ratio Q4 2013 2014 2015
Tier 1 common ratio 5 percent 5 percent 5 percent
Common equity tier 1 ratio N/A N/A 4.5 percent
Tier 1 risk-based capital ratio 4 percent 4 percent 6 percent
Total risk-based capital ratio 8 percent 8 percent 8 percent
Tier 1 leverage ratio 3 or 4 percent 3 or 4 percent 4 percent
Note: For purposes of CCAR 2014, an advanced approaches BHC includes any BHC that has consolidated assets greater than or equal to $250 billion or total consolidatedon-balance sheet foreign exposure of at least $10 billion as of December 31, 2013. See 12 CFR 217.100(b)(1); 12 CFR part 225, appendix G, section 1(b). Other BHCs includeany BHC that is subject to 12 CFR 225.8 and is not an advanced approaches BHC.
The tier 1 common ratio is to be calculated using the definitions of tier 1 capital and total risk-weighted assets as currently in effect in 2013. All other ratios are calculatedin accordance with the transition arrangements provided in the Board's revised capital framework, issued in July 2013.
50 CCAR 2014: Assessment Framework and Results

Table A.13.B. Fifth Third Bancorp
Actual Q3 2013 and projected minimum regulatory capital ratios and tier 1 common ratios,Q4 2013–Q4 2015Federal Reserve estimates in the adverse scenario
Projected capital ratios through Q4 2015 in the adverse scenario
ActualQ3 2013
Minimum stressed ratios with originalplanned capital actions
Minimum stressed ratios with adjustedplanned capital actions
Q4 2013 2014 2015 Q4 2013 2014 2015
Tier 1 common ratio (%) 9.9 9.3 8.9 8.9
Common equity tier 1 ratio (%) 8.4
Tier 1 capital ratio (%) 11.1 10.3 9.9 9.5
Total risk-based capital ratio (%) 14.3 13.9 13.0 12.1
Tier 1 leverage ratio (%) 10.6 9.6 9.3 9.3
Note: These projections represent hypothetical estimates that involve an economic outcome that is more adverse than expected. These estimates are not forecasts of capitalratios. The tables include the minimum ratios assuming the capital actions originally submitted in January 2014 by the BHCs in their annual capital plans and the minimumratios incorporating any adjustments to capital distributions made by BHCs after reviewing the Federal Reserve’s stress test projections and original planned capital distributionsfor those BHCs that did not make adjustments. The minimum capital ratios are for the period Q4 2013 to Q4 2015 and do not necessarily occur in the same quarter.
Required minimum capital ratios for other BHCs in CCAR 2014
Regulatory ratio Q4 2013 2014 2015
Tier 1 common ratio 5 percent 5 percent 5 percent
Common equity tier 1 ratio N/A N/A 4.5 percent
Tier 1 risk-based capital ratio 4 percent 4 percent 6 percent
Total risk-based capital ratio 8 percent 8 percent 8 percent
Tier 1 leverage ratio 3 or 4 percent 3 or 4 percent 4 percent
Note: For purposes of CCAR 2014, an advanced approaches BHC includes any BHC that has consolidated assets greater than or equal to $250 billion or total consolidatedon-balance sheet foreign exposure of at least $10 billion as of December 31, 2013. See 12 CFR 217.100(b)(1); 12 CFR part 225, appendix G, section 1(b). Other BHCs includeany BHC that is subject to 12 CFR 225.8 and is not an advanced approaches BHC.
The tier 1 common ratio is to be calculated using the definitions of tier 1 capital and total risk-weighted assets as currently in effect in 2013. All other ratios are calculatedin accordance with the transition arrangements provided in the Board's revised capital framework, issued in July 2013.
March 2014 51

Table A.14.A. The Goldman Sachs Group, Inc.
Actual Q3 2013 and projected minimum regulatory capital ratios and tier 1 common ratios,Q4 2013–Q4 2015Federal Reserve estimates in the severely adverse scenario
Projected capital ratios through Q4 2015 in the severely adverse scenario
ActualQ3 2013
Minimum stressed ratios with originalplanned capital actions
Minimum stressed ratios with adjustedplanned capital actions
Q4 2013 2014 2015 Q4 2013 2014 2015
Tier 1 common ratio (%) 14.2 8.3 5.7 5.8 8.3 6.1 6.2
Common equity tier 1 ratio (%) 7.5 5.0 7.8 5.6
Tier 1 capital ratio (%) 16.3 10.3 8.2 6.0 10.3 8.6 6.4
Total risk-based capital ratio (%) 19.4 13.4 10.7 8.0 13.4 11.0 8.4
Tier 1 leverage ratio (%) 7.9 5.1 4.4 3.9 5.1 4.5 4.2
Note: These projections represent hypothetical estimates that involve an economic outcome that is more adverse than expected. These estimates are not forecasts of capitalratios. The tables include the minimum ratios assuming the capital actions originally submitted in January 2014 by the BHCs in their annual capital plans and the minimumratios incorporating any adjustments to capital distributions made by BHCs after reviewing the Federal Reserve’s stress test projections and original planned capital distributionsfor those BHCs that did not make adjustments. The minimum capital ratios are for the period Q4 2013 to Q4 2015 and do not necessarily occur in the same quarter.
Required minimum capital ratios for advanced approaches BHCs in CCAR 2014
Regulatory ratio Q4 2013 2014 2015
Tier 1 common ratio 5 percent 5 percent 5 percent
Common equity tier 1 ratio N/A 4 percent 4.5 percent
Tier 1 risk-based capital ratio 4 percent 5.5 percent 6 percent
Total risk-based capital ratio 8 percent 8 percent 8 percent
Tier 1 leverage ratio 3 or 4 percent 4 percent 4 percent
Note: For purposes of CCAR 2014, an advanced approaches BHC includes any BHC that has consolidated assets greater than or equal to $250 billion or total consolidatedon-balance sheet foreign exposure of at least $10 billion as of December 31, 2013. See 12 CFR 217.100(b)(1); 12 CFR part 225, appendix G, section 1(b). Other BHCs includeany BHC that is subject to 12 CFR 225.8 and is not an advanced approaches BHC.
The tier 1 common ratio is to be calculated using the definitions of tier 1 capital and total risk-weighted assets as currently in effect in 2013. All other ratios are calculatedin accordance with the transition arrangements provided in the Board's revised capital framework, issued in July 2013.
52 CCAR 2014: Assessment Framework and Results

Table A.14.B. The Goldman Sachs Group, Inc.
Actual Q3 2013 and projected minimum regulatory capital ratios and tier 1 common ratios,Q4 2013–Q4 2015Federal Reserve estimates in the adverse scenario
Projected capital ratios through Q4 2015 in the adverse scenario
ActualQ3 2013
Minimum stressed ratios with originalplanned capital actions
Minimum stressed ratios with adjustedplanned capital actions
Q4 2013 2014 2015 Q4 2013 2014 2015
Tier 1 common ratio (%) 14.2 10.2 8.1 7.2 10.2 8.5 8.0
Common equity tier 1 ratio (%) 9.7 5.8 10.1 6.5
Tier 1 capital ratio (%) 16.3 12.4 11.1 7.1 12.4 11.5 7.8
Total risk-based capital ratio (%) 19.4 15.5 13.8 9.2 15.5 14.2 9.9
Tier 1 leverage ratio (%) 7.9 5.9 5.2 4.4 5.9 5.4 4.8
Note: These projections represent hypothetical estimates that involve an economic outcome that is more adverse than expected. These estimates are not forecasts of capitalratios. The tables include the minimum ratios assuming the capital actions originally submitted in January 2014 by the BHCs in their annual capital plans and the minimumratios incorporating any adjustments to capital distributions made by BHCs after reviewing the Federal Reserve’s stress test projections and original planned capital distributionsfor those BHCs that did not make adjustments. The minimum capital ratios are for the period Q4 2013 to Q4 2015 and do not necessarily occur in the same quarter.
Required minimum capital ratios for advanced approaches BHCs in CCAR 2014
Regulatory ratio Q4 2013 2014 2015
Tier 1 common ratio 5 percent 5 percent 5 percent
Common equity tier 1 ratio N/A 4 percent 4.5 percent
Tier 1 risk-based capital ratio 4 percent 5.5 percent 6 percent
Total risk-based capital ratio 8 percent 8 percent 8 percent
Tier 1 leverage ratio 3 or 4 percent 4 percent 4 percent
Note: For purposes of CCAR 2014, an advanced approaches BHC includes any BHC that has consolidated assets greater than or equal to $250 billion or total consolidatedon-balance sheet foreign exposure of at least $10 billion as of December 31, 2013. See 12 CFR 217.100(b)(1); 12 CFR part 225, appendix G, section 1(b). Other BHCs includeany BHC that is subject to 12 CFR 225.8 and is not an advanced approaches BHC.
The tier 1 common ratio is to be calculated using the definitions of tier 1 capital and total risk-weighted assets as currently in effect in 2013. All other ratios are calculatedin accordance with the transition arrangements provided in the Board's revised capital framework, issued in July 2013.
March 2014 53

Table A.15.A. HSBC North America Holdings Inc.
Actual Q3 2013 and projected minimum regulatory capital ratios and tier 1 common ratios,Q4 2013–Q4 2015Federal Reserve estimates in the severely adverse scenario
Projected capital ratios through Q4 2015 in the severely adverse scenario
ActualQ3 2013
Minimum stressed ratios with originalplanned capital actions
Minimum stressed ratios with adjustedplanned capital actions
Q4 2013 2014 2015 Q4 2013 2014 2015
Tier 1 common ratio (%) 14.7 12.7 8.5 6.6
Common equity tier 1 ratio (%) 12.6 9.4
Tier 1 capital ratio (%) 17.1 15.6 12.6 9.4
Total risk-based capital ratio (%) 26.5 24.6 22.0 18.2
Tier 1 leverage ratio (%) 7.8 6.9 5.7 4.4
Note: These projections represent hypothetical estimates that involve an economic outcome that is more adverse than expected. These estimates are not forecasts of capitalratios. The tables include the minimum ratios assuming the capital actions originally submitted in January 2014 by the BHCs in their annual capital plans and the minimumratios incorporating any adjustments to capital distributions made by BHCs after reviewing the Federal Reserve’s stress test projections and original planned capital distributionsfor those BHCs that did not make adjustments. The minimum capital ratios are for the period Q4 2013 to Q4 2015 and do not necessarily occur in the same quarter.
Required minimum capital ratios for advanced approaches BHCs in CCAR 2014
Regulatory ratio Q4 2013 2014 2015
Tier 1 common ratio 5 percent 5 percent 5 percent
Common equity tier 1 ratio N/A 4 percent 4.5 percent
Tier 1 risk-based capital ratio 4 percent 5.5 percent 6 percent
Total risk-based capital ratio 8 percent 8 percent 8 percent
Tier 1 leverage ratio 3 or 4 percent 4 percent 4 percent
Note: For purposes of CCAR 2014, an advanced approaches BHC includes any BHC that has consolidated assets greater than or equal to $250 billion or total consolidatedon-balance sheet foreign exposure of at least $10 billion as of December 31, 2013. See 12 CFR 217.100(b)(1); 12 CFR part 225, appendix G, section 1(b). Other BHCs includeany BHC that is subject to 12 CFR 225.8 and is not an advanced approaches BHC.
The tier 1 common ratio is to be calculated using the definitions of tier 1 capital and total risk-weighted assets as currently in effect in 2013. All other ratios are calculatedin accordance with the transition arrangements provided in the Board's revised capital framework, issued in July 2013.
54 CCAR 2014: Assessment Framework and Results

Table A.15.B. HSBC North America Holdings Inc.
Actual Q3 2013 and projected minimum regulatory capital ratios and tier 1 common ratios,Q4 2013–Q4 2015Federal Reserve estimates in the adverse scenario
Projected capital ratios through Q4 2015 in the adverse scenario
ActualQ3 2013
Minimum stressed ratios with originalplanned capital actions
Minimum stressed ratios with adjustedplanned capital actions
Q4 2013 2014 2015 Q4 2013 2014 2015
Tier 1 common ratio (%) 14.7 13.4 11.3 11.1
Common equity tier 1 ratio (%) 13.6 11.6
Tier 1 capital ratio (%) 17.1 16.3 14.2 12.2
Total risk-based capital ratio (%) 26.5 25.3 23.5 20.7
Tier 1 leverage ratio (%) 7.8 7.2 6.3 5.6
Note: These projections represent hypothetical estimates that involve an economic outcome that is more adverse than expected. These estimates are not forecasts of capitalratios. The tables include the minimum ratios assuming the capital actions originally submitted in January 2014 by the BHCs in their annual capital plans and the minimumratios incorporating any adjustments to capital distributions made by BHCs after reviewing the Federal Reserve’s stress test projections and original planned capital distributionsfor those BHCs that did not make adjustments. The minimum capital ratios are for the period Q4 2013 to Q4 2015 and do not necessarily occur in the same quarter.
Required minimum capital ratios for advanced approaches BHCs in CCAR 2014
Regulatory ratio Q4 2013 2014 2015
Tier 1 common ratio 5 percent 5 percent 5 percent
Common equity tier 1 ratio N/A 4 percent 4.5 percent
Tier 1 risk-based capital ratio 4 percent 5.5 percent 6 percent
Total risk-based capital ratio 8 percent 8 percent 8 percent
Tier 1 leverage ratio 3 or 4 percent 4 percent 4 percent
Note: For purposes of CCAR 2014, an advanced approaches BHC includes any BHC that has consolidated assets greater than or equal to $250 billion or total consolidatedon-balance sheet foreign exposure of at least $10 billion as of December 31, 2013. See 12 CFR 217.100(b)(1); 12 CFR part 225, appendix G, section 1(b). Other BHCs includeany BHC that is subject to 12 CFR 225.8 and is not an advanced approaches BHC.
The tier 1 common ratio is to be calculated using the definitions of tier 1 capital and total risk-weighted assets as currently in effect in 2013. All other ratios are calculatedin accordance with the transition arrangements provided in the Board's revised capital framework, issued in July 2013.
March 2014 55

Table A.16.A. Huntington Bancshares Incorporated
Actual Q3 2013 and projected minimum regulatory capital ratios and tier 1 common ratios,Q4 2013–Q4 2015Federal Reserve estimates in the severely adverse scenario
Projected capital ratios through Q4 2015 in the severely adverse scenario
ActualQ3 2013
Minimum stressed ratios with originalplanned capital actions
Minimum stressed ratios with adjustedplanned capital actions
Q4 2013 2014 2015 Q4 2013 2014 2015
Tier 1 common ratio (%) 10.9 9.8 7.4 6.0
Common equity tier 1 ratio (%) 6.6
Tier 1 capital ratio (%) 12.4 11.2 8.7 7.2
Total risk-based capital ratio (%) 14.7 13.5 10.9 9.5
Tier 1 leverage ratio (%) 10.9 9.7 7.5 6.4
Note: These projections represent hypothetical estimates that involve an economic outcome that is more adverse than expected. These estimates are not forecasts of capitalratios. The tables include the minimum ratios assuming the capital actions originally submitted in January 2014 by the BHCs in their annual capital plans and the minimumratios incorporating any adjustments to capital distributions made by BHCs after reviewing the Federal Reserve’s stress test projections and original planned capital distributionsfor those BHCs that did not make adjustments. The minimum capital ratios are for the period Q4 2013 to Q4 2015 and do not necessarily occur in the same quarter.
Required minimum capital ratios for other BHCs in CCAR 2014
Regulatory ratio Q4 2013 2014 2015
Tier 1 common ratio 5 percent 5 percent 5 percent
Common equity tier 1 ratio N/A N/A 4.5 percent
Tier 1 risk-based capital ratio 4 percent 4 percent 6 percent
Total risk-based capital ratio 8 percent 8 percent 8 percent
Tier 1 leverage ratio 3 or 4 percent 3 or 4 percent 4 percent
Note: For purposes of CCAR 2014, an advanced approaches BHC includes any BHC that has consolidated assets greater than or equal to $250 billion or total consolidatedon-balance sheet foreign exposure of at least $10 billion as of December 31, 2013. See 12 CFR 217.100(b)(1); 12 CFR part 225, appendix G, section 1(b). Other BHCs includeany BHC that is subject to 12 CFR 225.8 and is not an advanced approaches BHC.
The tier 1 common ratio is to be calculated using the definitions of tier 1 capital and total risk-weighted assets as currently in effect in 2013. All other ratios are calculatedin accordance with the transition arrangements provided in the Board's revised capital framework, issued in July 2013.
56 CCAR 2014: Assessment Framework and Results

Table A.16.B. Huntington Bancshares Incorporated
Actual Q3 2013 and projected minimum regulatory capital ratios and tier 1 common ratios,Q4 2013–Q4 2015Federal Reserve estimates in the adverse scenario
Projected capital ratios through Q4 2015 in the adverse scenario
ActualQ3 2013
Minimum stressed ratios with originalplanned capital actions
Minimum stressed ratios with adjustedplanned capital actions
Q4 2013 2014 2015 Q4 2013 2014 2015
Tier 1 common ratio (%) 10.9 10.0 9.0 8.6
Common equity tier 1 ratio (%) 8.3
Tier 1 capital ratio (%) 12.4 11.4 10.4 9.2
Total risk-based capital ratio (%) 14.7 13.8 12.5 11.5
Tier 1 leverage ratio (%) 10.9 9.9 8.9 8.1
Note: These projections represent hypothetical estimates that involve an economic outcome that is more adverse than expected. These estimates are not forecasts of capitalratios. The tables include the minimum ratios assuming the capital actions originally submitted in January 2014 by the BHCs in their annual capital plans and the minimumratios incorporating any adjustments to capital distributions made by BHCs after reviewing the Federal Reserve’s stress test projections and original planned capital distributionsfor those BHCs that did not make adjustments. The minimum capital ratios are for the period Q4 2013 to Q4 2015 and do not necessarily occur in the same quarter.
Required minimum capital ratios for other BHCs in CCAR 2014
Regulatory ratio Q4 2013 2014 2015
Tier 1 common ratio 5 percent 5 percent 5 percent
Common equity tier 1 ratio N/A N/A 4.5 percent
Tier 1 risk-based capital ratio 4 percent 4 percent 6 percent
Total risk-based capital ratio 8 percent 8 percent 8 percent
Tier 1 leverage ratio 3 or 4 percent 3 or 4 percent 4 percent
Note: For purposes of CCAR 2014, an advanced approaches BHC includes any BHC that has consolidated assets greater than or equal to $250 billion or total consolidatedon-balance sheet foreign exposure of at least $10 billion as of December 31, 2013. See 12 CFR 217.100(b)(1); 12 CFR part 225, appendix G, section 1(b). Other BHCs includeany BHC that is subject to 12 CFR 225.8 and is not an advanced approaches BHC.
The tier 1 common ratio is to be calculated using the definitions of tier 1 capital and total risk-weighted assets as currently in effect in 2013. All other ratios are calculatedin accordance with the transition arrangements provided in the Board's revised capital framework, issued in July 2013.
March 2014 57

Table A.17.A. JPMorgan Chase & Co.
Actual Q3 2013 and projected minimum regulatory capital ratios and tier 1 common ratios,Q4 2013–Q4 2015Federal Reserve estimates in the severely adverse scenario
Projected capital ratios through Q4 2015 in the severely adverse scenario
ActualQ3 2013
Minimum stressed ratios with originalplanned capital actions
Minimum stressed ratios with adjustedplanned capital actions
Q4 2013 2014 2015 Q4 2013 2014 2015
Tier 1 common ratio (%) 10.5 8.0 5.8 5.5
Common equity tier 1 ratio (%) 6.9 5.4
Tier 1 capital ratio (%) 11.7 9.2 8.1 6.6
Total risk-based capital ratio (%) 14.3 11.7 10.4 8.7
Tier 1 leverage ratio (%) 6.9 5.5 5.0 4.2
Note: These projections represent hypothetical estimates that involve an economic outcome that is more adverse than expected. These estimates are not forecasts of capitalratios. The tables include the minimum ratios assuming the capital actions originally submitted in January 2014 by the BHCs in their annual capital plans and the minimumratios incorporating any adjustments to capital distributions made by BHCs after reviewing the Federal Reserve’s stress test projections and original planned capital distributionsfor those BHCs that did not make adjustments. The minimum capital ratios are for the period Q4 2013 to Q4 2015 and do not necessarily occur in the same quarter.
Required minimum capital ratios for advanced approaches BHCs in CCAR 2014
Regulatory ratio Q4 2013 2014 2015
Tier 1 common ratio 5 percent 5 percent 5 percent
Common equity tier 1 ratio N/A 4 percent 4.5 percent
Tier 1 risk-based capital ratio 4 percent 5.5 percent 6 percent
Total risk-based capital ratio 8 percent 8 percent 8 percent
Tier 1 leverage ratio 3 or 4 percent 4 percent 4 percent
Note: For purposes of CCAR 2014, an advanced approaches BHC includes any BHC that has consolidated assets greater than or equal to $250 billion or total consolidatedon-balance sheet foreign exposure of at least $10 billion as of December 31, 2013. See 12 CFR 217.100(b)(1); 12 CFR part 225, appendix G, section 1(b). Other BHCs includeany BHC that is subject to 12 CFR 225.8 and is not an advanced approaches BHC.
The tier 1 common ratio is to be calculated using the definitions of tier 1 capital and total risk-weighted assets as currently in effect in 2013. All other ratios are calculatedin accordance with the transition arrangements provided in the Board's revised capital framework, issued in July 2013.
58 CCAR 2014: Assessment Framework and Results

Table A.17.B. JPMorgan Chase & Co.
Actual Q3 2013 and projected minimum regulatory capital ratios and tier 1 common ratios,Q4 2013–Q4 2015Federal Reserve estimates in the adverse scenario
Projected capital ratios through Q4 2015 in the adverse scenario
ActualQ3 2013
Minimum stressed ratios with originalplanned capital actions
Minimum stressed ratios with adjustedplanned capital actions
Q4 2013 2014 2015 Q4 2013 2014 2015
Tier 1 common ratio (%) 10.5 9.3 8.4 8.3
Common equity tier 1 ratio (%) 8.3 7.1
Tier 1 capital ratio (%) 11.7 10.5 9.6 8.4
Total risk-based capital ratio (%) 14.3 13.0 11.9 10.5
Tier 1 leverage ratio (%) 6.9 6.2 5.7 5.4
Note: These projections represent hypothetical estimates that involve an economic outcome that is more adverse than expected. These estimates are not forecasts of capitalratios. The tables include the minimum ratios assuming the capital actions originally submitted in January 2014 by the BHCs in their annual capital plans and the minimumratios incorporating any adjustments to capital distributions made by BHCs after reviewing the Federal Reserve’s stress test projections and original planned capital distributionsfor those BHCs that did not make adjustments. The minimum capital ratios are for the period Q4 2013 to Q4 2015 and do not necessarily occur in the same quarter.
Required minimum capital ratios for advanced approaches BHCs in CCAR 2014
Regulatory ratio Q4 2013 2014 2015
Tier 1 common ratio 5 percent 5 percent 5 percent
Common equity tier 1 ratio N/A 4 percent 4.5 percent
Tier 1 risk-based capital ratio 4 percent 5.5 percent 6 percent
Total risk-based capital ratio 8 percent 8 percent 8 percent
Tier 1 leverage ratio 3 or 4 percent 4 percent 4 percent
Note: For purposes of CCAR 2014, an advanced approaches BHC includes any BHC that has consolidated assets greater than or equal to $250 billion or total consolidatedon-balance sheet foreign exposure of at least $10 billion as of December 31, 2013. See 12 CFR 217.100(b)(1); 12 CFR part 225, appendix G, section 1(b). Other BHCs includeany BHC that is subject to 12 CFR 225.8 and is not an advanced approaches BHC.
The tier 1 common ratio is to be calculated using the definitions of tier 1 capital and total risk-weighted assets as currently in effect in 2013. All other ratios are calculatedin accordance with the transition arrangements provided in the Board's revised capital framework, issued in July 2013.
March 2014 59

Table A.18.A. KeyCorp
Actual Q3 2013 and projected minimum regulatory capital ratios and tier 1 common ratios,Q4 2013–Q4 2015Federal Reserve estimates in the severely adverse scenario
Projected capital ratios through Q4 2015 in the severely adverse scenario
ActualQ3 2013
Minimum stressed ratios with originalplanned capital actions
Minimum stressed ratios with adjustedplanned capital actions
Q4 2013 2014 2015 Q4 2013 2014 2015
Tier 1 common ratio (%) 11.2 10.2 8.6 8.0
Common equity tier 1 ratio (%) 8.0
Tier 1 capital ratio (%) 11.9 10.9 9.3 8.3
Total risk-based capital ratio (%) 14.4 13.4 11.6 10.6
Tier 1 leverage ratio (%) 11.3 10.3 8.7 7.9
Note: These projections represent hypothetical estimates that involve an economic outcome that is more adverse than expected. These estimates are not forecasts of capitalratios. The tables include the minimum ratios assuming the capital actions originally submitted in January 2014 by the BHCs in their annual capital plans and the minimumratios incorporating any adjustments to capital distributions made by BHCs after reviewing the Federal Reserve’s stress test projections and original planned capital distributionsfor those BHCs that did not make adjustments. The minimum capital ratios are for the period Q4 2013 to Q4 2015 and do not necessarily occur in the same quarter.
Required minimum capital ratios for other BHCs in CCAR 2014
Regulatory ratio Q4 2013 2014 2015
Tier 1 common ratio 5 percent 5 percent 5 percent
Common equity tier 1 ratio N/A N/A 4.5 percent
Tier 1 risk-based capital ratio 4 percent 4 percent 6 percent
Total risk-based capital ratio 8 percent 8 percent 8 percent
Tier 1 leverage ratio 3 or 4 percent 3 or 4 percent 4 percent
Note: For purposes of CCAR 2014, an advanced approaches BHC includes any BHC that has consolidated assets greater than or equal to $250 billion or total consolidatedon-balance sheet foreign exposure of at least $10 billion as of December 31, 2013. See 12 CFR 217.100(b)(1); 12 CFR part 225, appendix G, section 1(b). Other BHCs includeany BHC that is subject to 12 CFR 225.8 and is not an advanced approaches BHC.
The tier 1 common ratio is to be calculated using the definitions of tier 1 capital and total risk-weighted assets as currently in effect in 2013. All other ratios are calculatedin accordance with the transition arrangements provided in the Board's revised capital framework, issued in July 2013.
60 CCAR 2014: Assessment Framework and Results

Table A.18.B. KeyCorp
Actual Q3 2013 and projected minimum regulatory capital ratios and tier 1 common ratios,Q4 2013–Q4 2015Federal Reserve estimates in the adverse scenario
Projected capital ratios through Q4 2015 in the adverse scenario
ActualQ3 2013
Minimum stressed ratios with originalplanned capital actions
Minimum stressed ratios with adjustedplanned capital actions
Q4 2013 2014 2015 Q4 2013 2014 2015
Tier 1 common ratio (%) 11.2 10.6 9.9 9.8
Common equity tier 1 ratio (%) 9.6
Tier 1 capital ratio (%) 11.9 11.3 10.6 10.0
Total risk-based capital ratio (%) 14.4 13.8 12.8 12.0
Tier 1 leverage ratio (%) 11.3 10.7 9.9 9.5
Note: These projections represent hypothetical estimates that involve an economic outcome that is more adverse than expected. These estimates are not forecasts of capitalratios. The tables include the minimum ratios assuming the capital actions originally submitted in January 2014 by the BHCs in their annual capital plans and the minimumratios incorporating any adjustments to capital distributions made by BHCs after reviewing the Federal Reserve’s stress test projections and original planned capital distributionsfor those BHCs that did not make adjustments. The minimum capital ratios are for the period Q4 2013 to Q4 2015 and do not necessarily occur in the same quarter.
Required minimum capital ratios for other BHCs in CCAR 2014
Regulatory ratio Q4 2013 2014 2015
Tier 1 common ratio 5 percent 5 percent 5 percent
Common equity tier 1 ratio N/A N/A 4.5 percent
Tier 1 risk-based capital ratio 4 percent 4 percent 6 percent
Total risk-based capital ratio 8 percent 8 percent 8 percent
Tier 1 leverage ratio 3 or 4 percent 3 or 4 percent 4 percent
Note: For purposes of CCAR 2014, an advanced approaches BHC includes any BHC that has consolidated assets greater than or equal to $250 billion or total consolidatedon-balance sheet foreign exposure of at least $10 billion as of December 31, 2013. See 12 CFR 217.100(b)(1); 12 CFR part 225, appendix G, section 1(b). Other BHCs includeany BHC that is subject to 12 CFR 225.8 and is not an advanced approaches BHC.
The tier 1 common ratio is to be calculated using the definitions of tier 1 capital and total risk-weighted assets as currently in effect in 2013. All other ratios are calculatedin accordance with the transition arrangements provided in the Board's revised capital framework, issued in July 2013.
March 2014 61

Table A.19.A. M&T Bank Corporation
Actual Q3 2013 and projected minimum regulatory capital ratios and tier 1 common ratios,Q4 2013–Q4 2015Federal Reserve estimates in the severely adverse scenario
Projected capital ratios through Q4 2015 in the severely adverse scenario
ActualQ3 2013
Minimum stressed ratios with originalplanned capital actions
Minimum stressed ratios with adjustedplanned capital actions
Q4 2013 2014 2015 Q4 2013 2014 2015
Tier 1 common ratio (%) 9.1 8.6 7.3 6.7
Common equity tier 1 ratio (%) 7.2
Tier 1 capital ratio (%) 11.9 11.3 9.6 8.7
Total risk-based capital ratio (%) 15.1 14.4 12.3 11.5
Tier 1 leverage ratio (%) 10.7 10.1 7.8 7.8
Note: These projections represent hypothetical estimates that involve an economic outcome that is more adverse than expected. These estimates are not forecasts of capitalratios. The tables include the minimum ratios assuming the capital actions originally submitted in January 2014 by the BHCs in their annual capital plans and the minimumratios incorporating any adjustments to capital distributions made by BHCs after reviewing the Federal Reserve’s stress test projections and original planned capital distributionsfor those BHCs that did not make adjustments. The minimum capital ratios are for the period Q4 2013 to Q4 2015 and do not necessarily occur in the same quarter.
Required minimum capital ratios for other BHCs in CCAR 2014
Regulatory ratio Q4 2013 2014 2015
Tier 1 common ratio 5 percent 5 percent 5 percent
Common equity tier 1 ratio N/A N/A 4.5 percent
Tier 1 risk-based capital ratio 4 percent 4 percent 6 percent
Total risk-based capital ratio 8 percent 8 percent 8 percent
Tier 1 leverage ratio 3 or 4 percent 3 or 4 percent 4 percent
Note: For purposes of CCAR 2014, an advanced approaches BHC includes any BHC that has consolidated assets greater than or equal to $250 billion or total consolidatedon-balance sheet foreign exposure of at least $10 billion as of December 31, 2013. See 12 CFR 217.100(b)(1); 12 CFR part 225, appendix G, section 1(b). Other BHCs includeany BHC that is subject to 12 CFR 225.8 and is not an advanced approaches BHC.
The tier 1 common ratio is to be calculated using the definitions of tier 1 capital and total risk-weighted assets as currently in effect in 2013. All other ratios are calculatedin accordance with the transition arrangements provided in the Board's revised capital framework, issued in July 2013.
62 CCAR 2014: Assessment Framework and Results

Table A.19.B. M&T Bank Corporation
Actual Q3 2013 and projected minimum regulatory capital ratios and tier 1 common ratios,Q4 2013–Q4 2015Federal Reserve estimates in the adverse scenario
Projected capital ratios through Q4 2015 in the adverse scenario
ActualQ3 2013
Minimum stressed ratios with originalplanned capital actions
Minimum stressed ratios with adjustedplanned capital actions
Q4 2013 2014 2015 Q4 2013 2014 2015
Tier 1 common ratio (%) 9.1 8.9 8.7 9.4
Common equity tier 1 ratio (%) 8.9
Tier 1 capital ratio (%) 11.9 11.7 11.5 10.5
Total risk-based capital ratio (%) 15.1 14.8 14.1 13.3
Tier 1 leverage ratio (%) 10.7 10.5 9.2 9.5
Note: These projections represent hypothetical estimates that involve an economic outcome that is more adverse than expected. These estimates are not forecasts of capitalratios. The tables include the minimum ratios assuming the capital actions originally submitted in January 2014 by the BHCs in their annual capital plans and the minimumratios incorporating any adjustments to capital distributions made by BHCs after reviewing the Federal Reserve’s stress test projections and original planned capital distributionsfor those BHCs that did not make adjustments. The minimum capital ratios are for the period Q4 2013 to Q4 2015 and do not necessarily occur in the same quarter.
Required minimum capital ratios for other BHCs in CCAR 2014
Regulatory ratio Q4 2013 2014 2015
Tier 1 common ratio 5 percent 5 percent 5 percent
Common equity tier 1 ratio N/A N/A 4.5 percent
Tier 1 risk-based capital ratio 4 percent 4 percent 6 percent
Total risk-based capital ratio 8 percent 8 percent 8 percent
Tier 1 leverage ratio 3 or 4 percent 3 or 4 percent 4 percent
Note: For purposes of CCAR 2014, an advanced approaches BHC includes any BHC that has consolidated assets greater than or equal to $250 billion or total consolidatedon-balance sheet foreign exposure of at least $10 billion as of December 31, 2013. See 12 CFR 217.100(b)(1); 12 CFR part 225, appendix G, section 1(b). Other BHCs includeany BHC that is subject to 12 CFR 225.8 and is not an advanced approaches BHC.
The tier 1 common ratio is to be calculated using the definitions of tier 1 capital and total risk-weighted assets as currently in effect in 2013. All other ratios are calculatedin accordance with the transition arrangements provided in the Board's revised capital framework, issued in July 2013.
March 2014 63

Table A.20.A. Morgan Stanley
Actual Q3 2013 and projected minimum regulatory capital ratios and tier 1 common ratios,Q4 2013–Q4 2015Federal Reserve estimates in the severely adverse scenario
Projected capital ratios through Q4 2015 in the severely adverse scenario
ActualQ3 2013
Minimum stressed ratios with originalplanned capital actions
Minimum stressed ratios with adjustedplanned capital actions
Q4 2013 2014 2015 Q4 2013 2014 2015
Tier 1 common ratio (%) 12.6 8.1 5.9 6.3
Common equity tier 1 ratio (%) 8.5 6.8
Tier 1 capital ratio (%) 15.3 10.8 8.8 7.2
Total risk-based capital ratio (%) 16.1 12.0 10.5 9.4
Tier 1 leverage ratio (%) 7.3 5.4 5.0 4.6
Note: These projections represent hypothetical estimates that involve an economic outcome that is more adverse than expected. These estimates are not forecasts of capitalratios. The tables include the minimum ratios assuming the capital actions originally submitted in January 2014 by the BHCs in their annual capital plans and the minimumratios incorporating any adjustments to capital distributions made by BHCs after reviewing the Federal Reserve’s stress test projections and original planned capital distributionsfor those BHCs that did not make adjustments. The minimum capital ratios are for the period Q4 2013 to Q4 2015 and do not necessarily occur in the same quarter.
Required minimum capital ratios for advanced approaches BHCs in CCAR 2014
Regulatory ratio Q4 2013 2014 2015
Tier 1 common ratio 5 percent 5 percent 5 percent
Common equity tier 1 ratio N/A 4 percent 4.5 percent
Tier 1 risk-based capital ratio 4 percent 5.5 percent 6 percent
Total risk-based capital ratio 8 percent 8 percent 8 percent
Tier 1 leverage ratio 3 or 4 percent 4 percent 4 percent
Note: For purposes of CCAR 2014, an advanced approaches BHC includes any BHC that has consolidated assets greater than or equal to $250 billion or total consolidatedon-balance sheet foreign exposure of at least $10 billion as of December 31, 2013. See 12 CFR 217.100(b)(1); 12 CFR part 225, appendix G, section 1(b). Other BHCs includeany BHC that is subject to 12 CFR 225.8 and is not an advanced approaches BHC.
The tier 1 common ratio is to be calculated using the definitions of tier 1 capital and total risk-weighted assets as currently in effect in 2013. All other ratios are calculatedin accordance with the transition arrangements provided in the Board's revised capital framework, issued in July 2013.
64 CCAR 2014: Assessment Framework and Results

Table A.20.B. Morgan Stanley
Actual Q3 2013 and projected minimum regulatory capital ratios and tier 1 common ratios,Q4 2013–Q4 2015Federal Reserve estimates in the adverse scenario
Projected capital ratios through Q4 2015 in the adverse scenario
ActualQ3 2013
Minimum stressed ratios with originalplanned capital actions
Minimum stressed ratios with adjustedplanned capital actions
Q4 2013 2014 2015 Q4 2013 2014 2015
Tier 1 common ratio (%) 12.6 9.8 8.6 8.5
Common equity tier 1 ratio (%) 10.9 8.0
Tier 1 capital ratio (%) 15.3 12.6 11.6 8.7
Total risk-based capital ratio (%) 16.1 13.9 13.8 11.0
Tier 1 leverage ratio (%) 7.3 5.9 5.5 4.9
Note: These projections represent hypothetical estimates that involve an economic outcome that is more adverse than expected. These estimates are not forecasts of capitalratios. The tables include the minimum ratios assuming the capital actions originally submitted in January 2014 by the BHCs in their annual capital plans and the minimumratios incorporating any adjustments to capital distributions made by BHCs after reviewing the Federal Reserve’s stress test projections and original planned capital distributionsfor those BHCs that did not make adjustments. The minimum capital ratios are for the period Q4 2013 to Q4 2015 and do not necessarily occur in the same quarter.
Required minimum capital ratios for advanced approaches BHCs in CCAR 2014
Regulatory ratio Q4 2013 2014 2015
Tier 1 common ratio 5 percent 5 percent 5 percent
Common equity tier 1 ratio N/A 4 percent 4.5 percent
Tier 1 risk-based capital ratio 4 percent 5.5 percent 6 percent
Total risk-based capital ratio 8 percent 8 percent 8 percent
Tier 1 leverage ratio 3 or 4 percent 4 percent 4 percent
Note: For purposes of CCAR 2014, an advanced approaches BHC includes any BHC that has consolidated assets greater than or equal to $250 billion or total consolidatedon-balance sheet foreign exposure of at least $10 billion as of December 31, 2013. See 12 CFR 217.100(b)(1); 12 CFR part 225, appendix G, section 1(b). Other BHCs includeany BHC that is subject to 12 CFR 225.8 and is not an advanced approaches BHC.
The tier 1 common ratio is to be calculated using the definitions of tier 1 capital and total risk-weighted assets as currently in effect in 2013. All other ratios are calculatedin accordance with the transition arrangements provided in the Board's revised capital framework, issued in July 2013.
March 2014 65

Table A.21.A. Northern Trust Corporation
Actual Q3 2013 and projected minimum regulatory capital ratios and tier 1 common ratios,Q4 2013–Q4 2015Federal Reserve estimates in the severely adverse scenario
Projected capital ratios through Q4 2015 in the severely adverse scenario
ActualQ3 2013
Minimum stressed ratios with originalplanned capital actions
Minimum stressed ratios with adjustedplanned capital actions
Q4 2013 2014 2015 Q4 2013 2014 2015
Tier 1 common ratio (%) 13.1 12.6 11.0 10.0
Common equity tier 1 ratio (%) 11.2 9.1
Tier 1 capital ratio (%) 13.6 13.1 11.4 9.2
Total risk-based capital ratio (%) 14.9 16.2 14.6 12.1
Tier 1 leverage ratio (%) 8.3 8.0 6.9 6.0
Note: These projections represent hypothetical estimates that involve an economic outcome that is more adverse than expected. These estimates are not forecasts of capitalratios. The tables include the minimum ratios assuming the capital actions originally submitted in January 2014 by the BHCs in their annual capital plans and the minimumratios incorporating any adjustments to capital distributions made by BHCs after reviewing the Federal Reserve’s stress test projections and original planned capital distributionsfor those BHCs that did not make adjustments. The minimum capital ratios are for the period Q4 2013 to Q4 2015 and do not necessarily occur in the same quarter.
Required minimum capital ratios for advanced approaches BHCs in CCAR 2014
Regulatory ratio Q4 2013 2014 2015
Tier 1 common ratio 5 percent 5 percent 5 percent
Common equity tier 1 ratio N/A 4 percent 4.5 percent
Tier 1 risk-based capital ratio 4 percent 5.5 percent 6 percent
Total risk-based capital ratio 8 percent 8 percent 8 percent
Tier 1 leverage ratio 3 or 4 percent 4 percent 4 percent
Note: For purposes of CCAR 2014, an advanced approaches BHC includes any BHC that has consolidated assets greater than or equal to $250 billion or total consolidatedon-balance sheet foreign exposure of at least $10 billion as of December 31, 2013. See 12 CFR 217.100(b)(1); 12 CFR part 225, appendix G, section 1(b). Other BHCs includeany BHC that is subject to 12 CFR 225.8 and is not an advanced approaches BHC.
The tier 1 common ratio is to be calculated using the definitions of tier 1 capital and total risk-weighted assets as currently in effect in 2013. All other ratios are calculatedin accordance with the transition arrangements provided in the Board's revised capital framework, issued in July 2013.
66 CCAR 2014: Assessment Framework and Results

Table A.21.B. Northern Trust Corporation
Actual Q3 2013 and projected minimum regulatory capital ratios and tier 1 common ratios,Q4 2013–Q4 2015Federal Reserve estimates in the adverse scenario
Projected capital ratios through Q4 2015 in the adverse scenario
ActualQ3 2013
Minimum stressed ratios with originalplanned capital actions
Minimum stressed ratios with adjustedplanned capital actions
Q4 2013 2014 2015 Q4 2013 2014 2015
Tier 1 common ratio (%) 13.1 12.8 11.8 11.4
Common equity tier 1 ratio (%) 11.6 10.0
Tier 1 capital ratio (%) 13.6 13.2 11.8 10.1
Total risk-based capital ratio (%) 14.9 15.9 14.7 12.7
Tier 1 leverage ratio (%) 8.3 8.0 7.1 6.6
Note: These projections represent hypothetical estimates that involve an economic outcome that is more adverse than expected. These estimates are not forecasts of capitalratios. The tables include the minimum ratios assuming the capital actions originally submitted in January 2014 by the BHCs in their annual capital plans and the minimumratios incorporating any adjustments to capital distributions made by BHCs after reviewing the Federal Reserve’s stress test projections and original planned capital distributionsfor those BHCs that did not make adjustments. The minimum capital ratios are for the period Q4 2013 to Q4 2015 and do not necessarily occur in the same quarter.
Required minimum capital ratios for advanced approaches BHCs in CCAR 2014
Regulatory ratio Q4 2013 2014 2015
Tier 1 common ratio 5 percent 5 percent 5 percent
Common equity tier 1 ratio N/A 4 percent 4.5 percent
Tier 1 risk-based capital ratio 4 percent 5.5 percent 6 percent
Total risk-based capital ratio 8 percent 8 percent 8 percent
Tier 1 leverage ratio 3 or 4 percent 4 percent 4 percent
Note: For purposes of CCAR 2014, an advanced approaches BHC includes any BHC that has consolidated assets greater than or equal to $250 billion or total consolidatedon-balance sheet foreign exposure of at least $10 billion as of December 31, 2013. See 12 CFR 217.100(b)(1); 12 CFR part 225, appendix G, section 1(b). Other BHCs includeany BHC that is subject to 12 CFR 225.8 and is not an advanced approaches BHC.
The tier 1 common ratio is to be calculated using the definitions of tier 1 capital and total risk-weighted assets as currently in effect in 2013. All other ratios are calculatedin accordance with the transition arrangements provided in the Board's revised capital framework, issued in July 2013.
March 2014 67

Table A.22.A. The PNC Financial Services Group, Inc.
Actual Q3 2013 and projected minimum regulatory capital ratios and tier 1 common ratios,Q4 2013–Q4 2015Federal Reserve estimates in the severely adverse scenario
Projected capital ratios through Q4 2015 in the severely adverse scenario
ActualQ3 2013
Minimum stressed ratios with originalplanned capital actions
Minimum stressed ratios with adjustedplanned capital actions
Q4 2013 2014 2015 Q4 2013 2014 2015
Tier 1 common ratio (%) 10.3 10.1 9.0 8.1
Common equity tier 1 ratio (%) 8.8 6.7
Tier 1 capital ratio (%) 12.2 12.0 10.5 8.2
Total risk-based capital ratio (%) 15.6 15.5 14.0 11.4
Tier 1 leverage ratio (%) 11.1 10.8 9.4 8.0
Note: These projections represent hypothetical estimates that involve an economic outcome that is more adverse than expected. These estimates are not forecasts of capitalratios. The tables include the minimum ratios assuming the capital actions originally submitted in January 2014 by the BHCs in their annual capital plans and the minimumratios incorporating any adjustments to capital distributions made by BHCs after reviewing the Federal Reserve’s stress test projections and original planned capital distributionsfor those BHCs that did not make adjustments. The minimum capital ratios are for the period Q4 2013 to Q4 2015 and do not necessarily occur in the same quarter.
Required minimum capital ratios for advanced approaches BHCs in CCAR 2014
Regulatory ratio Q4 2013 2014 2015
Tier 1 common ratio 5 percent 5 percent 5 percent
Common equity tier 1 ratio N/A 4 percent 4.5 percent
Tier 1 risk-based capital ratio 4 percent 5.5 percent 6 percent
Total risk-based capital ratio 8 percent 8 percent 8 percent
Tier 1 leverage ratio 3 or 4 percent 4 percent 4 percent
Note: For purposes of CCAR 2014, an advanced approaches BHC includes any BHC that has consolidated assets greater than or equal to $250 billion or total consolidatedon-balance sheet foreign exposure of at least $10 billion as of December 31, 2013. See 12 CFR 217.100(b)(1); 12 CFR part 225, appendix G, section 1(b). Other BHCs includeany BHC that is subject to 12 CFR 225.8 and is not an advanced approaches BHC.
The tier 1 common ratio is to be calculated using the definitions of tier 1 capital and total risk-weighted assets as currently in effect in 2013. All other ratios are calculatedin accordance with the transition arrangements provided in the Board's revised capital framework, issued in July 2013.
68 CCAR 2014: Assessment Framework and Results

Table A.22.B. The PNC Financial Services Group, Inc.
Actual Q3 2013 and projected minimum regulatory capital ratios and tier 1 common ratios,Q4 2013–Q4 2015Federal Reserve estimates in the adverse scenario
Projected capital ratios through Q4 2015 in the adverse scenario
ActualQ3 2013
Minimum stressed ratios with originalplanned capital actions
Minimum stressed ratios with adjustedplanned capital actions
Q4 2013 2014 2015 Q4 2013 2014 2015
Tier 1 common ratio (%) 10.3 10.3 10.0 9.9
Common equity tier 1 ratio (%) 9.6 8.2
Tier 1 capital ratio (%) 12.2 12.2 11.3 9.8
Total risk-based capital ratio (%) 15.6 15.6 14.7 12.9
Tier 1 leverage ratio (%) 11.1 11.0 10.1 9.5
Note: These projections represent hypothetical estimates that involve an economic outcome that is more adverse than expected. These estimates are not forecasts of capitalratios. The tables include the minimum ratios assuming the capital actions originally submitted in January 2014 by the BHCs in their annual capital plans and the minimumratios incorporating any adjustments to capital distributions made by BHCs after reviewing the Federal Reserve’s stress test projections and original planned capital distributionsfor those BHCs that did not make adjustments. The minimum capital ratios are for the period Q4 2013 to Q4 2015 and do not necessarily occur in the same quarter.
Required minimum capital ratios for advanced approaches BHCs in CCAR 2014
Regulatory ratio Q4 2013 2014 2015
Tier 1 common ratio 5 percent 5 percent 5 percent
Common equity tier 1 ratio N/A 4 percent 4.5 percent
Tier 1 risk-based capital ratio 4 percent 5.5 percent 6 percent
Total risk-based capital ratio 8 percent 8 percent 8 percent
Tier 1 leverage ratio 3 or 4 percent 4 percent 4 percent
Note: For purposes of CCAR 2014, an advanced approaches BHC includes any BHC that has consolidated assets greater than or equal to $250 billion or total consolidatedon-balance sheet foreign exposure of at least $10 billion as of December 31, 2013. See 12 CFR 217.100(b)(1); 12 CFR part 225, appendix G, section 1(b). Other BHCs includeany BHC that is subject to 12 CFR 225.8 and is not an advanced approaches BHC.
The tier 1 common ratio is to be calculated using the definitions of tier 1 capital and total risk-weighted assets as currently in effect in 2013. All other ratios are calculatedin accordance with the transition arrangements provided in the Board's revised capital framework, issued in July 2013.
March 2014 69

Table A.23.A. RBS Citizens Financial Group, Inc.
Actual Q3 2013 and projected minimum regulatory capital ratios and tier 1 common ratios,Q4 2013–Q4 2015Federal Reserve estimates in the severely adverse scenario
Projected capital ratios through Q4 2015 in the severely adverse scenario
ActualQ3 2013
Minimum stressed ratios with originalplanned capital actions
Minimum stressed ratios with adjustedplanned capital actions
Q4 2013 2014 2015 Q4 2013 2014 2015
Tier 1 common ratio (%) 13.9 13.2 10.0 9.0
Common equity tier 1 ratio (%) 9.1
Tier 1 capital ratio (%) 14.0 13.2 10.6 10.3
Total risk-based capital ratio (%) 16.3 15.8 14.3 13.9
Tier 1 leverage ratio (%) 12.1 11.3 9.0 9.2
Note: These projections represent hypothetical estimates that involve an economic outcome that is more adverse than expected. These estimates are not forecasts of capitalratios. The tables include the minimum ratios assuming the capital actions originally submitted in January 2014 by the BHCs in their annual capital plans and the minimumratios incorporating any adjustments to capital distributions made by BHCs after reviewing the Federal Reserve’s stress test projections and original planned capital distributionsfor those BHCs that did not make adjustments. The minimum capital ratios are for the period Q4 2013 to Q4 2015 and do not necessarily occur in the same quarter.
Required minimum capital ratios for other BHCs in CCAR 2014
Regulatory ratio Q4 2013 2014 2015
Tier 1 common ratio 5 percent 5 percent 5 percent
Common equity tier 1 ratio N/A N/A 4.5 percent
Tier 1 risk-based capital ratio 4 percent 4 percent 6 percent
Total risk-based capital ratio 8 percent 8 percent 8 percent
Tier 1 leverage ratio 3 or 4 percent 3 or 4 percent 4 percent
Note: For purposes of CCAR 2014, an advanced approaches BHC includes any BHC that has consolidated assets greater than or equal to $250 billion or total consolidatedon-balance sheet foreign exposure of at least $10 billion as of December 31, 2013. See 12 CFR 217.100(b)(1); 12 CFR part 225, appendix G, section 1(b). Other BHCs includeany BHC that is subject to 12 CFR 225.8 and is not an advanced approaches BHC.
The tier 1 common ratio is to be calculated using the definitions of tier 1 capital and total risk-weighted assets as currently in effect in 2013. All other ratios are calculatedin accordance with the transition arrangements provided in the Board's revised capital framework, issued in July 2013.
70 CCAR 2014: Assessment Framework and Results

Table A.23.B. RBS Citizens Financial Group, Inc.
Actual Q3 2013 and projected minimum regulatory capital ratios and tier 1 common ratios,Q4 2013–Q4 2015Federal Reserve estimates in the adverse scenario
Projected capital ratios through Q4 2015 in the adverse scenario
ActualQ3 2013
Minimum stressed ratios with originalplanned capital actions
Minimum stressed ratios with adjustedplanned capital actions
Q4 2013 2014 2015 Q4 2013 2014 2015
Tier 1 common ratio (%) 13.9 13.3 11.5 11.5
Common equity tier 1 ratio (%) 11.0
Tier 1 capital ratio (%) 14.0 13.3 12.0 11.6
Total risk-based capital ratio (%) 16.3 16.0 15.7 15.2
Tier 1 leverage ratio (%) 12.1 11.5 10.2 10.3
Note: These projections represent hypothetical estimates that involve an economic outcome that is more adverse than expected. These estimates are not forecasts of capitalratios. The tables include the minimum ratios assuming the capital actions originally submitted in January 2014 by the BHCs in their annual capital plans and the minimumratios incorporating any adjustments to capital distributions made by BHCs after reviewing the Federal Reserve’s stress test projections and original planned capital distributionsfor those BHCs that did not make adjustments. The minimum capital ratios are for the period Q4 2013 to Q4 2015 and do not necessarily occur in the same quarter.
Required minimum capital ratios for other BHCs in CCAR 2014
Regulatory ratio Q4 2013 2014 2015
Tier 1 common ratio 5 percent 5 percent 5 percent
Common equity tier 1 ratio N/A N/A 4.5 percent
Tier 1 risk-based capital ratio 4 percent 4 percent 6 percent
Total risk-based capital ratio 8 percent 8 percent 8 percent
Tier 1 leverage ratio 3 or 4 percent 3 or 4 percent 4 percent
Note: For purposes of CCAR 2014, an advanced approaches BHC includes any BHC that has consolidated assets greater than or equal to $250 billion or total consolidatedon-balance sheet foreign exposure of at least $10 billion as of December 31, 2013. See 12 CFR 217.100(b)(1); 12 CFR part 225, appendix G, section 1(b). Other BHCs includeany BHC that is subject to 12 CFR 225.8 and is not an advanced approaches BHC.
The tier 1 common ratio is to be calculated using the definitions of tier 1 capital and total risk-weighted assets as currently in effect in 2013. All other ratios are calculatedin accordance with the transition arrangements provided in the Board's revised capital framework, issued in July 2013.
March 2014 71

Table A.24.A. Regions Financial Corporation
Actual Q3 2013 and projected minimum regulatory capital ratios and tier 1 common ratios,Q4 2013–Q4 2015Federal Reserve estimates in the severely adverse scenario
Projected capital ratios through Q4 2015 in the severely adverse scenario
ActualQ3 2013
Minimum stressed ratios with originalplanned capital actions
Minimum stressed ratios with adjustedplanned capital actions
Q4 2013 2014 2015 Q4 2013 2014 2015
Tier 1 common ratio (%) 11.0 10.2 8.7 8.2
Common equity tier 1 ratio (%) 8.5
Tier 1 capital ratio (%) 11.5 10.7 9.7 9.1
Total risk-based capital ratio (%) 14.5 13.8 12.3 11.4
Tier 1 leverage ratio (%) 9.9 9.1 8.2 7.8
Note: These projections represent hypothetical estimates that involve an economic outcome that is more adverse than expected. These estimates are not forecasts of capitalratios. The tables include the minimum ratios assuming the capital actions originally submitted in January 2014 by the BHCs in their annual capital plans and the minimumratios incorporating any adjustments to capital distributions made by BHCs after reviewing the Federal Reserve’s stress test projections and original planned capital distributionsfor those BHCs that did not make adjustments. The minimum capital ratios are for the period Q4 2013 to Q4 2015 and do not necessarily occur in the same quarter.
Required minimum capital ratios for other BHCs in CCAR 2014
Regulatory ratio Q4 2013 2014 2015
Tier 1 common ratio 5 percent 5 percent 5 percent
Common equity tier 1 ratio N/A N/A 4.5 percent
Tier 1 risk-based capital ratio 4 percent 4 percent 6 percent
Total risk-based capital ratio 8 percent 8 percent 8 percent
Tier 1 leverage ratio 3 or 4 percent 3 or 4 percent 4 percent
Note: For purposes of CCAR 2014, an advanced approaches BHC includes any BHC that has consolidated assets greater than or equal to $250 billion or total consolidatedon-balance sheet foreign exposure of at least $10 billion as of December 31, 2013. See 12 CFR 217.100(b)(1); 12 CFR part 225, appendix G, section 1(b). Other BHCs includeany BHC that is subject to 12 CFR 225.8 and is not an advanced approaches BHC.
The tier 1 common ratio is to be calculated using the definitions of tier 1 capital and total risk-weighted assets as currently in effect in 2013. All other ratios are calculatedin accordance with the transition arrangements provided in the Board's revised capital framework, issued in July 2013.
72 CCAR 2014: Assessment Framework and Results

Table A.24.B. Regions Financial Corporation
Actual Q3 2013 and projected minimum regulatory capital ratios and tier 1 common ratios,Q4 2013–Q4 2015Federal Reserve estimates in the adverse scenario
Projected capital ratios through Q4 2015 in the adverse scenario
ActualQ3 2013
Minimum stressed ratios with originalplanned capital actions
Minimum stressed ratios with adjustedplanned capital actions
Q4 2013 2014 2015 Q4 2013 2014 2015
Tier 1 common ratio (%) 11.0 10.8 10.5 10.5
Common equity tier 1 ratio (%) 10.3
Tier 1 capital ratio (%) 11.5 11.3 11.2 11.1
Total risk-based capital ratio (%) 14.5 14.3 14.0 13.5
Tier 1 leverage ratio (%) 9.9 9.6 9.5 9.6
Note: These projections represent hypothetical estimates that involve an economic outcome that is more adverse than expected. These estimates are not forecasts of capitalratios. The tables include the minimum ratios assuming the capital actions originally submitted in January 2014 by the BHCs in their annual capital plans and the minimumratios incorporating any adjustments to capital distributions made by BHCs after reviewing the Federal Reserve’s stress test projections and original planned capital distributionsfor those BHCs that did not make adjustments. The minimum capital ratios are for the period Q4 2013 to Q4 2015 and do not necessarily occur in the same quarter.
Required minimum capital ratios for other BHCs in CCAR 2014
Regulatory ratio Q4 2013 2014 2015
Tier 1 common ratio 5 percent 5 percent 5 percent
Common equity tier 1 ratio N/A N/A 4.5 percent
Tier 1 risk-based capital ratio 4 percent 4 percent 6 percent
Total risk-based capital ratio 8 percent 8 percent 8 percent
Tier 1 leverage ratio 3 or 4 percent 3 or 4 percent 4 percent
Note: For purposes of CCAR 2014, an advanced approaches BHC includes any BHC that has consolidated assets greater than or equal to $250 billion or total consolidatedon-balance sheet foreign exposure of at least $10 billion as of December 31, 2013. See 12 CFR 217.100(b)(1); 12 CFR part 225, appendix G, section 1(b). Other BHCs includeany BHC that is subject to 12 CFR 225.8 and is not an advanced approaches BHC.
The tier 1 common ratio is to be calculated using the definitions of tier 1 capital and total risk-weighted assets as currently in effect in 2013. All other ratios are calculatedin accordance with the transition arrangements provided in the Board's revised capital framework, issued in July 2013.
March 2014 73

Table A.25.A. Santander Holdings USA, Inc.
Actual Q3 2013 and projected minimum regulatory capital ratios and tier 1 common ratios,Q4 2013–Q4 2015Federal Reserve estimates in the severely adverse scenario
Projected capital ratios through Q4 2015 in the severely adverse scenario
ActualQ3 2013
Minimum stressed ratios with originalplanned capital actions
Minimum stressed ratios with adjustedplanned capital actions
Q4 2013 2014 2015 Q4 2013 2014 2015
Tier 1 common ratio (%) 13.7 12.7 8.6 7.9
Common equity tier 1 ratio (%) 7.3
Tier 1 capital ratio (%) 14.4 13.4 11.4 11.8
Total risk-based capital ratio (%) 16.5 15.5 13.1 14.6
Tier 1 leverage ratio (%) 12.4 11.2 10.1 10.5
Note: These projections represent hypothetical estimates that involve an economic outcome that is more adverse than expected. These estimates are not forecasts of capitalratios. The tables include the minimum ratios assuming the capital actions originally submitted in January 2014 by the BHCs in their annual capital plans and the minimumratios incorporating any adjustments to capital distributions made by BHCs after reviewing the Federal Reserve’s stress test projections and original planned capital distributionsfor those BHCs that did not make adjustments. The minimum capital ratios are for the period Q4 2013 to Q4 2015 and do not necessarily occur in the same quarter.
Required minimum capital ratios for other BHCs in CCAR 2014
Regulatory ratio Q4 2013 2014 2015
Tier 1 common ratio 5 percent 5 percent 5 percent
Common equity tier 1 ratio N/A N/A 4.5 percent
Tier 1 risk-based capital ratio 4 percent 4 percent 6 percent
Total risk-based capital ratio 8 percent 8 percent 8 percent
Tier 1 leverage ratio 3 or 4 percent 3 or 4 percent 4 percent
Note: For purposes of CCAR 2014, an advanced approaches BHC includes any BHC that has consolidated assets greater than or equal to $250 billion or total consolidatedon-balance sheet foreign exposure of at least $10 billion as of December 31, 2013. See 12 CFR 217.100(b)(1); 12 CFR part 225, appendix G, section 1(b). Other BHCs includeany BHC that is subject to 12 CFR 225.8 and is not an advanced approaches BHC.
The tier 1 common ratio is to be calculated using the definitions of tier 1 capital and total risk-weighted assets as currently in effect in 2013. All other ratios are calculatedin accordance with the transition arrangements provided in the Board's revised capital framework, issued in July 2013.
74 CCAR 2014: Assessment Framework and Results

Table A.25.B. Santander Holdings USA, Inc.
Actual Q3 2013 and projected minimum regulatory capital ratios and tier 1 common ratios,Q4 2013–Q4 2015Federal Reserve estimates in the adverse scenario
Projected capital ratios through Q4 2015 in the adverse scenario
ActualQ3 2013
Minimum stressed ratios with originalplanned capital actions
Minimum stressed ratios with adjustedplanned capital actions
Q4 2013 2014 2015 Q4 2013 2014 2015
Tier 1 common ratio (%) 13.7 13.6 10.5 11.0
Common equity tier 1 ratio (%) 9.2
Tier 1 capital ratio (%) 14.4 14.3 13.2 13.6
Total risk-based capital ratio (%) 16.5 16.4 14.9 16.5
Tier 1 leverage ratio (%) 12.4 11.9 11.7 12.1
Note: These projections represent hypothetical estimates that involve an economic outcome that is more adverse than expected. These estimates are not forecasts of capitalratios. The tables include the minimum ratios assuming the capital actions originally submitted in January 2014 by the BHCs in their annual capital plans and the minimumratios incorporating any adjustments to capital distributions made by BHCs after reviewing the Federal Reserve’s stress test projections and original planned capital distributionsfor those BHCs that did not make adjustments. The minimum capital ratios are for the period Q4 2013 to Q4 2015 and do not necessarily occur in the same quarter.
Required minimum capital ratios for other BHCs in CCAR 2014
Regulatory ratio Q4 2013 2014 2015
Tier 1 common ratio 5 percent 5 percent 5 percent
Common equity tier 1 ratio N/A N/A 4.5 percent
Tier 1 risk-based capital ratio 4 percent 4 percent 6 percent
Total risk-based capital ratio 8 percent 8 percent 8 percent
Tier 1 leverage ratio 3 or 4 percent 3 or 4 percent 4 percent
Note: For purposes of CCAR 2014, an advanced approaches BHC includes any BHC that has consolidated assets greater than or equal to $250 billion or total consolidatedon-balance sheet foreign exposure of at least $10 billion as of December 31, 2013. See 12 CFR 217.100(b)(1); 12 CFR part 225, appendix G, section 1(b). Other BHCs includeany BHC that is subject to 12 CFR 225.8 and is not an advanced approaches BHC.
The tier 1 common ratio is to be calculated using the definitions of tier 1 capital and total risk-weighted assets as currently in effect in 2013. All other ratios are calculatedin accordance with the transition arrangements provided in the Board's revised capital framework, issued in July 2013.
March 2014 75

Table A.26.A. State Street Corporation
Actual Q3 2013 and projected minimum regulatory capital ratios and tier 1 common ratios,Q4 2013–Q4 2015Federal Reserve estimates in the severely adverse scenario
Projected capital ratios through Q4 2015 in the severely adverse scenario
ActualQ3 2013
Minimum stressed ratios with originalplanned capital actions
Minimum stressed ratios with adjustedplanned capital actions
Q4 2013 2014 2015 Q4 2013 2014 2015
Tier 1 common ratio (%) 15.5 13.3 12.3 11.4
Common equity tier 1 ratio (%) 13.9 9.4
Tier 1 capital ratio (%) 17.3 15.0 16.1 11.5
Total risk-based capital ratio (%) 19.8 17.3 18.9 13.5
Tier 1 leverage ratio (%) 7.2 6.3 6.7 6.3
Note: These projections represent hypothetical estimates that involve an economic outcome that is more adverse than expected. These estimates are not forecasts of capitalratios. The tables include the minimum ratios assuming the capital actions originally submitted in January 2014 by the BHCs in their annual capital plans and the minimumratios incorporating any adjustments to capital distributions made by BHCs after reviewing the Federal Reserve’s stress test projections and original planned capital distributionsfor those BHCs that did not make adjustments. The minimum capital ratios are for the period Q4 2013 to Q4 2015 and do not necessarily occur in the same quarter.
Required minimum capital ratios for advanced approaches BHCs in CCAR 2014
Regulatory ratio Q4 2013 2014 2015
Tier 1 common ratio 5 percent 5 percent 5 percent
Common equity tier 1 ratio N/A 4 percent 4.5 percent
Tier 1 risk-based capital ratio 4 percent 5.5 percent 6 percent
Total risk-based capital ratio 8 percent 8 percent 8 percent
Tier 1 leverage ratio 3 or 4 percent 4 percent 4 percent
Note: For purposes of CCAR 2014, an advanced approaches BHC includes any BHC that has consolidated assets greater than or equal to $250 billion or total consolidatedon-balance sheet foreign exposure of at least $10 billion as of December 31, 2013. See 12 CFR 217.100(b)(1); 12 CFR part 225, appendix G, section 1(b). Other BHCs includeany BHC that is subject to 12 CFR 225.8 and is not an advanced approaches BHC.
The tier 1 common ratio is to be calculated using the definitions of tier 1 capital and total risk-weighted assets as currently in effect in 2013. All other ratios are calculatedin accordance with the transition arrangements provided in the Board's revised capital framework, issued in July 2013.
76 CCAR 2014: Assessment Framework and Results

Table A.26.B. State Street Corporation
Actual Q3 2013 and projected minimum regulatory capital ratios and tier 1 common ratios,Q4 2013–Q4 2015Federal Reserve estimates in the adverse scenario
Projected capital ratios through Q4 2015 in the adverse scenario
ActualQ3 2013
Minimum stressed ratios with originalplanned capital actions
Minimum stressed ratios with adjustedplanned capital actions
Q4 2013 2014 2015 Q4 2013 2014 2015
Tier 1 common ratio (%) 15.5 13.9 13.4 13.6
Common equity tier 1 ratio (%) 14.0 9.7
Tier 1 capital ratio (%) 17.3 15.7 15.6 11.2
Total risk-based capital ratio (%) 19.8 17.9 18.3 13.2
Tier 1 leverage ratio (%) 7.2 6.5 6.6 6.1
Note: These projections represent hypothetical estimates that involve an economic outcome that is more adverse than expected. These estimates are not forecasts of capitalratios. The tables include the minimum ratios assuming the capital actions originally submitted in January 2014 by the BHCs in their annual capital plans and the minimumratios incorporating any adjustments to capital distributions made by BHCs after reviewing the Federal Reserve’s stress test projections and original planned capital distributionsfor those BHCs that did not make adjustments. The minimum capital ratios are for the period Q4 2013 to Q4 2015 and do not necessarily occur in the same quarter.
Required minimum capital ratios for advanced approaches BHCs in CCAR 2014
Regulatory ratio Q4 2013 2014 2015
Tier 1 common ratio 5 percent 5 percent 5 percent
Common equity tier 1 ratio N/A 4 percent 4.5 percent
Tier 1 risk-based capital ratio 4 percent 5.5 percent 6 percent
Total risk-based capital ratio 8 percent 8 percent 8 percent
Tier 1 leverage ratio 3 or 4 percent 4 percent 4 percent
Note: For purposes of CCAR 2014, an advanced approaches BHC includes any BHC that has consolidated assets greater than or equal to $250 billion or total consolidatedon-balance sheet foreign exposure of at least $10 billion as of December 31, 2013. See 12 CFR 217.100(b)(1); 12 CFR part 225, appendix G, section 1(b). Other BHCs includeany BHC that is subject to 12 CFR 225.8 and is not an advanced approaches BHC.
The tier 1 common ratio is to be calculated using the definitions of tier 1 capital and total risk-weighted assets as currently in effect in 2013. All other ratios are calculatedin accordance with the transition arrangements provided in the Board's revised capital framework, issued in July 2013.
March 2014 77

Table A.27.A. SunTrust Banks, Inc.
Actual Q3 2013 and projected minimum regulatory capital ratios and tier 1 common ratios,Q4 2013–Q4 2015Federal Reserve estimates in the severely adverse scenario
Projected capital ratios through Q4 2015 in the severely adverse scenario
ActualQ3 2013
Minimum stressed ratios with originalplanned capital actions
Minimum stressed ratios with adjustedplanned capital actions
Q4 2013 2014 2015 Q4 2013 2014 2015
Tier 1 common ratio (%) 9.9 9.6 8.4 8.0
Common equity tier 1 ratio (%) 7.5
Tier 1 capital ratio (%) 11.0 10.6 9.5 8.3
Total risk-based capital ratio (%) 13.0 12.6 11.3 10.2
Tier 1 leverage ratio (%) 9.5 9.1 8.1 7.3
Note: These projections represent hypothetical estimates that involve an economic outcome that is more adverse than expected. These estimates are not forecasts of capitalratios. The tables include the minimum ratios assuming the capital actions originally submitted in January 2014 by the BHCs in their annual capital plans and the minimumratios incorporating any adjustments to capital distributions made by BHCs after reviewing the Federal Reserve’s stress test projections and original planned capital distributionsfor those BHCs that did not make adjustments. The minimum capital ratios are for the period Q4 2013 to Q4 2015 and do not necessarily occur in the same quarter.
Required minimum capital ratios for other BHCs in CCAR 2014
Regulatory ratio Q4 2013 2014 2015
Tier 1 common ratio 5 percent 5 percent 5 percent
Common equity tier 1 ratio N/A N/A 4.5 percent
Tier 1 risk-based capital ratio 4 percent 4 percent 6 percent
Total risk-based capital ratio 8 percent 8 percent 8 percent
Tier 1 leverage ratio 3 or 4 percent 3 or 4 percent 4 percent
Note: For purposes of CCAR 2014, an advanced approaches BHC includes any BHC that has consolidated assets greater than or equal to $250 billion or total consolidatedon-balance sheet foreign exposure of at least $10 billion as of December 31, 2013. See 12 CFR 217.100(b)(1); 12 CFR part 225, appendix G, section 1(b). Other BHCs includeany BHC that is subject to 12 CFR 225.8 and is not an advanced approaches BHC.
The tier 1 common ratio is to be calculated using the definitions of tier 1 capital and total risk-weighted assets as currently in effect in 2013. All other ratios are calculatedin accordance with the transition arrangements provided in the Board's revised capital framework, issued in July 2013.
78 CCAR 2014: Assessment Framework and Results

Table A.27.B. SunTrust Banks, Inc.
Actual Q3 2013 and projected minimum regulatory capital ratios and tier 1 common ratios,Q4 2013–Q4 2015Federal Reserve estimates in the adverse scenario
Projected capital ratios through Q4 2015 in the adverse scenario
ActualQ3 2013
Minimum stressed ratios with originalplanned capital actions
Minimum stressed ratios with adjustedplanned capital actions
Q4 2013 2014 2015 Q4 2013 2014 2015
Tier 1 common ratio (%) 9.9 9.8 9.6 9.8
Common equity tier 1 ratio (%) 9.5
Tier 1 capital ratio (%) 11.0 10.8 10.6 10.1
Total risk-based capital ratio (%) 13.0 12.9 12.5 12.1
Tier 1 leverage ratio (%) 9.5 9.3 9.1 8.8
Note: These projections represent hypothetical estimates that involve an economic outcome that is more adverse than expected. These estimates are not forecasts of capitalratios. The tables include the minimum ratios assuming the capital actions originally submitted in January 2014 by the BHCs in their annual capital plans and the minimumratios incorporating any adjustments to capital distributions made by BHCs after reviewing the Federal Reserve’s stress test projections and original planned capital distributionsfor those BHCs that did not make adjustments. The minimum capital ratios are for the period Q4 2013 to Q4 2015 and do not necessarily occur in the same quarter.
Required minimum capital ratios for other BHCs in CCAR 2014
Regulatory ratio Q4 2013 2014 2015
Tier 1 common ratio 5 percent 5 percent 5 percent
Common equity tier 1 ratio N/A N/A 4.5 percent
Tier 1 risk-based capital ratio 4 percent 4 percent 6 percent
Total risk-based capital ratio 8 percent 8 percent 8 percent
Tier 1 leverage ratio 3 or 4 percent 3 or 4 percent 4 percent
Note: For purposes of CCAR 2014, an advanced approaches BHC includes any BHC that has consolidated assets greater than or equal to $250 billion or total consolidatedon-balance sheet foreign exposure of at least $10 billion as of December 31, 2013. See 12 CFR 217.100(b)(1); 12 CFR part 225, appendix G, section 1(b). Other BHCs includeany BHC that is subject to 12 CFR 225.8 and is not an advanced approaches BHC.
The tier 1 common ratio is to be calculated using the definitions of tier 1 capital and total risk-weighted assets as currently in effect in 2013. All other ratios are calculatedin accordance with the transition arrangements provided in the Board's revised capital framework, issued in July 2013.
March 2014 79

Table A.28.A. U.S. Bancorp
Actual Q3 2013 and projected minimum regulatory capital ratios and tier 1 common ratios,Q4 2013–Q4 2015Federal Reserve estimates in the severely adverse scenario
Projected capital ratios through Q4 2015 in the severely adverse scenario
ActualQ3 2013
Minimum stressed ratios with originalplanned capital actions
Minimum stressed ratios with adjustedplanned capital actions
Q4 2013 2014 2015 Q4 2013 2014 2015
Tier 1 common ratio (%) 9.3 8.9 7.4 6.6
Common equity tier 1 ratio (%) 7.6 6.0
Tier 1 capital ratio (%) 11.2 10.8 9.3 7.8
Total risk-based capital ratio (%) 13.3 12.8 11.6 10.0
Tier 1 leverage ratio (%) 9.6 9.1 7.8 6.9
Note: These projections represent hypothetical estimates that involve an economic outcome that is more adverse than expected. These estimates are not forecasts of capitalratios. The tables include the minimum ratios assuming the capital actions originally submitted in January 2014 by the BHCs in their annual capital plans and the minimumratios incorporating any adjustments to capital distributions made by BHCs after reviewing the Federal Reserve’s stress test projections and original planned capital distributionsfor those BHCs that did not make adjustments. The minimum capital ratios are for the period Q4 2013 to Q4 2015 and do not necessarily occur in the same quarter.
Required minimum capital ratios for advanced approaches BHCs in CCAR 2014
Regulatory ratio Q4 2013 2014 2015
Tier 1 common ratio 5 percent 5 percent 5 percent
Common equity tier 1 ratio N/A 4 percent 4.5 percent
Tier 1 risk-based capital ratio 4 percent 5.5 percent 6 percent
Total risk-based capital ratio 8 percent 8 percent 8 percent
Tier 1 leverage ratio 3 or 4 percent 4 percent 4 percent
Note: For purposes of CCAR 2014, an advanced approaches BHC includes any BHC that has consolidated assets greater than or equal to $250 billion or total consolidatedon-balance sheet foreign exposure of at least $10 billion as of December 31, 2013. See 12 CFR 217.100(b)(1); 12 CFR part 225, appendix G, section 1(b). Other BHCs includeany BHC that is subject to 12 CFR 225.8 and is not an advanced approaches BHC.
The tier 1 common ratio is to be calculated using the definitions of tier 1 capital and total risk-weighted assets as currently in effect in 2013. All other ratios are calculatedin accordance with the transition arrangements provided in the Board's revised capital framework, issued in July 2013.
80 CCAR 2014: Assessment Framework and Results

Table A.28.B. U.S. Bancorp
Actual Q3 2013 and projected minimum regulatory capital ratios and tier 1 common ratios,Q4 2013–Q4 2015Federal Reserve estimates in the adverse scenario
Projected capital ratios through Q4 2015 in the adverse scenario
ActualQ3 2013
Minimum stressed ratios with originalplanned capital actions
Minimum stressed ratios with adjustedplanned capital actions
Q4 2013 2014 2015 Q4 2013 2014 2015
Tier 1 common ratio (%) 9.3 9.1 8.6 8.8
Common equity tier 1 ratio (%) 8.6 7.8
Tier 1 capital ratio (%) 11.2 11.0 10.3 9.4
Total risk-based capital ratio (%) 13.3 13.0 12.3 11.6
Tier 1 leverage ratio (%) 9.6 9.3 8.6 8.2
Note: These projections represent hypothetical estimates that involve an economic outcome that is more adverse than expected. These estimates are not forecasts of capitalratios. The tables include the minimum ratios assuming the capital actions originally submitted in January 2014 by the BHCs in their annual capital plans and the minimumratios incorporating any adjustments to capital distributions made by BHCs after reviewing the Federal Reserve’s stress test projections and original planned capital distributionsfor those BHCs that did not make adjustments. The minimum capital ratios are for the period Q4 2013 to Q4 2015 and do not necessarily occur in the same quarter.
Required minimum capital ratios for advanced approaches BHCs in CCAR 2014
Regulatory ratio Q4 2013 2014 2015
Tier 1 common ratio 5 percent 5 percent 5 percent
Common equity tier 1 ratio N/A 4 percent 4.5 percent
Tier 1 risk-based capital ratio 4 percent 5.5 percent 6 percent
Total risk-based capital ratio 8 percent 8 percent 8 percent
Tier 1 leverage ratio 3 or 4 percent 4 percent 4 percent
Note: For purposes of CCAR 2014, an advanced approaches BHC includes any BHC that has consolidated assets greater than or equal to $250 billion or total consolidatedon-balance sheet foreign exposure of at least $10 billion as of December 31, 2013. See 12 CFR 217.100(b)(1); 12 CFR part 225, appendix G, section 1(b). Other BHCs includeany BHC that is subject to 12 CFR 225.8 and is not an advanced approaches BHC.
The tier 1 common ratio is to be calculated using the definitions of tier 1 capital and total risk-weighted assets as currently in effect in 2013. All other ratios are calculatedin accordance with the transition arrangements provided in the Board's revised capital framework, issued in July 2013.
March 2014 81

Table A.29.A. UnionBanCal Corporation
Actual Q3 2013 and projected minimum regulatory capital ratios and tier 1 common ratios,Q4 2013–Q4 2015Federal Reserve estimates in the severely adverse scenario
Projected capital ratios through Q4 2015 in the severely adverse scenario
ActualQ3 2013
Minimum stressed ratios with originalplanned capital actions
Minimum stressed ratios with adjustedplanned capital actions
Q4 2013 2014 2015 Q4 2013 2014 2015
Tier 1 common ratio (%) 11.1 11.7 10.2 9.7
Common equity tier 1 ratio (%) 9.7
Tier 1 capital ratio (%) 11.2 11.8 10.2 9.7
Total risk-based capital ratio (%) 13.1 14.2 12.8 11.9
Tier 1 leverage ratio (%) 10.2 10.8 9.3 9.0
Note: These projections represent hypothetical estimates that involve an economic outcome that is more adverse than expected. These estimates are not forecasts of capitalratios. The tables include the minimum ratios assuming the capital actions originally submitted in January 2014 by the BHCs in their annual capital plans and the minimumratios incorporating any adjustments to capital distributions made by BHCs after reviewing the Federal Reserve’s stress test projections and original planned capital distributionsfor those BHCs that did not make adjustments. The minimum capital ratios are for the period Q4 2013 to Q4 2015 and do not necessarily occur in the same quarter.
Required minimum capital ratios for other BHCs in CCAR 2014
Regulatory ratio Q4 2013 2014 2015
Tier 1 common ratio 5 percent 5 percent 5 percent
Common equity tier 1 ratio N/A N/A 4.5 percent
Tier 1 risk-based capital ratio 4 percent 4 percent 6 percent
Total risk-based capital ratio 8 percent 8 percent 8 percent
Tier 1 leverage ratio 3 or 4 percent 3 or 4 percent 4 percent
Note: For purposes of CCAR 2014, an advanced approaches BHC includes any BHC that has consolidated assets greater than or equal to $250 billion or total consolidatedon-balance sheet foreign exposure of at least $10 billion as of December 31, 2013. See 12 CFR 217.100(b)(1); 12 CFR part 225, appendix G, section 1(b). Other BHCs includeany BHC that is subject to 12 CFR 225.8 and is not an advanced approaches BHC.
The tier 1 common ratio is to be calculated using the definitions of tier 1 capital and total risk-weighted assets as currently in effect in 2013. All other ratios are calculatedin accordance with the transition arrangements provided in the Board's revised capital framework, issued in July 2013.
82 CCAR 2014: Assessment Framework and Results

Table A.29.B. UnionBanCal Corporation
Actual Q3 2013 and projected minimum regulatory capital ratios and tier 1 common ratios,Q4 2013–Q4 2015Federal Reserve estimates in the adverse scenario
Projected capital ratios through Q4 2015 in the adverse scenario
ActualQ3 2013
Minimum stressed ratios with originalplanned capital actions
Minimum stressed ratios with adjustedplanned capital actions
Q4 2013 2014 2015 Q4 2013 2014 2015
Tier 1 common ratio (%) 11.1 12.0 11.5 12.3
Common equity tier 1 ratio (%) 12.0
Tier 1 capital ratio (%) 11.2 12.1 11.5 12.0
Total risk-based capital ratio (%) 13.1 14.4 14.0 13.8
Tier 1 leverage ratio (%) 10.2 11.0 10.5 11.2
Note: These projections represent hypothetical estimates that involve an economic outcome that is more adverse than expected. These estimates are not forecasts of capitalratios. The tables include the minimum ratios assuming the capital actions originally submitted in January 2014 by the BHCs in their annual capital plans and the minimumratios incorporating any adjustments to capital distributions made by BHCs after reviewing the Federal Reserve’s stress test projections and original planned capital distributionsfor those BHCs that did not make adjustments. The minimum capital ratios are for the period Q4 2013 to Q4 2015 and do not necessarily occur in the same quarter.
Required minimum capital ratios for other BHCs in CCAR 2014
Regulatory ratio Q4 2013 2014 2015
Tier 1 common ratio 5 percent 5 percent 5 percent
Common equity tier 1 ratio N/A N/A 4.5 percent
Tier 1 risk-based capital ratio 4 percent 4 percent 6 percent
Total risk-based capital ratio 8 percent 8 percent 8 percent
Tier 1 leverage ratio 3 or 4 percent 3 or 4 percent 4 percent
Note: For purposes of CCAR 2014, an advanced approaches BHC includes any BHC that has consolidated assets greater than or equal to $250 billion or total consolidatedon-balance sheet foreign exposure of at least $10 billion as of December 31, 2013. See 12 CFR 217.100(b)(1); 12 CFR part 225, appendix G, section 1(b). Other BHCs includeany BHC that is subject to 12 CFR 225.8 and is not an advanced approaches BHC.
The tier 1 common ratio is to be calculated using the definitions of tier 1 capital and total risk-weighted assets as currently in effect in 2013. All other ratios are calculatedin accordance with the transition arrangements provided in the Board's revised capital framework, issued in July 2013.
March 2014 83

Table A.30.A. Wells Fargo & Company
Actual Q3 2013 and projected minimum regulatory capital ratios and tier 1 common ratios,Q4 2013–Q4 2015Federal Reserve estimates in the severely adverse scenario
Projected capital ratios through Q4 2015 in the severely adverse scenario
ActualQ3 2013
Minimum stressed ratios with originalplanned capital actions
Minimum stressed ratios with adjustedplanned capital actions
Q4 2013 2014 2015 Q4 2013 2014 2015
Tier 1 common ratio (%) 10.6 9.8 7.7 6.1
Common equity tier 1 ratio (%) 7.7 5.2
Tier 1 capital ratio (%) 12.1 11.3 9.2 6.9
Total risk-based capital ratio (%) 15.1 14.4 13.0 10.9
Tier 1 leverage ratio (%) 9.8 9.0 7.3 5.6
Note: These projections represent hypothetical estimates that involve an economic outcome that is more adverse than expected. These estimates are not forecasts of capitalratios. The tables include the minimum ratios assuming the capital actions originally submitted in January 2014 by the BHCs in their annual capital plans and the minimumratios incorporating any adjustments to capital distributions made by BHCs after reviewing the Federal Reserve’s stress test projections and original planned capital distributionsfor those BHCs that did not make adjustments. The minimum capital ratios are for the period Q4 2013 to Q4 2015 and do not necessarily occur in the same quarter.
Required minimum capital ratios for advanced approaches BHCs in CCAR 2014
Regulatory ratio Q4 2013 2014 2015
Tier 1 common ratio 5 percent 5 percent 5 percent
Common equity tier 1 ratio N/A 4 percent 4.5 percent
Tier 1 risk-based capital ratio 4 percent 5.5 percent 6 percent
Total risk-based capital ratio 8 percent 8 percent 8 percent
Tier 1 leverage ratio 3 or 4 percent 4 percent 4 percent
Note: For purposes of CCAR 2014, an advanced approaches BHC includes any BHC that has consolidated assets greater than or equal to $250 billion or total consolidatedon-balance sheet foreign exposure of at least $10 billion as of December 31, 2013. See 12 CFR 217.100(b)(1); 12 CFR part 225, appendix G, section 1(b). Other BHCs includeany BHC that is subject to 12 CFR 225.8 and is not an advanced approaches BHC.
The tier 1 common ratio is to be calculated using the definitions of tier 1 capital and total risk-weighted assets as currently in effect in 2013. All other ratios are calculatedin accordance with the transition arrangements provided in the Board's revised capital framework, issued in July 2013.
84 CCAR 2014: Assessment Framework and Results

Table A.30.B. Wells Fargo & Company
Actual Q3 2013 and projected minimum regulatory capital ratios and tier 1 common ratios,Q4 2013–Q4 2015Federal Reserve estimates in the adverse scenario
Projected capital ratios through Q4 2015 in the adverse scenario
ActualQ3 2013
Minimum stressed ratios with originalplanned capital actions
Minimum stressed ratios with adjustedplanned capital actions
Q4 2013 2014 2015 Q4 2013 2014 2015
Tier 1 common ratio (%) 10.6 10.1 9.3 8.7
Common equity tier 1 ratio (%) 9.0 7.4
Tier 1 capital ratio (%) 12.1 11.6 10.4 9.0
Total risk-based capital ratio (%) 15.1 14.7 14.4 13.1
Tier 1 leverage ratio (%) 9.8 9.2 8.2 7.3
Note: These projections represent hypothetical estimates that involve an economic outcome that is more adverse than expected. These estimates are not forecasts of capitalratios. The tables include the minimum ratios assuming the capital actions originally submitted in January 2014 by the BHCs in their annual capital plans and the minimumratios incorporating any adjustments to capital distributions made by BHCs after reviewing the Federal Reserve’s stress test projections and original planned capital distributionsfor those BHCs that did not make adjustments. The minimum capital ratios are for the period Q4 2013 to Q4 2015 and do not necessarily occur in the same quarter.
Required minimum capital ratios for advanced approaches BHCs in CCAR 2014
Regulatory ratio Q4 2013 2014 2015
Tier 1 common ratio 5 percent 5 percent 5 percent
Common equity tier 1 ratio N/A 4 percent 4.5 percent
Tier 1 risk-based capital ratio 4 percent 5.5 percent 6 percent
Total risk-based capital ratio 8 percent 8 percent 8 percent
Tier 1 leverage ratio 3 or 4 percent 4 percent 4 percent
Note: For purposes of CCAR 2014, an advanced approaches BHC includes any BHC that has consolidated assets greater than or equal to $250 billion or total consolidatedon-balance sheet foreign exposure of at least $10 billion as of December 31, 2013. See 12 CFR 217.100(b)(1); 12 CFR part 225, appendix G, section 1(b). Other BHCs includeany BHC that is subject to 12 CFR 225.8 and is not an advanced approaches BHC.
The tier 1 common ratio is to be calculated using the definitions of tier 1 capital and total risk-weighted assets as currently in effect in 2013. All other ratios are calculatedin accordance with the transition arrangements provided in the Board's revised capital framework, issued in July 2013.
March 2014 85
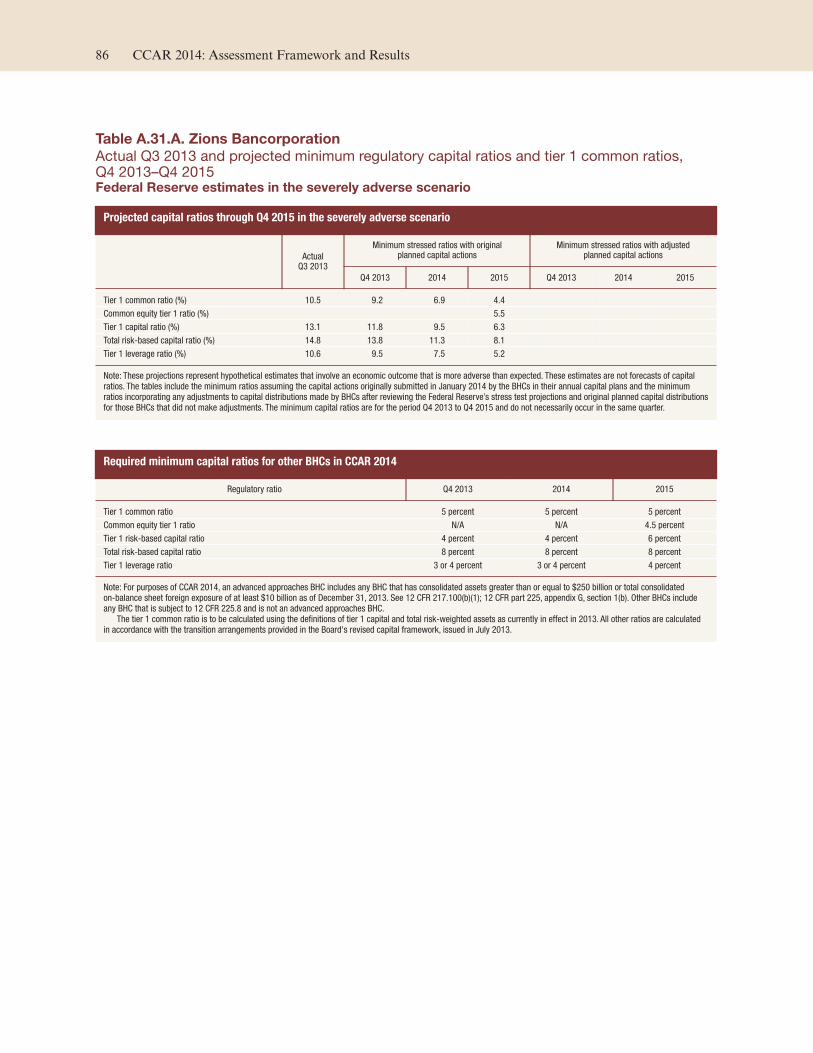
Table A.31.A. Zions Bancorporation
Actual Q3 2013 and projected minimum regulatory capital ratios and tier 1 common ratios,Q4 2013–Q4 2015Federal Reserve estimates in the severely adverse scenario
Projected capital ratios through Q4 2015 in the severely adverse scenario
ActualQ3 2013
Minimum stressed ratios with originalplanned capital actions
Minimum stressed ratios with adjustedplanned capital actions
Q4 2013 2014 2015 Q4 2013 2014 2015
Tier 1 common ratio (%) 10.5 9.2 6.9 4.4
Common equity tier 1 ratio (%) 5.5
Tier 1 capital ratio (%) 13.1 11.8 9.5 6.3
Total risk-based capital ratio (%) 14.8 13.8 11.3 8.1
Tier 1 leverage ratio (%) 10.6 9.5 7.5 5.2
Note: These projections represent hypothetical estimates that involve an economic outcome that is more adverse than expected. These estimates are not forecasts of capitalratios. The tables include the minimum ratios assuming the capital actions originally submitted in January 2014 by the BHCs in their annual capital plans and the minimumratios incorporating any adjustments to capital distributions made by BHCs after reviewing the Federal Reserve’s stress test projections and original planned capital distributionsfor those BHCs that did not make adjustments. The minimum capital ratios are for the period Q4 2013 to Q4 2015 and do not necessarily occur in the same quarter.
Required minimum capital ratios for other BHCs in CCAR 2014
Regulatory ratio Q4 2013 2014 2015
Tier 1 common ratio 5 percent 5 percent 5 percent
Common equity tier 1 ratio N/A N/A 4.5 percent
Tier 1 risk-based capital ratio 4 percent 4 percent 6 percent
Total risk-based capital ratio 8 percent 8 percent 8 percent
Tier 1 leverage ratio 3 or 4 percent 3 or 4 percent 4 percent
Note: For purposes of CCAR 2014, an advanced approaches BHC includes any BHC that has consolidated assets greater than or equal to $250 billion or total consolidatedon-balance sheet foreign exposure of at least $10 billion as of December 31, 2013. See 12 CFR 217.100(b)(1); 12 CFR part 225, appendix G, section 1(b). Other BHCs includeany BHC that is subject to 12 CFR 225.8 and is not an advanced approaches BHC.
The tier 1 common ratio is to be calculated using the definitions of tier 1 capital and total risk-weighted assets as currently in effect in 2013. All other ratios are calculatedin accordance with the transition arrangements provided in the Board's revised capital framework, issued in July 2013.
86 CCAR 2014: Assessment Framework and Results
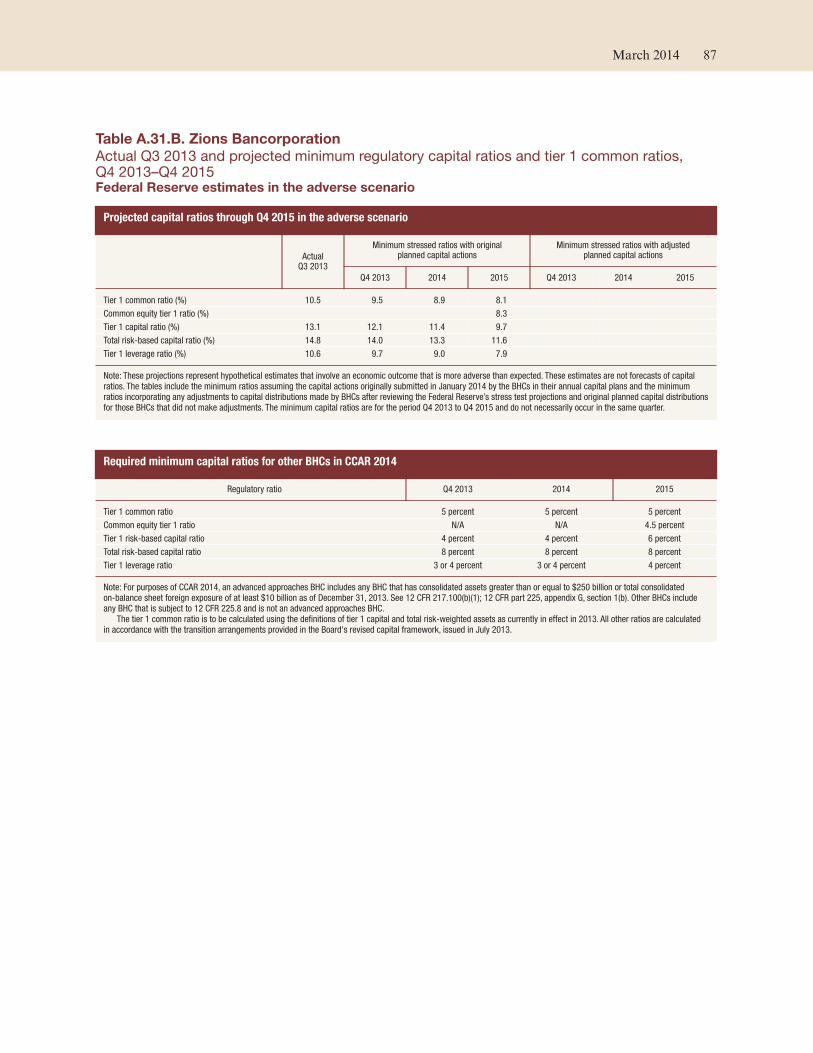
Table A.31.B. Zions Bancorporation
Actual Q3 2013 and projected minimum regulatory capital ratios and tier 1 common ratios,Q4 2013–Q4 2015Federal Reserve estimates in the adverse scenario
Projected capital ratios through Q4 2015 in the adverse scenario
ActualQ3 2013
Minimum stressed ratios with originalplanned capital actions
Minimum stressed ratios with adjustedplanned capital actions
Q4 2013 2014 2015 Q4 2013 2014 2015
Tier 1 common ratio (%) 10.5 9.5 8.9 8.1
Common equity tier 1 ratio (%) 8.3
Tier 1 capital ratio (%) 13.1 12.1 11.4 9.7
Total risk-based capital ratio (%) 14.8 14.0 13.3 11.6
Tier 1 leverage ratio (%) 10.6 9.7 9.0 7.9
Note: These projections represent hypothetical estimates that involve an economic outcome that is more adverse than expected. These estimates are not forecasts of capitalratios. The tables include the minimum ratios assuming the capital actions originally submitted in January 2014 by the BHCs in their annual capital plans and the minimumratios incorporating any adjustments to capital distributions made by BHCs after reviewing the Federal Reserve’s stress test projections and original planned capital distributionsfor those BHCs that did not make adjustments. The minimum capital ratios are for the period Q4 2013 to Q4 2015 and do not necessarily occur in the same quarter.
Required minimum capital ratios for other BHCs in CCAR 2014
Regulatory ratio Q4 2013 2014 2015
Tier 1 common ratio 5 percent 5 percent 5 percent
Common equity tier 1 ratio N/A N/A 4.5 percent
Tier 1 risk-based capital ratio 4 percent 4 percent 6 percent
Total risk-based capital ratio 8 percent 8 percent 8 percent
Tier 1 leverage ratio 3 or 4 percent 3 or 4 percent 4 percent
Note: For purposes of CCAR 2014, an advanced approaches BHC includes any BHC that has consolidated assets greater than or equal to $250 billion or total consolidatedon-balance sheet foreign exposure of at least $10 billion as of December 31, 2013. See 12 CFR 217.100(b)(1); 12 CFR part 225, appendix G, section 1(b). Other BHCs includeany BHC that is subject to 12 CFR 225.8 and is not an advanced approaches BHC.
The tier 1 common ratio is to be calculated using the definitions of tier 1 capital and total risk-weighted assets as currently in effect in 2013. All other ratios are calculatedin accordance with the transition arrangements provided in the Board's revised capital framework, issued in July 2013.
March 2014 87
