compressive strength and abrasion resistance of concretes ... · specific gravity 2.64 2.70 bulk...
TRANSCRIPT

Open Journal of Civil Engineering, 2017, 7, 82-99 http://www.scirp.org/journal/ojce
ISSN Online: 2164-3172 ISSN Print: 2164-3164
DOI: 10.4236/ojce.2017.71005 March 10, 2017
Compressive Strength and Abrasion Resistance of Concretes under Varying Exposure Conditions
Adekunle P. Adewuyi1*, Ismaila A. Sulaiman2, Joseph O. Akinyele1
1Department of Civil Engineering, Federal University of Agriculture, Abeokuta, Nigeria 2Department of Engineering, Cappa and D’Alberto Plc, Lagos, Nigeria
Abstract The purpose of this study is to comparatively evaluate the wear resistance of concretes under abrasion rates. Five concrete mix proportions of a fixed wa-ter-cement ratio of 0.45 were considered in the study, but the constituent ma-terials, age of concrete and exposure contact conditions were varied. The coarse aggregate type employed in the study was crushed granite. The com-pressive strength and abrasion resistance of concretes were tested between at ages 7 to 70 days and 100 - 500 revolutions of abrasion wheels respectively. The study revealed that the compressive strength and abrasion resistance had the optimal performance when the coarse aggregate content was 45% and the worst performance when the fine aggregate content was 28.7% of the total weight of concrete constituents. There was a remarkable loss of concrete par-ticles to wear between 200 revs and 300 revs of abrasion wheel contact. Con-crete grade in excess of 60 N/mm2 is required to resist abrasion beyond 200 revolutions of abrasion wheel contact on concrete specimens. Concretes in-vestigated also showed weak resistance to deep abrasion at and above 300 rev-olutions of abrasion wheel contact. Keywords Compressive Strength, Abrasion Resistance, Concretes, Crushed Granite, Cement Content, Durability
1. Introduction
Abrasion is often a foremost operational threat to the quality and durability of existing concrete structures leading to deterioration and premature failure. Con-crete performance is more commonly evaluated with respect to the engineering
How to cite this paper: Adewuyi, A.P., Sulaiman, I.A. and Akinyele, J.O. (2017) Compressive Strength and Abrasion Resis-tance of Concretes under Varying Exposure Conditions. Open Journal of Civil Engi-neering, 7, 82-99. https://doi.org/10.4236/ojce.2017.71005 Received: December 23, 2016 Accepted: March 7, 2017 Published: March 10, 2017 Copyright © 2017 by authors and Scientific Research Publishing Inc. This work is licensed under the Creative Commons Attribution International License (CC BY 4.0). http://creativecommons.org/licenses/by/4.0/
Open Access

A. P. Adewuyi et al.
83
or mechanical properties such as compressive/flexural strengths and modulus of elasticity, and less frequently, tensile strength, shrinkage and creep. Although carbonation, sulphate and chloride penetration resistance, and less frequently, water absorption and air/oxygen permeability have received remarkable atten-tion, abrasion resistance is in fact one of the least investigated durability proper-ties of hardened concrete. However, this is vital in hydraulic structures, floors and highway and runway pavements.
The abrasion resistance of concrete is significantly affected by the exposure conditions, concrete strength, aggregate properties, cementitious materials, cur-ing, methods and surface finish [1]. Extensive literature reports have focused on the investigation of the physical processes involved in abrasive wear of a wide variety of fly ash and silica fumes concrete [2] [3] [4]. The notable standard test methods for abrasion resistance suggest that both the sand blasting method of ASTM C 418 [5] and under-water method of ASTM C 1138 [6] are suitable for evaluating the abrasive erosion resistance of water-borne particles on hydraulic structures. On the other hand, ASTM C 779 [7] and ASTM C 944 [8] are applied to measure the abrasion resistance of pavements and floors.
The abrasion resistance of concrete incorporating haematite as partial re-placement for fine and coarse aggregates was evaluated in line with the Turkish Standard specifications (TS 699) comparable to ASTM C799 [9] [10]. Saikia and de Brito [11] determined the abrasion resistance of concrete containing shred-ded PET bottle waste as a partial replacement of natural aggregate using Böhme apparatus according to the DIN 52108. The effect of class F fly ash and coal bot-tom ash as partial substitutes for fine aggregate and cement on the abrasion re-sistance of concrete was investigated by Siddique’s research team in accordance with Indian Standard IS 1237-1980 [12] [13] [14] [15] [16]. This method is comparable to ASTM C1138M [6] which qualitatively simulates the behaviour of swirling water containing suspended and transported solid objects that cause abrasion of hydraulic concrete structures. Similarly, the underwater method ac-cording to ASTM C 1138 [6] was employed to evaluate the abrasion resistance of alkali-activated slag cement concrete [17], concrete containing marginal aggre-gates [18], high strength concrete (HSC) [19] and influence of class F fly ash as partial replacement for cement in HSC in hydraulic structures [3].
Shamsai et al. [20] showed that reduction of water-cement ratio in nano-silica concrete from 0.5 to 0.33 improved the abrasive strength by 36%, while the conductivity coefficient and porosity decreased. Yen et al. [3] studied the wear- erosion resistance of high strength concrete mixtures in which cement was par-tially replaced by 15%, 20%, 25% and 30% of class F fly ash. The findings showed that wear-erosion resistance of fly ash concrete increased with the compressive strength as the water-cementitious materials ratio decreased. Aginam et al. [21] evaluated the effects of coarse aggregate types on the compressive strength of concrete. It was revealed that crushed granite aggregated concrete produced the best compressive strength, while the unwashed gravel concrete had the least. Apebo et al. [22] comparatively analyzed the compressive strength of concrete

A. P. Adewuyi et al.
84
with gravel and crushed burnt bricks as coarse aggregates. The study categorized crushed bricks concrete as medium lightweight concrete of density 2000-2200 kg/m3.
Extensive studies have shown that the abrasion resistance of concrete depends on its compressive strength and the individual properties of the constituent ma-terials. However, there is no general direct correlation between the aggregate and concrete abrasion test results. Hassan [23] investigated the effect of grading and types of coarse aggregates on the compressive strength and unit weight of con-crete. There is a dearth of investigation on the resistance of concrete to deep ab-rasion according to BS 6717 [24] now modified as BS EN 1338 [25]. This study therefore reports an experimental study on the abrasion resistance of concrete specimens of varying cement and aggregate contents but fixed water-cement ra-tio of 0.45 based on BS EN 1338 [25] at different revolutions of abrasion wheel and curing ages.
2. Experimental Programme 2.1. Materials
Grade 42.5 ordinary Portland cement conforming to BS 12 [26] was used in this study. The properties of cement such as consistency, setting times, soundness and compressive strength are summarized in Table 1. Coarse aggregate was crushed granite of maximum nominal size of 19 mm sourced from Shagamu, Southwestern Nigeria. Fine aggregate was natural coarse sand collected from Ogun River of maximum nominal size of 4.75 mm. The both aggregates were free from deleterious materials and the physical properties were carried out in accordance with BS 812 [27]. The properties of fine and coarse aggregates are presented in Table 2 and the particle distribution curves are plotted in Figure 1. It is obvious that the fine and coarse aggregates employed as constituents of the concrete in the study are well-graded. Potable water of pH of 7.1 which con-formed to the requirements of BS 3148 [28] was used in mixing the aggregates and cement.
2.2. Concrete Mix Proportions
A total of five mixtures designated M1 to M5 with a fixed water-cement ratio of
Table 1. Physical properties of cement.
Standard consistency (%) 30
Specific gravity 3.15
Initial setting time (min) Final setting time (min)
118 215
Soundness (mm) 1.0
Compressive strength (N/mm2) 3 days 7 days
24.5 30.8

A. P. Adewuyi et al.
85
Table 2. Properties of aggregates.
Sand Crushed granite
Specific gravity 2.64 2.70
Bulk density (kg/m3) 1240 1464
Moisture content 4.09 0.6
Fineness modulus 3.00 6.15
Aggregate crushing value (%) 12.9
Impact value (%) 7.13
Figure 1. Particle distribution curves of fine and coarse aggregates.
0.45 were proportioned for the study. The cement contents were in the range 239 - 525 kg/m3, while fine and coarse aggregates were in the ranges 525 - 718 kg/m3 and 954 - 1436 kg/m3 respectively. Mixtures of concrete were prepared in a ro-tating drum mixer. The aggregates and cement were placed in the drum and mixed in parts with water to ensure a better bond between the cement paste and the aggregates. All mixing and sampling of concrete were carried out in accor-dance with the procedures given in BS 1881 [29]. The mix proportioning com-puted using arbitrary volume method is presented in Table 3. Consequently, Conplast SP430 Superplasticizer (a chloride free, super plasticising admixture based on selected sulphonated naphthalene polymers) was added to mixtures M4 and M5 at a dosage of 1 liter per 50 kg of cement to achieve satisfactory workability of 45 mm and 34 mm respectively from the initial slump values of 20 mm and 10 mm.
2.3. Preparation and Casting of Concrete Specimens
Sixty concrete cubes were cast, cured and tested for compressive strength. A to-tal of seventy-five 150 mm concrete cube specimens were cast, cured and tested for compressive strength according to BS 1881 [30], while 300 concrete prisms of
0
20
40
60
80
100
0.01 0.1 1 10 100
Sieve size (mm)
Per
cent
pas
sing
(%)
Granite
Sand

A. P. Adewuyi et al.
86
Table 3. Concrete mix proportion.
Mix constituents M1 M2 M3 M4 M5
Cement (kg/m3) 525 477 404 329 239
Fine aggregate (kg/m3) 525 716 606 658 718
Coarse aggregate (kg/m3) 1050 954 1213 1316 1436
Water (kg/m3) 236 215 182 148 108
Water-cement ratio (w/c) 0.45 0.45 0.45 0.45 0.45
All constituents (kg/m3) 2336 2362 2405 2451 2501
Cement proportion (CP) (%) 22.47 20.19 16.80 13.42 9.56
Cement-total aggregates ratio (CTAR) (%) 33.33 28.56 22.21 16.67 11.10
Coarse aggregate content (CAC) (%) 44.95 40.39 50.44 53.69 57.42
Air temperature (˚C) 25 26 26 27 25
Concrete temperature (˚C) 28 29 28 28 26
Slump (mm) 110 90 46 45 34
size 100 × 100 × 60 mm were cast to determine concrete resistance to deep abra-sion in line with BS EN 1338 [25]. The compressive strengths of the specimens were determined from average crushing load of 150 mm cubes at 7 days, 28 days, 42 days, 56 days and 70 days, while 100 × 100 × 60 mm concrete block specimens were produced for abrasion resistance investigation. Concrete specimens were cast and then covered with thin polythene membrane to minimize moisture loss. The concretes were stored and tested in the laboratory under mean air tempera-ture of 26˚C ± 1˚C. The specimens were demoulded after 24 ± (1/2) hours and then transferred into a water-curing tank for the test periods.
2.4. Tests of Fresh and Hardened Concretes
The workability of the five concrete mixtures designated as M1, M2, M3, M4 and M5 in fresh state was determined through slump test carried out according to BS 1881 [31]. Compressive strength of the 150 mm concrete cube specimens of the five concrete mixtures was determined at the curing ages of 7, 28, 42, 56 and 70 days in line with BS 1881 [30]. The resistance of 100 × 100 × 60 mm concrete specimens of different mix proportions to deep abrasion by a rotating abrasion wheel at constant speed and pressure was tested at curing ages of 28, 42, 56 and 70 days in conformity with BS EN 1338 [25].
The abrasion resistance was determined by measuring the groove length pro-duced in the surface of the specimen by a disc rotating at a constant speed of 75 revolutions per (60 ± 3) s. Measurement of groove length was made for 100, 200, 300, 400 and 500 revolutions of rotating disc. For each test day, the procedure was replicated three times for each specimen at a specified number of revolu-tions. The final thickness of tested sample was taken to determine wear depth for each number of investigated revolutions. The abrasion resistance was measured as a function of the difference in values of groove length measured before and

A. P. Adewuyi et al.
87
after the abrasion test. The schematic test setup for abrasion resistance of con-crete specimen and the Tecnotest D513 abrasion tester are shown in Figure 2.
(a)
(b) (c)
Figure 2. (a) Schematic test setup for abrasion resistance of concrete [6], (b) Tecnotest D513 abrasion tester and (c) abrasion test setup for concrete block.
Abrasion Sand

A. P. Adewuyi et al.
88
3. Results and Discussion 3.1. Compressive Strength
The test results of the compressive strength of the investigated concrete mixture are shown in Figure 3. The compressive strength of the concrete mixtures in-creased as the cement contents increased for all the test days. The rate of com-pressive strength increment was higher in concretes prior to the 28 days age. The results showed that for all the mix proportions, there was a significant increase in the strength of concrete with curing age. The compressive strength values at the 7th day curing ages for all mixes were within 65% - 70% of the 28th day strength values. The strength thereafter increased almost linearly from 28 days to 70 days, a period when considerable hydration of the cement ought to have been attained [32], albeit at a decreasing rate. Even though M2 had the highest fine aggregate content and lowest coarse aggregate amongst the five mixtures, this uniqueness did not reflect in the compressive strength pattern.
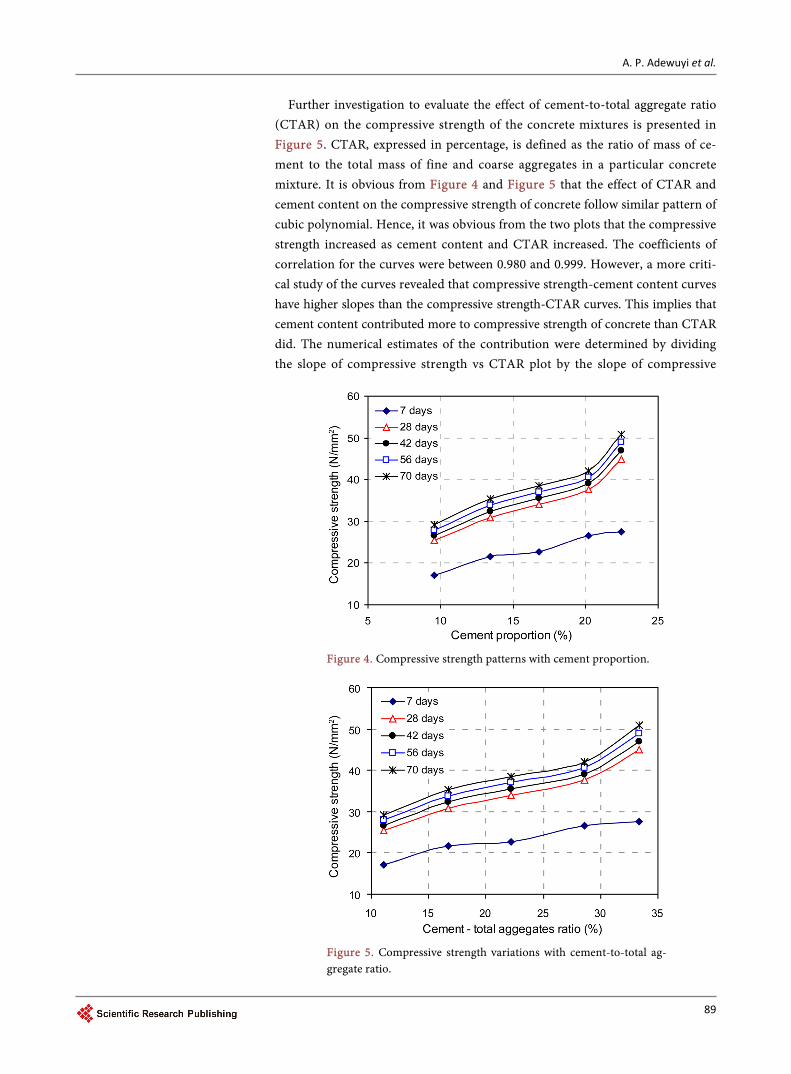
The variation of the compressive strength of the concrete mixtures as a func-tion of cement content is shown in Figure 4. Cement content here was regarded as the percentage mass of cement from the mass of the entire constituents of concrete including water. Coupled with the fact that compressive strength in-creased as the age of concrete increased, the strength also followed similar trend between ages 28 days and 70 days. The 14 days interval resulted in almost equal strength increment with respect to cement proportions. The strength increased at decreasing rates between 10% and 20% cement contents for all the curing ages. However, the strength increased remarkably beyond 20% cement content from ages 28 days and beyond. These findings show a direct relationship between strength and cement content. This is at variance with the position of Wassermann et al. [33] that although strength increases with decrease in wa-ter-cement ratio, it is independent of cement content for a given water-cement ratio in the absence of admixtures.
Figure 3. Compressive strength of various concrete at varying curing ages.
A. P. Adewuyi et al.
89
Further investigation to evaluate the effect of cement-to-total aggregate ratio (CTAR) on the compressive strength of the concrete mixtures is presented in Figure 5. CTAR, expressed in percentage, is defined as the ratio of mass of ce-ment to the total mass of fine and coarse aggregates in a particular concrete mixture. It is obvious from Figure 4 and Figure 5 that the effect of CTAR and cement content on the compressive strength of concrete follow similar pattern of cubic polynomial. Hence, it was obvious from the two plots that the compressive strength increased as cement content and CTAR increased. The coefficients of correlation for the curves were between 0.980 and 0.999. However, a more criti-cal study of the curves revealed that compressive strength-cement content curves have higher slopes than the compressive strength-CTAR curves. This implies that cement content contributed more to compressive strength of concrete than CTAR did. The numerical estimates of the contribution were determined by dividing the slope of compressive strength vs CTAR plot by the slope of compressive
Figure 4. Compressive strength patterns with cement proportion.
Figure 5. Compressive strength variations with cement-to-total ag-gregate ratio.

A. P. Adewuyi et al.
90
strength vs cement content for curing ages 7 days to 70 days. The comparative study of the statistical trend of the compressive strength of hardened concrete showed that the contribution of CTAR to the compressive strength was about 82% of that contributed by cement content at 7 days which dropped to 75% at 70 days.
Kosmatka et al. [34] posited that a wide range in grading can be used without measurable effect on strength provided the water-cement ratio is kept constant and the ratio of fine-to-coarse aggregate is chosen correctly. The comparative study of the influence of fine and coarse aggregates on the compressive strength of the five investigated concrete mixtures is presented in Figure 6. Concrete strength decreased linearly (minimum R2 = 0.97) with increase in fine aggregate content until it attained the minimum value at 28.7% (M5) after which it in-creased linearly up to 30.3% as shown in Figure 6(a). On the other hand, the optimal coarse aggregate content was 45% corresponding to mixture M1 (the mixture with the highest cement content). The compressive strength increased from about 40% (M2) to 45% (M1) beyond which the compressive strength de-creased linearly as the coarse aggregate content increased.
3.2. Abrasion Resistance
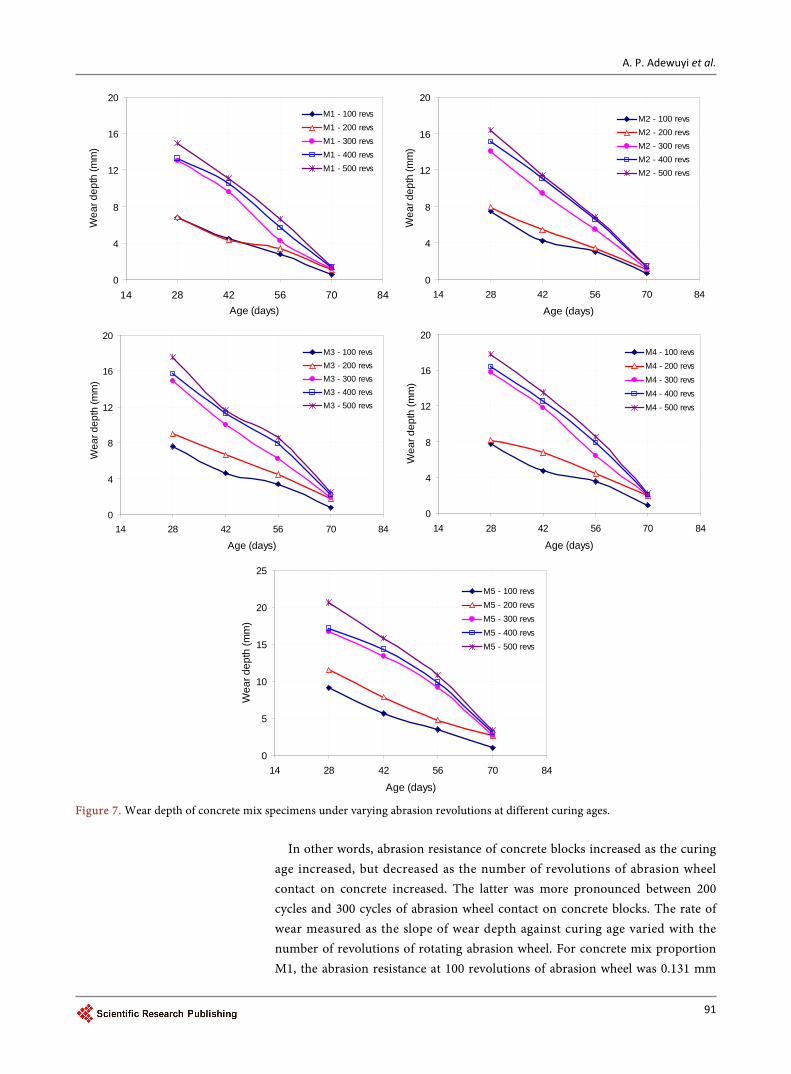
Effect of the number of revolution of abrasion wheel on wear resistance of vari-ous mix proportions is summarized in Figure 7. The relationship between wear depth and curing age for all the investigated mix proportions were best represented by linear equations whose coefficients of correlation ranged between 0.9715 and 0.9994. In all cases, wear depth decreased with curing age of concrete. The equations of the lines of best fit (plotted in Figure 7) for wear depths meas-ured for the five concrete mixtures under the abrasive contact with the rotating disc of different cycles are summarized at different curing ages in Table 4. The average rate of rate of wear and the trend of deterioration due to number of cycles of rotating disc are extracted and discussed in terms of the percentage difference of the slope with respect to the 100 revolutions for each concrete mixture.
(a) (b)
Figure 6. Influence of (a) fine aggregate and (b) coarse aggregate on the compressive strength of concrete.
A. P. Adewuyi et al.
91
Figure 7. Wear depth of concrete mix specimens under varying abrasion revolutions at different curing ages.
In other words, abrasion resistance of concrete blocks increased as the curing
age increased, but decreased as the number of revolutions of abrasion wheel contact on concrete increased. The latter was more pronounced between 200 cycles and 300 cycles of abrasion wheel contact on concrete blocks. The rate of wear measured as the slope of wear depth against curing age varied with the number of revolutions of rotating abrasion wheel. For concrete mix proportion M1, the abrasion resistance at 100 revolutions of abrasion wheel was 0.131 mm
0
4
8
12
16
20
14 28 42 56 70 84Age (days)
Wea
r dep
th (m
m)
M1 - 100 revsM1 - 200 revsM1 - 300 revsM1 - 400 revsM1 - 500 revs
0
4
8
12
16
20
14 28 42 56 70 84
Age (days)
Wea
r dep
th (m
m)
M2 - 100 revsM2 - 200 revsM2 - 300 revsM2 - 400 revsM2 - 500 revs
0
4
8
12
16
20
14 28 42 56 70 84
Age (days)
Wea
r dep
th (m
m)
M3 - 100 revsM3 - 200 revsM3 - 300 revsM3 - 400 revsM3 - 500 revs
0
4
8
12
16
20
14 28 42 56 70 84
Age (days)
Wea
r dep
th (m
m)
M4 - 100 revsM4 - 200 revsM4 - 300 revsM4 - 400 revsM4 - 500 revs
0
5
10
15
20
25
14 28 42 56 70 84
Age (days)
Wea
r dep
th (m
m)
M5 - 100 revsM5 - 200 revsM5 - 300 revsM5 - 400 revsM5 - 500 revs

A. P. Adewuyi et al.
92
Table 4. Statistical trends of wear depth against curing ages for different concrete mixtures and rotating disc cycles.
Wear depth vs curing age (M1)
Designation Wear depth, y (mm) vs age,
t (days) Correlation
coefficient, R2 Percentage difference of the slopes
with reference to that of M1-100 rev Rate of wear (mm/day)
M1 - 100 rev w = −0.1306t + 10.731 0.9973 - 0.131
M1 - 200 rev w = −0.1447t + 10.308 0.9744 (|−0.1447| − |−0.1306|)/|−0.1306|
× 100% = 10.8% 0.145
M1 - 300 rev w = −0.2914t + 21.305 0.9882 123.1% 0.291
M1 - 400 rev w = −0.2907t + 21.94 0.9887 122.6% 0.291
M1 - 500 rev w = −0.3224t + 24.314 0.9957 146.9% 0.322
Wear depth vs curing age (M2)
Designation Wear depth, w (mm) vs age,
t (days) Correlation
coefficient, R2 Percentage difference of the slopes
with reference to that of M2-100 rev Rate of wear (mm/day)
M2 - 100 rev w = −0.1541t + 11.413 0.9715 - 0.154
M2 - 200 rev w = −0.1582t + 12.235 0.9979 (|−0.1582| − |−0.1541|)/|−0.1541|
× 100% = 2.7% 0.158
M2 - 300 rev w = −0.3035t + 22.434 0.9994 97.0% 0.304
M2 - 400 rev w = −0.3252t + 24.508 0.9968 111.0% 0.325
M2 - 500 rev w = −0.3531t + 26.348 0.9992 129.1% 0.353
Wear depth vs curing age (M3)
Designation Wear depth, w (mm) vs age,
t (days) Correlation
coefficient, R2 Percentage difference of the slopes
with reference to that of M3-100 rev Rate of wear (mm/day)
M3 - 100 rev w = −0.1557t + 11.73 0.979 - 0.156
M3 - 200 rev w = −0.1702t + 13.813 0.9975 (|−0.1702| − |−0.1557|)/|−0.1557|
× 100% = 9.3% 0.170
M3 - 300 rev w = −0.3048t + 23.212 0.9976 95.8% 0.305
M3 - 400 rev w = −0.3126t + 24.571 0.9903 100.8% 0.313
M3 - 500 rev w = −0.3438t + 26.908 0.985 120.8% 0.344
Wear depth vs curing age (M4)
Designation Wear depth, w (mm) vs age,
t (days) Correlation
coefficient, R2 Percentage difference of the slopes
with reference to that of M4-100 rev Rate of wear (mm/day)
M4 - 100 rev w = −0.1714t + 11.847 0.9751 - 0.171
M4 - 200 rev w = −0.1903t + 12.651 0.9854 (|−0.1903| − |−0.1714|)/|−0.1714|
× 100% = 11.0% 0.190
M4 - 300 rev w = −0.3354t + 25.43 0.9969 95.7% 0.335
M4 - 400 rev w = −0.3406t + 26.434 0.9913 98.7% 0.341
M4 - 500 rev w = −0.3697t + 28.651 0.9917 115.7% 0.370
Wear depth vs curing age (M5)
Designation Wear depth, w (mm) vs age,
t (days) Correlation
coefficient, R2 Percentage difference of the slopes
with reference to that of M5-100 rev Rate of wear (mm/day)
M5 - 100 rev w = −0.1891t + 14.073 0.9901 - 0.189
M5 - 200 rev w = −0.2124t + 17.089 0.9862 (|−0.2124| − |−0.1891|)/|−0.1891|
× 100% = 12.3% 0.212
M5 - 300 rev w = −0.3301t + 26.656 0.9756 74.6% 0.330
M5 - 400 rev w = −0.334t + 27.456 0.9645 76.6% 0.334
M5 - 500 rev w = −0.4054t + 32.525 0.9891 114.4% 0.405

A. P. Adewuyi et al.
93
per day curing age. There was no clear difference in the abrasive wear of 100 rev and 200 revs of abrasion wheel. The percentage loss of abrasion resistance as the number of revolutions increased to 200 revs, 300 revs, 400 revs and 500 revs were 11%, 123%, 123% and 146% respectively. The massive loss of concrete to abrasion at 300 revs and above clearly showed that the concrete grade was not suitable for such an exposure condition. This particularly was common to all the mix proportions. Concrete mix proportion M2 exhibited slightly less resistance to abrasion than M1. This is better explained by the fact that the compressive strength of M2 was slightly less than that of M1. The mean wear depth per each day of curing age was 0.154 mm. In addition, the abrasion loss increased by 3%, 97%, 111% and 129% at 200 revs, 300 revs, 400 revs and 500 revs of abrasion wheel respectively. It can be concluded from this study that compressive strength is indeed directly related to the abrasion resistance of concrete.
Furthermore, M3 had an average wear of 0.156 mm per day of curing age of concrete at 100 revs of abrasion wheel. Concrete grains lost to wear increased as the number of revolutions of the wheel increased. The abrasion wear of concrete specimen M3 increased by 9%, 96%, 101% and 121% at 200 revs, 300 revs, 400 revs and 500 revs of abrasion wheel respectively. Concrete mix M4 had an aver-age wear of 0.171 mm per each day of curing age at 100 revs of abrasion wheel. Similar to the behaviour of previous concrete mix proportions, abrasion wear increased with the number of cycles made by the abrasion wheel on concrete specimens. The loss of concrete surface to abrasion wear increased by 11%, 96%, 99% and 116% as a result of 200 revs, 300 revs, 400 revs and 500 revs of abrasion wheel respectively. Finally, the average loss of M5 specimens to wear at 100 cycles of abrasion wheel was 0.189 mm per day of curing age. The loss of speci-men surface to varying cycles of abrasion wheel increased by 12%, 75%, 77% and 114% at revs, 300 revs, 400 revs and 500 revs respectively. The experimental in-vestigation agreed with the findings of Siddique [12] [13] that abrasion resis-tance of concrete increased with compressive strength and age for all mix pro-portions. A common observation in all the investigated mixtures is the fact that none of the mixtures was suitable for exposure conditions close to 300 cycles of abrasion wheel and beyond.
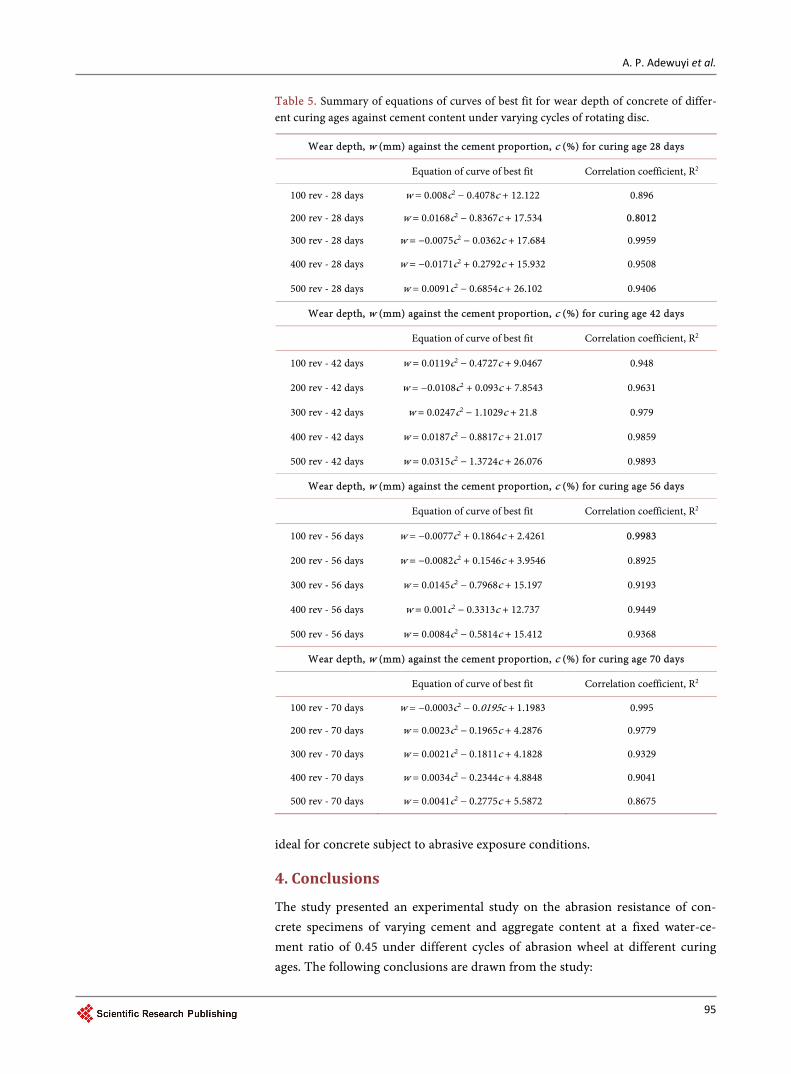
The effects of cement content on abrasion resistance of concrete are presented in Figure 8 for curing ages 28, 42, 56 and 70 days. The equations of curves of best fit representing the relationship between wear depth and cement proportion of concrete of different curing ages and varying cycles rotating disc are summa-rized in Table 5. The relationship between wear depth and cement proportion was quadratic having a correlation coefficients between 0.8012 and 0.9983. The study corroborated previous findings that abrasion resistance decrease with the number of cycles of abrasion wheel on concrete specimens. It was also found to increase with the increase in age for all mixtures. Abrasion resistance, like com-pressive strength, also improved as the cement content in concrete mixture in-creased.
It was also found from the investigation that cement content and cement-total

A. P. Adewuyi et al.
94
Figure 8. Influence of cement contents on abrasion resistance of concrete specimens at different curing ages under varying abra-sion exposures.
aggregate ratio (CTAR) have similar influence on abrasion resistance. Figure 9 shows the relationship between wear depth and cement-total aggregate ratio in concrete specimens. Analysis of the plots showed that abrasion resistance has a quadratic relationship with the percentage of total aggregate represented by ce-ment content with a coefficient of correlation varying between 0.7825 and 0.9967. Age of concrete and cement content as a fraction of total aggregates had direct effects on abrasion resistance. This behaviour is similar to the effect of CTAR on compressive strength thereby confirming the fact that abrasion resistance is di-rectly related to the compressive strength of concrete.
The effect of coarse aggregate content on the abrasion resistance of concrete specimen is presented in Figure 10. The relationship between wear depth and coarse aggregate content in concrete specimens was quadratic with a coefficient of correlation varying 0.6708 and 0.9976. The ability of concrete specimens to resist deep abrasion increased from 40% and peaked at 45% after which there was progressive loss of concrete surface to abrasion wear. As previously estab-lished, abrasion resistance increased with the age of concrete mixtures, but de-creased as the number of cycles of abrasion wheel on the concrete specimens increased. It is therefore obvious that coarse aggregate in excess of 45% is not
5
10
15
20
25
8 12 16 20 24
cement proportion (%)
Wea
r dep
th (m
m)
100 rev - 28 d 200 rev - 28 d300 rev - 28 d 400 rev - 28 d500 rev - 28 d
2
6
10
14
18
8 12 16 20 24
Cement proportion (%)
Wea
r dep
th (m
m)
100 rev - 42 d 200 rev - 42 d300 rev - 42 d 400 rev - 42 d500 rev - 42 d
1
4
7
10
13
8 12 16 20 24
Cement proportion (%)
Wea
r dep
th (m
m)
100 rev - 56 d 200 rev - 56 d300 rev - 56 d 400 rev - 56 d500 rev - 56 d
0
1
2
3
4
8 12 16 20 24Cement proportion (%)
Wea
r dep
th (m
m)
100 rev - 70 d200 rev - 70 d300 rev - 70 d400 rev - 70 d500 rev - 70 d
A. P. Adewuyi et al.
95
Table 5. Summary of equations of curves of best fit for wear depth of concrete of differ-ent curing ages against cement content under varying cycles of rotating disc.
Wear depth, w (mm) against the cement proportion, c (%) for curing age 28 days
Equation of curve of best fit Correlation coefficient, R2
100 rev - 28 days w = 0.008c2 − 0.4078c + 12.122 0.896
200 rev - 28 days w = 0.0168c2 − 0.8367c + 17.534 0.8012
300 rev - 28 days w = −0.0075c2 − 0.0362c + 17.684 0.9959
400 rev - 28 days w = −0.0171c2 + 0.2792c + 15.932 0.9508
500 rev - 28 days w = 0.0091c2 − 0.6854c + 26.102 0.9406
Wear depth, w (mm) against the cement proportion, c (%) for curing age 42 days
Equation of curve of best fit Correlation coefficient, R2
100 rev - 42 days w = 0.0119c2 − 0.4727c + 9.0467 0.948
200 rev - 42 days w = −0.0108c2 + 0.093c + 7.8543 0.9631
300 rev - 42 days w = 0.0247c2 − 1.1029c + 21.8 0.979
400 rev - 42 days w = 0.0187c2 − 0.8817c + 21.017 0.9859
500 rev - 42 days w = 0.0315c2 − 1.3724c + 26.076 0.9893
Wear depth, w (mm) against the cement proportion, c (%) for curing age 56 days
Equation of curve of best fit Correlation coefficient, R2
100 rev - 56 days w = −0.0077c2 + 0.1864c + 2.4261 0.9983
200 rev - 56 days w = −0.0082c2 + 0.1546c + 3.9546 0.8925
300 rev - 56 days w = 0.0145c2 − 0.7968c + 15.197 0.9193
400 rev - 56 days w = 0.001c2 − 0.3313c + 12.737 0.9449
500 rev - 56 days w = 0.0084c2 − 0.5814c + 15.412 0.9368
Wear depth, w (mm) against the cement proportion, c (%) for curing age 70 days
Equation of curve of best fit Correlation coefficient, R2
100 rev - 70 days w = −0.0003c2 − 0.0195c + 1.1983 0.995
200 rev - 70 days w = 0.0023c2 − 0.1965c + 4.2876 0.9779
300 rev - 70 days w = 0.0021c2 − 0.1811c + 4.1828 0.9329
400 rev - 70 days w = 0.0034c2 − 0.2344c + 4.8848 0.9041
500 rev - 70 days w = 0.0041c2 − 0.2775c + 5.5872 0.8675
ideal for concrete subject to abrasive exposure conditions.
4. Conclusions
The study presented an experimental study on the abrasion resistance of con- crete specimens of varying cement and aggregate content at a fixed water-ce- ment ratio of 0.45 under different cycles of abrasion wheel at different curing ages. The following conclusions are drawn from the study:

A. P. Adewuyi et al.
96
Figure 9. Concrete wear depth at varying cement-total aggregates ratios under different abrasion exposures and curing ages.
Figure 10. Concrete wear depth at varying coarse aggregate contents under different abrasion exposures and curing ages.
5
10
15
20
25
10 15 20 25 30 35
Cement-total aggregate ratio (%)
Wea
r dep
th (m
m)
100 rev - 28 d 200 rev - 28 d300 rev - 28 d 400 rev - 28 d500 rev - 28 d
2
6
10
14
18
10 15 20 25 30 35
Cement-total aggregate ratio (%)
Wea
r dep
th (m
m)
100 rev - 42 d 200 rev - 42 d300 rev - 42 d 400 rev - 42 d500 rev - 42 d
0
2
4
6
8
10
12
10 15 20 25 30 35
Cement-total aggregate ratio (%)
Wea
r dep
th (m
m)
100 rev - 56 d 200 rev - 56 d300 rev - 56 d 400 rev - 56 d500 rev - 56 d
0
1
2
3
4
10 15 20 25 30 35
Cement-total aggregate ratio (%)
Wea
r dep
th (m
m)
100 rev - 70 d200 rev - 70 d300 rev - 70 d400 rev - 70 d500 rev - 70 d
0
5
10
15
20
25
35 40 45 50 55 60Coarse aggregate content (%)
Wea
r dep
th (m
m)
100 rev - 28 d200 rev - 28 d300 rev - 28 d400 rev - 28 d500 rev - 28 d
0
5
10
15
20
35 40 45 50 55 60
Coarse aggregate content (%)
Wea
r dep
th (m
m)
100 rev - 42 d200 rev - 42 d300 rev - 42 d400 rev - 42 d500 rev - 42 d
0
2
4
6
8
10
12
35 40 45 50 55 60
Coarse aggregate content (%)
Wea
r dep
th (m
m)
100 rev - 56 d200 rev - 56 d300 rev - 56 d400 rev - 56 d500 rev - 56 d
0
1
2
3
4
35 40 45 50 55 60
Coarse aggregate content (%)
Wea
r dep
th (m
m)
100 rev - 70 d200 rev - 70 d300 rev - 70 d400 rev - 70 d500 rev - 70 d

A. P. Adewuyi et al.
97
1) The abrasion resistance of concrete specimen decreased as the number of cycles of abrasion wheel increased. There were remarkable erosion of concrete particles between 200 cycles and 300 cycles of abrasion wheel contact. Thus, high grade concrete grade is more appropriate for higher erosive surface in terms of frequency and intensity.
2) Compressive strength and abrasion resistance of concrete specimen had the worst performance at 28.7% fine aggregates and best performance when the coarse aggregate was 45%.
3) The compressive strength of concrete had strong influence on its abrasion resistance which improved with increase in age for all concrete mixtures.
4) Cement-total aggregate ratio (CTAR) and cement content of concrete have similar effect on the compressive strength and abrasion resistance of concrete. However, CTAR was found to be a more reliable variable.
References [1] Naik, T.R., Singh, S.S. and Hossain, M.M. (1993) Abrasion Resistance of High-Vo-
lume Fly Ash Concrete System. Rep. No. 176 Prepared for EPRL, Center for By- Products Utilization, University of Wisconsin-Milwaukee.
[2] Siddique, R. (2010) Wear Resistance of High Volume Fly Ash Concrete. Leonardo Journal of Sciences, 17, 21-36.
[3] Yen, T., Hsu, T.-H., Liu, Y.-W. and Chen, S.-H. (2007) Influence of Class F Fly Ash on the Abrasion-Erosion Resistance of High-Strength Concrete. Construction and Building Materials, 21, 458-463. https://doi.org/10.1016/j.conbuildmat.2005.06.051
[4] Naik, T.R., Singh, S.S. and Ramme, B.W. (2002) Effect of Source of Fly Ash on Ab-rasion Resistance of Concrete. Journal of Materials in Civil Engineering, 14, 417- 426. https://doi.org/10.1061/(ASCE)0899-1561(2002)14:5(417)
[5] ASTM C418 (2012) Standard Test Method for Abrasion Resistance of Concrete by Sandblasting. ASTM International, West Conshohocken.
[6] ASTM C1138M (2012) Standard Test Method for Abrasion Resistance of Concrete (Underwater Method). ASTM International, West Conshohocken.
[7] ASTM C779/C779M (2012) Standard Test Method for Abrasion Resistance of Ho-rizontal Concrete Surface. ASTM International, West Conshohocken.
[8] ASTM C944/C944M (2012) Standard Test Method for Abrasion Resistance of Con-crete or Mortar Surfaces by the Rotating-Cutter Method. ASTM International, West Conshohocken.
[9] Gencel, O., Ozel, C. and Filiz, M. (2011) Investigation on Abrasive Wear of Con-crete Containing Hematite. Indian Journal of Engineering & Materials Sciences, 18, 40-48.
[10] Gencel, O., Gok, M.S. and Brostow, W. (2011) Effect of Metallic Aggregate and Ce-ment Content on Abrasion Resistance Behaviour of Concrete. Materials Research Innovations, 15, 116-123. https://doi.org/10.1179/143307511X12998222918877
[11] Saikia, N. and de Brit, J. (2014) Mechanical Properties and Abrasion Behaviour of Concrete Containing Shredded PET Bottle Waste as a Partial Substitution of Natu-ral Aggregate. Construction and Building Materials, 52, 236-244. https://doi.org/10.1016/j.conbuildmat.2013.11.049
[12] Siddique, R. (2003) Effect of Fine Aggregate Replacement with Class F Fly Ash on the Abrasion Resistance of Concrete. Cement and Concrete Research, 33, 1877-

A. P. Adewuyi et al.
98
1881. https://doi.org/10.1016/S0008-8846(03)00212-6
[13] Siddique, R. (2004) Performance Characteristics of High-Volume Class F Fly Ash Concrete. Cement and Concrete Research, 34, 487-493. https://doi.org/10.1016/j.cemconres.2003.09.002
[14] Siddique, R., Kapoor, K., Kadri, E. and Bennacer, R. (2012) Effect of Polyester Fi-bres on the Compressive Strength and Abrasion Resistance of HVFA Concrete. Construction and Building Materials, 29, 270-278. https://doi.org/10.1016/j.conbuildmat.2011.09.011
[15] Siddique, R. (2013) Compressive Strength, Water Absorption, Sorptivity, Abrasion Resistance and Permeability of Self-Compacting Concrete Containing Coal Bottom Ash. Construction and Building Materials, 47, 1444-1450. https://doi.org/10.1016/j.conbuildmat.2013.06.081
[16] Singh, M. and Siddique, R. (2015) Properties of Concrete Containing High Volumes of Coal Bottom Ash as Fine Aggregate. Journal of Cleaner Production, 91, 269-278. https://doi.org/10.1016/j.jclepro.2014.12.026
[17] Mohebi, R., Behfarnia, K. and Shojaei, M. (2015) Abrasion Resistance of Alka-li-Activated Slag Concrete Designed by Taguchi Method. Construction and Build-ing Materials, 98, 792-798. https://doi.org/10.1016/j.conbuildmat.2015.08.128
[18] Kumar, G.B.R. and Sharma, U.K. (2014) Abrasion Resistance of Concrete Contain-ing Marginal Aggregates. Construction and Building Materials, 66, 712-722. https://doi.org/10.1016/j.conbuildmat.2014.05.084
[19] Horszczaruk, E. (2005) Abrasion Resistance of High-Strength Concrete in Hydrau-lic Structures. Wear, 259, 62-69. https://doi.org/10.1016/j.wear.2005.02.079
[20] Shamsai, A., Peroti, S., Rahmani, K. and Rahemi, L. (2012) Effect of Water-Cement Ratio on Abrasion Strength, Porosity and Permeability of Nano-Silica Concrete. World Applied Sciences Journal, 17, 929-933.
[21] Aginam, C.H., Chidolue, C.A. and Nwakire, C. (2013) Investigating the Effects of Coarse Aggregate Types on the Compressive Strength of Concrete. International Journal of Engineering Research and Application, 3, 1140-1144.
[22] Apebo, N.S., Iorwua, M.B. and Agunwamba, J.C. (2013) Comparative Analysis of the Compressive Strength of Concrete with Gravel and Crushed over Burnt Bricks as Coarse Aggregates. Nigeria Journal of Technology, 38, 7-11.
[23] Hassan, N.S. (2011) Effect of Grading and Types of Coarse Aggregates on the Com-pressive Strength and Unit Weight of Concrete. Iraqi Academic Scientific Journal, 24, 74-87.
[24] British Standard Institution (2001) BS 6717: Precast, Unreinforced Concrete Paving Blocks, Requirements and Test Methods. British Standard Institution, London.
[25] European Committee for Standardization (2003) BS EN 1338: Concrete Paving Blocks. Requirements and Test Methods. European Committee for Standardization, Brussels.
[26] British Standard Institution (1996) BS 12: Specification for Portland Cement. British Standard Institution, London.
[27] British Standard Institution (1995) BS 812: Methods for Sampling and Testing of Mineral Aggregates, Sands and Fillers. Part 103. British Standard Institution, Lon-don.
[28] British Standard Institution (1980) BS 3148: Methods of Test for Water for Making Concrete. British Standard Institution, London.
[29] British Standard Institution (1996) BS 1881: Methods for Mixing and Sampling Fresh Concrete in the Laboratory. Part 125. British Standard Institution, London.

A. P. Adewuyi et al.
99
[30] British Standard Institution (1983) BS 1881: Method for Determination of Com-pressive Strength of Concrete Cubes. British Standard Institution, London.
[31] British Standard Institution (1983) BS 1881: Method for Determination of Slump. Part 102. British Standard Institution, London.
[32] British Standard Institution (1985) BS 8110: Structural Use of Concrete—Part 2. Code of Practice for Special Circumstances. British Standard Institution, London.
[33] Wassermann, R., Katz, A. and Bentur, A. (2009) Minimum Cement Content Re-quirements: A Must or a Myth? Materials and Structures, 42, 973-982. https://doi.org/10.1617/s11527-008-9436-0
[34] Kosmatka, S.H., Kerkhoff, B. and Panarese, W.C. (2003) Design and Control of Concrete Mixtures. 14th Edition, Portland Cement Association, Skokie.
Submit or recommend next manuscript to SCIRP and we will provide best service for you:
Accepting pre-submission inquiries through Email, Facebook, LinkedIn, Twitter, etc. A wide selection of journals (inclusive of 9 subjects, more than 200 journals) Providing 24-hour high-quality service User-friendly online submission system Fair and swift peer-review system Efficient typesetting and proofreading procedure Display of the result of downloads and visits, as well as the number of cited articles Maximum dissemination of your research work
Submit your manuscript at: http://papersubmission.scirp.org/ Or contact [email protected]