comptia managed-services best-practices study what about
TRANSCRIPT

CompTIA Managed-Services Best-Practices StudyWhat About Profi tability?
October 2008

What About Profi tability? - Page 2
CompTIA Managed-Services Best-Practices StudyWhat About Profi tability?
TABLE OF CONTENTS
1. Executive Summary................................................................................................3
II. Managed Services Profi tability.............................................................................5
III. Targeting Customers.............................................................................................8
IV. Pricing Strategy.....................................................................................................11
V. Designing the Service Offering.........................................................................14
VI. Resource Allocation............................................................................................17
VII. Service Delivery & Performance......................................................................20
VIII. Conclusion............................................................................................................22
IX. Appendix: General Profi le of Respondents..................................................24
1815 S. Myers Road, Suite 300Oakbrook Terrace, IL 60181-5228Ph. [email protected]
925 15th Street NW4th FloorWashington DC 20005Ph. [email protected]
What About Profi tability? - Page 3
I. EXECUTIVE SUMMARYHow should managed service providers (MSPs) design, price, market and deliver their offerings in order to maximize profi ts? As the economy turns downward, what steps can MSPs take to guard against profi t erosion? In order to address these and related issues regarding pricing and profi tability, CompTIA partnered with Kotler Marketing Group to conduct an in-depth study with more than 200 MSP owners and senior executives in the United States and Canada. The research was conducted during late September and early October of 2008. To qualify as an MSP, the respondent’s company had to generate at least 10% of revenue from managed services, with this fi gure reported as between 20% and 50% for the majority of respondents.
Despite the economic crisis unfolding as the survey was in the fi eld, most respondents remain optimistic about the growth prospects for managed services. More than one-half of respondents expect their managed-service revenues to increase by 25% or more in 2009 compared to 2008.
Growth markets, however, attract new entrants. Many of the MSPs surveyed see competition growing substantially during the next 12 months.
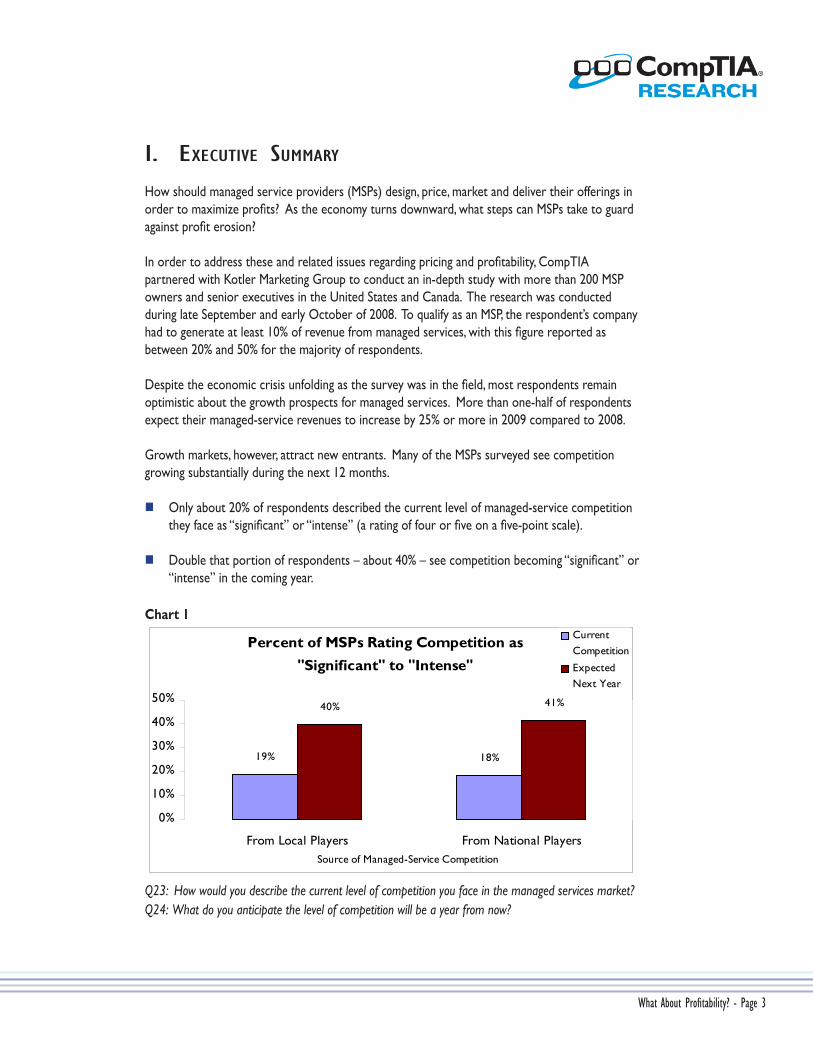
Only about 20% of respondents described the current level of managed-service competition they face as “signifi cant” or “intense” (a rating of four or fi ve on a fi ve-point scale).
Double that portion of respondents – about 40% – see competition becoming “signifi cant” or “intense” in the coming year.
Chart 1
Percent of MSPs Rating Competition as "Significant" to "Intense"
19% 18%
40% 41%
0%
10%
20%
30%
40%
50%
From Local Players From National Players
CurrentCompetition
ExpectedNext Year
Source of Managed-Service Competition
Q23: How would you describe the current level of competition you face in the managed services market? Q24: What do you anticipate the level of competition will be a year from now?

How much of a threat does this increasing competition pose to MSPs’ profi tability? One way to gauge the impact is to compare the profi t margins of respondents who currently face competing bids most often (more than 50% of the time), compared to those who currently face competing bids least often (less than 5% of the time).
The former group’s operating margins were on average an overwhelming 28% lower than the latter group’s. While not all MSPs should expect that level of damage to their margins, it is clear that a substantial portion of profi t is at risk as competition grows.
It is therefore timely to examine in detail the best-practices that characterize the most profi table MSPs operating today. This study identifi es these most profi table MSPs as “Profi t Leaders” and examines what they do differently than the least profi table ones (aka “Profi t Laggards”). Key fi ndings about “Profi t Leaders” include:
They earn a signifi cantly higher percentage of their managed-service revenues from whatever industry vertical they focus on most. In other words, they take a more targeted marketing approach, compared to other MSPs.
To set pricing, they most often use a value-based approach of analyzing the ROI their customers realize from managed services. By comparison, “Profi t Laggards” most often base their pricing on their own costs of service delivery.
In part because of how they structure their SLAs, they are able to deliver more consistently on promised service levels than other MSPs.
They invested signifi cantly less than others in technology and new hiring when they launched their managed-service business. At the same time, they invested slightly more in training and outside consultants.
They pay their sales staff and senior technicians higher salaries, but still earn more revenue per billable employee than other MSPs.
All of the above help enable them to achieve higher customer retention rates, earn higher margins, and recoup their investment faster than other MSPs.
The report that follows discusses each of these fi ndings in detail.
CompTIA Defi nition of Managed Services The ongoing management, monitoring, and maintenance of networks, software, hardware,
and related IT services by an external organization. Managed services are often marked by detailed service level agreements (SLAs), which typically include provisions for performance, security, effi ciency, accountability, response times, and relevant upgrades.1
1 See: “CompTIA Research: Opportunities in Managed Services,” February 2007.
What About Profi tability? - Page 4
What About Profi tability? - Page 5
II. MANAGED SERVICE PROFITABILITY
The managed-services business model has proven to be a profi table one. As noted in a previous CompTIA study, MSPs benefi t from a combination of factors:1
2
The proactive service model creates signifi cant effi ciencies. For example: staffi ng for scheduled preventive maintenance requires fewer technicians than staffi ng for an unknown, randomly-generated volume of service calls.
The fact that many services get delivered remotely via the Internet, and with a high level of automation, creates further effi ciencies.
Recurring revenues, in the form of monthly fees, allow MSPs to plan and allocate resources more effi ciently.
Indeed, participants in the current study anticipate strong margins for 2008 – both in terms of gross profi t and operating profi t.
Respondents anticipate average gross profi t margins of 42% for 2008. Here gross profi t was defi ned as “managed service revenues minus sales commissions and direct costs.”
Respondents anticipate average operating profi t margins of 28% for 2008. Operating profi t was defi ned as “managed service revenues less direct and indirect costs.”
“Profi t Leaders” vs. “Profi t Laggards”
While most respondents reported healthy profi t margins, the study found signifi cant variance among MSPs. This variance offers an opportunity to benchmark against the most profi table group of MSPs and identify best practices for profi tability. The study defi ned two key groups for benchmarking purposes:
“Profi t Leaders” are respondents in the top quartile (25%) based on operating profi t margin. These respondents all anticipate operating margins of 40% or more for their managed-service business in 2008.
“Profi t Laggards” are respondents in the bottom quartile (25%) based on operating profi t margin. These respondents all anticipate operating margins of less than 15% for their managed-service business in 2008
1
2 See “Managed Services Best Practices for Profi t-Minded Service Providers,” CompTIA Research, October 2007.

What About Profi tability? - Page 6
Chart 2
Managed-Service Profitability Quartiles
Operating
Margins of
<15%
Operating
Margins of
15% to 39%
Operating
Margins of
40% or more
0%
10%
20%
30%
40%
50%
60%
70%
80%
90%
100%
Per
cent
of R
espo
nden
ts
"Profit Leaders"
"Profit Laggards"
Q25: For the managed-services portion of your business, what are your anticipated margins for this year?
In order to validate these defi nitions, we compared the two groups along a number of other business dimensions besides operating profi t. Using the defi nitions above yielded the following results:
Profi t Leaders achieved a faster payback on their initial investment in managed services – 13 months on average, versus 18 months for Profi t Laggards.
57% of Profi t Leaders reported that their profi t margins grew in 2008, compared to only 37% of Profi t Laggards reporting increased profi t margins this year.
The average Profi t Leader anticipates 49% growth in their managed-service revenue in 2009 – compared to 35% anticipated revenue growth for the average Profi t Laggard.
Note that we defi ned the groups based on operating margin as opposed to gross margin. This was because there was greater variance in the data on managed-service gross margins, suggesting inconsistency in which of their costs respondents counted as “direct” versus “indirect.” Since operating margins net out both direct and indirect costs, respondents’ interpretations of the question appear to have been more consistent.

What About Profi tability? - Page 7
Chart 3
Average Expected Revenue Growth
31%
47%51%
0%
10%
20%
30%
40%
50%
60%
Profit Laggards
Overall
Profit Leaders
Q10: What is your anticipated growth rate for managed-services revenues next year (2009 vs. 2008)?
Chart 4
Average Payback Period (Months)
18
15
13
0
2
4
6
8
10
12
14
16
18
Profit Laggards
Overall
Profit Leaders
Q30: Have you broken even on your initial investment yet? If yes, how long did it take from your launch date?

What About Profi tability? - Page 8
III. TARGETING CUSTOMERS
The study found that best-practice MSPs take a more targeted approach to marketing their services. Profi t Leaders generate a larger percent of managed-service revenue from a single industry vertical, whereas Profi t Laggards are less focused on any one industry. In terms of customer size, both groups focus on customers with 10-to-100 employees. But Profi t Leaders are more likely to get the lion’s share of their revenue from this “sweet-spot” customer demographic, again illustrating their more targeted approach.
More targeted marketing affords best-practice MSPs key advantages that tend to increase profi tability. These include:
Word-of-mouth: Members of the same industry or profession have established networks which allow word-of-mouth to spread faster, thereby lowering marketing costs and increasing sales.
Niche pricing: Industry-specifi c service offerings, expertise, and experience can justify higher fees.
Learning-curve benefi ts: Similarities across customers means MSPs can more easily leverage knowledge gained serving one organization to more effi ciently serve the next one. This tends to lower service-delivery costs.
By Industry
To gauge their degree of focus on a single industry vertical, respondents were asked to consider the primary industry they serve as well as what percentage of their managed-service revenue comes from that industry. The results from the latter part of the question are shown in the chart below.
Chart 5
Percent of Managed-Service Revenue
from a Single Industry 53%
44% 46%
0%10%20%30%40%50%60%
Profit Laggards
Overall
Profit Leaders
Q12: Consider the industry vertical where you have the most managed-service customers (e.g. law fi rms,healthcare, etc.). What percent of your managed-service revenue come from this industry?

What About Profi tability? - Page 9
Which industries in particular are most profi table to serve? To answer this question, all survey respondents were grouped according to the primary industry they serve. Then average managed-service operating margins were analyzed for each group. The resulting ranking is shown below.
Chart 6
Average Operating Profit Margins,
by Primary Industry Served
24%
27%
30%
36%
37%
0% 10% 20% 30% 40%
Nonprofit/Education/Govt
Manufacturing
Professional Services
Healthcare
Financial
*Only includes respondents generating 25% or more of managed-service revenue from a single industry.
Q12: Consider the industry vertical where you have the most managed-service customers (e.g. law fi rms, healthcare, etc.). What is the industry?
Note one potential downside of focusing too much on any one industry – increased exposure to problems in that sector. For example, the fi nancial industry ranks highly in terms of current (2008) profi tability, as shown above. However, if we rank the industry groupings not by 2008 profi tability, but instead by expected revenue growth in 2009, the results are very different. Those MSPs targeting fi nancial services rank at the bottom in terms of anticipated growth. This most likely has a lot to do with the fi nancial crisis currently hitting that sector.
Chart 7
Average Expected Growth, by Primary Industry Served
34%
37%
42%
52%
78%
0% 10% 20% 30% 40% 50% 60% 70% 80% 90%
Financial
Professional Services
Healthcare
Nonprofit/Education/Govt
Manufacturing
*Only includes respondents generating 25% or more of managed-service revenue from a single industry.
Q12: Consider the industry vertical where you have the most managed-service customers (e.g. law fi rms, healthcare, etc.). What is the industry?

What About Profi tability? - Page 10
Targeting By Customer Size
As can be seen in the chart below, most respondents say they earn most of their revenue from customers with 10-to-100 employees. This is especially true of Profi t Leaders. However, Profi t Laggards tend to rely more on customers outside of this “sweet spot.” This could drag on their profi tability in one of two ways:
Larger customers tend to wield more negotiating power, which they can use to drive down price. They also may have in-house IT departments that can be more demanding, thereby increasing service costs.
Serving very small customers (e.g. less than 10 employees) can lead to a higher cost-of-sales as a percentage of revenue.
Chart 8
Percent of Revenue by Customer Size
15%
44%
23%
13%6%6%
55%
24%
14%
2%0%0%
0%
10%
20%
30%
40%
50%
60%
70%
Less than 10 10-49 50-99 100-199 200-499 500 or more
Number of employees
Profit Laggards
Profit Leaders
Q11: Which segment accounts for the biggest portion of your managed-service customers and revenues?
What About Profi tability? - Page 11
IV. PRICING STRATEGY
The study found that Profi t Leaders take a more disciplined, value-based approach to pricing than their less-profi table MSP peers. At a more tactical level, best-practice MSPs tend to use simpler pricing structures as opposed to more complex ones that can be diffi cult to manage and control.
To gauge their strategic approach, respondents were fi rst asked which of the following had been most useful to them in setting price:
Studies from trade groups and research fi rms on average MSP prices;
Their own research into other local MSPs’ pricing;
Analyzing their own service-delivery costs;
Analyzing the benefi ts/ROI of managed services for their customers.
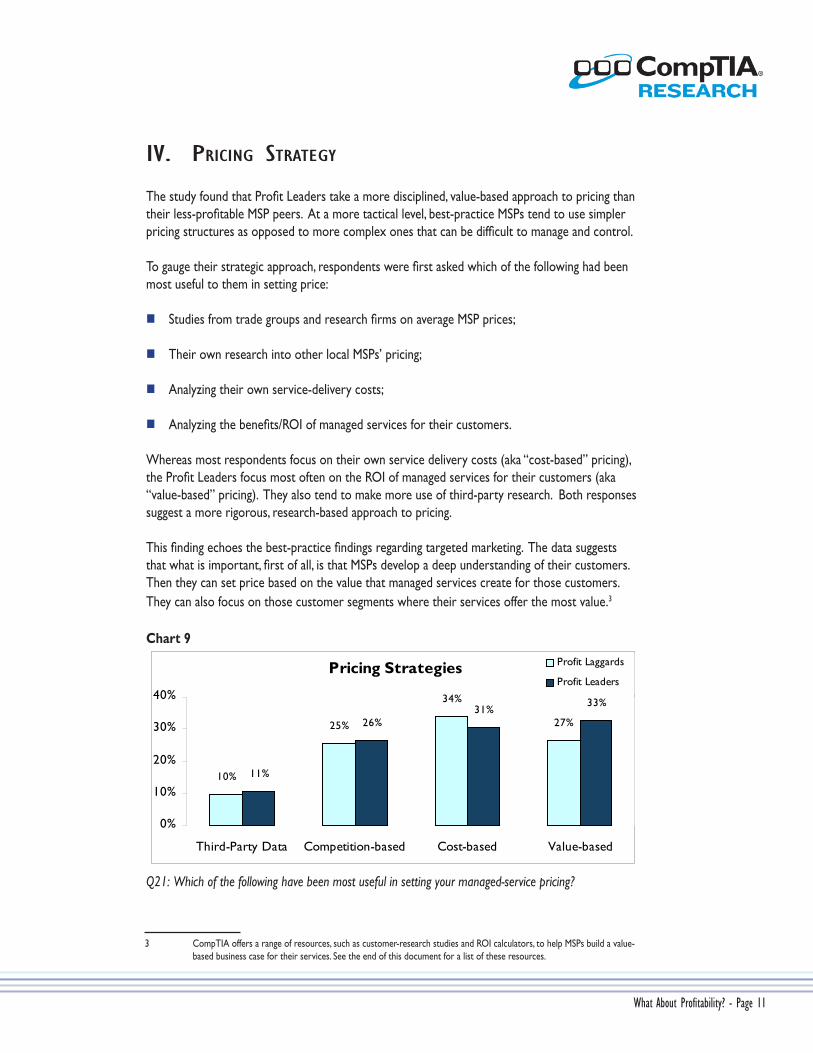
Whereas most respondents focus on their own service delivery costs (aka “cost-based” pricing), the Profi t Leaders focus most often on the ROI of managed services for their customers (aka “value-based” pricing). They also tend to make more use of third-party research. Both responses suggest a more rigorous, research-based approach to pricing.
This fi nding echoes the best-practice fi ndings regarding targeted marketing. The data suggests that what is important, fi rst of all, is that MSPs develop a deep understanding of their customers. Then they can set price based on the value that managed services create for those customers. They can also focus on those customer segments where their services offer the most value.312
Chart 9
Pricing Strategies
10%
25%
34%
27%
11%
26%31%
33%
0%
10%
20%
30%
40%
Third-Party Data Competition-based Cost-based Value-based
Profit Laggards
Profit Leaders
Q21: Which of the following have been most useful in setting your managed-service pricing?
1
3 CompTIA offers a range of resources, such as customer-research studies and ROI calculators, to help MSPs build a value- based business case for their services. See the end of this document for a list of these resources.

What About Profi tability? - Page 12
Secondly, the fi ndings suggest that MSPs should choose a pricing structure that is simple enough for sales people to apply in a consistent, disciplined manner. Complex pricing structures tend to be harder to implement consistently, which in turn can lead to mismatches between price and delivery cost.
Profi t Leaders tend to avoid multi-level pricing (e.g. “Bronze,” “Silver,” and “Gold” options), an approach that Profi t Laggards are more likely to use.
Profi t Leaders also price their services per-device more often than other respondents. Profi t Laggards, on the other hand, are more likely to use a hybrid approach – sometimes pricing per-user, other times per-device – or to take other approaches such as customized pricing based on time estimates. These latter approaches can be more diffi cult to manage and to execute consistently.
Chart 10
Pricing with Multiple Levels of Service
(i.e. "Gold," "Silver," etc.)55%
46%
38%
0%
10%
20%
30%
40%
50%
60%
Profit Laggards
Overall
Profit Leaders
Q15: Do you have multiple service-plan levels (e.g. Bronze, Silver, Gold) with different SLA terms and prices?
Chart 11
Pricing Structures
65%
10% 10%15%
75%
10% 6% 10%
0%10%20%30%40%50%60%70%80%
Per Device Per User Both Other
Profit Laggards
Profit Leaders
Q14: How do you price your managed services contracts?

What About Profi tability? - Page 13
Lastly, and not surprisingly, the data suggests that Profi t Leaders command higher prices for comparable services. Given the diffi culty of comparing multi-level service plans, the study only compared respondents who charge per-device, with a single level of pricing. While variations in pricing clearly refl ect differences in SLA terms, the overall comparison between Profi t Leaders and Profi t Laggards shows that Profi t Leaders:
Charge an average of 37% more per server under contract.
Charge an average of 31% more per network device under contract.
Charge an average of 55% more per desktop or PC under contract.
Note that charging higher prices is not necessarily a best practice in-and-of itself. Rather it is other best practices – in areas such as pricing strategy, targeting, service delivery, etc. – that allow leading MSPs to successfully charge higher prices.

What About Profi tability? - Page 14
V. DESIGNING THE SERVICE OFFERING
MSPs face two central questions when designing their service offerings:
Is it better to focus on delivering a few services well, or to offer customers an “end-to-end” solution that covers a broad array of services?
Even with an end-to-end strategy, not all services can be offered. Which services in particular will be most profi table?
The study yields confl icting results on the fi rst question. When we asked respondents how they describe their differentiation and value proposition to customers, 25% said they stress the breadth of their managed service offering. This was the second most-popular response. Only 3% said they emphasized specializing in a few services.
Chart 12
Value Proposition
�� ����
����
��
�� ����
��
���
��
��
��
��
��
��
��
��
���
���
��
���
��
���
���
���
0%
10%
20%
30%
40%
50%
Aggre
ssive
prici
ng
Under
stand
ing of
verti
cal m
arket
Certifi
catio
ns, c
rede
ntials
Geogra
phic
prox
imity
to cu
stomer
Bran
d nam
es of
vend
ors t
hat I
sell
Brea
dth/ c
omple
tenes
s of s
ervic
e offe
rings
Spec
ializi
ng in
one o
r jus
t a fe
w servi
ces
Relatio
nship
s with
custo
mers
Other
Profit Laggards
OverallProfit Leaders
Q13: How would you best describe your differentiation and value proposition to your managed-service customers?
What About Profi tability? - Page 15
Similarly, when asked how they plan to improve their managed-service profi tability going forward, 15% said they plan to broaden their offering (again, the second most-popular response). Again only 3% said they planned to narrow their offering.
Clearly, many MSPs believe that a broad managed-service offering is desirable.
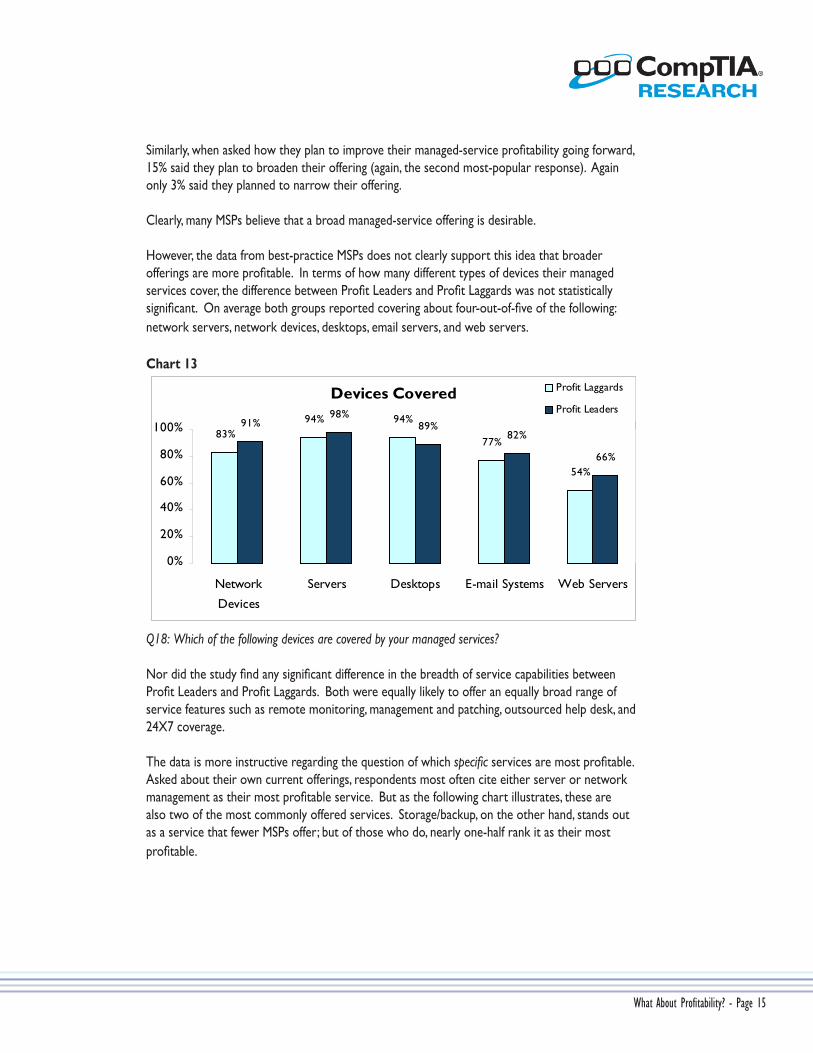
However, the data from best-practice MSPs does not clearly support this idea that broader offerings are more profi table. In terms of how many different types of devices their managed services cover, the difference between Profi t Leaders and Profi t Laggards was not statistically signifi cant. On average both groups reported covering about four-out-of-fi ve of the following: network servers, network devices, desktops, email servers, and web servers.
Chart 13
Devices Covered
83%94% 94%
77%
54%
91%98%
89%82%
66%
0%
20%
40%
60%
80%
100%
Network
Devices
Servers Desktops E-mail Systems Web Servers
Profit Laggards
Profit Leaders
Q18: Which of the following devices are covered by your managed services?
Nor did the study fi nd any signifi cant difference in the breadth of service capabilities between Profi t Leaders and Profi t Laggards. Both were equally likely to offer an equally broad range of service features such as remote monitoring, management and patching, outsourced help desk, and 24X7 coverage.
The data is more instructive regarding the question of which specifi c services are most profi table. Asked about their own current offerings, respondents most often cite either server or network management as their most profi table service. But as the following chart illustrates, these are also two of the most commonly offered services. Storage/backup, on the other hand, stands out as a service that fewer MSPs offer; but of those who do, nearly one-half rank it as their most profi table.

What About Profi tability? - Page 16
Chart 14
Most Profitable Managed Services
7%
17%
28%
13%
6% 5%
14%
75% 74%
81%78%
64% 64%
29%
0%
10%
20%
30%
40%
50%
60%
70%
80%
90%
100%
Networ
k/fire
wall m
onito
ring
Networ
k Man
agem
ent
Serve
r Man
agem
ent
Deskto
p Man
agem
ent
Helpde
sk Fu
nctio
ns
Man
agem
ent
Storag
e/bac
kup/d
isaste
r
% ranking it as most profitable
% offering the service
Q27: Indicate which of the managed services you offer are most profi table, on a per-customer basis.

What About Profi tability? - Page 17
VI. RESOURCE ALLOCATION
The study found that Profi t Leaders allocate their fi nancial resources differently than Profi t Laggards in two key areas:
The one-time investments they made to launch their managed-service businesses;
The salaries they pay their technical and sales employees.
Investment
When asked how much they have invested in their managed-service business to date, respondents not only disclosed how much, but also where they invested. For respondents across the board, technology was their biggest investment. However, it is the least profi table MSPs who invested the most in this area – about $70,000 more on average than Profi t Leaders. Profi t Laggards also invested more in hiring new employees – about $23,000 more on average than Profi t Leaders.
These fi ndings suggest that that taking a “big bang” approach to launching a managed-service business – bringing in expensive tools and new hires – can be a risky one.
Chart 15
Investment$162,744
$44,979
$100,258
$21,403
$93,639
$21,843
$0
$25,000
$50,000
$75,000
$100,000
$125,000
$150,000
$175,000
Technology Hiring Process
Profit Laggards
Overall
Profit Leaders
Q29: How much have you invested to-date in your managed-service business, in each of the following areas?
In contrast, Profi t Leaders invest more than Profi t Laggards in two other areas:
Training managed-service personnel; and
Business consultants and other outside expertise.

What About Profi tability? - Page 18
Although these two areas require noticeably lighter investments than technology, they can yield important benefi ts in terms of employee retention, customer satisfaction, and solving specifi c business problems where outside experts can help.
Chart 16
Investment (cont)
$28,021$30,753
$25,339 $25,770
$34,969$39,435
$0
$10,000
$20,000
$30,000
$40,000
$50,000
Training Other
Profit Laggards
Overall
Profit Leaders
Q29: How much have you invested to-date in your managed-service business, in each of the following areas?
Staffi ng
The study looked at compensation levels for employees in three different categories:
Junior level technicians
Senior level technicians
Salespeople (including any bonus or commissions)
In regards to junior level staff, Profi t Leaders on average do not pay a higher wage than Profi t Laggards do. Profi t Leaders do pay higher salaries to senior-level technicians, but only about $4,000 per annum more on average. The stark difference can be seen in the annual salaries of salespeople. Profi t Leaders on average pay their salespeople over $15,000 more per annum than Profi t Laggards do.

What About Profi tability? - Page 19
Chart 17
Compensation
$36,538
$63,205$58,950
$38,004
$65,552 $68,634
$35,592
$67,855$74,239
$0
$20,000
$40,000
$60,000
$80,000
$100,000
Junior technicians Senior technicians Salespeople
Profit Laggards
Overall
Profit Leaders
Q32: What is the average annual salary at your company for the following job roles?
Although junior-level technicians contribute to the quality of service of many MSPs, senior-level people often play a larger role. Indeed, one of the advantages of the MSP model is that automated tools and remote service provision allow providers to better leverage their most experienced technicians.
Skilled salespeople can also impact success more in the MSP model than in traditional product sales. The managed-service sales process tends to be longer and more consultative, and requires more interaction with business decision-makers, not just IT staff.
Thus, while Profi t Leaders pay their key employees more, they end up earning a better return on their salary expenses than do other MSPs. They earn more revenue per employee – about $50,000 more – than their Profi t-Laggard peers, as shown below.
Chart 18
Managed-Service Revenue per
Billable Employee
$112,780$131,517
$165,974
$0$25,000$50,000$75,000
$100,000$125,000$150,000$175,000$200,000
Profit Laggards
Overall
Profit Leaders

What About Profi tability? - Page 20
VII. SERVICE DELIVERY & PERFORMANCE
Respondents overall reported high performance levels on key service metrics. The average compliance with response-time SLAs was nearly 95%. These high service levels contributed to an average renewal rate of 93% on managed service contracts.
“Profi t Leaders” performed at an even higher level than other MSPs, as shown in the charts below.
Chart 19
Percent of Incidents
Out of Compliance
6.1%5.7%
3.4%
0%
5%
10% Profit Laggards
Overall
Profit Leaders
Q34: Do you track your compliance with the response times listed in your managed-service SLAs?Q35: If yes to the previous question, what % of incident responses are out of compliance?
Chart 20
Customer Defection Rate9.3%
6.7%
4.1%
0%
5%
10%
Profit Laggards
Overall
Profit Leaders
Q38: What % of your managed service customers whose contracts expired during the past six months renewed their contract?

What About Profi tability? - Page 21
Several previously mentioned study fi ndings may help explain this performance advantage:
Profi t Leaders invest more in training their managed-service staff. They also pay higher salaries to their senior managed-service technicians. The combination
of higher salaries and the investment in training creates a “career ladder” for good employees, enticing them to stay, which in turn creates continuity in providing good service to customers.
Profi t Leaders also structure their SLAs so that response time commitments align with, rather than undermine, profi tability goals.
The last point is a subtle one that deserves elaboration. Study participants were asked what response time they promise for high-priority (e.g. “system down” or “P1”) events. Respondents with multi-level offerings (e.g. “Bronze,” “Silver,” and “Gold”) reported separate response times for each level. What is noteworthy is the differences between basic (e.g. “Bronze”) plans and premium (e.g. “Gold”) plans. The difference is much larger, on average, in Profi t Leaders’ SLAs than in SLAs of Profi t Laggards.
Chart 21
Average "System-Down"
Response Time Commitment
4 32
10
14
19
0
4
8
12
16
20
24
Profit Laggards Overall Profit Leaders
Hou
rs
Premium Plans
Basic Plans
Q19: What response time do you typically promise in your SLA for high-priority (e.g. “system-down”) events?
In other words, Profi t Leaders offer customers a starker choice between a low-priced, weak SLA versus a premium-priced, strong SLA. These MSPs can then focus more of their staff resources on high-paying customers. At the same time they do not over-promise to lower-paying customers. The result (the data suggests) is higher SLA compliance, and ultimately customer retention.

What About Profi tability? - Page 22
VIII. CONCLUSION
Prospects for the managed-service market continue to look strong, despite the weakening economy. Indeed, it can be argued that managed services are a good “down market” offering due to the cost savings many customers realize from outsourcing IT management and support tasks.
At the same time, strong markets attract competition, especially when the broader economy is struggling. Study participants expect intensifying competition in the coming year – from both local competitors as well as from big national players. And increased competition means that MSPs need to focus more than ever on profi tability.
Based on detailed survey data from 201 MSP owners and executives, this study identifi ed best-practices for increasing profi t margins. But the fi ndings cover a broad range of business areas, including targeting strategy, designing service offerings, pricing, and allocating resources. So, which best-practices are most important? Where should an MSP owner start?
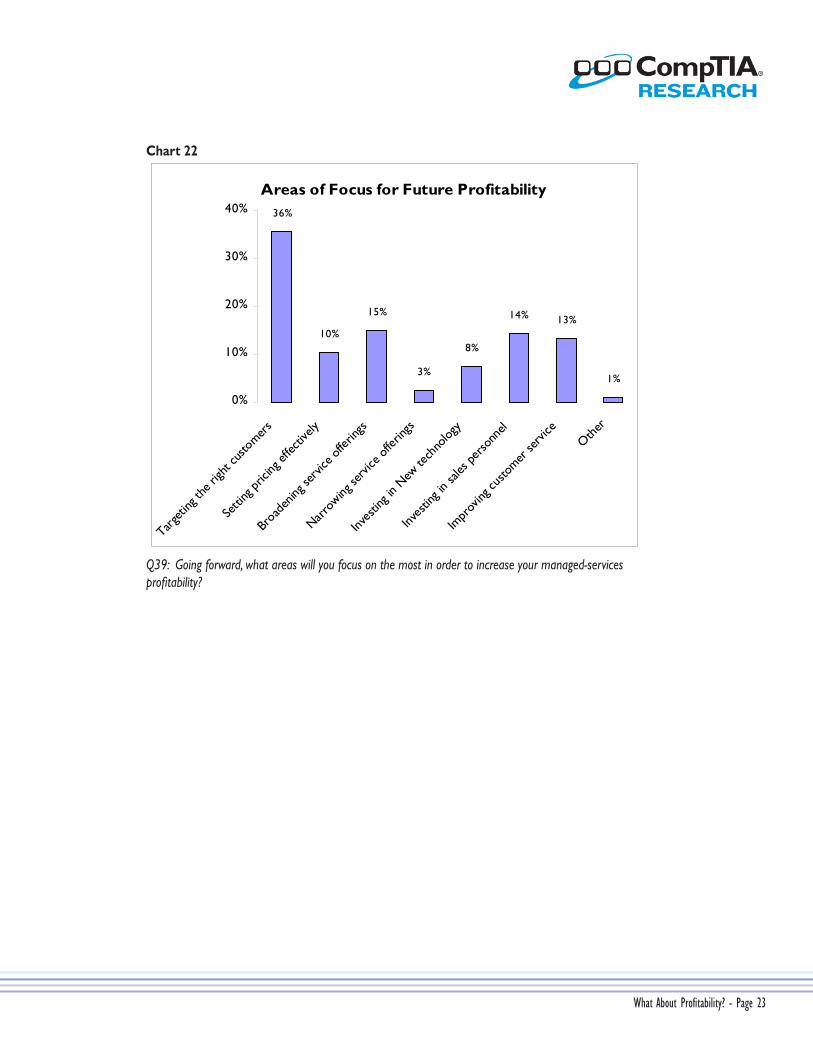
Study participants were asked which areas they plan on focusing on in order to increase their profi tability. Their answers are shown on the following page. In general, they correspond with the fi ndings from the study.
Targeting the right customers should be a top priority. Getting this right makes it easier to implement other important best-practices, such as:
Designing service offerings that address the key needs of target segments, and that can be executed on consistently;
Pricing service offerings based on the value that they deliver to target segments.
Investing in employees – both sales personnel and those delivering the services – is also critical. In the end, they have the biggest day-to-day impact on whether an MSP acquires and retains profi table customers.
The one area where the study fi ndings do not fully support participants’ focus is “broadening the offering.” It appears to be more important to offer the right services – ones you can deliver profi tably and deliver well – rather than more services just for the sake of breadth.
As increasing competition and a slowing economy impact the managed-service market, MSPs who have invested in these areas will be prepared to meet these challenges and maintain profi table growth.
What About Profi tability? - Page 23
Chart 22
Areas of Focus for Future Profitability36%
10%
15%
3%
8%
14% 13%
1%
0%
10%
20%
30%
40%
Targeti
ng th
e righ
t cus
tomer
s
Setti
ng pr
icing
effec
tively
Broad
ening
servi
ce of
fering
s
Narrow
ing se
rvice
offer
ings
Inves
ting i
n New
tech
nolog
y
Inves
ting i
n sale
s per
sonn
el
Impr
oving
custo
mer se
rvice
Other
Q39: Going forward, what areas will you focus on the most in order to increase your managed-services profi tability?

What About Profi tability? - Page 24
IX. APPENDIX: GENERAL PROFILE OF RESPONDENTS
The on-line survey was conducted during September and October of 2008 with 201 owners or senior managers at companies that provide managed services.
Respondents provided data on more than forty different business metrics and practices including, pricing, services offered, markets served, employee compensation, capital expenditures, and service metrics.
The majority of companies surveyed either launched their managed services business prior to 2000 or within the past three years.
Launch Date of Managed Services Business 16.49% Prior to 2000 5.32% 2001 3.19% 2002 5.32% 2003 8.51% 2004 61.17% 2005-2008
Geographically, survey respondents came primarily from the US, with approximately 5% coming from Canada. The largest group of these North American companies serves large cities, whereas companies serving small towns only comprised 2% of all responses.
Chart 23
Areas Primarily Served by Respondents
44%
38%
12%
2% 3%
Large city / metropolitanarea
Mid-size city / metropolitanarea
Small city
Small town / rural
Other
Q7: What best describes the area(s) you primarily serve?

What About Profi tability? - Page 25
Profi le by Percent of Revenue From Managed Services
The majority of companies surveyed earn less than one-half of their revenues through managed services. In fact, 29% of responses came from companies that only make 11-20% of their revenues from managed services. However, 31% of respondents still labeled their companies as “IT managed services.”
Chart 24
Percent of Revenue from Managed Services
29%
54%
17%
11-20%
21-50%
51-100%
Q4: What percent of your company’s revenues (projected for 2008) come from each of the following business areas?
Profi le by Revenue
The average expected 2008 year-end revenues for managed services was $534,253. The median was $200,000. Several large numbers for 2008 year-end revenues make the average far above the median. Overall, respondents ranged across a wide spectrum in terms of year-end revenues, but most were small MSPs.
Chart 25
Revenues for 2008
20%
12%
23%
18%
15%
11%
Less than $50K
$50K to $99K
$100K to $249K
$250K to $499K
$500K to $1M
Over $1M
Q9: What are your anticipated managed-service revenues from these customers for this year (2008)?

What About Profi tability? - Page 26
Profi le by Number of Customers Served
The average number of customers served at a single company was 51, and the median was 20. Again, these results show that most respondents were small MSPs.
Chart 26
Number of Customers Served
23%
35%
26%
6%
10%
Less than 10
10 to 24
25 to 50
51 to 100
Over 100
Q8: How many managed-service customers do you currently have under contract?

What About Profi tability? - Page 27
COMPTIA RESEARCH ON MANAGED SERVICESThe information contained throughout CompTIA research studies is proprietary to CompTIA. Small segments may be quoted if proper citation is made. For more information, please contact [email protected].
Additional CompTIA research and sales tools related to this topic include:
Sales Quick Guides – quick reference guides for MSP salespeople, describing the key IT systems for different customer segments, and the business issues that arise when those systems go down. Quick Guides are available for healthcare, fi nancial services, legal and manufacturing.
CompTIA Managed Services ROI Calculator – an online calculator that allows MSPs to demonstrate the business value of managed services. Calculations cover reduced IT labor costs and the value of avoiding costly IT system downtime, and are backed up with extensive CompTIA research with SMB end-users.
“Making the Case for Managed Services - The Business Impact of IT Problems at SMBs,” CompTIA Research study, January 2008.