computational analysis for improved design of an sae baja
TRANSCRIPT

UNLV Theses, Dissertations, Professional Papers, and Capstones
12-2010
Computational analysis for improved design of an SAE BAJA Computational analysis for improved design of an SAE BAJA
frame structure frame structure
Nagurbabu Noorbhasha University of Nevada, Las Vegas
Follow this and additional works at: https://digitalscholarship.unlv.edu/thesesdissertations
Part of the Mechanical Engineering Commons
Repository Citation Repository Citation Noorbhasha, Nagurbabu, "Computational analysis for improved design of an SAE BAJA frame structure" (2010). UNLV Theses, Dissertations, Professional Papers, and Capstones. 736. http://dx.doi.org/10.34917/2016694
This Thesis is protected by copyright and/or related rights. It has been brought to you by Digital Scholarship@UNLV with permission from the rights-holder(s). You are free to use this Thesis in any way that is permitted by the copyright and related rights legislation that applies to your use. For other uses you need to obtain permission from the rights-holder(s) directly, unless additional rights are indicated by a Creative Commons license in the record and/or on the work itself. This Thesis has been accepted for inclusion in UNLV Theses, Dissertations, Professional Papers, and Capstones by an authorized administrator of Digital Scholarship@UNLV. For more information, please contact [email protected].
COMPUTATIONAL ANALYSIS FOR IMPROVED DESIGN OF AN SAE BAJA
FRAME STRUCTURE
by
Nagurbabu Noorbhasha
Bachelor of Technology in Mechanical Engineering Jawaharlal Nehru Technological University, India
April - 2003
A thesis submitted in partial fulfillment of the requirements for the
Master of Science Degree in Mechanical Engineering Department of Mechanical Engineering
Howard R. Hughes College of Engineering
Graduate College University of Nevada, Las Vegas
December 2010

Copyright by Nagurbabu Noorbhasha 2011 All Rights Reserved

THE GRADUATE COLLEGE
We recommend the thesis prepared under our supervision by
Nagurbabu Noorbhasha
entitled
Computational Analysis for Improved Design of an SAE BAJA Frame Structure
be accepted in partial fulfillment of the requirements for the degree of
Master of Science in Mechanical Engineering
Brendan J O’Toole, Committee Chair
Mohammed Trabia, Committee Member
Reynolds Douglas, Committee Member
Aly M Said,, Graduate Faculty Representative
Ronald Smith, Ph. D., Vice President for Research and Graduate Studies
and Dean of the Graduate College
December 2010

iii
ABSTRACT
Computational Analysis for Improved Design of an SAE BAJA Frame Structure
by
Nagurbabu Noorbhasha
Dr. Brendan J. O’Toole, Examination Committee Chair Associate Professor of Mechanical Engineering
University of Nevada, Las Vegas
Baja SAE is an intercollegiate competition to design, fabricate, and race a
small, single passenger, off-road vehicle powered by a 10 HP Briggs &
Stratton 4-Stroke gasoline engine. All Baja SAE vehicles for the
competition are powered by a small engine, thus large part of vehicle
performance depends on the acceleration and maneuverability of the
vehicle which is proportional to the weight of the chassis and rollcage. As
weight is critical to achieve the greater performance of the vehicle, a
balance must be found between the strength and weight of the rollcage to
ensure the safety of the driver.
The objective of the present research was to optimize the design of
roll cage in compliance with the guidelines set by SAE and to perform the
finite element analysis (FEA) for validating the design. Initially, a
preliminary design of the rollcage was produced based on the rules of the
competition and a 3-D model was generated using CAD. To study the
effects of stress and deformation on the frame members, linear static

iv
frontal impact analysis was carried out using FEA techniques for
different loading conditions on the rollcage model. The static analysis in
this research is focused to obtain the optimum grid size for the rollcage
structure. Modifications were done to the existing design to withstand
the applied load based on the analysis results for the optimum mesh
size. The design was considered to be safe if the generated roll-cage Von
Mises stresses were less than the yield strength of the material and the
deflections of the members were favorable enough for the safety of the
driver. The research also presents different approaches to achieve the
optimum design of the roll cage. The new design was subjected to FEA
for validation.
Dynamic analysis was also performed on the vehicle chassis to
review the structural rigidity of the chassis frame. A full vehicle
modeling was carried out for the equivalent mass distribution of the
vehicle. An initial velocity of 6.7 m/s (15 mph) is ascribed to the full
vehicle model to impact a fixed rigid wall to investigate the effects of
dynamic stresses, energy, reaction forces and acceleration of the frame
members in a worst case loading scenario. Different ways of mitigating
the acceleration on the chassis are also discussed in this research for the
driver safety.

v
ACKNOWLEDGEMENTS
I deeply express my sincere gratitude to my advisor Dr. Brendan J.
O’Toole for trusting my abilities to work on this project. His invaluable
guidance, suggestions, thoughts throughout the entire course of this
research work is priceless. It has been very rewarding and satisfying
experience to be able to work with him. I am also grateful to Department
of Mechanical Engineering, Unversity of Nevada Las Vegas for providing
me the oppurtunity to pursue my master degree.
I would like to thank Dr. Mohamed B. Trabia, Dr. Reynolds Douglas
and Dr. Aly M. Said for their time in reviewing the prospectus,
participation in defense and counseling of the thesis as committee
members.
Last but not the least, I would like to thank my parents, family and
friends, and all the other people whom I have not mentioned above but
have helped me in some way through the completion of my thesis degree.
I would like to take this opportunity to express my gratitude to those who
have helped me bring this thesis to a successful end with their
knowledge, help and co-operation.

vi
TABLE OF CONTENTS
ABSTRACT ........................................................................................... iii
ACKNOWLEDGEMENTS ........................................................................ v
LIST OF FIGURES ...............................................................................viii
LIST OF TABLES .................................................................................. ix
CHAPTER 1 INTRODUCTION............................................................... 1 1.1 Background.................................................................................. 1 1.2 SAE Baja Frame Design Objectives ............................................... 2 1.3 Frontal Impact Testing.................................................................. 6 1.4 Objective of the Research............................................................ 10
CHAPTER 2 FINITE ELEMENT ANALYSIS .......................................... 12
2.1 Preprocessor Altair HyperMesh ................................................... 12 2.2 Solver OptiStruct........................................................................ 14 2.3 Solver LS-DYNA.......................................................................... 16 2.4 Post processor Altair HyperView ................................................. 17
CHAPTER 3 LINEAR STATIC FRONTAL IMPACT ANALYSIS................ 20
3.1 Design Methodology.................................................................... 20 3.2 Development of a preliminary design .......................................... 23
3.2.1 Design Guidelines ............................................................. 24 3.2.2 The Mini Baja Guidelines .................................................. 25 3.2.3 Adequate Operator Space .................................................. 25
3.3 Geometry Development............................................................... 26 3.4 Material Selection....................................................................... 30 3.5 Linear Static Frontal Impact Analysis ......................................... 33
3.5.1 Loading / Boundary Conditions......................................... 34 CHAPTER 4 RESULTS & DISCUSSION FOR THE STATIC ANALYSIS.. 37
4.1 Grid Independence ..................................................................... 37 4.2 Strengthening Mechanism .......................................................... 49
4.2.1 Providing gussets at the critical joints of the frame ............ 50 4.2.2 Effect of gusset size on stress concentration ...................... 51
4.3 Load carrying capacity of the frame ............................................ 56 4.4 Design modification .................................................................... 59
CHAPTER 5 DYNAMIC FRONTAL IMPACT ANALYSIS ......................... 62
5.1 Dynamic Analysis ....................................................................... 62 5.2 Design Methodology for Dynamic Analysis .................................. 64

vii
5.3 Geometry Development............................................................... 65 5.4 Materials .................................................................................... 66
5.4.1 *MAT_PLASTIC_KINEMATIC .............................................. 67 5.5 Contact Surfaces ........................................................................ 67
5.5.1 *CONTACT_TIED_SURFACE_TO_SURFACE....................... 68 5.6 Rigid Wall ................................................................................... 69
5.6.1 *RIGIDWALL_PLANAR ....................................................... 69 5.7 Loads and Boundary Conditions................................................. 69
5.7.1 INITIAL_VELOCITY_NODE................................................. 70 5.8 Frontal Impact Analysis Results Discussion:............................... 71
CHAPTER 6 SUMMARY, CONCLUSION AND FUTURE WORK ............ 78 6.1 Research Summary and Conclusion ........................................... 78 6.2 Future Work............................................................................... 81
REFERENCES ..................................................................................... 82
APPENDIX A SAE BAJA RULES 2009 .................................................. 85
APPENDIX B EXAMPLE LS-DYNA PROGRAM ...................................... 96
VITA .................................................................................................... 99

viii
LIST OF FIGURES
Figure 1.1 Full width and frontal offset crash test.................................. 7
Figure 3.1 Flow chart for generic illustration of design process ............ 22
Figure 3.2 Pro/Engineer model for the rollcage frame .......................... 27
Figure 3.3 HyperMesh model of the rollcage frame member.................. 28
Figure 3.4 Magnified view of the meshed rollcage model....................... 29
Figure 3.5 2D Element quality report................................................... 30
Figure 4.1 Mesh configuration for various grid sizes............................. 40
Figure 4.2 Location of maximum Von Mises stress for various mesh sizes........................................................................................................... 42
Figure 4.3 Grid independence study graph for the max Von Mises stress........................................................................................................... 44
Figure 4.4 Grid independence study graph for the max displacement... 44
Figure 4.5 Selected locations of the points ........................................... 45
Figure 4.6 Grid independence study graph for stress at selected locations........................................................................................................... 46
Figure 4.7 Grid independence study graph for displacement at selected locations.............................................................................................. 47
Figure 4.8 Provision of gussets at the frame joints ............................... 51
Figure 4.9 Effect of gusset size on the max Von Mises stress of the frame........................................................................................................... 55
Figure 4.10 Effect of gusset size on the max. displacement of the frame55
Figure 4.11 Effect of impact load on maximum Von Mises stress ......... 58
Figure 4.12 Effect of impact load on maximum displacement ............... 58
Figure 4.13 New design of the chassis frame/rollcage .......................... 60
Figure 4.14 Von Mises stress distribution in the frame for 31138 N impact load ......................................................................................... 60
Figure 4.15 Displacement in the frame at 31138 N impact load ........... 61
Figure 5.1 Chassis/Rollcage model for multi body dynamic analysis .... 66
Figure5.2 Velocity profile of the rollcage structure................................ 72
Figure 5.3 Rigid wall force history profile of the rollcage structure during the impact ........................................................................................... 73
Figure 5.4 Deformation of the frame members at different stages of impact................................................................................................. 75
Figure 5.5 Energy plots for impact loading........................................... 75
Figure 5.6 Acceleration profiles during the impact ............................... 76

ix
LIST OF TABLES
Table 3.1 Material Property of the Frame ............................................. 33
Table 4.1 Effect of maximum stress and displacement on mesh size .... 41
Table 4.2 Von Mises stress at selected locations after the impact loading........................................................................................................... 46
Table 4.3 Displacement of the frame at selected locations after the impact........................................................................................................... 47
Table 4.4 Effect of the mesh size on computation time & memory ........ 48
Table 4.5 Effect of gusset size on the max. Von Mises stress of the frame........................................................................................................... 53
Table 4.6 Effect of gusset size on the max. displacement of the frame .. 54
Table 4.7 Effect of impact load on Von Mises stress and displacement . 57
Table 5.1 LS-DYNA material models..................................................... 67
1
CHAPTER 1
INTRODUCTION
1.1 Background
SAE Baja is an intercollegiate engineering design competition for
undergraduate and graduate engineering students organized by the
Society of Automotive Engineers (SAE). The objective of the competition is
to simulate real-world engineering design projects and their related
challenges. A team of students (SAE BAJA team) has to design, fabricate,
and race an off-road vehicle powered by a 10 HP Briggs and Stratton
gasoline engine. Typical capabilities on basis of which these vehicles are
judged are hill climb, load pull, rock crawl, acceleration, maneuverability
and endurance on land as well as water.
All SAE approved Baja vehicles are required to use a 10 horsepower
four-stroke engine. The engine cannot be enhanced in any way to ensure
uniform comparison of overall vehicle design. Thus, a large part of
vehicle performance depends on the drive train and the maneuverability
of the vehicle. By improving drive-train efficiency, the vehicle will
accelerate faster and achieve a higher top speed. The other contributing
factor for the vehicle performance is acceleration and maneuverability.
The total weight of the vehicle including the driver weight has significant
impact on performance. Overall, a light vehicle should perform better
since the engine capacity is fixed.

2
Driver safety is an important concern in the design of the vehicle. The
rollcage part of the chassis is the primary protection for the driver. So to
ensure driver safety, the rollcage must be structurally rigid. As weight is
critical in a vehicle powered by a small engine, a balance must be found
between the strength and weight of the vehicle. Thus the chassis design
becomes very important in the vehicle performance.
1.2 SAE Baja Frame Design Objectives
The design of the SAE Baja frame is heavily influenced by the safety rules
set out by the competition organizers. These rules are updated yearly to
address new safety concerns. The frame design discussed in this report
is in compliance with the 2009 Baja SAE Rules [1]. These rules define the
frame design in two ways. First, the rules set specific requirements on
minimum frame cross-section flexural strength. This flexural strength
can be achieved by any combination of material and cross-section
geometry. Smaller members can be used with stronger materials. They
also define the specific requirements of the frame geometry, such as
maximum length, width and height as well as minimum clearance
between driver and frame members. The requirements were referenced
when making decisions regarding the material selection, design geometry
and any additional modifications to the design. A thorough review of the
different types of chassis designs and rules were made at the end of the
design stage before fabrication [2, 3, 4]. This review included not only the

3
letter of the guideline but also a discussion of the intent. In any cases in
which the clarity or meaning of a rule was in doubt, the SAE rules
committee was contacted to ensure compliance.
The following functional and design requirements were used as guides in
the design process. Functionally, the vehicle should [5]:
1. Allow for easy driver entrance and exit
2. Be aesthetically pleasing
3. Be rugged, dependable, and easy to maintain
4. Be able to operate across rough terrain
5. Cost less than $2,500
6. Maintain safety as a primary consideration
The scope of the design includes [5]:
1. A four-wheel vehicle with a roll cage with appropriate bracing
which meets or exceeds all requirements of the SAE Mini Baja
competition
2. Optimization of strength/weight ratio for the entire vehicle to
enhance performance
3. A frame constructed of either steel tubing having a minimum
carbon content of 0.18%, outside diameter of 0.0254 m (1.0 in.)
and wall thickness of 0.0021 m (0.083 in.), or material having
equivalent strength and bending modulus.

4
4. A frame designed to incorporate continuous lengths of tubing
where possible to reduce welding and improve strength.
5. Consideration of the reliability and safety of all components,
including frame, suspension, drive train, brakes, and steering
This vehicle was designed and to be produced with semi-skilled labor
in a relatively high production volume, based on the concept of
introducing a new product to the consumer industrial market from a
fictitious company. The team uses learned engineering practices to
design, build, test, and race this vehicle against other student teams, in
a series of competitive events which reward teams for good engineering
and mechanical practices. UNLV SAE Baja chassis/rollcage was designed
to maximize strength and durability, while minimizing weight and
retaining manufacturability [6]. The UNLV SAE BAJA team is relatively
inexperienced compares to most of the schools in the competition. The
team selected the cheapest steel tubing material readily available and
selected the diameter and wall thickness to meet the minimum strength
requirements specified in the rules. This resulted in a relatively weak
material and large tubing dimensions than many competitors. The initial
layout of the frame was chosen based on team members’ best judgment
and the dimensions of the tallest/biggest drivers. As team members
learned the frame rules, additional members were added. The end result
over a 3-year period is a frame that meets the design requirements
5
specified in the rules but was not optimal. It was not optimized because
the team did not have the finances to purchase high strength steel and
they did not have the analysis capability at the beginning of their
design/fabrication phase. ameter and wall thickness to meet the mini
To best optimize the balance between strength, weight, durability and
manufacturability, the use of Computer Aided Design (CAD) modeling
and Finite Element Analysis (FEA) techniques are extremely useful in
addition to conventional analysis. It covers the design constraints
required by SAE, material selection, structural analysis and design
modifications. It will finally cover the results of the actual real world
usage of the frame design.
The frame configuration was designed to incorporate continuous tube
lengths where possible. This helped to keep the frame as strong as
possible, improved efficiency of material usage, reduced the number of
welds required and reduced fabrication time.
The frame was constructed with the following important features [5]:
1. The firewall roll hoop was tilted back at an angle from the vertical
for economy of space.
2. The roll cage widens front to back to increase passenger
accessibility.
3. Tubing joint placements were optimized for greater strength of the
roll cage.

6
4. Continuous sections of tubing were utilized where possible to
increase the manufacturability of the frame by bending the tubing
instead of welding the corners.
5. An adjustable seat to accommodate the height differences of
drivers on the team
1.3 Frontal Impact Testing
The research indicates that most of the automotive fatalities or deaths
occur due to head on or frontal crashes. In order to reduce traffic related
fatalities and injuries, all the vehicles must pass frontal crash test. In the
frontal impact or crash testing the vehicle crashes head-on into a rigid
concrete barrier at certain specified speed. Federal law requires all
passenger cars to pass a 13.4 m/s (30 mph) frontal crash test while the
NCAP tests involve crashing a fixed barrier at 15.64 m/s (35 mph) [7].
Instrumented anthropomorphic dummies are placed in the driver and
passenger seats for the test. Accelerometers are also placed on the
vehicles to record response of structure during the crash. These tests are
conducted to measure how well occupants are protected in a head on
collision. During the test, instrumented dummies are placed in the fully
belted position to measure the force of impact to the chest, head and leg.
The test program deals only with crashworthiness and indicates how well
an automobile can protect its occupants in a frontal collision.

7
There are two types of fixed barrier tests performed to measure the
crashworthiness differences of the vehicles [8]. They are full width rigid
barrier frontal crash test and offset rigid barrier frontal impact test.
Figure 1.1 Full width and frontal offset crash test [8]
Fixed rigid barrier collisions can represent severe automotive impacts.
This test is conducted on automotive vehicles to obtain information of
value in reducing occupant injuries and in evaluating structural
integrity. The barrier device may be of almost any configuration, such as
flat, round, offset, etc. The primary objective of this standard test method
is to provide realistic simulation of the forces which act on vehicles and
occupants during collisions with fixed objects. Measurements of
structural loads and deflections, determination of occupant dynamics,
and photographic and post-collision observations of pertinent special
events may be useful in establishing design criteria.

8
Full-width and offset tests complement each other. Crashing the full
width of a vehicle into a rigid barrier maximizes energy absorption so
that the integrity of the occupant compartment, or safety cage, can be
maintained well in all but very high-speed crashes. Full-width rigid-
barrier tests produce high occupant compartment decelerations, so
they're especially demanding of restraint systems. In offset tests, only
one side of a vehicle's front end, not the full width, hits the barrier so
that a smaller area of the structure must manage the crash energy. This
means the front end on the struck side crushes more than in a full-width
test, and intrusion into the occupant compartment is more likely. The
bottom line is that full-width tests are especially demanding of restraints
but less demanding of structure, while the reverse is true in offsets.
The three factors evaluated in the frontal offset crash test —
structural performance, injury measures, and restraints/dummy
kinematics — determine each vehicle's overall frontal offset
crashworthiness evaluation.
a. Structure/safety cage: Structural performance is based on
measurements indicating the amount and pattern of intrusion into the
occupant compartment during the offset test. This assessment indicates
how well the front-end crush zone managed the crash energy and how
well the safety cage limited intrusion into the driver space. Intrusion is
measured at 9 places in the driver seating area by comparing the

9
precrash and postcrash positions of these 9 points. (The steering wheel
intrusion is split into upward and rearward components to obtain a total
of 10 measurements.) Larger intrusion numbers indicate more collapse of
the safety cage.
b. Injury measures: Obtained from a 50th percentile male Hybrid III
dummy in the driver seat, injury measures are used to determine the
likelihood that a driver would have sustained injury to various body
regions. The measures recorded from the head, neck, chest, legs, and
feet of the dummy indicate the level of stress/strain on that part of the
body. Thus, greater numbers mean bigger stresses/strains and a greater
risk of injury.
c. Restraints/dummy kinematics (movement): Significant injury risk
can result from undesirable dummy kinematics — for example, partial
ejection from the occupant compartment — in the absence of high injury
measures. This aspect of performance involves how safety belts, airbags,
steering columns, head restraints, and other aspects of restraint systems
interact to control dummy movement.
There are different set of rules and test procedures to evaluate the test
results for passenger vehicles. Although, there are no well defined set of
rules for estimating the crashworthiness of the off-road vehicles, the test
methods are evaluated based on the existing rules and procedures.

10
1.4 Objective of the Research
The goal of the present research was to develop the analysis guidelines
for SAE Baja vehicles. The current UNLV Baja frame was analyzed
extensively for several worst case load conditions. Modifications to the
frame for the improved strength and safety were considered. The analysis
recommendations from this work should provide guidelines that will keep
the next UNLV team design a more optimized vehicle frame.
Specific objectives were to:
a) Develop a preliminary design based on specifications given by SAE
[1] by meeting the above mentioned requirement and generate the
rollcage model in Pro/Engineer Wildfire 4.0.
b) Perform a linear static analysis that simulates the loads from a
frontal impact using FEA techniques. Results of interest from this
analysis are Von Mises stress and displacements for different
loading conditions on the rollcage structure. The design is aimed
for a factor of safety of not less than 1.25. The linear static
structural analysis include:
i.Grid independence
ii.Determining the safe loading conditions
iii.Effect of gusset design
iv.Other design modifications

11
c) Perform the multi body dynamic analysis for the frontal impact
crash loading using LS-DYNA to determine acceleration response,
energy dissipation during the impact and reaction force on the
frame structure.

12
CHAPTER 2
FINITE ELEMENT ANALYSIS
FEA is a powerful design tool that has significantly improved both the
standard of engineering designs and the methodology of the design
process. The introduction of FEA has substantially decreased the time to
take products from concept to the production line. It is primarily through
improved initial prototype designs using FEA that testing and
development have been accelerated. In summary, benefits of FEA include
increased accuracy, enhanced design and better insight into critical
design parameters, virtual prototyping, fewer hardware prototypes, a
faster and less expensive design cycle, increased productivity, and
increased revenue. This section includes FEA tools used in the present
research and describes briefly the features and the capabilities of each
tool.
2.1 Preprocessor Altair HyperMesh
Altair HyperMesh is a high-performance finite element preprocessor [9]
that works with many finite element solvers. It allows engineers to
analyze product design performance in a highly interactive and visual
environment. HyperMesh’s user interface is easy to learn and supports a
number of CAD geometry and finite element model file formats, thereby
increasing interoperability and efficiency. Advanced functionality within
HyperMesh allows the user to efficiently manipulate geometry and mesh
13
in highly complex models. These functionalities include extensive
meshing and model control, morphing technology to update existing
meshes to new design proposals and automatic mid-surface generation
for complex designs with varying wall thickness. Solid geometry
enhances tetra-meshing and hexa-meshing by reducing interactive
modeling times, while batch meshing enables large scale meshing of
parts with no manual cleanup and minimal user input.
HyperMesh provides direct access to variety of industry leading CAD
data formats for generating finite element models. Moreover, HyperMesh
has tools to clean up imported geometry containing surfaces with gaps,
overlaps and misalignments that prevent high quality mesh generation.
By eliminating misalignments and holes, and suppressing boundaries
between adjacent surfaces, users can mesh across larger, more logical
regions of the model, while improving overall meshing speed and quality.
Boundary conditions can be applied to these surfaces for future mapping
to underlying future data.
HyperMesh presents users with an advanced suite of easy to use tools
to build and edit CAE models. For 2D and 3D model creation, users have
access to variety of mesh generation, as well as HyperMesh’s powerful
auto meshing module. Automatic mid-surface generation, a
comprehensive laminate modeler and morphing offer new levels of model
manipulation. The surface auto-meshing module in HyperMesh is a tool

14
for mesh generation that provides users with an ability to interactively
adjust a variety of mesh parameters for each surface or surface edge.
These parameters include element density, element biasing and mesh
algorithm. Element generation can be automatically optimized for a set of
user defined quality criteria. User can also employ interactive, process
driven tools within HyperMesh for easy model setup, including model
assembly using connectors, creation of complex contact definitions,
applications of boundary conditions and solver deck preparations.
HyperMesh supports a host of different solver formats for both import
and export. Along with fully supported solvers, HyperMesh also provides
the flexibility to support additional solvers by way of complete export
template language and libraries for the development of input translators.
Although HyperMesh support different solvers, in the present application
OptiStruct and LS-DYNA solvers are used for static analysis and
dynamic analysis respectively to solve the present problem.
2.2 Solver OptiStruct
Altair OptiStruct is highly advanced finite-element-based software for
both structural analysis and design optimization. OptiStruct is used to
design, evaluate and improve performance of mechanical structures.
OptiStruct's design module uses the topology optimization approach to
generate innovative concept-design proposals. In the initial phase of the
development process, the user enters the package space information,

15
design targets and manufacturing process parameters. OptiStruct
generates a design proposal that is optimized for the given design targets.
OptiStruct's analysis module uses the most recent element
formulations and a fast, robust sparse-matrix solver for linear static,
frequency, buckling or simple contact problems. With its large spectrum
of solutions, material models and element types, OptiStruct performs the
majority of analysis types for structural analysis, and generates reliable
and highly accurate results
Shape optimization is applied on existing product components.
OptiStruct’s free-shape optimization can be used to reduce high-stress
concentrations. OptiStruct can also use HyperMesh's morphing
technology to prepare finite element meshes for optimization. As a result,
dramatic shape changes are possible without mesh distortion. OptiStruct
can easily propose design modifications without underlying CAD data,
with minimum user interaction.
OptiStruct is tightly integrated into the HyperWorks environment.
Thus, models can be set up completely in HyperMesh. Animations,
contour plots and charts can be generated using the post-processing
tools in HyperView. OptiStruct uses the NASTRAN syntax to ensure
closed-simulation process chains. Moreover, jobs can be easily
automated by using a powerful automation and data management layer
available in HyperWorks.

16
2.3 Solver LS-DYNA
LS-DYNA is a general purpose explicit and implicit finite element
program used to analyze the nonlinear dynamic response of three
dimensional structures [10]. Its fully automated contact analysis
capability and error checking features have enabled users worldwide to
solve successfully many complex crash and forming problems. LS-DYNA
is one of the premier software’s to study automotive crash and has many
default input parameters tailored for crash simulations. For crash
simulations, the explicit time integration is used due to advantage over
implicit integration method. In the explicit integration method, the
solution is advanced without computing the stiffness matrix thus
dramatically reducing the time of the simulation. Due to these savings,
complex geometries and large deformations can be simulated. LS-DYNA
supports a very extensive library of material models. Over one hundred
metallic and non metallic material models able to simulate elastic, elasto-
plastic, elasto-viscoplastic, Blatzko rubber, foams, glass and composite
materials.
LS-DYNA supports a fully automated contact analysis that is simple
to use, robust and has been validated. It uses the constraint and penalty
method to simulate contact conditions. These methods have been shown
to work particularly well in full vehicle crashworthiness studies,
systems/component analysis and occupant safety studies. LS-DYNA

17
supports over twenty-five contact formulations to treat contacts between
deformable objects and rigid bodies.
2.4 Post processor Altair HyperView
Altair HyperView is a complete post processing and visualization
environment for the finite element analysis, multi body system
simulation, digital video and engineering data. HyperView combines
advanced animation and XY plotting features with window
synchronization to enhance results visualization. Amazingly fast 3D
graphics and unparalleled functionality set a new standard for speed and
integration of CAE results post processing. HyperView supports many
popular CAE solver formats through direct readers, providing flexible and
consistent high performance post processing environment.
HyperView’s animation client provides a complete suite of interactive
post-processing features that dramatically improve results visualization.
HyperView also supports an advanced toolset for model query and
results comparison for single and overlaid models.
The video client in HyperView introduces the unique capability to read
digital video files and synchronize them to CAE animation and XY plot
information for enhanced simulation post-processing and correlation.
The video client directly reads and writes most standard movie file
formats, including AVI, BMP, JPEG, PNG and TIFF. HyperView supports
the following:

18
i. Multi body dynamics animations with flex-bodies
ii. Complex animations and complex stress calculations
iii. Deformed animations
iv. Linear animations
v. Transient animations
HyperView’s plotting client is a powerful data analysis and plotting
tool with interfaces to a wide array of data file formats. Engineers can
build, edit and manipulate 2D curves and 3D plots (such as waterfall,
surface and 3D line plots) a simple point and click environment provides
easy access to curve expressions, axis labels, and legends, plot headers
and footers. In addition, plots can be annotated with advanced notes
using templates, a built-in text and numeric processor. A sophisticated
math engine is capable of processing even the most complex
mathematical expressions.
The publishing session export features allows users to output reports
to HTML or a power point XML of the active HyperView session. Users
can specify which pages are to be written out, as well as specify the
format for each window exported.
HyperView supports many popular CAE solver formats through direct
readers, providing a flexible and consistent high performance post
processing environment. Additional solver formats can be supported
through user defined results translator that convert results into the

19
Altair H3D compressed binary format. This functionality further
increases the value proposition of HyperView by broadening its ability to
support other commercial and proprietary solver formats.

20
CHAPTER 3
LINEAR STATIC FRONTAL IMPACT ANALYSIS
3.1 Design Methodology
The purpose of this section is to give a basic knowledge of the
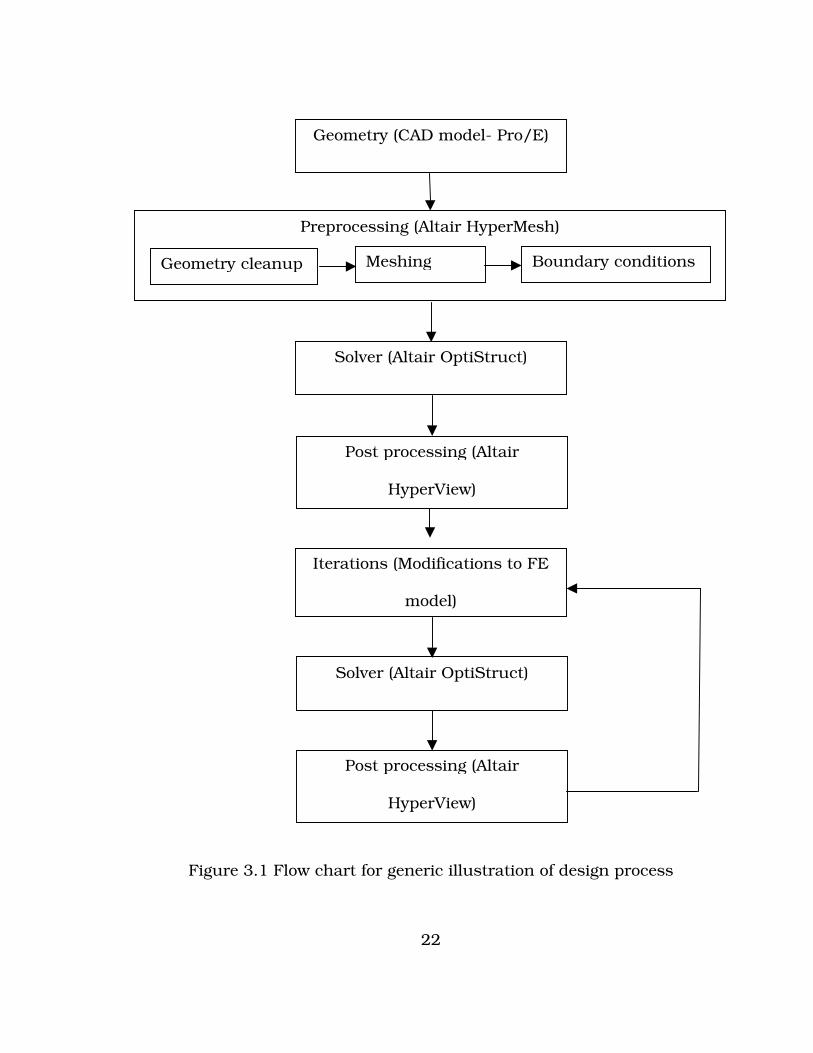
methodology that was used to analyze the SAE Baja frame member. The
Figure 3.1 shows a generic illustration of the major steps involved in the
design optimization process.
1. Considering the objectives, functions, design considerations and
the rules laid by the SAE Baja, preliminary design of the frame
structure was developed.
2. Once the design was established, a CAD model was created using
Pro/Engineer Wildfire 4.0 with the preliminary design. The model
created was fully parametric to ensure that future changes could
be made easily. This model is the basis for creating complex FE
model.
3. A finite element (FE) model was created using shell elements using
Altair HyperMesh, on which structural analysis was performed.
The element quality has been ensured for optimum analysis
results.
4. The next step in the analysis was selection of parameters for
setting simulation. The parameters include material properties,

21
section properties, constraints, loading conditions and other
simulation related parameters.
5. After setting the parameters, the simulation was run using
OptiStruct solver. A static analysis was run for the current
problem in the initial stages to find out the optimum parameters
for the dynamic analysis.
6. The results of the simulation were interpreted in HyperView. The
analysis determines the intensity and the areas of the highest Von
Mises stresses and the deformations that the frame members are
subjected for the applied loads.
7. If the stresses generated in the chassis member were above the
yield limit of the material and/or the deformation of the frame
members were more, then existing frame has been modified for the
improved performance.
8. The new design has been subjected to the structural analysis with
definite input parameters and the process will go on till the
stresses and deformation were within the desired limit.
9. Finally, design engineers who consider all manufacturing and cost
issues in order to develop a final design should interpret the
results of the structural analysis.
22
Figure 3.1 Flow chart for generic illustration of design process
Geometry (CAD model- Pro/E)
Solver (Altair OptiStruct)
Post processing (Altair
HyperView)
Iterations (Modifications to FE
model)
Solver (Altair OptiStruct)
Post processing (Altair
HyperView)
Preprocessing (Altair HyperMesh)
Geometry cleanup Meshing Boundary conditions

23
3.2 Development of a Preliminary Design
The vehicle frame is used to provide a basis on which to mount the
various peripherals necessary for self-propulsion. The frame is the
“skeleton” of any vehicle. The roll cage provides a framework to protect
the operator from hazards and injuries. In the event of a rollover
accident, the roll cage is designed to absorb as much of the inertia as
possible to lessen the force of the collision on the operator. It means that
the chassis was designed to maximize strength and durability, while
minimizing weight and retaining manufacturability. It has to support all
operator control systems, front and rear suspension systems, and engine
and drive train. The objective of the frame design was to satisfy these
functions while meeting the SAE regulations with special considerations
given to safety of the occupants, ease of manufacturing, cost, quality,
weight, and overall attractiveness. Other design factors included
durability and maintainability of the frame.
To begin the initial design of the frame, there first must be set some
design guidelines. These include not only design features and
manufacturing methods, but also the tools to be used in the design.
From that point, the areas of the design that may show weakness or high
loading should be analyzed for stress concentrations should be identified
for analysis.

24
3.2.1 Design Guidelines
Before beginning the design of the frame it was important to make
several global design decisions. These include such details as intended
steering and suspension design and also intended fabrication methods.
While these decisions are not important to the analysis of the frame, they
are important to understanding the design. The rules regarding the
frame geometry and driver safety must be considered as well.
The intended fabrication is important due to the limitations of the
abilities and skills of the build team as well as design directives. The
objective is to minimize the number of welded joints on the frame in favor
of bent members. Bending is less time consuming and when properly
done show a much lower stress concentration. As the design progressed
the manufacturability was constantly reviewed with the build team. This
ensured that there were no impossible features in the design, and that
the team felt confident with its construction. As with the material type,
the overall frame geometry is guided by strict rules. These rules were
constantly referenced throughout the design of the frame to ensure
compliance. As mentioned above the rules change yearly, for this reason
they are attached in Appendix A. The interactions of the frame and the
strict safety rules required that the frame be designed with a solid
modeling software package.
25
3.2.2 The Mini Baja Guidelines
SAE has laid down a set of guidelines and rules that every vehicle should
follow. These guidelines are based on recommendations and tests
conducted by design professionals. For creating a preliminary design
these guidelines were followed to include members in the frame of the
chassis. No additional members were added initially, so that the frame
with the minimum weight is obtained.
The dimensions of these elements were selected keeping in mind the
rules laid down by SAE. No additional members were added. A method of
adaptive designing was used wherever possible and considerations were
made for the ergonomics of the driver. These members were included in
the preliminary design and the minimum possible section was taken i.e.
Outer Diameter = 25.4 mm (1.0 in.), Inner Diameter = 19.3 mm (0.76
in.), Material: AISI1020 alloy Steel.
3.2.3 Adequate Operator Space
Another objective of the rollcage design is to have adequate operator
space for the driver’s comfort. The design would allow driver of 1.9 m (6
foot 3 in.) height, 90.7 Kg (200 lbs) weight to fit comfortably into the
frame. It was assumed that a driver was placed in the frame in the
driving position and measurements were made to make certain all of the
SAE safety rules were satisfied.

26
3.3 Geometry Development
A preliminary design was developed by UNLV SAE BAJA team as per the
rules and guidelines laid by SAE for the BAJA competition. Since
Computer Aided Design (CAD) model is the basis to create a complex
FEA model, there began a quest to develop a CAD model. There is no
CAD data exists for the preliminary design. To create the CAD, the
vehicle was manually measured for the dimensions. With the reference
dimensions, a CAD model was developed in Pro/Engineer Wildfire 4.0.
CAD drawings were made from the developed model and the frame
design was validated to the original dimensions. Figure represents the
solid model of the chassis developed in Pro/Engineer wildfire 4.0 for the
preliminary design.
Upon completion of CAD model of the frame, the Pro/Engineer part
model is imported into the HyperMesh environment which is a part of the
Altair HyperWorks software package. Altair HyperMesh was used as the
finite element meshing utility in preparation for the optimization study. It
is made sure that all the surfaces are imported into HyperMesh properly
without any geometry problems. The next step is extracting the mid-
surface of the solid pipe model. HyperMesh can automatically generate a
mid-surface from a symmetrical cross section. The surface editing tools
would allow morphing the generated mid-surface to be convenient for the
quadratic meshing. The mid-surface geometry was “cleaned” to prepare

27
for meshing. This means that some of the lines in the imported model
were toggled from edge lines to suppressed (or manifold) lines so that
they would not represent an artificial edge that would force the finite
elements to unnecessarily align them to. The misreading of lines happens
at the locations of fillets and radii features created in CAD models, as the
features get falsely interpreted as distinct surfaces in the IGES
transformation.
Figure 3.2 Pro/Engineer model for the rollcage frame
Once the geometry was cleaned, the surfaces of the frame member
were edited for proper meshing. The surfaces were split at each joint so
28
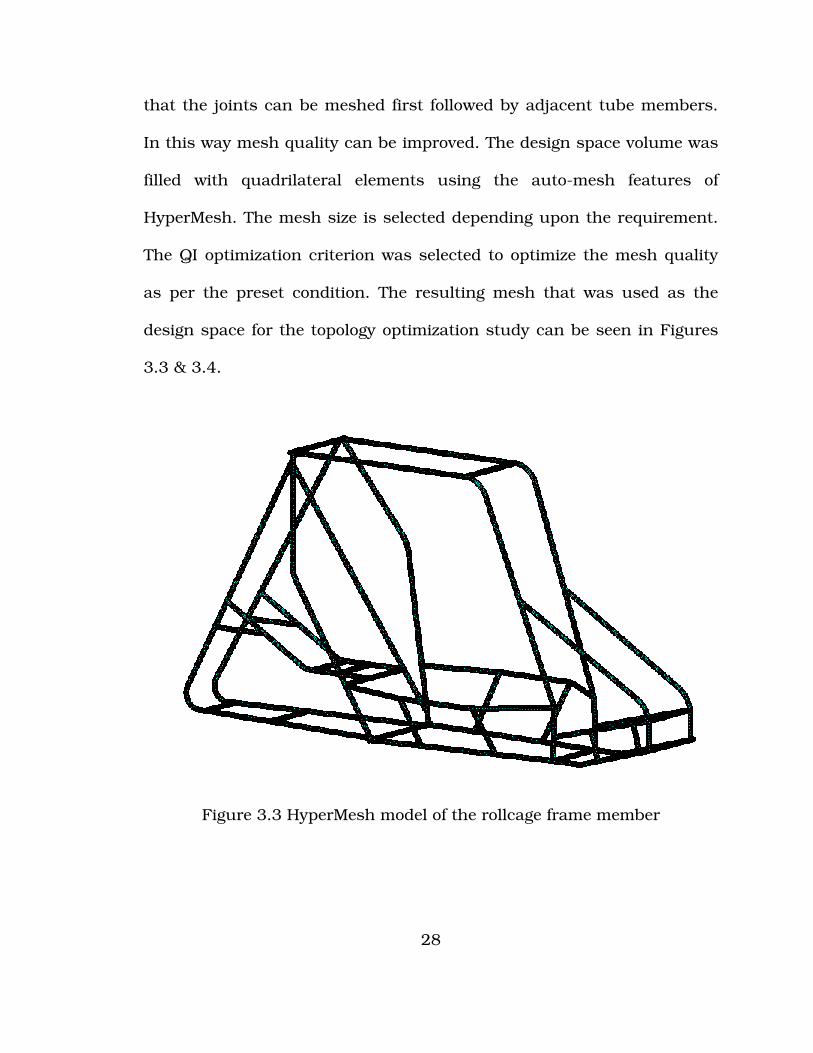
that the joints can be meshed first followed by adjacent tube members.
In this way mesh quality can be improved. The design space volume was
filled with quadrilateral elements using the auto-mesh features of
HyperMesh. The mesh size is selected depending upon the requirement.
The QI optimization criterion was selected to optimize the mesh quality
as per the preset condition. The resulting mesh that was used as the
design space for the topology optimization study can be seen in Figures
3.3 & 3.4.
Figure 3.3 HyperMesh model of the rollcage frame member

29
Figure 3.4 Magnified view of the meshed rollcage model
To ensure model accuracy and efficiency, the mesh of the model needs
to meet a mesh quality criterion. The quality of the mesh will affect the
time step calculations of the simulations and thus the computation time.
The time step is directly related to the characteristic length of the
elements so the minimum element size is of particular importance.
Severely distorted elements will affect the accuracy of the results due to
an increase in stiffness of the element due to the distortion. The
percentage triangular elements should be less than 5% of the number of
elements in the component because the triangular elements impart an
artificial stiffness into parts modeled with them. This will cause an

30
unrealistic behavior of the chassis frame. Figure 3.5 outlines the
important mesh quality criteria.
Figure 3.5 2D Element quality report
3.4 Material Selection
The materials used in the cage must meet certain requirements of
geometry as set by SAE, and other limitations. The main criteria we took
into consideration when choosing the material for the roll cage are safety,
cost and durability. In a situation where the Baja would roll over, the

31
material used has to be sturdy enough to protect the driver from fatal
injuries. As the frame is used in a racing vehicle, weight is a crucial
factor and must be considered. The proper balance of fulfilling the design
requirements and minimizing the weight is crucial to a successful design
[12].
The rules define the cage to be made with materials equivalent to the
following specification [1]:
Steel members with at least equal bending stiffness and bending strength
to 1018 steel having a circular cross section having a 25.4 mm (1 inch)
OD and a wall thickness of 2.10 mm (0.083 inch)
A key factor of this statement is that only steel members are allowed
for the frames construction. However the alloy of the steel is definable as
long as it meets the equivalency requirements. These values are required
to be calculated about the axis that gives the lowest value. Calculating
the strength and stiffness this way ensures that tubes with a non-
circular cross-section will be equivalent even in a worst case loading
situation. The rules go on further to define bending strength and
stiffness by:
Bending stiffness is proportional by the EI product and
Bending strength is given by the value of SyI/c,
(For 1018 steel the values are; Sy = 370 MPa (53.7 ksi) E = 205 GPa
(29,700 ksi)
32
E = Modulus of elasticity
I = Second moment of area for the cross section about the axis giving the
lowest value
Sy = Yield strength of material in units of force per unit area
c = Distance from the neutral axis to the extreme fiber
While the rules set many factors of the material’s geometry there are
other limitations. These limitations include the method of fabrication and
industry standards for the material. The frame will be built using a bent
tube construction and TIG welded joints. The geometry is limited by
industry standards. It is important to utilize commonly available tubing
sizes and materials. By considering all the above factors, AISI 1020
graded steel is considered for the frame material. The material and
section properties of AISI 1020 steel are given in table 3.1.
3.5 Linear Static Frontal Impact Analysis
Linear static analysis is carried out on the chassis to test different
loading conditions and to find out the resulting stresses and deformation
on the frame members. Knowing how the current design reacts to
different loading conditions would allow designers to make changes prior
to physical prototyping. In addition, a linear static analysis is a base for
dynamic or non-linear FEA analysis. If a design cannot survive a linear
static stress analysis it has to be fixed before moving on to more
complex, time consuming and expensive dynamic or non-linear analysis.

33
Table 3.1 Material Property of the Frame [6]
S.NO PROPERTY VALUE
1 Material (Steel) AISI 1020
2 Outer Dia (mm) 25.4
3 Inner Dia (mm) 19.3
4 Section Thickness (mm) 3
5 Area moment of Inertia (mm4) 8324.6
6 Young’s Modulus E (MPa) 247,749
7 Yield Strength Sy (MPa) 594.6
8 Density (Kg/m3) 7861
9 Poisson Ratio 0.3
The next stage in the design process is to perform a finite element
linear static stress analysis, review the stress and deformation pattern on
the frame members and modify the frame members to reduce the stress
and deformation so as to withstand the applied load. Although, a vehicle
needs different types of FE analysis to validate its design, for the current
problem a frontal impact analysis is carried out to study the effect of
loading on the frame.
Assumptions for frontal impact simulation:
1. The chassis material is considered isotropic and homogeneous
34
2. Chassis tube joints are assumed to be perfect joints
3. The impact barrier is not deformable.
3.5.1 Loading / Boundary Conditions
Frontal impact is a dynamic event but it is easier to do preliminary
analysis using linear elastic quasi-static analysis. Therefore we need to
determine a force value to use in the static analysis that is roughly
equivalent to the peak dynamic force or average dynamic force observed
during an impact. One way to estimate a maximum allowable force is to
start with a simplified injury criterion. Research has found that the
human body will pass out at loads much higher than 9 times the force of
gravity or 9 G’s. A value of 10 G’s was set as the goal point for an
extreme worst case collision [13]. For the static frontal impact analysis, a
deceleration of 10 G’s was assumed for the loading which is equivalent to
a static force of 26,698 N (equivalent to 6000 lbf) load on the vehicle,
assuming the weight of the vehicle is 272.16 Kg (600 lbs).
Florida Institute of technology SAE Baja team analyzed the data from
‘The motor Insurance Repair Research Center’ and estimated the
maximum g-force that the Baja car will see is 7.9 G’s [14, 15]. To
calculate the forces used to analyze the 7.9 G impact, Newton’s second
law was used. The force calculation was shown below in equation.
F = ma
m = 272.16 Kg (600 lbs)

35
a = 7.9 X 9.81 m/s = 77.5 m/s
F = 272.16 x 77.5 = 21,092.4 N (equivalent to 4750 lbf)
3.5.2 Analytical Calculation for Impact Force
The vehicle for SAE BAJA is designed for a maximum speed of 17.88
m/s (40mph) for the competition [15]. The total weight of the vehicle
including the driver is estimated to be 272.16 kg (600 lbs).
For a perfectly inelastic collision, the impact force can be estimated
using the below equation:
dfW
mvmvW
net
initialfinalnet
×=
−= 22
2
1
2
1
This equation states that the change in kinetic energy is equal to the
net work done, and the work needed to stop the car is equal to the force
times the distance.
mvdf initial2
1 2−=×
It is considered for the static analysis that the vehicle comes to rest
0.1 sec after the impact [16]. For a 17.88 m/s (40 mph) speed, the travel
of the vehicle after the impact is 1.79 m.
Impact force = 79.1
1*88.17*16.272*
2
1 2
= 24,304 N

36
The frame does not need to survive the crash load so long as it
protects the driver in this situation. Here, we have three different types
of loads i.e. 26,698 N (10G force), 21,092 N (7.9G force) & 24,304 N
(analytical value). In the initial stages, the current frame design is aimed
to withstand the impact load of 33,262 N (7500 lbf). If not, it is made
sure that the frame withstands an impact load of 26,698 N (equivalent to
6000 lbf) minimum, with a design factor of safety of 1.25.
The finite element analysis software program used for solving the
problem for structural kinematics analysis was Altair OptiStruct. The
frontal impact analysis was run for different grid sizes and the effect of
Von Mises stress and displacement was reviewed for each case for the
chassis members. Changes or modifications were done accordingly to the
chassis members to withstand the impact load (i.e. Generated Von Mises
stress should be less than the yield stress of the material).
37
CHAPTER 4
RESULTS & DISCUSSION FOR THE STATIC ANALYSIS
4.1 Grid Independence
Mesh size is an important parameter to consider in a numerical analysis
due to artificially defining a distribution of displacement or stress in the
elements, whether the modeling is based on a continuum or a
discontinuum approach. Grid size or mesh size plays an important role
in both convergence and accuracy of the solution. Theoretically, a
computational model with a finer mesh size obtains a more accurate
result. Though, the use of high-density mesh improves the accuracy of
simulation, but is computationally expensive and at times the solution
may be impossible. On the other hand, too fine mesh may not produce
more accurate results, because other factors such as time step and
boundary condition may govern the modeling accuracy. A course mesh is
used to quickly examine the solver settings and boundary conditions.
This means that the numerical model with coarse mesh will take less
time for computation than the fine mesh. Hence, grid independence
studies are performed to obtain an optimized mesh size.
Grid independency is the non-variation of the results with change in
the grid density. It is performed to make sure that the ideal grid size is
used during the computation process, which avoids the unnecessary
computational space and time. It is one way to make the best use of
38
available resources economically. For the current problem, grid
independency was accomplished by simulating the frontal impact
analysis for various grid/mesh sizes. The results obtained from each grid
size are compared. Initially a coarse mesh with size 5.08 mm (0.2 in.) is
used to study the effects of the frontal impact on the SAE Baja chassis
frame. The mesh size was reduced for the further analysis to 4.57 mm
(0.18 in.), 4.24 mm (0.167 in.), 3.6 mm (0.14 in.), 3.05 mm (0.12 in.),
2.54 mm (0.10 in.), 2.23 mm (0.088 in.), 1.9 mm (0.075 in.) and 1.27
mm (0.05 in.) subsequently the numbers of elements are increased. For
each case, the analysis for frontal impact is run and the values of the
maximum stress and displacement after the impact are listed. The mesh
size is stable or the grid independency is reached if the stress and
deflection of the frame after impact is less than 10% for various grid sizes
Figure 4.1 represents the mesh configuration of similar pipe with various
grid sizes.

39
Mesh Size: 1.27 mm (0.05 in.)
Mesh Size: 1.9 mm (0.075 in.)
Mesh Size: 2.23 mm (0.088 in.)
Mesh Size: 2.54 mm (0.1 in.)
Mesh Size: 3.048 mm (0.12 in.)
Mesh Size: 3.56 mm (0.14 in.)

40
Mesh Size: 4.24 mm (0.167 in.)
Mesh Size: 4.57 mm (0.18 in.)
Mesh Size: 5.08 mm (0.2 in.)
Figure 4.1 Mesh configuration for various grid sizes
Table 4.1 represents the effect of the maximum Von Mises stress and
the displacement on mesh size. It can be observed from the results that
the maximum stress increases with the decrease of the grid size. The
deflection of the frame after impact is less than 10% for various grid sizes
and is assumed to be independent of the grid size. It can be conferred
from the results that the convergence stress is the main criteria for
selecting the grid size rather than the deflection.

41
Table 4.1 Effect of maximum stress and displacement on mesh size
S. No
Mesh
Size
(mm)
No. of
Elements
No. of
DOF
Max.
Von Mises
Stress (MPa)
Max.
Displacement
(mm)
1 1.27
597,443
(Localized
mesh
refinement)
3,561,360 2192.53 21.54
2 1.91 507,408 3,030,570 1751.27 21.89
3 2.24 385,244 2,299,686 1503.06 22.81
4 2.54 294,141 1,762,104 1337.58 21.79
5 3.05 210,290 1,258,626 1054.90 21.16
6 3.56 151,870 904,548 1020.42 21.69
7 4.24 103,134 613,647 958.37 25.10
8 4.57 94,286 560,526 917.00 22.40
9 5.08 75,071 448,404 848.06 23.06
The maximum stress does not occur at same locations for all the
simulations. For most of the analyses, the location of the maximum
stress is either on the left or the right constraint as represented in the
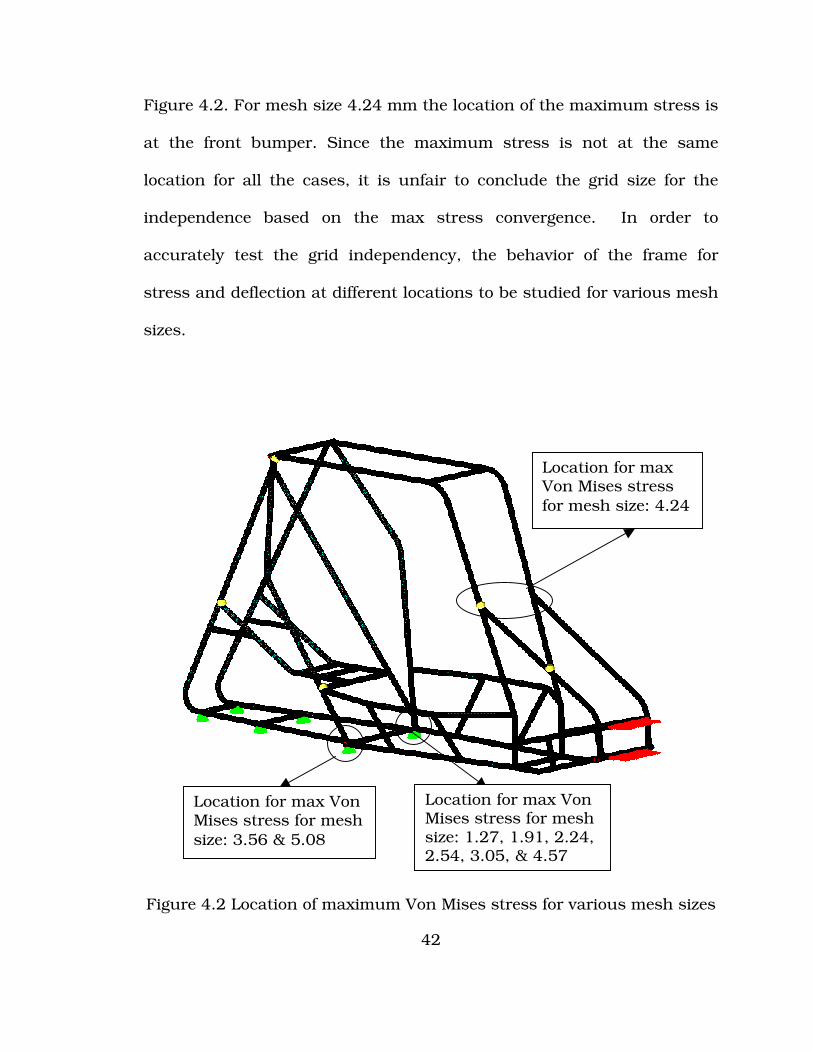
42
Figure 4.2. For mesh size 4.24 mm the location of the maximum stress is
at the front bumper. Since the maximum stress is not at the same
location for all the cases, it is unfair to conclude the grid size for the
independence based on the max stress convergence. In order to
accurately test the grid independency, the behavior of the frame for
stress and deflection at different locations to be studied for various mesh
sizes.
Figure 4.2 Location of maximum Von Mises stress for various mesh sizes
Location for max Von Mises stress for mesh size: 4.24
Location for max Von Mises stress for mesh size: 1.27, 1.91, 2.24, 2.54, 3.05, & 4.57
Location for max Von Mises stress for mesh size: 3.56 & 5.08

43
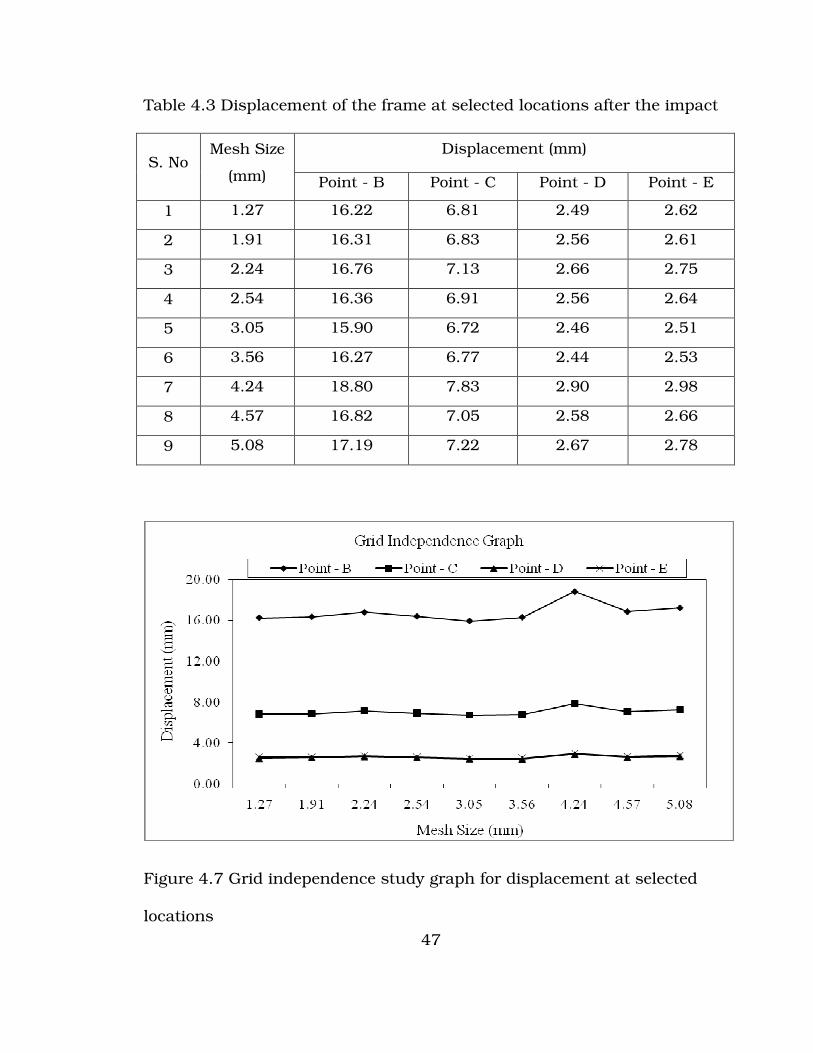
The Von Mises stress and the deflection for five selected point
locations are shown in Table 4.2 and 4.3.The results are plotted for the
analysis as shown in Figures 4.2 & 4.3 The point locations, as shown in
Figure 4.5 are selected to find out the exact behavior of the frame for
stress and deflection at the joints and the middle of the frame on front
and back of the chassis for various mesh sizes. It can be observed from
the results that the Von Mises stress decreases with the increase of the
mesh size at all selected locations as shown in Figures 4.6 & 4.7. The
deflection after impact does not influence much on the mesh size. The
table indicates that the variation of the displacement after the loading is
less than 10% for the different grid sizes.
The FEA model was said to achieve grid independent when the
solutions from two grid sizes are within predetermined tolerance limits.
For the same location the maximum percentage difference in the Von
Mises stress values were observed to be less than 10% for all given mesh
sizes. So it is decided to select the grid size based on the maximum
values of stress since the variation of displacement at different points B,
C, D & E for all mesh sizes are almost uniform. In addition, the mesh
size for the grid independence should be selected based on the
computational time and the memory requirement for solving the
problem.

44
Figure 4.3 Grid independence study graph for the max Von Mises stress
Figure 4.4 Grid independence study graph for the max displacement

45
Figure 4.5 Selected locations of the points
Point- A
Point- B
Point- C
Point-
Point- E

46
Table 4.2 Von Mises stress at selected locations after the impact loading
Von Mises Stress (MPa) S. No
Mesh Size
(mm) Point -A Point - B Point - C Point - D Point - E
1 1.27 -- 965.27 747.39 342.05 36.75
2 1.91 14.46 917.69 739.12 327.43 39.92
3 2.24 18.42 910.11 698.44 333.22 40.20
4 2.54 17.68 901.83 658.59 318.12 38.33
5 3.05 13.95 823.92 685.13 299.58 37.51
6 3.56 15.39 774.28 617.22 295.03 39.09
7 4.24 17.35 905.28 568.68 314.06 42.09
8 4.57 16.49 790.83 597.78 296.06 36.34
9 5.08 16.02 704.64 591.78 272.21 39.33
Figure 4.6 Grid independence study graph for stress at selected locations
47
Table 4.3 Displacement of the frame at selected locations after the impact
Displacement (mm) S. No
Mesh Size
(mm) Point - B Point - C Point - D Point - E
1 1.27 16.22 6.81 2.49 2.62
2 1.91 16.31 6.83 2.56 2.61
3 2.24 16.76 7.13 2.66 2.75
4 2.54 16.36 6.91 2.56 2.64
5 3.05 15.90 6.72 2.46 2.51
6 3.56 16.27 6.77 2.44 2.53
7 4.24 18.80 7.83 2.90 2.98
8 4.57 16.82 7.05 2.58 2.66
9 5.08 17.19 7.22 2.67 2.78
Figure 4.7 Grid independence study graph for displacement at selected
locations

48
Table 4.4 Effect of the mesh size on computation time & memory
S. No
Mesh
Size
(mm)
No. of
Elements No. of DOF
Computation
Time
(Min)
Memory
to run the
simulation
(MB)
1 1.27 597,443 3,561,360 108.85 1541
2 1.91 507,408 3,030,570 59.33 1312
3 2.24 385,244 2,299,686 235.1* 1237
4 2.54 294,141 1,762,104 22.5 948
5 3.05 210,290 1,258,626 147* 679
6 3.56 151,870 904,548 5.88 488
7 4.24 103,134 613,647 2.25 331
8 4.57 94,286 560,526 2.75 304
9 5.08 75,071 448,404 2.3 244
*Analysis run on different server
In general, refining the mesh by a factor of 2 can lead to a 4-fold
increase in problem size. The increase in the problem size increases the
degrees of freedom which in turn increase the computation time. This is
49
clearly unacceptable for a piece of software intended to be used as an
engineering design tool operating to tight production deadlines. The more
number of DOF, the more is the memory required to solve the problem
and save the results. In some cases, the increase in the number of
elements may cause the meshing problems. Table 4.4 represents the
computation time and the memory required to solve the problem. In the
present case, mesh size of 1.27 mm has caused great meshing problems.
So instead of meshing uniformly with 1.27 mm all over, the joint areas
were meshed with the required length of 1.27 mm and the remaining
areas equivalences with appropriate mesh size. From the following table,
it can be concluded that the memory requirement and computation time
for mesh size 4.24 mm are optimal for the current problem.
It could be concluded from the above graphs and tables for Von Mises
stress, displacement and computation time and memory requirements
that 4.24 mm mesh size is optimum for grid independence for the SAE
Baja vehicle with the current design.
4.2 Strengthening Mechanism
In an attempt to alleviate stress concentrations resulting from chassis
geometry as well as improve the frame’s torsional stiffness, strengthening
mechanisms like gusseting at the nodes were incorporated into the
design.

50
4.2.1 Providing gussets at the critical joints of the frame
It is observed from the results that the stress concentration is more at
the joints of the frame members. In order to reduce the effects of stress
concentration so as to avoid the catastrophic failure of the frame under
loading or impact, gussets are provided at the area of high stress
concentration [17]. Gussets are pieces of sheet steel that are welded
tangential to the two tubes intersecting at a node. They reduce the stress
concentration by distributing the force of impact further down the
intersecting members. The primary purpose of the gussets was to
increase the rollcage safety factor and provide better protection for the
driver in a roll over a scenario. They also help to increase the overall
frame stiffness which will benefit vehicle control and feel during normal
or bumpy driving conditions. Although there are different gusset shapes
available, in the present analysis only triangular shaped gussets are
used. Even though it is not mentioned in the report, addition of a relief
hole at the center of the gusset would effectively reduce the weight
without effecting the stress concentration. Figure 4.8 clearly depicts the
addition of the gussets to the roll-cage.
The stress concentration depends on the size (length & height) and
slenderness ratio (ratio of length to thickness) of the gusset. Here an
attempt has been done to find out the optimum size and design of the
gusset for the current frame member.

51
Figure 4.8 Provision of gussets at the frame joints
4.2.2 Effect of gusset size on stress concentration
Frontal impact analysis is carried out for different sizes (length, width
and thickness) of gusset. The effect of max Von Mises stress and the max
displacement on the frame member is studied for various gusset sizes.
Table 4.5 represents the effect of gusset size on the maximum Von Mises
stress of the frame. It is observed from the results that provision of

52
gusset would reduce the maximum stress by 17-21 %. The lowest Von
Mises stress now is 751.53 MPa for gusset size of 88.9 mm L x 88.9 mm
H x 6.35 mm T (3.5 in. L x 3.5 in. H x 0.25 in. T). It is also observed from
the Figure 4.9 that with the increase in gusset thickness, the maximum
Von Mises stress decreases and similarly with the increase of gusset size
per side (length and width) the maximum stress also reduces. In actual
case, the gussets are to be welded over the pipe of outer diameter 25.4
mm. The maximum thickness of the gusset for the analysis is set based
on the feasibility of welding the gusset of the curvature of the pipe. Based
on this criterion, the maximum limit for the thickness is set as 6.35 mm.
Table 4.6 represents the effect of gusset size on the maximum
displacement of the frame. It is observed that provision of gusset would
reduce the maximum displacement by 11-17%. The lowest displacement
with gusset is 5.62 mm, for gusset size of 88.9 mm L x 88.9 mm H x 6.35
mm T, which is the same for the lowest Von Mises stress with the gusset.
It is also observed from the Figure 4.10 that with the increase in gusset
thickness, the maximum displacement decreases and similarly with the
increase of gusset size per side (length and width) the maximum
displacement also reduces.
So it can be concluded from the above results that the optimum
gusset size is 88.9 mm L x 88.9 mm H x 6.35 mm T for the chassis frame
member.

53
Table 4.5 Effect of gusset size on the max. Von Mises stress of the frame
Size of the Gusset (mm) Max. Von Mises stress (Mpa)
S.No Length
per side Thickness
With
gusset
MPa)
Without gusset
% Change
in the stress
1 88.90 3.18 786.00 958.37 17.99
2 3.81 779.11 958.37 18.71
3 4.45 765.32 958.37 20.14
4 5.08 758.42 958.37 20.86
5 5.72 758.42 958.37 20.86
6 6.35 751.53 958.37 21.58
7 76.20 3.18 792.90 958.37 17.27
8 3.81 786.00 958.37 17.99
9 4.45 779.11 958.37 18.71
10 5.08 772.21 958.37 19.42
11 5.72 765.32 958.37 20.14
12 6.35 758.42 958.37 20.86
13 63.50 3.18 799.79 958.37 16.55
14 3.81 792.90 958.37 17.27
15 4.45 786.00 958.37 17.99
16 5.08 779.11 958.37 18.71
17 5.72 772.21 958.37 19.42
18 6.35 765.32 958.37 20.14

54
Table 4.6 Effect of gusset size on the max. Displacement of the frame
Size of the Gusset (mm) Max. Displacement (mm)
S.No Length
per side Thickness
With
gusset
MPa)
Without gusset
% Change
in the stress
1 88.90 3.18 5.79 6.81 14.98
2 3.81 5.74 6.81 15.69
3 4.45 5.71 6.81 16.19
4 5.08 5.67 6.81 16.70
5 5.72 5.65 6.81 17.11
6 6.35 5.62 6.81 17.51
7 76.20 3.18 5.91 6.81 13.26
8 3.81 5.87 6.81 13.87
9 4.45 5.83 6.81 14.37
10 5.08 5.80 6.81 14.88
11 5.72 5.77 6.81 15.28
12 6.35 5.75 6.81 15.59
13 63.50 3.18 6.03 6.81 11.54
14 3.81 5.99 6.81 12.04
15 4.45 5.96 6.81 12.55
16 5.08 6.03 6.81 11.44
17 5.72 5.90 6.81 13.36
18 6.35 5.88 6.81 13.66

55
Figure 4.9 Effect of gusset size on the max Von Mises stress of the frame
Figure 4.10 Effect of gusset size on the max. Displacement of the frame

56
4.3 Load carrying capacity of the frame
The maximum Von Mises stress generated in the chassis frame for
33,362 N (7500 lbf) load condition is relatively higher. The stress in every
case for the same loading condition is more than the yield stress of the
material. This signifies that the material of the chassis frame could not
able to withstand the generated forces due to impact. Since the frame is
already manufactured or welded with this design, UNLV SAE team is
intended to use the frame for the competition this year with slight
changes in the design. In this research, an attempt has been made to
find out the load carrying capability of the frame member.
The OptiStruct analysis is carried out for the gusset frame design for
different loading conditions. The static load is varied to 33,362 N (7500
lbf), 31,138 N (7000 lbf), 28,913 N (6500 lbf), 26,689 N (6000 lbf), 24,465
N (5500 lbf) and 22,241 N (5000 lbf) for the frontal impact analysis. Table
4.7 shows the effect of different loads on the Von Mises stress and
displacement of the frame members.
Figures 4.11 and 4.12 represent the variation of the Von Mises stress
and displacement with the impact loading. The yield stress for the frame
material is 594.6 MPa (86,240 psi) and any stress beyond that would be
undesirable for the designer point of view. The Von Mises stress for
33,362 N static load is 751.53 MPa which is above the yield stress of the
frame material. The static load is reduced to 31138 N the stress induced

57
in the member is 533.64 MPa which is below the yield stress and is
considered to be safe load for the frame. The maximum displacement for
the above load is reduced drastically from 21.16 mm to 2.59 mm.
Table 4.7 Effect of impact load on Von Mises stress and displacement
S.No
Grid
Size
(mm)
Gusset Size
(LxHxT) (mm)
Static
Load
(N)
Von Mises
Stress
(MPa)
Displacement
(mm)
1 4.24 88.9 x 88.9 x
6.35 33362 751.53 21.16
2 4.24 88.9 x 88.9 x
6.35 31138 533.65 3.51
3 4.24 88.9 x 88.9 x
6.35 28913 504.01 3.28
4 4.24 88.9 x 88.9 x
6.35 26689 472.29 3.05
5 4.24 88.9 x 88.9 x
6.35 24465 453.68 2.84
6 4.24 88.9 x 88.9 x
6.35 22241 447.47 2.59

58
Figure 4.11 Effect of impact load on maximum Von Mises stress
Figure 4.12 Effect of impact load on maximum displacement

59
It can be concluded from the above results that the frame design is
safe for 31,138 N (7000 lbf) static load. Therefore the factor of safety of
the existing frame member is 1.2.
4.4 Design modification
Further analysis is carried out to study the influence of other auxiliary
plates attached to the frame member as shown in Figure 4.13. These
components are welded to the frame to place the engine, transmission
and other components of the vehicle. Body sheet panels are also added
or welded for the safety and convenience of the drier. The proposed
changes for the frame design are:
1. Added/Welded plate at the base of the frame
2. Added/Welded plate to cover the driver sideways and back
3. Added/Welded plate to place the engine and transmission at the
back of the frame
4. Added/Welded a pipe at the front bumper of the frame
5. Added/Welded gussets at the front bumper frame members

60
Figure 4.13 New design of the chassis frame/rollcage
Figure 4.14 Von Mises stress distribution in the frame for 31138 N
impact load

61
Figure 4.15 Displacement in the frame at 31138 N impact load
The maximum Von Mises stress is 570.2 MPa (82,700 psi), which is less
than the yield stress (594.6 MPa) of the frame material. The design is
safe for the applied load and is considered for the dynamic crash
analysis. The maximum displacement of the frame is 4.98 mm (0.196
in.), which is acceptable for the driver safety.
62
CHAPTER 5
DYNAMIC FRONTAL IMPACT ANALYSIS
5.1 Dynamic Analysis
A multi-body dynamic analysis simulation is carried out to study the
performance of the chassis for dynamic loading conditions. This study
develops a vehicle chassis model using the multi-body dynamics method
to investigate the dynamic response of the chassis/rollcage in a frontal
impact. Since the chassis has to provide a base on which various
peripherals like engine, power train components, suspension, wheels,
steering, driver seating system and other auxiliary components are
mounted, modeling was done to distribute the mass of the vehicle over
its frame members to simulate the real world problem for dynamic
analysis.
The finite element analysis software program used for solving the
problem for structural kinematics analysis was LS-DYNA. LS-DYNA is an
explicit non-linear dynamic finite element code, which is capable of
solving a wide variety of problems including, impact and penetration. In
an explicit dynamic analysis, the principle of virtual work is used to write
a weak form of an equilibrium equation incorporating the tractions and
boundary conditions for each element. This is later summed up over all
elements and integrated to obtain the solution for element accelerations.
From the explicit solution of elemental acceleration, nodal velocity and

63
displacements are obtained through integration. Once the displacements
are known, incremental strains are computed to update the stress
increment through material models and equation of states. In the current
research, a frontal impact analysis was run for different loading
conditions to study the effect of Von Mises stress, displacement, velocity,
acceleration and forces for each loading case. Changes or modifications
were done accordingly to the chassis members to withstand the frontal
impact crash.
A consistent set of units is specified and used for LS-DYNA modeling.
The units used in the FEA models are [18]:
Force: lbf
Length: inches (in.)
Mass: lbf-s2/in
Time: sec
A compatibility check for the units used can be conducted by using
the definition of force according to Newton’s second Law.
By Newton’s II law we have, F = m * a
In metric system, the force, mass and acceleration units are lbf, lbf-
s2/in, and in/s2 respectively. Therefore N= lbf-s2/in * in/s2
N= lbf
Therefore the units used are compatible.

64
5.2 Design Methodology for Dynamic Analysis
Following is the generic illustration of the major steps involved in the
design process for dynamic analysis. Structurally safe chassis design
from linear static analysis is used for accomplishing dynamic analysis.
1. From the existing design, additional geometry members that would
be mounted on the chassis like engine, suspension, transmission,
driver with seating system and other auxiliary components are
modeled as equivalent mass elements for mass distribution of the
vehicle to simulate the design for real world dynamic analysis
problem.
2. A finite element (FE) model was created using shell elements using
Altair HyperMesh, on which dynamic analysis was performed. The
element quality has been ensured for optimum FE analysis results.
3. The next step in the analysis was setting the boundary conditions
for simulation. The parameters include material properties, section
properties, contacts constraints, creating rigid walls, defining
initial velocity and other simulation related parameters.
4. After setting the parameters, the simulation was run using LS-
DYNA solver for the crash analysis.
5. The results of the simulation were interpreted in HyperView/Ls-
Post. The analysis determines the velocity profile, rigid wall forces
or reaction forces, total and absorbed energy and acceleration at
65
any desired location that the frame members are subjected for the
applied loading condition.
5.3 Geometry Development
For BAJA competition, SAE restricts the teams to use standard engine,
power train, steering and other components. The weights of all the
components are evaluated and equivalent weights are modeled in the
form of solid rigid blocks.
The weight calculations are given below [19, 20]:
Weight of the chassis frame - 54.4 kg (120lbs)
(Includes body sheet & gussets)
Weight of the engine (Briggs & Stratton 10HP) - 27.2 kg (60lbs)
Weight of tire assembly - 45.4 kg (100 lbs)
(Includes suspension 50lbs)
Weight of transmission - 27.2 kg (60lbs)
Weight of steering + Brakes & auxiliary components - 27.2 kg (60lbs)
Weight of the driver - 90.7 kg (200lbs)
Total weight of the vehicle for simulation -272.1 kg (600lbs)
In order to reduce the computational time of the simulation, the
weights of the above components are defined as lumped mass element
assigned to a nodal point or equally distributed to the nodes of a node set
different locations using *ELEMENT_MASS. Figures 5.1 represent the

66
equivalent distribution of element masses on the chassis frame for the
dynamic analysis.
Figure 5.1 Chassis/Rollcage model for multi body dynamic analysis
5.4 Materials
For each component in FEM, a mathematical material needs to be
assigned to simulate the behavior of the component. The chassis frame is
made of alloy steel 1020 and other components of the vehicle are
constructed with different materials. The material behavior and
properties of each material is different from others. LS-DYNA has over
100 material models to choose from but due to simplicity of the vehicle
model only one of these are selected for the analysis.

67
5.4.1 *MAT_PLASTIC_KINEMATIC
This material (MAT-3) card was used to model the chassis frame
members. This model is suited to model isotropic and kinematic
hardening plasticity with the option of including rate effects. It is a very
cost efficient material and can be used with beam, shell and solid
elements. Table 5.1 represents the material properties for plastic
kinematic material model.
Table 5.1 LS-DYNA material models
5.5 Contact Surfaces
Most of the multi body systems involve contact between different
components. In this case contacts are defined between the chassis and
*MAT_PLASTIC_KINEMATIC
$HMNAME MATS 1steel 1020
$# MID Rho E PR SIGY
ETAN BETA
17.3300E-0435933000.0 0.3000 86240.0
0.0 0.0
$# SRC SRP FS VP
0.0 0.0 0.0 0.0

68
engine, chassis and suspension, chassis and seating (including driver
weight) and chassis and bumper members. In actual case all these
components are either welded to the frame or fixed through reliable
joints to prevent the motion of the components with respect to the
chassis. To simulate the equivalent effects in the analysis
*CONTACT_TIED_SURFACE_TO_SURFACE card is selected for the
current problem.
5.5.1 *CONTACT_TIED_SURFACE_TO_SURFACE
To ensure proper interaction between components during crash event,
contacts between the components have to be specified. LS-DYNA
provides an automatic contact formulation between each individual
component of the crash model. As currently implemented, one surface of
the interface is identified as the master surface and the other as a slave.
In tied contact types, the slave nodes are constrained to move with the
master surface. At the beginning of the simulation, the nearest master
segment for each slave node is located based on an orthogonal projection
of the slave node to the master segment. If the slave node is deemed close
to the master segment based on established criteria, the slave node is
moved to the master surface. In this way, the initial geometry may be
slightly altered without invoking any stresses. As the simulation
progresses, the iso-parametric position of the slave node with respect to
its master segment is held fixed using kinematic constraint equations.

69
This contact type should generally only be used with solid elements since
rotational degrees-of-freedom of the slave node are not constrained.
5.6 Rigid Wall
5.6.1 *RIGIDWALL_PLANAR
RIGIDWALL option provides a simple way of treating contact between a
rigid surface and nodal points of a deformable body.
*RIGIDWALL_PLANAR is LS-DYNA keyword used to define the planar
rigid surfaces. It defines a planar wall of finite or infinite size (FINITE).
Orthotropic friction can be defined (ORTHO). Also, the plane can possess
a mass and an initial velocity (MOVING); otherwise the wall is assumed
to be stationary. The FORCES option allows the specification of the
segments on the rigid walls on which the contact forces are computed. In
order to achieve a more physical reaction related to the force versus tie
curve, the SOFT value on the FORCES card can be specified.
5.7 Loads and Boundary Conditions
To simulate the chassis crash analysis, all loads and boundary
conditions that occur in the actual need to be modeled. Since the current
analysis is only limited to chassis crash analysis, the gravitational loads
and frictional loads between the tire and road surface are ignored. In the
frontal impact or crash testing the vehicle crashes head-on into a rigid
concrete barrier at certain speed. A velocity has to be applied to the

70
vehicle in a manner as to not impart any unrealistic acceleration or
cause the simulation to run for an extended amount of time.
5.7.1 INITIAL_VELOCITY_NODE
This card is used to impart an initial velocity to all the nodes of the
vehicle. This card enables a vehicle to start at the prescribed initial
velocity without any unrealistic acceleration. It does not require an
extended amount of time for the vehicle to ramp up to the prescribed
velocity.
The main objective of the frontal impact test is to ensure the chassis
frame to able to dissipate the kinetic energy involved in the crash and the
driver is protected from the injurious deceleration forces. The dynamic
analysis is carried out for the impact velocity of 15mph. This velocity
obviously is lower than typical race track but before a racing car frontally
strikes a rigid wall its speed is usually reduced by a gravel run-off areas
and the deformable tire barriers. An initial velocity of 15 mph (265 in/s
or 6.7 m/s) is ascribed to the whole model to impact a fixed rigid wall.
The energy data can be printed in LS-DYNA file forming a useful check in
analysis. The following equation is the energy conservation criteria at all
times;
Ekin + Eint + Esi + Erw + Edamp + Ehg = Ekin + Eint + Wext
Where; Ekin = Current kinetic energy
Eint = Current internal energy

71
Esi = Current sliding interface energy
Erw = Current rigid wall energy
Edamp = Current damping energy
Ehg = Current hourglass energy
Ekin = Initial kinetic energy
Eint = Initial internal energy
Wext = External work
Among those parameters internal energy is the mainly dealt
component. In the above equation, Internal energy includes elastic strain
energy and work done in permanent deformation. Thus in the model,
*DATABASE_GLSTAT is activated where the internal energy data is
printed.
5.8 Frontal Impact Analysis Results Discussion:
Case: Crashworthiness of frame for 15 mph (6.7 m/s) speed of the
vehicle against a rigid wall
Figure 5.2 represents the velocity profile of the chassis/rollcage
structure for 15 mph (6.7 m/s) impact speed of the vehicle against a rigid
wall. The initial velocity of impact is 265 in/s (6.7 m/s). After the
impact, the velocity gradually reduces to zero at around 22 ms and
becomes negative. The negative velocity is called the rebound velocity. In
this case the rebound velocity is 27.1 in/s (2.48 m/s). The total velocity
change is 292.1 in/s (26.7 m/s).

72
Figure5.2 Velocity profile of the rollcage structure
The rigid wall forces are the reaction force that acts on the frame
members during the impact or crash. Figure 5.1 represents rigid wall
force history profile of the rollcage structure during the impact. After the
impact, the change of momentum from frame structure / rollcage is
transferred to the rigid wall that causes high rigid wall forces during
initial impact. The maximum rigid wall force is 60,353 lbf (268.5 KN).
According to Newton’s 3rd law, the reaction force on the frame members
will also be 60,353 lbf (268.5 KN), which is very high for the cross section
of the frame members that cause high deflections in the frame. Figure

73
5.4 shows the deformation of the frame members at different stages of
impact.
Figure 5.3 Rigid wall force history profile of the rollcage structure during
the impact

74
a. Deformation after 5 ms
b. Deformation after 10 ms
c. Deformation after 20 ms

75
d. Deformation after 30 ms
Figure 5.4 Deformation of the frame members at different stages of
impact
Figure 5.5 Energy plots for impact loading

76
The energy plot for the frontal crash simulation is shown in Figure
5.5. The total energy is 51,272 in-lbf (5793 J) and is constant throughout
the simulation. This shows the conservation of energy is satisfied. It can
be observed from the kinetic energy drops drastically when the vehicle
hits the rigidwall. The kinetic energy, which is initially at 51,272 in-lbf
(5793 J) drops down to about 3000 in-lbf (339 J) and at the same time
the internal energy increased to 48,000 in-lbf (5423 J). The hourglass
energy is almost zero.
Figure 5.6 Acceleration profiles during the impact

77
The acceleration is measured at three different nodes at and around
the driver location to have an insight of kinematics of the driver during
the impact. Figure 5.6 represents the resultant acceleration – time
history for the chassis. It is discussed from the result that as soon as the
vehicle crash with the rigid wall, the accelerations will reach the peak
value of 0.175e6 in/s2 (4445 m/s2) which is equivalent to 453 G’s
acceleration. This deceleration is continues for 0.01 s. The decelerations
generated in the frame are very that could cause severe head injury and
other injuries to the driver.

78
CHAPTER 6
SUMMARY, CONCLUSION AND FUTURE WORK
This chapter provides the summary and outline of the research
performed, observations made from the different structural analysis on a
rollcage frame for SAE BAJA competition. Finally, recommendations for
future work that would build on this research were discussed.
6.1 Research Summary and Conclusion
The usage of finite element analysis was invaluable to the design and
analysis of the frame for SAE Baja Vehicle. The objective of the present
research is to perform finite element structural analysis on rollcage
frame and optimize the design for different loading conditions. Structural
analysis in the research includes the linear static and dynamic analysis
for simulating the impact loading. The static analysis was aimed to
determine the optimum mesh size and to study the effects of stress and
displacement on the rollcage frame members. Yielding is considered to
be the failure criteria for the static analysis.
A preliminary design of the rollcage was produced based on the
rules of the competition using CAD. This CAD design model was used to
perform the FE analysis. A finite element simulation for frontal impact
load of 33,362 N (7500 lbf) was carried out for a design factor of safety of
1.25 on the rollcage frame to investigate the effects of stress and strain
for the applied load. The design has got convergence for a grid size of

79
4.24 mm. The max displacement of the frame was 25.1 mm and max Von
Mises stress generated for the grid size was 958.37 MPa which is higher
than the yield stress of the material of the frame (594.6 MPa).
Based on the stress pattern in the frame, gussets were provided at
the maximum stress locations to reduce the stress concentration by
distributing the force of impact further down the intersecting members.
Frontal impact analysis was carried out to optimize the size of the
gussets. It was been concluded that the optimum gusset size for the
design of the frame was 88.9 mm L X 88.9 mm H X 6.35 mm T (3.5 in. L
x 3.5 in. H x 0.25 in. T). The displacement of the members was favorable
enough for the safety of the driver. The maximum stress was reduced by
21.87 % with the gussets. But this stress 751.53 MPa was also higher
than the yield stress and design was not safe for a factor of safety 1.25.
An attempt was done to find out the safe load for the design of the
frame. The OptiStruct simulation was carried out on the gusset frame
design for different impact loads varied from 33,362 N (7500 lbf) to
22,241 N (5000 lbf). It can be concluded from the above results that the
frame design is structurally safe for a load below 31,138 N (7000 lbf)
static. Therefore the factor of safety of the existing frame member is 1.2.
Another objective of the present research was to accomplish the
dynamic analysis on the structurally safe rollcage frame to review the
structural rigidity and the injury criteria. A full vehicle modeling was

80
carried out for the equivalent mass distribution of the vehicle. An initial
velocity of 15 mph (265 in/s) is ascribed to the full vehicle model to
impact a fixed rigid wall to investigate the effects of dynamic stresses,
energy, forces and acceleration of the frame members.
Dynamic frontal crash analysis on rollcage structure revealed high
level of reaction forces (60,353 lbf) and acceleration (453 G’s) during the
impact. The total energy after the impact is directly transferred by the
frame members that create severe deformations in the frame. A further
research has to be carried to reduce the generated accelerations on the
frame members.
The current research provides a standard finite element analysis
procedure for designing future SAE Baja vehicle chassis/rollcage. It can
be concluded from this research that the future SAE BAJA teams should
use the static analysis to evaluate the stresses and deformations in the
frame before building the rollcage structure. A multi body dynamic crash
analysis is an option for the SAE BAJA team to understand the exact
behavior of the frame for frontal impact, to study the effects of forces and
acceleration during the impact. Modifications to the existing frame
members should be done at every stage of the analysis depending on the
simulation results for the safe design. This report includes the criterion
for the safe design for static and dynamic frontal impact analysis. The
engineers to build the rollcage structure use the safe design. Following

81
the standard procedure would help the engineers to reduce the weight of
the rollcage without affecting the structural strength thus improves the
vehicle performance and driver safety.
6.2 Future Work
• Present research only focused on the frontal impact analysis of the
rollcage structure. There are other loading conditions to be analyzed
to evaluate the accurate structural behavior of the frame members.
The other loading conditions include rollover loading (static and
dynamic), side impact loading, heave loading and shock mount
loading etc.
• In addition to the rollcage optimization, there is a scope for further
research on optimization of the drive train, suspension, brakes and
wheels to enhance the performance of the Baja vehicle.
• Current research considers only one material option for the roll-cage.
Further research should explore the effect of material modeling to
reduce the weight of the roll-cage.
• The present research on the frontal impact analysis focused on one
frame material type and bumper material type to reduce the
accelerations. Further research has to be carried out towards material
modeling has to be done to reduce the generated accelerations and
reaction forces on the rollcage structure and to find out the optimum
material properties for the rollcage structure.

82
REFERENCES
1. 2009 Baja SAE Competition Rules
(http://www.sae.org/students/mbrules.pdf).
2. University of Tennessee at Chattanooga, “Mini Baja Design Report
2006”.
3. Union College SAE Baja Vehicle Design Report 2005.
4. Mark, Wan. "Different Types of Chassis." Autozine. 2000. Autozine
Technical School. 21 Mar. 2006,
http://www.autozine.org/technical_school/chassis/tech_chassis.htm
5. Abhijit Duraphe, Ajit D. Kelkar and David Klett, “Non-Linear
Structural Analysis of an All Terrain Vehicle Using Ansys”,
http://www.ncat.edu/~duraphe/pub/Ansys.pdf.
6. University of Nevada Las Vegas, “Baja SAE Technical Design Report
2008”.
7. Mark Anthony Virginia, “Crashworthiness of a pre NCAP safety
standard light truck and corresponding suspension analysis” A thesis
Report, Wichita state University 2001.
8. Side Impact Crashworthiness Evaluation, Crash Test Protocol
(Version V), IIHS, May 2008
(http://www.iihs.org/ratings/protocols/pdf/test_protocol_side.pdf).
9. Altair Hyperworks 10.0 User Manual.

83
10. “LS-DYNA theoretical manual,” Livemore Software Technology
Corporation.
11. Sane, S.S., Ghanashyam Jadav, and Anandraj, H., “Stress analysis of
a light commercial vehicle chassis by FEM”, p1-5, Driving Innovation
with enterprise simulation.
12. Worcester Polytechnic Institute, “SAE Baja Design Report 2006”.
13. Jonathan Hastie, Mini Baja Vehicle Design Optimization, Honors
Thesis, Fall 2004 – Fall 2005.
14. Anthony Taylor Owens, Marc Daniel Jarmulowicz, Peter Jones,
“Structural Considerations of a Baja SAE Frame”, Motorsports
Engineering Conference & Exposition, December 2006.
15. Florida Institute of Technology, “ Mini Baja design Report 2008”.
16. Vijay Jain, Manvinder Singh, ”Mini Baja Design Report”,
http://www.freewebs.com/manvinder/baja.pdf
17. 2008-2009 Design and Fabrication of a SAE Baja Race Vehicle, A
Major Qualifying Project Report, Worcester Polytechnic Institute.
18. LS-DYNA Support,
http://www.dynasupport.com/howtos/general/consistent-units
19. Briggs and Stratton website. <www.briggsracing.com>
20. The Buggy Shop <thebuggyshop.50megs.com>
21. “LS-DYNA version 970 keyword user’s manual,” Livermore Software
Technology Corporation.

84
22. Mehrdad Asadi, Brian Walker, Hassan Shirvani, “New Finite Element
Model for NHTSA Impact Barrier”, 10th International LS-DYNA®
Users Conference.
23. CYMAT Material Data Sheet,
http://www.alusion.com/download/Cymat%20Technical%20Manual
%20Nov%202009.pdf
24. www.matweb.com

85
APPENDIX A
SAE BAJA RULES 2009
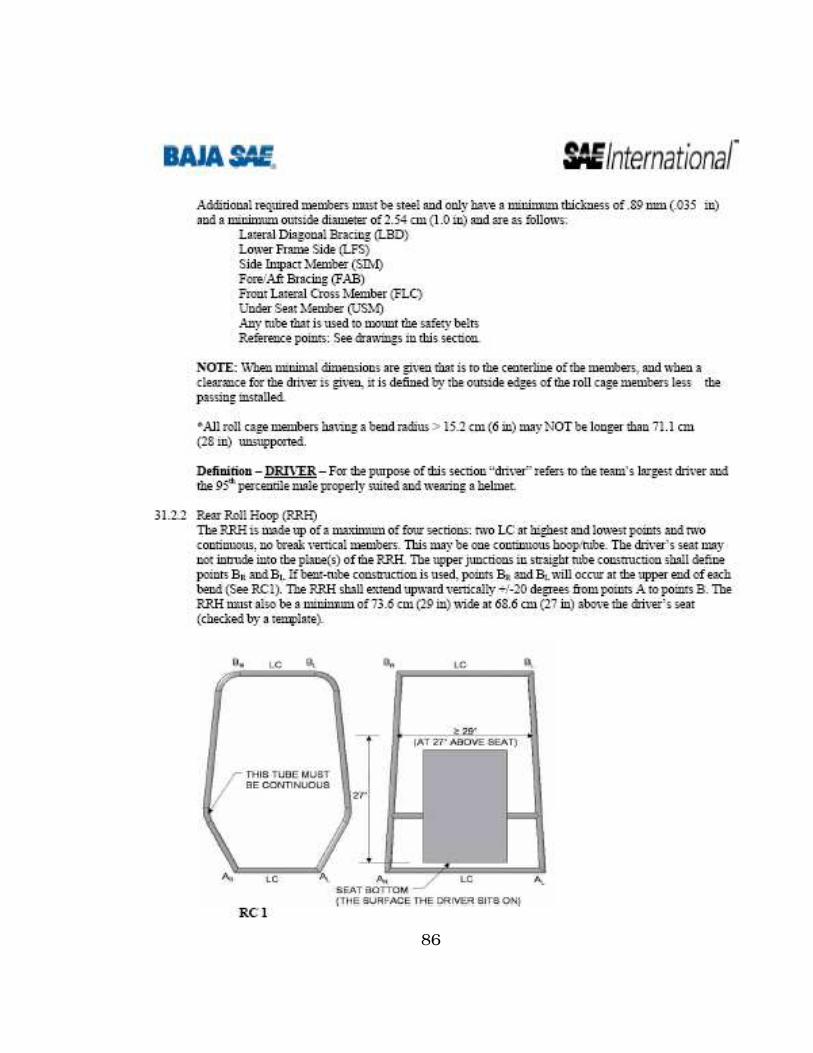
86

87

88

89

90

91

92

93

94

95

96
APPENDIX B
EXAMPLE LS-DYNA PROGRAM
$$ HM_OUTPUT_DECK created 16:36:19 05-18-2010 by HyperMesh Version 9.0b121 $$ LS-DYNA Input Deck Generated by HyperMesh Version : 9.0b121 $$ Generated using HyperMesh-LS-DYNA 971 Template Version : 9.0b121 *KEYWORD *CONTROL_TERMINATION $$ ENDTIM ENDCYC DTMIN ENDENG ENDMAS 0.05 *CONTROL_TIMESTEP $$ DTINIT TSSFAC ISDO TSLIMT DT2MS LCTM ERODE MSIST 0.0 0.9 *CONTROL_HOURGLASS $$ IHQ QH 1 0.1 *CONTROL_ENERGY $$ HGEN RWEN SLNTEN RYLEN 2 2 2 $$DATABASE_OPTION -- Control Cards for ASCII output *DATABASE_ELOUT 1.0000E-03 1 *DATABASE_GLSTAT 1.0000E-03 1 *DATABASE_MATSUM 1.0000E-03 1 *DATABASE_NODOUT 1.0000E-03 1 *DATABASE_RWFORC 1.0000E-03 1 *DATABASE_SLEOUT 1.0000E-03 1 *DATABASE_BINARY_D3PLOT $$ DT/CYCL LCDT BEAM NPLTC 1.0000E-03 0 *NODE 1 -17.8038 44.11536 -5.6208 2 54.53807 9.184963 5.321385 3 54.538 9.185 5.154101 4 54.538 9.185 4.986802 5 54.538 9.185 4.819503
……………………………………………………………………………………………………………………………………………………………………………………………………………………………………………………………………………………………… 230438 24.321790005316 0.5383733641691 -0.423785316713 230439 24.313365290926 0.5402206805621 -0.251055749391 230441 24.45014481584 0.4926461266713 -0.27305628118 230442 24.442902045946 0.4970673060488 -0.438509342539

97
*MAT_PLASTIC_KINEMATIC $HMNAME MATS 1steel 1020 17.3300E-0435933000.0 0.3 86240.0 *PART $HMNAME COMPS 1Chassis $HWCOLOR COMPS 1 7 1 1 1 $HMNAME COMPS 2Gussets $HWCOLOR COMPS 2 49 2 2 1 5 4 1 *SECTION_SHELL $HMNAME PROPS 1chassis section 1 0 0.0 0.12 0.12 0.12 0.12 *SECTION_SHELL $HMNAME PROPS 2Gusset section 2 0 0.0 0.15 0.15 0.15 0.15 *RIGIDWALL_PLANAR_ID $HMNAME GROUPS 3Front wall $HWCOLOR GROUPS 3 22 3 0 67.418 6.185-2.8350132 66.418 6.185-2.8350131 *RIGIDWALL_PLANAR_ID $HMNAME GROUPS 4bottom wall $HWCOLOR GROUPS 4 53 4 0 -0.0032435-0.43971178.55183096-0.00324350.560288268.55183096 *ELEMENT_MASS $HMNAME COMPS 7ele_mass_driver $HWCOLOR COMPS 7 17 118331 32733 0.02159 7 118332 32738 0.02159 7 118333 32742 0.02159 7
…………………………………………………………………………………………………………………………………………………………………………………………… 118500 16937 0.0129534 7 118501 17095 0.0129534 7 118502 17125 0.0129534 7 118503 17128 0.0129534 7 *ELEMENT_SHELL 1 1 66554 66555 66553 66553 2 1 62539 62536 62538 62538 3 1 61448 58454 49570 49570 4 1 61150 61350 61149 61149

98
…………………………………………………………………………………………………………………………………………………………………………………………… 116501 5 229081 229078 11208 11208 116502 5 11191 228941 228938 228938 116503 5 64048 229432 64049 64049 *ELEMENT_SHELL 1054 1 66565 66564 66566 66567 1055 1 66549 66565 66567 66550 1056 1 66567 66566 66526 66525 1057 1 66550 66567 66525 66524
…………………………………………………………………………………………………………………………………………………………………………………………… 118328 1 230442 32906 32823 32824 118329 1 32903 230441 230439 32969 118330 1 230441 32903 32826 32825 *ELEMENT_SOLID 115866 3 227774 227763 227782 227784 227854 227843 227862 227864 115867 3 227784 227782 227783 227785 227864 227862 227863 227865 115868 3 227763 227762 227778 227782 227843 227842 227858 227862
…………………………………………………………………………………………………………………………………………………………………………………………… 116485 4 228398 228399 228427 228419 228432 228428 228431 228433 116486 4 228399 228400 228426 228427 228428 228429 228430 228431 *INITIAL_VELOCITY_NODE $HMNAME LOADCOLS 1auto1 $HWCOLOR LOADCOLS 1 3 1 265.0 0.0 0.0 2 265.0 0.0 0.0 3 265.0 0.0 0.0 4 265.0 0.0 0.0
…………………………………………………………………………………………………………………………………………………………………… 230438 265.0 0.0 0.0 230439 265.0 0.0 0.0 230441 265.0 0.0 0.0 230442 265.0 0.0 0.0 *END

99
VITA
Graduate College University of Nevada, Las Vegas
Nagurbabu Noorbhasha
Degree:
Bachelor of Technology, Mechanical Engineering, 2003 J N T University, Hyderabad, India Thesis Title: Computational Analysis for Improved Design of an SAE Baja
Frame Structure
Thesis Examination Committee:
Chairperson, Dr. Brendan J O’Toole, Ph. D Committee Member, Dr. Mohammed Trabia, Ph. D Committee Member, Dr. Reynolds Douglas, Ph. D Graduate Faculty Representative, Dr. Aly M Said, Ph. D