computational analysis of motorcoach rollover for
TRANSCRIPT

Computational Analysis of Motorcoach
Rollover for Passenger Safety Assessment
By
Wei Zhou
A Thesis Submitted to the Faculty of Graduate Studies of
The University of Manitoba
In partial fulfillment of the requirement of the degree of
MASTER OF SCIENCE
Department of Mechanical Engineering
University of Manitoba
Winnipeg, Manitoba
Copyright © 2018 by Wei Zhou


Dedication
I would like to show my heartiest gratitude to my parents for the sacrifices and supports they
made for me during my studying.


This thesis has contained works from the following papers:
Zhou W, Kuznetcov A, Telichev I, Wu C. "Deformable-Rigid Switch in Computational
Simulation of Bus Rollover Test." Proceedings: 24th International Congress of Theoretical and
Applied Mechanics 2016.
Zhou W, Kuznetcov A, Wu C, Telichev I. "A Comparative Numerical Study of Motorcoach
Rollover Resistance under ECE R66 and Proposed NHTSA Regulation Conditions." Under
Review
Zhou, W, Wu C, Telichev I. "Application of the U* Index Theory for Load Transfer Analysis
of Vehicle Structure Subjected to Elastic-Plastic Deformation." Under Review


I
Abstract
Under increasing public concern for the passenger safety in large passenger vehicles,
legislative regulations are enforced and continuously updated. Recently, a new federal regulation
was proposed in North America to enhance the safety level of the motorcoach passengers under
the rollover, based on regulation No.66 of the Economic Commission for Europe, but with more
severe loading conditions in the form of full passenger mass ballasted to all seats. The studies in
this thesis use the explicit finite element method (implemented in LS-DYNA) and the load
transfer index U* to model and analyze the motorcoach rollover event in order to evaluate the
structural performance and passenger safety in accordance with related legislative regulations. A
modified version of complete finite element model of a typical motorcoach is developed and
validated using data from the component test and the complete vehicle rollover test. The rollover
tests are numerically replicated for loading conditions corresponding to the vehicle with zero and
full passenger mass respectively. The comparative study is performed on the structural resistance
to deformation and energy absorption capability. The original concept of U* index is applied for
analysis of key structural components experiencing the elastic-plastic deformation to determine
the load path and examine the load transfer efficiency.
Obtained coach rollover simulation results indicate that test condition of the proposed
regulation leads to a 150% increase in penetration distance to the surviving space of the
passenger compartment compared to the ECE R66 condition. The key structural members, which
absorb the most energy in the rollover impact, are identified, and the need for the higher rollover
resistance of the coach for its compliance with the newly proposed regulation is demonstrated.
Obtained load transfer analysis results show the effectiveness of the application of the U*
approach in detecting the change of load path within the structural elements experiencing plastic
deformation. It shows that the U* approach can be used in combination with FEM as an effective
tool for the vehicle crashworthiness analysis. Overall, results of this study can provide a data
basis for the automotive manufacturers to evaluate and improve the rollover resistance of
motorcoaches.

II

III
Acknowledgement
I would like to give my gratitude to my advisor, Dr. Christine Q. Wu, for her support in my
studies. Her rich expertise and vision in the academic and industrial field, and her approachable
personality have inspired and encouraged me to work on this research.
Also, I would like to give my gratitude to my co-advisor, Dr. Igor Telichev for his guidance
for my project and thesis work. I would like to express my appreciation for his help and
comments for my studies and this thesis would not be possible without his supervision.
I would also like to thank my colleagues Dr. Anton Kuznetcov, Dr. Qingguo Wang, Mr.
Hamid Giahi and Dr. Khashayar Pejhan for their help and useful discussions in the thesis work.
Also, I’d like to thank Ms.Tamrin Tanha and Mr.Md Nuruzzaman for sharing the raw material
test data with our project team. And I’d also like to thank Dr. Yunhua Luo and Dr. Ehab El-
Salakawy for serving as committee members for my graduate program.
Last but not least, I would like to thank my families and friends for their significant support.
This research was enabled in part by support provided by Westgrid (www.westgrid.ca) and
Compute Canada (www.computecanada.ca).

IV

V
Table of Contents
Abstract ........................................................................................................................................ I
Acknowledgement..................................................................................................................... III
List of Figures ........................................................................................................................... IX
List of Tables.......................................................................................................................... XIII
Abbreviations ........................................................................................................................... XV
1. INTRODUCTION ............................................................................................................... 1
1.1. Problem Statement ........................................................................................................ 1
1.1.1. Background and Motivation .................................................................................. 1
1.1.2. Problem Definition ................................................................................................ 4
1.1.3. Proposed Solution ................................................................................................. 5
1.2. Thesis Formalization .................................................................................................... 6
1.2.1. Aim of the Thesis .................................................................................................. 6
1.2.2. Core Concepts within the Thesis ........................................................................... 7
1.2.3. Thesis Organization............................................................................................... 8
2. LITERATURE REVIEW .................................................................................................. 11
2.1. Rollover Regulations and Tests .................................................................................. 11
2.1.1. Rollover test by Regulation 66 of ECE ............................................................... 11
2.1.2. Newly Proposed Regulation by NHTSA ............................................................ 14

VI
2.2. Vehicle Rollover Simulation Studies ......................................................................... 16
2.3. Load Transfer Analysis and Index U* ........................................................................ 20
2.4. Summary ..................................................................................................................... 23
3. FINITE ELEMENT MODELING OF MOTORCOACH ROLLOVER ........................... 25
3.1. Explicit Analysis and Used Software ......................................................................... 25
3.1.1. Explicit Analysis ................................................................................................. 25
3.1.2. Bus Rollover Simulation and Software Choice .................................................. 28
3.2. Modeling Approach and Model Description .............................................................. 29
3.2.1. Modelling Approach ........................................................................................... 30
3.2.2. Input Data and Problem Analysis........................................................................ 34
3.2.3. Model Modification............................................................................................. 36
3.2.4. Mass Distribution and Centre of Gravity ............................................................ 40
3.2.5. Constitutive Material Models .............................................................................. 41
3.2.6. Element Types and Formulations ........................................................................ 45
3.2.7. Contacts and Constraints ..................................................................................... 46
3.2.8. Hardware Support ............................................................................................... 48
3.3. Boundary Conditions .................................................................................................. 49
3.4. Component Test and Validation ................................................................................. 52
3.4.1 Component Bending Test ......................................................................................... 53

VII
3.4.2 Model Validation ..................................................................................................... 56
3.5. Free Falling Simulation and Results ........................................................................... 58
3.5.1. Simulation Results............................................................................................... 59
3.5.2. Energy Verification ............................................................................................. 60
3.6. Impact Simulation and Results ................................................................................... 61
3.6.1. Simulation Results – Deformation ...................................................................... 62
3.6.2. Simulation Results – Energy Curves ................................................................... 64
3.6.3. Simulation Results – Acceleration Curves .......................................................... 66
3.7. Comparison Results between ECE R66 and Proposed NHTSA Regulation .............. 69
3.7.1. Deformation Comparison .................................................................................... 70
3.7.2. Energy Absorption Comparison .......................................................................... 71
3.8. Conclusion .................................................................................................................. 79
4. LOAD TRANSFER ANALYSIS USING INDEX U* OF VEHICLE STRUCTURE
SUBJECTED TO ELASTIC-PLASTIC DEFORMATION ......................................................... 81
4.1. Review of Theory Preliminaries ................................................................................. 81
4.2. Numerical Procedure .................................................................................................. 85
4.3. Load Path Calculation for Case of Non-elastic Deformation ..................................... 86
4.3.1. First Example ...................................................................................................... 86
4.3.2. Second Example .................................................................................................. 89

VIII
4.3.3. Discussion of Results .......................................................................................... 92
4.4. Load Transfer Analysis of Pillar Structure ................................................................. 93
4.4.1. Computational Model .......................................................................................... 93
4.4.2. Results and Discussions ...................................................................................... 94
4.5. Conclusions ................................................................................................................ 98
5. CONCLUSIONS AND FUTURE WORK ........................................................................ 99
5.1. Conclusions and Contributions ................................................................................... 99
5.2. Limitations of This Analysis .................................................................................... 100
5.3. Future Work .............................................................................................................. 100
References ............................................................................................................................... 103
Appendix A Experimental Data of Frame Material Tensile Test .......................................... 113

IX
List of Figures
Figure 1-1 Workflow outline of the thesis .................................................................................. 6
Figure 2-1 Illustration of ECE R66 rollover test ....................................................................... 11
Figure 2-2 Quasi-static loading test of body sections ............................................................... 12
Figure 3-1 Calculation diagram of the explicit method ............................................................ 26
Figure 3-2 Diagram of work steps using LS-DYNA for simulation ......................................... 29
Figure 3-3 Full scale motorcoach model ................................................................................... 30
Figure 3-4 Coach framework model ......................................................................................... 31
Figure 3-5 Parcel rack model in the coach ................................................................................ 31
Figure 3-6 Model scale of the seat ............................................................................................ 33
Figure 3-7 Model scale of the parcel rack ................................................................................. 33
Figure 3-8 Rigid parts in the coach ........................................................................................... 34
Figure 3-9 Location of axis of tilting platform ......................................................................... 38
Figure 3-10 Material properties test and stress-strain curve ..................................................... 43
Figure 3-11 Different components of seat structure ................................................................. 44
Figure 3-12 Surviving space with the null material .................................................................. 45
Figure 3-13 Examples of connections and constraints in the coach model .............................. 48
Figure 3-14 Initial condition of rollover simulation ................................................................. 49
X
Figure 3-15 Tilting platform and wheel support in ECE R66 ................................................... 50
Figure 3-16 Hinge in the model ................................................................................................ 50
Figure 3-17 Rigid wall modelling for coach impact ................................................................. 51
Figure 3-18 Rollover simulation for free falling and impact .................................................... 52
Figure 3-19 Example of pillar structure in a typical coach ....................................................... 53
Figure 3-20 Pillar bending test setup ........................................................................................ 54
Figure 3-21 Quasi-static component test results of the pillar ................................................... 55
Figure 3-22 Force-displacement curve of the component test .................................................. 55
Figure 3-23 Pillar from the coach model .................................................................................. 56
Figure 3-24 Simulation results of pillar submodel from the coach frame model ..................... 57
Figure 3-25 Initial state of free falling process of coach rollover ............................................. 58
Figure 3-26 Impact force angle ................................................................................................. 59
Figure 3-27 Angular velocity time history ................................................................................ 60
Figure 3-28 Energy time history for free falling simulation ..................................................... 61
Figure 3-29 Initial state of the coach rollover impact simulation ............................................. 61
Figure 3-30 Comparison of deformation pattern between NHTSA test and simulation........... 63
Figure 3-31 Max penetration of the surviving space ................................................................ 64
Figure 3-32 Energy time history for impact simulation ............................................................ 65
Figure 3-33 Mass increase percentage time history .................................................................. 66

XI
Figure 3-34 Planes in the vehicle to measure the acceleration data .......................................... 67
Figure 3-35 Comparison of accelerations on 3 planes on the floor (transverse direction) ....... 68
Figure 3-36 Deformation comparison ....................................................................................... 71
Figure 3-37 Contour of effective plastic strains on the deformed coach (zero passenger mass)
....................................................................................................................................................... 72
Figure 3-38 Contour of effective plastic strains on the deformed coach (full passenger mass) 73
Figure 3-39 Groups of coach frame members .......................................................................... 74
Figure 3-40 Time histories of absorbed energy (model with zero passenger mass) ................. 75
Figure 3-41 Time histories of energy absorption ratios (model with zero passenger mass) ..... 76
Figure 3-42 Ranking of energy absorption ratios among structural groups.............................. 77
Figure 4-1 Illustration of conventional U* calculation ............................................................. 81
Figure 4-2 Illustration of U* contour and load paths of a plate under tensile loading ............. 83
Figure 4-3 Illustration of Usum ∗contour of a plate under tensile loading ............................... 85
Figure 4-4 U* calculation flowchart ......................................................................................... 86
Figure 4-5 Plate model under tensile loading ........................................................................... 87
Figure 4-6 Contour of plastic strain of the load case of elastic-plastic deformation ................ 87
Figure 4-7 U* contour plots and load paths of the plate with a plastic strip............................. 88
Figure 4-8 Model of plate with a hole with the contour of plastic strain of load case 2 ........... 89
Figure 4-9 Load transfer analysis and stress analysis of the plate with a hole ......................... 91

XII
Figure 4-10 Relation between load transfer portion of left-side fixed node and loading force 92
Figure 4-11 Computational pillar model ................................................................................... 94
Figure 4-12 U* contour of the pillar ......................................................................................... 95
Figure 4-13 Comparison of U* variation along one load path for 3 cases ............................... 95
Figure 4-14 Von Mises stress contour of 12kN loading ........................................................... 96
Figure 4-15 Usum ∗ contour of pillar under 3 load cases ......................................................... 97
Figure A-1 Different stress and strain curves from material test ............................................ 114

XIII
List of Tables
Table 3-1 Major modification on the Eicher model .................................................................. 36
Table 3-2 Differences of CG location between model and tilt table test data of similar coach 41
Table 3-3 Material models of the frame and two key subsystems ............................................ 42
Table 3-4 Material properties for the frame structural steel ..................................................... 43
Table 3-5 Material properties for seat structure ........................................................................ 44
Table 3-6 Summary of contacts ................................................................................................ 47
Table 3-7 Quantitative comparison of the force-displacement curves...................................... 57
Table 3-8 Proportion of energy items for impact simulation .................................................... 65
Table 3-9 Verification metrics for energy results ..................................................................... 66
Table 3-10 Validation metrics ................................................................................................... 67
Table 3-11 Curve comparison metrics for acceleration time histories ..................................... 69
Table 3-12 Model data comparison........................................................................................... 70
Table A-1 Stress and strain data of frame material tensile test ............................................... 114

XIV

XV
Abbreviations
ECE R66 Regulation No.66 of Economic Commission for Europe
NHTSA National Highway Traffic Safety Administration, USA
FMVSS American Federal Motor Vehicle Safety Standards
FEA Finite Element Analysis
FEM Finite Element Method
GVWR Gross Vehicle Weighting Rating
MPP Massively Parallel Processing
APDL ANSYS Parametric Design Language

XVI

1
1. INTRODUCTION
1.1. Problem Statement
1.1.1. Background and Motivation
Each traveler is concerned by road safety problems, and vehicle manufacturers together with
legislative authorities play an essential role in minimizing the probability of passenger injuries.
In the United States in 2014, the National Highway Traffic Safety Administration (NHTSA)
reported that 32,675 people were killed in motor vehicle traffic crashes [1]. In Canada in 2015,
Transport Canada reported that the number of motor vehicle fatalities was 1,858 with 10,280
seriously injured [2].
Rollover is among the accidents associated with the highest possibility of fatalities. Data for
fatal crashes in the United States report that from 2001 to 2010, rollover and roadside events
accounted for 74% of all motorcoach fatalities [3]. In Canada, it is reported that among 21
collisions of intercity buses from 1990 to 2001, there were 7 (33%) rollover events accounted for
the majority of severe and fatal injuries [4].
Passive safety technology is studied extensively by researchers and engineers to address the
passenger safety issues. Vehicle passive safety systems involve all structural parts that could
deform to absorb and dissipate kinetic energy in a crash accident and occupant restraint
components such as airbags and seatbelts [5]. The ability of the vehicle structure to contribute to
occupant protection in the crash event is defined as crashworthiness and it plays an important
role in the overall vehicle safety. For example, the crush box is designed to absorb a large

2
amount of kinetic energy in the vehicle frontal collision. Another critically important aspect of
the collision safety is structural integrity, which is the ability of a structural component to
withstand the impact load in the collision without failure.
In rollover accidents, the vehicle structure absorbs the kinetic energy of the colliding objects
and irreversibly converts it to the strain energy by the deformation and failures such as buckling
and fracture. The sufficient energy absorption is required to reduce the acceleration affecting the
passengers during a collision. Unlike the frontal collision scenario, the problem arises [5] for the
rollover events owing to the absence of the dedicated energy absorption components or
structures. The vehicle lateral body and roof are mainly made of thin panels and beams, which
provide insufficient energy absorption by the plastic deformation.
From the 1970s researchers suggested that space needs to be preserved in passengers and
driver’s compartment for better survival possibility in the vehicle crash accident, which is known
as the “surviving space” or “residual space” [6]. During the crash test, the passenger
compartment must remain nearly non-deformed and non-intruded by other structural
components. However, in the real-life rollover accidents, it is usually encountered in the most of
the cases that the damaged vehicle has the large deformation, which directly contributes to the
fatality rate of passengers.
The superstructure of a motorcoach is the load bearing components of vehicle bodywork as
defined by the manufacturer. Consequently, for the passenger protection in the rollover
accidents, the superstructure should provide both the required surviving space and sufficient
energy absorbing capability. These requirements are contradictive, since the preservation of the
surviving space is achieved by minimization of the superstructure’ deformations, while energy
absorption is usually associated with large deformations.

3
Thus legislated standards are enacted worldwide in terms of both surviving space and energy
absorption to ensure that vehicle products meet the required safety level. One such regulation is
the Regulation No.66 of Economic Commission for Europe (ECE R66) [7]. The approval
procedure in [7] is based on a rollover test of a complete vehicle. By testing the strength of the
superstructure, the main requirement is the preservation of the designated surviving space in the
passenger compartment. No parts of the vehicle outside the surviving space at the start of the test
shall intrude into the surviving space during the test.
In order to better design for the crashworthiness of the passenger vehicle and assess the
structural ability to resist the deformation in the rollover events, it is also necessary to study the
application of load transfer analysis in the vehicle crashworthiness problem together with the
traditional stress analysis method. It studies the load carry capability of the vehicle structure. The
vehicle primary structure should not fail under the normal service condition and behave in a
predictable and controllable manner in the accidents. In the viewpoint of the vehicle designer,
this requires that the designed vehicle body should achieve a sufficient level of stiffness.
In the modern vehicle industry, the development has shown that the lightweight and low
energy-consumption design is pursued by consumers and vehicle manufacturers. Taking into
account the needs of both environment and passenger safety, it is necessary to make the vehicle’s
primary structure more efficient to transfer the load. To this end, it is essential to visualize and
determine the load paths within the vehicle’s primary structure. With this knowledge of how the
load is transferred, the structural performance can be better predicted and improved in the design
stage.

4
1.1.2. Problem Definition
To evaluate the rollover performance of the motorcoach and the passenger safety, the effective
simulation methodologies capable of assessing the motorcoach compliance with the latest
legislative regulation and the advanced instruments are on demand by the manufacturers and
engineers. These approaches can also be effectively applied to the design of the passenger
vehicle in terms of the crashworthiness problem.
The current federal regulations related to the rollover protection in the USA are Federal Motor
Vehicle Safety Standard (FMVSS) 208 “Occupant crash protection”, FMVSS 216 “Roof crush
resistance”, and FMVSS 220 “School bus rollover protection” [8]. They use the static loading
method to assess the roof strength of buses. Concerning the lack of the specific regulation for the
passenger safety of motorcoaches and other heavy buses in North America, the federal
government agency is currently working on updating the current regulation in order to enhance
motorcoach safety. New considerations of the test conditions and new requirements will be
implemented in the proposal of the new regulation for motorcoach rollover protection. In
response to the regulation change, the thesis work will concentrate on the study of the following
problems.
Firstly, In consideration of the new requirements owing to the regulatory change, the studies of
the modeling approach in order to evaluate the structural performance and the passenger safety in
compliance to the latest regulation requirement are thus needed. Secondly, as the design needs to
make a compromise between the surviving space preservation for passenger safety and the
energy absorption capability of the vehicle structure, the alteration of the design requirement also
needs to be studied for rollover in accordance with the existing rollover regulation of ECE R66

5
and the new regulation. At last, the demonstration of the applicability of load transfer analysis to
the vehicle crashworthiness problem is also essential.
1.1.3. Proposed Solution
With the fast development of computing technology, vehicle industry benefits greatly from
Computer Aided Design (CAD) and Computer Aided Engineering (CAE), which lead to faster
product development, lower cost, and better quality. Computational modeling and simulation are
highly valued by engineers and researchers in vehicle industries. The possibility to perform the
numerical simulation allows to analyze the different engineering solutions in the very early
design stage and evaluate the structural performance under different types of impact events in the
design development phase [5].
This study aims to use the numerical simulation to analyze the structural performance of a
typical motorcoach in the rollover event and evaluate the compliance of passenger safety to
related legislative regulations. Finite element method and U* approach are to be employed
together to model and analyze the motorcoach rollover event along with the load transfer
analysis of key components identified by FEM.
Experimental methods will also be employed in the thesis work. To obtain the correct material
properties and to validate the modeling technique, the material tensile test and the component
bending test are to be conducted. The physical rollover test data of the complete motorcoach will
be used to validate the simulation result. The workflow of the thesis can be summarized in
Figure 1-1.

6
Figure 1-1 Workflow outline of the thesis
1.2. Thesis Formalization
1.2.1. Aim of the Thesis
The objectives of this study can be categorized as two-fold. As different regulations require
different test conditions, the main task is to evaluate the structural performance and passenger
safety of a typical coach under different regulations using the finite element method. This thesis
also aims to apply the load transfer analysis on the vehicle structure. The method of load transfer
index U* is chosen as the tool. Through the application of the original concept of U* index on
structures experiencing the elastic-plastic deformation, the demonstration in this work will
potentially provide a new perspective on the vehicle design against collision problems. These
objectives include the following tasks:
1) To perform the coach rollover simulation with a validated model using data from the
component test and complete vehicle rollover test;

7
2) To compare the deformation and energy absorption distribution among structural members
under different test conditions in compliance with regulations;
3) To address differences in design criteria to develop a sufficiently resistant vehicle
framework for rollover events under the different regulations;
4) To demonstrate the applicability of U* approach to the load transfer analysis of the vehicle
structures.
1.2.2. Core Concepts within the Thesis
The following core concepts are used in the context of the thesis:
(a). Motorcoach:
Motorcoach [3] refers to a bus characterized by an elevated passenger deck located over a
baggage compartment, excluding the public transit bus and the school bus.
(b). Superstructure
Superstructure [7] of the vehicle refers to the load-bearing components of the bodywork as
defined by the manufacturer. It includes those coherent structural components which contribute
to the strength and energy absorbing capability of the bodywork and preserve the surviving space
in the rollover test.
(c). Crashworthiness
Crashworthiness is the ability of the vehicle structure to contribute to occupant protection in
the crash event to reduce the number of fatal and serious injuries.
(d). Load transfer analysis

8
Load transfer analysis assesses the efficiency and rationality of structures in transferring loads
from the loading to the supporting end. It is used as the complementary methodology together
with the traditional stress analysis for assessing the vehicle performance in the thesis.
1.2.3. Thesis Organization
The remaining parts of the thesis are outlined as following:
In Chapter 2, firstly, the literature review is provided on rollover regulations and related tests
requirements. Limitations of the existing regulation ECE R66 and the new regulation proposal
are discussed respectively. This chapter also includes the review of the development of the
computational analysis methods for vehicle rollover simulation. The concepts of load transfer
analysis, U* index theory and its applications are discussed.
In Chapter 3, the modeling approach and the simulation results of a motorcoach rollover are
presented in details. The validation of the finite element model is also presented based on a
quasi-static component test for a representative member of the vehicle frame and results of a
complete vehicle rollover test under ECE R66 conditions. Based on the validated coach model, a
comparative study is presented to evaluate the structural performance of a motorcoach and the
passenger safety under a new proposed regulation and the existing regulation ECE R66 using
explicit FEA simulation LS-DYNA®.
In Chapter 4, the load transfer analysis using the U* index on the vehicle structure subjected to
elastic-plastic deformation is presented. Firstly, the theory preliminaries are reviewed. The
numerical procedure is given as the following. Using the U* concept, effects of the material
nonlinearity on the load path and the stiffness distribution were analyzed for the representative
example structures. The first two examples of the plate demonstrate the load path changes when

9
the structure starts to deform plastically. In the last example, the Usum∗ contour obtained for a
vehicle pillar structure demonstrates that the local structural stiffness is changed by the
development of the plastic region.
In Chapter 5, the conclusions and contributions of the thesis work are summarized. The
limitations of studies are discussed, and the recommendations on the future work are provided.

10

11
2. LITERATURE REVIEW
2.1. Rollover Regulations and Tests
2.1.1. Rollover test by Regulation 66 of ECE
The Regulation No.66 of Economic Commission for Europe (ECE R66) is one of the most
widely used international regulations related for rollover protection. A rollover test on a full
vehicle is the basic method to get the certification of ECE R66 for the compliance with the
required safety level. An illustration of ECE R66 full vehicle rollover test is shown in Figure 2-1.
The test vehicle is placed on a tilting platform, which is inclined to reach unstable equilibrium
position with a minimum rotational velocity. The vehicle is then tipped over with the minimum
rotational velocity until it falls freely into a ditch, which has a horizontal, dry and smooth
concrete ground surface with a nominal depth of 800 mm.
Figure 2-1 Illustration of ECE R66 rollover test [7]

12
In the latest version, v.2006 [7], including the rollover test as the basic approval method, 4
other methods based on test, calculation or simulations are also included in the regulation. The 4
equivalent methods include:
(1). Rollover test using body sections;
The manufacturer can choose the body section to be tested on the tilting platform instead of
the complete vehicle. The center of gravity of the tested body section must be measured and it
needs to be the same with the complete vehicle. The structural feature of the body section also
needs to be same with the superstructure in regard to the shape, geometry, material and joints.
The vehicle is considered to pass the test if all the body sections pass the test. If one of them fails,
the vehicle type shall not be approved.
(2). Quasi-static loading test of body sections;
In this equivalent method, the quasi-static loading is applied in the way to be evenly
distributed on the cantrail of the vehicle through a rigid beam to simulate the ground in a rollover
test, shown in Figure 2-2. The load direction angle 𝛼 needs to be calculated to match the impact
load direction in the rollover test on the tilting platform with 800 mm height.
Figure 2-2 Quasi-static loading test of body sections

13
(3). Quasi-static calculations based on the results of component tests;
This equivalent method needs to identify all the deformable plastic zones and plastic hinges on
the vehicle superstructure. The characteristic curves of the plastic zones and plastic hinges need
to be obtained by component tests beforehand. The algorithm and computer programs are able to
do quasi-static calculations of the model.
(4). Computer simulation of rollover test on a complete vehicle.
Several requirements for this equivalent method include: The simulation must give
conservative results. The total mass and CG position of the model must be identical with the real
vehicle. The mass distribution in the model corresponds to the real vehicle. The simulation shall
run till max deformation is reached. Non-physical energy shall not exceed 5% of total energy.
The original ECE R66 was developed by the European Union in the late seventies to overcome
the deficiencies of the vehicle superstructure under rollover impact events. Despite the fact that
ECE R66 has been enforced in many countries, during these years, its limitations have also been
studied and the new version is discussed by researchers. The recent publications of the research
on ECE R66 have shown two main concerns regarding the limitations of ECE R66.
Firstly, the loading condition in ECE R66 depends on whether the seatbelts are installed in the
test vehicle. For a coach without seatbelts installed, the unladen curb mass should be used. For a
coach equipped with seatbelts, the total effective vehicle mass should be reproduced in the test,
meaning a ballast of half of a passenger mass should be mounted to each seat [7]. With the
introduction of mandatory seatbelt wearing in coaches in Europe in 2006, the influence of the
passenger on the vehicle needs to be considered [9]. However, for ECE R66, the influence of
passenger’s mass on the deformation of the vehicle has often been neglected in physical tests for

14
old coaches not equipped with seatbelts. Due to the variance of the restraints of safety belts,
related studies on the influence of the effective mass from passengers coupled to the vehicle
structure have been conducted by researchers. The researcher in [10] calculates the passenger
mass factor via the displacement using a validated bay section model. It is found that 18% of the
unrestraint passenger’s mass and 93% of the passenger on the 3-point seatbelt are effectively
coupled to the vehicle structure in the rollover test. The study in [11] suggests that depending on
the restraint system in the vehicle, the energy absorption of the coach could increase up to 60%
due to the passenger’s mass. The simulation work in [12] shows that the surviving space is
severely penetrated in the rollover test with the additional passenger on the coach, and the energy
absorption is 37% higher.
The second limitation of ECE R66 is that, in many studies for the compliance to ECE R66, the
bay sections have been used in the physical rollover tests and simulations to minimize the
associated costs and computational resources. As studies show, the mass of the bay section
should be adjusted to obtain a deformation comparable with that of the complete vehicle [10] [13]
[14]. The choice of the bay section from the complete vehicle is subjected to engineers’
judgment and experiences, and no recommendations are provided in the regulation [7]. Thus the
degree of representativeness of complete vehicle structural performance using the bay section
still lacks detailed investigations.
2.1.2. Newly Proposed Regulation by NHTSA
In North America, up until recently, there were no regulations concerning the rollover
performance for motorcoaches. The existing regulations most closely associated with the rollover
protection are FMVSS 220 for school buses and FMVSS 216 for small passenger vehicles,
which assess the roof strength of a vehicle under quasi-static loading. Compared with the

15
regulation using the dynamic test procedure like the ECE R66, existing American regulations are
considered as the less effective representation of real situations. Liang et al [15] compared the
difference between FMVSS 220 and ECE R66 using numerical simulations, and has shown that
the penetration to the passenger compartment is more likely to be underestimated under
American regulation test condition.
Taking account of recent severe motorcoach crashes and absence of a dedicated procedure to
evaluate the rollover resistance of motorcoaches, National Highway Traffic Safety Agency
(NHTSA, USA) has proposed a new regulation aiming to improve vehicle roof resistance to
prevent serious occupant injury in rollover crashes [16] in 2014. The proposal will be applied to
all new over-the-road buses and other types of buses with Gross Vehicle Weighting Rating
(GVWR) greater than 25,000 lbs.
The proposed regulation is based on the complete vehicle rollover test from ECE R66 and the
following performance requirements are specified by the proposal [16]:
(1) (Surviving space): Intrusion into the surviving space, demarcated in the vehicle interior, by
any part of the bus outside the surviving space is prohibited;
(2) (Seats and parcel racks): Each anchorage of the seats and interior overhead luggage racks
and compartments shall not completely separate from its mounting structure;
(3) (Emergency exits): Emergency exits must remain shut during the test and roof and rear
emergency exits must be operable in the manner required under FMVSS No. 217 after the test;
(4) (Side window glazing): Each side window glazing opposite the impacted side of the
vehicle must remain attached to its mounting such that there is no opening that will allow the
passage of a 102 mm diameter sphere.

16
However, based on the aforementioned shortcomings and limitations of the ECE R66 and
additional investigations conducted by NHTSA to determine whether ECE R66 could be applied
to the larger and heavier buses sold in the US, the following additional considerations are
included in the proposed regulation:
1) A mass of 68 kg shall be ballasted in each designated seating positions in the test, regardless
of the ballasting method;
2) Approval of compliance using the equivalent methods of ECE R66 via body sections and
quasi-static calculations shall not be given, as the representativeness is suspicious;
3) Complete vehicle rollover test based on the computer simulation shall not be used to get
compliance as it is not sufficiently objective.
2.2. Vehicle Rollover Simulation Studies
The passenger safety is one of the top considerations in the vehicle design. Though the vehicle
is often equipped with various passive safety devices, the vehicle structure during its failure can
be dangerous to the passengers, especially in terms of the rollover impact situation. It is shown
that the fatality rate will be 13 times larger when the surviving space is intruded in the rollover
events [17]. Consequently, researchers have studied the passive safety of the vehicle structure in
the various impact events for decades and developed the methods and tools to evaluate the
vehicle structural performance and passenger safety.
As the full scale vehicle physical test is of high cost and also difficult to collect sufficient
impact data, researchers have conducted studies on the numerical simulation methods and the
virtual testing tools. The numerical model is considered to be an effective and efficient tool
enabling extensive investigations once the model is built and validated [18]. The numerical

17
simulation can also be used as one of the methods to certify the vehicle in compliance with the
regulation [7]. As a consequence, in the recent decade various simulation tools for numerical
modeling of the vehicle impact events have been developed by the researchers.
(1). From the 1970s, researchers have been attempting to use the numerical simulation method
for modeling the vehicle rollover events with a goal to understand the vehicle crash structural
performance such as the collapse behavior and look for the efficient method to improve the
crashworthiness. As one of the earliest research work shown in [19] in 1979, the computational
modeling began to be used as the tool to study vehicle rollover accidents. Based on the studies of
the vehicle dynamics in accidents, the numerical modeling was conducted and it showed that
most actual rolls occurred with the lateral vehicle motion [19]. A vehicle dynamics program was
developed to simulate the free body roll motion. As for the impact simulation, to obtain the
deformation history of the vehicle, the structural collapse finite element program was developed.
Due to the limited computational resources at the time in 1970s, only the deformation of the bus
cross section rings was simulated.
Another example of using the computer simulation method to model the bus rollover accident
was shown in [20] to improve its crashworthiness and the stability. To reduce the computational
cost, the bus cage model was constructed with beam elements, and the modal analysis was used
to identify the dynamic characteristics.
(2). With the increasing computation capabilities and advancement of the dynamic FE code for
vehicle crashworthiness application, the numerical simulation has been more widely used to
build more complex models. It has been seen that the computational crash analysis is the method
to help to fully understand the failure mechanisms with sequential, complex and progressive
failure [18]. In 1990s the research in using the computational analysis as an effective tool for

18
future development was not limited to universities but included the vehicle manufactures and
supervising government agencies. E.g., since the 1990s Ford Motor Company has been using the
crash simulation code DYNA3D as a key tool for the virtual vehicle collision test [21]. In the
NHTSA’s initiative Partnership for New Generation Vehicles (PNGV) [22], NHTSA decided to
develop detailed FE models of representative vehicles from the highway fleet in the USA using
the LS-DYNA program. The paper [23] presented the full-scale detailed FE model of Chevrolet
C-2500 pickup truck developed in NHTSA National Crash Analysis Center using LS-DYNA.
The above model was validated by comparing the results with the pendulum tests on the pickup
suspension and the full-scale crash test.
(3). Later on, taking advantage of the available growing computation resources, the numerical
simulations using explicit finite element method were conducted by researchers to evaluate the
vehicle crashworthiness in compliance with legislative regulations such as ECE R66. This type
of research became particularly active in the recent decade. The work in [9] presents the virtual
testing approach using FE modeling based on the thin-walled frame structure to approve the
coach rollover performance in accordance with ECE R66 in UK. The work in [24] presents the
virtual test of the bus for its ECE R66 compliance using the FE model in OASYS-Primer and the
solver OASYS-LSDYNA. The research examined the structural performance of the modified
bus superstructure to improve the design in terms of load resistance. In [15], the authors
conducted the comparative analysis of the bus rollover distortion configuration of the
superstructure under ECE R66 and FMVSS 220 using the LS-DYNA code. Another example in
[25] shows that the virtual simulation and evaluation is the key tool in the development of
vehicle rollover test devices. The comparison between the FEA simulations of rollover test using
the test devices of Jordan Rollover System (JRS) with the over-the-ground rollover test was
19
conducted, and the simulation results showed that the JRS testing approach was able to closely
replicate the equivalent over-the-road rollover event.
(4). Nowadays, the design-related research based on the regulation requirements is becoming a
common topic within the vehicle crashworthiness community. The numerical simulation is able
to evaluate the structural performance in a wide range of impact scenarios and it is used
effectively for studying the design criteria, the design improvement and optimization. For
example, the problem of the design criteria of the highly resistant and lightweight vehicle
bodywork was studied by the researchers in IDIADA (Institute for Applied Automotive Research,
Spain) in 1997 [26]. The explicit FEA method is adopted to study the structural resistance
during a rollover for motorcoaches. The beam bending collapse behavior was simulated using the
FEA code ABAQUS accompanied by the experimental data. The study suggested that the pillars
and roof should be continuous in the structure and have similar resistances so that energy could
be absorbed uniformly.
Multiple researchers have studied the energy absorbing capability of the vehicle implementing
the crashworthiness design principle. One example of the study is shown in [27] where the
elastic-plastic FE model (developed in ANSYS) based on the quasi-static loading test of the body
sections was used to identify the essential structural components governing the energy absorbing
capability. Parts of the bus structure contributing to the rollover strength can thus be identified.
The preferential method of the structural optimization for the bus rollover crashworthiness
design following ECE R66 is presented in [6]. The optimization was conducted using the
successive response surface method (SRSM) by LS-OPT and the FE code LS-DYNA with
respect to the energy absorption. The results showed that the displacement of the optimized bus
structure in the rollover event was largely decreased.

20
(5). With the recent development and updates of the rollover legislated regulation, studies
pertaining to the influence of new requirements to the design have become the particularly
important topic. Due to the more severe loading conditions of newly proposed NHTSA
regulation, previous design criteria (suggested to meet the ECE R66 requirements [24] [26] )
may not be sufficiently applicable to the design under new regulations. For example, the research
on effect of the seat structure, passenger weight, and luggage weight on the rollover
crashworthiness of the motorcoach was presented in [12]. An investigation of different scenarios
was conducted using explicit FEA implemented in LS-DYNA software, and the obtained results
on bending deformation and energy absorption were compared. The component tests of a side-
body breast knot and a roof edge knot were used to verify the calculation. This research
concluded that the used computational model produced comparable results with experimental
measurements, and can also be effective for assessment other types of buses and coaches.
Another example in [10] also used the FE model built using LS-DYNA and the physical test to
study the influence of passenger mass on structural deformation of the bus body section in a
rollover event. The obtained data on the addition of the load to the bus structure owing to the
passenger mass will be used for the possible modernization and updating of the regulation.
2.3. Load Transfer Analysis and Index U*
The ability of the coach to meet the regulations depends not only on energy absorbing
capabilities of its components but also on the load carrying capacities [9]. To maintain the
surviving space as required, the high load carrying capacities are essential. Compared with the
traditional stress analysis, load transfer analysis provides insights into the stiffness distribution
among structural members and the ability of the structure to resist deformation.

21
Load transfer analysis provides the way for the vehicle design engineers to determine and
analyze the load path in the vehicle primary structure. Load transfer analysis assesses the
efficiency and rationality of structures in transferring loads from the loading to the supporting
end. The methodology for load transfer analysis has been studied since mid-90s [28] [29] [30]
[31] [32]. Though the concept of load path had been widely used, a simple descriptive definition
was firstly given as “the trajectory taken by a unit of applied load in a prescribed direction within
a structure beginning at a point of application and ending at an equilibrating reaction” by Kelly
and Elsley (1995) [28], where the principal stress and their directions are used as the indicators
of the load distribution. Detailed procedure was later given in [29]. Another method to obtain
load path using fluid flow analogy was proposed in [30] where the load path is described as the
trajectory along which the constant force is transferred. Method of obtaining load path based on a
new concept of transferred and potential transferred force instead of the “stress flow” was
presented in [31].
As for the vehicle structures, the complexity of the components geometry has limited the
application of the above methods of load transfer analysis. The load transfer index U* was firstly
proposed as a method to express the course of the load transfer in the passenger car structure in
Japan in 1995 [33]. The index U* is calculated as a non-dimensional value using strain energies.
Based on this new index, the procedure of load path analysis was later presented in [34], where
the load path is obtained by connecting the ridgeline of the U* contour. The complete
implementation of U* using the matrix of internal stiffness was later proposed in [35]. It shows
that the U* is an index of the degree of connection between an arbitrary point in the structure and
the loading point [35]. The load path is defined as the stiffness line which has the minimum
decay rate of U* values. Compared with the stress trajectory based method, the U* index theory

22
is more effective to express and evaluate the load path in complex structures, since the problem
of stress concentration can be avoided [34]. Inspection load method in [36] was then proposed
based on the internal stiffness expression of U* for efficient calculation. Experiments have been
carried out to prove that U* theory is the true indicator of load transfer in the structure [37]. The
U* index method is also used as a new tool to evaluate the design in terms of the load transfer
efficiency. Design criteria related to the U* index were introduced in [34] to achieve an efficient
and desirable structural design. To better use U* to assist in the design, a new derived index
Usum∗ was proposed in [38], [39] to evaluate the load transfer efficiency. As the sum of U* values
of the loading force and the reaction force, the value of Usum∗ is used as an indicator of the load
path distribution in the structure and as a measure of the effectiveness of the structural design.
The index Usum∗ enables the evaluation of the load dispersion state within the structure.
Vehicle industry has benefited from the designs employing the index U* method for load
transfer analysis on account of its effectiveness. Stiffness problems on the heavy-duty truck
cabin in [34] were solved by investigating the load path using U*. Weight efficiency design
using Usum∗ was presented in [39] for automobile bodies. Design evaluations on the vehicle
component using both the U* method and stress analysis were presented in [40]. Work in [41]
shows that U* and Usum∗ can be used effectively on the parcel rack strut to achieve a modified
design of better overall stiffness and reduced weight. Example of structural sheet steel joints in
[42] shows U* can be used practically to obtain a design of joints of efficient load transfer.
Researchers have also applied the U* method in vehicle crash applications to improve the
structural performance. The initial phase of the frontal collision for a truck cab was analyzed
using U* in [43]. A dynamic U* analysis for side impact of the passenger car was introduced by
considering the inertial force in the U* calculation [44], and the overall rigidity of the

23
compartment is improved effectively. To accommodate U* theory in more applications,
researchers have worked to extend U* theory in complex conditions such as the multiple loading
[45], in composites and in nonlinear elastic structures [46]. Up to date there was no research
done allowing application of index U* approach to the load transfer analysis of the plastically
deformed structures. In order to implement the load transfer analysis approach to the vehicle
crashworthiness design the extension of index U* approach to plastic domain is needed.
2.4. Summary
1. Addressing severe consequences of motorcoach crashes and absence of a dedicated
procedure to evaluate the rollover resistance of motorcoaches, National Highway Traffic Safety
Agency has proposed a new regulation aiming to increase the rollover structural integrity for
buses in North America. To implement the legislative regulation change and reduce the high
costs associated with the full scale physical test, the numerical simulation tools for the virtual
testing of the coach structural performance are needed by the vehicle industry.
2. To avoid the potential subjectivity and questionable representativeness of using body
sections, the numerical analysis should include simulation of the complete vehicle with full
passenger mass.
3. Nowadays the explicit finite element method is a “working horse” being used to conduct the
specialized structural analysis approaches in the viewpoint of the crashworthiness of vehicle.
4. Load transfer analysis provides the way for the vehicle design engineers to determine and
analyze the load path in the vehicle primary structure. In order to implement the load transfer
analysis approach to the vehicle crashworthiness design, the extension of index U* approach to
plastic domain is needed.

24

25
3. FINITE ELEMENT MODELING OF MOTORCOACH ROLLOVER
3.1. Explicit Analysis and Used Software
3.1.1. Explicit Analysis
The finite element analysis can be conducted using the implicit approach or the explicit
approach. As it is shown in the literature review the explicit approach is the primary technique
for analysis of the dynamic response of a structure subjected to the impact and rapidly changing
time-dependent loads. Different with the implicit approach, in the case of explicit finite element
solution, the equations become uncoupled, and they can be solved directly, i.e. explicitly without
iteration for nonlinear problems. A lumped mass matrix M is required for simple inversion, and
no inversion of the stiffness matrix K is needed.
The explicit scheme is shown as the following [47]. In the explicit method, during a time step
∆t, the acceleration and velocity are assumed constant. The information at time t is used to
determine the values at time t+∆t. The time step ∆t needs to be small enough to maintain the
stability of computation. The formulations are presented as following:
𝐌𝐚𝐧 + 𝐂𝐯𝐧 + 𝐊𝐝𝐧 = 𝐅𝐧𝐞𝐱𝐭 (1)
𝐌𝐚𝐧 = 𝐅𝐧𝐞𝐱𝐭 − 𝐅𝐧
𝐢𝐧𝐭 (2)
𝐌𝐚𝐧 = 𝐅𝐧𝐫𝐞𝐬 (3)
Where M is the mass matrix; C is the damping matrix; K is the stiffness matrix; 𝐚𝐧, 𝐯𝐧, 𝐝𝐧are
vectors of acceleration, velocity and displacement, respectively; 𝐅𝐧𝐞𝐱𝐭 is the external loading
vector; 𝐅𝐧𝐢𝐧𝐭 is the internal force vector; and 𝐅𝐧
𝐫𝐞𝐬 is the residual load vector. The residual load

26
vector 𝐅𝐧𝐫𝐞𝐬 is also the net nodal force vector, which includes the contributions from external
loads such as the body force, pressure and contacts, element stress, damping, bulk viscosity, and
hourglass control.
Thus, the acceleration is determined by inverting the mass matrix and multiplying it by the
residual load vector. The velocity and displacement are calculated using numerical integration in
time.
𝐚𝐧 = 𝐌−𝟏𝐅𝐧𝐫𝐞𝐬 (4)
The loop in the calculation of the explicit solution is shown in the diagram [48] shown in
Figure 3-1.
Figure 3-1 Calculation diagram of the explicit method
In summary, compared with the implicit approach, the explicit solution has the following
advantages:

27
(a). The explicit solution handles nonlinearities with relative ease as compared to the implicit
analysis. All types of nonlinearities are included in the internal force vector in the explicit
solution, as shown in the explicit scheme. The calculation of the internal forces is the major cost.
Thus the explicit solution can solve efficiently the problem of various types of contacts, material
nonlinearity, and rigid body motion, etc.
(b). For the nonlinear implicit solution [49], each step requires a series of iterations to establish
an equilibrium within a certain tolerance, while in the explicit solution, no iteration is needed as
the nodal accelerations are solved directly.
(c). The implicit solution requires the inversion of the stiffness matrix over the course of a
time step. For a large deformation problem such as the vehicle impact analysis, the stiffness
matrix could include millions of degrees of freedom. The matrix inversion operation is
computationally expensive, especially for large models. The explicit solution doesn’t require the
matrix decomposition. The explicit solution only requires the simple inversion of a diagonal
mass matrix. Thus it allows solving the large deformation problem more efficiently.
(d). There is also the disadvantage of the explicit solution. The time step for the explicit
solution must be smaller than the time required for the stress wave to cross the smallest element
in the mesh, which is known as Courant-Friedrichs-Levy (CFL) condition. This time step is
usually around 100 – 1000 times smaller than that used in the implicit method.
The vehicle impact event is associated with the physical phenomena of short-duration, highly
nonlinear behaviors of the material, large deformation of the structure, and the rigid body motion.
For the rollover impact, the large deformation of the superstructure and the plastic hinges formed
on the structural beams are the key features for the simulation. These aspects make the traditional

28
Finite Element Analysis with the implicit approach impossible to solve. Consequently, the
explicit FEA tool will have to be employed in this study.
3.1.2. Bus Rollover Simulation and Software Choice
From the literature review, several popular commercial programs for the nonlinear FEA
solution in the application of the vehicle impact simulation include LS-DYNA (LSTC, US),
PAM-CRASH (ESI, France), MSC.Dytran (MSC, US), MADYMO (TNO, Netherlands),
RADIOSS (Altair Engineering, US), and ABAQUS/Explicit (Dassault Systemes, France) [50].
In order to select the best FEA program for the coach rollover simulation, several criteria are
considered, which include (1) the expertise in the vehicle crash application, (2) the accuracy and
the reliability, (3) the parallel processing capability, and (4) the availability of technical support
and resources.
With the consideration of the coach rollover simulation needs and the explicit solver
capabilities of the related commercial programs in vehicle crash simulations, the explicit
nonlinear finite element dynamic code, LS-DYNA®, developed by Livermore Software
Technology Corp (LSTC), was selected to perform the complete coach rollover simulation. The
version R7.1.1 is used [51].
The application examples of LS-DYNA as the FEA tool for the rollover crashworthiness can
be found in the study of rollover performance of an intercity coach [12] and transit buses [52]
[53], the improvement of bus design in rollover [54], and the virtual rollover testing in
compliance of ECE R66 [24].
LS-DYNA is a multifunctional explicit and implicit FE program to simulate and analyze
highly nonlinear physical phenomena pertaining to real-world problems. Usually, these events

29
are subjected to large deformations within the short time duration, e.g. the crashworthiness and
explosion simulations. The features of LS-DYNA include the advanced contact algorithms, the
large library of constitutive models and element types, and the special implementation for the
automobile industry. The diagram of typical work steps using LS-DYNA is shown in Figure 3-2.
Figure 3-2 Diagram of work steps using LS-DYNA for simulation
The pre/post-processing is accomplished in LS-PrePost (LSPP), also developed by LSTC
Company. As an interactive tool for the pre/post-processing, LSPP is designed to have the full
LS-DYNA keyword support, the LS-DYNA model visualization, the capability to create and edit
the LS-DYNA model, the advanced post-processing, and the importing and exporting data in
many common formats [55]. The contour and time histories plotting and simulation animation
can be efficiently conducted using LSPP for the complete coach rollover model.
3.2. Modeling Approach and Model Description
The finite element model of a complete motorcoach used for the vehicle rollover simulation is
shown in Figure 3-3. The assembly consists of the superstructure, parcel racks, the seat structure,
the window glasses and skins, the passenger and baggage floor, the suspension and wheel
assemblies, and the simplified models for the engine and transmission.

30
Figure 3-3 Full scale motorcoach model
3.2.1. Modelling Approach
From the requirements of the newly proposed regulation by NHTSA and the literature review
of the simulation methods for the bus rollover problem presented in Chapter 2, it is seen that the
modelling of the complete vehicle becomes a mandatory part of the modern design procedure. In
order to analyze the behaviour of the coach structure and its compliance with the ECE R66 and
new regulation, the whole process of the rollover from the very beginning when vehicle falls off
the platform to the moment of reaching the maximum deformation should be simulated.
The new regulation also requires examining the structural integrity of the components of the
parcel rack assembly and the seats in the rollover test in case they break and penetrate the
surviving space. To obtain the accurate simulation results these essential components are
included in the complete coach model. They are connected with the superstructure in the
modelling using contacts and constraints.
With the above considerations, the details of the coach framework model are shown in Figure
3-4. The components of the parcel racks, window glasses, and skins are hidden for a clear

31
illustration. As shown in Figure 3-4, the superstructure includes the vertical pillars, cantrails,
waistrails, roof beams, seat beams, beams in the frontal end and rear end. The component of the
parcel rack model is shown in Figure 3-5.
Figure 3-4 Coach framework model
Figure 3-5 Parcel rack model in the coach

32
The total length of the coach is around 13.8 m, thus the scale of the model is one of the critical
question to be addressed. The superstructure of the coach physically is composed of the thin-
walled beams. In the rollover event the vehicle structure dissipates the kinetic energy via
mechanisms of deformation, buckling and fracture. It produces the essential distortions of
geometry and forms the plastic hinges surrounded by the extended zones of plastic deformation.
In order to simulate the phenomena, the beam joints in the structure need to be modeled using
shell elements. Though the simplification of beams as the beam elements has higher computation
efficiency, it is not reasonable as the beam element is unable to simulate the production of plastic
hinges. This scale of the modeling is shown in Figure 3-4 by one example of the roof beam joints
with welds. This small feature is regarded as very important for the rollover simulation. As
shown in Figure 3-4, these beam joints in the coach superstructure are modeled using shell
elements with no less than 5 elements across the length of the beams. As a trade-off between the
accuracy and cost, this mesh density has been shown to be sufficient to capture the bucking
behavior [8].
The model scale of the seat and the parcel rack are shown in Figure 3-6 and Figure 3-7. As the
seats and parcel racks are not designed to bear the load directly, their contributions to the
resistance to the coach global deformation are much less important than the beams in the
superstructure. Though these two components can have many geometrical details, the mesh
density in the model is not as fine as for the coach beams. Shown in Figure 3-6, the seat beams
only have 2 or 4 elements across the width. The parcel rack struts are designed to be
strengthened by stiffeners. They are also modeled using shell elements, shown in Figure 3-7.
These stiffeners have the feature of the narrow width, and they have at least 2 elements across
the width. With this level of details modeled, they are the smallest part in the coach model.

33
Figure 3-6 Model scale of the seat
Figure 3-7 Model scale of the parcel rack
With the consideration of the large dimension of the coach and significant number of the
geometrical features in the structural components contributing to the global deformation in the
rollover, it is not reasonable to have more detailed modeling due to the rapid increasing of
computation cost when the density of mesh gets finer. Since the performed simulations
demonstrated that the selected mesh density in the current model is able to capture the failure
phenomena in the rollover, there is no need to achieve the higher mesh resolution in the model.
Additionally, with the consideration of structural deformation in the rollover event, parts with
negligible deformation will be modeled as the rigid body in order to save the computational time.

34
The rigid parts in the coach model are shown in Figure 3-8. They are mainly the suspension
system and the brackets on the seats. Other parts in the coach model will be deformable.
Figure 3-8 Rigid parts in the coach
3.2.2. Input Data and Problem Analysis
The development of the full scale motorcoach FE model is divided into different stages. The
model is developed based on the modeling work of Eicher Engineering Solutions, Inc. It was
initially developed by Eicher for the purpose of evaluating the parcel rack design in the frontal
collision events [56]. The Eicher model gives the detailed modeling of coach geometries,
contacts and constraints between parts, especially in the frontal part. The University of Manitoba
collision project group decided to use it as the base model, and sought the possibility to modify it
and adapt it to the rollover simulation.
35
As shown by the initial run using the Eicher model, the simulation results demonstrated that
the model had the problem of the unrealistic deformation, the overlarge artificial energy, and the
deviated total energy. It indicated that the Eicher model was far from producing any useful
information. The possible reasons for that include the following:
(a). Rigid parts;
As the Eicher model was used for the frontal collision purpose, its modeling approach treats
the rear lower structural frame as the rigid bodies, since they will not experience large
deformation in the frontal collision. However, this consideration is not acceptable for the rollover
conditions due to significance of the rear frame deformation.
(b). Missing geometry;
After checking the Eicher model, it is found that some essential structural geometry in the rear
part is missing, such as one transverse beam and the engine cradle. They are considered to make
a contribution to resisting the deformation in the rollover. Their absence is thus incorrect.
(c). Unverified material properties;
It is found that the frame material property has a rather low yielding strength, lower than the
common structural steel found from literature and the industry specification. It will directly lead
to a larger deformation in the rollover simulation. It indicates that the material properties need to
be verified with an additional material tensile test. The material properties of other key
components also need to be verified.
(d). Boundary conditions.
The Eicher model check also shows that the rollover boundary condition does not comply with
the ECE R66 regulation specifications.

36
3.2.3. Model Modification
To use the Eicher model for the rollover simulation, the heavy modification work has been
done by the author, with the objective of achieving rollover simulation results which can be
correlated with the physical test results on a similar coach from the database of National
Highway Traffic Safety Administration (NHTSA) and show the reasonable deformation and
energy verification.
The modification work has been carried out for more than 2 years. LS-PrePost was used as the
pre- and post-processing tool for the modification work. Considerable changes were introduced
to the boundary conditions, material properties, geometrical modeling of the key structural
components, contacts and constraints, mass distributions, and the mesh. Among others, the
following major modifications were made, shown in Table 3-1.
Table 3-1 Major modification on the Eicher model
Category Details
(a)
Boundary
conditions
Platform height is 800mm as in ECE R66, and the Center of Gravity in equilibrium position
before the free falling;
Rotational hinge axis is moved to be on the plane of wheel lower tip;
Gravitational force is perpendicular to the ground modeled as a rigid wall;
Friction coefficient 0.7 is chosen between the vehicle and the ground;
The free falling simulation is run at the first step to obtain the correct initial angular velocity
for the impact simulation;
(b) Material
property
The stress-strain curve and the yielding strength of the steel for the frame and welds are
obtained from material tensile test;
The rear lower frame is changed from rigid parts to deformable parts, and lost connections

37
are made up using Constrained Nodal Rigid Bodies or welding;
The material properties of seat structures are modified using data from “Kiel AVANCE
2010 D-coach single pedestal seats”;
(c)
Geometrical
modeling
Welds for key joints of the coach frame are modified to tie adequate nodes according to the
result of the component test validation;
A transverse frame beam connecting two sides at the very lower rear end is introduced to
the model;
The floor at the rear part is modeled;
Accelerometers are modeled by *ELEMENT_SEATBELT_ACCELEROMETER at
multiple locations according to NHTSA’s rollover test data. The minimum sampling
frequency (for output) is studied to get a converged measurement;
(d) Contacts
and
constraints
Tied contacts type is replaced by *Contact_tied_shell_edge_to_surface_beam_offset due to
the negative sliding interface energy;
Tied contact for seat rails are modified to avoid the penetration;
(e) Mass
distribution
Passengers’ mass represented by the mass blocks is removed in the coach model;
Engine mass is modeled by a lumped mass element, which is connected with the mount
frame by beam elements, and the corresponding mass is subtracted from the coach rear
lower frame;
(f) Mesh,
Elements
Full integration formulation is used for elements modeling the strut of the parcel rack to
reduce the hourglass deformation.
(a). Boundary conditions
According to the ECE R66 specification, the height of the platform needs to be 800 ± 20 mm.
The axis of the tilting platform is located at the side of the lower edge of wheels, shown in Figure

38
3-9. As the friction between the ground and the coach also absorbs a certain amount of kinetic
energy, the friction coefficient needs to be defined from a validation test or the literature. A
typical value 0.7 is defined between the steel and concrete [8]. To obtain the correct angular
velocity, the rollover simulation starts from the free falling process.
Figure 3-9 Location of axis of tilting platform
(b). Material property
The low yielding strength of the frame material in the original Eicher model leads to the
decision that the frame material property needs to be verified. It is decided that the material data
from the tensile test of a cut sample of the coach, which will be shown in details in subsection
3.2.5, is used in the simulation, as it represents the real condition. As stated in the initial model
problems, the rear lower frame will use the deformable material model because the deformation
of the rear lower frame is important in the rollover. Material properties of the seats will be
replaced by more detailed material models of the components such as the bracket, beam, leg, and
rail to increase the model’s representativeness of the current coach in production. The detailed
material properties of the seat structure will be shown in subsection 3.2.5.
(c). Geometrical modeling of components

39
As the plastic hinge developed at the pillar joints is a very important factor for the coach
overall structural behavior in the rollover simulation [8], the modeling technique of the welds at
key beam connections needs to be validated in accordance with the component bending test of a
cross pillar joint sample. This will be shown in details in the subsection 3.4. With the validated
behavior of the cross pillar joint by the physical bending test, the coach model will be considered
validated at the component level. Missing structural members such as the transverse beam need
to be introduced to reduce the excessive deformation of the rear frame. The missing floor is also
modeled as it is considered to contribute to the deformation resistance in the coach. To measure
the acceleration in the model for the sake of the comparison with the rollover test result of a
similar coach, the accelerometer model is introduced in the coach model.
(d). Contacts and constraints
To combat the large negative sliding surface energy in the initial model problems, the tied
contact type is studied and compared, and a new tied contact type is used. Another problem for
the contact is that the seat rails and the coach frame beams have the noticeable penetration into
each other in the initial simulation result. In order to avoid this unrealistic penetration and obtain
a correct contact simulation result, the contact thickness in the tied contact parameters is
increased to tie more nodes and the choice of the slave part and the master part are adjusted
according to the mesh density.
(e). Mass distribution
As the tested coach isn’t ballasted with the passenger mass in the current ECE R66 test, to
achieve a comparable rollover simulation results, the passenger mass is removed from the current
coach model. Also, in order to obtain a better mass distribution, even when the model is ballasted
with passenger mass, the mass will be represented by the mass blocks located above the seats.
40
For the same reason, the mass of the engine will be represented by a lumped mass element rather
than being distributed in the rear coach frame as in the Eicher model. The inertia of the lumped
engine mass has a certain influence on the deformation of the rear frame of the coach.
(f). Mesh and elements
During the simulation, it is found that there is evident hourglass deformation of the parcel rack
strut, which contributes to the accumulation of the artificial hourglass energy. To deal with this
problem, the full integration formulation is used for the shell elements of the strut, which is able
to avoid the hourglass deformation occurrence.
3.2.4. Mass Distribution and Centre of Gravity
The modified model was checked for the total mass and the position of the centre of the gravity by
comparison with the tilt table test data of a very similar coach provided by the vehicle manufacturer [57].
The results of comparison are shown in
Table 3-2. It demonstrates that there is very small difference between the model and the data,
so the mass distribution of this coach is considered accurate to a satisfied extent.
More specifically, the structural curb mass of the complete coach model is measured as 17,616
kg, which includes the structural mass, the fuel and fluids and the driver [7]. Since some of the
non-structural components are not represented in the model, to achieve a correct mass
distribution, lumped masses are added to the model, with one of 1,637 kg for the engine, and
additional points with a total mass of 2,435 kg dispersed on the beams throughout the frame.

41
Table 3-2 Differences of CG location between model and tilt table test data of a very similar coach
Model Tilt table test Difference Comments
CG
location
Height, mm
(Measured as table
angle Theta, degree)
42.5 40.73 6.03% Acceptable
Length, mm
(From frontal axle)
6056 6252 3.1% Good
Width, mm
(From centerline)
0 0 0% Very good
Height from the
ground, mm
By calculation
using Theta
By calculation
using Theta
2.4% Good
Weight Total curb weight, kg 17,616 17290 1.89% Very good
3.2.5. Constitutive Material Models
The material response of the coach FE model is simulated mainly using isotropic piecewise
linear plasticity model, with a small number of rigid parts for non-structural elements. The
material models used for the coach main frame and the subsystem of seats and parcel racks,
which are the main contributors to the coach rollover performance, are listed in Table 3-3.

42
Table 3-3 Material models of the frame and two key subsystems
Subsystem Material Model Locations in coach
Welds Steel (024 MAT_PIECEWISE_LINEAR_PLASTICITY) Welds
Frame Steel (024 MAT_PIECEWISE_LINEAR_PLASTICITY) Frontal frame and rear frame
Seat
Structure
Steel (020 MAT_RIGID) Seat fasteners
(020 MAT_RIGID) Passenger and driver mass
blocks
Steel (024 MAT_PIECEWISE_LINEAR_PLASTICITY) Bracket seat-to-wall
Steel (024 MAT_PIECEWISE_LINEAR_PLASTICITY) Leg and rail floor
Aluminum, (024 MAT_PIECEWISE_LINEAR_PLASTICITY) Rail wall
Steel (024 MAT_PIECEWISE_LINEAR_PLASTICITY) Beams seat frame
Complete
parcel rack
Aluminum (024 MAT_PIECEWISE_LINEAR_PLASTICITY) Evaporator for Parcel rack
Parcel rack rails
Nylon (024 MAT_PIECEWISE_LINEAR_PLASTICITY) Parcel rack strut and coverings
054/055 EHANCED_COMPOSTE_DAMAGE Pultrusions of Parcel rack
100 SPOTWELD_DAMAGE_FAILURE Bolts for Parcel rack
Stress-strain curves of the structural stainless steel for the frame beams and welds were
obtained by the uniaxial material tensile test per ASTM E8/E8M testing standard on the samples
cut from the real vehicle frame, conducted by the University of Manitoba collision project group.
Author of the present thesis contributed to the analysis of data. The obtained material properties
are presented in Table 3-4:

43
Table 3-4 Material properties for the frame structural steel
Density (kg/m3) Young’s modulus (GPa) Poisson ratio Yielding strength (MPa)
7850 210 0.3 426.7
The dog-bone specimen and the plastic strain and true stress curve are shown in Figure 3-10.
No strain rate effects or failure is considered for the structural steel material in this model. The
raw test data and analysis can be found in Appendix A.
(a) (b)
Figure 3-10 Material properties test and stress-strain curve: (a) Dog-bone specimen; (b) Stress-strain
curve of the frame steel
The material properties of the seats differ in different components. The structural components
are shown in Figure 3-11 and the material properties are shown in Table 3-5.

44
Figure 3-11 Different components of seat structure
Table 3-5 Material properties for seat structure
Components Young’s modulus (GPa) Poisson ratio Yielding strength (MPa)
Bracket seat-to-wall
(steel_S355) 210 0.3 391
Leg and rail floor
(steel_SS304) 195 0.3 258.85
Rail wall
(aluminum_AA6060T4) 68.2 0.33 80.58
Beams seat frame
(steel_St34) 195 0.3 220
To evaluate the passenger safety in the coach rollover event according to ECE R66, in the
modified model the periphery of the surviving space is built using the shell elements with the
type of null material (*MAT_NULL) as the surviving space is not an existing component in the
coach (Figure 3-12).

45
Figure 3-12 Surviving space with the null material
3.2.6. Element Types and Formulations
As the coach structure mainly consists of the thin-walled beams and panels as the frame, shell
elements are employed and they dominate in the modified finite element model. This model
contains around 4.2 million nodes and 4.7 million elements with approximately 83% of shell
elements and 17% of solid elements; the rest are a few beam and discrete elements and mass
elements.
The shell element formulation of four-node underintegrated type Belytschko-Tsay with 5
integration points through the thickness is widely used in the finite element model for its
advantage of high computational efficiency [58]. It requires 2.5 times less computation time than
the fully integrated element formulation (Type 16), and it becomes the default shell element
formulation for explicit simulations. The underintegrated shell elements also have the low
possibility of the shear locking problem. However, the Belytschko-Tsay elements are prone to
the problem of the nonphysical deformation pattern with zero energy deformation modes in the
shell elements as the hourglass deformation. LS-DYNA provides the hourglass control with the

46
introduction of additional stiffness for the elements [51]. Type 1 standard hourglass control with
the default coefficient 0.1 is used in the model with the Belytschko-Tsay shell elements.
For the coach frame beams, no less than five elements across the edge of the cross section are
used to permit the correct simulation of the buckling behavior of the frame beams, which is
critically important to capture the dynamic behavior of the vehicle structure in the rollover.
Solid elements are mainly used in the coach model in the parts of suspension systems. Beam
elements are implemented in the model mainly for modelling the air springs and the bolts
connecting parcel racks and the coach frame, which are considered to play much less important
role in the coach rollover performance. Mass elements are used to tune the mass distribution in
the coach.
3.2.7. Contacts and Constraints
The vehicle assembly is built using contacts and multi-point constraints between individual
parts. The summary of the contacts defined in the coach model is shown in Table 3-6.
Constrained Nodal Rigid Bodies (CNRB) are used in the model to attach most of the small non-
structural components to the frame by simply constraining all degrees of freedom. Constraints
for the rigid bodies are also defined in the model, mainly for the rigid suspension parts and
between the rigid passenger mass blocks and the deformable seat structure. The examples of
connections and constraints are shown in Figure 3-13.

47
Table 3-6 Summary of contacts
Contact type Details
Automatic_single_
surface
Global contact between most of the parts
Automatic_surface
_to_surface
Parcel rack to coach side frame
Parcel rack to coach top frame
Rear floor to the channel structures beneath the floor
Tied_shell_edge_
to_surface_beam_
offset
Welds (Slave) tied to the coach frame (Master); welds for main pillars
excluded
Welds (Master) tied to the coach frame (Slave) for main pillar connection
Seat rails (Master) tied to frame shells (Slave)
Nodes of parcel rack at the side (Slave) tied to coach top frame (Master) at
two sides as the bolts connection
Nodes of parcel rack near the top center (Slave) tied to coach top frame
(Master) at two sides as the bolt connection
Tied contact within parcel rack components at two sides
The global contact is defined between most of the structural parts to prevent them from
penetrating into each other. Other types of contacts are used mainly for the subsystem of parcel
racks and seats for the connection within them and the connection with the coach frame. As one
of the most important contacts for the coach rollover performance, welds are modeled explicitly

48
as separate parts with isotropic piecewise linear plasticity model connected to the beams using
tied contacts. Shown in Figure 3-13, for the main pillars, adequate numbers of slave nodes on the
beam are tied to the welds using the contact type Tied_shell_edge_to_surface_beam_offset [51].
This type of the tied contact is used for the welding modeling because it constrains both the
translational and rotational degree of freedoms, and it will not produce large negative sliding
surface energy.
Figure 3-13 Examples of connections and constraints in the coach model: (Red) welds tied to the coach
frame for the main pillars with tied nodes highlighted; (Green) CNRB for connecting a bracket to the
frame beam; (Blue) Rigid body constraints for the rigid rear suspension parts
3.2.8. Hardware Support
Considering the model size and the nature of the small time step of the explicit FEA solution,
the computation cost requirement is very high and it exceeds the hardware capability of any

49
personal computer or workstation. Supercomputing facility provided by the network of Compute
Canada is employed. The simulations are performed using MPP (Massively Parallel Processing)
version LS-DYNA on the supercomputing facility GREX, which is part of Compute Canada’s
Westgrid network. For the simulation of the impact event of 800 ms duration, the simulation
takes around 74 hours running on 26 cores. The pre- and post-processing is conducted on the PC
using the tool LSPP.
3.3. Boundary Conditions
Replicating the conditions of a physical test, the simulation starts with the equilibrium position
shown in Figure 3-14. Initially, the center of the gravity is at its highest position when the wheel
lift-off starts. The gravitational load is applied as the external loading using the keyword
*LOAD_BODY to add the acceleration in the vertical direction. The interaction between tires
and an edge of the platform is represented by a rotary hinge with the axis parallel to the
longitudinal axis of the vehicle using the keyword *CONSTRAINED_JOINT_REVOLUTE. The
hinge is deactivated by defining the time for the revolute joint failure when the wheels leave the
platform.
Figure 3-14 Initial condition of rollover simulation

50
Shown in Figure 3-15, a wheel support on the rigid tilting platform is used to prevent wheels
of the tested vehicle from sliding sideways. To simplify the modeling of the tilting platform and
the contact between wheels and the support, a hinge is built where the outward surface of wheels
touches the wheel support, shown in Figure 3-16. The lower half of the hinge is fixed and the
upper half is connected to the wheel using nodal constraints. The revolute joint between the
lower and upper half is used as the rotation axis for tilting.
Figure 3-15 Tilting platform and wheel support in ECE R66 [7]
Figure 3-16 Hinge in the model
The contact of the coach model and the ground is implemented in LS-DYNA using a rigid
wall with a frictional contact using the keyword *RIGIDWALL_PLANAR, shown as the green
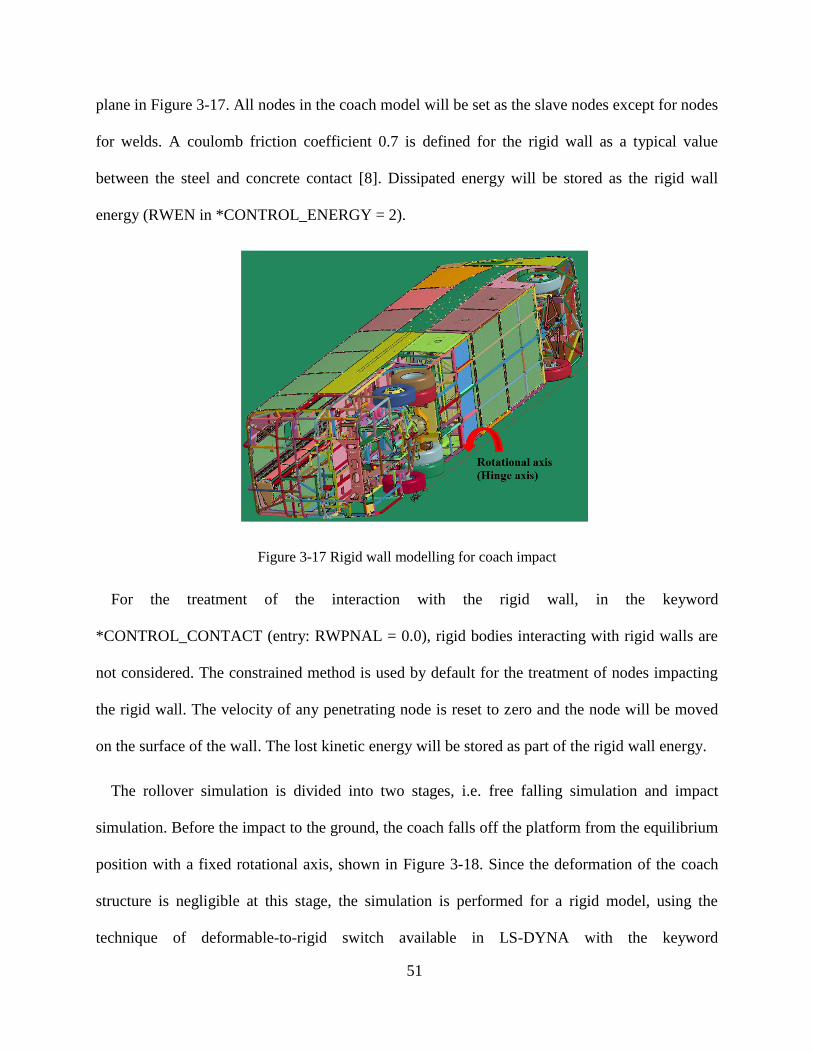
51
plane in Figure 3-17. All nodes in the coach model will be set as the slave nodes except for nodes
for welds. A coulomb friction coefficient 0.7 is defined for the rigid wall as a typical value
between the steel and concrete contact [8]. Dissipated energy will be stored as the rigid wall
energy (RWEN in *CONTROL_ENERGY = 2).
Figure 3-17 Rigid wall modelling for coach impact
For the treatment of the interaction with the rigid wall, in the keyword
*CONTROL_CONTACT (entry: RWPNAL = 0.0), rigid bodies interacting with rigid walls are
not considered. The constrained method is used by default for the treatment of nodes impacting
the rigid wall. The velocity of any penetrating node is reset to zero and the node will be moved
on the surface of the wall. The lost kinetic energy will be stored as part of the rigid wall energy.
The rollover simulation is divided into two stages, i.e. free falling simulation and impact
simulation. Before the impact to the ground, the coach falls off the platform from the equilibrium
position with a fixed rotational axis, shown in Figure 3-18. Since the deformation of the coach
structure is negligible at this stage, the simulation is performed for a rigid model, using the
technique of deformable-to-rigid switch available in LS-DYNA with the keyword

52
*DEFORMABLE_TO_RIGID_AUTOMATIC [59] [60]. All parts are switched to the rigid state
and be merged as one body at the time 0 s. The rotational velocity at the moment of impact is
then recorded. At the next stage, an impact simulation is performed, where the model is treated
as the deformable state. The simulation starts at the coach position just before the impact with
the applied initial rotational velocity, recorded in the free falling simulation. The keyword
*INTIAL_VELOCITY_GENEGRATION is used to define the initial rotation velocity.
Figure 3-18 Rollover simulation for free falling and impact
3.4. Component Test and Validation
Due to the model complexity and limited amount of information available for model validation
from a complete rollover test, the model validation at the component level was carried out. A
typical joint between a vertical pillar and a roof beam is utilized as one of the representative
members of the coach. One example of the pillar connection with roof beams is shown in Figure
3-19. Such a connection is considered to play an important role in contributing to the structural
integrity in the rollover event, as most of the overall deformation for the coach structure is
dictated by the plastic hinge developed at the pillar joints. Thus, the validation of a model of the
pillar joint will lead to the correct structural behavior of the majority of the coach frame.

53
Figure 3-19 Example of pillar structure in a typical coach
The quasi-static component bending test on the cross pillar sample was firstly conducted. The
significance of the component test is that it provides the way to validate the simulation technique
used in the full coach model for the pillar-roof connection, including the material model, mesh
density, element type and welding modeling approach. Due to the complexity of the loading and
the boundary condition of the cross pillar in the dynamic rollover event, the quasi-static bending
test will not produce the same failure mode as in the real rollover event. However, the same
loading and boundary condition can be duplicated in the simulation. Based on the comparison of
the simulation and component test results, the simulation technique can therefore be validated.
3.4.1 Component Bending Test
The pillar sample was cut from the coach frame directly, made of the stainless steel. The test
setup is shown in Figure 3-20 (a). The loading is applied by an MTS loading machine with the
displacement-controlled method at the rate of 10 mm per minute. Shown in Figure 3-20 (b), three
ends of the pillar were fixed while the lower end was subjected to a quasi-static vertical load

54
until failure occurred at around 100 mm displacement. It is noted that the three fixed-end
connections are strengthened to ensure the failure will happen at other locations of the pillar. The
displacement and the force data at the loading point were recorded during the test. More detailed
description and discussions about the test setup can be found in [61].
(a) (b)
Figure 3-20 Pillar bending test setup [61] (permission acquired): (a) Loading machine and fixture; (b)
Boundary conditions of the pillar before the test
The deformed pillar after the loading is applied is shown in Figure 3-21 (a). At the end of the
test, the pillar joint fails due to the buckling and fracture at the welded areas, shown in Figure
3-21 (b) (c) (d). The force-displacement curve for the test is shown in Figure 3-22.

55
Figure 3-21 Quasi-static component test results of the pillar: (a) Deformed pillar; (b) Fracture at welding;
(c) Close view of failure; (d) Another close view of the failure
Figure 3-22 Force-displacement curve of the component test

56
3.4.2 Model Validation
The pillar connection model is directly extracted from the coach main frame model, shown in
Figure 3-23, and the same boundary conditions as in the component test are applied. The
deformed pillar at the end of the simulation is shown in Figure 3-24 (a), and the comparison of
the deformation and force-displacement curves between the simulation and the test is presented
in Figure 3-24 (b) (c). Table 3-7 shows data on the quantitative comparison of the force-
displacement curves.
(a) (b)
Figure 3-23 Pillar from the coach model: (a) Location of the pillar in the coach; (b) Pillar model
(a) (b)

57
(c)
Figure 3-24 Simulation results of pillar submodel from the coach frame model: (a) Deformation of
submodel; (b) Comparison of deformation between the simulation and test; (c) Comparison of f-d curves
between the simulation and test
Table 3-7 Quantitative comparison of the force-displacement curves
Metrics Experiment Simulation Difference %
Peak force at buckling, Fmax (kN) 10.1 10.5 4.0
Stiffness in linear region, K (N/mm) 1122 1080 -3.7
Energy absorbed up at 97mm, E (J) 793 917 15.6
Figure 3-24 (c) shows that the model is capable of reproducing the linear and initial buckling
behavior of the pillar. The difference between the slopes in the linear region and maximum
values of the two curves are small enough to be both within 4%. There is a noticeable difference
in the post-buckling behavior between the model and test, shown in Table 3-7. By refining the
mesh and introducing the failure criteria, it is expected that the simulation curve can get closer to
the test. As the global deformation of the coach primarily depends on the linear behavior of the

58
structural members, taking account of the limitations imposed by the scale of the full vehicle
model, a good correlation of the connection strength for the pillar submodel has been obtained
with the component test result. Consequently, the component submodeling and the simulation
technique is considered to be sufficiently validated.
3.5. Free Falling Simulation and Results
The process of the free falling is firstly simulated for the coach rollover. The simulation is
performed for a rigid body using the deformable-to-rigid switch technique. Shown in Figure 3-25,
the coach starts falling when the wheel lift-off starts at the equilibrium position. The tilt table
angle is measured as around 42.5 degrees at this moment.
Figure 3-25 Initial state of free falling process of coach rollover
In order to accelerate the simulation, an initial angular velocity is set up for 0.35 rad/s for the
free falling simulation, which is considered an acceptable value as the added kinetic energy is
negligible when compared with that at the moment of impact.

59
In the free falling process, the potential energy of the coach is transferred into the kinetic
energy. And the total mechanical energy is conserved in this process.
mg∆H = K2 − K1 (5)
Where K1, K2 are the kinetic energy at the initial moment and impact moment.
Results of the free falling simulation will be used as the boundary condition for the impact
simulation. The angular velocity at the moment of impact will be extracted.
3.5.1. Simulation Results
The free falling simulation shows that at the moment when the roof corner impacts with the
ground, shown in Figure 3-26, the impact force angle is roughly around 13.6 degrees.
Figure 3-26 Impact force angle
The angular velocity time history in the global coordinate is shown in Figure 3-27. As all
nodes in the model give the same angular velocity, the choice of nodes here is arbitrary.

60
Figure 3-27 Angular velocity time history
At the moment of impact (around 1.30 s), the angular velocity is measured as 1.96 rad/s.
As the total mechanical energy is conserved, from Equation (5), we have:
mg∆H =1
2Jo(ω2
2 − ω12) (6)
Where Jo is the moment of inertia, and the angular velocity at the initial moment and at impact
moment are:
ω1 = 0.35rad
s, and ω2 = 1.96
rad
s
Consequently, when ω1 = 0, ω2 will be around 1.92 rad/s, which is used as the initial angular
velocity for the impact simulation.
3.5.2. Energy Verification
The energy time history of the free falling simulation is shown in Figure 3-28. The potential
energy, shown in the graph as the external work by gravity, is transformed into the kinetic energy.
The total energy is conserved. The added initial kinetic energy due to the initial angular velocity
is small enough for only around 3.2% of the kinetic energy at the impact moment.

61
Figure 3-28 Energy time history for free falling simulation
3.6. Impact Simulation and Results
Following the free falling simulation, the impact simulation of the coach rollover starts at the
moment of the coach rollover impact, with the applied initial rotational velocity extracted from
the free falling process. The initial state of the coach in this simulation is shown in Figure 3-29.
Figure 3-29 Initial state of the coach rollover impact simulation

62
To validate the model of the complete vehicle with available data, the rollover simulation is
performed with no passenger mass, and the results are compared with the results of a physical
test completed according to the ECE R66 procedure by NHTSA for a passenger vehicle with
very similar structural features [62].
3.6.1. Simulation Results – Deformation
Snapshots of the deformation starting at the moment of impact are shown in Figure 3-30 in
comparison with the deformation pattern from the physical test.
PHYSICAL TEST BY NHTSA [62] SIMULATION
a) Roof corner touches the ground
t=0s t=0.0s
b) Waistrails impact with the ground for 1st time
About t=0.16s t=0.15s

63
c) Coach bounces up and slides
t=0.33s t=0.375s
d) Waistrails impact with the ground for 2nd
time
About t=0.55s t=0.575s
e) Recovered, with residual deformation
About t=0.78s t=0.7s
Figure 3-30 Comparison of deformation pattern between NHTSA test and simulation

64
The comparison shows a good level of qualitative correlation for the deformation pattern in the
rollover test. After the roof corner touches the ground at t=0.0s in Figure 3-30 (a), the
superstructure starts to deform till around 0.15s when the waistrails impact the ground in Figure
3-30 (b). Then the vehicle bounces up and slides forward along the contact line between the
ground and the roof corner in Figure 3-30 (c). It makes the 2nd
impact on waistrails in Figure
3-30 (d). The coach rolls back to reach a balanced position in Figure 3-30 (e). The deformed
superstructure also restores partially in Figure 3-30 (c) (d) (e).
During the rollover impact simulation, the surviving space is seen to be penetrated by the side
frames at the impact side. The maximum penetration is shown in Figure 3-31, as found around
0.3s, during sliding process.
Figure 3-31 Max penetration of the surviving space
3.6.2. Simulation Results – Energy Curves
For verification purposes, the energy curves from the simulation are shown in Figure 3-32.
At the end of the simulation, the majority of the kinetic energy is consumed by the plastic
deformation and the ground friction. Internal energy takes up around 86% of the total. Wall

65
energy due to the friction takes up 5% of the total. Artificial energy terms including hourglass
energy and the contact energy only take up 6.6% of the total. Shown in Figure 3-32, the total
energy is conserved. The final proportion of each energy term is shown in Table 3-8.
Figure 3-32 Energy time history for impact simulation
Table 3-8 Proportion of energy items for impact simulation
Energy
item
Total
energy
Internal
energy
Kinetic
energy
Potential
energy
Wall
energy
Contact
energy
Hourglass
energy
Percentage 100% 86% 2.4% 0% 5% 0.6% 6%
The time history of mass increase percentage is shown in Figure 3-33. It is shown the final
mass increase is below 5.5%. It is considered acceptable though it is slightly larger than the
recommended value of 5% [63]. The mass increase can be reduced by using a smaller time step

66
in the simulation. Due to the rapidly increased computation cost, it is unnecessary to strictly
accomplish in the simulation.
Figure 3-33 Mass increase percentage time history
The verification metrics for the energy results are summarized in Table 3-9.
Table 3-9 Verification metrics for energy results
Criterion Max value (Absolute value) Threshold [63]
Deviation of total energy 1.3% 10%
Contact energy /Total energy 0.6% 10%
Hourglass energy /Total energy 6% 10%
Mass increase 5.5% 5%
3.6.3. Simulation Results – Acceleration Curves
To provide the quantitative comparison between the results of test and simulation, the data
from the accelerometers placed in the passenger compartment are used [62]. Shown in Figure
3-34, the acceleration is measured on three planes (A, B and C) on the vehicle from the frontal

67
end to the rear end. All curves are outputted in local coordinates, filtered by SAE J211 filter with
Channel Frequency Class of 60Hz, in both the test and the simulation.
Figure 3-34 Planes in the vehicle to measure the acceleration data
The quantitative assessment of the curve similarity for the acceleration plots is carried out with
curve comparison metrics recommended for crashworthiness applications in [63]. Table 3-10
outlines the utilized metrics, together with acceptance criteria. In the table, mi and ci denote the
measured and computed quantities, respectively; i indicates an instance in time, and n indicates
the total number of data samples. The metrics values are calculated using RSVVP software [64].
Table 3-10 Validation metrics
Metrics Equation Acceptance criteria, %
Sprague-
Geers
Magnitude
40
Phase
40
Comprehensive
40
ANOVA
Average residual error
5
Standard deviation
20

68
Shown in Figure 3-35, acceleration profiles in the transverse direction on 3 planes on the floor
are compared. Table 3-11 gives the quantitative metrics comparison for the curves similarity.
Figure 3-35 Comparison of accelerations on 3 planes on the floor (transverse direction)
Two peaks of the acceleration can be seen from the curves on all 3 planes, corresponding to
two impacts on waistrails in Figure 3-30 (b) (d). It is shown that acceleration results are closely
correlated in the simulation and the test, as reflected in the low value of the Sprague-Geers
metrics. Though the differences exist with regard to the appearance time of the 2nd
peak of the
curve, the main features of rollover impact are still matched. The values of the ANOVA metrics
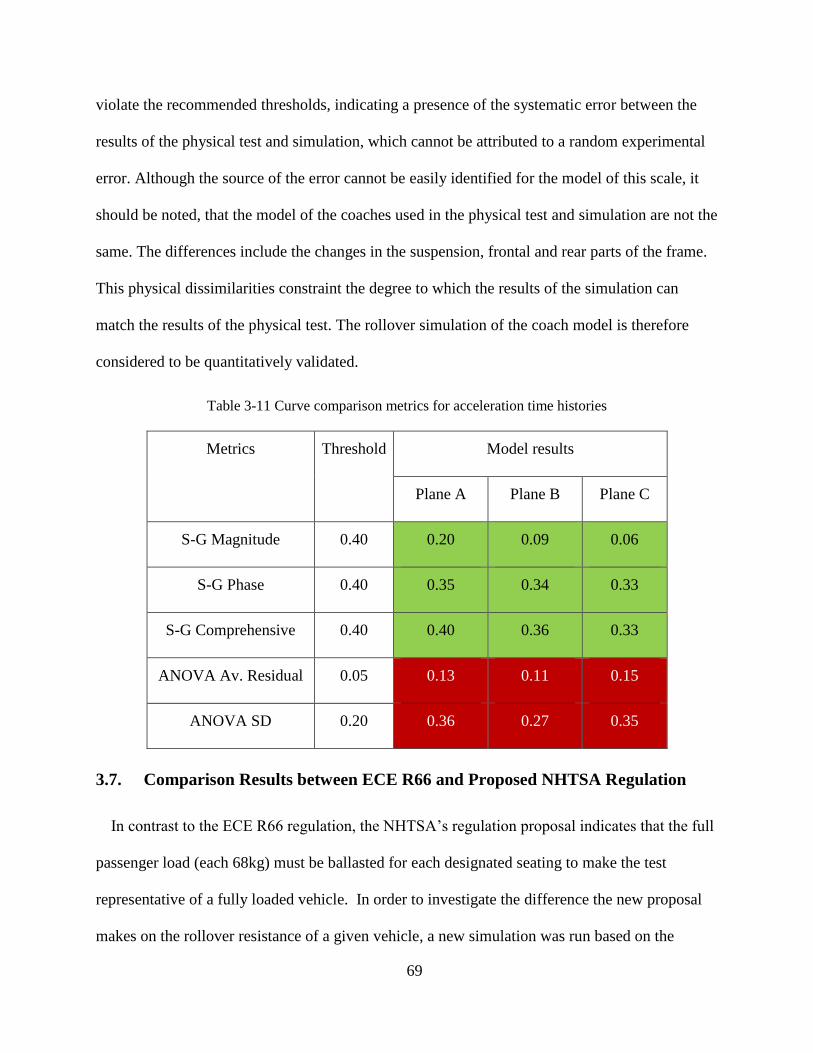
69
violate the recommended thresholds, indicating a presence of the systematic error between the
results of the physical test and simulation, which cannot be attributed to a random experimental
error. Although the source of the error cannot be easily identified for the model of this scale, it
should be noted, that the model of the coaches used in the physical test and simulation are not the
same. The differences include the changes in the suspension, frontal and rear parts of the frame.
This physical dissimilarities constraint the degree to which the results of the simulation can
match the results of the physical test. The rollover simulation of the coach model is therefore
considered to be quantitatively validated.
Table 3-11 Curve comparison metrics for acceleration time histories
Metrics Threshold Model results
Plane A Plane B Plane C
S-G Magnitude 0.40 0.20 0.09 0.06
S-G Phase 0.40 0.35 0.34 0.33
S-G Comprehensive 0.40 0.40 0.36 0.33
ANOVA Av. Residual 0.05 0.13 0.11 0.15
ANOVA SD 0.20 0.36 0.27 0.35
3.7. Comparison Results between ECE R66 and Proposed NHTSA Regulation
In contrast to the ECE R66 regulation, the NHTSA’s regulation proposal indicates that the full
passenger load (each 68kg) must be ballasted for each designated seating to make the test
representative of a fully loaded vehicle. In order to investigate the difference the new proposal
makes on the rollover resistance of a given vehicle, a new simulation was run based on the

70
validated model described above. In the new simulation, the coach model is loaded with the full
passenger mass for each designated seat.
As the passenger masses are coupled with the structural mass on the seats, compared with the
coach model without passenger mass, the coach with full passenger mass has a higher position of
the center of gravity. The pre-simulation of the free falling process shows that the full passenger
loaded coach has a higher rotational velocity before the impact. For the purpose of the
comparison, the mass, position of the center of gravity and the angular velocity at the moment of
impact of the two models are shown in Table 3-12.
Table 3-12 Model data comparison
Model 1: without passenger mass; Model 2: with full passenger mass.
Model 1 Model 2 Difference
Model mass /kg 17,623.6 21,431.6 21.6%
Centre of gravity position /mm (0,0,0) if the coordinate
is fixed at the C.G.
(-76,1,113) in the
same coordinate
/
Initial angular velocity / rad/s 1.92 1.99 3.65%
3.7.1. Deformation Comparison
The comparison of the deformation of two coach models is shown in Figure 3-36. With a
raised center of gravity position, the vehicle experiences a larger inertial force. A worse
penetration into the surviving space will be produced in the test condition of a full passenger
load. At t=0.35 s when the coach starts to slide, the penetration in the model of zero passenger
mass is measured to be around 154 mm, while the penetration in the case of full passenger mass
is of 2.5 times, to be around 389 mm. The simulation results also show that the coach with the

71
full passenger mass produces a longer slide distance (S2>S1) during the rollover test, as the
additional inertial force from the coupled passenger mass drives the vehicle roll forward.
Figure 3-36 Deformation comparison: (a) t =0.35 s when the coach starts to slide; (b) t=0.70 s when the
coach finishes sliding
3.7.2. Energy Absorption Comparison
3.7.2.1. Distribution of plastic strain
The extent of the deformation experienced by the coach frame depends on energy absorbing
capabilities among structural members [9]. Due to the thin-walled beam construction of the
coach structure under consideration, the main mechanism for energy absorption is the formation

72
of local plastic hinges at the beams’ connections. The contours of the effective plastic strain on
the deformed structures of the two coach models at the time 0.3s are shown in Figure 3-37 and
Figure 3-38. The fringe limit is set to a rather small value 0.01. The locations of red color
indicate the area associated with the relatively large plastic strains, which are considered as the
plastic hinges.
The simulations show that most of the plastic deformations are localized in the connection
joints of beams in the superstructure of the coach in both models, including pillar–roof joints,
pillar-waistrail joints, joints of seats, seat-wall joints and welded joints of the rear frame, shown
in Figure 3-37. The larger area of plastic hinges can be seen in Figure 3-38 with full passenger
mass at joints of seats-wall and pillar-waistrail joints.
Figure 3-37 Contour of effective plastic strains on the deformed coach (zero passenger mass)

73
Figure 3-38 Contour of effective plastic strains on the deformed coach (full passenger mass)
3.7.2.2. Distribution of energy absorption
The energy absorption is not evenly distributed among the vehicle frame members, and they
also vary during the process of rollover impact. To provide the better understanding of the
energy absorbing capabilities of different frame members, a frame model is used in the analysis.
Components which are considered much less effective in absorbing energy in rollover, e.g. the
glass and skins, parcel rack assembly, are removed from the model. The coach frame is divided
into 9 groups, shown in Figure 3-39.

74
(1) Pillar loops, (2) Rear frame, (3) Seats, (4) Lower frame, (5) Waistrails, (6) Roof
longitudinal beams, (7) Wall beams, (8) Floor, and (9) Frontal beams.
Figure 3-39 Groups of coach frame members
Time histories of the absorbed energy among structural groups during the impact process are
shown in Figure 3-40.
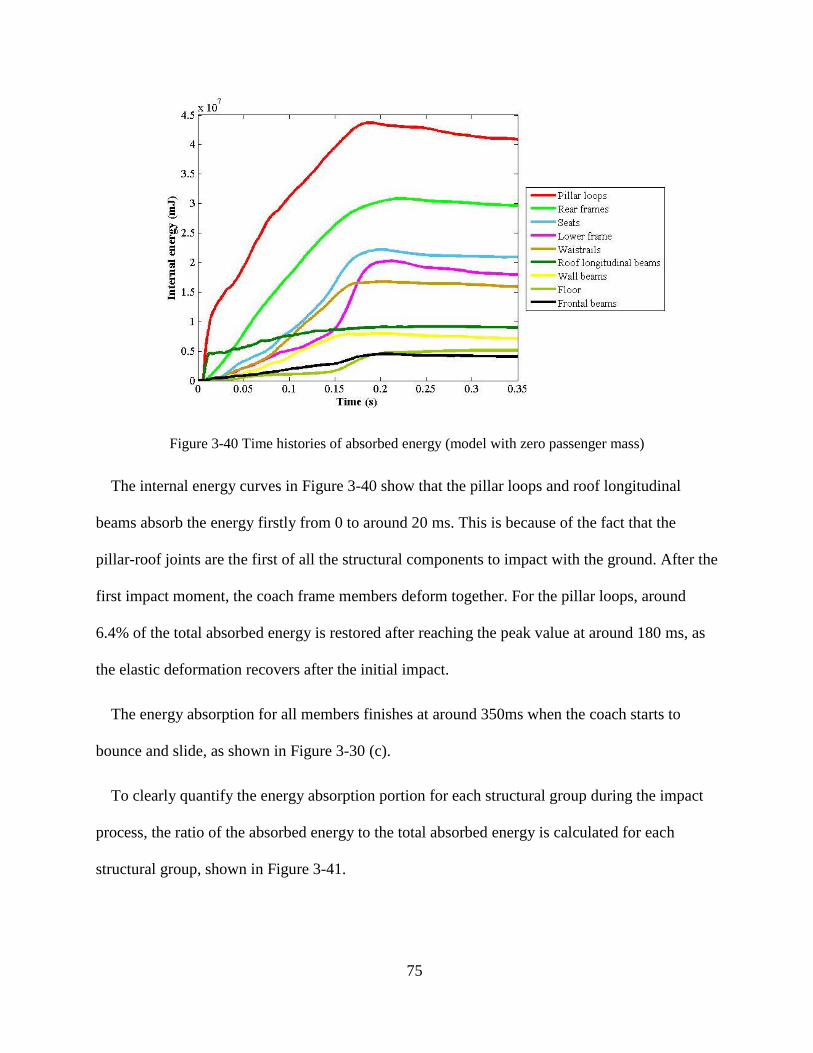
75
Figure 3-40 Time histories of absorbed energy (model with zero passenger mass)
The internal energy curves in Figure 3-40 show that the pillar loops and roof longitudinal
beams absorb the energy firstly from 0 to around 20 ms. This is because of the fact that the
pillar-roof joints are the first of all the structural components to impact with the ground. After the
first impact moment, the coach frame members deform together. For the pillar loops, around
6.4% of the total absorbed energy is restored after reaching the peak value at around 180 ms, as
the elastic deformation recovers after the initial impact.
The energy absorption for all members finishes at around 350ms when the coach starts to
bounce and slide, as shown in Figure 3-30 (c).
To clearly quantify the energy absorption portion for each structural group during the impact
process, the ratio of the absorbed energy to the total absorbed energy is calculated for each
structural group, shown in Figure 3-41.

76
Figure 3-41 Time histories of energy absorption ratios (model with zero passenger mass)
At the first impact moment (20 ms), the pillar loops contribute to around 50% of total
absorbed energy, and roof longitudinal beams absorb around 20%. After the first impact
moment, though pillar loops and roof longitudinal beams continue deforming, their ratios
decrease rapidly, since other structural groups start to deform.
At the end of the energy absorption (350 ms), shown in Figure 3-41, pillar loops still rank first
in the energy absorption ratio, and rear frames, seats, lower frames, waistrails, and the roof
longitudinal beams following. These groups together take up around 82% in the energy
absorption at the end of the impact. Other structural members such as wall beams, the floor, and
frontal beams have less prominent energy absorption capabilities.
To better compare the differences of energy absorption between the model with zero passenger
mass and that with full passenger mass, rankings of energy absorption among the structural
groups at the beginning (t = 20 ms) and at the end of the impact (t = 800 ms) are illustrated in

77
Figure 3-42 (a) and (b) respectively. In the figure, structural groups are arranged in the
decreasing order of energy absorption ratio at the end of impact.
(a)
(b)
Figure 3-42 Ranking of energy absorption ratios among structural groups: (a) Model with zero passenger
mass; (b) Model with full passenger mass

78
For the model with full passenger mass, the coach structure needs to absorb much more energy
during the rollover, as the simulations show that the initial kinetic energy is around 1.4 times that
in the model with zero passenger mass. However, comparing the results in two test conditions in
Figure 3-42 (a) and (b), the distribution of energy absorption at the beginning of impact are very
alike. The main reason for such similarity is the short duration of the initial impact on the roof
corner and the localization of plastic hinges.
The comparison at the end of impact shows that the first five groups have slight changes, but
the group of wall beams rises by one spot in the ranking with the energy absorption ratio
increasing by 27%. This is because of the effect of the coupled passenger mass on the seats. The
inertial force exerted on the seats is transferred through joints between seats and wall, which will
lead to a large bending force, in this case experienced by wall beams in the coach superstructure.
From the data shown in Figure 3-42 (a) (b), it can be seen that the pillar loops always absorb
the most of energy during the impact process. Thus the pillar-roof joints and pillar-waistrails
joints play a significant role for the coach superstructure in the energy absorption of the rollover
event. The contribution of welded joints between rear frame beams is also important, as the rear
frame group ranks the second in energy absorption at the end of impact.
For the coach with zero passenger mass, joints of seats and joints between seats and wall also
contribute to the energy absorption, to a certain amount. In the case of full passenger mass, the
contributions of joints between seats and wall will increase largely, and special attention is
required to maintain the rollover resistance for the coach superstructure.

79
3.8. Conclusion
This chapter presents the results of evaluating the rollover structural performance of a typical
motorcoach using a full scale coach model. The model is validated at the component level by the
roof-pillar joint test and at a system level by complete vehicle rollover test, and a good level of
correlation is found. The performance of the coach structure is then evaluated for two loading
conditions: with no passenger mass, according to the current ECE R66 regulation, and with full
passenger mass of each 68 kg in compliance with a newly proposed NHTSA regulation. Taking
advantage of the detailed computational model, energy absorption distribution among structural
members is presented. Requirements of the design for a sufficient rollover resistance in
accordance with the regulatory changes are studied using the coach frame model. The following
conclusions are therefore made.
1) The methodology of the numerical simulation provides an effective tool in assisting vehicle
designers to predict and assess the vehicle structural performance for the compliance to the new
regulations in the crash event.
2) Simulation results show that a worse penetration into the surviving space is produced for
the coach under the newly proposed NHTSA regulation, which is estimated 2.5 times of the
penetration distance under ECE R66.
3) Localized plastic deformation can be found at beam joints of the coach in the rollover test,
including pillar-roof joints, pillar-waistrail joints, welded joints in rear frame, joints of seats and
seats-wall joints. As can be expected, the more severe loading condition of the proposed
regulation results in the increased size of the developed plastic joints, especially in the regions of
seats-wall joints and pillar-waistrail joints.
80
4) Simulations under ECE R66 and proposed NHTSA regulation show that pillar loops and
roof longitudinal beams absorb the most of energy (70%) at the first impact moment. The
absorbed energy of the pillar loops decreases by 6.4% as the elastic deformation recovers. At the
end of rollover, pillar loops still rank the 1st in energy absorption ratio, while the rear frame,
seats, lower frame, waistrails and roof longitudinal beams also absorb a significant amount of
energy. Results exhibit that NHTSA proposed regulation poses higher requirement on the
rollover resistance of the wall beams and seats-wall joints than the ECE R66, as their energy
absorption ratio at the end of impact increases by 27% due to the coupled passenger mass.
5) The results can be used as the basis for adapting the existing design criteria under ECE R66
test condition to the NHTSA proposed regulation, which poses more stringent requirement on
rollover resistance of the vehicle frame. Vehicle manufacturers could benefit from these results
through the consideration of reinforcing the key joints in the design stage to achieve a sufficient
rollover resistance.

81
4. LOAD TRANSFER ANALYSIS USING INDEX U* OF VEHICLE
STRUCTURE SUBJECTED TO ELASTIC-PLASTIC DEFORMATION
4.1. Review of Theory Preliminaries
As the load transfer index, U* is a non-dimensional value calculated from the strain energy U
[34]. It quantifies the strength of connectivity of each point in the structure with the loading
point. The calculation of U* is shown as the following [34] [35] [36].
(a) (b)
Figure 4-1 Illustration of conventional U* calculation: (a) Three-spring model; (b) Three-spring model
with fixed arbitrary point
Shown in Figure 4-1 (a), a linear elastic body is viewed as a spring system which includes the
loading point A, constrained point B and an arbitrary point C. Point A is loaded with a force 𝐩𝐀
and the corresponding displacement is 𝐝𝐀. The total strain energy U is calculated as:
U = 1
2𝐩𝐀𝐝𝐀 (7)

82
Shown in Figure 4-1 (b), in the load case when a selected arbitrary point C is fixed while the
same forced displacement 𝐝𝐀 is imposed on the loading point A, total strain energy U′ is
calculated as:
U′ = 1
2𝐩𝐀
′ 𝐝𝐀 (8)
where 𝐩𝐀′ is the corresponding force on point A.
The load transfer index U* is defined as:
U∗ = 1 −U
U′ (9)
At the constrained point B, U′ equals to U, and the index U* is 0. At the loading point A, U′
tends to infinity, and the index U* is 1. The rest points in the body have the U* between 0 and 1.
Equation (9) shows that U* represents the strength of connectivity for any point C and loading
point A.
By calculating the U* for each point, the load path can be found as the ridgeline of the U*
contour, as this line connects the most strongly coupled points in the structure sequentially from
the loading point to the constrained point [35]. Shown in Figure 4-2 as an example, calculated by
Equation (9) using the numerical method, the load paths are visualized in a discretized structure
of a plate with a central hole under tensile loading. This example also illustrates that the index
U* allows the load transfer analysis of structures with geometry irregularities, for example holes.

83
Figure 4-2 Illustration of U* contour and load paths of a plate under tensile loading
The physical meaning of the U* index is presented in [35] [36] [40] [43] [45]. In the model of
Figure 4-1, the stiffness constant of each spring within the three-spring model represents the
internal stiffness of the structure (i.e., 𝐊𝐀𝐁, 𝐊𝐀𝐂, and 𝐊𝐁𝐂). The relationship between the loading
and the displacement can be expressed as:
{
𝐩𝐀
𝐩𝐁
𝐩𝐂
} = [
𝐊𝐀𝐀 𝐊𝐀𝐁 𝐊𝐀𝐂
𝐊𝐁𝐀 𝐊𝐁𝐁 𝐊𝐁𝐂
𝐊𝐂𝐀 𝐊𝐂𝐁 𝐊𝐂𝐂
] {
𝐝𝐀
𝐝𝐁
𝐝𝐂
} (10)
where 𝐩𝐢(𝐢=𝐀,𝐁,𝐂) is the force vector at point A,B, and C; 𝐝𝐢(𝐢=𝐀,𝐁,𝐂) is the displacement vector
at point A,B, and C; 𝐊𝐢𝐣 (𝐢=𝐀,𝐁,𝐂;𝐣=𝐀,𝐁,𝐂) represents the internal stiffness tensor between points A,B,
and C.
Shown in Figure 4-1(a), since point B is fixed (𝐝𝐁 = 0), then 𝐩𝐀 can be written as:
𝐩𝐀 = 𝐊𝐀𝐀𝐝𝐀 + 𝐊𝐀𝐂𝐝𝐂 (11)
Shown in Figure 4-1(b), for the case of fixed point C (𝐝𝐁 = 𝐝𝐂 = 0), then 𝐩𝐀′ can be written
as:
𝐩𝐀′ = 𝐊𝐀𝐀𝐝𝐀 (12)

84
Using Equation (7)(8)(11)(12), Equation (9) can be written as:
U∗ = 1 −U
U′ = (1 −2U
(𝐊𝐀𝐂𝐝𝐂)𝐝𝐀)−1 (13)
Equation (13) shows that the U* index is only related to 𝐊𝐀𝐂 instead of 𝐊𝐀𝐁, 𝐊𝐁𝐂 . U* is
effective to express the load path as it is related to the internal stiffness between the loading point
A and the arbitrary point C. The load path is obtained by connecting the loading point with
supporting points along the line which has the smallest gradient of the U* variation, which is
regarded as the stiffest path in the structure [35] [43]. The largest portion of loading is
transferred on this load path.
The load transfer index here can be noted as U1∗. Similarly, by tracing the load transfer index of
the reaction force, the index to be named as U2∗ can be obtained. The index Usum
∗ is defined as:
Usum∗ = U1
∗ + U2∗ (14)
Shown in Figure 4-3, the contour of Usum∗ is plotted on the same plate with Figure 4-2. The
index Usum∗ was introduced in the design of weight-efficient structure [38] [39]. As it represents
the coupling stiffness of each point with both the loading and supporting points [41], the portion
associated with a higher Usum∗ indicates its more efficient load transfer. The index Usum
∗ enables
the evaluation of the load dispersion state, and statistical methods such as histograms can be used
to evaluate the load transfer via the index Usum∗ .

85
Figure 4-3 Illustration of Usum∗ contour of a plate under tensile loading
4.2. Numerical Procedure
As the U* matrix formula of internal stiffness is developed using a linear elastic body, it is not
applicable beyond the elastic domain. Nevertheless, the original concept of U* introduced via the
Equation (9) does not have limitation to its application to the problems involving the material
nonlinearity, considering its physical meaning of expressing the strength of connectivity in a
structure.
In the nonlinear U* analysis, the material is modeled as the elastic-plastic piecewise linear
function with isotropic hardening. When the load exceeds the material elastic limit, the
displacement-force relationship can be modeled by a multilinear curve, where the total strain
energy U equals to the area under the curve.
To perform the nonlinear U* analysis, an in-house program was developed using ANSYS
APDL [65]. The process is shown in Figure 4-4. Under the elastic-plastic deformation, the strain
energy U in the original model is firstly calculated (Figure 4-1(a)). Each node in the model is
fixed sequentially, and the strain energy U′ in the modified system (Figure 4-1(b)) is calculated

86
for each node. U* is calculated using the numerical procedure shown in Figure 4-4 which
implements the Equation (9). Then the obtained contour of U* is plotted.
Figure 4-4 U* calculation flowchart
The demonstration of the application of the nonlinear U* approach is shown in the examples
as following.
4.3. Load Path Calculation for Case of Non-elastic Deformation
4.3.1. First Example
A finite element model of a plate under tensile loading is used to study the influence of plastic
deformation on the load transfer. The plate comprises of two types of material models. Shown in
Figure 4-5, the material of the highlighted strip in the middle has the bilinear isotropic hardening
plasticity, while the rest are linear elastic. All elements are 4-node SHELL181. The material
models have the elastic modulus of 71GPa and Poisson’s ratio 0.33.

87
Figure 4-5 Plate model under tensile loading
Two load cases are considered for the model. Under the first loading, the plate experiences
only the elastic deformation. In the second case of a larger loading, the plastic strain appears in
the middle strip, as shown in Figure 4-6. The index U* is calculated respectively for the two
cases and load paths are obtained accordingly.
Figure 4-6 Contour of plastic strain of the load case of elastic-plastic deformation

88
Presented in Figure 4-7(a), the contour of U* is obtained for the load case of elastic
deformation. The load path is seen to go from the loading end to the fixed end and to distribute
evenly across the width. The diagram of reaction force values of fixed nodes is plotted, and it
also shows that the load transfer is equal along the nodes of the fixed boundary in this load case.
The U* contour and load paths for the load case of elastic-plastic deformation are presented in
Figure 4-7(b). Load paths mainly go through the linear elastic region in the plate. The diagram of
reaction force values of fixed nodes confirms that nodes belonging to the plastic strip transfer
much less load than others.
(a) (b)
Figure 4-7 U* contour plots and load paths of the plate with a plastic strip: (a) load case of elastic
deformation; (b) load case of elastic-plastic deformation.

89
4.3.2. Second Example
A finite element model of the plate with a circular hole in the center shown in Figure 4-8 is
used as another example. The material model has the elastic modulus 71 GPa, Poisson’s ratio
0.33 with the bilinear plasticity. The loading force is applied in the middle of the upper edge, and
3 nodes are fixed on the lower edge. The same ANSYS program is employed for the
computation.
In the same manner, the U* is calculated respectively for two load cases where the plate is
subjected to the elastic deformation and elastic-plastic deformation. In the load case 1, the
structure is still in the domain of elastic deformation. For the load case 2, the plastic strain is
produced at edges of the circular hole and around applied boundaries. The contour of plastic
strain developed by the loading is shown in Figure 4-8.
Figure 4-8 Model of plate with a hole with the contour of plastic strain of load case 2

90
The index U* is calculated for the two load cases and the contours are presented in Figure 4-9
(a) and Figure 4-9 (b) along with the load paths. The diagram of reaction force values of fixed
nodes along the loading direction is also plotted. In the first case, shown in Figure 4-9 (a), the
load paths go from the loading point to the left and right fixed nodes and they are away from the
hole. Reaction force diagram demonstrates that these two fixed nodes transfer most of the
loading, 77.6%. In the second case, shown in Figure 4-9 (b), the load paths have included the
middle fixed node and they also stay away from the hole. Reaction force diagram illustrates that
3 fixed nodes transfer the equal amount of loads.

91
Figure 4-9 Load transfer analysis and stress analysis of the plate with a hole: (a) U* contour plots and
load paths of load case of elastic deformation; (b) U* contour plots and load paths of load case of elastic-
plastic deformation; (c) Principal stress vector of load case of elastic deformation; (d) Principal stress
vector of load case of elastic-plastic deformation
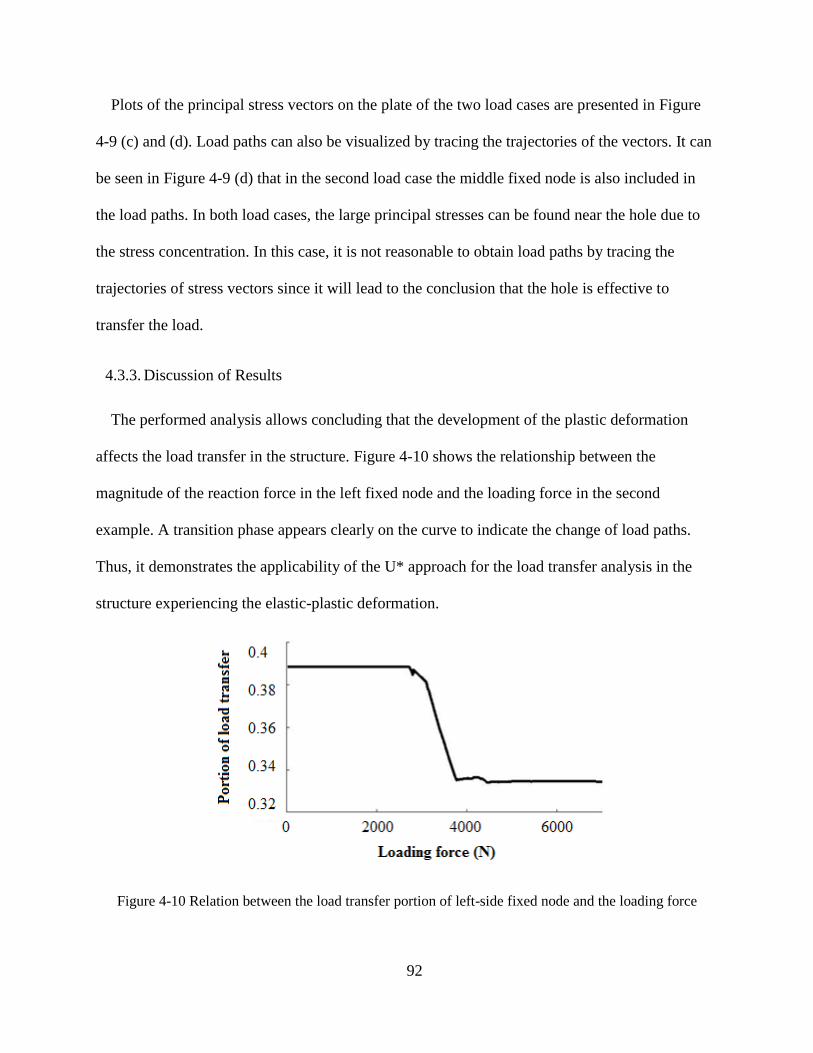
92
Plots of the principal stress vectors on the plate of the two load cases are presented in Figure
4-9 (c) and (d). Load paths can also be visualized by tracing the trajectories of the vectors. It can
be seen in Figure 4-9 (d) that in the second load case the middle fixed node is also included in
the load paths. In both load cases, the large principal stresses can be found near the hole due to
the stress concentration. In this case, it is not reasonable to obtain load paths by tracing the
trajectories of stress vectors since it will lead to the conclusion that the hole is effective to
transfer the load.
4.3.3. Discussion of Results
The performed analysis allows concluding that the development of the plastic deformation
affects the load transfer in the structure. Figure 4-10 shows the relationship between the
magnitude of the reaction force in the left fixed node and the loading force in the second
example. A transition phase appears clearly on the curve to indicate the change of load paths.
Thus, it demonstrates the applicability of the U* approach for the load transfer analysis in the
structure experiencing the elastic-plastic deformation.
Figure 4-10 Relation between the load transfer portion of left-side fixed node and the loading force

93
4.4. Load Transfer Analysis of Pillar Structure
As the pillar joint is one of the key components of the superstructure of coach, its load transfer
analysis is conducted here as an example. The example of the component is shown in Figure
3-19.
A quasi-static bending test on the pillar joint was conducted to validate the coach modeling in
Chapter 3, and the deformation results are shown in Figure 3-21. The bending test result shows
that the pillar fails with the buckling and fractures at the beam connection area. The plastic hinge
is developed at this connection as the load increases. Thus, material nonlinearity must be
considered when analyzing its load transfer capability.
4.4.1. Computational Model
A finite element model for the pillar is built as another example for the application of U* with
material nonlinearity. The material model has Young’s modulus 210 GPa, Poisson’s ratio 0.3 and
the multilinear plasticity. The computation model is assumed to have perfect bonding to connect
the beams so that the results are independent of the welding quality. In this way, the load transfer
performance of the structural design can be studied. The same boundary condition is applied as
in the test, shown in Figure 4-11 (a).
Initially, 4 load cases are chosen, as marked in the structure’s displacement-force curve, shown
in Figure 4-11 (b). By marking elements having the non-zero plastic strain as red, the plastic
region is also shown on the pillar structure. Subjected to the first loading 1 kN the pillar deforms
elastically. With the loading 8 kN, as shown in red, four corners of the connection area enter the
stage of the plastic deformation. As shown in Figure 4-11 (b), 12 kN loading corresponds to the

94
beginning of the transition on the displacement-force curve. The case of 16 kN loading leads to a
larger plastic deformation.
(a) (b)
Figure 4-11 Computational pillar model: (a) Finite element model; (b) D-F curve and load cases
The pillar structure is expected to transfer the load efficiently before it fails. In the case of 16
kN when the pillar undergoes large plastic deformation, the load path would be very different
with the other 3 cases. Other types of nonlinearity will also be prominent. In order to examine
the load transfer efficiency of the pillar as its deformation goes from the elastic to the elastic-
plastic phase, cases of 1 kN, 8 kN and 12 kN are chosen for the U* analysis.
4.4.2. Results and Discussions
The U* contours obtained for 3 load cases are shown in Figure 4-12. The load paths are drawn
and it is shown that the four edges of the horizontal beam transfer the most of the load in all
cases.
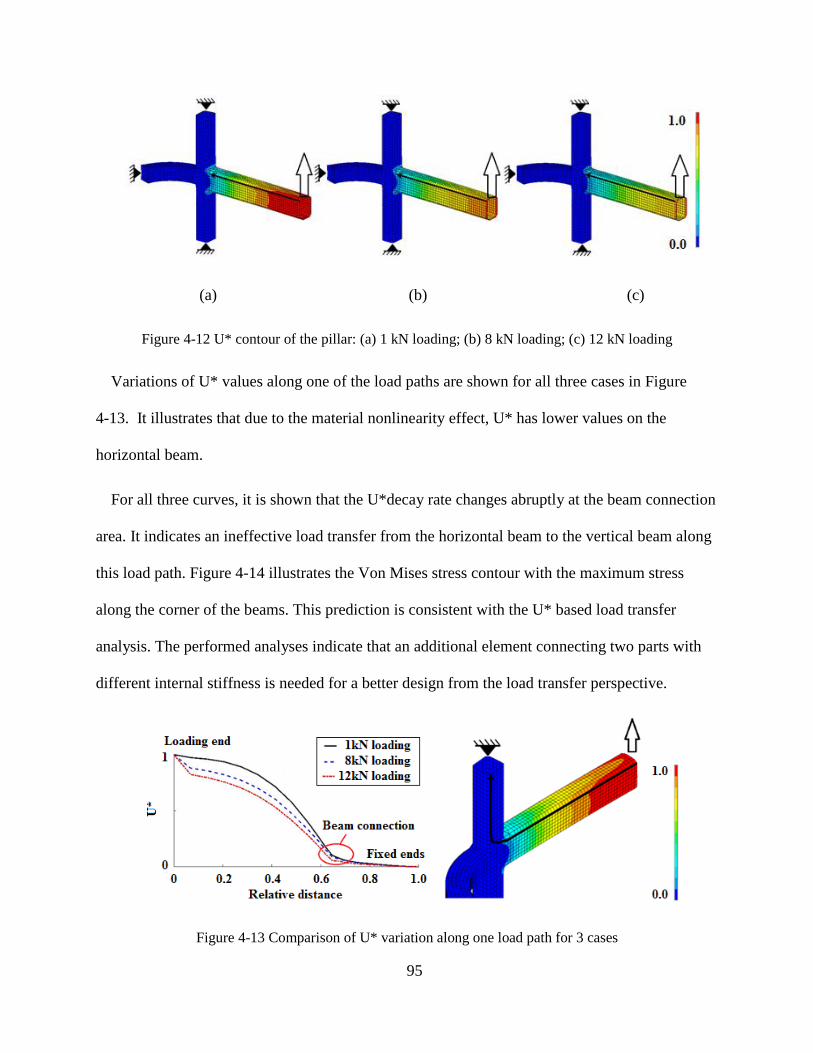
95
(a) (b) (c)
Figure 4-12 U* contour of the pillar: (a) 1 kN loading; (b) 8 kN loading; (c) 12 kN loading
Variations of U* values along one of the load paths are shown for all three cases in Figure
4-13. It illustrates that due to the material nonlinearity effect, U* has lower values on the
horizontal beam.
For all three curves, it is shown that the U*decay rate changes abruptly at the beam connection
area. It indicates an ineffective load transfer from the horizontal beam to the vertical beam along
this load path. Figure 4-14 illustrates the Von Mises stress contour with the maximum stress
along the corner of the beams. This prediction is consistent with the U* based load transfer
analysis. The performed analyses indicate that an additional element connecting two parts with
different internal stiffness is needed for a better design from the load transfer perspective.
Figure 4-13 Comparison of U* variation along one load path for 3 cases

96
Figure 4-14 Von Mises stress contour of 12kN loading
To proceed with the load transfer analysis let’s note the obtained U* here as U1∗. The U*
calculated in the reversed direction (from the 3 fixed ends to the loading end) is labeled as U2∗ .
Usum∗ is obtained by summing up U1
∗ and U2∗ . The Usum
∗ contours for 3 load cases are presented in
Figure 4-15.
As it can be seen on the plane parallel with the shear force, zone with the lower Usum∗ in Figure
4-15 tends to move toward the beam connection area. This indicates the significant reduction of
the local stiffness there making the zone less effective for the load transfer. In this zone, less load
path will pass through.
As shown by the pillar test, the plastic hinge is developed in this location. As the material
enters the plastic deformation stage, it has a smaller contribution to the load bearing, so the
plastic hinge reduces the local stiffness and interferes with the transfer of the load there. The
contour plots of Usum∗ distribution in Figure 4-15 capture the re-distribution of the stiffness thus
providing the results compliant with the test.

97
(a) (b) (c)
Figure 4-15 Usum∗ contour of pillar under 3 load cases: (a) 1 kN loading; (b) 8 kN loading; (c)12 kN
loading
Another observation from Usum∗ contours of the pillar in Figure 4-15 is that side plane always
has lower Usum∗ , thus being less effective to transfer the load. This is reasonable since the side
plane is perpendicular to the loading vector [42]. This obtained result shows that an additional
structural element in parallel with the loading direction could be added at the connection area to
improve the design from the load transfer perspective.

98
4.5. Conclusions
The present study demonstrates that the application of the U* approach in the non-elastic
domain allows to analyze the load transfer in the structure experiencing the elastic-plastic
deformation. Performed analyses show that:
(1) The plastic deformation changes load paths. The two examples of the plate show that the
load path changes as the plastic deformation develops. The result of the extended U* approach
agrees with the observation.
(2) The plastic deformation affects the stiffness distribution of the structure. The example of
the vehicle pillar structure shows the index Usum∗ of the extended approach is effective to express
the load path distribution in a structure experiencing elastic-plastic deformation. This result is
confirmed experimentally because the area associated with the least load transfer efficiency
predicted by Usum∗ is the same location where the plastic deformation develops in the test.
It can be seen that the nonlinear U* approach can be effectively used as the design tool
considering the stiffness distribution for the vehicle crashworthiness. The load transfer
performance of the vehicle structure under impact can be improved, and a uniform deformation
and energy absorption among structure members can be realized.

99
5. CONCLUSIONS AND FUTURE WORK
5.1. Conclusions and Contributions
In this research work, two numerical approaches are presented for the motorcoach rollover
event, i.e., FEA and load transfer analysis using U* approach to evaluate the structural
performance and the passenger safety. The following conclusions and contributions are based on
this thesis work.
1) The studies demonstrate that the methodology of FEM and U* approach can be effectively
used together as tools for solving the problem of vehicle crashworthiness in a rollover event.
They are effective in assisting vehicle designers to predict and assess the vehicle structural
performance for the compliance to the new regulations in the crash event.
2) In the thesis work, the full coach FE model is modified based on the original Eicher model
and validated based on results of a complete vehicle rollover test under ECE R66 conditions and
quasi-static component test for a representative member of the vehicle frame. Comparative
analyses of rollover resistance and energy absorption distribution features of the coach frame are
conducted under the test conditions of both ECE R66 and the NHTSA proposed regulation.
Energy absorption ratios among vehicle structural members are presented, and key connections
that contribute to the energy absorptions are compared. Results in this study can provide
guidance for structural modifications to improve the passenger safety under rollover events.
3) The FEA simulation results can be used as the basis for adapting the existing design criteria
under ECE R66 test condition to the NHTSA proposed regulation, which poses more stringent
requirement on rollover resistance of the vehicle frame. Vehicle manufacturers could benefit

100
from these results through the consideration of reinforcing the key joints in the design stage to
achieve a sufficient rollover resistance.
4) The load transfer analysis approach studies demonstrate that the U* concept allows to
analyze the load transfer in the structure experiencing the elastic-plastic deformation, which is
very important for vehicle in crashworthiness problems. Using the U* concept, effects of the
material nonlinearity on the load path and the stiffness distribution were analyzed for the
representative vehicle component.
5.2. Limitations of This Analysis
The correlation of the full coach model with the NHTSA complete vehicle test is limited by
the availability of data of the weight distribution of the coach, the material properties and the
component test for all key joints. Due to the time and cost restraints, conducting material tests for
all frame beams and component tests for all pillar connections were not feasible.
Based on the available data, however, from the model validation results, it can still be
concluded that the full coach model is close to the tested vehicle to a satisfactory extent and the
results made are therefore valuable.
5.3. Future Work
The following are recommendations for future work based on this study.
A. The thesis work presents a large scale complete coach rollover model. Work that can
improve the quality of model validation and structural performance evaluation include:
1). The validation in the component level can be improved in by refining the mesh of pillar
joint model and introducing the material failure criteria.

101
2). The model validation of rollover deformation with the NHTSA test can be improved by
tuning the center of gravity position if data from tilt table test of the tested coach are available.
3). Since the engine has a considerably large mass and it is mounted on the frame using
springs and dampers, the deformation of the rear end of the coach is influenced by the inertial
force of the engine in the rollover. The mass distribution of the coach can be more accurate by
modeling them instead of lumped mass point.
B. The study uses the index U* method to conduct the load transfer analysis on a
representative component of the coach. The results allow us to infer that plastic hinges developed
on the coach frame in the impact event will change the load path, and they lead to the large
deformation and penetration of the surviving space. Engineers are eager to know how impact
loads are transferred in the coach superstructure and whether this dynamic load path is the same
with the one under a static load.
Thus, it is promising to further explore the application of U* for vehicle crashworthiness
problems involving the stiffness distribution, especially for the rollover application. Some future
works include:
1). Load transfer analysis using U* method can be applied to a representative bay section of
the coach. How the impact load is transferred can be studied efficiently using this simple model
which doesn’t demand very high computational resources.
2). The applicability and limitations of index U* method can be discussed by results
comparison between the U* method and the explicit nonlinear finite element method through
tracking the force amplitude in the coach frame in LS-DYNA.

102

103
References
[1] Natioanl Highway Traffic Safety Administration, "2014 Motor Vehicle Crashes:
Overview," U.S. Department of Trasnportation, Washington, D.C., 2016.
[2] Transport Canada, "Canadian Motor Vehicle Traffic Collision Statistics 2015,"
Goverment of Canada, Ottawa, 2017.
[3] Department of Transportation, "Motorcoach safety action plan 2012 update," U.S.
Department of Transportation, Washington, D.C., 2012.
[4] RONA kinetics and Associates Ltd, "Evaluation of Occupant Protection in Buses,"
Transport Canada, North Vancouver, BC, 2002.
[5] S. Abrate, "Impact engineering of composite structures," vol. 526, Springer Science &
Business Media, 2011, pp. 193-260.
[6] C.-C. Liang and G.-N. Le, "Bus rollover crashworthiness under European standard: an
optimal analysis of superstructure strength using successive response surface method,"
International Journal of Crashworthiness, vol. 14, no. 6, pp. 623-639, 2009.
[7] JASIC, ECE, "Regulation No. 66 01-Strength of Superstructure," Economic Commission
for Europe, 2006.
[8] C. Bojanowski, "Verification, validation and optimization of finite element model of bus
structure for rollover test," THE FLORIDA STATE UNIVERSITY, Tallahassee, Florida,
2009.

104
[9] S. Hashemi, A. Walton and K. Kayvantash, "Strength of Super-Structure UN-ECE R66
Rollover Approval of Coaches based on Thin-Walled Framework Structures," International
Journal of Vehicle Structures & Systems (IJVSS), vol. 1, no. 4, pp. 78-84, 2009.
[10] J. Anderson and M. Sadeghi, "Influence of passengers during coach rollover," in 18th
International Technical Conference on the Enhanced Safety of Vehicles, Nagoya, Japan,
2003.
[11] L. Martínez, F. Aparicio, A. García, J. Páez and G. Ferichola, "Improving occupant safety
in coach rollover," International journal of crashworthiness, vol. 8, no. 2, pp. 121-132,
2003.
[12] M. Guler, K. Elitok, B. Bayram and U. Stelzmann, "The influence of seat structure and
passenger weight on the rollover crashworthiness of an intercity coach," International
journal of crashworthiness, vol. 12, no. 6, pp. 567-580, 2007.
[13] M. Matolcsy, "Body section rollover test as an approval method for required strength of
bus superstructures," Automotive and Transportation Technology Congress and Exposition
2001 Proceedings, 2001 SAE Technical Paper 2001-01-3209.
[14] R. P. Sergeevich and O. L. Nikolaevich, "Verification of computer simulation results of
bus body section rollover," Journal of Traffic and Transportation Engineering, vol. 3, pp.
118-127, 2015.
[15] C.-C. Liang and G.-N. Le, "Analysis of bus rollover protection under legislated standards
using LS-DYNA software simulation techniques," International Journal of Automotive
Technology, vol. 11, no. 4, pp. 495-506, 2010.

105
[16] National Highway Traffic Safety Administration, "Notice of proposed rulemaking
(NPRM)," Department of Transportation Vol.79, No.151, Washington, D.C., 2014.
[17] M. Matolcsy, "Unusual statistics about rollover accident of buses," in 85th GRSG
Working Party on General Safety Provisions, 2003.
[18] L. Kwasniewski, H. Li, R. Nimbalkar and J. Wekezer, "Crashworthiness assessment of a
paratransit bus," International Journal of Impact Engineering, vol. 32, no. 5, pp. 883-888,
2006.
[19] M. Sadeghi and G. Tidbury, "Bus roll over accident simulation," in 3rd International
Conference on Vehicle Structural Mechanics, 1979 SAE Technical Paper No. 790994.
[20] A. Subic and J. He, "Improving bus rollover design through modal analysis,"
International journal of crashworthiness, vol. 2, no. 2, pp. 139-152, 1997.
[21] S. R. Wu and J. Chen, "Advanced development of explicit FEA in automotive
applications," Computer Methods in Applied Mechanics and Engineering, vol. 149, no. 1-4,
pp. 189-199, 1997.
[22] J. Thacker, S. Reagan, J. Pellettiere, W. Pilkey, J. Crandall and E. Sieveka, "Experiences
during development of a dynamic crash response automobile model," Finite Elements in
Analysis and Design, vol. 30, no. 4, pp. 279-295, 1998.
[23] D. Marzougui, M. Zink, A. Zaouk, C. Kan and N. Bedewi, "Development and validation
of a vehicle suspension finite element model for use in crash simulations," International
Journal of Crashworthiness, vol. 9, no. 6, pp. 565-576, 2004.

106
[24] E. Chirwa, H. Li and Q. Peng, "Modelling a 32-seat bus and virtual testing for R66
compliance," International journal of crashworthiness, vol. 20, no. 2, pp. 200-209, 2015.
[25] J. Hutchinson, K. Friedman and D. Mihora, "Finite element modeling comparisons of
rollover test devices," in SAE 2011 World Congress & Exhibition, 2011 SAE Technical
Paper No. 2011-01-0011.
[26] T. Roca, J. Arbiol and S. Ruiz, "Development of rollover-resistant bus structures," in
Automotive Concurrent/Simultaneous Engineering-SP-1233, 1997 SAE Technical Paper
970581.
[27] N. Indera, R. Zain, S. Mihradi and K. Soe Oo, "Computer modelling of energy absorbing
capability of bus superstructure for rollover safety," Journal of KONES, vol. 18, pp. 331-
338, 2011.
[28] D. Kelly and M. Elsley, "A procedure for determining load paths in elastic continua,"
Engineering Computations, vol. 12, no. 5, pp. 415-424, 1995.
[29] D. Kelly and M. Tosh, "Interpreting load paths and stress trajectories in elasticity,"
Engineering Computations, vol. 17, no. 2, pp. 117-135, 2000.
[30] D. Kelly, P. Hsu and M. Asudullah, "Load paths and load flow in finite element analysis,"
Engineering Computations, vol. 18, no. 1/2, pp. 304-313, 2001.
[31] H. Harasaki and J. Arora, "New concepts of transferred and potential transferred forces in
structures," Computer methods in applied mechanics and engineering, vol. 191, no. 3, pp.
395-406, 2001.

107
[32] K. Marhadi and S. Venkataraman, "Comparison of Quantitative and Qualitative
Information Provided by Different Structural Load Path Definitions," International Journal
for Simulation and Multidisciplinary Design Optimization, vol. 3, no. 3, pp. 384-400, 2009.
[33] M. Shinobu, D. Okamoto, S. Ito, H. Kawakami and K. Takahashi, "Transferred Load and
Its Course in Passenger Car Bodies," JSAE Review, vol. 16, no. 2, pp. 145-150, 1995.
[34] H. Hoshino, T. Sakurai and K. Takahashi, "Vibration Reduction in The Cabin of Heavy-
Duty Truck Using The Theory of Load Transfer Paths," JSAE Review, vol. 24, no. 2, pp.
165-171, 2003.
[35] K. Takahashi and T. Sakurai, "Expression of load transfer paths in structures,"
Transactions of the Japan Society of Mechanical Engineers, Series A, vol. 71, no. 708, pp.
1097-1102, 2005.
[36] T. Sakurai, K. Takahashi, H. Kawakami and M. Abe, "Reduction of Calculation Time for
Load Path U* Analysis of Structures," Journal of Solid Mechanics and Materials
Engineering, vol. 1, no. 11, pp. 1322-1330, 2007.
[37] K. Pejhan, Q. Wang, C. Wu and I. Telichev, "Experimental Validation of U* index
Theory for Load Transfer Analysis," International Journal of Heavy Vehicle Systems, vol.
24, no. 3, pp. 288-304, 2017.
[38] H. Koboyashi, T. Naito and Y. Urushiyama, "Study on Similarity of Load Path
Distribution in Body Structure," Honda R&D Technical Review, vol. 23, no. 1, pp. 80-89,
2011.

108
[39] T. Naito, H. Kobayashi, Y. Urushiyama and K. Takahashi, "Introduction of new concept
U* sum for evaluation of weight-efficient structure," SAE International Journal of
Passenger Cars-Electronic and Electrical Systems, vol. 12, no. 4(2011-01-0061), pp. 30-41,
2011.
[40] K. Pejhan, C. Wu and I. Telichev, "Comparison of load transfer index (U*) with
conventional stress analysis in vehicle structure design evaluation," International Journal of
Vehicle Design, vol. 68, no. 4, pp. 285-303, 2015.
[41] Q. Wang, K. Pejhan, I. Telichev and C. Wu, "Demonstration of the effectiveness of U*-
based design criteria on vehicle structural design," Proceedings of the Institution of
Mechanical Engineers, Part D: Journal of Automobile Engineering, 2017 Sep
19:0954407017724635.
[42] N. Tadashi, H. Kobayashi and Y. Urushiyama, "Application of load path index U* for
evaluation of sheet steel joint with spot welds," in SAE 2012 World Congress & Exhibition,
2012 SAE Technical Paper No. 2012-01-0534.
[43] E. Wang, Y. Yoshikuni, Q. Guo, T. Nohara, H. Ishii, H. Hoshino and K. Takahashi,
"Load Transfer in Truck Cab Structures under Initial Phase of Frontal Collision,"
International Journal of Vehicle Structures & Systems, vol. 2, no. 2, pp. 60-68, 2010.
[44] S. Akima, M. Omiya and K. Takahashi, "Load Transfer of Passenger Car Compartment
for Improvement of Structural Performance in Side Impact," in 24th International Technical
Conference on the Enhanced Safety of Vehicles (ESV), 2015.
[45] T. Sakurai, M. Tada, H. Ishii, T. Nohara, H. Hoshino and K. Takahashi, "Load path U*

109
Analysis of structures under multiple loading conditions," Nippon Kikai Gakkai Ronbunshu
A Hen(Transactions of the Japan Society of Mechanical Engineers Part A)(Japan), vol. 19,
no. 2, pp. 195-200, 2007.
[46] Q. Wang, K. Pejhan, I. Telichev and C. Wu, "Extensions of the U* theory for applications
on orthotropic composites and nonlinear elastic materials," International Journal of
Mechanics and Materials in Design, vol. 13, no. 3, pp. 469-480, 2017.
[47] ANSYS, Inc., "ANSYS Explicit Dynamics, Release 17.0," [Online]. Available:
https://www.sharcnet.ca/Software/Ansys/17.0/en-us/help/exd_ag/exd_ag_overview.html.
[Accessed 15 Jan 2017].
[48] MSC SOFTWARE, "Dytran 2010 Theory Manual," MSC.Software Corporation, Newport
Beach, California, 2010.
[49] Livermore Software Technology Corporation, "LS-DYNA Support -What are the
differences between implicit and explicit?," [Online]. Available:
http://www.dynasupport.com/faq/general/what-are-the-differences-between-implicit-and-
explicit.. [Accessed 07 March 2018].
[50] L. Zhu, "Study on Automobile Structural Passive safety Using MSC.Dytran Software,"
Zhejiang University, Hangzhou, China, 2004.
[51] J. O. Hallquist, "LS-DYNA keyword user’s manual," Livermore Software Technology
Corporation 970, Livermore, California, 2007.
[52] P. S. Deshmukh, "Rollover and roof crush analysis of low-floor mass transit bus,"

110
Wichita State University, Wichita, Kansas, 2006.
[53] B. D. Gepner, "Rollover procedures for crashworthiness assessment of paratransit bus
structures," Florida State University, Tallahassee, Florida, 2014.
[54] K.-T. Kang, H.-J. Chun, J.-C. Park, W.-J. Na, H.-T. Hong and I.-H. Hwang, "Design of a
composite roll bar for the improvement of bus rollover crashworthiness," Composites Part
B: Engineering, vol. 43, no. 4, pp. 1705-1713, 2012.
[55] Livermore Software Technology Corporation, "LS-PrePost Online Documentation,"
[Online]. Available: http://www.lstc.com/lspp/. [Accessed 07 March 2018].
[56] S. Golinskikh and R. Iyer, "J Coach Parcel Rack Analysis (Bus Front Impact and
Rollover) Report," Eicher Engineering Solutions, Inc, Michigan, 2014.
[57] L. Kotyk and H. Chorney, "Tilt Table Static Rollover Test for Determining the Center of
Gravity Height Location on a Production J4500 Coach," Westest, Portage la Prairie, MB,
2016.
[58] J. O. Hallquist, "LS-DYNA Theory Manual," Livermore Software Technology
Corporation, Livermore, California, 2006.
[59] L. Zhu, "Development of guidelines for deformable and rigid switch in LS-Dyna
simulation," Mechanical (and Materials) Engineering-- Dissertations, Theses, and Student
Research, vol. 3, 2009.
[60] W. Zhou, A. Kuznetcov, I. Telichev and C. Wu, "Deformable-rigid switch in
computational simulation of bus rollover test," in Proceedings: 24th International Congress

111
of Theoretical and Applied Mechanics, Montreal, QC, 2016.
[61] K. Pejhan, A. Kuznetcov, Q. Wang, C. Wu and I. Telichev, "Design assessment of a
multiple passenger vehicle component using load transfer index (U*) method,"
International Journal of Mechanics and Materials in Design, pp. 1-17 DOI:
10.1007/s10999-017-9372-7, 2017.
[62] MGA Research Corporation, "Final Report of ECE Regulation 66 Based Research Test of
Motorcoach Roof Strength 2000 MCI 102-EL3 Series Motorcoach NHTSA NO.: MY0800,"
DEPARTMENT OF TRANSPORTATION, Cambridge, MA, 2009.
[63] M. Ray, C. Plaxico and M. Anghileri, "Procedures for Verification and Validation of
Computer Simulations Used for Roadside Safety Applications," Washington, DC, 2010.
[64] M. H. Ray and M. Mongiardini, "Roadside Safety Verification and Validation Program
(RSVVP)," Worcester Polytechnic Institute, Worcester, Massachusetts, 2008.
[65] ANSYS® Academic Research, Release 15.0, "ANSYS Mechanical APDL Theory
Reference," ANSYS, Inc., Canonsburg, Pennsylvania, 2013.

112

113
Appendix A Experimental Data of Frame Material Tensile Test
The raw data from the material tensile test include the strain and the load. Thus, stresses are
calculated using the measured load divided by the cross section area of the sample. The stress-
strain data here is known as the engineering strain and stress.
Using the following equations, the true strain and stress are calculated.
εTRUE = ln (1 + εENG) (15)
σTRUE = σENG ∗ eεTRUE = σENG ∗ (1 + εTRUE) (16)
where εTRUE, σTRUE are true strain and stress, and εENG, σENG are engineering strain and stress.
The LS-DYNA plasticity model needs the effective plastic strain, and it is the residual true
strains after unloading elastically. Thus, the effective plastic strain is calculated using the
formula:
εeff plastic = εTRUE − σTRUE E⁄ (17)
where E is Young’s modulus.
The stress and strain data and the calculated results are presented in Table A-1 and Figure A-1.

114
Table A-1 Stress and strain data of frame material tensile test
Figure A-1 Different stress and strain curves from material test