computational fluid dynamics (cfd) simulation of … fluid dynamics (cfd) simulation of solar dryers...
TRANSCRIPT
Computational Fluid Dynamics (CFD) Simulation of Solar Dryers
Achint Sanghi, Dr. R.P. Kingsly AmbroseDepartment of Agricultural and Biological Engineering, Purdue University

Introduction
2
Postharvest losses in developing countries
• Losses in the cereal grain postharvest chain
Quantity: 10-23% weight loss1 in sub Saharan Africa
Quality: More than 1/3rd of samples tested with aflatoxin above regulatory limit during a 3-year study in Kenya2
• Open-air sun drying could be one contributing factor
1African Postharvest Losses Information System (2012)2Daniel et al (2007) Comprehensive assessment of maize aflatoxin levels in Eastern Kenya 2005-2007
Traditional drying in Ghana (Picture courtesy Dr. Klein Ileleji)

Introduction
3
Postharvest losses in developing countries
• Mechanical dryers still not feasible
23% of the population in developing countries lack access to electricity1
Gas and biofuel-fired dryers operating costs are around 500 to 1000x than sun drying2
1World Energy Outlook, International Energy Agency (2012)2Boroze et al (2014) Inventory and comparative characteristics of dryers used in the sub-Saharan zone: Criteria influencing dryer choice

Introduction
4
1Kumar et al (2016) Progress in solar dryers for drying various commodities2Boroze et al (2014) Inventory and comparative characteristics of dryers used in the sub-
Saharan zone: Criteria influencing dryer choiceEkechukwu and Norton (1997) Review of solar-energy drying systems II
• Solar dryers- variety of designs developed in last 40 years1
• Limited adoption when compared to traditional sun drying2
• Most dryers developed for particular crop/location/throughput

5
Objectives
• Develop and validate a mathematical grain drying model for a low-capacity solar dryer.
• Develop and validate mathematical grain drying models for high-capacity natural and forced convection solar dryers.

Materials and Methods
6
Computational Fluid Dynamics
• Allows for 3D simulation of fluid flow problems
• Solution of equations of mass, momentum, and energy:
) 0 (Mass Transfer)
+ ∙ =- p g (Momentum Transfer)
∙ ∙ T - density of air– air velocity
p – pressureSm- momentum source terms– energy source terms (radiation
and drying energy)
E – internal energyh – enthalpyk – thermal conductivityJj – moles of species j

7
Model Key Features
• Thin layer dying equation (constants are crop-dependent)
• Moisture migration
• ‘Greenhouse effect’
• Direct and diffuse radiation (cloud cover)

Materials and Methods
8
Solar bubble dryer
Cabinet dryer Greenhouse dryer
Solar bubble dryer
Natural Convection
Naturalconvection
Forced Convection
45 kg 4000kg 1000 kg
Mixed-mode Direct Direct
Small farm Cooperative Small farm
Greenhouse dryerCabinet dryer

Materials and Methods
9
Experimental validation
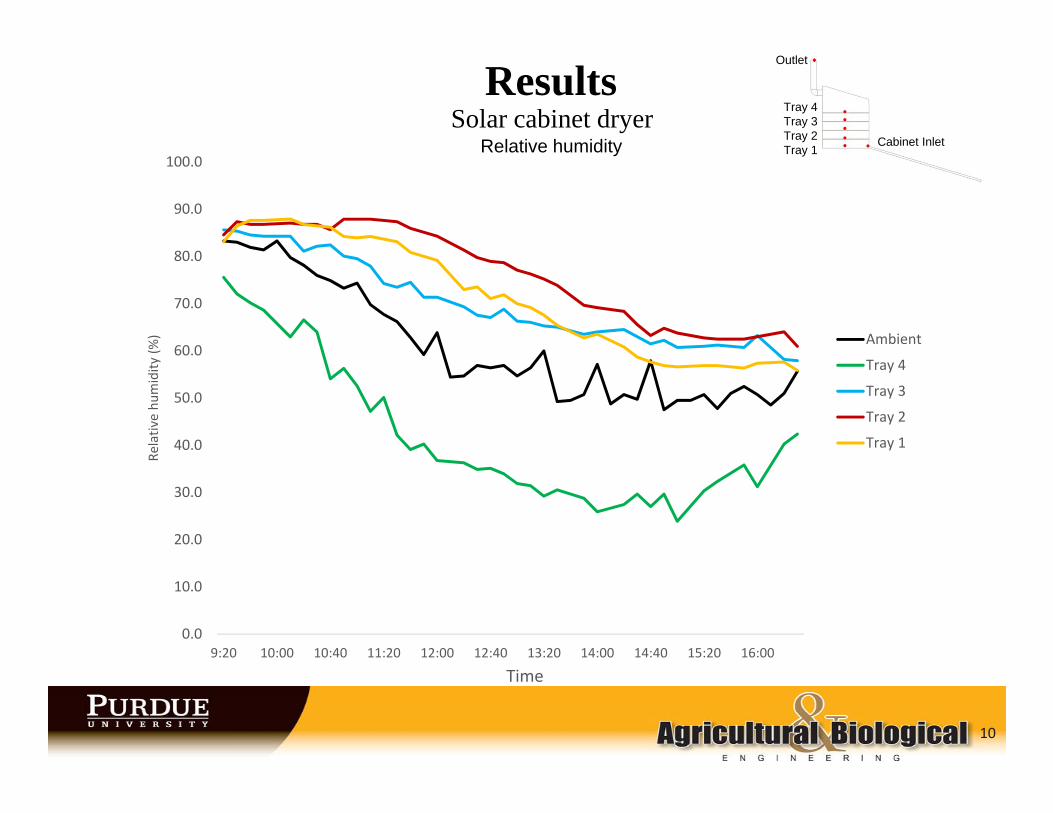
Solar cabinet dryerResults
10
Tray 4Tray 3Tray 2Tray 1
Cabinet Inlet
Outlet
0.0
10.0
20.0
30.0
40.0
50.0
60.0
70.0
80.0
90.0
100.0
9:20 10:00 10:40 11:20 12:00 12:40 13:20 14:00 14:40 15:20 16:00
Relativ
e hu
midity
(%)
Time
Ambient
Tray 4
Tray 3
Tray 2
Tray 1
Relative humidity

Results
11
Tray 4Tray 3Tray 2Tray 1
Cabinet Inlet
Outlet
0
200
400
600
800
1000
1200
1400
1600
0.0
10.0
20.0
30.0
40.0
50.0
60.0
70.0
9:20 10:00 10:40 11:20 12:00 12:40 13:20 14:00 14:40 15:20 16:00
Solar radiation (W/m
2)
Tempe
rature (°C)
Time
Ambient
Tray 4
Tray 3
Tray 2
Tray 1
Solar radiation
Temperature
Solar cabinet dryer

Solar cabinet dryerResults
12
Relative humidity at 9:20 AM Temperature at 9:20 AM
Average deviation 8.4% from experiment Average deviation of 6.9% from experiment
Tray 4Tray 3Tray 2Tray 1
Cabinet Inlet
Outlet
0.00
0.10
0.20
0.30
0.40
0.50
0.60
0.70
0.80
0.90
1.00
Tray 1 Tray 2 Tray 3 Tray 4 CabinetInlet
Outlet
RH(decim
al)
0.00
5.00
10.00
15.00
20.00
25.00
30.00
35.00
40.00
Tray 1 Tray 2 Tray 3 Tray 4 CabinetInlet
Outlet
Tempe
rature (°C)

Solar cabinet dryerResults
13
Relative humidity at 9:20 AM Temperature at 9:20 AM

Solar cabinet dryerResults
14
Velocity profile in cabinet at 9:20 AM

Greenhouse dryerResults
15
20.0
25.0
30.0
35.0
40.0
45.0
50.0
55.0
60.0
9:00 9:30 10:00 10:30 11:00 11:30 12:00 12:30 13:00 13:30 14:00
Tempe
rature (°C)
TimeLayer 4 Layer 3 Layer 2 Layer 1 Ambient
Temperature profile at 9:00 AM
Comparison of simulation and experiment
Temperature profile throughout the day

Conclusions• The cabinet dryer model can predict the temperature and
relative humidity to within 7% and 8.5% respectively• The models are able to account for the effect of heating and
moisture loss due to solar radiation, as well as the natural convection heat transfer
• The models can be used to understand the performance of the dryers with different loading and weather conditions
Ongoing work• Simulation of the solar bubble dryer• Full-day-length simulations
16
Acknowledgements
• USAID Borlaug Fellows program • Dr. Sam McNeill, University of Kentucky• Dr. Paul Armstrong, USDA-ARS-CGAHR• Isaac Addo, KNUST, Kumasi, Ghana
17
Thank You!