computational genomic design of ni & co alloys€¦ · computational genomic design of ni &...
TRANSCRIPT

Computational Genomic Design
of Ni & Co Alloys
Jiadong Gong, Ph.D.
Senior Engineer
QuesTek Innovations LLC
SRG
March 24, 2017

p. 2
Jiadong Gong
SRG 2017
QuesTek’s ICME approach
• Systems-based design approach utilizing computational tools to model key
process-structure and structure-property linkages
• Replacing the legacy trial-and-error approaches with parametric materials design
Faster, cheaper, targeted material performance
Modeling at all length-scales relevant to
materials design and processing
Treat material as a system, linking process-
structure-properties to meet defined
performance goals

p. 3
Jiadong Gong
SRG 2017
SX Ni Superalloy for industrial gas turbines
• DOE SBIR Phase I, Phase II, and Phase IIA award
• SX castings – High Temperature Performance– Desirable for better creep resistance – no grain boundaries
• IGT blade castings are large > 8 inches– Slower solidification / cooling rates exacerbate processing issues
• Primary casting (processing) constraints:– Freckle formation
– High angle boundaries (HAB) and low-angle boundaries (LAB)
– Hot-tearing
– Shrinkage porosity
• 3rd generation blade alloys are especially difficult to cast
as SX due to their high refractory content– Increased tendency for hot tearing
– Increased tendency for freckle formation
QuesTek’s approach: ICME-based design of a new processable, high-performance single
crystal alloy for IGT applications

p. 4
Jiadong Gong
SRG 2017
List of benchmark alloys – SX performance
ID Re Al Co Cr Hf Mo Ta Ti W other
PWA1480 - 5 5 10 - - 12 1.5 4
PWA1483 - 3.6 9 12.2 - 1.9 5 4.1 3.8 0.07C
GTD444 - 4.2 7.5 9.8 0.15 1.5 4.8 3.5 6 0.08C
CMSX7 - 5.7 10 6 0.2 0.6 9 0.8 9
CMSX8 1.5 5.7 10 5.4 0.2 0.6 8 0.7 8
PWA1484 3 5.6 10 5 0.1 2 9 - 6
CMSX4 3 5.6 9 6.5 0.1 0.6 6.5 1 6
Rene N5 3 6.2 7.5 7 0.15 1.5 6.5 - 5 0.01Y
CMSX10 6 5.7 3 2 0.03 0.4 8 0.2 5 0.1Nb
TMS238 6.4 5.9 6.5 4.6 0.1 1.1 7.6 - 4 5.0Ru
QuesTek’s Phase I design (“QT-SX”) contained these
same elemental constituents, but with 1% Re
Re-free
alloys
Recently-
developed
2nd Gen alloys
High-Re alloys

p. 5
Jiadong Gong
SRG 2017
Systems design chart for SX castings

p. 6
Jiadong Gong
SRG 2017
Modeling of liquid density during solidification
7.615
7.620
7.625
7.630
7.635
7.640
7.645
7.650
1,320 1,330 1,340 1,350 1,360 1,370 1,380 1,390 1,400 1,410 1,420
ReneN5 Liquid density vs. T
40%
20%
liquid
den
sity
, g/c
m3
Temperature, °C
liquidus
Actual modeling
output is a
combined use of
various databases
and software
Freckle-resistance is related to the modeling of the liquid density during
solidification base on a critical Rayleigh number:

p. 7
Jiadong Gong
SRG 2017
Modeling freckling behavior in N5 and QT-SX castings
Target this range (>B, <A)

p. 8
Jiadong Gong
SRG 2017
QTSX (1% Re)
CMSX8 (1.5% Re)
Thermodynamic and kinetics calculations on key
properties
• phase fraction, key temperatures
• coarsening rate

p. 9
Jiadong Gong
SRG 2017
0
0.005
0.01
0.015
0.02
0.025
0.03
Liquid density difference at 20% solidification
1%
Re
0.00E+00
2.00E-20
4.00E-20
6.00E-20
8.00E-20
1.00E-19
1.20E-19
1.40E-19
Coarsening Rate Constant for different alloys
Coarsening rate and liquid density difference
comparisons (lower is better)
Comparable coarsening rate
to CMSX-8 (1.5% Re) alloy
Reduced buoyancy
differences (less than
non-Re CMSX-7)
0%
Re
0%
Re
0%
Re
0%
Re
3%
Re
3%
Re
3%
Re
3%
Re
1.5%
Re
1.5%
Re
3%
Re
3%
Re
0%
Re
0%
Re
0%
Re
0%
Re
1%
Re

p. 10
Jiadong Gong
SRG 2017
2nd round of casting results
Rene N5
QTSX
QTSX
Solidification Rate
Rene N5Mold Geometry

p. 11
Jiadong Gong
SRG 2017
2nd round of casting results

p. 12
Jiadong Gong
SRG 2017
Microstructure after double-step aging
Characterization and microstructure analysis confirm the achievement of the design goal of γ’ phase fraction and lattice misf it
(no evidence of TCP phases were found during all heat treatments)
room temperature
lattice misfit
validated at -0.1%
p. 13
Jiadong Gong
SRG 2017
γ'
γ
γ'
γ'γ'
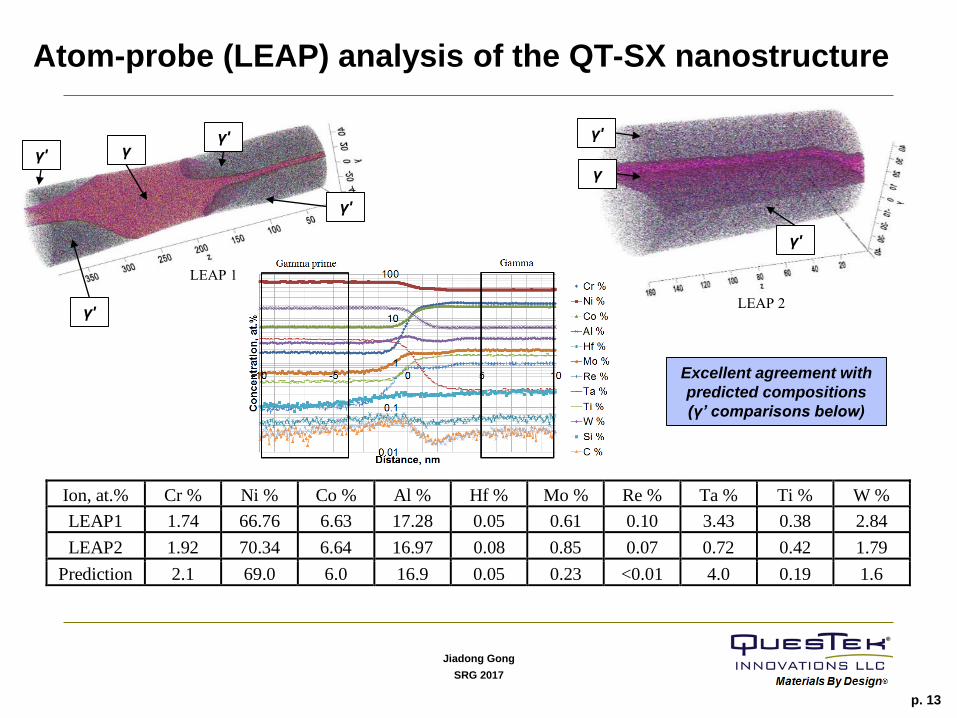
Atom-probe (LEAP) analysis of the QT-SX nanostructure
Ion, at.% Cr % Ni % Co % Al % Hf % Mo % Re % Ta % Ti % W %
LEAP1 1.74 66.76 6.63 17.28 0.05 0.61 0.10 3.43 0.38 2.84
LEAP2 1.92 70.34 6.64 16.97 0.08 0.85 0.07 0.72 0.42 1.79
Prediction 2.1 69.0 6.0 16.9 0.05 0.23 <0.01 4.0 0.19 1.6
γ'
γ
γ'
Excellent agreement with
predicted compositions
(γ’ comparisons below)
LEAP 1
LEAP 2

p. 14
Jiadong Gong
SRG 2017
Temperature Stress Approx Life LMP (C=20)
C F Mpa Ksi hr
850 1562 461 66.9 1000 25.8
850 1562 375 54.3 4500 26.6
950 1742 205 29.7 1000 28.1
950 1742 160 23.2 4500 28.9
950 1742 160 23.2 4500 28.9
1050 1922 124 18.0 300
1050 1922 115 16.7 1000 30.4
1050 1922 90 13.1 4500 31.3
TemperatureR Ratio
Strain
RangeC F
750 1382 -1 1.8
750 1382 -1 1.5
750 1382 -1 1.5
750 1382 -1 1.3
750 1382 -1 1.3
950 1742 -1 1.5
950 1742 -1 1
950 1742 -1 0.9
950 1742 -1 0.9
950 1742 -1 0.75
950 1742 -1 0.65
LCF
Stress Rupture (*Creep)Temperature
C F
22 71.6
22 71.6
600 1112
760 1400
800 1562
900 1652
1000 1832
1100 2012
1200 2192
Tensile
Density
Thermal Diffusivity (22 – 1200C)
Thermal Conductivity (22 – 1200C)
Specific Heat (22 – 1200C)
CTE (22 – 1200C)
Elastic Modulus
Shear Modulus
Poisson’s Ratio
Physical PropertiesSulfidation Testing
• Burner rig testing at
Cranfield.
• QTSX vs. Rene N5
• Preparing samples and
awaiting SOW from
Siemens to start testing
Oxidation Testing
• Small cubes exposed to air
at elevated temperature
(1000 and 1150C)
• Small cubes exposed to air
in cyclic environment at
Siemens
Initial property data development plan

p. 15
Jiadong Gong
SRG 2017
Testing results – physical properties
Property Result Secondary Data
Density 0.316 lb/in3 8.735 g/cm3
0.320 lb/in3 8.861 g/cm3
0.321 lb/in3 8.890 g/cm3
0.320 lb/in3 8.845 g/cm3
Poisson’s Ratio 0.3804 18.58 Msi 128.1 GPa
0.3556 18.86 Msi 130.0 GPa
Young’s Modulus 18.8 Msi 129.6 GPa
19.1 Msi 131.7 GPa
Shear Modulus 19.27 Msi 132.9 GPa
18.75 Msi 129.3 GPa

p. 16
Jiadong Gong
SRG 2017
Testing results – fatigue
• Still in-progress:
– 1382°F
• Strain range:
– 1.3, 1.3, 1.5
– 1742°F
• Strain range:
– 0.65, 0.75, 1.5

p. 17
Jiadong Gong
SRG 2017
Stress rupture test results (ASTM E139)
Comparison to Select Incumbent SX alloys*
*Baseline data taken from respective patent filings, literature
1%
Re
3%
Re
1.5%
Re
3%
Re
3%
Re
0%
Re
0%
Re
QTSX: Temperatures evaluated from 870
to 1150°C with times up to 1700 hrs

p. 18
Jiadong Gong
SRG 2017
Commercialization
• QTSX license discussions ongoing with OEM
• QTSX potential evaluation program in 2017

p. 19
Jiadong Gong
SRG 2017
A new Co: as a Cu-Be Replacement
A high-strength, wear-resistant material alternative to Cu-Be is sought for
highly loaded, unlubricated aerospace bushing applications to avoid
health-hazards associated with Be.
• Key property goals are WEAR resistance and STRENGTH• Low-friction bushing applications
• Achieve strength in large product sizes without cold work (Quench suppressibility)
Objective
Design and develop an environmentally safe drop-in alternative alloy as a
substitution for highly loaded bushing applications
Vertical Tail Hinge Assembly
Wing Lug Attach
Main Landing Gear

p. 20
Jiadong Gong
SRG 2017
CoCr alloy with precipitation strengthening
• High Cr content – Wear/Corrosion
• Minimize the hardness and ease of machining in
annealed state– Minimize interstitial elements (C, N)
– Most machining before final solution heat treatment
• Design for a precipitation-strengthening dispersion
– Similar microstructures recently demonstrated for
CoAlW
– Solution-treatable following (rough) machining in
annealed state
– Coherent phase is ideal: (L12 or γ’) – Co3Ti
– Efficient precipitation during tempering > ~700-900°C
– Ensure good lattice parameter matching between the
FCC matrix and ordered FCC (L12) particles
• Design for good solidification and hot-working
• Design for an efficient grain pinning dispersion
– TiC can be effective at low phase fraction
J. Sato et al., vol. 312, Science, 2006

p. 21
Jiadong Gong
SRG 2017
Systems Design Chart
VIM/VAR
melting
Homogenization
Hot working
>4” dia.
Solution
treatment
Machining
Tempering
Processing Structure
Solidification
structure
- Inclusions
- Eutectic
Grain Structure
- Grain size
- GB chemistry
- pinning particles
- Avoid cellular
reaction
Nanostructure
- Low-misfit L12
- Size & fraction
- Avoid embrittling
phases
Matrix
- FCC (avoid HCP
transformation)
- Low SFE
- Solid solution
strengthening
Properties
Non-toxic
Strength
-120 to 180 ksi
compressive YS
- CW not required
for strength
Wear
- Low CoF
- Galling/fretting
resistance
Toughness
-Highly ductile after
solution treat
- High toughness
fully hardened
Corrosion
Resistant
Environmentally
Friendly
Bearing Strength
Wear Resistance
Damage Tolerant
Formable
Performance
Corrosion
Resistant

p. 22
Jiadong Gong
SRG 2017
Co System Thermodynamics with L12
• Develop thermodynamic database
– Search composition space for achieve targeted microstructure
– Co-Cr-Ti-W-Fe-Ni-V-C multicomponent thermodynamic database assessment complete
• Design for FCC – L12 lattice parameter matching for stable, coherent dispersion
– Avoid cellular growth reactions at grain boundary (Cr, Fe & V to reduce misfit)
– Stabilize FCC (vs. HCP) at tempering temperature (Fe, Ni)
Co
Al
W Co
Ti
Cr
Isothermal
section at 1173K
γ’
γ’

p. 23
Jiadong Gong
SRG 2017
Conceptual Design Approach
Equilibrium step diagram
Calculation using QuesTek Co database
Calculated contour plots of the γ’ volume
fraction and lattice misfit as a function of
composition
Key design challenges are to: 1) avoid HCP; 2) avoid eta during tempering; 3) avoid Co4Cr2Ti phase
while maintaining high Cr

p. 24
Jiadong Gong
SRG 2017
γ’=16%
Design Iteration:
Optimize Strength and Processability
γ’=22%
1st Generation 3rd Generation
γ γ
LL
Solutionizing window
Tempered condition for 1st Generation characterization(aged at 780C/24 hours – Hardness of 34.8 HRC)
Design of Alloy by CALPHAD
• Maximizing 𝛾′ fraction for strength
• Considering processing (e.g.
solutionizing window)
Optimizing Temper Treatment
• Identify time to peak strength for
reduced processing time

p. 25
Jiadong Gong
SRG 2017
Validation of Design with LEAP
• Validation of alloy nanostructure using
atom probe tomography after tempering
at ~780 °C:
– FCC (Co-rich) matrix and γ’ (L12 crystal
structure, Co3Ti-type) strengthening
nano-precipitates
Side viewTop view

p. 26
Jiadong Gong
SRG 2017
Scale-up Production and Process Optimization
Tempered condition for 1st Generation characterization(aged at 780C/24 hours – Hardness of 34.8 HRC)
410 HV
Alloy production (500 lb. VIM/VAR scale)
Heat treatment optimization is
performed by isothermal holding at
different aging temperatures for
various times (note long times).
The peak hardness condition was
identified as 780°C for 72 hours, then
optimized to within 48 hours
T = 780°C
After ForgingDiameter~6’’

p. 27
Jiadong Gong
SRG 2017
Sub-scale bushing tests showed
• Sub-scale bushing test showed
equivalent wear resistance to Toughmet
• Equivalent galling resistance to Cu-Be
(no galling up to yielding)
• <0.9% wear resistance was program
goal
Dimensional Wear

p. 28
Jiadong Gong
SRG 2017
QT Co Property Comparison
Typical
Tensile
Properties
CuBe
C17200
(HT04)
Toughmet 3
(Cu-Ni-Sn)
ACUBE100
(Co-Cr-Mo)
QuesTalloy Co
(Co-Cr-Fe-Ti-
Ni-V)
Yield Strength
(ksi)164 110 162 126
Tensile
Strength (ksi)182 130 223 200
Elongation (%) ~4 10 12 ~30
Cold Work? Yes Yes No No
Heat
Treatment
SHT, cold
work, age
SHT and cold
work
Warm Work
and ageSHT and age
• QT Co has demonstrated better wear resistance compared to baseline
AMS4533 CuBe alloy.
• Additional interest from turbine engine OEMs
• Patent granted in EU; US and JP pending

p. 29
Jiadong Gong
SRG 2017
Summary
• ICME databases/tools for thermodynamic and process modeling
have been applied to the design of precipitate-strengthened high-
strength Ni-base and Co-base alloys for target applications
• The genomic design method significantly accelerated the materials
design, process development, and prototype production
• The novel Ni and Co alloys show excellent properties and high
potential for the specific applications compared with incumbent
• The methodology and technology used during the development of
these two alloys demonstrates flexible applicability and robust
capability
• Wider application of the computational genomic design has been
growing in related novel fields of materials technology, such as
Additive Manufacturing

p. 30
Jiadong Gong
SRG 2017
Thank you!
For more information, contact:
Jiadong Gong
Senior Materials Design Engineer
QuesTek Innovations
847.425.8221
www.questek.com

p. 31
Jiadong Gong
SRG 2017
Back-up Slides

p. 32
Jiadong Gong
SRG 2017
List of benchmark alloys - IGT
Alloy Re Cr Co Mo W Al Ti Ta Nb Fe Hf C B Zr Ni Other?
QTSX 1 7.1 9.1 0.9 8 5.9 0.1 9.4 - - 0.1 - - - Balance
X45 - 25 Balance - 8 - - - - 1 - 0.25 0.01 - 10
ECY768 - 23.5 Balance - 7 0.1
5
0.2 3.5 - 1 - 0.6 0.01 0.05 10
FSX414 - 28 Balance - 7 - - - - 1 - 0.25 0.01 - 10
MGA2400 - 19 19 - 6 1.9 3.7 1.4 1 - - - - - Balance
U500 - 18 18.5 4 - 2.9 2.9 - - - - 0.08 0.006 0.05 Balance
IN738 - 16 8.5 1.7 2.6 3.4 3.4 1.7 - - - 0.17 0.01 0.1 Balance
IN939 - 22.4 19 - 2 1.9 3.7 - 1 - - 0.15 0.009 0.10 Balance
MAR M247LC - 8 10 0.6 10 5.5 1 3 - - 1.5 0.15 0.015 0.03 Balance
CM247LC - 8 9.3 0.5 9.5 5.6 0.7 3.2 - - 1.4 0.07 0.015 0.010 Balance
PWA1483 - 12.2 9.2 1.9 3.8 3.6 4.2 5.0 - - - 0.07 - - Balance
ReneN5 3 7 8 2 5 6.2 - 7 - - 0.2 - - - Balance
GTD222 - 22.5 19.1 - 2 1.2 2.3 0.9
4
0.8 - - 0.08 0.004 0.02 Balance
Nim155
Nimonic 263

p. 33
Jiadong Gong
SRG 2017
List of benchmark alloys - Aerospace
Alloy Re Cr Co Mo W Al Ti Ta Nb Hf C Ni Other?
QTSX 1 7.1 9.1 0.9 8 5.9 0.1 9.4 - 0.1 - Balance
PWA1480 - 10 5 - 4 5 1.5 12 - - - Balance
PWA1483 - 12.2 9 1.9 3.8 3.6 4.1 5 - - 0.07 Balance
GTD444 - 9.8 7.5 1.5 6 4.2 3.5 4.8 - 0.15 0.08 Balance
CMSX7 - 6 10 0.6 9 5.7 0.8 9 - 0.2 - Balance
CMSX8 1.5 5.4 10 0.6 8 5.7 0.7 8 - 0.2 - Balance
PWA1484 3 5 10 2 6 5.6 - 9 - 0.1 - Balance
CMSX4 3 6.5 9 0.6 6 5.6 1 6.5 - 0.1 - Balance
Rene N5 3 7 7.5 1.5 5 6.2 - 6.5 0.01 0.15 - Balance 0.01Y
CMSX10 6 2 3 0.4 5 5.7 0.2 8 0.1 0.03 - Balance
TMS238 6.4 4.6 6.5 1.1 4 5.9 - 7.6 - 0.1 - Balance 5.0Ru

p. 34
Jiadong Gong
SRG 2017
Performance at elevated temperature
Evolution of microstructures during long-term exposure at elevated temperature
Maintains phase fraction after
high temperature exposure

p. 35
Jiadong Gong
SRG 2017
Stress Rupture Samples: 1562F & 1742F
1562F/1255h 1562F/1693h 1742F/873h 1742F/1283h
Longitudinal
Transverse

p. 36
Jiadong Gong
SRG 2017
Stress Rupture Samples: 1800F
1800F/515h1800F/391h 1800F/455h
Longitudinal
Transverse

p. 37
Jiadong Gong
SRG 2017
Stress Rupture Samples: 1900F
1900F/210h1900F/149h 1900F/185h
Longitudinal
Transverse

p. 38
Jiadong Gong
SRG 2017
Stress Rupture Samples: 1922F & 2000F
1922F/747h 1922F/920h 2000F/160h
Longitudinal
Transverse

p. 39
Jiadong Gong
SRG 2017
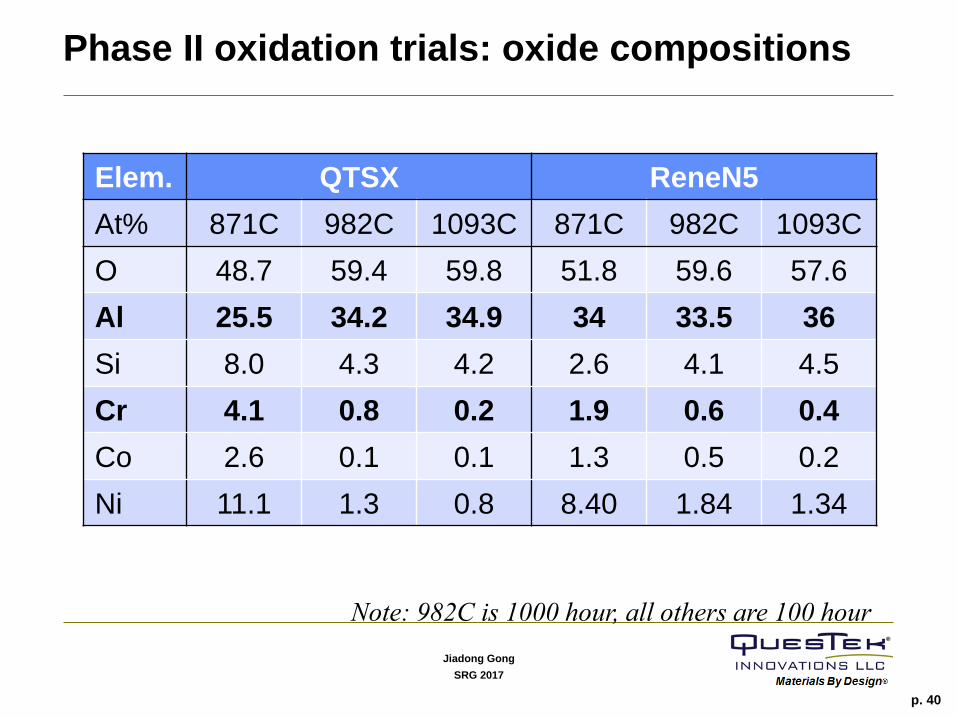
Phase II oxidation trials
• In-air oxidation at 871°C (1600°F), 982°C (1800°F) and 1093°C (2000°F)• 100 hour at all three, 1000 hour at 982°C
• QTSX + ReneN5 (both fully aged)
• Mass change and oxide scale thickness change analyzed
Isochronal (100h) 982°C Isothermal
Δ Mass
Δ Thickness
p. 40
Jiadong Gong
SRG 2017
Phase II oxidation trials: oxide compositions
Elem. QTSX ReneN5
At% 871C 982C 1093C 871C 982C 1093C
O 48.7 59.4 59.8 51.8 59.6 57.6
Al 25.5 34.2 34.9 34 33.5 36
Si 8.0 4.3 4.2 2.6 4.1 4.5
Cr 4.1 0.8 0.2 1.9 0.6 0.4
Co 2.6 0.1 0.1 1.3 0.5 0.2
Ni 11.1 1.3 0.8 8.40 1.84 1.34
Note: 982C is 1000 hour, all others are 100 hour

p. 41
Jiadong Gong
SRG 2017
Thermal processing
Homogenization:
1285°C/4 hrs
1295°C/4 hrs
1310°C/8 hrs
Air Cool
Aging:
1121°C/4 hrs
871°C/20 hrs
Air Cool

p. 42
Jiadong Gong
SRG 2017
Thermal processing
• Microstructural evolution through
thermal processing path
As-cast
1285C 4 hrs 1285C 4 hrs,
1295C 4 hrs
1285C 4 hrs,
1295C 4 hrs,
1310C 8 hrs
1285C 4 hrs,
1295C 4 hrs,
1310C 8 hrs,
air cool,
1121C 4 hrs,
871C 20 hrs,
Air cool
Homogenization Age

p. 43
Jiadong Gong
SRG 2017
Testing results – thermal diffusivity
Thermal Diffusivity

p. 44
Jiadong Gong
SRG 2017
Testing results – specific heat
Specific Heat

p. 45
Jiadong Gong
SRG 2017
Testing results – thermal conductivity
Thermal Conductivity

p. 46
Jiadong Gong
SRG 2017
Testing results – thermal expansion
Thermal Expansion

p. 47
Jiadong Gong
SRG 2017
Testing results – coefficient of thermal expansion
Mean Coefficient of Thermal Expansion

p. 48
Jiadong Gong
SRG 2017
Testing results – tensile

p. 49
Jiadong Gong
SRG 2017
Testing results – stress rupture
• Still in-progress:
– 1562°F
• Stress:
– 55.8 and 66.9 ksi
– 1742°F
• Stress:
– 23.2 ksi
– 1922°F
• Stress:
– 13.1 ksi

p. 50
Jiadong Gong
SRG 2017
Next Steps
• Sulfidation testing at Cranfield in collaboration with Siemens
– QTSX vs. Rene N5
• Oxidation testing at Siemens
– QTSX vs. Rene N5
• Small cubes for dimension and weight
• Cast another round of test bars and build-out required test data
to allow for adoption considerations
• Coating design & development

p. 51
Jiadong Gong
SRG 2017
Summary
• Thermodynamic and process modeling ICME tools have been applied to
the design of L12 precipitate-strengthened high-strength wear-resistant
Co-base alloy
• Full-scale prototypes were produced and extensive performance testing
shows excellent properties and high potential for the alloy as a CuBe
replacement
• Simulation and validation of multi-step temper to reduce time to peak
strength
• Newest forging (with attempted larger deformation) has similar
microstructure as previous heats (with identical SHT and temper) and
similar properties (tensile, galling)
– No grain refinement achieved
• Improved bushing wear over CuBe
• Potential for improved properties with smaller grains
– SHT optimization
– Larger deformation

p. 52
Jiadong Gong
SRG 2017
0
5
10
15
20
25
30
0 5 10 15 20 25 30
Pre
dic
ted
Pre
cip
itat
ion
Str
en
gth
en
ing,
Ksi
Precipitate Radius (nm)
60
70
80
90
100
110
120
130
140
0 5 10 15 20 25 30
Pre
dic
ted
Yie
ld S
tre
ngt
h, K
si
Precipitate Radius (nm)
Precipitation strengthening Predicted Yield strength
22%
17.5%
16%
22%
17.5%
16%
Strength Modeling
For a fixed precipitate fraction, maximum strength is achieved at the precipitate size that precipitation shearing and Orowan looping effect equal.
APB energy is taken as 185 mJ/m

p. 53
Jiadong Gong
SRG 2017
Multi-step temper to reduce time
to peak strength
Alloy production (300 lb. VIM/VAR scale)
0 20 40 60 80 100
0
10
20
30
40
50
60
(
KS
i)
Time (hrs)
780C
800C
820C
780C+680C
800C+680C
820C+680C
Aging cycle Ave. tensile σy
Prior cycle
(1-step, 72h)
127.2 ksi
New cycle
(2-step, 48h)
127.3 ksi
DICTRA Simulations to Optimize
Homogenization Time
Strength Model* Calibrated to Peak Aged
Condition
*Kozar, R. W.et.al, Metall. Mater. Trans. 40A (7), (2009) 1588-1603.
Model validated by
experiment for
decrease in aging by
33%

p. 54
Jiadong Gong
SRG 2017
Precipitation Modeling
0
5
10
15
20
25
0.00001 0.0001 0.001 0.01 0.1 1 10 100
γ' Precipitation radius (nm)
0
0.05
0.1
0.15
0.2
0.25
0.00001 0.0001 0.001 0.01 0.1 1 10 100
γ' Precipitation Phase Fraction
0.00E+00
2.00E+25
4.00E+25
6.00E+25
8.00E+25
1.00E+26
1.20E+26
1.40E+26
0.00001 0.0001 0.001 0.01 0.1 1 10 100
Number Density (#/m^3)
Aging time (hr)
PrecipiCalc® and TC-PRISMA
simulation has been performed
to predict the evolution of the γ’
precipitates during the long
term aging.
Figures on the left demonstrates
the simulation results of the 780
°C isothermal aging.
The γ and γ’ interfacial energy is
set to a preliminary value of 30
mJ/m2 according to previous
studies. Further refinement of
the simulation requires
calibration of this term to give
better predictions.

p. 55
Jiadong Gong
SRG 2017
QuesTek Cobalt Alloy Property
Comparison • Designed for low-friction bushing applications as an alternative to high-strength
CuBe alloys– The new design has demonstrated better wear resistance in pin-on-disk and reciprocating wear tests,
compared to baseline AMS4533 CuBe alloy.
• Additional interest from turbine engine OEMs
• QuesTek patent pending
Room Temperature Tensile Property
QuesTek Cobalt*
Haynes 188(AMS 6508 Sheet)
Haynes 25(Hot-rolled +
Annealed Bar)
Haynes 556™(Hot-rolled +
Annealed plate)
Ultimet®(Solution
Treated Bar)
Stellite 6®(Investment
Cast)
Tensile Strength 200 ksi 137 ksi 147 ksi 116 ksi 147 ksi 115 ksi
0.2% Yield Strength
127 ksi 67 ksi 73 ksi 55 ksi 76 ksi 96 ksi
Elongation 33% 53% 60% 51% 38% 3%
Reduction in Area 28% - - - - 3%
Hardness, RC 38 30 41
*Based on initial evaluations of 2” round hot forged bar, solution treated and aged at 780°C, produced at 500 lb. VIM + VAR scale

p. 56
Jiadong Gong
SRG 2017
Conclusions and Future Directions
• Thermodynamic and process modeling tools have been developed/applied
to the design of high-strength wear-resistant Co-base alloys
• Nano-scale L12 precipitation strengthening was employed to achieve
required strength levels
• CALPHAD calculations and PrecipiCalc® simulations were performed to
optimize the design and the heat treatment process for higher strength
• The predictions are in good agreement with the experimental observations
of the microstructures and the compositions validated via SEM and LEAP
• A full-scale prototype has been produced and the initial testing shows
excellent properties and high promise for replacement of the Cu-Be alloys
• Future efforts will include
• Accelerate scale-up and manufacturing optimization
• Adapt to high-temperature aeroturbine applications