computational modeling of flat slabs: influence of ribs
TRANSCRIPT

ORIGINAL ARTICLE
Received: May 21, 2020; In Revised Form: July 04, 2020; Accepted: July 14, 2020; Available online: July 15, 2020. https://doi.org/10.1590/1679-78256128
Latin American Journal of Solids and Structures. ISSN 1679-7825. Copyright © 2020. This is an Open Access article distributed under the terms of the Creative Commons Attribution License, which permits unrestricted use, distribution, and reproduction in any medium, provided the original work is properly cited.
Latin American Journal of Solids and Structures, 2020, 17(6), e285 1/16
Computational modeling of flat slabs: Influence of ribs and flexural reinforcement on shear strength
Ricardo J. C. Silvaa* , Dênio R. C. Oliveirab , Nívea G. B. Albuquerqueb , Francisco E. S. Silva Júniorc , Paulo V. P. Sacramentob
a Faculdade de Engenharia Civil, Universidade Estadual Vale do Acaraú - UVA, Rua Dr. Guarany 317, Sobral-CE, Brasil. Email: [email protected] b Faculdade de Engenharia Civil, Universidade Federal do Pará - UFPA, Rua Augusto Corrêa s/n, Belém-PA, Brasil. Email: [email protected], [email protected], [email protected] c Faculdade de Engenharia Civil, Universidade Estadual Vale do Acaraú - UVA, Rua Dr. Guarany 317, Sobral-CE, Brasil. Email: [email protected]
* Corresponding author
http://dx.doi.org/10.1590/1679-78256128
Abstract A greater number of structures are being built with flat reinforced concrete slabs because they offer several advantages. However, many designers are still unsure about the type of slab that has the best structural performance and which building codes provide the best strength estimates. This study presents nonlinear computer simulations of 16 flat reinforced concrete slabs under symmetrical punching: 4 solid slabs, 4 waffle slabs with wide beams, and 8 waffle slabs with different numbers of ribs supported in the solid area of the slab. Geometric longitudinal reinforcement ratios ranged from 0.45% to 1.97%. The results showed that solid and beamed slabs are more resistant, and normative estimates overestimate their strengths, while the opposite outcome was found for waffle slabs, whose estimates provided in the codes were rather conservative. The most accurate code was EC2, followed by ACI 318 and NBR 6118.
Keywords Punching, Flat waffle slab, Wide beam
Graphical Abstract

Computational modeling of flat slabs: Influence of ribs and flexural reinforcement on shear strength Ricardo J. C. Silva et al.
Latin American Journal of Solids and Structures, 2020, 17(6), e285 2/16
1 INTRODUCTION
Punching shear is a type of brittle failure that occurs in slabs as a result of the application of a concentrated force, such as the reaction of the column on the slab, for example. This failure may lead to an unplanned redistribution of efforts and cause a domino effect of punching failure, known as progressive collapse. Kinnunen & Nylander (1960) proposed the first relevant mechanical model for punching shear after analyzing experimental tests with 61 circular slabs (without shear reinforcement) supported on circular columns. They reported that, with increased loadings, radial cracks appeared on the top face of the slab, followed by a circumferential crack that formed at the top of the punching cone. Together with radial cracks, they outlined “slices” in a slab. These “slices” in the slab were deformed, and rotated around a center, causing the area to be crushed on the bottom face of the slab.
Important experimental works, e.g., those of Regan (1981, 1986) and Regan & Bræstrup (1985), provided relevant insights to the development of punching shear research. One of the most important findings that influenced the current normative equations was that when the reinforcement ratio of a slab is increased, its punching shear strength also increases. Subsequently, Muttoni (2008) introduced the Critical Shear Crack Theory (CSCT), which was based on the shear crack along the slab thickness, cutting the compression strut that transmits load to column. Thus, he demonstrated that the punching strength curve was inversely proportional to the slab rotation curve. Lastly, Muttoni created an equation for the load-rotation ratio to estimate a slab punching resistance value. Based on the work of Muttoni (2008), Bompa & Onet (2016) proposed a simplified model for struts and ties for estimation of slab punching strength without the need to calculate rotation.
The point is that, in general, building codes and standards establish formulas that estimate punching strength for solid flat slabs, based on the above-mentioned theories, but they hardly address waffle slabs. ACI 318 (ACI, 2019), Eurocode 2 (EC2) (CEN, 2004) and NBR 6118 (ABNT, 2014) propose some calculations to estimate rib shear failure and recommend the use of the same formulas for punching shear. However, waffle slabs were tested in recent experimental studies, such as those of Al-Bayati et al. (2015, 2018), Arunkumar et al. (2018) and Sacramento et al. (2018). It was found that strength was reduced in some of the slabs when the punching cone reached the rib region. In other words, to avoid a reduction in slab strength, the punching cone must not exceed the perimeter of the solid region of waffle flat slabs. If it does, the normative estimates must be adjusted to enable a safer structural design.
This problem has motivated this computational study, whose main objective was to investigate and compare the structural behavior of each type of slab using computational modeling, as well as check the influence of reinforcement ratio and slab rotation on ultimate strength and distribution of maximum and minimum principal stresses. Experimental tests were simulated on 4 solid flat slabs, 4 waffle slabs with wide beams, 4 waffle flat slabs with closely spaced central ribs and 4 waffle flat slabs with evenly spaced ribs. The slabs in each group had longitudinal reinforcement ratios of 0.45%, 0.90%, 1.41% and 1.97%, respectively. In addition, the estimates of building codes ACI 318 (ACI, 2019), Eurocode 2 (EC2) (CEN, 2004) and NBR 6118 (ABNT, 2014) were evaluated for punching shear and shear strengths of slab ribs. Although this is not a totally new subject, the outcomes of the present research can offer relevant scientific and design-related contributions with specific provisions for waffle flat slabs in case of future code amendments.
2 NORMATIVE RECOMMENDATIONS
2.1 ACI 318 (ACI, 2019)
ACI 318 estimates punching shear (VACI, p) for slabs without shear reinforcement using the lowest value provided by equations 1, 2 and 3, where fc the compressive strength of concrete limited to 70 MPa, β is the ratio between the largest and smallest column dimensions, λ is the modification factor that takes on a value equal to 1.0 for normalweight concrete or between 0.75 and 0.85 for lightweight concrete, λs is the size effect factor which is calculated by 𝜆𝜆𝑠𝑠 = �2 (1 + 0.004 ∙ 𝑑𝑑)⁄ ≤ 1, αs is the constant that takes on a value equal to 40 for internal columns or 30 for edge column or 20 for corner columns, d is the effective depth of the section and u1 is the control perimeter according to ACI 318 (Figure 1). For waffle slabs, ACI 318 recommends that ribs should have a minimum width (bw) of 100 mm, height (hb) no more than 3.5 times the minimum rib width, and maximum spacing between rib faces (s) of 750 mm. Topping slab thickness (hf) must be at least 37.5 mm and equivalent to the s/12 ratio at most (Figure 1). For analysis of the ribs without transversal reinforcement, ACI 318 estimates shear strength through Equation 4, where λ is the modification factor, bw is rib width and d is the effective depth of the section.
𝑉𝑉 𝐴𝐴𝐴𝐴𝐴𝐴,𝑝𝑝 = 0.33 ∙ 𝜆𝜆𝑠𝑠 ∙ 𝜆𝜆 ∙ �𝑓𝑓𝑐𝑐 ∙ 𝑢𝑢1 ∙ 𝑑𝑑 (1)
Computational modeling of flat slabs: Influence of ribs and flexural reinforcement on shear strength Ricardo J. C. Silva et al.
Latin American Journal of Solids and Structures, 2020, 17(6), e285 3/16
𝑉𝑉 𝐴𝐴𝐴𝐴𝐴𝐴,𝑝𝑝 = �0.17 + 0.33𝛽𝛽� ∙ 𝜆𝜆𝑠𝑠 ∙ 𝜆𝜆 ∙ �𝑓𝑓𝑐𝑐 ∙ 𝑢𝑢1 ∙ 𝑑𝑑 (2)
𝑉𝑉 𝐴𝐴𝐴𝐴𝐴𝐴,𝑝𝑝 = �0.17 + 0.083∙𝛼𝛼𝑠𝑠∙ 𝑑𝑑𝑢𝑢1
� ∙ 𝜆𝜆𝑠𝑠 ∙ 𝜆𝜆 ∙ �𝑓𝑓𝑐𝑐 ∙ 𝑢𝑢1 ∙ 𝑑𝑑 (3)
𝑉𝑉 𝐴𝐴𝐴𝐴𝐴𝐴,𝑅𝑅 = 0.083 ∙ 𝜆𝜆 ∙ �𝑓𝑓𝑐𝑐 ∙ 𝑏𝑏𝑤𝑤 ∙ 𝑑𝑑 (4)
2.2 Eurocode 2 (EC2) (CEN, 2004)
EC2 estimates punching shear load (VEC, p) for slabs without shear reinforcement through Equation 5. In this equation, ρl is the longitudinal reinforcement ratio and it is not greater than 0.02, 𝜉𝜉 = �1 + �200/𝑑𝑑 � ≤ 2.0 and u1 is the control perimeter according to EC2 (Figure 1). For waffle slabs, EC2 states that the topping slab and the ribs do not need to be analyzed separately when there is sufficient torsional stiffness between these two elements. Also, waffle slabs can be analyzed as if they were solid slabs. However, this condition will only be acceptable if spacing between the faces of the ribs (s) does not exceed 1500 mm, if rib height (H) is no greater than 4 times its width (bw) and if topping slab height (hf) is at least the greater of these two factors: (s/10) or (50 mm) (Figure 1). To analyze the ribs without transversal reinforcement, EC2 estimates shear strength with Equation 6.
𝑉𝑉𝐸𝐸𝐴𝐴,𝑝𝑝 = 0.18 ∙ 𝜉𝜉 ∙ (100 ∙ 𝜌𝜌𝑙𝑙 ∙ 𝑓𝑓𝑐𝑐)13 ∙ 𝑢𝑢1 ∙ 𝑑𝑑 (5)
𝑉𝑉𝐸𝐸𝐴𝐴,𝑅𝑅 = 0.18 ∙ 𝜉𝜉 ∙ (100 ∙ 𝜌𝜌𝑙𝑙 ∙ 𝑓𝑓𝑐𝑐)13 ∙ 𝑏𝑏𝑤𝑤 ∙ 𝑑𝑑 (6)
2.3 NBR 6118 (ABNT, 2014)
NBR 6118 estimates punching shear load (VNBR, p) for slabs without shear reinforcement according to the Equation 7. Here, 𝜉𝜉 = �1 + �200/𝑑𝑑 � and u1 is the control perimeter according to NBR 6118 (Figure 1). It should be noted that NBR 6118 does not limit the size effect (ξ) nor the longitudinal reinforcement ratio (ρl), unlike EC2.
𝑉𝑉𝑁𝑁𝑁𝑁𝑅𝑅,𝑝𝑝 = 0.18 ∙ 𝜉𝜉 ∙ (100 ∙ 𝜌𝜌𝑙𝑙 ∙ 𝑓𝑓𝑐𝑐)13 ∙ 𝑢𝑢1 ∙ 𝑑𝑑 (7)
For waffle slabs, NBR 6118 recommends that the ribs should have a minimum width (bw) of 50 mm and if they have compression reinforcement, minimum width (bw) becomes 80 mm (Figure 1). Topping slab thickness must be at least 50 mm when there is conduit wiring of Φ10mm or at least (40 mm + Φ) inside the slabs has a diameter greater than Φ10mm or at least (40 mm + 2Φ) when there is a conduit crossover inside the slabs. If the spacing between the axes of the ribs is less than or equal to 650 mm, there is no need to either test the topping slab as an independent slab or to check rib shear strength. When the spacing between the axes of the ribs is between 650 mm and 1100 mm, bending of the topping slab must be checked and the ribs must be dimensioned as beams, and calculations have to be made to check shear strength. However, when the spacing between the axes of the ribs is up to 900 mm and the average rib width is greater than 120 mm, there is no need to check the topping slab. In case the spacing between axes is greater than 1100 mm, the topping slab must be calculated as a solid slab, supported on the beam grid, while respecting the minimum thickness limits. To analyze the ribs without transversal reinforcement, NBR 6118 recommends equations 8 to 10, where 𝜏𝜏𝑅𝑅 = 0.05 (𝑓𝑓𝑐𝑐)2/3, 𝑘𝑘 = |1.6− 𝑑𝑑|, with d in meters and 𝜌𝜌1 = 𝐴𝐴𝑠𝑠1/(𝑏𝑏𝑤𝑤𝑑𝑑) ≤ 0.02, where As1 is the longitudinal reinforcement in the rib and bw is the minimum width of the section along the effective depth d.
1. (a) Calculation to check diagonal compressive strength:
𝑉𝑉𝑁𝑁𝑁𝑁𝑅𝑅,𝐴𝐴𝐶𝐶 = 0.27 ∙ 𝛼𝛼𝑣𝑣1 ∙ 𝑓𝑓𝑐𝑐 ∙ 𝑏𝑏𝑤𝑤 ∙ 𝑑𝑑 (8)
𝛼𝛼𝑣𝑣1 = 1 − 𝑓𝑓𝑐𝑐/250 (9)
2. (b) Calculation to check diagonal tensile strength:
𝑉𝑉𝑁𝑁𝑁𝑁𝑅𝑅,𝑇𝑇𝐶𝐶 = [𝜏𝜏𝑅𝑅 ∙ 𝑘𝑘 ∙ (1.2 + 40 𝜌𝜌1)] ∙ 𝑏𝑏𝑤𝑤 ∙ 𝑑𝑑 (10)

Computational modeling of flat slabs: Influence of ribs and flexural reinforcement on shear strength Ricardo J. C. Silva et al.
Latin American Journal of Solids and Structures, 2020, 17(6), e285 4/16
Figure 1 – Control perimeter and rib geometry. Source: Authors’ own data
3 METHOD
3.1 SLAB PROPERTIES
This research used the computer software Ansys Workbench to perform non-linear analyses on 16 flat reinforced concrete slabs, divided into 4 groups (S0, S1, S2 and S3) (Figure 2). Group S0 is composed of 4 solid flat slabs (S1S0, S2S0, S3S0 and S4S0) with reinforcement rates of 0.45%, 0.90%, 1.41% and 1.97%, respectively. Group S1 is composed of 4 waffle slabs with wide beams (S1S1, S2S1, S3S1 and S4S1) with reinforcement ratios of 0.45%, 0.90%, 1.41% and 1.97%, respectively. Group S2 is composed of 4 flat waffle slabs with closely spaced central ribs (S1S2, S2S2, S3S2 and S4S2) with reinforcement ratios of 0.45%, 0.90%, 1.41% and 1.97%, respectively. Group S3 group is composed of 4 flat waffle slabs (S1S3, S2S3, S3S3 and S4S3) with reinforcement ratios of 0.45%, 0.90%, 1.41% and 1.97%, respectively. The 16 slabs have height (h) of 150 mm, effective depth (d) of 133 mm, support dimensions (c x c) of 120 mm x 120 mm, average concrete compression strength (fc) of 40 MPa, average concrete tensile strength (ft) of 3.5 MPa and steel yield strength (fy) of 500 MPa. Table 1 shows the arrangement of the reinforcements in the study slabs.
The method used in Ansys (2013a) (2013b) was incremental, with step-by-step application of load/deformation, through substeps up to slab failure. In this way, a possible experimental test was simulated, using the dimensions of the slabs on a 1:2 scale to represent the region of negative bending moment of a slab with a span of approximately 7600 mm, slab thickness of 300 mm and column dimensions of 250 mm x 250 mm. It should be noted that, in this research, there was no intention to correlate the study slabs with a full-scale prototype, through quantitative research. This research is merely qualitative; it compared slabs with solid areas in different dimensions, in order to estimate percentages of gains and losses of strength.

Computational modeling of flat slabs: Influence of ribs and flexural reinforcement on shear strength Ricardo J. C. Silva et al.
Latin American Journal of Solids and Structures, 2020, 17(6), e285 5/16
Figure 2 – Slabs of groups S0, S1, S2 and S3. Source: Authors’ own data
Table 1 Data on the study slabs
Slab Top reinforcement in the central band
(in red)
Top reinforcement along the slab edges (in blue)
Ρ (%)
S1S0, S1S1, S1S2 and S1S3 5 Φ 10 (x2) 3 Φ 10 (x4) 0.45 S2S0, S2S1, S2S2 and S2S3 10 Φ 10 (x2) 0.90 S3S0, S3S1, S3S2 and S3S3 10 Φ 12.5 (x2) 3 Φ 12.5 (x4) 1.41 S4S0, S4S1, S4S2 and S4S3 14 Φ 12.5 (x2) 1.97
3.2 COMPUTATIONAL MODELING
Modeling for the slabs was performed on the platform Workbench Ansys, and a nonlinear and static analysis was defined. The Solid65 and Link180 elements were used for the concrete and the reinforcements, respectively. The constitutive model of Ansys for concrete is the concrete model, which uses the constitutive equations of Willam & Warnke (1974), with five parameters for failure. This model predicts failure of brittle materials, and it can work with cracking (tensile damage) and crushing (compression damage) as failure modes, as shown in Figure 3. This computer software was selected because it is widely used in nonlinear analysis of structures, has a user-friendly interface, and provides satisfactory responses when they are compared to experimental results.

Computational modeling of flat slabs: Influence of ribs and flexural reinforcement on shear strength Ricardo J. C. Silva et al.
Latin American Journal of Solids and Structures, 2020, 17(6), e285 6/16
Figura 3 –Concrete constitutive model. Source: Ansys (2013b)
For steel, a perfect bilinear elastoplastic model was adopted, with tangent modulus (ET) equal to 0 MPa, considering that the reinforcements only have axial stress-strength. Poisson's ratio (νs) was 0.3 for steel, and bond strength between reinforcement and concrete was considered to be perfect. The Solid185 element was defined for load application and support points, using the same material of the reinforcements, but without the nonlinearity properties.
For concrete, estimates were made for the initial tangent elastic modulus (Eci), of the FIB (2011), which was equal to 34.1 GPa. Poisson's ratio of concrete (νc) and the shear transfer coefficient was 0.3 for open cracks and 1.0 for closed cracks. The stress-strain graph for compressed concrete was defined as recommended by the FIB (Equation 11) and shown in Figure 4, with maximum stress achieved reached at 2.3 ‰ strain. After maximum stress was achieved, stress was considered to be constant until reaching failure deformation of 3.5 ‰, since Ansys does not allow a negative inclination in this graph.
𝜎𝜎𝑐𝑐 = 𝑓𝑓𝑐𝑐 �1 − �1 − 𝜀𝜀𝑐𝑐𝜀𝜀𝑐𝑐2�𝑛𝑛� (11)
where: σc: compressive strength of concrete; fc : average compressive strength of concrete; εc: concrete strain; εc2: concrete strain at the beginning of the yield plateau; n: exponent (2 for concretes under 50 MPa).
Figure 4 –Stress-strain graph for compressed concrete. Source: Authors’ own data
To reduce the computational effort in the analyses, only a quarter of the slabs were modeled and regions of symmetry were defined in the X and Z directions. The finite element mesh was divided into 31 elements in the X and Z directions, and divided into 9 elements in the Y direction. Thus, a mesh only with hexahedral elements was generated. In addition, the reinforcement nodes could be matched with the concrete element nodes; this is a condition required for analyses with the Solid65 element (according to Silva et al. (2019)). Figure 5 shows the model of the slabs. The analyses used a convergence criterion based on displacement, where tolerance was set at 1%, and the complete Newton-Raphson

Computational modeling of flat slabs: Influence of ribs and flexural reinforcement on shear strength Ricardo J. C. Silva et al.
Latin American Journal of Solids and Structures, 2020, 17(6), e285 7/16
method was adopted. Loading was applied in a single loading step and 100 substeps. Loads were applied to the slabs as a small displacement from top to bottom on the upper face of the load application points. Supportive reactions were defined as zero displacements in the Y direction on the bottom face of the column. The contact regions between all solids were defined with the bonded contact and the Pure Penalty formulation. Slab failure was considered to occur when the software returned an error of magnitude and the simulations were interrupted, indicating that the structure had reached its ultimate strength. Failure could also be identified through the vertical load-displacement curves of the slabs over the load application points.
Figure 5 - Model for the slabs (a), symmetry regions (b), detail of the ribs of slab S2S1 (c), detail of the ribs of slab S2S3.
Source: Authors’ own data
3.3 COMPUTATIONAL MODEL VALIDATION
The waffle flat slab L3 tested by Albuquerque (2009) and the solid flat slab tested by Ramos (2003) were simulated with Ansys and the computational results were compared to their experimental results, in order to validate the computational analyzes performed in this article. The Albuquerque slab L3 had a dimension of 1800 mm x 1800 mm with 150 mm thickness, with ribs 50 mm width 250 mm axis to axis spacement, supported on a stell plate measuring 120 mm x 120 mm x 50 mm, and the Ramos slab AR2 (2003) had dimension of 2300 mm x 2300 mm sides and 100 mm thickness. The distribution of reinforcement at the top of the slabs is shown in Figure 6. The testing scheme of the slabs L3 and AR2 is shown in Figure 7. The experimental and computational displacements of the slabs were measured at point B in relation to point A and are shown in Figure 8. L3 and AR2 slabs failed by punching shear with loads of 150.5 kN and 258 kN, respectively, and in the computational simutation both slabs also failed by punching shear with loads of 145.0 kN and 268 kN, respectively. The Table 2 presents the data and experimental results of the waffle flat slab L3 from Albuquerque and the solid flat slab AR2 from Ramos that were used to compare with the numerical results and with the normative estimates. Table 2 showed accurate results when comparing the experimental and computational failure loads. The normative results were conservative in relation to shear in the ribs. Figure 8 (a) and (b) show the good approximation for experimental and computational load vs displacement curves, and Figure 9 (a), (b), (c) and (d) highlight the strains and the maximum principal stresses that raise radial and circumferential cracks before the punching shear failure cone shaping, suggesting reasonable agreement with the experimental results. It is observed that displacements, strains and principal tensile stresses of AR2 slab are greater than those of L3 slab because AR2 slab is more flexible than L3 slab, and the small solid area of the Albuquerque L3 waffle flat slab reduced its resistance considerably.

Computational modeling of flat slabs: Influence of ribs and flexural reinforcement on shear strength Ricardo J. C. Silva et al.
Latin American Journal of Solids and Structures, 2020, 17(6), e285 8/16
Figure 6 – Reinforcement on the top of the slabs. Source: Albuquerque (2009) and Ramos (2003)
Figure 7 – Slab testing schemes. Source: Albuquerque (2009) and Ramos (2003)
Figure 8 – Experimental and computational curves load vs displacement. Source: Authors, Albuquerque (2009) and Ramos (2003)

Computational modeling of flat slabs: Influence of ribs and flexural reinforcement on shear strength Ricardo J. C. Silva et al.
Latin American Journal of Solids and Structures, 2020, 17(6), e285 9/16
Table 2 Results for L3 and AR2 slabs
Slab c
(mm) h
(mm) d
(mm) ρ
(%) fc
(MPa) fy
(MPa) Vcomp/Vu
Experimental failure mode
Code Vcode/Vu Normative
failure mode
L3 120 150 128 0.47 30.0 617.6 0.96 PS ACI 0.31 SR EC2 0.30 SR NBR 0.20 SR
AR2 200 100 80 1.30 39.1 613.0 1.04 PS ACI 0.63 PS EC2 0.68 PS NBR 0.88 PS
PS: Punching shear; SR: Shear in ribs.
Figure 9 – Strains and stresses for slabs (1/4 of slab). Source: Authors’ own data
4 RESULTS AND DISCUSSION
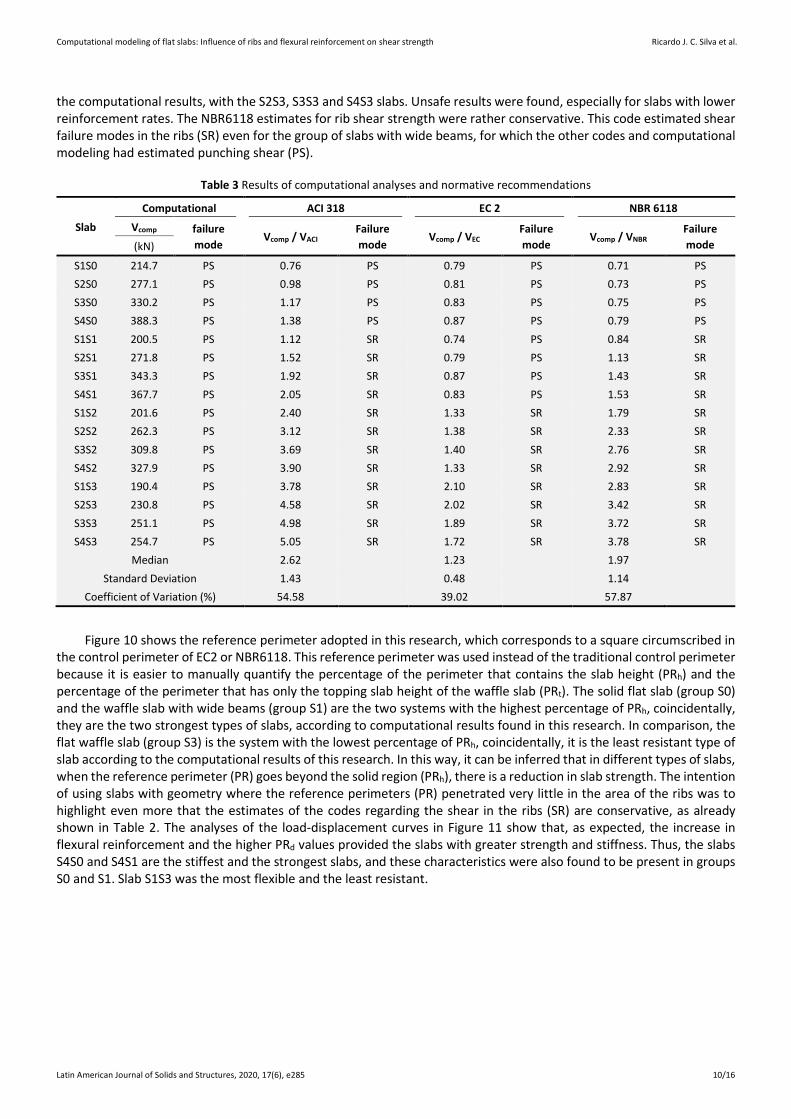
Table 3 shows the computational and normative results of the study slabs. The computational results show that the solid flat slab, together with the waffle slab with wide beams, were the strongest (groups S0 and S1, respectively) while the waffle flat slab (group S3) was the least resistant. Particularly in the solid flat slab (group S0), the increase in the reinforcement ratio increases slab strength, as expected. For this type of slab, the EC2 estimates were the most similar to the computational results, for the S1S0, S3S0 and S4S0 slabs. Unsafe results were found, especially for slabs with lower reinforcement ratios. For the waffle slab with wide beams (group S1), it was also found that the increase in the reinforcement ratio increases slab strength. In this case, EC2 estimates were, again, the most similar to the computational results for slabs S1S1, S3S1 and S4S1. There were also unsafe results, especially for slabs with lower reinforcement ratios. For the waffle flat slab with closely spaced ribs (group S2), an increase in the reinforcement ratio also increases slab strength. For this slab system, the ACI 318 estimates were the most similar to the computational results, for the slabs S2S2, S3S2 and S4S2. They were unsafe results for the smallest reinforcement ratios and conservative results for higher reinforcement ratios. For the waffle flat slab (group S3), the increase in the reinforcement ration increases slab strength, in the same way as in the other groups. For this type of slab, the ACI 318 estimates were the ones that came closest to
Computational modeling of flat slabs: Influence of ribs and flexural reinforcement on shear strength Ricardo J. C. Silva et al.
Latin American Journal of Solids and Structures, 2020, 17(6), e285 10/16
the computational results, with the S2S3, S3S3 and S4S3 slabs. Unsafe results were found, especially for slabs with lower reinforcement rates. The NBR6118 estimates for rib shear strength were rather conservative. This code estimated shear failure modes in the ribs (SR) even for the group of slabs with wide beams, for which the other codes and computational modeling had estimated punching shear (PS).
Table 3 Results of computational analyses and normative recommendations
Slab
Computational ACI 318 EC 2 NBR 6118
Vcomp failure mode
Vcomp / VACI Failure mode
Vcomp / VEC Failure mode
Vcomp / VNBR Failure mode (kN)
S1S0 214.7 PS 0.76 PS 0.79 PS 0.71 PS S2S0 277.1 PS 0.98 PS 0.81 PS 0.73 PS S3S0 330.2 PS 1.17 PS 0.83 PS 0.75 PS S4S0 388.3 PS 1.38 PS 0.87 PS 0.79 PS S1S1 200.5 PS 1.12 SR 0.74 PS 0.84 SR S2S1 271.8 PS 1.52 SR 0.79 PS 1.13 SR S3S1 343.3 PS 1.92 SR 0.87 PS 1.43 SR S4S1 367.7 PS 2.05 SR 0.83 PS 1.53 SR S1S2 201.6 PS 2.40 SR 1.33 SR 1.79 SR S2S2 262.3 PS 3.12 SR 1.38 SR 2.33 SR S3S2 309.8 PS 3.69 SR 1.40 SR 2.76 SR S4S2 327.9 PS 3.90 SR 1.33 SR 2.92 SR S1S3 190.4 PS 3.78 SR 2.10 SR 2.83 SR S2S3 230.8 PS 4.58 SR 2.02 SR 3.42 SR S3S3 251.1 PS 4.98 SR 1.89 SR 3.72 SR S4S3 254.7 PS 5.05 SR 1.72 SR 3.78 SR
Median 2.62 1.23 1.97 Standard Deviation 1.43 0.48 1.14
Coefficient of Variation (%) 54.58 39.02 57.87
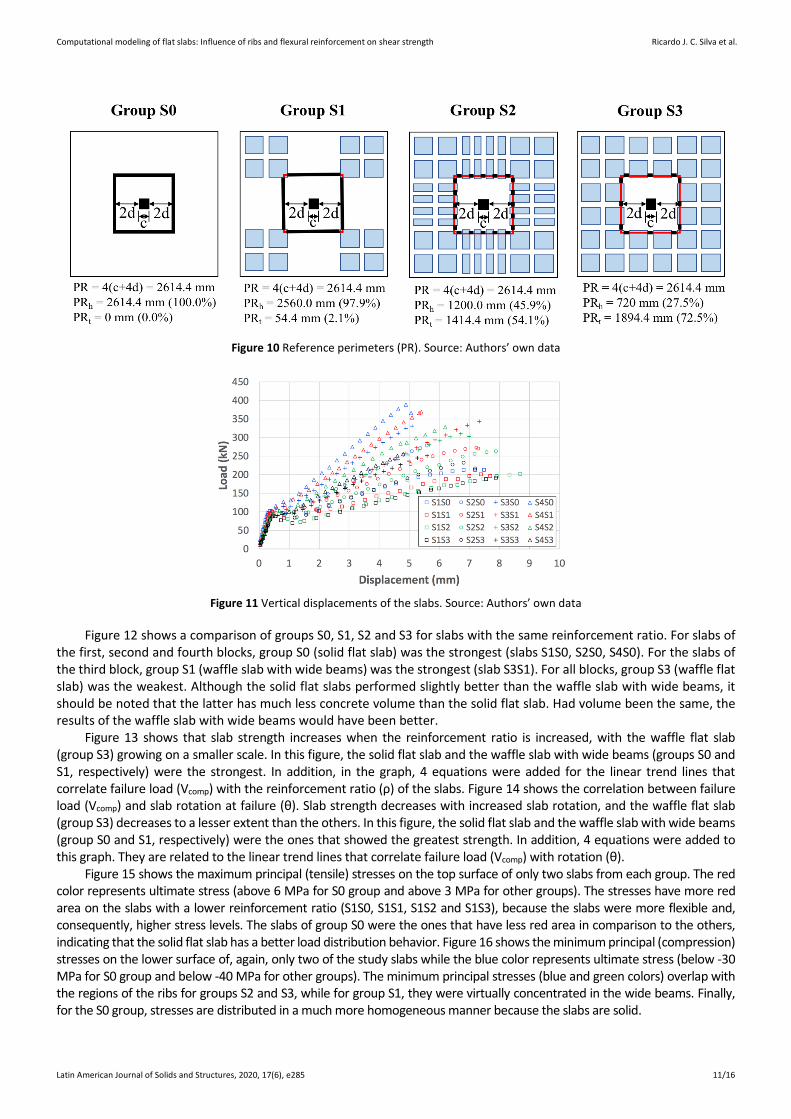
Figure 10 shows the reference perimeter adopted in this research, which corresponds to a square circumscribed in the control perimeter of EC2 or NBR6118. This reference perimeter was used instead of the traditional control perimeter because it is easier to manually quantify the percentage of the perimeter that contains the slab height (PRh) and the percentage of the perimeter that has only the topping slab height of the waffle slab (PRt). The solid flat slab (group S0) and the waffle slab with wide beams (group S1) are the two systems with the highest percentage of PRh, coincidentally, they are the two strongest types of slabs, according to computational results found in this research. In comparison, the flat waffle slab (group S3) is the system with the lowest percentage of PRh, coincidentally, it is the least resistant type of slab according to the computational results of this research. In this way, it can be inferred that in different types of slabs, when the reference perimeter (PR) goes beyond the solid region (PRh), there is a reduction in slab strength. The intention of using slabs with geometry where the reference perimeters (PR) penetrated very little in the area of the ribs was to highlight even more that the estimates of the codes regarding the shear in the ribs (SR) are conservative, as already shown in Table 2. The analyses of the load-displacement curves in Figure 11 show that, as expected, the increase in flexural reinforcement and the higher PRd values provided the slabs with greater strength and stiffness. Thus, the slabs S4S0 and S4S1 are the stiffest and the strongest slabs, and these characteristics were also found to be present in groups S0 and S1. Slab S1S3 was the most flexible and the least resistant.
Computational modeling of flat slabs: Influence of ribs and flexural reinforcement on shear strength Ricardo J. C. Silva et al.
Latin American Journal of Solids and Structures, 2020, 17(6), e285 11/16
Figure 10 Reference perimeters (PR). Source: Authors’ own data
Figure 11 Vertical displacements of the slabs. Source: Authors’ own data
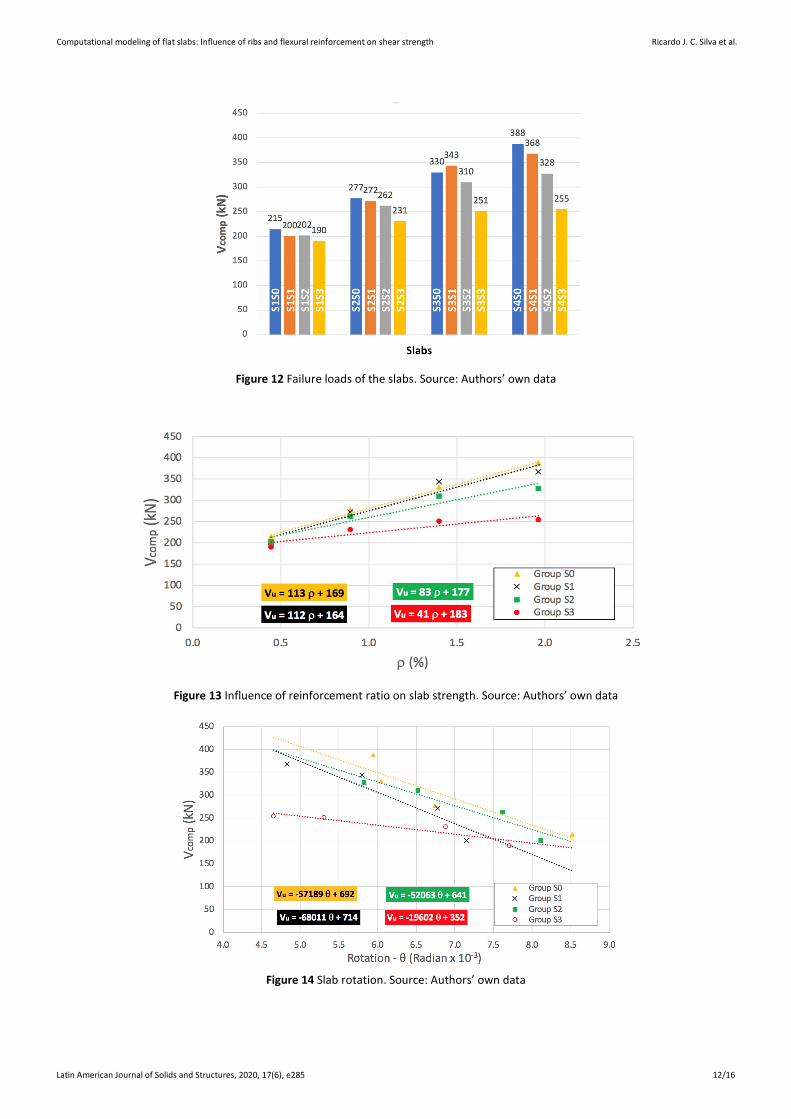
Figure 12 shows a comparison of groups S0, S1, S2 and S3 for slabs with the same reinforcement ratio. For slabs of the first, second and fourth blocks, group S0 (solid flat slab) was the strongest (slabs S1S0, S2S0, S4S0). For the slabs of the third block, group S1 (waffle slab with wide beams) was the strongest (slab S3S1). For all blocks, group S3 (waffle flat slab) was the weakest. Although the solid flat slabs performed slightly better than the waffle slab with wide beams, it should be noted that the latter has much less concrete volume than the solid flat slab. Had volume been the same, the results of the waffle slab with wide beams would have been better.
Figure 13 shows that slab strength increases when the reinforcement ratio is increased, with the waffle flat slab (group S3) growing on a smaller scale. In this figure, the solid flat slab and the waffle slab with wide beams (groups S0 and S1, respectively) were the strongest. In addition, in the graph, 4 equations were added for the linear trend lines that correlate failure load (Vcomp) with the reinforcement ratio (ρ) of the slabs. Figure 14 shows the correlation between failure load (Vcomp) and slab rotation at failure (θ). Slab strength decreases with increased slab rotation, and the waffle flat slab (group S3) decreases to a lesser extent than the others. In this figure, the solid flat slab and the waffle slab with wide beams (group S0 and S1, respectively) were the ones that showed the greatest strength. In addition, 4 equations were added to this graph. They are related to the linear trend lines that correlate failure load (Vcomp) with rotation (θ).
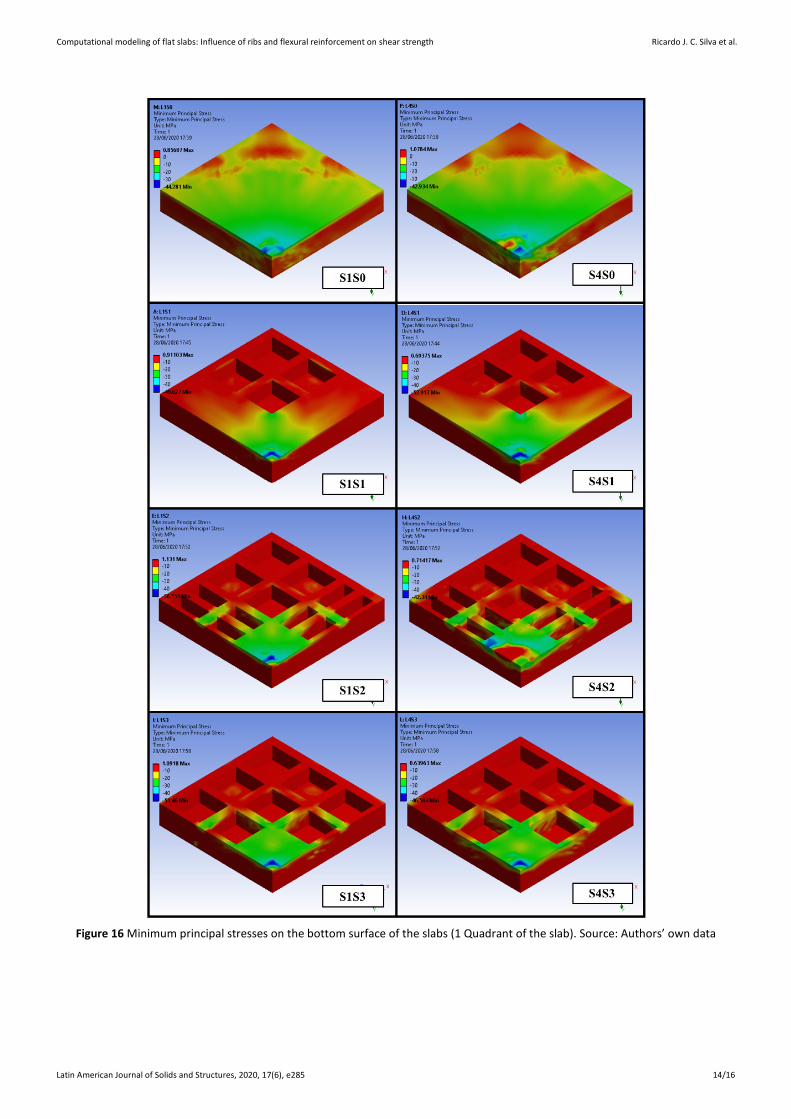
Figure 15 shows the maximum principal (tensile) stresses on the top surface of only two slabs from each group. The red color represents ultimate stress (above 6 MPa for S0 group and above 3 MPa for other groups). The stresses have more red area on the slabs with a lower reinforcement ratio (S1S0, S1S1, S1S2 and S1S3), because the slabs were more flexible and, consequently, higher stress levels. The slabs of group S0 were the ones that have less red area in comparison to the others, indicating that the solid flat slab has a better load distribution behavior. Figure 16 shows the minimum principal (compression) stresses on the lower surface of, again, only two of the study slabs while the blue color represents ultimate stress (below -30 MPa for S0 group and below -40 MPa for other groups). The minimum principal stresses (blue and green colors) overlap with the regions of the ribs for groups S2 and S3, while for group S1, they were virtually concentrated in the wide beams. Finally, for the S0 group, stresses are distributed in a much more homogeneous manner because the slabs are solid.
Computational modeling of flat slabs: Influence of ribs and flexural reinforcement on shear strength Ricardo J. C. Silva et al.
Latin American Journal of Solids and Structures, 2020, 17(6), e285 12/16
Figure 12 Failure loads of the slabs. Source: Authors’ own data
Figure 13 Influence of reinforcement ratio on slab strength. Source: Authors’ own data
Figure 14 Slab rotation. Source: Authors’ own data

Computational modeling of flat slabs: Influence of ribs and flexural reinforcement on shear strength Ricardo J. C. Silva et al.
Latin American Journal of Solids and Structures, 2020, 17(6), e285 13/16
Figure 15 Maximum principal stresses on the top surface of the slabs (1 Quadrant of the slab). Source: Authors’ own data
Computational modeling of flat slabs: Influence of ribs and flexural reinforcement on shear strength Ricardo J. C. Silva et al.
Latin American Journal of Solids and Structures, 2020, 17(6), e285 14/16
Figure 16 Minimum principal stresses on the bottom surface of the slabs (1 Quadrant of the slab). Source: Authors’ own data

Computational modeling of flat slabs: Influence of ribs and flexural reinforcement on shear strength Ricardo J. C. Silva et al.
Latin American Journal of Solids and Structures, 2020, 17(6), e285 15/16
5 CONCLUSIONS
This paper presented and discussed theoretical computational results found for 16 solid flat slabs and waffle slabs. It was found that the solid flat slabs (group S0), as well as the waffle slabs with wide beams (group S1), were the strongest, while the waffle flat slabs (group S3) had the worst performance. In general, EC2 was the code that best estimated the failure loads of the slabs, compared to the American and Brazilian codes. However, all codes were extremely conservative when estimating rib strength. For the solid slabs, the American code showed the best results, on average, while the other codes overestimated slab strength. Increasing the reinforcement ratio increased ultimate strength and stiffness of the slabs in the computational models, reducing their rotations. However, further computational and experimental analyses are needed to draw more comprehensive conclusions.
Author Contribuitions: Conceptualization, DRC Oliveira, RJC Silva and NGB Albuquerque; Methodology, RJC Silva, NGB Albuquerque and PVP Sacramento; Software, RJC Silva and FES Silva Júnior; Writing – original draft, RJC Silva, NGB Albuquerque, FES Silva Júnior and PVP Sacramento; Writing – review & editing, DRC Oliveira; Supervision, DRC Oliveira.
Editor: Marcílio Alves.
References
Al-Bayati, A. F., Lau, T. L., Clark, L. A. (2015). Concentric punching shear of waffle slab. ACI Structural Journal. v. 112, no 5, pg. 533-542.
Al-Bayati, A. F., Lau, T. L. Clark, L. A. (2018). Eccentric punching shear of waffle slab. ACI Structural Journal. v. 115, no 1, pg. 163-174.
Albuquerque, N. G. B. (2009). Análise experimental de lajes lisas nervuradas de concreto armado com região maciça de geometria variável ao puncionamento. Dissertação de Mestrado. Universidade Federal do Pará, Instituto de Tecnologia, Belém, Pará.
American Concrete Institute – ACI 318M (2019): Building Code Requirements for Structural Concrete and Commentary. Farmington Hills, Michigan.
Ansys (2013a). Ansys Composite PrepPost User’s Guide [Manual], Release 15.0. Canosburg, Pensilvania.
Ansys (2013b). Ansys Mechanical APDL Material Reference [Manual], Release 15.0. Canosburg, Pensilvania.
Arunkumar, C., Saketh, K., Senthil, S. S., Jeyashree, T. M. (2018). Behaviour of punching shear in normal RC slab and waffle slab. Asian Journal of Civil Engineering. v. 19, no 1, pg. 27-33.
Bompa, D. V., Onet, T. (2016). Punching shear strength of rc flat slabs at interior connections to columns. Magazine of Concrete Research, v.68, n.01, p.24-42.
Brazilian Association of Technical Standards (ABNT, 2014). NBR 6118: Design of concrete structures – procedure. ABNT, Rio de Janeiro.
European Committee for Standardization (CEN, 2004). Eurocode 2: Design of Concrete Structures – Part 1-1: General Rules and Rules for Buildings. CEN, Brussels.
International Federation for Structural Concrete (FIB, 2011). FIB Model Code for concrete structures 2010. FIB, Lausanne.
Kinnunen, S., Nylander, H. (1960). Punching of Concrete Slabs Without Shear Reinforcement. Transactions of the Royal Institute of Technology, No. 158, Stockholm, Sweden, 112 pp.
Muttoni, A. (2008). Punching Shear Strength of Reinforced Concrete Slabs without Transverse Reinforcement, ACI Structural Journal, V. 105, No. 4, pp. 440-450.
Ramos A.M.P. (2003). Punçoamento em lajes fungiformes pré-esforçadas. Tese de Doutorado. Instituto Superior Técnico, Universidade Técnica de Lisboa, Lisboa, Portugal.
Regan, P. E. (1981). Behavior of reinforced concrete flat slabs. Report 89, Construction Industry Research and Information Association (CIRIA); London, Feb. 1981, p 89.

Computational modeling of flat slabs: Influence of ribs and flexural reinforcement on shear strength Ricardo J. C. Silva et al.
Latin American Journal of Solids and Structures, 2020, 17(6), e285 16/16
Regan, P. E. (1986). Symmetric Punching of Reinforced Concrete Slabs. Magazine of Concrete Research, V. 38, No. 136, pp 115-128.
Regan, P. E., Bræstrup, M. W. (1985). Punching Shear in Reinforced Concrete. Comité Euro-International du Béton, Bulletin d›Information, No. 168, 232 pp.
Sacramento, P. V. P., Picanço, M. S., Oliveira, D. R. C. (2018). Lajes nervuradas de concreto armado com viga-faixa. Revista Ibracon de Estruturas e Materiais – RIEM (in Portuguese). v. 11, no 5, 981-996.
Silva, R. J. C., Cabral, A. E. B., Silva Júnior, F. E. S., Vasconcelos Filho, J.L.L., Eugenio, D.E.F. (2019). Analysis of reinforced concrete beams strengthened with different CFRP lengths. Acta Scientiarum. Technology, 42, 1-10.
Willam, K. J., Warnke, E. P. (1974). Constitutive model for the triaxial behaviour of concrete. Proceedings of International Association for Bridge and Structural Engineering, Bergamo, Itália.