computational modeling of mirna biogenesis
TRANSCRIPT
Computational modeling of miRNA Biogenesis
Brian Caffrey and Annalisa Marsico
Abstract Over the past few years it has been observed, thanks in no small partto high-throughput methods, that a large proportion of the human genome is tran-scribed in a tissue- and time-specific manner. Most of the detected transcriptsare non-coding RNAs and their functional consequences are not yet fully under-stood. Among the different classes of non-coding transcripts, microRNAs (miR-NAs) are small RNAs that post-transcriptionally regulate gene expression. Despitegreat progress in understanding the biological role of miRNAs, our understandingof how miRNAs are regulated and processed is still developing. High-throughputsequencing data have provided a robust platform for transcriptome-level, as wellas gene-promoter analyses. In silico predictive models help shed light on the tran-scriptional and post-transcriptional regulation of miRNAs, including their role ingene regulatory networks. Here we discuss the advances in computational methodsthat model different aspects of miRNA biogeneis, from transcriptional regulation topost-transcriptional processing. In particular, we show how the predicted miRNApromoters from PROmiRNA, a miRNA promoter prediction tool, can be used toidentify the most probable regulatory factors for a miRNA in a specific tissue. Asdifferential miRNA post-transcriptional processing also affects gene-regulatory net-works, especially in diseases like cancer, we also describe a statistical model pro-posed in the literature to predict efficient miRNA processing from sequence features.
Brian CaffreyMax Planck Institute for Molecular Genetics, Ihnestrasse 63-73 14195 Berlin, e-mail: [email protected]
Annalisa MarsicoMax Planck Institute for Molecular Genetics, Ihnestrasse 63-73 14195 Berlin, e-mail: [email protected]
1
2 Brian Caffrey and Annalisa Marsico
1 The role of miRNAs in gene-regulatory networks
In biological research, diverse high-throughput techniques enable the investigationof whole systems at the molecular level. One of the main challenges for computa-tional biologists is the integrated analysis of gene expression, interactions betweengenes and the associated regulatory mechanisms. The two most important types ofregulators, Transcription Factors (TFs) and microRNA (miRNAs) often cooperatein complex networks at the transcriptional level and at the post-transcriptional level,thus enabling a combinatorial and highly complex regulation of cellular processes[1].
While TFs regulate genes at the transcriptional level by binding to proximal ordistal regulatory elements within gene promoters[1], microRNAs (miRNAs) act atthe post-transcriptional level on roughly half of the human genes. These short non-coding RNAs of 18 to 24 nucleotides in length which can bind to the 3’-untranslatedregions (3’ UTRs) or coding regions of target genes, leading to the degradation oftarget mRNAs or translational repression [2].
MiRNAs are associated with an array of biological processes, such as embryonicdevelopment and stem cell functions in mammals [3], and a crucial role of miRNAsin gene regulatory networks has been recognized in the last decade in the contextof cancer and other diseases [5]. Altered miRNA expression profiles have oftenbeen associated with cancer development, progression and prognosis [6]. MiRNAswhich negatively regulate tumor suppressor genes can be amplified in associationwith cancer development. On the other hand, deletions or mutations in miRNAstargeting oncogenes can lead to the over-expression of their targets [5, 6].
MiRNAs also affect several aspects of the immune system response [7]. For ex-ample, cells of the hematopoietic system can be distinguished from other tissues bytheir miRNA expression profiles, including, among the others, the highly expressedmiRNA hsa-miR-155 [7]. Other immune system-related miRNAs are activated inresponse to viral or bacterial infections (e.g. hsa-miR-146a) and they affect the ex-pression of several cytokines downstream [8].
Given the growing prevalence of miRNA functions in contributing to the con-trol of gene expression, gene regulatory networks have been expanded to becomerather complex incorporating the involvement of miRNAs. The general frameworkfor inferring gene regulatory networks involving Transcription Factors (TFs) andmiRNAs is usually built using the following steps:
• 1: When expression data are available under a certain condition, the first step isto identify those genes which are mostly expressed in that particular condition orde-regulated compared to a control experiment.
• 2: miRNAs responsible for the observed co-expression or de-regulation of a setof genes are identified by identifying enriched miRNA binding sites in the 3’-UTRs of such genes. This is usually done by mining publicly available databasesfor miRNA-target interactions [9, 10].
• 3: MiRNA-target interactions are filtered based on the miRNA expression level(when available) or by using a cutoff score indicating the reliability of the pre-
Computational modeling of miRNA Biogenesis 3
dicted interaction. In addition, it is expected that when a miRNA regulates agene, the miRNA and the gene show typical correlated expression patterns acrossmultiple samples. This can be used as a criterium to further filter miRNA-geneinteractions which do not show any such correlation [9].
• 4: TFs regulating this set of genes can be inferred by means of prediction al-gorithms which scan for known TF binding sites in the proximal gene promoterregions using Position Weight Matrices (PWMs) [26].
• 5: Protein-Protein interaction databases, such as STRING, BioGrid and KEGGcan be inspected to find possible interactors of such genes and the cellular path-ways that they affect.
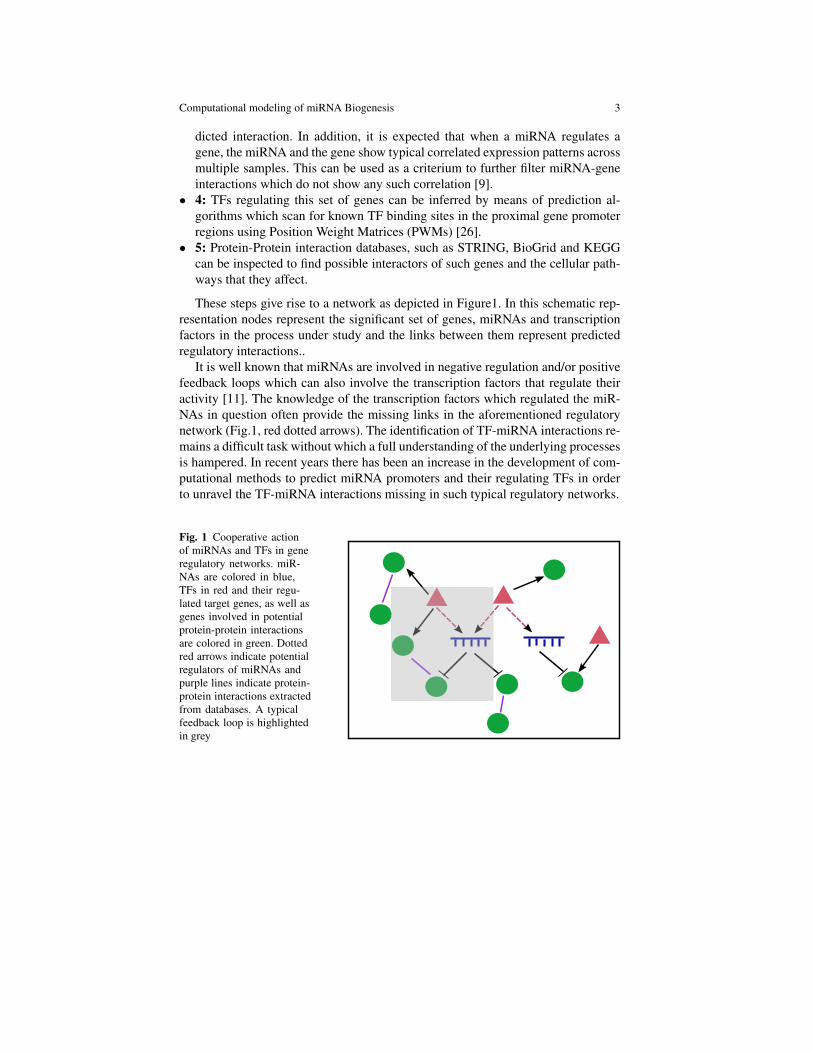
These steps give rise to a network as depicted in Figure1. In this schematic rep-resentation nodes represent the significant set of genes, miRNAs and transcriptionfactors in the process under study and the links between them represent predictedregulatory interactions..
It is well known that miRNAs are involved in negative regulation and/or positivefeedback loops which can also involve the transcription factors that regulate theiractivity [11]. The knowledge of the transcription factors which regulated the miR-NAs in question often provide the missing links in the aforementioned regulatorynetwork (Fig.1, red dotted arrows). The identification of TF-miRNA interactions re-mains a difficult task without which a full understanding of the underlying processesis hampered. In recent years there has been an increase in the development of com-putational methods to predict miRNA promoters and their regulating TFs in orderto unravel the TF-miRNA interactions missing in such typical regulatory networks.
Fig. 1 Cooperative actionof miRNAs and TFs in generegulatory networks. miR-NAs are colored in blue,TFs in red and their regu-lated target genes, as well asgenes involved in potentialprotein-protein interactionsare colored in green. Dottedred arrows indicate potentialregulators of miRNAs andpurple lines indicate protein-protein interactions extractedfrom databases. A typicalfeedback loop is highlightedin grey
4 Brian Caffrey and Annalisa Marsico
2 MiRNA transcriptional regulation
2.1 Challenges of in silico miRNA promoter identification
MiRNA promoter recognition is a crucial step towards the understanding of miRNAregulation. Knowing the location of the miRNA transcription start site (TSS) enablesthe location of the core promoter, the region upstream of the TSS which containsthe TFs binding sites necessary to initiate and regulate transcription. Predictions ofbinding sites in the core promoter elements can enable the identification of regula-tory factors for a specific miRNA (or a class of miRNAs), greatly improving ourunderstanding of miRNA function, and their role in tissue-specific feedback loops.
Genome-wide identification of miRNA promoters has been hindered for manyyears by two main factors. The first reason is the deficit in mammalian promotersequence characterization, which makes promoter prediction a challenging task ingeneral [12]. Although promoter regions contain short conserved sequence featuresthat distinguish them from other genomic regions, they lack overall sequence sim-ilarity, preventing detection by sequence-similarity-based search methods such asBLAST. Promoter recognition methods in the early 90s exploited the fact that pro-moters contain few specific sequence features or TF binding sites that distinguishthem from other genomic features [12]. This observation could be used to build aconsensus model, such as Position Weight Matrices (PWMs) or Logos to search fornew promoters in the genome. It soon became clear that such methods could notbe generalized to all existing promoters and more advanced strategies for patternrecognition utilized machine learning models trained on sequence k-mers.
The second reason for the lack of knowledge in miRNA transcriptional regula-tion is due to the complexity of the miRNA biogenesis pathway: miRNAs, whetherthey are located in intergenic regions or within introns of protein-coding genes, of-ten referred to as host genes, are generally generated from long primary transcriptswhich are rapidly cleaved in the nucleus by the enzyme Drosha [2]. This presentsa technical barrier for large-scale identification of miRNA TSSs as they can be lo-cated in regions far away from the mature miRNA and cannot be inferred simplyfrom the annotation of the processed mature miRNA, as done for stable protein cod-ing gene transcripts [13]. In addition, the situation is further complicated by the factthat recent studies indicate that several alternative miRNA biogenesis pathways ex-ist, especially for intragenic miRNAs. Indeed, if co-transcription with the host genewere the only mechanism to generate intragenic miRNAs, then the mirna and host-gene expression should be highly correlated among different tissues or conditions.Many recent studies, however, show many instances of poor correlation betweenmirna and host gene, pointing to an independent regulation of the mirna, utilizing analternative intronic promoter [14]. There is evidence that intragenic miRNAs mayact as negative feedback regulatory elements of their hosts interactomes [15] butthe contribution of host gene promoter versus intronic miRNA promoters, and themechanisms that control intronic promoter usage are still interesting open questionsin the biology of miRNA biogenesis.
Computational modeling of miRNA Biogenesis 5
Although overall similarity in promoters is not a general phenomena, it does existin the form of phylogenetic footprinting. Based on this observation, one of the firstmethods for miRNA promoter detection identifies about 60 miRNA transcriptionalstart regions by scanning for highly conserved genomic blocks within 100kb ofeach mature miRNA and searching for a core promoter element in the consensussequence regions extracted from these blocks [16]. Although this method provedto be valid in the identification of evolutionary conserved promoters, given the highnumber of non-conserved miRNAs, the sensitivity of such an evolutionary approachis very low, given the high number of non-conserved miRNAs annotated in MiRBase[17].
2.2 Next Generation Sequencing (NGS) technology leads tosignificant advances in miRNA promoter prediction
Recently, thanks to the advent of next-generation sequencing technologies com-bined with Chromatin Immunoprecipitation (CHIP-Seq technology [18]) and nascenttranscript capturing methods, such as Cap Analysis of Gene Expression coupled toNGS sequencing (deepCAGE) [19] or Global run on sequencing (GRO-seq) [20],several computational methods for miRNA promoter prediction genome-wide havebeen developed, providing valuable understanding in the detailed mechanisms ofmiRNA transcriptional regulation. For example, the epigenetic mark H3K4me3 hasbeen identified as a hallmark of active promoters, and computational methods forpromoter recognition have begun exploiting this information systematically.
The deepCAGE technique enables the mapping of the location of TSSs genome-wide. In the FANTOM4 Consortium this technique was applied across various dif-ferent tissues and conditions in order to profile transcriptional activities and pro-moter usage among different libraries.
GRO-seq is a technique to capture nascent RNAs genome-wide by quantifyingthe signal of transcriptionally engaged PolII at gene promoters. Both deepCAGEand GRO-seq read density is sharply peaked around transcripts TSS and it can besuccessfully used to locate the TSSs of miRNA primary transcripts [13, 21]. Finally,recent RNA-seq studies with increased sequencing depth can also be used to identifythe transient and lowly expressed pri-miRNA transcripts [21].
2.3 Classification and comparison of miRNA promoter predictionmethods
A limited number of miRNA promoter recognition methods have been developedin the past few years and can be classified either according to the methodologyused, supervised versus unsupervised learning approaches, or based on the nature oftheir predictions, tissue specific versus general promoter predictions and intergenic
6 Brian Caffrey and Annalisa Marsico
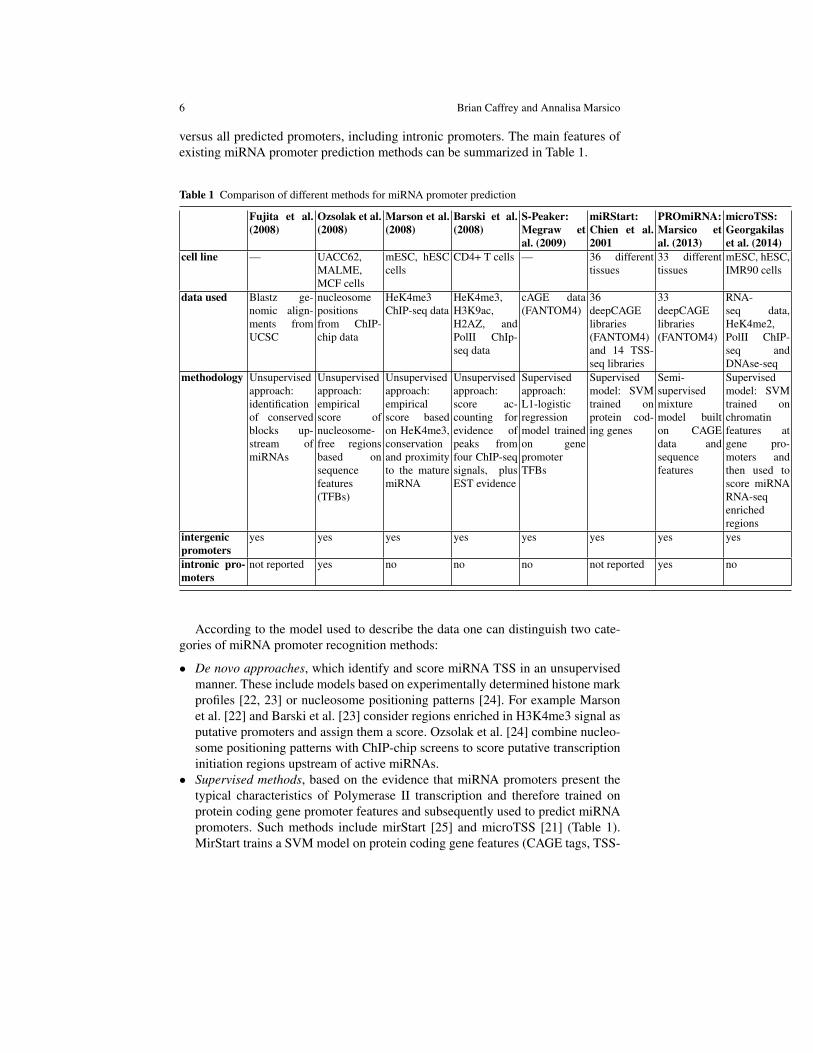
versus all predicted promoters, including intronic promoters. The main features ofexisting miRNA promoter prediction methods can be summarized in Table 1.
Table 1 Comparison of different methods for miRNA promoter prediction
Fujita et al.(2008)
Ozsolak et al.(2008)
Marson et al.(2008)
Barski et al.(2008)
S-Peaker:Megraw etal. (2009)
miRStart:Chien et al.2001
PROmiRNA:Marsico etal. (2013)
microTSS:Georgakilaset al. (2014)
cell line — UACC62,MALME,MCF cells
mESC, hESCcells
CD4+ T cells — 36 differenttissues
33 differenttissues
mESC, hESC,IMR90 cells
data used Blastz ge-nomic align-ments fromUCSC
nucleosomepositionsfrom ChIP-chip data
HeK4me3ChIP-seq data
HeK4me3,H3K9ac,H2AZ, andPolII ChIp-seq data
cAGE data(FANTOM4)
36deepCAGElibraries(FANTOM4)and 14 TSS-seq libraries
33deepCAGElibraries(FANTOM4)
RNA-seq data,HeK4me2,PolII ChIP-seq andDNAse-seq
methodology Unsupervisedapproach:identificationof conservedblocks up-stream ofmiRNAs
Unsupervisedapproach:empiricalscore ofnucleosome-free regionsbased onsequencefeatures(TFBs)
Unsupervisedapproach:empiricalscore basedon HeK4me3,conservationand proximityto the maturemiRNA
Unsupervisedapproach:score ac-counting forevidence ofpeaks fromfour ChIP-seqsignals, plusEST evidence
Supervisedapproach:L1-logisticregressionmodel trainedon genepromoterTFBs
Supervisedmodel: SVMtrained onprotein cod-ing genes
Semi-supervisedmixturemodel builton CAGEdata andsequencefeatures
Supervisedmodel: SVMtrained onchromatinfeatures atgene pro-moters andthen used toscore miRNARNA-seqenrichedregions
intergenicpromoters
yes yes yes yes yes yes yes yes
intronic pro-moters
not reported yes no no no not reported yes no
According to the model used to describe the data one can distinguish two cate-gories of miRNA promoter recognition methods:
• De novo approaches, which identify and score miRNA TSS in an unsupervisedmanner. These include models based on experimentally determined histone markprofiles [22, 23] or nucleosome positioning patterns [24]. For example Marsonet al. [22] and Barski et al. [23] consider regions enriched in H3K4me3 signal asputative promoters and assign them a score. Ozsolak et al. [24] combine nucleo-some positioning patterns with ChIP-chip screens to score putative transcriptioninitiation regions upstream of active miRNAs.
• Supervised methods, based on the evidence that miRNA promoters present thetypical characteristics of Polymerase II transcription and therefore trained onprotein coding gene promoter features and subsequently used to predict miRNApromoters. Such methods include mirStart [25] and microTSS [21] (Table 1).MirStart trains a SVM model on protein coding gene features (CAGE tags, TSS-
Computational modeling of miRNA Biogenesis 7
Seq and HeK4me3 ChIP-Seq data), and uses the trained model to identify pu-tative miRNA promoters [25]. microTSS also uses a combination of three SVMmodels trained on HEK4me3 and PolII occupancy at protein-coding gene pro-moters to score putative initial miRNA TSSs candidates derived from deeplysequenced RNA-Seq data [21].
One of the latest miRNA promoter prediction tools, PROmiRNA, is a methodin between these two categories [13]. PROmiRNA is based on a semi-supervisedclassification model which does not make any assumption about the nature ofmiRNA promoters and their similarities to protein-coding genes. On the contrary,PROmiRNA tries to learn the separation between putative miRNA promoters andtranscriptional noise based on few features, such as CAGE tag clusters upstream ofannotated miRNAs and sequence features.
Each of the described methods has advantages and disadvantages. Methods formiRNA promoter recognition based solely on sequence features, such as the evo-lutionary framework proposed by Fujita et al. [16] or S-Peaker [27], based on TFbinding sites and proposed by Megraw et al., are very accurate in identifying pu-tative promoter regions. MiRNAs are, however, known to mediate gene regulationin a highly tissue-specific manner, therefore it is expected that their regulation alsohappens in a tissue-specific way. Such methods cannot distinguish between pro-moters potentially active in different tissues, given that sequence features are in-variant features, but merely suggest possible locations for miRNA promoters. Onthe other hand, methods based on chromatin features have been designed for spe-cific cell lines, therefore providing a snapshot of the active promoters. Histonemark-based methods provide a broad view of promoter regions, rather than high-resolution predictions, hampering the detection of multiple TSSs close to each otherin the genome. In addition, most chromain-base methods can predict the promotersof independently transcribed intergenic miRNAs, but lack sensitivity in discoveringalternative or intronic promoters.
MicroTSS overcomes the problem of the non-informative broad predictions bymaking use of deep-coverage RNA-seq data and pre-selecting RNA-seq islands oftranscription upstream of intergenic pre-miRNAs at single-nucleotide resolution.Such initial miRNA promoter candidates are then given as input to the SVM modelwhich returns the predictions. Due to the nature of the RNA-seq used to pre-selectcandidate TSSs, microTSS works well for intergenic miRNAs but is not suitable foridentifying intronic promoters due to the difficulty in discriminating transcriptioninitiation events from the read coverage signal corresponding to the host transcript.
The method from Ozsolak et al. [24] and PROmiRNA [13] are the only twomethodologies which report predictions of intronic promoters. In particular, inPROmiRNA miRNA promoter predictions are derived from multiple high-coveragedeepCAGE libraries, and correspond to highly expressed, as well as lowly expressedtissue-specific intronic promoters.
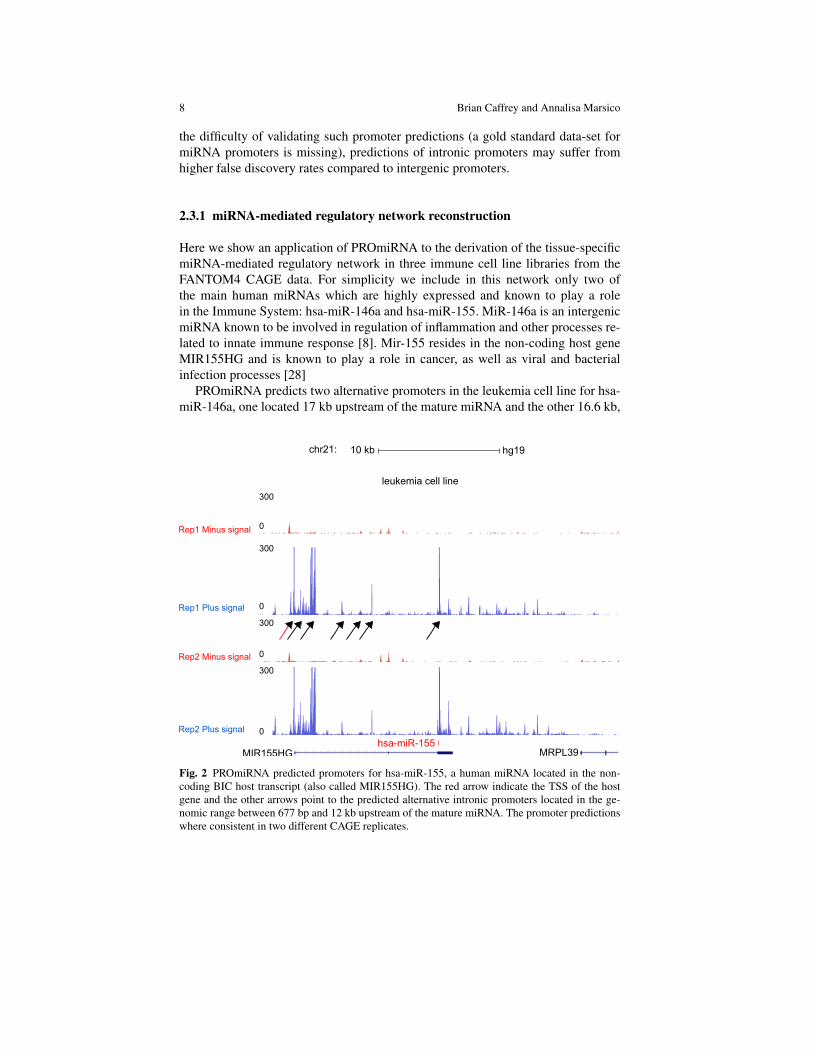
Fig.2 shows seven predicted TSSs for hsa-miR-155, six of which are intronicpromoters in a leukemia cell line, indicating that alternative promoters are able todrive the expression of this miRNA in this cell line. However, due to the low ex-pression of alternative intronic promoters, compared to intergenic promoters, and to
8 Brian Caffrey and Annalisa Marsico
the difficulty of validating such promoter predictions (a gold standard data-set formiRNA promoters is missing), predictions of intronic promoters may suffer fromhigher false discovery rates compared to intergenic promoters.
2.3.1 miRNA-mediated regulatory network reconstruction
Here we show an application of PROmiRNA to the derivation of the tissue-specificmiRNA-mediated regulatory network in three immune cell line libraries from theFANTOM4 CAGE data. For simplicity we include in this network only two ofthe main human miRNAs which are highly expressed and known to play a rolein the Immune System: hsa-miR-146a and hsa-miR-155. MiR-146a is an intergenicmiRNA known to be involved in regulation of inflammation and other processes re-lated to innate immune response [8]. Mir-155 resides in the non-coding host geneMIR155HG and is known to play a role in cancer, as well as viral and bacterialinfection processes [28]
PROmiRNA predicts two alternative promoters in the leukemia cell line for hsa-miR-146a, one located 17 kb upstream of the mature miRNA and the other 16.6 kb,
MIR155HGhsa-miR-155
MRPL39
10 kb hg19chr21:
leukemia cell line
Rep1 Minus signal
Rep2 Minus signal
Rep1 Plus signal
Rep2 Plus signal
0
300
300
300
0
0
0
300
Fig. 2 PROmiRNA predicted promoters for hsa-miR-155, a human miRNA located in the non-coding BIC host transcript (also called MIR155HG). The red arrow indicate the TSS of the hostgene and the other arrows point to the predicted alternative intronic promoters located in the ge-nomic range between 677 bp and 12 kb upstream of the mature miRNA. The promoter predictionswhere consistent in two different CAGE replicates.
Computational modeling of miRNA Biogenesis 9
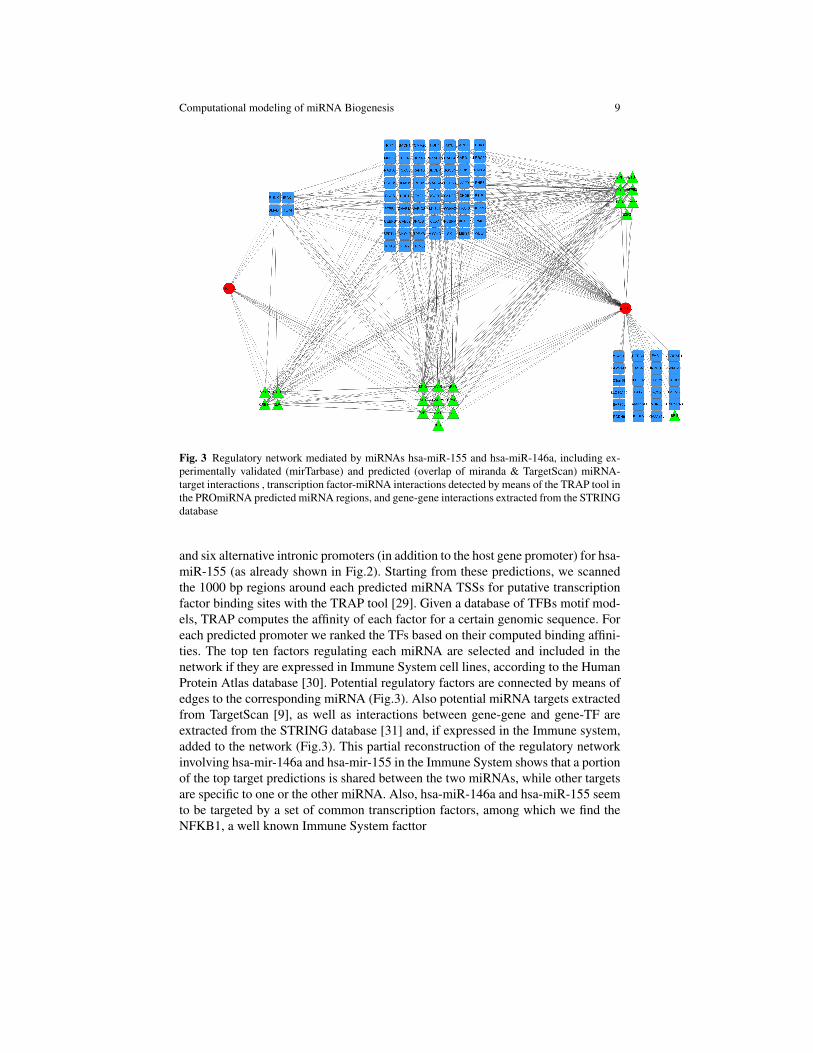
Fig. 3 Regulatory network mediated by miRNAs hsa-miR-155 and hsa-miR-146a, including ex-perimentally validated (mirTarbase) and predicted (overlap of miranda & TargetScan) miRNA-target interactions , transcription factor-miRNA interactions detected by means of the TRAP tool inthe PROmiRNA predicted miRNA regions, and gene-gene interactions extracted from the STRINGdatabase
and six alternative intronic promoters (in addition to the host gene promoter) for hsa-miR-155 (as already shown in Fig.2). Starting from these predictions, we scannedthe 1000 bp regions around each predicted miRNA TSSs for putative transcriptionfactor binding sites with the TRAP tool [29]. Given a database of TFBs motif mod-els, TRAP computes the affinity of each factor for a certain genomic sequence. Foreach predicted promoter we ranked the TFs based on their computed binding affini-ties. The top ten factors regulating each miRNA are selected and included in thenetwork if they are expressed in Immune System cell lines, according to the HumanProtein Atlas database [30]. Potential regulatory factors are connected by means ofedges to the corresponding miRNA (Fig.3). Also potential miRNA targets extractedfrom TargetScan [9], as well as interactions between gene-gene and gene-TF areextracted from the STRING database [31] and, if expressed in the Immune system,added to the network (Fig.3). This partial reconstruction of the regulatory networkinvolving hsa-mir-146a and hsa-mir-155 in the Immune System shows that a portionof the top target predictions is shared between the two miRNAs, while other targetsare specific to one or the other miRNA. Also, hsa-miR-146a and hsa-miR-155 seemto be targeted by a set of common transcription factors, among which we find theNFKB1, a well known Immune System facttor
10 Brian Caffrey and Annalisa Marsico
3 Predictive Models of miRNA processing
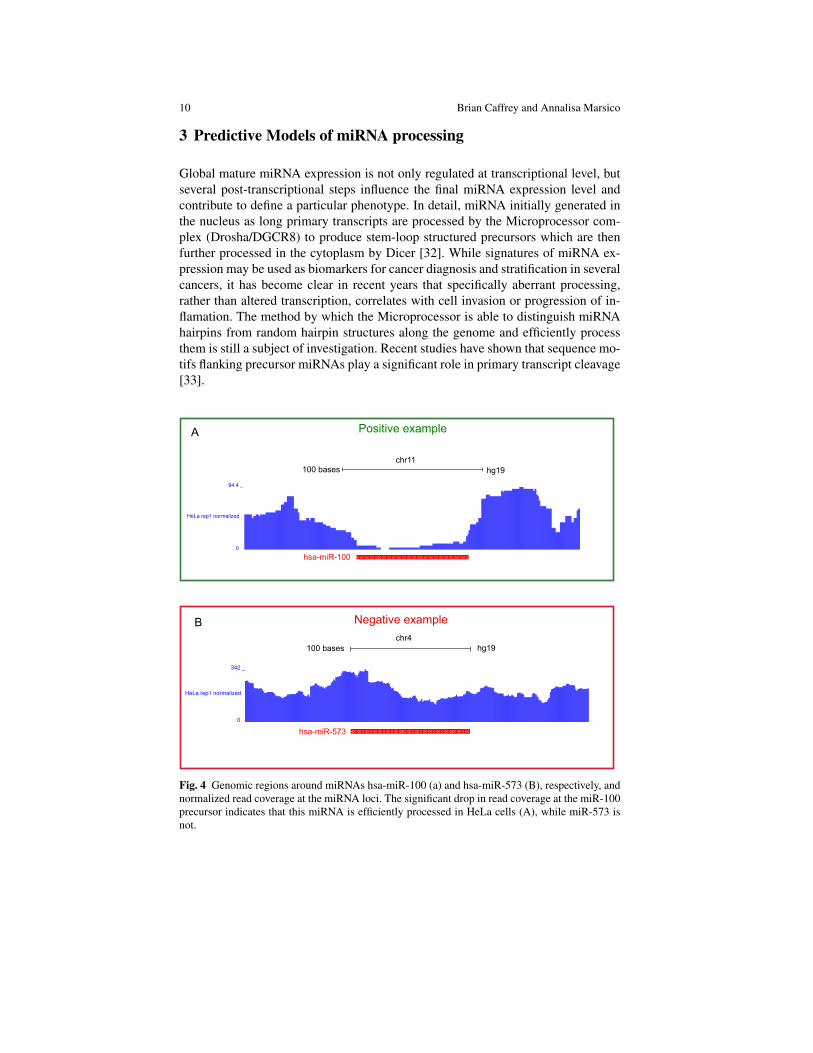
Global mature miRNA expression is not only regulated at transcriptional level, butseveral post-transcriptional steps influence the final miRNA expression level andcontribute to define a particular phenotype. In detail, miRNA initially generated inthe nucleus as long primary transcripts are processed by the Microprocessor com-plex (Drosha/DGCR8) to produce stem-loop structured precursors which are thenfurther processed in the cytoplasm by Dicer [32]. While signatures of miRNA ex-pression may be used as biomarkers for cancer diagnosis and stratification in severalcancers, it has become clear in recent years that specifically aberrant processing,rather than altered transcription, correlates with cell invasion or progression of in-flamation. The method by which the Microprocessor is able to distinguish miRNAhairpins from random hairpin structures along the genome and efficiently processthem is still a subject of investigation. Recent studies have shown that sequence mo-tifs flanking precursor miRNAs play a significant role in primary transcript cleavage[33].
N L P
HeLa rep1 normalized
94.4 _
0 _
chr11hg19100 bases
hsa-miR-100
Positive example
HeLa rep1 normalized
342 _
0 _
100 bases hg19
hsa-miR-573
Negative example
A
Bchr4
Fig. 4 Genomic regions around miRNAs hsa-miR-100 (a) and hsa-miR-573 (B), respectively, andnormalized read coverage at the miRNA loci. The significant drop in read coverage at the miR-100precursor indicates that this miRNA is efficiently processed in HeLa cells (A), while miR-573 isnot.
Computational modeling of miRNA Biogenesis 11
In a recent study [34] we have quantified the effect of different sequence mo-tifs on the Microprocessor activity in an endogenous setting. We have performedhigh-throughput RNA sequencing experiments of nascent transcripts associated tothe chromatin fraction in different cell lines. Since processing of primary miRNAtranscripts occurs co-transcriptionally, while the transcript is still associated to chro-matin, the read coverage pattern at miRNA loci shows the typical Microprocessorsignature, where Drosha cleavage is reflected in a significant drop in the read cov-erage in the precursor region. We have defined a quantitative measure of processingefficiency called Microprocessing Index (MPI), as the logarithm of the ratio betweenthe read density adjacent to the pre-miRNA and the read density in the precursorregion. On the basis of MPI values, miRNA could be divided into efficiently pro-cessed (Fig. 4A MPI <= −1.0, also called positive examples) and non-efficientlyprocessed (Fig. 4B MPI >=−0.4, also called negative examples). A classificationmodel based on sequence features was built in order to discriminate between thesetwo classes. We used L1-regularized logistic regression for training and classifica-tion of the miRNA in positives and negatives. In detail, given a binary variable Y,where yi = 0 or yi = 1 for each data point i, the probability of the outcome of Y,given the data X, is given by the following sigmoid function:
P(y = 1|x,θ) = 11+ exp(−θ T x)
(1)
where θ is the parameter vector of the logistic regression model. The optimizationproblem (Maximum Likelihood Estimate of θ ) in the case of L1-regularization isformulated as the following:
minθ (M
∑i=1−logP(yi|xi,θ)+β‖θ‖1) (2)
In our case the features used in the model were either dinucleotide counts(dinucleotide-based model) or counts of short motifs (motif-based model) in theregions upstream and downstream of miRNA precursors. L1-regularized logisticregression performs automatic feature selection penalizing dinucleotides or motifswhich are not significant in distinguishing efficiently processed miRNAs from non-efficiently processed. We found that the most important features associated withenhanced processing are: a GNNU motif (N indicates any nucleotide) directly up-stream of the 5’ of the miRNA, a CNNC motif between 17 and 21 positions down-stream of 3’ of the miRNAs and dinucleotides GC and CU enriched at the base ofthe miRNA stem loop.
4 Conclusions
In silico methods for studying miRNA biogenesis, ranging from statistical modelsof promoter recognition and transcription factor binding site prediction to predictive
12 Brian Caffrey and Annalisa Marsico
models of miRNA processing, enable a better understanding of miRNA-mediatedregulation in tissue-specific networks. Recent progress in the field of NGS resultedin a plethora of high-throughput and high-quality datasets in the last few years. Thisenabled the development of data-driven computational approaches which make useof such data and combine them with traditional sequence signals, in order to getmore accurate prediction of miRNA promoters. Although the basics of the miRNAbiogenesis pathway are known, there are still many unsolved questions. For exam-ple, several regulatory factors might be involved in miRNA regulation at differentlevels. Although some regulators of miRNA transcription and processing have beenpredicted and experimentally validated, more sophisticated in silico methods areneeded to discover more of these factors and predict how they affect miRNA bio-genesis.
RNA binding proteins interact with both pri-miRNAs in addition to intermediatemiRNA products at different stages of their regulation. High-throughput sequencingof RNA sites bound by a particular protein will reveal more aspects about miRNAregulation, as well as enable more reliable identification of targets which are physi-ologically relevant.
Although observations from different sources need to be unified in a coherentframework, it is clear that targeted computational approaches can help linking dif-ferent evidence from several genomic datasets and give a significant contribution todiscover additional details about miRNA-mediated regulation.
References
1. Guo, Z.: Genome-wide survey of tissue-specific microRNA and transcription factor regula-tory networks in 12 tissues. Sci. Rep. 4, 5150 (2014)
2. Davis, B.N.: Regulation of MicroRNA Biogenesis: A miRiad of mechanisms. Cell Commun.Signal 10, 7—18 (2014)
3. Bartel, D.P.: MicroRNAs: target recognition and regulatory functions. Cell 136, 215—233(2009)
4. Plaisier, C.L.: A miRNA-regulatory network explains how dysregulated miRNAs perturboncogenic processes across diverse cancers. Genome Res 22, 2302—2314 (2012)
5. Esquela-Kerscher, A.: Oncomirs - microRNAs with a role in cancer. Nat Rev Cancer 6, 259—269 (2006)
6. Takahashi, R.U.: The role of microRNAs in the regulation of cancer stem cells. Front Genet4, 295 (2014)
7. Davidson-Moncada, J.: MicroRNAs of the immune system: roles in inflammation and cancer.Ann N Y Acad Sci 1183, 183—194 (2010)
8. Ma, X.: MicrorNAs in NF-kappaB signaling. J Mol Cell Biol 3, 159—166 (2011)9. Lewis, B.P.: Conserved seed pairing, often flanked by adenosines, indicates that thousands of
human genes are microRNA targets. Cell 120, 15—20 (2005)10. Betel, D.: Comprehensive modeling of microRNA targets predicts functional non-conserved
and non-canonical sites. Genome Biol 11, R90 (2010)11. Krol, J.: The widespread regulation of microRNA biogenesis, function and decay. Nar Rev
Genet 11, 597—610 (2010)12. Fickett, J.: Eukaryotic Promoter Recognition. Genome Res 7, 861—878 (1997)13. Marsico, A.: PROmiRNA: a new miRNA promoter recognition method uncovers the complex
regulation of intronic miRNAs. Genome Biol 14, R84 (2013)
Computational modeling of miRNA Biogenesis 13
14. Monteys, A.M.: Structure and activity of putative intronic miRNA promoters. RNA 16, 495—505 (2010)
15. Hinske, L.C.: A potential role for intragenic miRNAs on their hosts’ interactome. BMC Ge-nomics 11, 533 (2010)
16. Fujita, S.: Putative promoter regions of miRNA genes involved in evolutionarily conservedregulatory systems among vertebrates. Bioinformatics 24, 303-308 (2008)
17. Kozomara, A.: miRBase: integrating microRNA annotation and deep-sequencing data. Nu-cleic Acids Res 39, D152-D157 (2011)
18. Kozomara, A.: ChIP-seq: advantages and challenges of a maturing technology. Net Rev Genet10, 669-680 (2009)
19. de Hoon, M.: Deep cap analysis gene expression (CAGE): genome-wide identification ofpromoters, quantification of their expression, and network inference. Biotechniques 44, 627-628 (2008)
20. Core, L.J.: Nascent RNA sequencing reveals widespread pausing and divergent initiation athuman promoters. Science 322, 1845-1848 (2008)
21. Georgakilas, G.: microTSS: accurate microRNA transcription start site identification revealsa significant number of divergent pri-miRNAs. Nat Commun 10, 5700 (2014)
22. Barski, A.: Connecting microRNA genes to the core transcriptional regulatory circuitry ofembryonic stem cells. Cell 134, 521—533 (2008)
23. Barski, A.: Chromatin poises miRNA- and protein-coding genes for expression. Genome Res19, 1742—1751 (2009)
24. Ozsolak, F.: Chromatin structure analyses identify miRNA promoters. Gene Dev 22, 3172—3183 (2008)
25. Chien, C.H. : Identifying transcriptional start sites of human microRNAs based on high-throughput sequencing data. Nucleic Acids Res 39, 9345—9356 (2011)
26. Sandelin, A.: JASPAR: an open-access database for eukaryotic transcription factor bindingprofiles Nucl. Acids Res. (2004) 32 D91-D94. doi: 10.1093/nar/gkh012
27. Megraw, M. : A transcription factor affinity-based code for mammalian transcription initia-tion. Genome Res 19, 644—656 (2009)
28. Eis, P. : Accumulation of miR-155 and BIC RNA in human B cell lymphomas. Prot Natl AcadSci 102, 3627—3632 (2003)
29. Thomas-Chollier, M. : Transcription factor binding predictions using TRAP for the analysisof ChIP-seq data and regulatory SNPs. Nat Protoc 102, 3627—3632 (2003)
30. Uhlen, M. : Tissue-based map of the human proteome. Science 347, 1260419 (2015)31. Szklarczyk, D. : The STRING database in 2011: functional interaction networks of proteins,
globally integrated and scored. Nucleic Acid Res 39, D561-568 (2011)32. Ha, M. : Regulation of microRNA biogenesis. Nat Rev Mol Cell Biol 15, 509-524 (2014)33. Auyeung, V.C. : Beyond secondary structure: primary-sequence determinants license pri-
miRNA hairpins for processing. Cell 152, 844-858 (2013)34. Conrad, T. : Microprocessor activity controls differential miRNA biogenesis In Vivo. Cell
Rep 9, 542-554 (2014)