computational simulation of buses accident … · the seat belt, although 68% ... laboratory for...
TRANSCRIPT

COMPUTATIONAL SIMULATION OF BUSES ACCIDENT WITH BIOMECHANICAL MODELS, INJURY’ ANALYSIS AND SEAT BELT ROLE
ANA FILIPA DO ROSÁRIO MENDES VIEIRA [email protected]
Bioengineering Department, Instituto Superior Técnico, Portugal
Abstract In Portugal, bus accidents are uncommon, but recently there were two heavy
passenger vehicle (i.e. buses) accidents in which 28 people died, in total. They happened on the 27th January, 2013, in route IC8, and on the 6th November, 2007, in route A23. The buses rolled over and for the majority of passengers it is not known if they were wearing the seat belt.
To determine whether or not passengers were using any retention system (as well as the driver) is interesting in terms of legal processes, it helps in the accident reconstruction, namely the conditions under which it happened and could support the methods and campaigns used to prevent and minimise people’s injuries caused by road accidents.
The methodology presented in this study allows investigating and performing the accident reconstruction where a bus is involved, using PC-CrashTM software. This analysis is based on injury criteria (such as Abbreviated Injury Score (AIS) or Injury Severity Scale (ISS)).
Using that methodology, it was verified that the diversity of movements that an unbelted passenger is subject to during a rollover bus accident is huge, which can be related to serious injuries, cause of death or absence of injuries. And the most interesting result is the proportional relation between unbelted occupants and higher rates of fatality.
A statistical analysis is performed, using a multinomial logistic regression model (MLR), provided by IBM® SPSS® Statistics 20 software and using the data of the Portuguese National Road Safety Authority (ANSR). From that main factors related to injured drivers of passenger vehicles (buses and cars) who were not wearing the seat belt when the accident occurred. And the highlighted factors are: bus drivers, drivers seriously injured or who have died, driver who was driving outside the law (regarding to driving licence or blood alcohol level), male drivers and drivers aged over 75.
A survey was performed to 54 bus passengers, out of them 35% said they do not wear the seat belt, although 68% classify its use as, at least, very important.
Key-Words: Bus Accident Reconstruction, Injury Biomechanics, Injury Criteria, Seat Belt,
Multinomial Logistic Regression Model
1 Introduction This study is focused on the analysis of the consequences of heavy passenger vehicles (i.e.
buses) accidents, relating the degree of injured people and the possible security measures that can be applied, namely the wearing of seat belt. Bearing this in mind computational simulations using PC-CrashTM software were performed.
Furthermore, Figure 1 compares the total of fatalities resulted from accidents involving buses where a decreasing of fatalities trend is shown, principally by “Average EU-15” [1]. Portugal is almost ever below the European average, but it is still necessary to continue working on road traffic prevention in order to minimize the number of injured people [2][3].
In the namely country, the last two buses accidents with more fatalities occurred in 2007 and 2013, a total of 28 fatalities [2][3]. Still in statistics subject, first part of this study is dedicated to a statistical study seeking to find out the factors that influence the drivers of vehicles (cars and buses) to use the seat belt in Portugal (during 2011 and 2012). Usually, injured people in

consequence of a road accident are classified as Minor Injured, Seriously Injured or Fatal victims according to international classification. In 2011 and 2012, there were 3 deaths, 13 passengers seriously injured and 329 passengers with minor injuries among people who do not wearing seat belts when were travelling by bus.
Figure 1 - Fatalities number in accidents involving buses in European Union [15]
2 Statistical analysis of factors associated with seat belt use by occupants of passenger vehicles performing using SPSS®
2.1 Model and Variables Through the SPSS®, a Multinomial Logistic Regression (MLR) model was used in this study.
The Confidence Interval (CI) was 95% (p-value = 0.05), which gives a comfortable confidence about results. This model is used for unordered categorical response variables [4], which corresponds to the current analysis. In order to perform the MLR, the use of seat belt was defined as the dependent variable (nominal variable), and it only has two categories, named as “Wearing” (reference category) and “Not Wearing”; for the cases in which the seat belt was being used and in which it was not, respectively. The independents variables in analysing were 54 categories (following defined in brackets) regarding 8 different factors (hereinafter factors or independent variables). The Human Factors are composed of Injury Severity (Minor Injured (reference), Serious Injury and Fatal), Blood Alcohol Level (0 g/l (reference), From 0.01 to 0.49 g/l, From 0.50 to 1.19 g/l and More than or equal to 1.20 g/l), Driving License (Legal (reference) and Illegal), Gender (Male (reference) and Female) and Age (From 18 to 35 years old (reference), Less than 18 years old, From 36 to 74 years old and More than or equal to 75 years old) while the Category of the Vehicle (Light (reference) and Heavy), Localization(Inside urban area (reference) and Outside urban area) and District (Lisboa (reference) and the others 17 districts of mainland Portugal) are classified as Non-human Factors. The data used in this study was provided by ANSR database [2][3].
Some correction in database had to me done (e.g. to delete wrong or incomplete data), in order to achieve results with statistical significance, accorded to the statistical indicators tests provided by SPSS®. The factors used in analysis of drivers were coded in SPSS® (reference category has always the higher code number). The final results were reached doing a Forward Stepwise procedure, i.e. the factors were included in the intercept model (“empty” model) by an order. This means that the significance of including one factor at each stage is testing [5]. The independent variables were added by the next sequence: Category of the Vehicle, Injury Severity, Blood Alcohol Level, Driving License, Gender, Age, Vehicle’s Service, Month of the Accident, Day of the Accident, Hour of the Accident, Type of Road, District, Localization and Illumination. Besides, there are priority factors: Category of the Vehicle and Injury Severity were added to the empty model as

“Forced Entry Term” to ensure the inclusion of these since they are the crucial factors of the study. Thus, each factor was included in the model if its influence was positively to the quality of the model; otherwise it was not included. This methodology ended without the inclusion of the 8 factors and after Driving License and Age were added as “Forced Entry Term” which did not influence the quality of the model.
Besides, Odds Ratio (OR) is one of a range of statistics used to assess the chance of a particular outcome if a certain factor is present. If the odds are greater than one, the event is more likely to occur than does not occur [6]. Therefore, the next results are interpreted based on OR.
It was tried to perform a similar analysis using bus’ passengers as sample, but the results had lower statistical significance, thus these results and conclusions drawn from them are omitted.
2.2 Results Table 1 summarises the results obtained, for the categories missing those did not have
statistical significance.
Table 1 - Results of the statistical analysis of (bus and car) drivers
Factor (or Variable or Predictor)
Category p-value OR
Type of Vehicle Car (reference) 1
Bus 0.000 11.243
Injury Severity
Minor injured (reference) 1
Serious Injury 0.000 5.979
Fatal 0.021 5.696
Blood Alcohol Level
0 g/l (reference) 1
From 0.01 to 0.49 g/l 0.787 0.023
From 0.50 to 1.19 g/l 0.023 2.359
More than or equal to 1.20 g/l 0.000 3.656
Driving License Legal (reference) 1
Illegal 0.045 2.269
Gender Male (reference) 1
Female 0.003 0.532
Age
From 18 to 35 years old (reference)
1
From 36 to 74 years old 0.893 10.2
More than or equal to 75 years old 0.041 20.27
Localization Inside urban area (reference) 1
Outside urban area 0.002 0.505
District Lisboa (reference) 1
Aveiro 0.02 0.245
All injured drivers characterized by categories with higher OR than reference category are more likely to be not wearing the seat belt then injured drivers characterized by reference category, (analogue analysis is done for OR below one, being the first drivers less likely to be not wearing the seat belt). For instance, drivers seriously injured or who had died are more likely to be not wearing the seat belt at the moment of the accident than drivers become minor injured drivers. On the other hand, drivers who are women are more likely to be wearing the seat belt than who are men, when both have an accident and consequently become injured drivers.
3 Accident Reconstitution
3.1 Procedure The reconstitution of the accident has few steps before the final result (simulation of the
accident). The first step is to analyse the initial data given by authorities (in this work, it was provided by GNR (National Republican Guard) and LNEC (National Laboratory for Civil Engineering)), which is usually composed of Road Characteristics (3D road dimensions, friction and slope values); Sketch of Accident (Vehicle Post-Accident Position); Vehicle Characteristics; Tachograph (Pre-Accident Speed); Photographs of Vehicle and Accident scenario and Autopsy/Medical reports. Figure 2 (left) is an illustrative scheme of the procedure followed, which

indeed could be divided in two processes: vehicle(s) simulation(s) and occupant(s) simulation(s). The parameters are adjusted, whenever necessary.
PC-CrashTM was the technical software used to perform the computational simulations. Its tools (“triangulate” and “polygons of friction”) allowed defining the scenario required and the vehicle model (Figure 2 (right upper) was found in software database and the features of this were adjusted). When the scenario and vehicle were ready, the simulation was performed. Figure 2 (right lower) shows the multibody model and seat model used in this work. It is easy to define whether the multibody is wearing the seat belt or not using the PC-CrashTM options [7].
Figure 2 - Scheme with the main steps of the computational simulation for a road accident investigation (left); vehicle
computational model involved in the accident (right upper); multibody and seat models of the PC-CrahTM software and localization of rigid bodies (right lower)
The occupants’ characteristics, such as age, weight and height, are defined in accordance with the autopsy data. According to PC-CrashTM technical manual, there are two possible configurations to define the impact between a rigid body and other object, they are “ellipsoid to ellipsoid contact” (contact between rigid bodies) and “ellipsoid to plane contact” (contact between bodies and vehicle/ground). The model used is based on to minimize the depth penetration, when there is the impact [7].
3.1.1 Bus Simulation Results The case study was the bus accident that happened on 27th January, 2013, in route IC8 [8].
Due to the complexity of the accident, it was not possible to obtain the intended bus movement out of the road. Thus, the multibody simulation was performed using the bus simulation of other accident, which happened on 6th November 2007, in route A23. Otherwise, the results of injury criteria would be meaningless. But since the computational simulation of the vehicle in route IC8 was done, the multibody computational simulation could be performed in order to analyse the multibody motion.
3.2 Injury’ Analysis
3.2.1 Injuries severity evaluation and Injury Criteria In order to classify injuries presented in medical reports (autopsies) and obtained by
computational simulation under the same scale, Abbreviated Injury Scale (AIS) is used; it is the most well-known injury scale for forensic injury biomechanics [9]. Table 2 shows the AIS severity code and associated fatality rate [9].
Head Neck
Torso Upper Arm
Femur Lower Arm
Hip
Lower Leg

Table 2 - AIS scale and fatality rate [9]
Injury Severity AIS Severity Code Fatality rate (range %)
1 Minor 0.0
2 Moderate 0.1 - 0.4
3 Serious 0.8 - 2.1
4 Severe 7.9 - 10.6
5 Critical 53.1 - 58.4
6 Maximum (currently untreatable) …
9 Unknown
Depending of the region under analysis, the AIS level or the risk factor associated was calculated, using routines defined in MatlabTM. The reference values used to calculate injury criteria are referred throughout the results of case study #1. Table 3 – Human body region and corresponding PC-CrashTM rigid body, Injury Criteria shows the Human body region and corresponding PC-CrashTM rigid body and Injury Criteria.
Note that the computational simulations results are provided in the global referential of the software. Therefore, for obtaining the necessary physical quantities (forces, accelerations and velocities) in each rigid body referential, a transformation of coordinates from global to local referential was done, implementing a simple routine in MatlabTM software.
Table 3 – Human body region and corresponding PC-CrashTM
rigid body, Injury Criteria and healthy threshold
Body Region Rigid Body Principal Criteria Healthy Threshold
Head Head
HIC (Skull probably of fracture)
1000
Rotational acceleration (α) and Rotational velocity (ω)
α < 4500 rad/s2 if ω < 30 rad/s
α = 1700 rad/s2 if ω > 30 rad/s
Neck Neck 1
NIC 15 m2s
-2
Thorax Torso
Thoracic rate of compression 0.19 N/mm
Lateral force 7.4 kN
Lateral Acceleration 60 g
Abdominal Torso and Hip
Front Impact < 0.24 kN*
Side Impact < 6.73*
Maximum total horizontal abdominal force
< 2.3 kN*
Pelvis Hip and
Femur
Hip frontal impact 6.2 kN – 11.8 kN
Femur frontal impact 10 kN
Hip side impact 8.6 kN
Hip lateral acceleration 80 g – 90 g
Maximum pubic symphysis force < 3.25 kN*
Lower Limbs Femur
and Lower leg
Long axis compression Femur 7.72 kN Tibia 10.36 kN Fibula 0.60 kN
Upper Limbs Upper arm
and Lower arm
Long axis compression Humerus 4.98 kN Radius 3.28 kN Ulna 4.98 kN
Moreover, the AIS is a “threat of life” for each region but it is not a scale capable of evaluating the injuries present in the human body as a whole [9]. The risk factor is also unable to do that evaluation. Thus, to analyse the combined effects of multiple injuries there is Injury Severity Score (ISS), and its relation with the rate of mortality is resented in Figure 3. The ISS is given by Equation (1) [9]:
(1) being the highest AIS anywhere in the body, is the highest AIS except body region of , and is the highest AIS except body region of or .
The Risk Factor (RF) is the ratio between applied value and limit value (the healthy threshold). If the risk factor is lower than 1, facture/injury occurrence is unlikely; on the other hand, if it is higher than 1, facture/injury occurrence is likely; and if it is close to 1, the bone is on the verge of fracturing/injuring [9] [10].

Figure 3 - ISS values and life threatening [adapted from 38]
3.3 Selection of study cases The accident chosen to perform this study was provided by IDMEC (Institute of
Mechanical Engineering) and it happened on 6th November, 2007, as mentioned. 17 out of 37 bus occupants died [8]. It is known that all seats were equipped with seat belts, but it is not known if the passengers were wearing it. Five study cases were selected among the fatal victims. The selection criteria were to have their autopsy and location before the accident (where they were seated). The “Study case #extra” contains simulation of the occupants using the computational simulation related to IC8 accident.
3.4 Results and Discussion
3.4.1 Study case #1: Occupant 23 The occupant was seated on seat number 23 when the accident happened. This was a
woman, she was 71 years old, 1.58 m tall and over the normal weight (79 kg). The passenger was seated near a pillar of the vehicle and she remained inside the vehicle, incarcerated, her pelvic region stuck. She died few days after the accident. Figure 4 shows the occupant’s final position (of belter occupant simulation) and with this figure it is intend to avoid possible impacts/collisions between the study case and the next seat passenger. These impacts cannot be neglected, depending on their magnitude they could cause an injury.
Figure 4 - Final position of occupant 23 (top view): impact with next passenger (red-highlighted square)
Table 4 sums up the body regions injury criteria results for belted and unbelted occupant computational simulation and injuries obtained from the autopsy data analysis. This table is followed by results interpretation and discussion concerning in each body region.
Table 4 - Study case #1 summary of body regions injury criteria results
Body Region Autopsy data Belted Occupant Unbelted Occupant
Head AIS 2/Fracture AIS 3/No fracture AIS 2/No fracture
Neck and Spinal Safe AIS 1 AIS 1
Thorax AIS > 2 AIS > 1 AIS > 3
Abdomen AIS > 3 AIS > 3 AIS 3
Pelvis AIS 5/Fracture AIS > 4/Fracture AIS 2/No Fracture
Lower Extremities AIS 3/Fracture (right femur) Fracture (both femurs) No fracture
Upper Extremities Articular dislocation No Fracture Fracture(right upper arm)
(Rate of Mortality) 38 (34%) 27 (22%) 22 (4%)
The head AIS 2 classification, related to the autopsy, is due to the fracture in the right upper mandible. This fracture may have been caused by an impact against the vehicle’s pillar located near the occupant’s head (when [11] [10] and [12] limit values were used). However, the simulations were inefficient since fractures in the head were not verified. This fact can raise issues related to vehicle dxf model problems.
The Neck Injury Criteria (NIC) value in both cases is very high causing AIS 1, which is contrary to the absence of injury described in the autopsy (based on [11], [13] and [9] references). The neck injuries caused by road accident were studied by Ana Ferreira (2012); she mentioned that
0
20
40
60
80
100
0 10 20 30 40 50 60 70 P
erc
en
t M
ort
alit
y
Injury Severity Score

simulation results and autopsy data cannot be coincident due to the complexity of interaction between the variables that can be caused by impacts. Observing that, through the simulations performed, “the victim could describe symptoms that are not coincident with the dynamic of the accident” [14].
So far, thoracic (its injuries thresholds can be founded in [11]) and abdominal injuries (injury criterion based on [10]) severity seem do not depending from the seat belt use, more cases has to be simulated to extrapolate about this issue. However, the criteria used do not allow having knowledge about the presence of vertebrae fracture, although the presence (in autopsy) of these fractures in lumbar region indicates that the occupant was probably wearing the seat belt as is suggested in [15].
Regarding to pelvic region result, the belted occupant suffered injuries more seriously than unbelted occupant. An explanation is that the unbelted occupant can move and avoid some impacts; on the other hand, the belted occupant remains seated and the impact with the front seat is imminent (according to [11] [16] and [17]). Note that due to the pressure caused by the retention system in the pelvic region, the fractures mentioned in the autopsy could indicate that the occupant was probably wearing the seat belt. And the results obtained in the belted occupant are closer to the autopsy data than the results of the unbelted occupant, supporting that probability.
The results for injuries in lower extremities based on the men’s thresholds presented in [18]. The belted occupant has both femurs fractured while the unbelted occupant has no fractures. The cause of that injury is probably the impact with the front seat. Thus, there are not thigh results matching perfectly with the autopsy data which reports only fractures in the right femur. Lower legs have no fractures in both simulations, which is consistent with the autopsy data but do not allow arguing about safety belt importance.
About upper extremities injuries, it is observed that in both simulations the occupant has no fractures, except in the left lower arm in the case of unbelted occupant. Unfortunately, the injury criterion just allows detecting fractures in the models, based on the thresholds of [19]; so, for instance, disarticulations (reported in autopsy) may have happened but are detected.
Finally, is closer to than to , which supports the
assumption that this passenger was wearing the seat belt.
3.4.2 Study case #2 to #5: Occupant 17, 16, 29 and 28 Following, Table 5 presents the result of the simulations performed for the others study
cases. The criteria used were the same of case study #1 and analogue analysis of the results can the done. However, the most interesting relation is between and rate of mortality as can be seen, the last is always higher in case of unbelted occupant simulation. Except passenger 17, the final location of the passenger is unknown.
About passenger 17, the initial position is similar to the previous study case initial position but the final position is outside the vehicle. The injury criteria showed similarity between autopsy data and unbelted occupant simulation results in the majority regions. For the regions where it did not happened the explanation is the higher probability of lower leg impact the front seat or head impact with vehicle pillar in case of belted and the uncertain of points of contact/impact in case of unbelted. The has the highest rate of mortality with supports the thesis of the passenger was not wearing the seat belt.
In case study #3 (passenger 16) the results from the unbelted occupant are slightly closer to the autopsy data than the results from belted occupant. However, the difference does not allow concluding about the use of the seat belt.
About study case #4, it is hard to highlight reliable conclusions when considering whether passenger 29 was wearing the seat belt or not because and comparing with autopsy data. However, the unbelted occupant has a mortality rate higher than the belted occupant, thus these results could be used to promote the use of safety belt.
Lastly, the results from the unbelted occupant are, once again, slightly closer to the autopsy data of passenger 28 than the results from the belted occupant. However, as in passenger

16, this does not allow concluding about the use of the seat belt; but since the difference between the results of belted and unbelted is significant, it is reasonable to apply it in the promotion of safety belt use, as in previously study case (passenger 29).
Table 5 - Study cases Study case #1 summary of body regions injury criteria results (from top to bottom: #2 to #5)
Study case #2 – Passenger 17
Body Region Autopsy data Belted Occupant Unbelted Occupant
Head AIS 4/No fracture AIS 2/No fracture AIS 4/Fracture
Neck and Spinal AIS 3/Fracture AIS 3 AIS 3
Thorax Safe Safe AIS > 6
Abdomen Safe AIS 3 AIS > 4
Pelvis AIS 4/Fracture AIS 3/Fracture AIS 3/Fracture
Lower Extremities AIS 3/Fracture(left femur) Fracture (both femur) No Fracture
Upper Extremities Safe Fracture (right lower arm) Fracture (upper And lower arms)
(Rate of Mortality) 41 (37%) 34 (24%) 68 (100%)
Study case #3 – Passenger 16 Body Region Autopsy data Belted Occupant Unbelted Occupant
Head AIS 3/Fracture AIS 3/Fracture AIS 2/No fracture
Neck and Spinal Safe AIS > 1 AIS > 1
Thorax AIS > 3 AIS > 2 AIS > 3
Abdomen AIS 1 AIS > 1 AIS 3
Pelvis Safe Safe AIS > 0
Lower Extremities AIS > 2 Fracture (left tibia and fibula) No Fracture No Fracture
Upper Extremities Fracture (right humerus head) No Fracture Fracture (left lower arm)
(Rate of Mortality) 19 (2%) 14 (1%) 22 (4%)
Study case #4 – Passenger 29
Body Region Autopsy data Belted Occupant Unbelted Occupant
Head AIS 4/Fracture AIS 3/No fracture Safe
Neck and Spinal AIS > 3/Fracture AIS > 3 AIS 2
Thorax AIS 4 AIS > 2 AIS 5
Abdomen AIS 3 AIS 3 AIS 4
Pelvis Safe Safe AIS > 1
Lower Extremities No fracture No fracture No fracture
Upper Extremities Fracture (both radius) No Fracture Fracture (left upper arm)
(Rate of Mortality) 41 (37%) 27 (22%) 45 (45%)
Study case #5 – Passenger 28
Body Region Autopsy data Belted Occupant Unbelted Occupant
Head AIS 3 AIS 3 AIS 3
Neck and Spinal Safe AIS > 2 AIS > 2
Thorax AIS 4 AIS > 2 AIS > 5
Abdomen AIS 3 AIS 3 AIS > 4
Pelvis Safe Safe AIS 2/Fracture (pelvis)
Lower Extremities AIS 3/Fracture (both femur) No fracture No Fracture
Upper Extremities Safe No fracture Facture (right upper arm)
(Rate of Mortality) 34 (24%) 22 (4%) 50 (58%)
3.4.3 Study case #extra During the simulation developments, it was noticed that the passengers were not being
ejected from the vehicle through the windows as it happens in reality when there is an accident like the one under analysis. This was happening because in the simulation the windows did not get broken as they would in the real accident. This problem was solved by changing the vehicle dxf model, i.e. removing its windows (Figure 5, right). In PC-CrashTM, there are two ways to define vehicles dxf: loading it from the software database or asking the software to generate the dxf according to the vehicle under study [7]. It is only possible to edit dxf when it is provided by the PC-CrashTM database. Thus, a dxf from the database was used, software did the necessary adjustments between dxf and vehicle model automatically, resulting in dxf able to edit (Figure 5, left). Additionally, there was a problem related to the floor of the bus. This had to be defined as a rigid
body and added to the model, since it was not provided by dxf model. Observing Figure 5 bus floor is the green rectangle below the passengers.
Figure 5 - Dxf provided by PC-CrashTM database adjusted to the vehicle model (left); dxf with windows (right)
Still in problems subject, some rigid bodies were penetrating the vehicle dxf too much (using ellipsoid to plane contact) and would get stuck there. To solve this problem the time integration step was decreased minimizing the (multibody and vehicle) movements omitted and thus ensuring the detection of the impact between each rigid body (ellipsoid) and the vehicle dxf (plane). The simulation using lower time integration step showed more detailed movements (less moments were omitted), but the problem was still there, i.e. the points of contact/penetration between the multibody and the vehicle dxf changed, but that only changes the rigid bodies that get stuck. Moreover, the coefficient of restitution and friction between multibody and vehicle were also changed (increasing the first and decreasing the second) but, these changes did not improve the results.
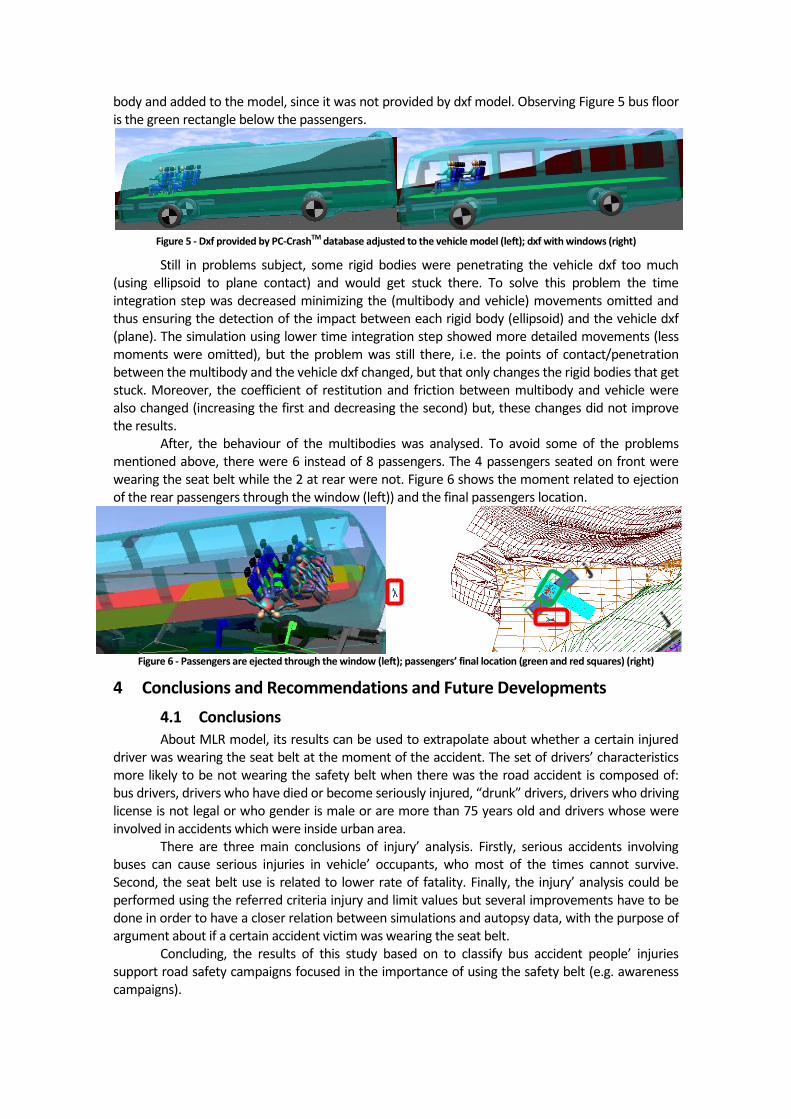
After, the behaviour of the multibodies was analysed. To avoid some of the problems mentioned above, there were 6 instead of 8 passengers. The 4 passengers seated on front were wearing the seat belt while the 2 at rear were not. Figure 6 shows the moment related to ejection of the rear passengers through the window (left)) and the final passengers location.
Figure 6 - Passengers are ejected through the window (left); passengers’ final location (green and red squares) (right)
4 Conclusions and Recommendations and Future Developments
4.1 Conclusions
About MLR model, its results can be used to extrapolate about whether a certain injured driver was wearing the seat belt at the moment of the accident. The set of drivers’ characteristics more likely to be not wearing the safety belt when there was the road accident is composed of: bus drivers, drivers who have died or become seriously injured, “drunk” drivers, drivers who driving license is not legal or who gender is male or are more than 75 years old and drivers whose were involved in accidents which were inside urban area.
There are three main conclusions of injury’ analysis. Firstly, serious accidents involving buses can cause serious injuries in vehicle’ occupants, who most of the times cannot survive. Second, the seat belt use is related to lower rate of fatality. Finally, the injury’ analysis could be performed using the referred criteria injury and limit values but several improvements have to be done in order to have a closer relation between simulations and autopsy data, with the purpose of argument about if a certain accident victim was wearing the seat belt.
Concluding, the results of this study based on to classify bus accident people’ injuries support road safety campaigns focused in the importance of using the safety belt (e.g. awareness campaigns).

4.2 Recommendations and Future Developments
The same model MLR may be used to study car’ passengers once the sample will be bigger, the MLR should results in significant statistical values, from which reliable conclusions will be drawn. Besides, developing studies with a clearer relation between statistical studies and simulation work can lead to more interesting conclusions.
The limitations related to the PC-CrashTM multibody system should be solved in order to have a closer relation between simulations results and autopsy data to improve road accident reconstitution procedure. For instance, if rigid bodies with some characteristics of soft human tissues were developed and added to the models perhaps it could signify improvements in the results. Besides, if the sample included no injured people study cases or at least people that survived, the method for classifying injuries could be adjusted based on a diversity of situations, which makes it more reliable. Regarding the dxf problems, it is suggested that more dxf models should be provided by PC-CrashTM. The ideal scenario would be to have a dxf (with the option of windows get broken or not) for each vehicle model provided by this software. In parallel, the definition of a bus dxf model based on a multibody system, i.e. composed of rigid bodies. With this the contact/penetration problems could be solved.
Other suggestion is to perform the multibody simulation using MADYMO; the results might be better.
5 References
[1] CARE (2013): Community database on accidents on the roads in Europe, Mobility and transport, European Commission, Available at: http://ec.europa.eu/transport/road_safety/pdf/observatory/historical_evol.pdf and http://ec.europa.eu/transport/road_safety/pdf/statistics/historical_country_transport_mode.pdf
[2] ANSR (2011): Road accidents database updated up to December 2011, Portuguese Road Safety Authority
[3] ANSR (2012): Road accidents database updated up to December 2012, Portuguese Road Safety Authority
[4] Xie, Y., Powers, D.A. (2000). Methods For Categorical Data Analysis – Academic Press. [5] Hosmer, D. W., & Lemeshow, S. (2000). Applied logistic regression. [6] Weatergren, A., Karlsson, S., Andersson, P., Ohlsson, O., & Hallberg, I. R. (2001). Eating difficulties, need
for assisted eating, nutritional status and pressure ulcers in patients admitted for stroke rehabilitation. Journal of clinical nursing, 10(2), 257-269.
[7] Datentechnik, S. (November 11, 2013). PC-CRASH Operating and Technical Manual Version 10.0. meaforensic.
[8] GNR – Guarda Nacional Republicana datafiles [9] Hayes W, Erickson M, Power E (2007): Forensic Injury Biomechanics, Annual Review Biomedical
Engineering, 9 pp 55-86 [10] King, A (2000) – Part 2: Fundamentals of Impact Biomechanics - Part 2 – Biomechanics of the Abdomen,
Pelvis and Lower Extremities, Bioengineering Center, Wayne State University, Detroit, Michigan [11] Schmitt, K-U., Niederer, P., Muser, M., Walz, F. (2007): Trauma Biomechanics - Accidental injury in traffic
and sports, 2nd edition. Springer-Verlag Berlin Heidelberg. [12] Hertz, E. (1993). A note on the head injury criterion (HIC) as a predictor of the risk of skull fracture.
In Proceedings: Association for the Advancement of Automotive Medicine Annual Conference (Vol. 37, pp. 303-312). Association for the Advancement of Automotive Medicine.
[13] Beer, F. P., Johnston, E. R., & DeWolf, J. T. (2006). Pure bending. Beer FP, Johnston ER, DeWolf JT. Mechanics of Materials. London: McGraw-Hill, 217-306.
[14] Ferreira A (2012): Evaluation of whiplash injuries in victims from road accidents in Portugal. Master of Science Thesis. Lisbon, Instituto Superior Técnico, Universidade Técnica de Lisboa
[15] Carvalho S (2013): Injuries Analysis and Computational Simulation of Two Wheelers Accidents Using Human Body Biomechanical Models. Master of Science Thesis. Lisbon, Instituto Superior Técnico, Universidade Técnica de Lisboa
[16] Hall, C. E. J., Norton, S. A., & Dixon, A. R. (2001). Complete small bowel transection following lap-belt injury. Injury, 32(8), 640-641.
[17] Kuppa S (2004): Injury Criteria for Side Impact Dummies; National Transportation Biomechanics Research Center; National Highway Traffic Safety Administration
[18] Levine R (2002): Injuries to the extremities, in Accidental Injury – Biomechanics and Prevention (Eds. Nahum, Melvin), Springer Verlag, New York
[19] Nahum, A., Melvin, J. (1993) Accidental injury, Springer-Verlag, New York