computed thz - tomography
TRANSCRIPT
18th World Conference on Nondestructive Testing, 16-20 April 2012, Durban, South Africa
Computed THz - Tomography
Daniel FRATZSCHER 1, Joerg BECKMANN 1, Lars S. von CHRANOWSKI 1 ,
Uwe EWERT 1
1 Radiological Methods, BAM Federal Institute for Materials Research and Testing; Berlin, Germany Phone: +49 30 81403693 , Fax: +49 30 81044657 , e-mail: [email protected] ,
[email protected] , [email protected] , [email protected]
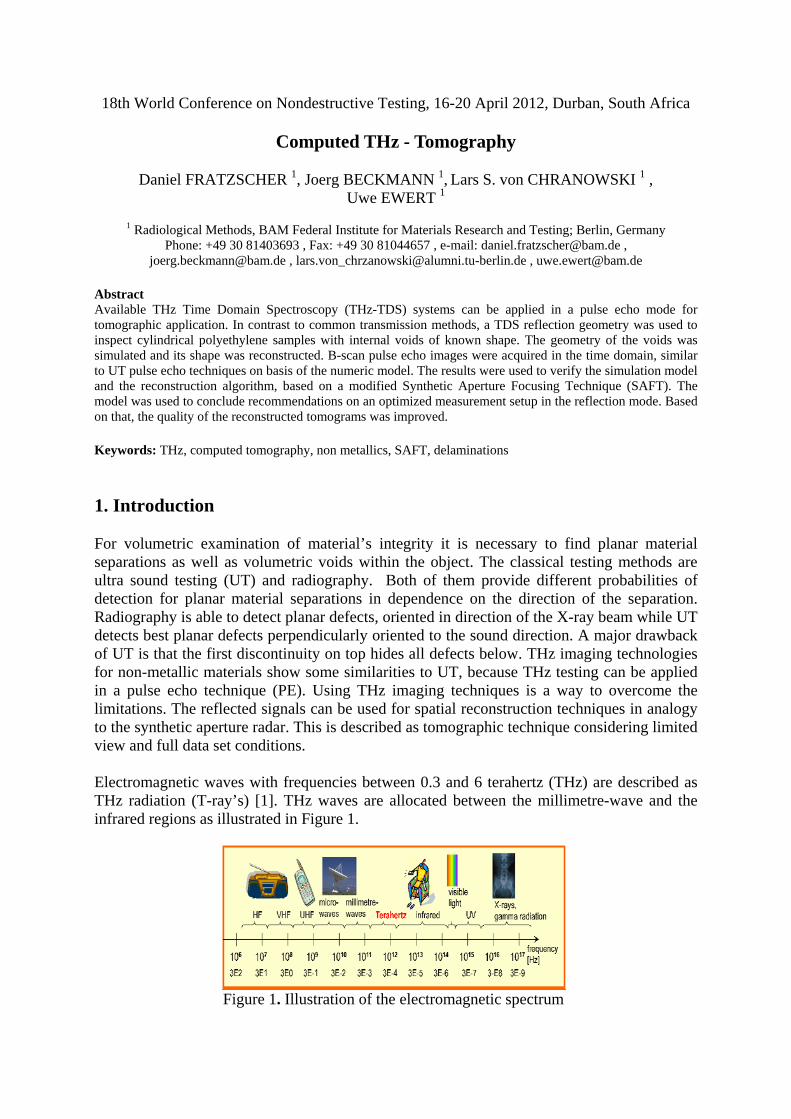
Abstract Available THz Time Domain Spectroscopy (THz-TDS) systems can be applied in a pulse echo mode for tomographic application. In contrast to common transmission methods, a TDS reflection geometry was used to inspect cylindrical polyethylene samples with internal voids of known shape. The geometry of the voids was simulated and its shape was reconstructed. B-scan pulse echo images were acquired in the time domain, similar to UT pulse echo techniques on basis of the numeric model. The results were used to verify the simulation model and the reconstruction algorithm, based on a modified Synthetic Aperture Focusing Technique (SAFT). The model was used to conclude recommendations on an optimized measurement setup in the reflection mode. Based on that, the quality of the reconstructed tomograms was improved. Keywords: THz, computed tomography, non metallics, SAFT, delaminations 1. Introduction For volumetric examination of material’s integrity it is necessary to find planar material separations as well as volumetric voids within the object. The classical testing methods are ultra sound testing (UT) and radiography. Both of them provide different probabilities of detection for planar material separations in dependence on the direction of the separation. Radiography is able to detect planar defects, oriented in direction of the X-ray beam while UT detects best planar defects perpendicularly oriented to the sound direction. A major drawback of UT is that the first discontinuity on top hides all defects below. THz imaging technologies for non-metallic materials show some similarities to UT, because THz testing can be applied in a pulse echo technique (PE). Using THz imaging techniques is a way to overcome the limitations. The reflected signals can be used for spatial reconstruction techniques in analogy to the synthetic aperture radar. This is described as tomographic technique considering limited view and full data set conditions. Electromagnetic waves with frequencies between 0.3 and 6 terahertz (THz) are described as THz radiation (T-ray’s) [1]. THz waves are allocated between the millimetre-wave and the infrared regions as illustrated in Figure 1.
Figure 1. Illustration of the electromagnetic spectrum
Optically opaque dielectric materials such as paper, textiles and plastics are transparent for T-rays. On the other hand, electrical conducting materials such as metals cannot be penetrated due to their screening effect. Nevertheless, images can be taken from scanned dielectric objects with similar appearance as gray scaled X-ray images. X-ray images show occasionally a weak contrast in the image if plastics and ceramic test objects have been tested. A much better contrast in the image can be observed, when similar objects have been tested by means of coherent pulsed THz radiation [2]. Table 1 describes the possible interactions of THz-waves with different materials. All surfaces produce a measureable reflection signal and therefore, reflection setups provide information on the internal structure.
Table 1: Application areas of THz wave based inspection
Additionally, THz radiation is considered to be not dangerous for the human body which makes it attractive to future measuring and testing applications for both medical and industrial usage. THz Time Domain Spectroscopy (THz-TDS) became attractive for laboratory work in the last years because it operates with coherent radiation at ambient temperatures and allows both, spectroscopic analysis and imaging of dielectric materials. Technical developments of the last years and advanced system integration made the design of portable compact and glass fiber coupled handheld THz time domain spectrometer possible. The state of the art offers nowadays the opportunity for application of mobile THz inspections in field [5]. First applications of transmission tomography were already demonstrated with T-rays [6-8]. A special experimental set up is required to use the known X-ray tomography geometry. The results are disturbed by artifacts if a broad beam has been used in the experiment [6-8]. For that reason a new approach of T-ray tomography has been selected. THz transmission tomography systems commonly utilize a time-consuming first-generation computed tomography setup using a single narrow beam. The aim of the current work is the development of a practically relevant, contactless and non-destructive inspection technique using THz time domain inspection in reflection. This allows the reconstruction of internal material structures, having only single sided access. In the following the experiments, the results and the developed simulation models are described in more detail.
2. Methods and Results 2.1 Experimental Setup In principle, THz time domain technique requires the generation and detection of electromagnetic terahertz pulses, which are produced in a photoconductor by intense optical femtosecond laser pulses. The pulsed laser beam is split and one pulse is delayed by an optical line to chronologically stagger the strikes on the terahertz antennas, the generator (transmitter) and on the detector (receiver). Glass fibre pigtailed systems are used that allow fast positioning of receiver and transmitter heads. A handheld and fully fibre equipped TDS system was described elsewhere [9] which operates at a centre wavelength of 1550 nm and takes advantage of the telecommunication fibre technology.
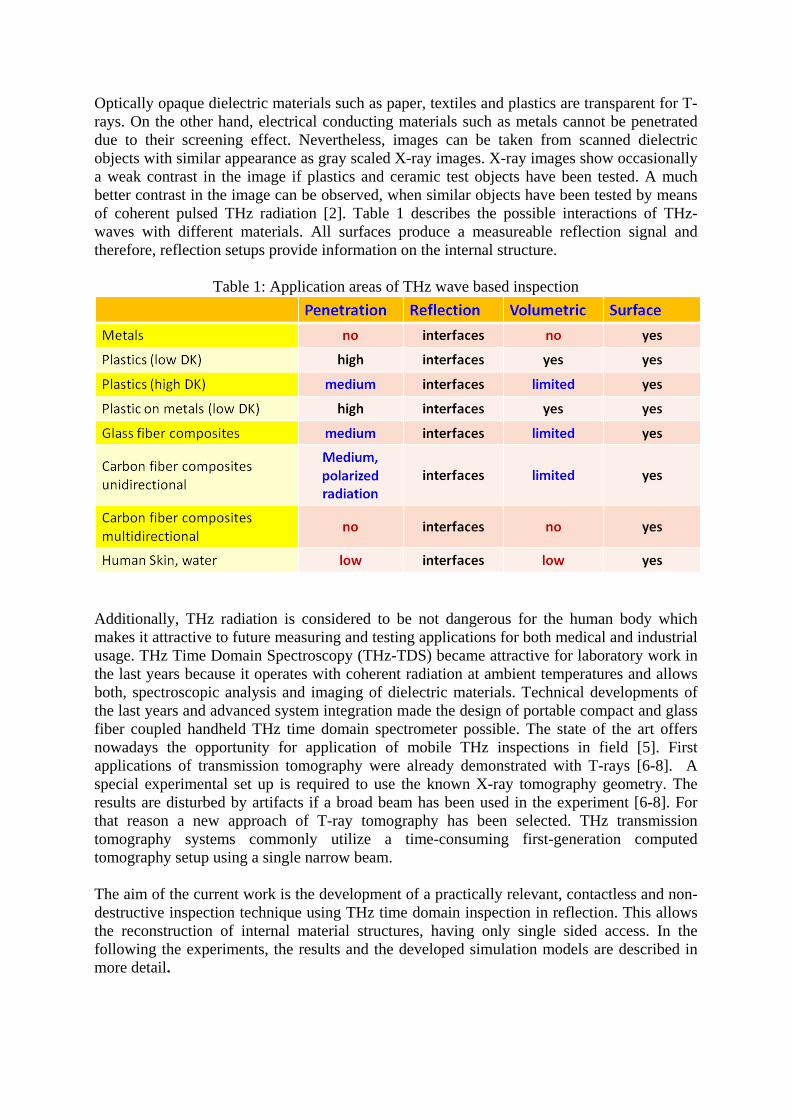
Figure 2. Measured Amplitude of the electrical pulse of a freely propagating terahertz beam in pure air (black) and after passage of 10mm polyethylene (red)
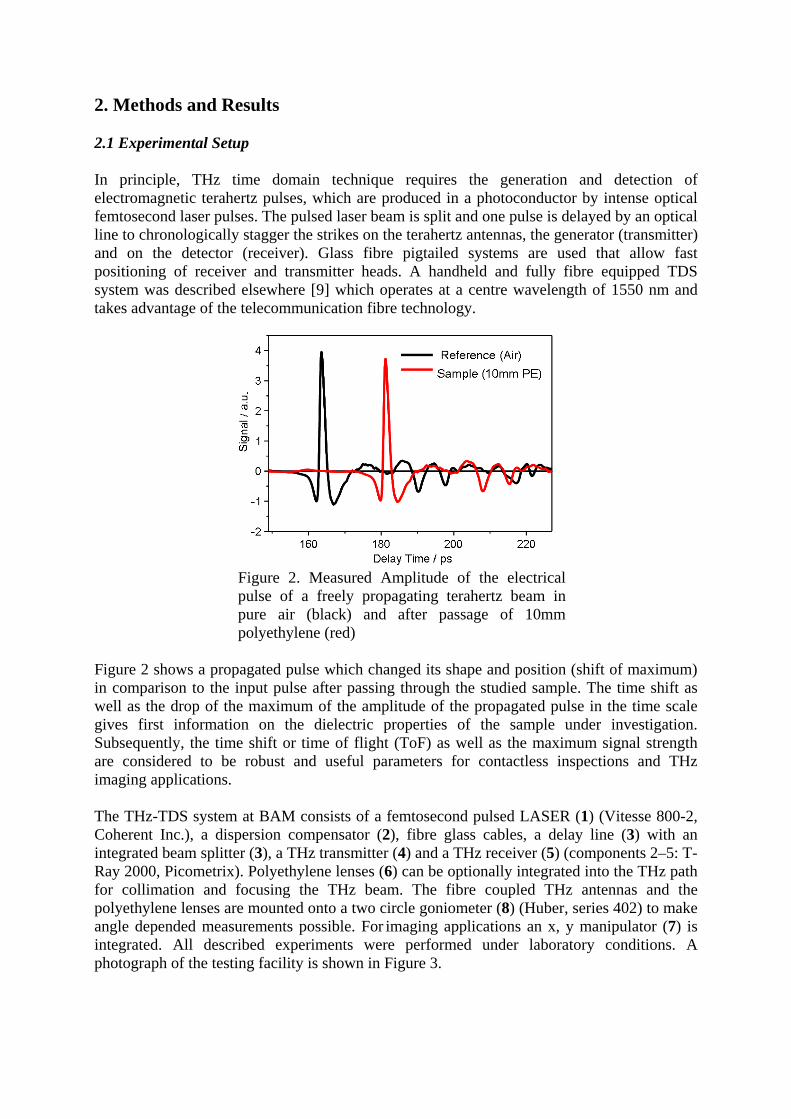
Figure 2 shows a propagated pulse which changed its shape and position (shift of maximum) in comparison to the input pulse after passing through the studied sample. The time shift as well as the drop of the maximum of the amplitude of the propagated pulse in the time scale gives first information on the dielectric properties of the sample under investigation. Subsequently, the time shift or time of flight (ToF) as well as the maximum signal strength are considered to be robust and useful parameters for contactless inspections and THz imaging applications. The THz-TDS system at BAM consists of a femtosecond pulsed LASER (1) (Vitesse 800-2, Coherent Inc.), a dispersion compensator (2), fibre glass cables, a delay line (3) with an integrated beam splitter (3), a THz transmitter (4) and a THz receiver (5) (components 2–5: T-Ray 2000, Picometrix). Polyethylene lenses (6) can be optionally integrated into the THz path for collimation and focusing the THz beam. The fibre coupled THz antennas and the polyethylene lenses are mounted onto a two circle goniometer (8) (Huber, series 402) to make angle depended measurements possible. For imaging applications an x, y manipulator (7) is integrated. All described experiments were performed under laboratory conditions. A photograph of the testing facility is shown in Figure 3.
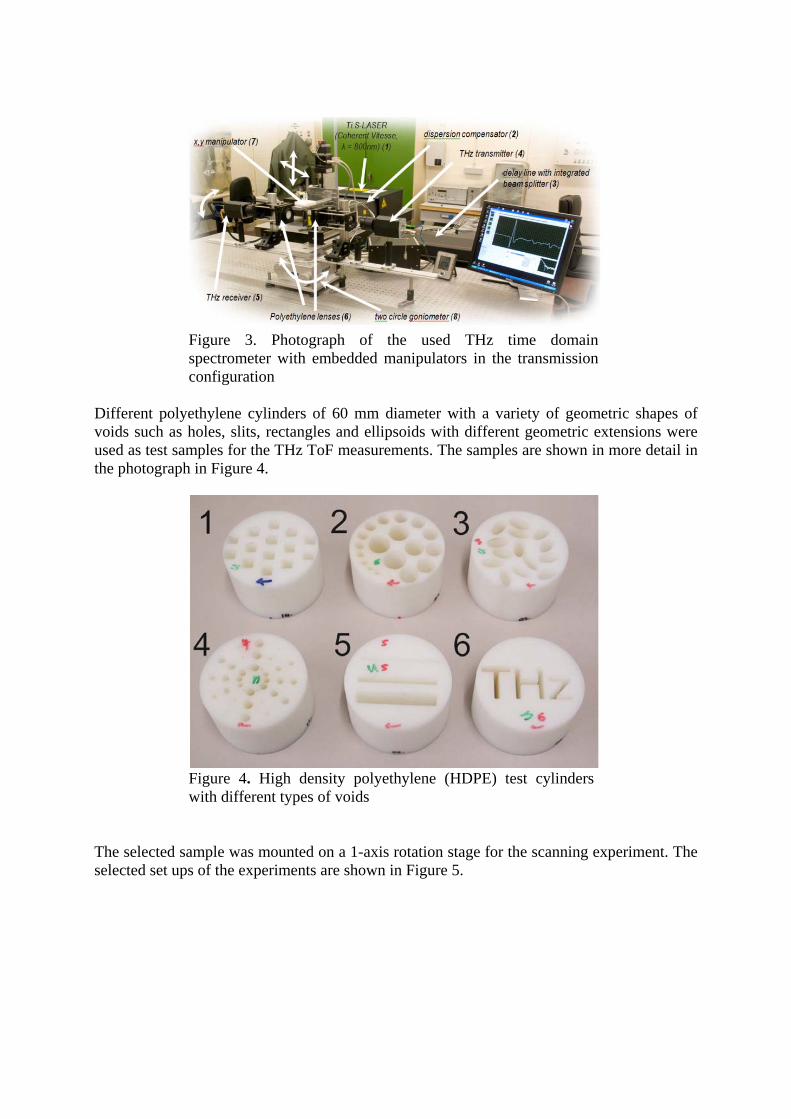
Figure 3. Photograph of the used THz time domain spectrometer with embedded manipulators in the transmission configuration
Different polyethylene cylinders of 60 mm diameter with a variety of geometric shapes of voids such as holes, slits, rectangles and ellipsoids with different geometric extensions were used as test samples for the THz ToF measurements. The samples are shown in more detail in the photograph in Figure 4.
Figure 4. High density polyethylene (HDPE) test cylinders with different types of voids
The selected sample was mounted on a 1-axis rotation stage for the scanning experiment. The selected set ups of the experiments are shown in Figure 5.
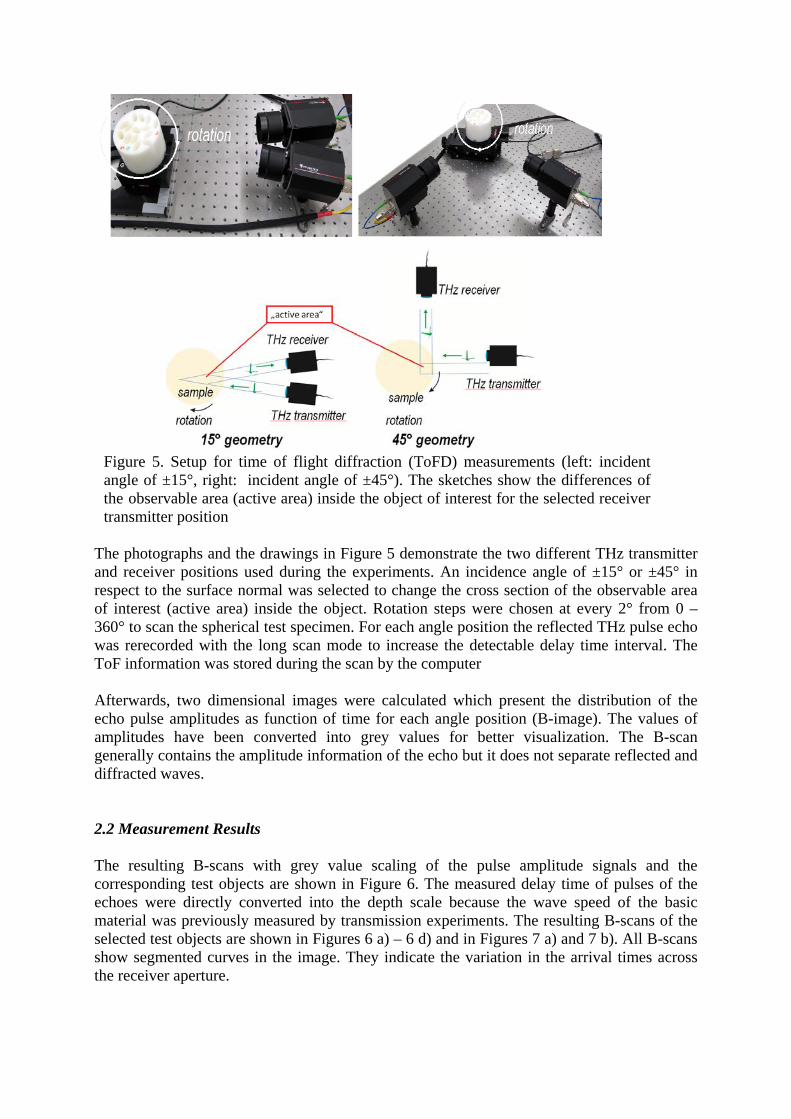
Figure 5. Setup for time of flight diffraction (ToFD) measurements (left: incident angle of ±15°, right: incident angle of ±45°). The sketches show the differences of the observable area (active area) inside the object of interest for the selected receiver transmitter position
The photographs and the drawings in Figure 5 demonstrate the two different THz transmitter and receiver positions used during the experiments. An incidence angle of ±15° or ±45° in respect to the surface normal was selected to change the cross section of the observable area of interest (active area) inside the object. Rotation steps were chosen at every 2° from 0 – 360° to scan the spherical test specimen. For each angle position the reflected THz pulse echo was rerecorded with the long scan mode to increase the detectable delay time interval. The ToF information was stored during the scan by the computer Afterwards, two dimensional images were calculated which present the distribution of the echo pulse amplitudes as function of time for each angle position (B-image). The values of amplitudes have been converted into grey values for better visualization. The B-scan generally contains the amplitude information of the echo but it does not separate reflected and diffracted waves. 2.2 Measurement Results The resulting B-scans with grey value scaling of the pulse amplitude signals and the corresponding test objects are shown in Figure 6. The measured delay time of pulses of the echoes were directly converted into the depth scale because the wave speed of the basic material was previously measured by transmission experiments. The resulting B-scans of the selected test objects are shown in Figures 6 a) – 6 d) and in Figures 7 a) and 7 b). All B-scans show segmented curves in the image. They indicate the variation in the arrival times across the receiver aperture.
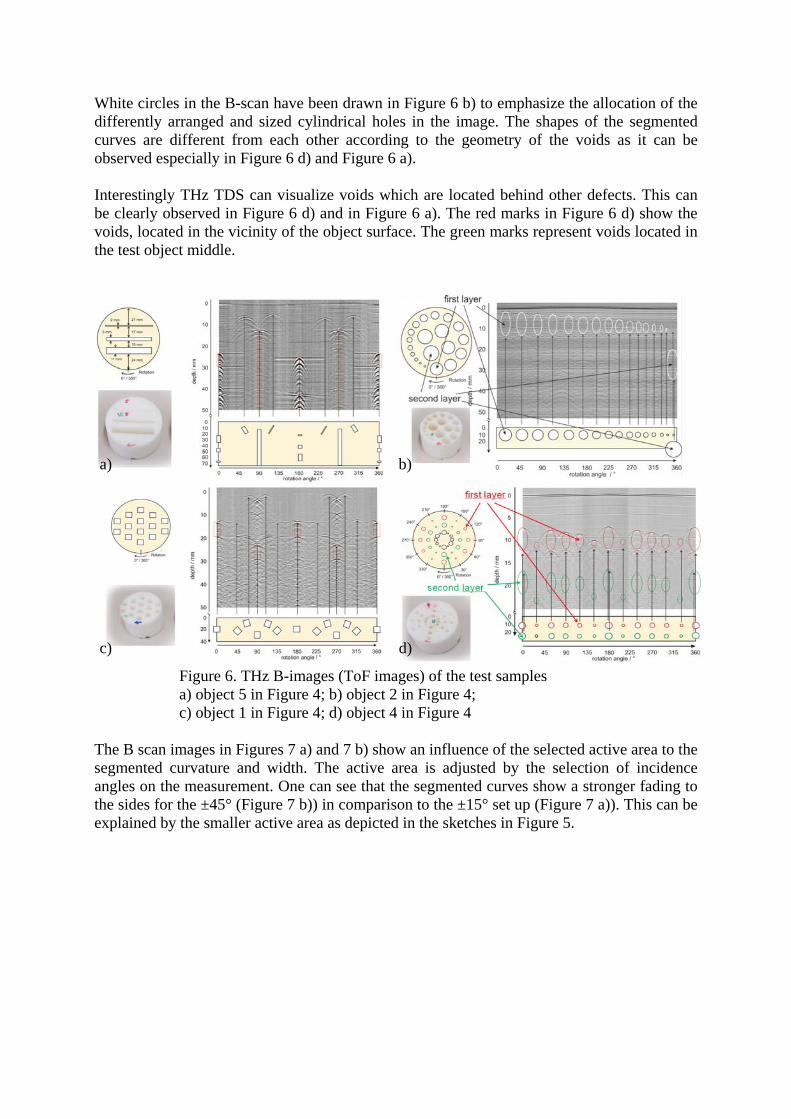
White circles in the B-scan have been drawn in Figure 6 b) to emphasize the allocation of the differently arranged and sized cylindrical holes in the image. The shapes of the segmented curves are different from each other according to the geometry of the voids as it can be observed especially in Figure 6 d) and Figure 6 a). Interestingly THz TDS can visualize voids which are located behind other defects. This can be clearly observed in Figure 6 d) and in Figure 6 a). The red marks in Figure 6 d) show the voids, located in the vicinity of the object surface. The green marks represent voids located in the test object middle.
Figure 6. THz B-images (ToF images) of the test samples a) object 5 in Figure 4; b) object 2 in Figure 4; c) object 1 in Figure 4; d) object 4 in Figure 4
The B scan images in Figures 7 a) and 7 b) show an influence of the selected active area to the segmented curvature and width. The active area is adjusted by the selection of incidence angles on the measurement. One can see that the segmented curves show a stronger fading to the sides for the ±45° (Figure 7 b)) in comparison to the ±15° set up (Figure 7 a)). This can be explained by the smaller active area as depicted in the sketches in Figure 5.
d) c)
a) b)

Figure 7. Comparison of the measured B-scans at incidence angles of ±15° (a) and ±45° (b) All B-scans indicate a correlation of the segmented curvatures to the geometry of the internal voids and its size depending on the active area (Figure 5). But the segmented curvature shape does not provide direct information on the location and shape of the voids. For that reason an adapted tomographic back projection algorithm was developed in analogy to the synthetic aperture radar (SAR) and synthetic aperture focusing technique (SAFT) as applied in UT techniques to calculate the sample cross section. Simulations on the PC were started first to test the developed algorithm. 2.3 Results of Simulations Simulations were performed starting with the simplest case: a number of isotropic point scatterers are located in an expanded plastic plate. Influences of inhomogenities within the material, such as the influences of the surface and the back wall reflection are neglected by this approach.
Figure 8. B-scans (top) and tomograms (bottom), calculated for a large (infinite length and depth no side walls, no backwall) plate with six point scatterers (left: wide aperture, right: small aperture).
The calculated B-scans and the reconstructed tomograms for a parallel and strongly focused beam are shown in Figure 8. The transmitter and receiver operation was simulated with parallel beam optics. For all performed simulations a transmitter and receiver aperture position was assumed to be ±15° in respect to the surface normal following the experimental
a) b)
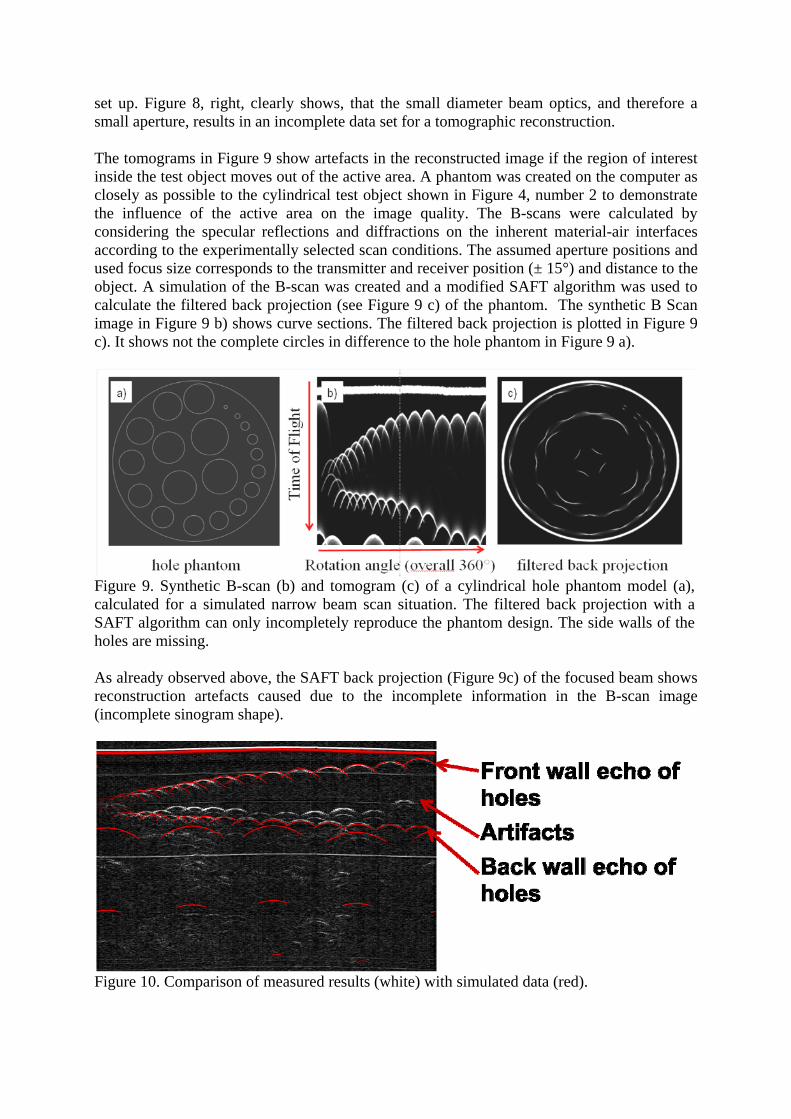
set up. Figure 8, right, clearly shows, that the small diameter beam optics, and therefore a small aperture, results in an incomplete data set for a tomographic reconstruction. The tomograms in Figure 9 show artefacts in the reconstructed image if the region of interest inside the test object moves out of the active area. A phantom was created on the computer as closely as possible to the cylindrical test object shown in Figure 4, number 2 to demonstrate the influence of the active area on the image quality. The B-scans were calculated by considering the specular reflections and diffractions on the inherent material-air interfaces according to the experimentally selected scan conditions. The assumed aperture positions and used focus size corresponds to the transmitter and receiver position (± 15°) and distance to the object. A simulation of the B-scan was created and a modified SAFT algorithm was used to calculate the filtered back projection (see Figure 9 c) of the phantom. The synthetic B Scan image in Figure 9 b) shows curve sections. The filtered back projection is plotted in Figure 9 c). It shows not the complete circles in difference to the hole phantom in Figure 9 a).
Figure 9. Synthetic B-scan (b) and tomogram (c) of a cylindrical hole phantom model (a), calculated for a simulated narrow beam scan situation. The filtered back projection with a SAFT algorithm can only incompletely reproduce the phantom design. The side walls of the holes are missing. As already observed above, the SAFT back projection (Figure 9c) of the focused beam shows reconstruction artefacts caused due to the incomplete information in the B-scan image (incomplete sinogram shape).
Figure 10. Comparison of measured results (white) with simulated data (red).
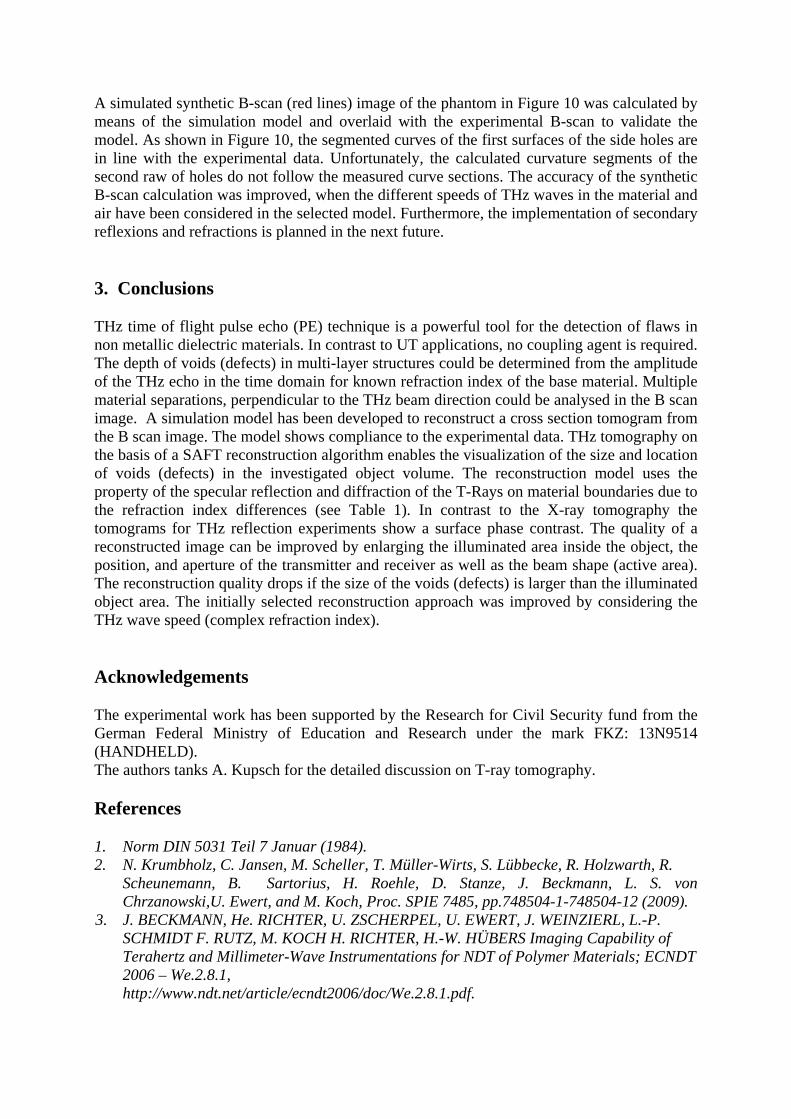
A simulated synthetic B-scan (red lines) image of the phantom in Figure 10 was calculated by means of the simulation model and overlaid with the experimental B-scan to validate the model. As shown in Figure 10, the segmented curves of the first surfaces of the side holes are in line with the experimental data. Unfortunately, the calculated curvature segments of the second raw of holes do not follow the measured curve sections. The accuracy of the synthetic B-scan calculation was improved, when the different speeds of THz waves in the material and air have been considered in the selected model. Furthermore, the implementation of secondary reflexions and refractions is planned in the next future. 3. Conclusions
THz time of flight pulse echo (PE) technique is a powerful tool for the detection of flaws in non metallic dielectric materials. In contrast to UT applications, no coupling agent is required. The depth of voids (defects) in multi-layer structures could be determined from the amplitude of the THz echo in the time domain for known refraction index of the base material. Multiple material separations, perpendicular to the THz beam direction could be analysed in the B scan image. A simulation model has been developed to reconstruct a cross section tomogram from the B scan image. The model shows compliance to the experimental data. THz tomography on the basis of a SAFT reconstruction algorithm enables the visualization of the size and location of voids (defects) in the investigated object volume. The reconstruction model uses the property of the specular reflection and diffraction of the T-Rays on material boundaries due to the refraction index differences (see Table 1). In contrast to the X-ray tomography the tomograms for THz reflection experiments show a surface phase contrast. The quality of a reconstructed image can be improved by enlarging the illuminated area inside the object, the position, and aperture of the transmitter and receiver as well as the beam shape (active area). The reconstruction quality drops if the size of the voids (defects) is larger than the illuminated object area. The initially selected reconstruction approach was improved by considering the THz wave speed (complex refraction index). Acknowledgements The experimental work has been supported by the Research for Civil Security fund from the German Federal Ministry of Education and Research under the mark FKZ: 13N9514 (HANDHELD). The authors tanks A. Kupsch for the detailed discussion on T-ray tomography. References 1. Norm DIN 5031 Teil 7 Januar (1984). 2. N. Krumbholz, C. Jansen, M. Scheller, T. Müller-Wirts, S. Lübbecke, R. Holzwarth, R. Scheunemann, B. Sartorius, H. Roehle, D. Stanze, J. Beckmann, L. S. von
Chrzanowski,U. Ewert, and M. Koch, Proc. SPIE 7485, pp.748504-1-748504-12 (2009). 3. J. BECKMANN, He. RICHTER, U. ZSCHERPEL, U. EWERT, J. WEINZIERL, L.-P.
SCHMIDT F. RUTZ, M. KOCH H. RICHTER, H.-W. HÜBERS Imaging Capability of Terahertz and Millimeter-Wave Instrumentations for NDT of Polymer Materials; ECNDT 2006 – We.2.8.1, http://www.ndt.net/article/ecndt2006/doc/We.2.8.1.pdf.
4. Jörg BECKMANN, Lars S. VON CHRZANOWSKI, Uwe EWERT, Time of Flight Diffraction – Technik (ToFD) mit THz-Strahlung zur Untersuchung von Kunststoffobjekten; DGZfP Jahrestagung 2010, Poster 35, http://www.ndt.net/article/dgzfp2010/Inhalt/p35.pdf.
5. Lars S. VON CHRZANOWSKI, Jörg BECKMANN, Barbara MARCHETTI, Uwe EWERT, Ulrich SCHADE, Capability of Terahertz-Wave Instrumentation for Non Destructive Testing of Liquids; ECNDT 2010, http://www.ndt.net/article/ecndt2010/reports/1_05_16.pdf.
6. B. Ewers, A. Kupsch, A. Lange, and M.P. Hentschel, Terahertz spectral imaging techniques in NDT: Topography and computed tomography, 10th European conference on non-destructive testing (Proceedings), Moscow, June (2010), http://www.ndt.net/article/ecndt2010/reports/1_09_10.pdf.
7. Kodo Kawase, Takayuki Shibuyaa, Shininaa, S Hayashi, Koji Suizu, THz imaging techniques for nondestructive inspections; Comptes Rendus Physique (2010)
8. D. J. Roth, S. Reyes-Rodriguez, D.A. Zimdars, R.W. Rauser, W.W. Ussery, Terahertz Computed Tomography of Nasa Thermal Protection System Foam Materials; Materials Evaluation (Sept. 2011).
9. U. Ewert, J. Beckmann, L. von Chrzanowski, G. Brekow, D. Brackrock, Time of flight diffraction (ToFD) with THz radiation - an alternative to the ultra sound - ToFD technique for non-metallic materials; AIP Conference Proceedings 1335 (2010), 541-548.