computed tomography for diagnosing pulmonary embolism · 1 computed tomography for diagnosing...
TRANSCRIPT

1
Computed Tomography for Diagnosing
Pulmonary Embolism
A Health Technology Assessment
The Health Technology Assessment Unit, University of Calgary
March 21, 2017

2
Acknowledgements
This report is authored by Laura E. Dowsett, Fiona Clement, Vishva Danthurebandara, Diane
Lorenzetti, Kelsey Brooks, Dolly Han, Gail MacKean, Fartoon Siad, Tom Noseworthy and
Eldon Spackman on behalf of the HTA Unit at the University of Calgary. Dr. Eldon Spackman
has received personal non-specific financial compensation from Roboleo & Co and Astellas
Pharma. The remaining authors declare no conflict of interests.
This research was supported by the Health Technology Review (HTR), Province of BC. The
views expressed herein do not necessarily represent those of the Government of British
Columbia, the British Columbia Health Authorities, or any other agency.
We gratefully acknowledge the valuable contributions of the key informants and thank them for
their support. We also acknowledge the collaboration with CADTH to complete the cost-
effectiveness model.

3
Contents Abbreviations .................................................................................................................................. 7
Executive Summary ........................................................................................................................ 8
1 Purpose of this Health Technology Assessment ................................................................... 12
2 Research Question and Research Objectives ........................................................................ 12
3 Background ........................................................................................................................... 13
3.1 Pulmonary Embolism Overview .................................................................................... 13
3.2 Prevalence and Incidence ............................................................................................... 13
3.3 Disease Progression and Severity .................................................................................. 14
3.4 Risk Factors .................................................................................................................... 15
3.5 Diagnosis ........................................................................................................................ 16
3.6 Risk Stratification ........................................................................................................... 18
3.7 Diagnostic Tests for PE .................................................................................................. 21
3.8 Computed tomography (CT) Overview ......................................................................... 27
3.9 Treatment ....................................................................................................................... 32
3.10 Clinical Practice Guidelines ....................................................................................... 34
3.11 Ongoing Research....................................................................................................... 38
4 Diagnostic Accuracy ............................................................................................................. 39
4.1 Objective ........................................................................................................................ 39
4.2 Methods .......................................................................................................................... 39
4.3 Results ............................................................................................................................ 42
4.4 Conclusions .................................................................................................................... 50
5 British Columbia Context and Physician Perspectives ......................................................... 52
5.1 Purpose ........................................................................................................................... 52
5.2 Methods .......................................................................................................................... 52
5.3 Findings .......................................................................................................................... 52
5.4 Conclusion ...................................................................................................................... 59
6 Patient Perspective Systematic Review ................................................................................ 61
6.1 Objective ........................................................................................................................ 61
6.2 Methods .......................................................................................................................... 61
6.3 Results ............................................................................................................................ 62

4
6.4 Discussion ...................................................................................................................... 65
7 Appropriate Use of CT.......................................................................................................... 66
7.1 Objective ........................................................................................................................ 66
7.2 Methods .......................................................................................................................... 66
7.3 Results ............................................................................................................................ 68
7.4 Discussion ...................................................................................................................... 75
8 Cost-effectiveness and Economic Impact ............................................................................. 76
8.1 Objective ........................................................................................................................ 77
8.2 Overview of Previous Studies ........................................................................................ 77
8.3 Methods .......................................................................................................................... 84
8.4 Results .......................................................................................................................... 101
8.5 Budget Impact Analysis ............................................................................................... 113
8.6 Discussion .................................................................................................................... 118
8.7 Conclusion .................................................................................................................... 119
9 Overall Conclusions ............................................................................................................ 119
10 References ........................................................................................................................... 121
Appendix A: Diagnostic Accuracy ............................................................................................. 133
Appendix B: Patient Perspective ................................................................................................ 156
Appendix C: Appropriate Use of CT .......................................................................................... 158
Search Strategy ....................................................................................................................... 158
Appendix D: Cost-Effectiveness and Budget Impact Analysis .............................................. 175
Search Strategy ....................................................................................................................... 175

5
Tables
Table 1: Inherited or acquired Predisposing factors for PE 9........................................................ 16
Table 2: Wells Criteria Tool31
....................................................................................................... 19
Table 3: Revised Geneva Score Tool 34
........................................................................................ 20
Table 4: CT Scan Parameters ........................................................................................................ 30
Table 5: Thrombosis Canada, Recommendations for Duration of Treatment of PE or DVT ...... 33
Table 6. Inclusion and Exclusion Criteria for Clinical Systematic Review ................................. 40
Table 7: Synthesis of Characteristics of Included Studies ............................................................ 44
Table 8: Between study variability of CT scan parameters .......................................................... 46
Table 9. Quality Assessment of Included Randomized Controlled Trial ..................................... 47
Table 10. Inclusion and Exclusion Criteria for Systematic Review ............................................. 62
Table 11: Summary of Included Study ......................................................................................... 64
Table 12. Inclusion and Exclusion Criteria for Systematic Review ............................................. 67
Table 13: Synthesis of Interventions ............................................................................................. 70
Table 14. Outcomes of Included Studies ...................................................................................... 72
Table 15. Summary of previously published cost-effectiveness analyses .................................... 81
Table 16. Baseline probabilities of recurrent PE. ......................................................................... 93
Table 17. Utility values for treatment-related health states .......................................................... 94
Table 18. Per patient costs ............................................................................................................ 97
Table 19. Anticoagulation treatment costs.................................................................................... 98
Table 20. Event costs .................................................................................................................... 99
Table 21. Results of model validation exercise .......................................................................... 102
Table 22. Base case deterministic results – sequential ICUR ..................................................... 105
Table 23. Disaggregated Costs and Effectiveness ...................................................................... 107
Table 24. Sensitivity Analyses - Sequential ICUR ..................................................................... 110
Table 25. Important Differences in Model Inputs ...................................................................... 112
Table 26. Model Results with CADTH Inputs ........................................................................... 112
Table 27. Total annual cost per patient by diagnostic test and disease outcome ........................ 114
Table 28. Budget impact results: 1 year...................................................................................... 116
Table 29. Budget impact results: 5 years .................................................................................... 117

6
Figures
Figure 1: Diagnosis Overview ..................................................................................................... 17
Figure 2: Pulmonary Embolism Rule-out (PERC) ....................................................................... 21
Figure 3: (Left) SSCT arrays containing single, long elements along z-axis. .............................. 28
Figure 4: Dual Source CT equipped with two X-ray tubes. Courtesy of: Siemens AG ............... 29
Figure 5: Conventional multislice CT with one X-ray generator. Courtesy of: Siemens AG ...... 29
Figure 6: Suggested Diagnostic Algorithm for Suggested PE100
.................................................. 35
Figure 7: Diagnostic Pathway used at St, Joseph’s Healthcare 102
............................................... 38
Figure 8: Flow Chart ..................................................................................................................... 43
Figure 9: Assessment of quality item for all included non-randomized studies. Proportions of
studies rated as “Low”, “Unclear” and “High” for each QUADAS-2 item. ................................. 48
Figure 10: Sensitivity and specificity reported in included studies .............................................. 49
Figure 11: Receiver operating characteristics (ROC) plot displaying diagnostic accuracy of CT
reported in each included study and summary estimates obtained from the bi-variate random
effect model .................................................................................................................................. 50
Figure 12: PE Diagnostic Pathway ............................................................................................... 53
Figure 13: Challenges of Diagnosis .............................................................................................. 57
Figure 14: Flow Chart ................................................................................................................... 62
Figure 15. Flow Chart ................................................................................................................... 69
Figure 16: Forest plot of change in CT yield after intervention ................................................... 73
Figure 17: Barriers and Facilitators to Acceptance of Intervention .............................................. 74
Figure 18. Flow Chart of Review Process .................................................................................... 79
Figure 19. Decision Tree for Diagnostic Algorithms ................................................................... 88
Figure 20. Decision Tree Outcomes for Algorithm: WellsPERCD-dimerCT .................. 89
Figure 21. Conceptual Design of the Markov component of the economic model ...................... 90
Figure 22. Incremental Cost-effectiveness Plane ........................................................................ 106
Figure 23. Yield versus compliance rate of the intervention ...................................................... 108
Figure 24. Cost-effectiveness acceptability curves ..................................................................... 111
7
Abbreviations
CDS: Clinical Decision Support
CT or CTPA: CT Pulmonary Angiography
CUS: Compressive ultrasound
DSCT: Dual Source CT
DVT: Deep vein thrombosis
ED: Emergency Department
FoV: Field of view
HTA: Health Technology Assessment
ICUR: Incremental Cost Utility Ratio
IV: Intravenous
LMWH: Low-molecular weight heparin
LUS: Lung ultrasound
mAs: milliampere seconds
MDCT: Multi-detector CT
MRI: Magnetic Resonance Imaging
PE: Pulmonary embolism
PERC: Pulmonary Embolism Rule-out Criteria
RCT: Randomized Controlled Trial
SDCT: single detector CT
SPECT: Single photon emission CT
VKE: Vitamin K antagonists
VTE: venous thromboembolism
V/Q: Ventilation Perfusion

8
Executive Summary
This report presents the findings and conclusions of a provincial Health Technology Assessment
on the use of computed tomography (CT) for diagnosing pulmonary embolism (PE). The primary
research questions were:
1) What is the appropriate use of CT to diagnose PE taking into account effectiveness, cost-
effectiveness and perspectives within the BC health system?
2) If a change in use of CT is needed, what are the effective interventions to change CT use
patterns?
Background: PE is the occlusion of pulmonary arterial vasculature by thrombus, tumor, air or
fat. In most cases, a PE is caused by a venous thromboembolism (VTE) that forms in the leg,
called a deep vein thrombosis (DVT), which breaks loose and travels through the bloodstream to
the lung. Causes of thrombosis and PE are summarized by Virchow’s triad: hemodynamic
changes, endothelial injury/dysfunction, and hypercoagulability. Clinical data indicates that most
cases of PE occur in those who are between the ages of 60 and 70; however, autopsy data show
the highest incidence among individuals 70 to 80 years of age. After coronary artery disease and
stroke, acute PE ranks as the third most common cardiovascular disease.
Prior to diagnostic testing, risk stratification tools may be used to determine clinical probability
of PE. These tools include: Wells’ Criteria, PERC and rGeneva. These tools may be used to rule
out PE, but cannot be used to diagnose PE. Pulmonary angiography was historically considered
to be the “gold standard” imaging test for diagnosing PE; however, other diagnostic tests, such as
CT, ECG, chest x-ray, laboratory investigations (D-dimer and markers of cardiac injury and
overload), ventilation-perfusion scintigraphy, MRI and/or echocardiography may be used. CT in
particular has become a first-line modality for imaging in patients with suspected PE. Recent
advances in CT such as helical CT, and multi-detector row CT have drastically improved the
detection of small emboli, optimized contrast delivery and reduced radiation dose. Unless
bleeding risk is high, anticoagulation therapy is recommended as the primary treatment for
patients with a high pre-test probability of PE. Therapeutic goals for PE involve the prevention
of thrombus growth, restoration of pulmonary blood flow and the prevention of recurrences

9
Methods: The following methodological approaches were used to gather and synthesize the
available evidence:
I. Review of Clinical Practice Guidelines
II. Systematic Review on diagnostic accuracy of using CT to diagnose PE
III. Clinician interviews to determine patterns of care in British Columbia, and clinician
perspectives on CT use for diagnosing PE
IV. Systematic review on patient perspectives of using CT to diagnose PE in comparison to
alternatives
V. Systematic review on appropriate use of CT for diagnosing PE
VI. Cost-effectiveness model and budget impact analysis of using interventions to improve
the yield of CT for diagnosing PE
Key Findings:
No Canadian or provincial guidelines exist for the diagnosis of PE. Individual centers, and in
some cases individual physicians, have developed their own approaches to diagnosis. A total of
14 studies assessing the accuracy of using CT to diagnose PE were identified. All included
studies were considered in the meta-analysis despite the differences in scan parameters and
reference standards. The pooled sensitivity of CT for diagnosing PE is 84.8% (95% CI 81.7% to
87.5%) and the pooled specificity is 93.0% (95% CI 90.9% to 94.6%). Thus, CT is more
effective at correctly identifying subjects without PE than correctly classifying patients with PE.
Emergency Department (ED) physicians working in British Columbia describe diagnosing or
ruling out PE as a complex endeavour. The patient population is heterogeneous, the symptoms
general in nature, and it can be challenging to determine whether a PE is clinically significant.
There are societal, healthcare system and ED contextual factors that influence the PE diagnostic
pathway and contribute to over-ordering of CT scans. Not diagnosing a clinically important PE
may lead to death, and therefore, there is significant fear in the medical community about
missing this diagnosis. Lack of access to follow-up primary care or other kinds of transitional
care puts pressure on ED physicians to make a diagnosis or rule out PE before the patient leaves
the ED. The physician interviews were unaware of decision support tools for diagnosing PE that

10
would help decrease inappropriate use of CT. Physicians felt that such a tool along with a strong
strategy for physician education would be helpful although challenging to develop.
One study on patient perspectives of using CT to diagnose PE was identified. This study found
that when involved in a shared decision making process, one-third of patients would decline CT
testing. Reasons for declining CT testing included: risk of adverse events, and exposure to
radiation from CT technology. This suggests that a shared decision making process is acceptable
to patients, and that including patients in the decision on diagnostic approach may decrease
imaging for PE. This study was conducted in an experimental setting, and may not be
generalizable to clinical practice.
Fourteen studies were identified assessing interventions to achieve appropriate use of CT. Two
studies assessed the effectiveness of an audit and feedback system, five assessed the
effectiveness of a clinical decision support tool, three assessed a type of communication, three
assessed the effectiveness of guidelines and one assessed both a clinical decision support tool
and guideline. Pooled estimates obtained from the stratified meta-analysis demonstrate that
interventions involving clinical decision support tools resulted in statistically significant
increases in CT yield. Barriers such as time pressures and patient demands, as well as facilitators
such as staff acceptance and buy-in, may change the success of the intervention.
A de novo cost-utility analysis was developed to evaluate the lifetime costs, health outcomes and
the cost-effectiveness of interventions to promote the appropriate use of CT in diagnosing PE in
emergency departments of British Columbia. In the base case, an intervention of
WellsPERCD-dimerCT had the lowest costs with a total of $1981 and effectiveness of
12.489 QALYs. However, the changes in effectiveness of all strategies were very small with CT
resulting in only an additional 0.007 QALYs or 0.4 days of quality adjusted life. These small
effectiveness increases resulted in an incremental cost utility ratio (ICUR) of $30,000 per QALY
gained with WellsD-dimerCT (moderate and high) compared WellsPERCD-
dimerCT and an ICUR of $364,900 per QALY gained for CT alone compared to WellsD-
dimerCT (moderate and high). The positive CT yield for interventions ranged from 14.2%
with CT alone to 21.1% with WellsD-dimerCT (moderate with high).

11
There were very small differences in clinical effectiveness across all strategies; the difference
between WellsPERCD-dimerCT and CT alone is less than one additional day of life. The
budget impact analysis predicts that WellsPERCD-dimerCT may save up to $4 Million in
the first year. Over five years, between $11.6 and $20.9 million in costs avoided may be realized
for all of British Columbia for WellsD-dimerCT (moderate and high) and WellsPERC
D-dimer CT, respectively.

12
1 Purpose of this Health Technology Assessment The purpose of this health technology assessment (HTA) is to synthesize the evidence to support
optimal use of CT (CT or CTPA) to diagnose pulmonary embolism (PE). The report summarizes
evidence on the effectiveness, diagnostic accuracy, cost-effectiveness, and patient experience of
using CT to diagnose PE. In addition, this report includes a synthesis of interventions to achieve
optimal use of CT for the diagnosis of PE. A cost-effectiveness and budget impact of the
effective interventions is also reported.
2 Research Question and Research Objectives The primary questions are:
What is the appropriate use of CT to diagnose PE taking into account effectiveness, cost-
effectiveness and perspectives within the BC health system?
If a change in use of CT is needed, what are the effective interventions to change CT use
patterns?
The primary research objectives are:
To determine the effectiveness/efficacy of CT for diagnosing PE
To determine the diagnostic accuracy of CT for diagnosing PE
To determine patient’s perspectives on the use of CT for diagnosing PE
To identify and determine the effectiveness of interventions to support appropriate use of
CT for diagnosing PE
To determine the cost effectiveness and budget impact of using interventions to improve
the yield of CT for diagnosing PE

13
3 Background
3.1 Pulmonary Embolism Overview
Pulmonary embolism (PE) is the occlusion of pulmonary arterial vasculature by thrombus,
tumor, air or fat. In most cases, a PE is caused by a venous thromboembolism (VTE) that forms
in the leg, called a deep vein thrombosis (DVT), which breaks loose and travels through the
bloodstream to the lung.1
Deep vein thrombosis, and subsequent PE, often results from the body
being stationary for long periods of time.2
Although thrombi most commonly originate in the leg,
they may also originate in the pelvic, renal or upper extremity veins, or in the right heart
chambers.2 Without intervention, approximately 50% of people with proximal DVT develop PE
as the freed blood clot enters the lungs.3
PE can either be acute or chronic.2
In acute cases, symptoms develop immediately after
occlusion of pulmonary vessels, whereas in chronic cases patients tend to develop slowly
progressing dyspnea over a period of time, sometimes years 2
. Causes of thrombosis and PE are
summarized by Virchow’s triad: hemodynamic changes, endothelial injury/dysfunction, and
hypercoagulability. However, PE can also be found in 20% of patients without predisposing
factors.4 PE can lead to hypoxemia, permanent damage to the affected lung, and/or damage to
other organs receiving limited oxygen.1 Without treatment, approximately 30% of patients with
PE will die in the first 3 months.5 This mortality rate can be significantly decreased with
treatment, which helps restore blood flow and prevents additional blood clots from forming.1
PE symptoms include shortness of breath, chest pain, or hemoptysis.1
Other common symptoms
are fever, hypotension, cyanosis, pulmonary hypertension, syncope and heart palpitations.6,7
However, approximately half of all cases remain asymptomatic.8
In many cases, death due to
acute PE is a result of acute right heart failure.9 However, it is important to note that symptoms
are non-specific; thus the diagnosis of PE is often missed or delayed, and in some instances an
autopsy is the only identifier of PE as the cause of death.10
3.2 Prevalence and Incidence
The true incidence of PE remains unknown due to the asymptomatic nature of the disease.2 In
British Columbia, an average of 3,551 patients were diagnosed with PE annually between 2012
14
and 2015. Of the patients diagnosed in 2014/2015, 77% had a CT scan. In a 2001 study of
emergency departments in four tertiary hospitals in Canada, 86 of 930 patients suspected of PE
were diagnosed with PE11
. This suggests the prevalence of PE among those patients suspected of
PE is 9.25%11
. Clinical data indicates that most cases of PE occur in those who are between the
ages of 60 and 70; however, autopsy data show the highest incidence among individuals 70 to 80
years of age.5 British Columbia specific data suggests that in 2014/2015 the average age of
diagnosis was 64.63, with the highest rate of diagnosis in those who are 80 years and older. After
coronary artery disease and stroke, acute PE ranks as the third most common cardiovascular
disease.5
3.3 Disease Progression and Severity
If left untreated, acute PE is associated with a mortality rate as high as 30%, whereas the death
rate of treated PE is 8%.5 PE generally occurs 3-7 days after the onset of DVT.
12 British
Columbia specific data provided by the BC Ministry of Health suggests that 7 days after
diagnosis, 1.93% of patients have died, and 24.01% have died one year after diagnosis. However,
published studies suggest this might be high; Pengo et al. found 13.4% had died after one year.13
Typically, the course of events will follow from one of the following two cases of PE:
1. Small to medium embolus: artery blockage will cut off circulation from a part of the lung,
and shortness of breath will occur. In 10% of these cases, the region of the lung supplied
by the blocked artery will die due to inadequate blood flow.3 This region will eventually
heal with a fibrous scar.3
2. Massive embolus: may lodge in the main pulmonary artery, which will occlude nearly all
blood flow to the lungs. The right side of the heart will experience back-pressure, which
will reduce the amount of blood pumped from the heart to the lungs, and cause heart
failure.3 This may occur suddenly (due to a massive PE) or gradually (due to recurrent
PE).14
Patients presenting with a massive PE will experience severe bradycardia (heart
rate <40 beats per minute), shock and have a high risk for short-term mortality.3
Along with mortality, PE can often precede recurrent venous thromboembolism and long-term
health issues.

15
Recurrent venous thromboembolism may occur during anticoagulant treatment or following the
resumption of anticoagulant treatment.15
The risk of long-term recurrent VTE in patients with PE
has been assessed in multiple randomized controlled trials.16-20
Those not treated with long-term
anticoagulant therapy for three-months after PE had a statistically significant higher risk of
recurrent VTE compared to those on anticoagulant therapy.16-20
Additionally, multiple studies have reported that a significant proportion of patients are at high
risk of developing persistent perfusion defects after a PE.21,22
These patients were more likely to
report dyspnea on exercise, and have a higher pulmonary artery pressure at follow-up.21
However, additional studies are required to determine the long-term significance of these
persistent defects.15,21
PE may increase risks for other diseases. It is well established that patients with acute PE have a
higher risk of cancer and arterial cardiovascular events than population controls.23,24
Chronic thromboembolic pulmonary hypertension (CTEPH) is a rare disease that has also been
estimated in several cohort studies following an episode of PE. In one study the cumulative rate
of symptomatic CTEPH was 3.8% (95% CI, 1.1-6.5) 2 years after a first episode of acute PE.25
However, a higher level of data is required to confirm the true occurrence of CTEPH after an
episode of acute PE.15
3.4 Risk Factors
PE develops in about half of cases with confirmed DVT thus risk factors for DVT are also
considered risk factors for PE.2 See Table 1 for a summary of predisposing factors for PE.

16
Table 1: Inherited or acquired Predisposing factors for PE 9
Strong predisposing
factors (odds ratio >10)
Moderate predisposing
factors (odds ratio 2–9)
Weak predisposing factors
(odds ratio <2)
Bone fractures (hip, leg) Arthroscopic knee surgery Bed rest >3 days
Hip or knee replacement Central venous lines
Immobility due to sitting
(e.g., prolonged car or plane
travel)
Major general surgery Chemotherapy Increasing age
Major trauma Chronic heart or respiratory
failure
Laparoscopic surgery (e.g.,
cholecystectomy)
Spinal cord injury Hormone replacement
therapy Obesity
Malignancy Pregnancy (antepartum)
Oral contraceptive therapy Chronic venous insufficiency,
varicose veins
Immobility after stroke
Pregnancy (peripartum)—
Lactation
Previous venous
thromboembolism
Thrombophilia
3.5 Diagnosis
PE can be difficult to diagnose, especially if the patient has underlying lung or heart disease.26
PE may be diagnosed using validated prediction rules, ECG, laboratory investigations (primarily
D-dimers and markers of cardiac injury and overload), imaging techniques (most commonly CT,
ventilation-perfusion scintigraphy and x-ray) and/or echocardiography.5
The elements related to diagnosing PE will be outlined in the following sections, including,
physical exam, risk stratification tools, diagnostic tests, diagnostic challenges and treatment
(Figure 1).
Physical Exam
The healthcare professional will take a history of the chest pain, including its characteristics, its
onset, and any associated symptoms that may direct the diagnosis to PE. Physical examination
will concentrate on the heart and lungs, as shortness of breath and chest pain have a broad range
of differential diagnoses.27
Physical examination may include assessment of DVT signs and
symptoms, including warmth, redness, tenderness and swelling. It is critical to account for risk
factors for clotting, because signs associated with DVT may be completely absent in the
presence of a clot.27

17
Figure 1: Diagnosis Overview
Physical Exam
•History of the chest pain, including its characteristics, onset, and any associated symptom
•Focus on the heart and lungs
•Also watch for signs of a DVT such as warmth, redness, tenderness and swelling
Risk Stratification Tools
•Prior to testing, risk stratification tools are used to determine clinical probability of PE
•Tools include: Wells’ Criteria, PERC, and rGeneva
Diagnostic Tests
•Patients with suspected PE should be evaluated within 24 hours
•Diagnostic tests include:
•Pulmonary Angiography
•Imaging Techniques such as CT, MRI, VQ SPEC
•Electrocardiogram
•Chest X-ray
•Echocardiography
•D-dimer
Treatment
•Primary Treatment: Anticoagulation Therapy
•Involve prevention of thrombus growth, restoration of pulmonary blood flow, and prevention of recurrence
•Canadian Guideline for Treatment: Thrombosis Canada
•Duration of treatment: 3 months or long-term therapy
Diagnostic Challenges • Symptoms and signs of PE are suggestive but not specific
• PE is easy to rule-out but difficult to diagnose

18
3.6 Risk Stratification
Suspected or confirmed PE patients are stratified into high, intermediate, or low risk based on
their risk for short-term mortality.28
High-risk patients are identified by the presence of
hypotension, respiratory failure, or shock.9 These characteristics of hemodynamic stability
should be assessed during the acute phase in the hospital to enable evaluation of the likely risk of
patient mortality due to PE.9 Risk stratification is not straightforward as some patients who
present as normotensive are still at an increased mortality risk.
3.6.1 Risk Stratification Tools: Wells, rGeneva, and PERC
Explicit clinical prediction rules supplement implicit clinical judgement. Validated clinical
prediction tools include the Wells’ Criteria, the revised Geneva score, and the Pulmonary
Embolism Rule out Criteria (PERC). These can aid clinicians in stratifying patients into low,
intermediate, or high probability groups, or into “PE likely” and “PE unlikely” groups.29
3.6.2 Wells’ Criteria
The Wells’ Criteria for PE quantifies the risk of PE and provides an estimated pre-test
probability.30
The Wells Criteria uses seven criteria to assess the possibility of a PE (Table 2).
Each criteria is associated with a certain number of points, with evidence of DVT having the
most points, and therefore the highest weighting, and hemoptysis (coughing up blood) and
malignancy associated with the lowest number of points 31
. All points are summed to provide a
probability of having PE, with a maximum total of 12.5 points. Scores are interpreted based on
three tiers; low probability is less than two points, moderate probability is 2-6 points, and high
probability is greater than 6 points 31
.

19
Table 2: Wells Criteria Tool31
Clinical Signs and Symptoms of PE Points*
Evidence of DVT (leg swelling, pain with palpation) 3
Heart rate higher than 100 beats per minute 1.5
Previous objectively diagnosed DVT or PE 1.5
Immobilization for three or more consecutive days or surgery in the previous
four weeks
1.5
Hemoptysis 1
Malignancy 1
PE as a highly likely diagnosis 3
*Probability of PE: <2 points=low, 2-6 points=moderate, >6 points=high
A simplified Wells’ criteria has also been developed 29
. The simplified Wells scoring system
replaces the weighted scores for each criteria with a 1 point score for all present symptoms and
clinical signs 29
. The total score is summed, with a highest possible score of 7 points. Using the
simplified Wells’ Criteria, a score less or equal to 1 is considered unlikely, and a score of greater
than 1 is considered likely 29
.
The weighted and simplified Wells’ Criteria have been validated in both inpatient and
emergency department settings. They are simple to use and provide straightforward cutoffs for
the predicted probability of PE. Although Wells’ has received some criticism for its involvement
of more “subjective” criterion, Wells’ also has the potential to reduce the number of CT scans
performed on low-risk PE patients.30
It is also important to note that: 1) Wells’ should only be
used in patients with a clinical suspicion for PE, and 2) Wells’ does not diagnose PE but rather
Wells is a risk stratification tool identifying pre-test probability and to guide appropriate further
testing. 32,33
3.6.3 rGeneva Score (Revised Geneva Score)
Similar to the Wells Score, the Revised Geneva Score provides a tool to quantify the risk of PE.
The rGeneva Score is often the preferred score due to its objectivity 34
. The original Geneva

20
score was criticized for its inclusion of both a Chest X-ray and arterial blood gas to be applied;
the revised score does not include these.
The rGeneva score uses nine variables to identify PE risk. As with the Wells’ Criteria, these
variable are weighted using points; having a heart rate over 95 beats per minute is given the most
weight, with 5 points assigned 34
. A total of 17 points may be assigned, plus an additional 4
points if the heart rate is between 75-94 beats per minute or an additional 5 points if the heart
rate is above 95 beats per minute. Based on these scores, the rGeneva stratifies patients in to low,
intermediate or high risk; 0-3 points indicates low probability of PE, 4-10 points indicates
intermediate probability, and 11 or more points indicates high probability 34
.
By identifying low risk patients, the rGeneva score provides assistance in decreasing the number
of unnecessary imaging tests performed for PE.34
Similar to the Wells score, the rGeneva is not
meant to diagnose PE but rather to guide workup and testing by predicting pre-test probability of
PE.34
Table 3: Revised Geneva Score Tool 34
Variable Score
Age 65 or older 1
Previous DVT or PE 3
Surgery or fracture within 1 month 2
Active malignant condition 2
Unilateral lower limb pain 3
Hemoptysis 2
Heart rate 75-94 beats per minute 3
Heart rate 95 or more beats per minute 5
Pain on deep palpation of lower limb and unilateral edema 4
*0-3 points indicates low probability, 4-10 points indicates intermediate probability, 11 or more points indicates
high probability
As with the Wells’ tool, there is also a simplified version of the Revised Geneva Tool 29
. The
simplified Geneva Tool replaces the weighted scores for each criteria with a 1 point score for all

21
variables, with the exception of having a heart rate over 95 beats per minute, which receives 2
points 29
. The total score is summed, with a highest possible score of 10 points. Using the
simplified Geneva Tool, a score of 2 or less is considered unlikely to have PE29
.
3.6.4 Pulmonary Embolism Rule-out Criteria (PERC)
The PERC rule can be applied to patients with a low-risk of PE but where PE diagnosis is being
considered.35
Using a series of 8 questions, PERC allows a physician to evaluate the risk of PE.
PERC is a “rule-out” tool; if the answer to all eight questions is “no,” no testing is required.35
It
is also a unidirectional test; while PERC negative allows for the avoidance of further testing,
PERC positive does not necessarily lead the clinician to order further tests.35
Figure 2: Pulmonary Embolism Rule-out (PERC)
Pulmonary Embolism Rule-Out Criteria
Is the patient >49 years of age?
Is the pulse rate >99 beats per minute?
Is the pulse oximetry reading <95% while the patient breathes room air?
Is there are present history of hemoptysis?
Is the patient receiving exogenous estrogen?
Does the patient have a prior diagnosis of venous thromboembolism?
Has the patient had recent surgery or trauma requiring endotracheal intubation or
hospitalization in the previous 4 weeks?
Does the patient have unilateral leg swelling? *If the answer to all questions is “no,” then diagnostic testing is not necessary
In the case of a low-risk patient who is not PERC negative, the physician should consider d-
dimer for further evaluation.35
If this d-dimer is negative and pre-test probability is <15%, the
patient may not require further testing for PE.35
If the d-dimer is positive, further testing such as
CT-angiography or V/Q scan is warranted.35
It is important to note that PERC should not be
utilized for patients with moderate or high risk of PE. In these cases d-dimer or imaging testing is
required.35
3.7 Diagnostic Tests for PE
There is yet to be developed a single noninvasive test for PE that has achieved perfect specificity
and sensitivity as well as minimized risk, although attempts to optimize the value of history and

22
physical examination are continuous.7,36
Often, a combination of CT and one or more additional
tests are used. Four non-CT tests (d-dimer, V/Q scanning, leg ultrasound and MRI scanning) are
commonly used to diagnose PE. Some of these tests, such as d-dimer, are primarily only
adequate for ruling out PE, while others such as ventilation–perfusion (V/Q) lung scanning, have
the ability to both rule out and diagnose PE.37
3.7.1 Pulmonary Angiography
An angiogram is an X-ray test that uses iodine dye and a camera (fluoroscopy) to take images of
the blood flow in an artery or a vein.38
A pulmonary angiogram is defined as an angiogram of the
blood vessels of the lungs.39
During the test, a catheter (thin tube) is placed in a blood vessel in
either the groin or just above the elbow, and subsequently guided towards the lungs.38
The
iodine dye (contrast material) is then injected into a vessel; this dye and the use of fluoroscopic
x-rays allow the healthcare professional to clearly see the vessels that send blood to and from the
lungs.38,39
Diagnostic criteria for acute PE in direct angiography involve direct evidence of a
thrombus, either a filling defect or amputation of a pulmonary artery branch.40
From the late 1960s onwards, pulmonary angiography had been considered the “gold standard”
imaging test for diagnosing PE.40,41
Direct angiography allows for the visualization of thrombi as
small as 1-2 mm within subsegmental arteries.42
However, this test is invasive and did not avoid
exposing the patients to hazards, including a slight mortality risk.43
The risks and costs
associated with pulmonary angiography and the availability of alternatives have warranted an
increase in the use of non-invasive diagnostic approaches for PE. The more recent development
of new, non-invasive diagnostic techniques such as CT in the 1990s have decreased the role that
direct pulmonary angiography plays in the diagnosis of PE; it is now rarely used as a sole
diagnostic procedure.40
3.7.2 D-dimer
D-dimer forms in the body when cross-linked fibrin is lysed (dissolved or destroyed) by
plasmin.37
It reflects the ongoing activation of the hemostatic system.37,44
D-dimer testing
involves the conduction of a blood test to measure a substance that is released after a blood clot
breaks up.45
A low or normal d-dimer test result indicates that only a minor amount of the

23
substance released as the clot breaks up; thus, problems resulting from this blood clot are not
likely. A higher than normal d-dimer level signals the potential for a blood clot issue to develop;
d-dimer levels are often higher than normal in patients with abnormal blood clotting.45
Elevations of D-dimer are non-specific; for instance, D-dimer is increased by aging,
inflammation or cancer, and thus an abnormal result has a low positive predictive value. With
respect to the role of d-dimer testing in the diagnosis of PE, a negative D-dimer result can assist
in the exclusion of PE. The clinical probability estimate, determined by information from the
patient’s history and physical examination, can be assessed by either a formal numerical
model,30,46
or an informed intuitive estimate.47,48
D-dimer testing as an assistant in the diagnosis of PE can be divided between two types of D-
dimer assays, very highly sensitive and moderate-to-highly sensitive. Very highly sensitive D-
dimer assays1 have a sensitivity for PE of around 98% or higher.
37 The high negative likelihood
ratio of these assays is sufficient to rule out PE in all patients; thus these assays may be
considered a “standalone” test for the exclusion of PE.49
Moderate to highly sensitive D-dimer
tests have a sensitivity for PE of around 85%-98%.37
Because the negative likelihood ratio and
predictive value of these tests are not high enough to rule out PE in consecutive patients, a
normal result must be combined with an additional assessment which classifies patients as
having a lower pretest probability for PE. European Society of Cardiology guidelines state that
in 32-40% of patients with low to intermediate pretest clinical probability and normal D-dimer
levels, PE can be safely excluded without further testing.50
3.7.3 Ventilation/Perfusion (V/Q) Scanning
A lung V/Q scan is an imaging test that involves two nuclear scan tests to measure breathing
(ventilation) and circulation (perfusion) in all areas of the lungs.51
These tests may be done
separately or together.51
The ventilation scan measures air flow into the lungs;52
the patient will
breathe in radioactive gas through a mask while sitting or lying under the scanner arm.51
The
perfusion scan observes where blood flows in the lungs;52
a radioactive albumin is injected into
1 * Assay: investigative (analytic) procedure in laboratory medicine, pharmacology, environmental biology and molecular
biology for qualitatively assessing or quantitatively measuring the presence, amount, or functional activity of a target entity
24
the patient’s vein, and then the scanner observes the lungs as blood flows through them to find
the location of the radioactive particles.51
Although there is a slight exposure to radiation from
the radioisotope, no radiation is released from the scanners; rather they detect radiation and
convert it into an image.51
The healthcare professional then evaluates the ventilation scan and
the perfusion scan with a chest x-ray.51
Results that show the lungs taking up lower than normal
amounts of radioisotope during either of the scans may be indicative of a pulmonary embolus.51
A normal perfusion scan can exclude PE,53
although only around 25% of patients have a normal
perfusion scan.46
Perfusion defects are nonspecific, and PE is found in a third of patients with
perfusion defects. However, the probability that PE is causing perfusion defects will increase
with increasing size and number of defects, as well as the presence of a normal ventilation scan
and features of perfusion defects such as a wedge-shaped area in the lung periphery. 37,47,54
The
V/Q test is based principally on an intravenous injection of macroaggregated albumin particles,
which block a small fraction of pulmonary capillaries and thus allow for scintigraphic
assessment of lung perfusion at the tissue level.55
Perfusion scans are combined with ventilation
studies for the purpose of increasing specificity. Lung scan results assisting in the diagnosis of
PE are typically classified into four categories depending on criteria established in the North
American PIOPED trial: normal or near-normal, low, intermediate (non-diagnostic), and high
probability of PE.56
Numerous clinical outcome studies evaluating the validity of a normal
perfusion lung scan have concluded that it is a safe practice to withhold anticoagulant therapy in
patients with a normal perfusion lung scan.57,58
A 2014 systematic review and meta-analysis assessing the accuracy of V/Q SPECT in the
diagnosis of PE found that the sensitivity and specificity of this technology using a per-patient-
based analysis was 96% (95% CI: 95-97%) and 97% (95% CI: 96-98%)59
. The area under the
receiver operator curve was 0.99 in this per-patient-based analysis59
. The authors of this study
conclude that V/Q SPECT is an accurate method of diagnosing PE with a high sensitivity and
specificity59
.

25
3.7.4 Magnetic Resonance Imaging (MRI)
MRI scanning employs radio frequency waves and a powerful magnetic field to produce detailed
images of internal structures.60
While MRI scans have been used to observe areas of the body
for some decades, MRI for the chest has developed relatively recently.61
Several challenges that
had previously impeded its use included the motion of both heart and lungs, the lack of protons
within the chest, poor contrast between flowing blood and an embolus, and susceptibility
artifacts resulting from the interfaces between air and soft tissues.61-65
However, novel
sequencing, combined with increased gradient-strength systems, facilitated the advent of lung
perfusion MRI, direct thrombus imaging of the entire venous system, and the introduction of
hyperpolarized 3-helium, allowing high-resolution lung ventilation imaging. The development of
faster magnetic resonance hardware, combined with a dynamic gadolinium enhancement of
contrast dye, has made high-resolution angiography possible during a single suspended breath.66
This new three-dimensional magnetic resonance angiography during a single breath hold can be
used as a safe, fast and accurate assistive imaging technique for the diagnosis of PE.66
Today, a
wide range of MRI techniques may be applied for diagnosis of VTD and PE.61
MRI is a
relatively costly technology and thus is often reserved for pregnant women to avoid radiation to
the fetus, and for patients whose kidneys may be harmed by dyes used by other tests.60
Nonetheless, current MRI technology exhibits a high specificity and sensitivity for proximal PE,
and a positive result may aid in clinical decision making.67
MRI’s inherent lack of ionizing
radiation has been underscored both in general use of MRI to diagnose PE, and in pregnant
patients.68,69
A systematic review and meta-analysis by Zhou et al. assessed the accuracy of MRI for the
diagnosis of PE70
. Based on fifteen studies, this study found an overall sensitivity and specificity
of 0.75 (95% CI: 0.70-0.79) and 0.84 (95% CI: 0.80-0.87) using a patient-based analysis70
. The
authors concluded that MRI yielded high diagnostic accuracy, but that motion artifact and poor
arterial opacification resulted in inconclusive MRI exams in 18.89% of the participants70
.
3.7.5 Lung Ultrasound (LUS)
Since its emergence approximately 15 years ago,71
lung ultrasound technology has been
increasingly used to complement conventional assessment methods and other imaging modalities
of the lung in the diagnosis of PE.72
Traditionally used to assess pleural effusions and masses,

26
LUS has been revolutionized to image the pulmonary parenchyma, primarily as a point-of-care
technique.71
In general, the ultrasound imaging process has significant differences from
radiographic imaging in which x-ray beams are used. LUS can be performed in any position and
on the entire chest, laying the probe in the intercostal spaces and avoiding the ribs.71
The probe
is placed both longitudinally, perpendicular to the ribs, and obliquely along the intercostal
spaces.71
Ultrasound machines are lightweight, compact, easy to transport and robust, thus
allowing multiple bedside examinations.73
LUS is also not only easily available at bedside but,
similar to MRI scans, can be performed with the absence of an ionizing radiation risk.73
In
addition to lower limb compressive venous ultrasonography and echocardiography, lung
ultrasound can play an important role in the diagnosis of PE in selected patients’ subgroups.74
It
can be safely used under conditions of both pregnancy and renal insufficiency, and can be highly
useful as a bedside test for hemodynamically unstable patients.74
LUS provides accessibility to
only two-thirds of the lung area and thus more central lesions may potentially be missed.74
A
2013 systematic review of studies involving a total of 887 patients and evaluating the diagnostic
accuracy of LUS for the diagnosis of PE found bivariate weighted mean sensitivity to be 87.0%
(95% CI 79.5, 92.0%), and bivariate weighted mean specificity was 81.5% (95% CI 71.0,
89.3%).75
However, not all hospitals have access to fulltime LUS and many emergency
physicians lack the skills to perform and interpret this technically difficult exam on their own.
3.7.6 Echocardiogram
An echocardiogram is a sonogram of the heart. Information from Doppler ultrasound, B-mode
ultrasound, and M-mode ultrasound are combined to create images of the heart. These images
provide information about the size of the heart, the function of the valves, and the strength of the
heart muscle. The echocardiogram is used to identify areas of the heart that are not working well.
When patients with a PE have an echocardiogram, approximately 40 percent will be found to
have abnormalities of the right side of the heart, particularly the right ventricle. While an
echocardiogram is not actually used to diagnose a PE, it can identify strain on the right side of
the heart caused by a large PE as well as certain heart problems that may imitate a PE.

27
3.8 Computed tomography (CT) Overview
A technology that has revolutionized diagnostic radiology,76
CT is defined as a form of
radiography in which a three-dimensional image of a body structure is constructed by computer
from a series of plane cross-sectional images made along an axis.77
The CT scanner sends X-rays
through the body, with each rotation of the scanner producing images of a thin slice of the area.
Clinicians using conventional CT were subject to various limitations such as poor x-axis
resolution, a scan plane resolution of only ~1-2 lp/mm, section-to-section misregistration due to
variations in patient respiratory motion.78
Conventional CT also resulted in an inter-scan delay
from the stop-start actions of table translation and cable unwinding.78
Yet since its invention in
1972, CT has evolved significantly. The first two major leaps in the evolution of CT were spiral
or helical CT in the early 1990s, and multiple-row detector CT in the late 1990s to 2000s.78
The categorization of CT use is based on the population of patients (adult or pediatric) and the
purpose of imaging (either diagnosis in symptomatic patients or screening of asymptomatic
patients).76
Although diagnosis using CT is most often used for adults, CT use has increased
pediatric diagnosis and adult screening; a trend that is expected to continue.76
3.8.1 Types of CT
3.8.1.1 Single detector CT (SDCT)
The primary characteristic of SDCT hardware is denoted by its composition of a one-
dimensional set of detector arrays.79
SDCT capabilities include the elimination of inter-scan
delay, large tissue volumes scanned in short times, and improved Z axis resolution by over-
sampling.78
The SDCT also permits over-sampling without an increased dose of radiation.
However, single slice CT has various limitations including poor utilization of the X-ray tube, it is
only capable of near isotropic resolution over small volumes, and large volume scans in short
durations are limited.78
3.8.1.2 Multi Detector CT (MDCT)
The most significant difference between single-slice CT and MSCT hardware lies in the design
of the detector arrays.79
The linear array of elements used in conventional and helical CT scans
was replaced; in MDCT, each of the individual, SSCT detector elements in the z-direction is

28
divided into many smaller detector elements.79
This forms a two-dimensional array of detector
elements with anywhere between 4-64 rows.80
MDCT allows for CT scanners to acquire multiple
slices or sections simultaneously (in one rotation), for increased resolution. MDCT allows for a
significant increase in the speed of CT image acquisition, and also involves a more complex
image reconstruction compared to single section CT. 80
The introduction of multidetector over
single-detector techniques has increased the number of subsegmental (presence of PE on
subsegmental level only) PE diagnoses.81
It has also lead to the subsequent development of
higher-resolution CT imaging such as CT angiography.81
Figure 3:79 (Left) SSCT arrays containing single, long elements along z-axis.
(Right) MSCT arrays with several rows of small detector elements.
3.8.1.3 Dual Source CT (DSCT)
In contrast to a conventional multislice CT which uses a single X-ray generator, Dual source CT
is equipped with two X-ray tubes, each with different energy levels.82
Two corresponding
detectors with an angular offset of 90 degrees are oriented in the gantry. Thus, DSCT is
characterized by its two different operating modes: two X-ray sources and two detectors, used at
the same time in different scanning modes.82
This setup allows for a higher level of
information/resolution to be obtained, while reducing the radiation dose by up to 50% as
compared to a single source CT.82
However, currently DSCT provides no significant additional
benefit for diagnosing PE, and the full range of applications of novel Dual Energy information is
still under clinical investigation.82

29
Figure 4:82
Dual Source CT equipped with two X-ray
tubes. Courtesy of: Siemens AG
Figure 5:82
Conventional multislice CT with one X-
ray generator. Courtesy of: Siemens AG
3.8.1.4 Helical (Spiral) CT
Helical CT was introduced in the early 1990s and is characterized by its fast speed and
continued volumetric acquisition as the patient moves through the gantry.83
Complete helical CT
exams can be performed in under five minutes,84
with the scan’s ability to image the entire lung
during a single breath-hold and the associated decrease in image misregistration.85
Besides
shortened examination time, helical CT has improved visibility of vascular structures, the
capability for retrospective imaging and three dimensional vascular studies, and potential
reduction in the required amount of contrast material.83
These scanners are also equipped with
multiple parallel detector arrays, which acquire a higher level of data per scan rotation and as
well as added data to display unique representations of intrathoracic structures.83
Yet even these advances in CT technology have not avoided potential pitfalls. Even with its
improved visibility, the use of spiral CT has limitations in terms of the accurate diagnosis of
small peripheral emboli.86
Moreover, although it is noninvasive spiral CT use is still associated
with radiation exposure risk.86
3.8.1.5 Single Photon Emission CT (SPECT)
SPECT involves the fusing or merging of images from two different types of scans taken; a CT
scan and a radioactive material (tracer). The tracer allows the clinician to observe blood flowing
to tissues and organs.87
Centres for nuclear medicine are increasingly using SPECT techniques
over the planar technique for diagnosing PE; SPECT technology has been proven to have fewer
indeterminate results and a higher diagnostic value.55
One of the most current advances is a

30
combination of a low-dose CT scan with a Ventiliation/Perfusion (V/P) SPECT scan in a hybrid
tomograph.55
3.8.2 CT Scan Parameters2
Different types of CTs use different scan parameters, such as tube potential, tube current, scan
time, collimation and helical pitch (Table 4). There are also different reconstruction parameters
which specify how the image is viewed (Table 4). Studies that use CT often report the scan and
reconstruction parameters to provide the necessary details to replicate the results.
Table 4: CT Scan Parameters
Scan Acquisition Parameters Tube Potential The electric potential applied across an x-ray tube to
accelerate electrons towards a target material.
Expressed in units of kilovolts. For CT, generally
(80-140 kV) voltage between cathode and anode.
Scanner feature- depends on brand and detector type
(single or multi).88
Tube Current The number of electrons accelerated across an x-ray
tube per unit time. Expressed in units of milliampere
(mA). (20-500 mA) current flowing through filament.
Scanner feature- depends on brand and detector type
(single or multi).88
Tube current-
time product
The product of tube current and exposure time per
rotation, expressed in units of milliampere seconds
(mAs).
A. In axial scan mode, this is equal to:
tube current * (scan angle / 360) *
rotation time
B. In helical scan mode, this is equal
to: tube current * rotation time. 88
Scan time CT scanners have the ability to acquire data for a slice
typically between 0.5-4 seconds.89
Collimation/slice
width
The number of slices. The smaller the slice width
(ranging from 0.5-10mm), the higher the scan time.88
Helical pitch A unit-less parameter used to describe the table during
helical CT; equal to table travel (mm) per gantry
rotation divided by total nominal beam width (mm)
(0.5-3)- higher the pitch, more area that covers.88
Reconstruction Parameters Field of view
(FoV) (10-50
cm)
Width of the square region mapped to the
reconstructed image matrix. Scan area. A smaller FoV
provides better resolution.88
Reconstruction A matrix of small boxes of tissue called voxels, each
with attenuation coefficient, that forms the scanned
2A comprehensive overview of the principles of CT technology within the evolutionary context of CT can be found
in “Principles of CT and CT Technology” by Lee W. Goldman.

31
Matrix slice.90
If a 512 x 512 matrix is used (as is common
today), each voxel is approximately 0.5 x 0.5 mm.90
X-Ray transmission measurements (Ni) can be
expressed as the sum of attenuation values occurring
in voxels along the pay of ray for Ni.90
As such, the
objective of CT image reconstruction is to determine
how much attenuation of the narrow x-ray beam
occurs in each voxel of the reconstruction matrix.90
Reconstruction
Filter
A scan data processing method that defines the quality
of view by determining sharpness or smoothness of
the image in the axial plane.88
Reconstruction
Interval
The distance between two consecutive reconstructed
images (i.e. 1.25 mm). Alters the view and quality,
and has a thinning property.88
Using CT to Diagnose PE
As a fast and non-invasive technology, CT is often one of the first-line modalities for imaging of
pulmonary circulation in patients with suspected PE.81
CT can also reveal the extent of the PE,
identify signs of right ventricular dysfunction, as well as provide alternative diagnoses.50 9
CT acquires images of the lung using a breath hold technique during the pulmonary arterial
enhancement phase following the injection of intravenous contrast material. Similar to
observations discovered through means of pulmonary angiography, the PE would appear as a
filling defect in the pulmonary artery as it becomes more opaque from the
contrast. Further advances in CT technology such as multidetector rows have allowed for
a highly refined and detailed evaluation of the entire pulmonary vascular tree, and significant
improvements in the detection of peripheral PE. Due to its noninvasive nature as well as its
sensitivity and specificity, CT is currently considered the first line imaging tool for the
evaluation of suspected PE.
CT use for diagnosis of PE is increasing at a rapid pace due to large advances in technology that
make CT user friendly for both the physician and patient.76
However, compared to conventional
x-ray imaging procedures, CT exposes patients to higher doses of radiation. CT 16-array or
greater delivers a higher absorbed dose (8-20 mSv3) to breast tissue than conventional V/Q
3 mSv- radiation dosimetry. The average accumulated background radiation dose to an individual for 1 year, exclusive of radon,
in the United States.

32
imaging (0.6-3 mSv).91
These differences reflect variations in size and configuration of breast
tissue, CT parameter settings, and the methods used to measure radiation dose.91
Risk associated
with radiation exposure also depends on patients’ age; patients above 40 years have lower risk
due to the relatively lower life expectancy after this age, and the latency period of tumors
induced by radiation.76,81,92
Although data on the carcinogenic potential at relatively low dose
CT imaging are lacking, the excess stochastic risk of fatal cancer induction in a standard person
undergoing CT with the current effective dose of 3-6 mSv is 15-30 excess deaths per 100,000
persons.93,94
Various developments in CT imaging such as helical/spiral CT have enhanced the detection of
small emboli as well as visuals of peripheral pulmonary arteries.95
New technologies such as
multi-detector row CT have also allowed for improvements towards optimizing contrast material
delivery, and reducing radiation dose.95
3.9 Treatment
Unless bleeding risk is high, anticoagulation therapy is recommended as the primary treatment
for patients with a high pre-test probability of PE.96,97
If administered promptly, anticoagulation
is effective at preventing a thrombus from extending proximally and at decreasing mortality and
morbidity associated with PE.98
Therapeutic goals for PE depend on the severity but typically
involve the prevention of thrombus growth, restoration of pulmonary blood flow and the
prevention of recurrences.9
Thrombosis Canada has developed a comprehensive set of guidelines for the treatment of PE in
Canada.97
In patients with intermediate and low pre-test probabilities of PE, treatment may be
withheld under the condition that definitive diagnostic testing will be completed within 4 hours
(intermediate pre-test probability) or 24 hours (low pre-test probability). Patients with a high pre-
test probability of PE should be treated with anticoagulation therapy. All patients with a
confirmed PE diagnosis should be risk-stratified to determine whether outpatient management
will be sufficient or if in-hospital treatment is required. If a patient presents with hypotension
that is due to a cause such as tachycardia or sepsis, or is not responsive to a small fluid challenge,
risk of early mortality lies at 15% and thus the patient should be admitted and considered for

33
thrombolytic therapy.97
PE-confirmed patients who are clinically well and present with no
evidence of right ventricular dysfunction or myocardial injury have a significantly lower
mortality risk (<1%) and thus home treatment or early discharge may be appropriate.97
Recommendations for duration of treatment are below in Table 5.
Table 5: Thrombosis Canada, Recommendations for Duration of Treatment of PE or DVT
Although not a professional guideline body, the Canadian Agency for Drugs and Technologies in
Health (CADTH) has published treatment recommendations for optimal treatment use. CADTH
recommends that the standard of care for patients diagnosed with PE follow the approach of
systematic anticoagulation with heparin (low-molecular-weight heparin [LMWH], administered
subcutaneously) followed by oral administration of vitamin K antagonists (VKAs).99
VKAs
overlap with LMWH until sufficient anticoagulation with oral agents is achieved. To avoid

34
inadequate anticoagulation (associated with increased risk of recurrent VTE and PE), or
supratherapeutic anticoagulation (associated with increased bleeding risk), the degree of
systemic anticoagulation achieved with VKAs should be monitored with blood tests and dose
adjustment.99
3.10 Clinical Practice Guidelines
3.10.1 Canadian Clinical Practice Guidelines
In 2015 Thrombosis Canada published a clinical guideline for all Canadian health care
professionals with the intention of defining a diagnostic algorithm and treatment strategy for
patients with acute PE.100
Thrombosis Canada is a Canadian registered non-profit organization,
which was established in 1991. This organization membership includes eminent and
internationally recognized thrombosis experts, who have made many contributions to the body of
knowledge in vascular medicine. The guideline recommends that clinical stability and pre-test
probability dictate the diagnostic approach. The guideline provides a suggested diagnostic
algorithm for suspected PE (Figure 6). In patients without hypotension, pretest probability
should be assessed by an experienced clinician and possibly a validated clinical prediction rule
such as the Wells Score. The guideline subsequently states the following recommendations for
low to intermediate, and high pre-test probability of PE:100
Low to intermediate pre-test probability: A negative D-dimer result rules out the
diagnosis of PE. However, a positive D-dimer test should be followed by a definitive test
to confirm or refute diagnosis.
High pre-test probability: No value in checking a D-dimer level as a negative results’
post-test probability would be unacceptably high. Thus, the patient should be taken
directly to CT testing to establish diagnosis.
Low clinical probability and in the absence of D-dimer testing: Diagnosis can be safely
excluded using the PERC rule for PE.

35
Figure 6: Suggested Diagnostic Algorithm for Suggested PE100
SBP: Systolic Blood Pressure, CTPA: CT Pulmonary Angiography, PE: Pulmonary Embolism
For patients with an allergy to contrast dye in whom a CT would be contraindicated, the
guideline suggests looking initially for evidence of DVT through lower extremity compressive
ultrasound (CUS).100
A positive result would mandate the same treatment as PE, and no further
investigation is required. A negative result would also not rule out PE as up to 30% of patients
will not have DVT and PE concurrently; in this case, a V/Q scan should be obtained. If CT is not
readily available or if the patient has hypertension and is not able to undergo the scan, an
immediate echocardiogram should be obtained to search for evidence of a right heart overload or
a clot in the RV or pulmonary arteries. If this evidence is found and no alternative diagnosis is
given, treatment for PE should be commenced.100

36
As referred to under the subheading “Treatment” above, Thrombosis Canada has also published
a clinical guideline for the treatment of PE, with the aim of providing an evidence based
approach to diagnosis and treatment of patients with acute PE.97,101
3.10.2 Calgary Clinical Practice Guidelines
Calgary, Alberta has established a program to aid in the diagnosis of PE, headed by the Calgary
Zone Emergency Medicine Division. This program has designed a clinical decision support tool
to align CT use for PE to appropriate practice4. This tool is integrated into the electronic
management system (Sunrise Clinical Manager) in the Calgary zone.
When a physician orders a CT for a relevant patient encounter, the clinical decision support tool
is triggered. The tool first queries whether the clinician suspects PE; if no, the physician is
informed that the tool is not designed for this purpose, if yes, additional questions follow. The
physician is asked whether the patient has any of the following exclusions: unstable patient,
known DVT or PE, anticoagulation, or is pregnant. If none, the physician follows a series of
questions to determine the patient’s Wells score, including clinical signs and symptoms, heart
rate, history of DVT or PE, and malignancy. Based on the calculated Wells Score, a
recommended pathway is given. The pathway used for diagnosing PE within this clinical
decision support tool is as follows:
Wells Score <2: PERC, followed by D-Dimer and then CT
Wells Score between 2 and 4: D-Dimer followed by CT
Wells Score >4: CT, or if low-risk patient with normal chest x-ray, history of renal failure
or history of serious intravenous (IV) contrast reaction, then VQ scan used
Based on 3-months post-intervention data, uptake of this clinical decision support tool has been
43%. Uptake of this tool varies depending on whether use is mandatory or voluntary;
compliance varies between 0% and 75%, with the highest compliance being achieved at a site
that mandated use, while sites with low compliance had voluntary use. Eight-month data
4 The PE clinical decision support tool is available from the following link:
https://cdst.cru.ucalgary.ca/pe/assessment_tool/2333/

37
suggests that the yield has increased from 14.50% to 15.10% in the intervention arm and
decreased in the control arm from 14.3% to 14.0%. Moving forward, this program is considering
options for incentives and disincentives to improve uptake.
3.10.3 St Joseph’s Healthcare Program (Ontario) Clinical Practice Guidelines
St. Joseph’s Healthcare in Hamilton, Ontario implemented a clinical decision support tool
incorporating the simplified Wells criteria in 2013, with the objective of decreasing the number
of negative CT studies 102
. To evaluate the effectiveness of this program, 189 emergency room
patients were studied retrospectively after implementing a standardized requisition requiring
adherence to an algorithm based on the simplified Wells Score 102
. This clinical decision support
tool was implemented January 1st, 2013, and data were collected from January-March 2012, and
January-March 2013.
The pathway used for diagnosing PE within this clinical decision support tool is as follows 102
:
Wells Score ≤1: D-dimer, followed by empiric treatment (CT only with thrombosis
consult) as required
Wells Score >1: CT, followed by treatment for VTE and thrombosis consult as required
This diagnostic pathway differs from that of Thrombosis Canada; it is unknown how this
diagnostic pathway was developed and why it was chosen.

38
Figure 7: Diagnostic Pathway used at St, Joseph’s Healthcare 102
Using this tool, and diagnostic pathway, this program saw a 21.7% reduction in CT studies after
introducing the algorithm, and an increase in the number of positive CT studies (yield) from
13.2% to 21.7%; however, this result was not statistically significant with a p-value of 0.12 102
.
3.11 Ongoing Research
The Canadian Agency for Drugs and Technologies in Health (CADTH) is currently completing a
project on optimal strategies for the diagnosis of acute PE. This project includes an analysis of
the optimal diagnostic pathway for diagnosing PE, including risk stratification strategies. The
report will separately address the best strategies for urban, rural and remote settings. It is
anticipated that this guidance on diagnostic pathways will be completed June, 2017.

39
4 Diagnostic Accuracy
4.1 Objective
To determine the diagnostic accuracy of CT for diagnosing PE
4.2 Methods
Medline, Pubmed, Cochrane Database of Systematic Reviews, Database of Abstracts of Reviews
of Effect (DARE), Cochrane Central Register of Controlled Trials and CINAHL were searched
from inception until September 13, 2016. Terms aimed at capturing the technology such as
“CT,” “CTPA,” “Tomography Scanners,” and “CT” were combined using the Boolean Operator
“or.” These terms were then combined, using the Boolean Operator “and” with terms describing
the clinical condition, such as “pulmonary embolism,” “venous thromboembolism,” and “blood
clot.” Results were limited to English and French language studies, and conference abstracts
were filtered out. No other limitations or filters were applied. Details of this search can be found
in Appendix A.
All abstracts and titles were independently screened by two reviewers. Abstracts proceeded to
full-text review if: included only adults 18 years or older who were undergoing testing for acute
PE, assess CT technologies, report diagnostic test accuracy, clinical utility or harms, and were a
randomized controlled trial, non-randomized study or case series. Abstracts were excluded if
they failed to meet any of the above inclusion criteria, or if they: were single detector CT, did not
report original data, were not available in French or English, were duplicate publications, or were
case reports, conference abstracts, published thesis documents and evidence that has not been
A total of 5341 citations were identified from the literature search. Of those, 373
proceeded to full-text review. An additional 357 articles were excluded following full-text
review, and 14 articles were included in the final analysis
The pooled sensitivity was 84.8% (95% CI 81.7% to 87.5%) and the pooled specificity
was 93.0% (95% CI 90.9% to 94.6%).
These results indicate CT is more effective at correctly identifying subjects without PE
than correctly classifying patients with PE
Only one study reported safety outcomes. This study found that <1% of participants
experienced an adverse effect; all adverse symptoms were due to allergies to the contrast
material used during CT.

40
peer-reviewed. Abstracts selected for inclusion by either reviewer proceeded to full-text review.
This initial screen was intentionally broad to ensure that all relevant literature was captured.
Studies included after abstract review proceeded to full-text review in duplicate. Studies were
included if they met all inclusion criteria and failed to meet any of the criteria for exclusion
presented in Table 6. Full-text review was completed in duplicate. Any discrepancy between
reviewers was resolved through discussion, or consultation with a third reviewer when necessary.
Reference lists of identified eligible studies were hand searched to ensure all relevant articles
were captured in the search. In addition, articles identified by content experts were assessed for
eligibility.
Table 6. Inclusion and Exclusion Criteria for Clinical Systematic Review
Inclusion Criteria Exclusion Criteria
Adult patients 18 years or older
Undergoing testing for acute PE
Assessed CT technologies
Reports at least one of the following
outcomes:
o Diagnostic test accuracy
o Clinical utility (efficiency,
change in diagnostic thinking,
change in patient management,
change in patient outcomes,
identification of patients with
different diagnoses)
o Harms (radiation exposure, CT
attributed malignancy, contrast
nephropathy, allergic
reactions)
Study designs including:
o Randomized controlled trials,
non-randomized study, case
series
Single detector CT
Not original data
Full-text not available in French or
English language
Case reports, conference abstracts,
published thesis documents and
evidence that has not been peer-
reviewed
Duplicate publications
For all studies, data were extracted using standardized data extraction forms which were
designed a priori to document all relevant information from included studies. Data extraction was
conducted in duplicate by three teams of reviewers. All six reviewers piloted the data extraction
41
forms using randomly selected included studies until consistency amongst reviewers was
reached. Once consistency was reached, data from each included study was extracted by one
reviewer and checked for accuracy by a second reviewer. Data on study characteristics,
methodology, included patients and outcomes were extracted. Discrepancies between reviewers
during data extraction were resolved through discussion, or involvement of a third reviewer
when necessary. Authors from included studies were contacted to clarify any issues or provide
any missing information.
Three quality assessment tools were used, due to the heterogeneity of study design included in
this systematic review. Randomized Controlled Trials (RCTs) were assessed using the Cochrane
Risk of Bias checklist 103
. Using this checklist, each study was assessed for seven areas of bias
(random assignment generation; allocation concealment; blinding of participants and personnel;
blinding of outcome assessment; incomplete outcome data; selective reporting; and any
additional potential sources of bias) 103
. Each study is assigned “low, “high,” or “unclear” risk of
bias for each of these seven potential sources of bias.
The quality of diagnostic accuracy studies was assessed using the QUADAS-2 tool104
. The
previously published QUADAS-2 tool consisted of 11 signaling questions or assessment items
across four key domains: (1) patient selection; (2) index test; (3) reference standard; and (4)
patient flow and timing 104
.
The quality of non-comparative studies assessing safety of CT were assessed using the Moga
Checklist. This checklist assesses quality of studies in seven areas: study objective, intervention
and co-intervention, outcome measures, statistical analysis, results and conclusions, competing
interests and source of support. Within these seven domains, eighteen questions are assigned
“low,” “high,” or “unclear” risk of bias.
A narrative synthesis of all included studies is presented below. In addition, a meta-analysis was
conducted. Sensitivity and specificity of CT were the primary outcomes. Sensitivity quantifies
the ability of a test to correctly identify those with the target clinical condition (PE), whereas
specificity quantifies the ability of the test to correctly identify those without PE. The sensitivity

42
(true positive rate) and specificity (true negative rate) values of CT in diagnosing PE were
extracted from each included study and subsequently combined. Cochrane Q and χ2 statistics
were used to examine the heterogeneity of the included studies. A bivariate random effect model
was used in order to take the two-dimensional nature of the diagnostic accuracy data into
account105
. The model results in pooled point estimates of sensitivity and specificity together
with a confidence region. Further, a summary receiver operating characteristic (ROC) curve,
which provides information on the overall performance of CT in diagnosing PE through different
thresholds, was also obtained. In addition, from each included study, information on the type of
CT device used, relevant scan parameters and reference standards were extracted. All analyses
were completed in R using R package mada 106
.
4.3 Results
A total of 5341 citations were identified from the literature search. Of those, 4968 were excluded
during abstract review and 373 proceeded to full-text review. An additional 357 articles were
excluded following full-text review, and 14 articles were included in the final analysis (Figure 8).
4.3.1 Characteristics of Included Studies
Fourteen studies assessing diagnostic accuracy of CT were included; one randomized controlled
trial, ten prospective non-randomized studies and three retrospective non-randomized studies.
Characteristics of each included study have been synthesized in Table 7, and in Appendix A.
Three studies were conducted in China 107-109
, two in United States 110,111
, two in France 112,113
,
two in Germany 114,115
, and one in each: Japan 116
, Switzerland 117
, Belgium 118
, and Sweden 119
.
The studies were published between 2000 112,113
and 2015 116
.
The number of participants included in each study varied between 48 111
and 773 120
, with a total
of 2633 participants included in all fourteen studies combined. The inclusion and exclusion
criteria varied across studies. However, for all patients, there was a clinical suspicion of PE at the
point of inclusion.

43
Figure 8: Flow Chart
Number of records identified through
Database Searching
n=5337
Number of additional records
identified through other sources
n=4
*Identified via peer review feedback
Number of studies included in synthesis
n=14
Excluded (n=359):
Number of full-text articles assessed for
eligibility
n=373
Number of records excluded
n=4,968
Number of records screened
n=5,341
Number of records after duplicates removed
n=5,341
Iden
tifi
cati
on
S
creen
ing
E
lig
ibil
ity
In
clu
ded

44
Table 7: Synthesis of Characteristics of Included Studies
Author,
Year,
Country
Study Details Intervention Outcomes
Measured
Lu, 2014
China
Study Design: RCT
Setting of conduct: single center.
Imaging unit of a hospital.
Number of included participants: 100
Intervention: Dual source CT
Reference Standard: Consensus reading
Image
quality,
diagnostic
accuracy and
radiation dose
Megyeri,
2014
Switzerland
Study Design: Retrospective NRS
Setting of conduct: single center.
Emergency care unit of a tertiary-care
center
Number of included participants: 123
(Body Weight > 100kg); 114 (Body
Weight < 100 kg)
Intervention: Multi detector CT
Reference Standard: Composite
reference standard
Diagnostic
accuracy of
CT in two
patient
groups
Okada, 2015
Japan
Study Design: Retrospective NRS
Setting of conduct: single center.
Setting unclear.
Number of included participants: 83
Intervention: Multi detector CT
Reference Standard: CT / LPBV +
clinical and physical findings
Number and
locations of
intra-
pulmonary
clots,
Diagnostic
accuracy
values
Stein, 2006
International
Study Design: Prospective NRS
Setting of conduct: Multi center.
Inpatient or outpatient clinical centers
Number of included participants: 773
Intervention: Multi detector CT
Reference Standard: Composite
reference standard
Diagnostic
accuracy of
CT
Coche, 2003
Belgium
Study Design: Prospective NRS
Setting of conduct: single center.
Emergency department of urban
teaching hospital with an annual census
of 50,000 patients
Number of included participants: 94
Intervention: Multi detector spiral CT
Reference standard: Ventilation-
perfusion (V-P) scintigraphy, pulmonary
digital subtraction angiography when
indicated, and chest radiography
Episodes of
recurrent or
new deep
venous
thrombosis or
PE;
Diagnostic
accuracy of
CT
Quandli,
2000
France
Study Design: Prospective NRS
Setting of conduct: single center.
Department of radiology
Number of included participants: 158
Intervention: Dual section helical CT
Reference Standard: Pulmonary
Arteriography
Presence of
PE,
Diagnostic
accuracy of
CT
Wang, 2009
China
Study Design: Prospective NRS
Setting of conduct: single center.
Department of internal medicine
Number of included participants: 82
Intervention: Multi detector CT
Reference Standard: based upon all
imaging modalities, all available
laboratory recorders, clinical data, the
opinions of the physicians responsible
for treatment and outcomes.
.
Diagnostic
accuracy of
CT
Winer-
Muram,
2004
USA
Study Design: Prospective NRS
Setting of conduct: single center.
emergency room and inpatient
populations of tertiary care center and
a public hospital
Intervention: Multi detector CT
Reference Standard: Pulmonary
Arteriography
Presence of
PE,
Diagnostic
accuracy of
CT

45
Number of included participants: 93
Blachere,
2000
France
Study Design: Prospective NRS
Setting of conduct: single center.
inpatients, outpatient, intensive care
unit
Number of included participants: 179
Intervention: Helical CT
Reference Standard: All patients
underwent ventilation–perfusion
radionuclide lung scanning, contrast-
enhanced helical CT angiography, and
Doppler sonography of the legs
Recurrence of
PE or of a
VTE
Diagnostic
accuracy of
CT
Ohno, 2004
USA
Study Design: Prospective NRS
Setting of conduct: single center.
Setting unclear
Number of included participants: 48
Intervention: Multi detector CT
Reference standard: pulmonary
angiography
Diagnostic
accuracy of
CT
Reinartz,
2004
Germany
Study Design: Retrospective NRS
Setting of conduct: single center.
Setting not reported.
Number of included participants: 83
Intervention: Multi slice spiral CT
Reference Standard: Consensus reading
Diagnostic
accuracy of
CT
Reissig, 2001
Germany
Study Design: NRS
Setting of conduct: single center.
Setting not reported.
Number of included participants: 69
Intervention: Spiral CT
Reference Standard: CT and
transthoracic
sonography
Diagnostic
accuracy of
CT
He, 2012
China
Study Design: NRS. Cross sectional
Setting of conduct: Multi center.
Secondary care centers (including
academic centers).
Number of included participants: 544
Intervention: Multi detector CT
Reference Standard: clinical data,
laboratory recorders (D-dimer and
Doppler US available), imaging
information (e.g., echocardiography),
CT, V/Q, right heart cardiac
catheterization, and PA (performed in
patients with indeterminate tests by
other modalities) as well as physician
opinions and 6-month clinical follow-up
Diagnostic
accuracy of
CT
Nilsson, 2002
Sweden
Study Design: Prospective NRS
Setting of conduct: Single center.
Emergency ward.
Number of included participants: 90
Intervention: Spiral CT
Reference Standard: Pulmonary
Angiography
Diagnostic
accuracy of
CT
NRS: Non-randomized Study

46
Each study has used its own CT scan protocol with different scan parameters. Table 8
summarizes the variation of common scan parameters across studies. Four studies have used a
composite reference standard that was a combination of clinical probability, additional imaging,
follow-up, all available laboratory records and physicians’ opinions, as the reference method to
derive diagnostic ability of CT 108,109,117,120
. Four studies have used combined imaging tests that
include two or more of CT, transthoracic ultrasound, ventilation-perfusion, Doppler sonography,
and Pulmonary angiography, as the reference method 113,115,116,118
. Pulmonary arteriography /
angiography was used as the reference method in another four studies 110-112,119
. Two studies
have used consensus reading as the reference standard 107,114
.
Table 8: Between study variability of CT scan parameters
Study Scan parameters
Device Tube potential Tube current Scan time Collimation Pitch
Lu,
2014 Dual source CT 80 kVp 110 mA - 64 x 0.6 mm Routine pitch
Megyeri,
2014
Multi detector
CT 100 kVp 100 mA - 16 x 0.75 mm 2.2
Okada,
2015
Multi slice dual
source CT 120 kVp - - 64 x 0.6 mm 0.5
Stein,
2006
Multi detector
CT 120 kVp 400 mA 0.8 s 1.25 mm 1.5
Coche,
2003
Multi detector
spiral CT 120 kVp 144 mA 0.5 s 4 x 1 mm 1.25
Qanadli,
2000
Dual section
helical CT 120 kVp 199 mA 20 s 2 x 2.5 mm 1.5
Wang,
2009
Multi detector
CT - - - - -
Winer-
Muram,
2004
Multi detector
CT 120 kVp 200 - 300 mA 14 - 17 s 4 x 2.5 mm 1
Blachere,
2000 Helical CT 120 kVp 170 mA 0.75 s variable 1.8 - 2.0
Ohno,
2004
Multi detector
CT 140 kVp 110 mA - 4 x 1 mm 6:1
Reinartz,
2004
Multi slice spiral
CT 120 kVp 100 mA 20 s 4 x 1 mm -
Reissig,
2001 Spiral CT - - - - -
He,
2012
Multi detector
CT 120 kVp 300 mA - 64 x 0.625 mm -
Nilsson,
2002 Spiral CT 120 kVp
200 - 210 mA
- 3 mm
-

47
4.3.2 Reported Outcomes
Diagnostic accuracy (sensitivity and specificity) of CT was the primary outcome reported in all
included studies. In addition, one study 120
reported safety outcomes such as mild allergic
reactions (itching, swollen eyelid or vomiting) (<1% of patients), urticarial (<1%), and
moderately severe extravasation of contrast material into the antecubital fossa (<1%). Further,
five studies 108,112,113,118,120
have reported percentage of indeterminate CT examinations that range
from 1% 118
to 6% 120
.
4.3.3 Quality of Included Studies
Randomized Controlled Trials
Cochrane Risk of Bias for Randomized Controlled Trials was used to quality assess the one
included RCT107
. The RCT assessed showed a high or unclear risk of bias mainly due to unclear
methods of random sequence generation and due to difficulty to assess allocation concealment
(Table 9).
Table 9. Quality Assessment of Included Randomized Controlled Trial
Author
Random
Sequence
Generation
Allocation
Concealment
Blinding of
Participants
and
Personnel
Blinding of
Outcome
Assessment
Incomplete
Outcome
Data
Selective
Reporting
Any
Other
Bias?
Lu107
,
2013 High High Unclear Low Low Low Unclear
Non-Randomized Diagnostic Accuracy Studies
The methodological quality of the included diagnostic accuracy studies was assessed using the
10-item QUADAS-2 tool 104
. Ratings for the 10 signaling questions or assessment items for each
study are summarized in Figure 9, and the full quality assessment can be found in Appendix A.
Given that weights are not assigned to each of the assessment items, no overall or tallied quality
score was used. One non-randomized study has assessed as having a low risk of bias in all four
areas of QUADAS-II scheme 119
. None of the remaining studies received ‘Yes’ responses to all
10 signaling questions contained in the QUADAS-2 assessment tool, suggesting that each was
subject to at least one source of potential bias. One study was assessed as having high risk of bias
in one of the four areas 115
.

48
Broadly, lack of information on patient inclusion/exclusion criteria, un-blinded assessors and
participants, and unclear information about the timing of index and reference tests were the main
reasons for a study to be assessed as having an unclear or high risk of bias.
Figure 9: Assessment of quality item for all included non-randomized studies. Proportions of
studies rated as “Low”, “Unclear” and “High” for each QUADAS-2 item.
4.3.4 Meta-analysis of Diagnostic Accuracy of CT
All 14 studies were included in the meta-analysis despite differences in scan parameters.
Discussion with a clinical expert found these differences to have minor effect on diagnostic
accuracy of multi-detector CT, and therefore, all were included. In the meta-analysis, an
assumption was made that all reference standard tests had the same ability to correctly classify
PE. Many reference standard tests were used, such as consensus reading of CT results, composite
reference standards, and pulmonary angiography. It is possible that some of these reference

49
standards are more accurate at determining the true state of PE than others. This is a limitation of
this analysis.
Figure 10: Sensitivity and specificity reported in included studies
Figure 2 shows sensitivity and specificity reported in each study. Univariate meta-analyses
indicated that the studies were marginally heterogeneous in terms of sensitivity (P = 0.04) and
specificity (P = 0.05). In order to address this possible heterogeneity and to take the obvious
correlation between these two entities into account, a bi-variate random effect model was carried
out. Figure 3 shows the resulted summary ROC curve, the point estimates of pooled sensitivity
and specificity and their confidence region. The pooled sensitivity was 84.8% (95% CI 81.7% to
87.5%) and the pooled specificity was 93.0% (95% CI 90.9% to 94.6%). Results indicate that CT
has higher ability to identify subjects without PE correctly compared to its ability to correctly
classify patients with PE.
Two studies have used consensus reading as the reference standard to obtain diagnostic accuracy
of CT. This method is not as accurate as the other reference standards in correctly classifying PE
patients as it highly depends on the readers’ (or radiologist’s) viewpoint. In order to assess the

50
effect of these two studies on the results, we repeated the Meta-analysis excluding those studies.
The change in pooled diagnostic accuracy values was not significant (sensitivity 83.6% and
specificity 93.2%).
Figure 11: Receiver operating characteristics (ROC) plot displaying diagnostic accuracy of CT
reported in each included study and summary estimates obtained from the bi-variate random
effect model. Size of each data point is proportional to the sample size of the corresponding
study.
4.4 Conclusions
Fourteen studies were included in this systematic review and meta-analysis. All included studies
were considered in the meta-analysis despite the differences in scan parameters and reference
standards. The pooled sensitivity of CT for diagnosing PE is 84.8% and the pooled specificity is

51
93.0%. These results indicate that CT is a highly specific but moderately sensitive diagnostic
modality for PE. That is, CT is more effective at correctly identifying subjects without PE than
correctly classify patients with PE. Overall, CT is a good diagnostic tool, and there is opportunity
to combine it with other tests to improve the diagnostic accuracy. Given the low risk of treating
for PE, false positives produce a minimal risk.

52
5 British Columbia Context and Physician Perspectives
Summary
Five key informant interviews were conducted by a qualitative researcher to gain insight into
the current ED physician experience in British Columbia with diagnosing PE Several challenges, barriers and facilitators for improving the PE diagnostic pathway were
identified, including how to decrease inappropriate use of CT
5.1 Purpose
To gain insight into the current emergency room clinician experience in British Columbia, the
diagnostic pathway for PE, and where CT scans fit in this pathway.
5.2 Methods
Key informant interviews were conducted with emergency department (ED) physician leaders. A
semi-structured interview guide was developed to guide the interviews; questions were aimed at
determining current approaches to diagnose PE across Canada. This guide evolved over the
course of the interviews, as questions were refined to reflect what was learned through previous
interview(s). All the interviews were audiotaped with the consent of the interview participants
and detailed notes were taken. The notes and voice files were reviewed with the purpose of
identifying key themes and important points related to the policy questions being posed.
5.3 Findings
Interviews were conducted with five ED physicians between February and March 2017; two
physicians were from Interior Health; one from Vancouver Coastal; one from Vancouver Island;
and one from the Fraser Valley. We were unable to conduct an interview with a physician from
the Northern health region. Two of the physicians interviewed had experience as provincial
emergency transport advisors, providing support to paramedics and other health professionals in
rural and remote communities.
5.3.1 Clinical Experience
Undifferentiated chest pain, shortness of breath, and undifferentiated abdominal pain are the
most common complaints of patients presenting to the ED. Due to this, it is a common

53
experience for ED physicians to proceed along a diagnostic pathway with the intent to rule out or
diagnose PE. One interviewee said, for example, that of the 240 visits a day to their busy large
urban hospital ED, approximately 10% of those present with shortness of breath and chest pain.
These were described as “not quick patients”, all ranked a 2 or 3 on the Canadian Triage and
Acuity Scale (CTAS), meaning that they spend 3-4 hours in the ED.
5.3.2 Diagnostic Pathway
Physicians were asked to describe the process they follow to diagnose or rule out PE. All
described the following pathway:
Figure 12: PE Diagnostic Pathway
If there is some reason why a CT scan is considered to be risky, then a dose of anti-coagulant
may be given to see if this improves the patient’s symptoms
Other kinds of imaging (MRI, V/Q SPECT) are rarely done, primarily due to extra resources
required (e.g. time, expertise, specialized equipment)
•If high or moderate risk, proceed to CT
•If low risk, proceed to D-dimer
Risk Stratification
•If positive, proceed to CT
•If negative, rule out PE
D-dimer •Definitive diagnosis based on CT scan
CT

54
5.3.3 Risk Stratification Criteria
All interview participants identified a risk stratification tool was used at the beginning of the
diagnostic pathway. Four of the five interviewees mentioned using the PE Rule-Out Criteria
(PERC), two the Wells Criteria, and one the revised Geneva score; with some using more than
one. Some physicians described these criteria as being of limited use in determining whether a
patient might have a clinically important PE. A contributing factor to this may be the lack of
comprehensive clinical practice guideline and, not knowing where risk stratification should fit in
the diagnostic pathway.
5.3.4 D-dimer testing
There was frequent discussion about problems with D-dimer testing. For example, recently there
has been increased discussion about the role of age-adjusted D-dimer. As one physician noted:
what would help is a rule of next steps for positive D-dimer (most of people with a positive D-
dimer, have a negative CT or ultrasound), what next? That is, in order to cut down on the
ordering of CT scans, restricting the use of D-Dimer testing might be a good idea. For example,
you would not order a D-Dimer if someone was post-operative or had experienced trauma, as it
will always be positive.
5.3.5 Imaging
The CT scan was described by physicians as the “gold standard” for diagnosing PE. In the ED
context, the goal is to get an accurate diagnosis so the patient can be admitted or discharged
quickly. Many hospitals have CT scanners and the capacity to do a contrast CT; physicians see
CT scans as easy to order. “Even smaller sites with few radiologists can do and read CT.” Fifty-
seven hospitals in BC use CT to diagnose PE, ranging from less than 5 to 76 patients diagnosed
using CT per year per hospital.
Since CT provides a definitive answer at point of care that is also able to provide alternative
diagnoses (e.g., lung cancer, pneumonia, coronary artery calcification), physicians consider CT
an ideal test for the ED. Yet, the “yield of PE from CT is really, really low.” There was
recognition that many unnecessary CT scans are being done for “something that we know is low
probability and low yield.”

55
Some physicians described ordering a chest x-ray prior to CT in low risk patients with a positive
D-Dimer blood test. X-ray is preferred to ultrasound since ultrasound takes more time to order
and complete, and ultrasound staff are not on-call 24 hours/day. As one physician noted, it takes
“hours and hours” to get an ultrasound versus a CT. “If you are a patient and you don’t feel very
good, would you wait around 4 hours to get an ultrasound?”
In British Columbia, ventilation/perfusion imaging (V/Q) is rarely used, as it is logistically
challenging and time consuming. Many communities lack access to it. For example, one
physician said he has ordered a V/Q 1 or 2 times in his ten years of practice. This test is booked
on an outpatient basis. The main indications for a V/Q are “vanishingly rare”, and its use would
only be considered when CT radiation poses an extreme risk to a patient and/or when a patient is
extremely obese.
5.3.6 ED Physician’s Perspective on the Patient Experience
At a societal level, there is low awareness of PE, and types of imaging required for diagnosis.
The patient experience with this diagnostic process was described by ED physicians as being
variable, as patients with a possible PE present to the ED with various symptoms. They come
from all age groups and backgrounds; some present with minor symptoms, while others are
critically ill. The initial workup can be anxiety-inducing, upsetting, and/or stressful for patients.
For patients who are not seriously ill, it is important to recognize other factors that will impact
their ability to stay in the ED to get a diagnosis confirmed. For example, patients will have
competing time demands such as work, children and pets and other factors such as the expense
of parking will impact whether a patient stays or leaves the ER. One physician working in a busy
urban ED that serves a diverse group of people described the importance of understanding
patients’ expectations, and ensuring good communication throughout the patient’s ED
experience.
The development of a decision support tool (discussed below), was described as being useful for
supporting conversations with patients and engaging them in shared decision making. Ideally, a

56
decision to not order a particular test would be made together by the patient and physician. For
example, the patient needs to feel comfortable about a decision to not order a CT, and therefore
needs to understand the weighting of risks and benefits.
5.3.7 Challenges of Diagnosis
All physicians described challenges in ruling out or diagnosing PE because of the diverse and
non-specific range of possible symptoms (Figure 13). As one interviewee noted: “As the years
go on, I realize PE is difficult to diagnose. It is a mimicker of many things.” If patients are very
ill and there is suspicion of PE, a physician often does a CT quickly. However, if there is more
time to deliberate, a more complex diagnostic pathway may be used, including trying to
determine whether a possible PE might be clinically significant.
There are societal, healthcare system, and ED contextual issues that make prompt diagnosis of
PE a priority and a challenge. ED physicians feel substantial pressure not to miss a PE, and want
to be able to diagnose or rule out a PE before the patient leaves the ED. This is more challenging
if the patient is not presenting as seriously ill.
A contributing factor to this is the challenge often experienced in handing off follow-up care to
another physician. Some patients do not have family physicians and/or are unable to get an
appointment to see their family physicians quickly. As a result, patients cannot access timely
primary care, and in some cases also have no home or phone; in these cases, the burden of testing
falls on the ED. Further, a lack of integrated and coordinated care in transitioning patients out of
the ED poses additional challenges to physicians. As one physician described, ED physicians
want to “unburden themselves at the end of the shift”, and make the diagnosis quickly so that the
patient can be discharged rather than handed over to another physician. These human factors are
important.

57
Figure 13: Challenges of Diagnosis
In the ED context, with the pressure to make an accurate diagnosis as quickly as possible and
with the easy access to CT scans to support this, CT scans tend to get ordered. Another recent
contextual factor that is influencing an increase in the ordering of CT scans is that the shift in the
risk of renal damage from the use of the CT contrast material has been determined to be less than
previously thought. As this risk decreases, then the ordering of CT scans will increase; the
balance of potential risk and benefit has shifted.
In rural and remote areas, where there is no access to an ED or a CT scan, the complexity gets
magnified. Again, patients assessed as being at moderate or high risk of a PE are routinely
transported, but when assessed as low risk the decision-making becomes more challenging.
Transporting a patient to a larger centre is both disruptive to the patient and their family and uses
considerable system resources.
5.3.8 Improving the PE Diagnostic Pathway
The physicians interviewed provided a number of suggestions for how the PE diagnostic
pathway might be improved, and how inappropriate use of CT scans can be reduced. These
included:
- Clearly defining what a serious PE is
- Development of an evidence informed decision support tool
- Physician education on complex presentation of PE, and the use of decision support tools
- Provision of a hospital-based thrombosis or transition clinic that would accept patients when
the diagnosis is still outstanding
Non-specific symptoms
Pressure to make prompt diagnosis
Patient hand-off
Access to Emergency Department or CT scan

58
All physicians described the nuanced presentation of PE, and some described the ability of new
CT scanner types to diagnose small PE’s that would never have caused the patient any harm.
Physicians said it would be helpful to know what size of PE is safe, and what amount of risk is
safe. As one physician noted“no one has come together to design what a 10% risk of blood clot
looks like and how to proceed.”
All described the importance of developing evidence-informed decision support tools for
diagnosing PE, but recognized that this would be a difficult task given some of the challenges
described previously (e.g., often no clear mechanism of injury; a highly heterogeneous
population). Benefits were described as the opportunity to build in decision analysis and a
clinical scoring system, supporting decisions regarding what tests to conduct. A decision support
tool that is well accepted by the medical community was described as supporting the ED
physician’s clinical decision to rule out PE. As one physician noted, you need something that
shows that you went through an evidence informed list of findings to support no imaging of low-
risk patients. The reality is that missing a clinically important PE is much riskier for the patient
than missing an ankle fracture. This makes the need for clear rules, if they are possible to
develop for PE, very important.
Other than risk stratification tools, none of the physicians interviewed were aware of any
decision support tools or clinical practice guidelines, to support diagnosis of PE. As described
previously, an important component of a decision support tool would be clear criteria regarding
when to order a D-Dimer. All interviewees felt that a good decision support tool would be
valuable, even more so in rural and remote areas regarding the need to transport for a CT scan.
With respect to who might develop such a tool, suggestions included a collaborative effort
involving the Canadian Association of Emergency Physicians, the Heart and Stroke Foundation,
hematology, internal medicine, pulmonology, and radiology. One physician thought that the
Emergency Strategic Clinical Network in Alberta might be well positioned to develop a tool.
Physicians who had experience with the implementation the clinical practice guidelines and
decision support tools described how important it is to develop these tools and implementation

59
strategies collaboratively with physicians who will use the tool. One physician described a recent
failed experience in one health region, where the radiology department tried to get ED physicians
to provide a risk stratification score for PE before they could order a CT scan.
Physicians who had experience with referring patients who needed more follow-up to a
thrombosis clinic, found that resource helpful. Access to such a clinic can help to decrease
pressure on the ED physicians to make an immediate diagnosis, particularly in cases where the
patient is not critically ill and has been assessed as low risk.
5.3.9 Embedding Decision Support Tools in Electronic Medical Records
Health regions in British Columbia are at various stages of implementing electronic medical
records (EMRs) meaning that it is not yet possible to embed pop-up decision support tools
(DSTs) in EMRs across the province. Physicians who have experience with pop-up tools in other
settings felt that they could be helpful and are better than paper-forms. As described previously,
however, developing these tools in collaboration with ED physicians is important.
In addition, for something as complex as PE, a physician education campaign would be
important. Optimally, such a campaign would include online education and would also provide
opportunities for physicians to discuss the nuances around diagnosing PE such as determining
when a PE is clinically important (e.g., through physician rounds and journal clubs).
5.4 Conclusion
Diagnosing or ruling out PE is a complex endeavour. The patient population is heterogeneous,
the symptoms general in nature, and it can be challenging to determine whether a PE is clinically
significant. There are societal, healthcare system and ED contextual factors that influence the PE
diagnostic pathway and contribute to over-ordering of CT scan. Not diagnosing a clinically
important PE may have severe negative consequences; there is significant fear in the medical
community about missing this diagnosis. Lack of access to follow-up primary care or other kinds
of transitional care puts pressure on ED physicians to make a diagnosis or rule out PE before the
patient leaves the ED. The physician interviews were unaware of any good decision support tools
for diagnosing PE that would help decrease the inappropriate use of CT. Physicians, recognizing

60
that such a tool would be challenging to develop, felt that the development of such a tool along
with a strong strategy for physician education, would be helpful.

61
6 Patient Perspective Systematic Review
6.1 Objective
To determine patient’s perspectives on the use of CT for diagnosing PE
6.2 Methods
A systematic review was completed. EMBASE, Medline, all EMB reviews, and PsychINFO
were searched from inception until February 2nd
, 2017. Terms aimed at capturing technology
such as “computed tomography,” “CT,” “CTPA,” and “CT pulmonary angiography” were
combined using the Boolean Operator “or.” These terms were then combined, using the Boolean
Operator “and” with terms describing the patient experience, such as “attitudes,” “perceptions,”
and “patient preference.” No filters were applied. Details of this search can be found in
Appendix B.
All abstracts were screened in duplicate. Abstracts proceeded to full-text review if: they
examined patient perspectives or experiences with CT to diagnose PE, included only adults 18
years and older, reported any outcome, and was written in English or French. Abstracts were
excluded if they failed to meet any of the above inclusion criteria, or if they: were animal
models, or did not report original data. Abstracts selected for inclusion by either reviewer
proceeded to full-text review. This initial screen was intentionally broad to ensure that all
relevant literature was captured.
Summary
One study on patient perspectives of using CT to diagnose pulmonary embolism was
identified
This study found that one-third of patients would prefer to forgo CT testing for a number
of reasons including risk of adverse events and exposure to radiation from CT technology
This suggests that some patients screened using CT for possible pulmonary embolism, if
informed of the risks and benefits, would forego screening.
One study is not sufficient for robust conclusions to be drawn and more literature is
needed.

62
Studies included after abstract review proceeded to full-text review in duplicate. Studies were
included if they met all inclusion criteria and failed to meet any of the criteria for exclusion
presented in Table 10. Full-text review was completed in duplicate. Any discrepancy between
reviewers was resolved through discussion and consensus.
Table 10. Inclusion and Exclusion Criteria for Systematic Review
Inclusion Criteria Exclusions Criteria
Examines patient perspective on using
CT to diagnose PE
Adults over 18 years’ old
Any outcome
English or French language only
Does not examine patient perspectives
on using CT to diagnose PE
Under 18 years’ old
Not written in English or French
Animal models
Does not report original data
For all studies, year of publication, country, objective, methods, patient inclusion, patient
demographics, outcomes measured, and key findings were extracted using standardized data
extraction forms. Discrepancies between reviewers during data extraction were resolved through
consensus.
During data extraction, quality assessment was completed in duplicate. Disagreement between
reviewers was discussed and a consensus was reached. Studies were assessed using Downs and
Blacks Checklist121
. Using this checklist, each study was assessed based on 27 criteria, widely
covering areas reporting quality, external and internal validity, and power121
. Studies are
assigned a value of “1” if they meet the question criteria, “0” if they do not or if it is not possible
to determine whether they meet the criteria; with one exception where one question may be
given “2” points.
6.3 Results
335 citations were retrieved from EMBASE (n=178), PsychINFO (n=0), Medline (n=78) and all
EMB Reviews (n=78). After duplicates were removed, 298 citations were reviewed. Two
hundred and ninety-five were excluded, and three proceeded to full-text review. One study met
the final inclusion criteria, and the remaining two were excluded (Figure 14).
Figure 14: Flow Chart
Iden
tifi
cati
on

63
The included study was conducted by Geyer et al. in the United States and published in 2014122
(Table 11). This study investigated the impact of shared decision making on testing strategies for
PE. Two-hundred and three patients were included from the emergency department of an urban
university hospital; these patients had a mean age of 55 years (SD: 17years), and 61% were male.
Patients were included if they presented with chest pain or dyspnea, and were excluded if they
were hemodynamically unstable or unable to participate due to altered mental status, intoxication
or limited capacity to communicate in English.
Number of records identified through
Database Searching
n=335
EMBASE n= 178
Medline n=78
EMB Reviews n=79
PsychInfo n=0
Number of additional records
identified through other sources
n=0
Number of studies included in synthesis
n=1
Reasons for Exclusion (n=2):
Did not assess patient perspective of
CT for diagnosing pulmonary
embolism (n=2)
Number of full-text articles assessed for
eligibility
n=3
Number of records excluded
n=295
Number of records screened
n=298
Number of records after duplicates removed
n=298
Scr
een
ing
E
lig
ibil
ity
In
clu
ded

64
Table 11: Summary of Included Study
Author,
Year,
Country
Objective and Methods Clinical
context
Participant Details Key Findings Quality
Assessment
Greyer,
2014,
United
States
Objective: To determine
patient preferences
regarding PE diagnostic
approach
Study Design:
Observational study
Methods: Presentation of
hypothetical scenario where
patient has low pretest
probability and elevated D-
dimer. Patients asked to
consider risks and benefits
and express preference for
imaging.
Emergency
department
of a urban
university
hospital
Inclusion Criteria:
Patients presenting
with chest pain or
dyspnea
Exclusion Criteria:
hemodynamically
unstable or unable
to participate due to
altered mental
status, intoxication
or limited capacity
to communicate in
English
Participant
demographics: 203
participants, mean
age 55 years (SD:
17 years), 61%
male
63% indicated a
preference for
CT in the above
scenario, and
37% indicated a
preference to not
have a CT
All patients who
had precious PE
expressed
preference for
CT
20
CT: CT Pulmonary Angiography, SD: Standard Deviation
The risks and benefits of testing strategies were described to patients. Research staff presented
patients with information on pretest probability assessment, D-dimer testing and CT pulmonary
angiography. Patients were asked to consider a scenario where they had low pretest probability,
but elevated D-dimer (between 500ng/mL and 1000ng/mL). Patients were also presented with 2
image arrays of 1000 other similar patients which displayed the risks of obtaining or declining a
CT pulmonary angiography, including risks such as missed PE, adverse effects, false-positive.
Out of 203 participants, 63% indicated a preference for CT in the above scenario, and 37%
indicated a preference to not have a CT. Patients who had previously had a PE were more likely
to prefer CT (0% declined, p=0.07). Of patients who preferred not to have CT, 27% cited risk of
malignancy due to radiation exposure, 24% cited risk of contrast-induced nephropathy, 3% cited
risk of allergic reaction; the remaining patients declined due to a belief that the test was
unnecessary. Of those who preferred CT testing, 85% worried that declining would result in

65
missing a PE diagnosis, and 15% were concerned about missing an alternate diagnosis
discovered by CT.
6.4 Discussion
The literature on patient perspectives or preferences for PE testing is limited; only one study was
identified in a systematic review of the literature. This study found that one-third of patients
would prefer to forgo CT testing for a number of reasons including risk of adverse event and
exposure to radiation from CT technology. This suggests that some patients may be screened
using CT for possible PE, when, if informed of the risks and benefits, they would have forgone
screening. One study is not sufficient for robust conclusions to be drawn and more literature is
needed. However, this study suggests that some patients may have a preference for deferring CT
testing.

66
7 Appropriate Use of CT
7.1 Objective
To identify and determine the effectiveness of interventions to support appropriate use of
CT for diagnosing PE
7.2 Methods
Search Strategy
A systematic review was completed. Medline, EMBASE, Cochrane Library, EconLit, and
NHSEED were searched from inception until February 3, 2017. Terms aimed first at capturing
the technology used in PE diagnosis, such as “CT scan,” “tomography,” “X-ray CT,” “CAT
scan,” “multi-detector CT,” or “CTPA.” These terms were then combined, using the Boolean
Operator “and” with terms describing the appropriate use of the technology, such as “decrease,”
“overuse,” or “reduction.” These terms were all further combined using Boolean Operator “and”
with terms for the clinical condition, such as “pulmonary embolism” or “pulmonary
thromboembolism.” Results were limited to English or French language studies, and a second
filter also excluded studies that were commentaries, editorials or conference proceedings. No
other limitations or filters were applied. Details of this search can be found in Appendix C.
All abstracts were screened in duplicate. Abstracts proceeded to full-text review if: they assessed
an intervention that ensured appropriate CT testing for diagnosing PE, included only adults over
Summary
3,167 abstracts were reviewed, thirty-five full-texts were reviewed and fourteen studies
were included.
Two studies assessed the effectiveness of an audit and feedback system, five assessed the
effectiveness of a clinical decision support (CDS), three assessed the effectiveness of a
type of communication, three assessed the effectiveness of guidelines, and one assessed
both a clinical decision support and guideline
Pooled estimates obtained from the stratified meta-analysis suggest that only interventions
involving clinical decision support tools were significantly effective on increasing CT
yield.
Barriers, such as time pressures and patient demands, as well as facilitators such as staff
acceptance and buy-in, may change the success of the intervention.

67
18 years old, were a comparative study design, reported any outcome, and were written in
English or French. Abstracts were excluded if they failed to meet any of the above inclusion
criteria, or if they: were animal models, did not report original data, or were a commentary,
editorial, or a conference proceeding. Abstracts selected for inclusion by either reviewer
proceeded to full-text review. This initial screen was intentionally broad to ensure that all
relevant literature was captured.
Studies included after abstract review proceeded to full-text review in duplicate. Studies were
included if they met all inclusion criteria and failed to meet any of the criteria for exclusion
presented in Table 12. Full-text review was completed in duplicate. Any discrepancy between
reviewers was resolved through discussion and consensus.
Table 12. Inclusion and Exclusion Criteria for Systematic Review
Inclusion Criteria Exclusion Criteria
Study assesses intervention to ensure
appropriate CT testing for diagnosing
PE
Adults over 18 years’ old
Must use a comparative study design
to assess effectiveness or efficacy
Any outcome
English or French language only
Does not apply a comparative study
design
No intervention to ensure appropriate
CT testing for PE
Under 18 years’ old
Not written in English or French
Animal models
Does not report original data
Commentary, editorial, conference
proceeding
For all studies, year of publication, country, objective, methods, clinical context, participant
details, details of intervention, findings, and clinical pathway were extracted using standardized
data extraction forms. Discrepancies between reviewers during data extraction were resolved
through consensus.
The primary outcomes extracted during data extraction included: number of CT scans performed
before and after the corresponding intervention, and CT yield. CT yield is the percentage of CT
pulmonary angiographic examinations positive for acute PE and is therefore, a more accurate
indicator to quantify the effect of an intervention on appropriate CT use.

68
During data extraction, quality assessment was completed in duplicate, with one reviewer doing
primary data extraction and the other verifying data extraction. Disagreement between reviewers
was discussed and a consensus was reached. Quality assessment was completed using Downs
and Blacks Checklist121
. Using this checklist, each study was assessed based on 27 criteria,
widely covering areas reporting quality, external and internal validity, and power121
. Studies are
assigned a value of “1” if they meet the question criteria, “0” if they do not or if it is not possible
to determine whether they meet the criteria; with one exception where one question may be
given “2” points.
A meta-analysis was conducted using the change in CT yield. A random effect model that
assumes a normal distribution of effect size and different underlying effect for each study was
used. Cochran Q and I2 statistics were used to examine the heterogeneity of the included studies.
All analyses were completed in R using R package metafor 123
.
7.3 Results
4,571 citations were retrieved from EMBASE (n=2,779), Cochrane Library (n=70), Medline
(n=1,722) and EconLit (n=3). After duplicates were removed, 3,167 citations were reviewed.
3,132 were excluded, and thirty-five proceeded to full-text review. Of these, fourteen studies
were included.
7.3.1 Characteristics
The fourteen included studies were conducted between 2008 and 2016. Nine studies were from
the U.S., two from Australia, one from the Netherlands, one from South Africa, and one from
Spain. The number of participants who took part in the studies ranged significantly, from 21
physicians pre-intervention and 22 physicians post-intervention in the study by Raja et al.124
, to
46,834 patients pre-intervention and 49,673 patients post-intervention in the study by Geeting et
al.125
. Two studies assessed the effectiveness of an audit and feedback system
124,126, five
assessed the effectiveness of a clinical decision support (CDS) 127-131
, three assessed the
effectiveness of a type of communication 132-134
, three assessed the effectiveness of guidelines 135-
137, and one assessed both a clinical decision support and guideline
125 (Table 15).

69
Figure 15. Flow Chart
Number of records identified through
Database Searching
n=4571
EMBASE n= 2779
Cochrane Library n=70
Medline n=1722
Number of additional records
identified through other sources
n=0
Number of studies included in synthesis
n=14
Reasons for Exclusion (n=21):
Does not assesses intervention to
insure appropriate CT use (n=19)
Duplicate (n=1)
Only abstract published (n=1)
Number of full-text articles assessed for
eligibility
n=35
Number of records excluded
n=3132
Number of records screened
n=3167
Number of records after duplicates
removed
n=3167
Iden
tifi
cati
on
S
creen
ing
E
lig
ibil
ity
In
clu
ded

70
Table 13: Synthesis of Interventions
Study Intervention Description
AGARWAL128
CDS Diagnostic imaging pathways online clinical decisions support tool,
using Wells score as primary screening tool
BOOKER 126
Audit and feedback Presentation at monthly emergency department meeting. Individual
utilization data was sent confidentially to each clinician/
DUNNE 127
CDS Clinical decision tool informed providers of the patient-specific
pre-test probability for PE based on clinical suspicion and d-dimer
results
GEETING125
CDS / Guidelines Embedding a field for modified Wells score in the CTA order set.
Modified wells score was required to order CT, but CT could be
ordered regardless of score.
HARDIN 132
Communication Email sent to all Emergency Department physicians. Email
reported that use of CT to diagnose PE was increasing, and that to
prevent radiation exposure in young females, V/Q scan should be
considered as an alternative method of diagnosis.
JIMENEZ 2015 129
CDS Clinical Decision tool intended to guide diagnostic testing for PE.
No other details reported.
KANAAN 133
Communication Formal educational intervention, consisting of a 45-minute didactic
lecture followed by a 30-minute question and answer session.
MURTHY 136
Guidelines / CDS A PE diagnostic algorithm was distributed to all hospital clinicians,
outlining the combined role of the validated modified Wells score
and the quantitative D-dimer test in defining the pre-test probability
of PE. Further, clinicians were prompted using a electronic CDS to
enter the Wells score and the D-dimer test result, thereby defining
the pre-test probability of PE.
ONG 135
Guidelines Using Wells score, patients were stratified into pre-test probability
categories. Completion of the algorithm form was required before
the CT radiographers would perform a CT.
PREVEDELLO 130
CDS Clinical decision support tool for PE-CT (based Wells criteria)
within the institution’s computerized physician order entry system.
The clinical decision support required information about the level
of clinical suspicion for PE and the serum D-dimer level).
RAJA 124
Audit and feedback Quarterly performance feedback reports sent via e-mail that
displayed individual physicians’ statistics and their performance
compared with all emergency physicians.
RAJA 131
CDS Integration of clinical decision support using ED radiology
computerized physician order entry system
STEIN 134
Communication Two hour-long seminars held with the available emergency
department staff. Recommended that stable patients with a clinical
suspicion of PE should initially be imaged with chest radiography.
WALEN 137
Guidelines Every physician requesting a CT for PE was asked to document
Wells-scores on the request form and to document D-dimer.
CDS: Clinical Decision Support; CT: Computed Tomography pulmonary angiography; ED: Emergency Department;
PE: pulmonary embolism
A diverse range of interventions to decrease CT use were used in these studies. The most
common interventions involved the distribution of a PE diagnostic algorithm form (either
physical or computerized) to all hospital clinicians that outlined the role of evidence-based

71
clinical decision support tools in the diagnosis of PE, such as the Wells score and D-dimer test.
These forms prompted clinicians to enter scores for these decision support tools prior to entering
a CT request.127,129-131,135-137
Other common interventions were in-person education sessions that
focused on clinical decision support tools such as the Wells criteria, PERC scores, and D-dimer
testing 126,128,133
One study held educational seminars providing an algorithm that recommended
imaging with chest radiography and V/Q scanning, to decrease the use of CT.134
Another
embedded a pre-test probability rule based on Wells criteria, which was required during the
computerized physician order-entry process.125
One study used a simple intervention of an email
correspondence to all ED physicians that reported that the use of CT for PE was increasing, and
that V/Q scans should be considered as an alternative method.132
One study implemented
emergency department physician performance feedback reports sent via email that displayed
both individual physicians’ statistics and their performance compared with anonymized results
for the entire group of emergency physicians.124
Results from the included studies have been synthesized below. Detailed information on each
study can be found in Appendix C.
7.3.2 Quality Assessment
The fourteen included studies had quality scores ranging from 9 130
to 17 138
out of 27. All
studies had areas where quality was low or unclear. The three areas where quality was lowest
was describing the principle confounders, randomization, and blinding. Since these studies were
predominantly non-randomized controlled trials, using a pre- post-intervention design, these
areas of low quality are predominantly related to limitations of the study design. Quality was
high for the following elements: clearly describing the objective, clearly describing the main
outcomes, valid and reliable outcome measures, and compliance with the intervention. The
quality assessments of all included studies are synthesized in Table 14.
7.3.3 Meta-analysis
Included studies were divided into four groups based on intervention type: audit and feedback;
clinical decision support; communication; and guidelines. Figure 16 summarizes the change in
CT yield after intervention in each study and the pooled outcomes obtained by performing a

72
random effect meta-analysis stratified by the intervention type. All studies reported positive
change of CT yield indicating that the interventions were effective on increasing CT yield.
However, only three of them were statistically significant 130,136,137
. In all three studies,
interventions involve using Well’s score and D-dimer test results prior to the CT examination.
Table 14. Outcomes of Included Studies
CT Scans Ordered Effectiveness/Yield
Author, Year,
Country
Pre-
intervention
Sample Size
Post-
intervention
Sample Size
Quality Pre-
Intervention
Post-
Intervention
Pre-
Intervention
Post-
Intervention
Audit and Feedback
Booker
206 206 13 23 19 8.7% 9.2%
Raja
21
(Contro
l)
22
(Interv
ention)
17 Control:
20.4 (per
1000 ED
patients)
Interve
ntion:
20.2
(per
1000
ED
patients
)
Control:
20.1 (per
1000 ED
patients)
Interve
ntion:
18.1
(per
1000
ED
patients
)
Control:
11.6%
Interve
ntion:
11.2%
Control:
11.2%
Interve
ntion:
13.1%
Clinical Decision Support
Agarwal
187 109 16 NR NR NR NR
Dunne
3037 2825 16 26.8
per
1000
admissi
ons
22.6
per
1000
admissi
ons*
10.4% 12.1%
Geetings
46,734 49,673 16 NR 1417
0.44% 0.38%
Jimenez
652 711 13 362 350 31% 33%
Prevedello
1542 1349 12 1542 1349 9.21% 12.60%
*
Raja 3855 2983 11 NR NR NR NR
Murthy NR NR 13 149 101 17.4% 31.7%*

73
Communication
Hardin
33 32 15 33 32 3.03% 12.5%
Kanaan
100 100 14 NR NR NR NR
Stein
1753 1843 12 1234 920 13.1% 13.5%
Guidelines
Murthy
NR NR 13 149 174 17.4% 22.4%
Ong
138 268 9 454 333 13.6% 13.8%
Walen
974 250 13 974 250 23% 29.6%*
ED: Emergency Department; NR: Not reported; OR: Odds Ratio; PE: pulmonary Embolism
*Statistically significant finding
There was no statistical evidence to conclude that the included studies in each intervention group
were heterogeneous. Pooled estimates obtained from the stratified meta-analysis suggest that
only interventions that involve clinical decision support tools were significantly effective on
increasing CT yield.
Figure 16: Forest plot of change in CT yield after intervention

74
7.3.4 Lessons Learned
The included studies identified a number of lessons learned, such as barriers, facilitators and
impact of delivery mode (Figure 17). One study found that to be successful, a mandatory process
requires acceptance from emergency department senior staff, willingness by the department,
frequent education sessions for new staff, and review sessions for others, and advocates in the
department to promote and police the intervention 128
. Additionally, the need for long-term
persistence, and consistency to ensure uptake and appropriate application of the tool were
highlighted 135
.
Figure 17: Barriers and Facilitators to Acceptance of Intervention

75
Studies found that some barriers to success included: litigation and defensive medicine 126
,
pressure for quick turnover 126
, patient demands 126
, and lack of time 133
. Decisions supports may
be perceived by busy practitioners as an intrusion on their time, and therefore, it was found to be
important to have the appropriate clinical departments on board for any plans to institute a
decision support system 133
.
Two studies found that an education-only intervention, that was not related to any consequences
for the physician resulted in heterogeneous acceptance of the tool 127,130
. Another study found
that a tool required reminders and care suggestions to be effective; a passive, one-time
intervention had no effect 132
.
7.4 Discussion
Literature on effective interventions to align CT use with appropriate practice is substantial;
however, it is also diverse and heterogeneous. Broad categories of interventions used to promote
appropriate CT use include clinical decision support tools, audit and feedback, communication
and guidelines. However, each intervention differed on elements such as delivery mode, whether
or not it was mandatory, and whether there was reinforcement.
•Acceptance from ED senior staff
•Willingness by the department
•Education sessions
•Advocates in the department
•Long-term persistence and consistency
Facilitators
• Litigation and defensive medicine
• Pressure for quick turnover
• Patient demands
• Decisions supports may be perceived by busy practitioners as an intrusion on their time
Barriers

76
When considered separately, one of the clinical decision support studies 130
and two of the
guideline studies136,137
showed statistically significant improvement in CT yield. The guideline
studies relied on decision tools such as Wells and PERC, and therefore, the effectiveness of this
intervention could be linked to the effectiveness of these tools for ruling out PE in certain patient
groups. Due to the small number of studies the pooled results for each category are uncertain.
The included studies were of low to moderate quality. All studies had areas where quality was
low or unclear, and therefore all were at risk of bias. However, many of the study limitations
included not blinding, and not randomizing participants, which was predominately a
consequence of the non-randomized pre- post- intervention study designs used.
A number of barriers and facilitators were identified, and should be considered if implementing
an intervention to align CT use with appropriate practice. Acceptance and buy-in from staff,
including the department and the emergency staff, having advocates in the department and long-
term persistence and consistency were all identified as factors that promote the success of an
intervention. Barriers such as litigation and defensive medicine, time pressures, and patient
demands were all highlighted by the included studies. Considering these barriers prior to
implementation may help improve the success of an intervention.
In order to draw strong conclusions about the effectiveness of interventions to increase the
appropriate use of CT, more literature is required. If additional literature were available, it would
be possible to do a meta-analysis based on broader categories to see what type of intervention is
most likely to be effective. In the absence of additional literature, interventions to increase the
appropriate use of CT appear to be effective with guideline-based interventions that recommend
the use of Wells’ and D-dimer and clinical decision supports that implement the use of Wells’
and D-dimer being the most likely to change CT yield.
8 Cost-effectiveness and Economic Impact
Summary
A cost-effectiveness analysis and budget impact analysis incorporating diagnostic and
treatment costs for PE was completed.
In the base case, an intervention of WellsPERCD-dimerCT had the lowest costs
with a total of $1981 and effectiveness of 12.489 QALYs.
WellsD-dimerCT (moderate and high) resulted in an ICUR of $30,000 per QALY
gained compared to the baseline strategy of WellsPERCD-dimerCT.

77
8.1 Objective
To determine the cost-effectiveness of an intervention to support appropriate use of CT in
diagnosing PE in emergency departments in British Columbia.
8.2 Overview of Previous Studies
8.2.1 Methods
An update of a previously conducted systematic review by Raymakers et al. 139
of cost-
effectiveness analyses of diagnostic strategies incorporating CT for PE was conducted.
Raymakers et al. searched the published literature from 1990 to 2012. To leverage this work, a
de novo search which captured literature from 2012 to March 10th
, 2017 was conducted using the
search strategy developed by Raymakers et al139
. The original study searched: MEDLINE,
EMBASE, Health Technology Assessments, NHS Economic Evaluation Database, and the
Cochrane Central Register of Clinical Trials. The update search included only MEDLINE and
NHS Economic Evaluation Database as the majority of evidence is captured with those two
databases140
. The search was developed in MEDLINE using MeSH (medical subject heading)
terms and keywords for the concepts PE and diagnostic tests (scintigraphy, tomography, D-
dimer, ultrasonography, angiography, clinical probability assessment). These concepts were
combined using a Boolean operator AND; then the results were combined with an economic

78
evaluation filter141
. The search strategy for the update are in Appendix D. No language
restrictions or publication type were applied to the search.
8.2.1.1 Inclusion Criteria
The abstracts were screened by a single reviewer, similar to the original review by Raymakers et
al139
. All abstracts selected for inclusion proceeded to full-text review. For inclusion in this
update, a study had to meet the same inclusion criteria of the original systematic review: 1)
report on a comparative economic evaluation of strategies for the diagnosis of PE; and 2) include
CT as a component of at least one strategy. Data from the included studies were extracted using a
standard data extraction form and narrative synthesis was used to summarize overall results of
included studies.
8.2.2 Results
8.2.2.1 Identification of studies
A total of 300 citations were identified from the literature update search after removing duplicate
records. Of those, 297 were excluded in the abstract review and 3 were included for the full-text
analysis. In full-text review, all 3 were excluded from the final analysis. Thus, no new studies
were identified in addition to the 13 studies reported in Raymakers et al.

79
Raymakers et al. Search
Update Search
Full-text articles assessed
for eligibility
n=41
Full-text articles assessed
for eligibility
n=3
Number of studies
included
n=13
Number of studies
included
n=0
Number of records
screened after duplicates
Removed
n=300
Number of records
screened after duplicates
Removed
n=7595
Number of records
identified through
Database Searching
n=10,050
MEDLINE n=2693
EMBASE n=6872
HTA database n=22
NHSEED n=316
CENTRAL n=147
Number of records
identified through Database
Searching
n=304
MEDLINE n=285
NHSEED=19
Records Excluded
n=297
Records Excluded
n=50
n=3 not economic
evaluation
Records
Excluded
n=28
Iden
tifi
cati
on
S
creen
ing
E
lig
ibil
ity
In
clu
ded
Final Included Studies
n=13
Figure 18. Flow Chart of Review Process

80
8.2.2.2 Study characteristics
Individual characteristics of each economic evaluation have been previously reported by
Raymakers et al139
. Economic evaluations were conducted in Europe (n=6), USA (n=5), Canada
(n=1), and Australia (n=1). The perspective of the cost-effectiveness analyses were mostly from
a 3rd
party payer perspective (n=5) or hospital perspective (n=3). Three studies measured
effectiveness in quality-adjusted life years142-144
, with most studies measuring a form of survival.
Time horizons reported included 3 months, one year, and lifetime. Almost all populations
considered in economic evaluations were patients suspected of PE, one focused on pregnant
women and another specifically on a high-risk population only142,145
. All studies incorporated
clinical probability assessment except for those populations already considered at a high-risk of
PE (i.e. pregnant women).
Across all studies, the reported sensitivity of CT ranged from 0.70-0.955 and specificity of CT
from 0.89-0.976. Costs in 2011 USD of CT scans ranged from $158.37 (Great Britain) - $840.89
(Switzerland). Cost sources included Medicare for those studies based in the USA, local
hospitals (e.g., costs included physician fee, diagnostic, hospital stay, equipment, capital), and
physician payment schedules.
8.2.2.3 Study results
A summary of the key results of the primary economic evaluations previously identified by
Raymakers et al (n=13) are described in Table 15. The majority of studies reported CT as a
component of their most cost-effective strategies, particularly after the use of D-dimer or in
combination with ultrasound in their diagnostic strategy145-151
.
Overall, all economic evaluation studies incorporated clinical probability assessment (Wells
Criteria or Geneva Score) into the diagnostic algorithms evaluated when populations were not
previously risk stratified. The use of the more invasive test, pulmonary angiography, was not
frequently evaluated as part of a diagnostic algorithm. CT was a component of most reported
cost-effective diagnostic strategies, particularly after D-dimer or in combination with ultrasound.
One study reported that CT alone was not cost-effective and should be considered with D-dimer
and ultrasound 143
, they reported D-dimer + compression US was the most cost-effective
strategy. Another study reported V/Q + US + PA as the most cost-effective strategy compared
with CT-based strategies152
.

81
Table 15. Summary of previously published cost-effectiveness analyses
First
Author
Year
Location Objective Comparators Results Conclusion
Doyle
2004145
USA A cost analysis to evaluate
which of several diagnostic
strategies was the most CE with
the least number of deaths from
PE
CUS
V/Q scan
hCT
hCT as the initial
diagnostic regimen was
found to be the most CE
at $17,208 per life saved
Spiral CT offers the
most CE method
Duriseti
2006144
USA To examine the cost-
effectiveness of a quantitative D-
dimer assay for the evaluation of
patients with suspected PE in an
urban ED
Combinations of:
CUS
V/Q
CTA
CTP
CTP without D-dimer
was the preferred
strategy. CUS-V/Q
scanning was always
dominated by CT-based
strategies
When CTA is available,
even the most sensitive
D-dimer assay is not
likely to be cost-
effective.
Duriseti
2010143
USA To evaluates the cost-
effectiveness
of different diagnostic strategies
in an ED for patients presenting
with
undifferentiated symptoms
suggestive of PE
Combinations of:
D-dimer
CTP
CTV
V/Q
CUS
For all patient pretest
categories, the most
cost-effective diagnostic
strategy is to use an
initial ELISA D-dimer
test, followed by CUS of
the
lower extremities if the
D-dimer is above a
specified cutoff
Using ELISA D-dimer
assay (at cutoffs higher
than currently used)
followed by CUS, can
reduce costs and
improve outcomes
Larcos
2000152
Australia To compare the cost-
effectiveness of alternative
methods of diagnosing acute PE
V/Q + US + PA
CT + US + PA
CT
V/Q is both more
expensive and more
effective than CT alone,
resulting in 20.1
additional lives saved at
a cost of $940 per life
year gained
Incremental cost-
effectiveness of the V/Q
based strategy over CT
is reasonable in
comparison with other
health interventions.
Lee
2011151
USA To evaluate cost-effectiveness of
diagnostic strategies for PE in
patients with a high,
intermediate, or low clinical
V/Q + PA
CT
US + CT
D-dimer ± CT was more
effective and less costly
than CT alone in the
The strategy of D-dimer followed by CT was the
cost-effective option in

82
probability of PE CT + US
D-dimer + CT
D-dimer + US + CT
D-dimer + CT + US
V/Q + CT
D-dimer + V/Q + PA
intermediate and high
probability populations.
populations with low,
intermediate and high
probabilities of PE.
Paterson
2001150
Canada To assess the cost-effectiveness
of hCT for the diagnosis of acute
PE
Combinations of:
V/Q
Leg US
hCT
Conventional PA
Cost per additional life
saved was $70,833 for
hCT ± leg US relative to
V/Q ± leg US ± hCT.
hCT can replace PA in
patient with non-
diagnostic V/Q scan and
negative leg US
findings.
Perrier
2003147
Switzerland Evaluate the most CE strategy
for the three levels of clinical
probability of PE
Combinations of:
hCT
D-dimer
US
V/Q scan
Angiography
For low clinical
probability, the most CE
strategy was D-dimer,
US, and V/Q. For
intermediate and high
clinical probability, a
fourth test must be
added, either CT or
angiography
hCT in diagnostic
strategies for PE is CE
provided that it is
combined with D-dimer
and US, in contrast, hCT
as a single-test is not CE
Righini
2007146
Switzerland To evaluate the cost-
effectiveness of including D-
dimer and CUS in the workup of
PE, with particular attention to
patient age
CP ± D-dimer ± CUS ±
hCT
CP ± D-dimer ± hCT
CP ± CUS ± hCT
hCT alone
D-dimer measurement
was highly cost-saving
under the age of 80
years; above 80 years,
the cost-sparing effect of
D-dimer was diminished
Diagnostic strategies
using D-dimer was less
expensive; CUS is
costly, and only
marginally improves the
safety of diagnostic
strategies for PE
Van
Erkel
1996148
Western
Europe
To investigate the cost-
effectiveness of diagnostic
strategies involving hCT or
conventional PA in the diagnosis
of suspected PE
Combinations of:
V/Q scan
US
D-dimer
Conventional PA
hCT
All the best strategies
included hCT
Use of hCT angiography
is likely to reduce the
mortality and improve
cost-effectiveness in the
diagnostic work-up of
suspected PE
Van
Erkel
The
Netherlands
Re-examine the CEA previously
conducted to adjust for updated
Combinations of:
V/Q scan
Strategies including hCT
had lower costs and
Confirms results of the
original CEA

83
1998149
information US
D-dimer
PA
hCT
higher survival than
strategies using PA
Van
Erkel
1999153
France, the
Netherlands,
Great
Britain,
Austria,
Switzerland,
USA
To assess whether
potential differences in costs for
diagnostic procedures
and treatment of PE
among European and U. S.
hospitals alter the optimal
CE diagnostic strategy for PE
CT strategies (CT, US,
P-scan, V/Q, D-Dimer)
PA strategies (US, PA,
V/Q, D-dimer)
Reference strategies (no
therapy, all therapy)
There were considerable
differences in costs for
diagnostic and
therapeutic procedures
for PE among the
participating centers.
These differences,
however, did not affect
the most CE strategy
based on incremental
cost-effectiveness.
In all hospitals, the most
CE strategy appeared to
be US followed by hCT.
Ward
2011142
USA To analyze the cost-
effectiveness of a selective CT
strategy incorporating the use of
CUS to diagnosis and treat DVT
in patients with a high pretest
probability of PE
Universal CT
Selective CT with
screening CUS
The selective CT
strategy cost $1,457.70
less than the universal
CT strategy and resulted
in a gain of 0.0213
quality-adjusted life
years
A selective CT strategy
using CUS is CE for
patients provided they
have a high pretest
probability of PE
CE = cost-effective; CP = clinical probability; CT = computed tomography; CTA = computed tomography angiogram; CTP = computed tomography with pulmonary portion; CTV = computed
tomography venography; CUS = compression ultrasonography; ED = emergency department; hCT = helical computed tomography; P-scan = perfusion scan; PA = pulmonary angiography; PE = pulmonary embolism; US = lower limb venous ultrasound; V/Q = ventilation-perfusion
*Unable to access full-text of Elias 2004154

84
8.3 Methods
8.3.1 Objective
The objective of the economic evaluation was to evaluate the lifetime costs, health outcomes and
the cost-effectiveness of interventions to promote the appropriate use of CT in diagnosing PE in
emergency departments of British Columbia.
8.3.2 Type of analysis
A cost-utility analysis was conducted to account for the broad set of clinical outcomes associated
with a correct diagnosis or misdiagnosis of PE. Health outcomes were expressed as quality
adjusted life years (QALYs) to capture both the mortality and morbidity impacts related to the
condition and its treatments. The primary outcome in the economic analysis was the incremental
cost per QALY gained (commonly referred to as the incremental cost-utility ratio [ICUR]).
8.3.3 Target population and settings
The target population was adults suspected of first-time PE presenting at the emergency
department. All patients were suspected of PE based on clinical judgment by the attending
physician prior to any clinical decision rule and/or diagnostic imaging. Patients with a history of
PE were not included given that these patients have a higher risk of PE recurrence and represent
a different population. The reference case cohort represents patients 65 years of age with 50%
males; this matched the population of those diagnosed with PE in British Columbia in 2014/15.
The underlying prevalence of PE was estimated to be 9.25%, this prevalence was estimated from
patients with suspected PE in the emergency departments at four tertiary care hospitals in
Canada.155
Not all patients suspected of PE may be suitable to undergo CT. Specifically, pregnant patients
may undergo thoracic ultrasound and were not considered in this analysis. Lastly, the setting was
the British Columbia health care system in which it is assumed that there was access to all
diagnostic tests (e.g., biochemical d-dimer test and CT).
8.3.4 Time horizon and discount rate
As the clinical and cost consequences of a diagnosis of PE can persist indefinitely, a lifetime
time horizon was adopted. Alternative time horizons were evaluated in sensitivity analyses (i.e.,
three months, one year). The current revised draft Canadian guidelines suggests a discount rate

85
of 1.5% per annum156
. In the base case analysis the costs and benefits were discounted at 1.5%,
and a sensitivity analysis was conducted with the previously recommended discount rate of
5%157
.
8.3.5 Diagnostic algorithm comparators
As noted in the clinical review, diagnosis of PE may involve a multistep sequential algorithm.
Previous algorithms have included clinical decision support tools (such as Wells’ score or
PERC), ancillary test (such as D-dimer) and diagnostic imaging (usually CT). Integrated
approaches combining a sequence of diagnostic tests and using well-validated algorithms have
been proposed158
. Clinical guidelines have also recommended different algorithms. In the
Clinical Practice Guidelines, algorithms including Wells’ and D-dimer are recommended; in
Calgary the PERC is also included.
Thus, the model considers 5 different comparators:
1. CT alone
All patients suspected of PE have a CT scan
2. D-dimerCT
All patients suspected of PE have a D-dimer test, negative tests are no longer suspected
and positive tests go on to CT
3. WellsD-dimerCT (high)
All patients who have a high Wells’ score go directly to CT, all patients with a moderate
or low Wells’ score have D-dimer, and positive D-dimer go to CT
4. WellsD-dimerCT (moderate and high)
All patients who have a high or moderate Wells’ score go directly to CT, all patients
with a low Wells’ score have D-dimer, and positive D-dimer go to CT
5. WellsPERCD-dimerCT
All patients who have a high Wells’ score go directly to CT, all patients with a moderate
Wells’ score have D-dimer and positive D-dimer go to CT, all patients with a low Wells’
score have a PERC test, negative PERC tests are no longer suspected of PE, positive
PERC tests have D-Dimer and positive D-Dimer go to CT

86
In the appropriate use of CT section (Appropriate Use of CT) four types of interventions are
identified: clinical decision support; audit and feedback; guidelines, and communication. Most of
these interventions include the use of a PE diagnostic algorithm such as the Wells’ score and D-
dimer test. All four types of interventions report a positive change to CT yield, suggesting that
these interventions are effective at increasing CT yield compared to CT alone. Of the three
studies that demonstrate statistically significant results, the interventions include Wells’ score
and D-dimer tests prior to the CT examination 130,136,137
. However, yield alone is not sufficient to
maximize the health benefits of patients. Improving yield may result in fewer patients being
diagnosed, and therefore, patients missing treatment. Thus it is important to understand how
different diagnostic algorithms affect the diagnostic accuracy and how changes in accuracy affect
patients’ health and system costs. Based on those interventions deemed to improve yield and the
jurisdictional scan, the economic model explores strategies incorporating clinical decision
support tools with different combinations of the Wells’ Score, PERC and D-dimer test prior to
CT for diagnosing PE. Guidelines, audit and feedback and communication are not explicitly
considered in the model. The audit and feedback intervention requires electronic medical
records which are not currently available across BC and would incur high costs for little benefit.
The guideline and communication strategy rely on having a more cost-effective strategy to
communicate. The model estimates which strategy would be the most cost-effective to help
determine which strategy to develop guidelines or communication interventions.
Ancillary tests such as leg ultrasound or capnography5 were not identified to be used in British
Columbia from the jurisdictional scan and thus were not considered in the intervention strategy.
A variety of imaging modalities can be used to diagnose PE (CT, MRI, V/Q-based technologies,
thoracic ultrasound), however, these tests were not considered as they are rarely used in BC
practice.
8.3.6 Perspective
The perspective of the British Columbia Ministry of Health was adopted. As such, all medical
costs were captured including the cost of laboratory and diagnostic tests, emergency visits, in-
patient visits and medical services. Indirect non-medical costs, such as productivity losses and
out-of-pocket costs, were not considered in this analysis.
5 The monitoring of carbon dioxide in exhaled air.

87
8.3.7 Decision analytic model
A decision-analytic hybrid model was constructed to examine the clinical outcomes and costs
associated with diagnostic algorithms in a cohort of patients suspected of PE. The model was
developed in collaboration with CADTH. Conceptualization was undertaken by CADTH and the
HTA Unit in collaboration with clinical experts, CADTH programmed the model, the HTA Unit
validated the programming and populated the model inputs for this version of the model.
The model consisted of i) an upfront decision tree that captured the short-term screening
outcomes and ii) a downstream Markov model to capture the long-term outcomes following a
correct or mis-diagnosis. The Markov model was previously developed to assess anti-coagulant
treatment on deep vein thrombosis (DVT) and PE99
. The model was updated to be relevant to PE
only by eliminating the DVT specifics outcomes. The clinical pathway and decision-analytic
model were developed by reviewing existing clinical and economic literature, and the model
conceptualization was subsequently validated by clinical experts from different medical
specialties who are involved at different stages of the diagnostic process and clinical
management of PE (i.e., radiology, emergency medicine).
Figure 19 presents the structure of the decision tree reflecting the diagnostic process for PE (i.e.,
diagnostic algorithm of sequential tests). The patient cohort, patients suspected of PE, proceed
through the decision tree. Depending on which of the 5 diagnostic pathways were being tested
patients are tested with either CT, D-dimer or Wells. Follow-up testing depended on the
diagnostic pathway.

88
Figure 19. Decision Tree for Diagnostic Algorithms
CT=computed tomography; H= high; M=moderate; L=low; PE = pulmonary embolism, 1= CT alone, 2= D-dimerCT, 3= WellsD-
dimerCT (high), 4= WellsD-dimerCT (moderate and high), 5= WellsPERCD-dimerCT
Using the prevalence and sensitivity and specificity of each test, patients were identified as
having ‘PE’ or ‘No PE’. The model also identified the proportion of those identified as having
PE as true positive or false positive and the proportion of those identified as No PE as true
negatives or false negatives. This is important for the second part of the model since patients
were treated based on how they are identified and patient outcomes depend on the treatment they
received and whether they were identified correctly.
Figure 20 demonstrates an example of one comparator and how prevalence and accuracy data are
used to estimate the outcomes of the decision tree i.e. true positive, true negative, false positive
and false negative.

89
Figure 20. Decision Tree Outcomes for Algorithm: WellsPERCD-dimerCT
CT=computed tomography; H= high; M=moderate; L=low; PE = pulmonary embolism, 1= CT alone, 2= D-dimerCT, 3= WellsD-
dimerCT (high), 4= WellsD-dimerCT (moderate and high), 5= WellsPERCD-dimerCT
Outputs of the decision tree, relating to diagnostic test accuracy (i.e., true positive, false positive,
true negative, false negative), were incorporated into the adapted Markov cohort model (Figure
21).
From the decision tree, patients classified as true positives entered the treatment model. While on
treatment, patients were at risk of treatment-related complications but also benefit from treatment
due to a lowered risk of recurrent PE. Patients classified as true negatives did not receive
treatment and were not at risk of any recurrent PE. Patients classified as false positives
inappropriately received treatment and were at risk of treatment-related complications during the
treatment period without any treatment-related benefits (i.e., they were not at risk of recurrent
PE). Patients classified as false negative, on the contrary, are modelled to have treatment
withheld and were at an increased risk of recurrent PE and PE-related mortality. Patients that had
a second non-fatal PE were assumed to be correctly diagnosed and anticoagulant therapy
initiated.

90
Figure 21. Conceptual Design of the Markov component of the economic model
After each cycle, patients may move from one health state to the next as indicated by the arrows or remain in the previous state. Although not
explicitly shown, all states can lead to death. Adapted from CADTH, 201699
ICH = intracranial hemorrhage, CRNM = clinically relevant non-major; CTEPH = chronic thromboembolic pulmonary hypertension; PTS = post-
thrombotic syndrome; VTE = venous thromboembolism
The Markov portion of the model adopted a lifetime perspective that follows patients to death. At
any health state in the model, patients had a risk of death. Patients diagnosed with PE entered the
“anticoagulation state” while patients not diagnosed with PE entered the “off treatment” state.
Patients cycled monthly through health states related to PE and its treatment, including:
Recurrent PE159
: PE that occurs after successful treatment of newly diagnosed PE
(successful treatment where there is clear clinical improvement of patient symptoms and
signs within the first 2 weeks of treatment)
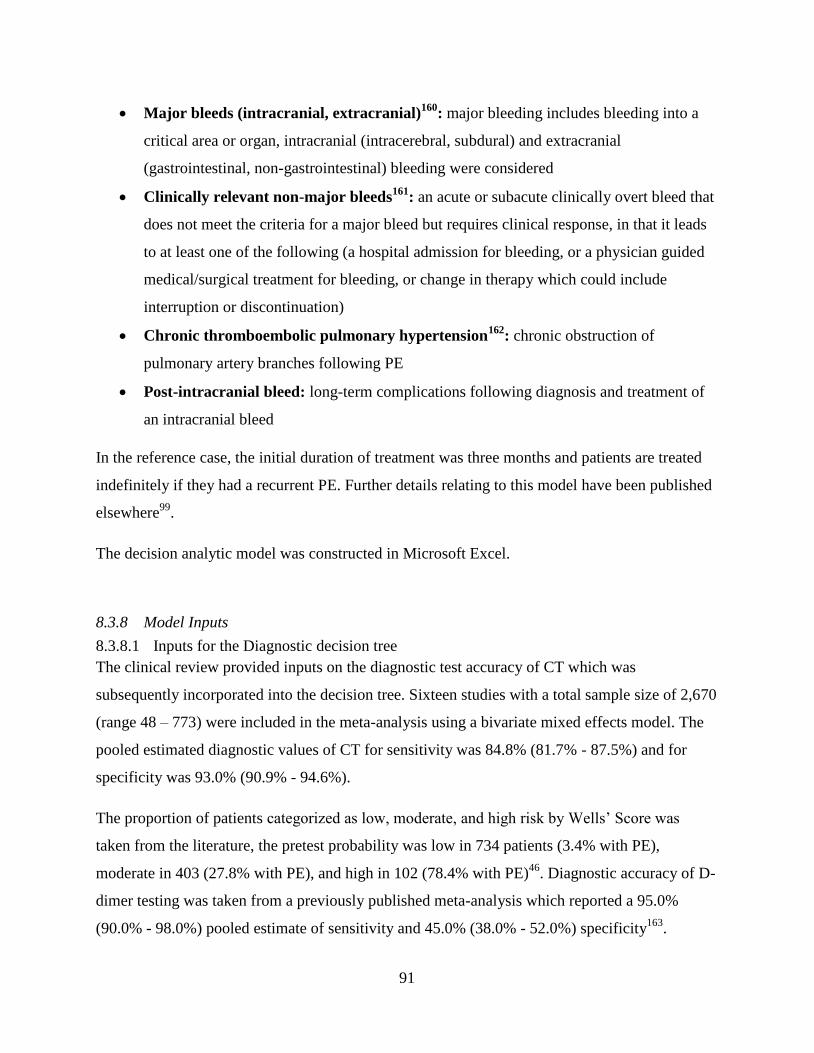
91
Major bleeds (intracranial, extracranial)160
: major bleeding includes bleeding into a
critical area or organ, intracranial (intracerebral, subdural) and extracranial
(gastrointestinal, non-gastrointestinal) bleeding were considered
Clinically relevant non-major bleeds161
: an acute or subacute clinically overt bleed that
does not meet the criteria for a major bleed but requires clinical response, in that it leads
to at least one of the following (a hospital admission for bleeding, or a physician guided
medical/surgical treatment for bleeding, or change in therapy which could include
interruption or discontinuation)
Chronic thromboembolic pulmonary hypertension162
: chronic obstruction of
pulmonary artery branches following PE
Post-intracranial bleed: long-term complications following diagnosis and treatment of
an intracranial bleed
In the reference case, the initial duration of treatment was three months and patients are treated
indefinitely if they had a recurrent PE. Further details relating to this model have been published
elsewhere99
.
The decision analytic model was constructed in Microsoft Excel.
8.3.8 Model Inputs
8.3.8.1 Inputs for the Diagnostic decision tree
The clinical review provided inputs on the diagnostic test accuracy of CT which was
subsequently incorporated into the decision tree. Sixteen studies with a total sample size of 2,670
(range 48 – 773) were included in the meta-analysis using a bivariate mixed effects model. The
pooled estimated diagnostic values of CT for sensitivity was 84.8% (81.7% - 87.5%) and for
specificity was 93.0% (90.9% - 94.6%).
The proportion of patients categorized as low, moderate, and high risk by Wells’ Score was
taken from the literature, the pretest probability was low in 734 patients (3.4% with PE),
moderate in 403 (27.8% with PE), and high in 102 (78.4% with PE)46
. Diagnostic accuracy of D-
dimer testing was taken from a previously published meta-analysis which reported a 95.0%
(90.0% - 98.0%) pooled estimate of sensitivity and 45.0% (38.0% - 52.0%) specificity163
.

92
Diagnostic accuracy of PERC was also taken from a previously published meta-analysis which
reported a pooled estimate of 97.0% (96.0% - 98.0%) sensitivity and a specificity of 23.0%
(22.0% to 24.0%)164
.
The probability of having PE, if suspected of PE, used in the model was 9.25%. This was
estimated from 930 patients with suspected PE in emergency departments at four tertiary care
hospitals in Canada.155
8.3.8.2 Inputs for the Treatment Markov model
Baseline probabilities in the re-adapted Markov model are outlined in Table 16. Specifically,
false positive patients entered the anticoagulant health state and were assumed to receive a
course of treatment for three months. Their risks of experiencing a bleeding adverse event during
the treatment period was increased to the same levels as true positives although their probability
of a recurrent PE was set to zero. After treatment ends, the prognosis of false positive patients
was modelled to be similar to the general population who did not have a prior PE diagnosis.
False negative patients were at an increased risk of death and an increased risk of recurrent PE in
the first month given that treatment was withheld (Table 16). Thereafter, the prognosis of these
patients in terms of their risk of mortality and recurrence was assumed to be similar to PE
patients off anticoagulant treatment (i.e., risks are higher than the general population but lower
than those with an incident PE). True negatives were modelled to reflect a general Canadian
population with general Canadian mortality rates applied.

93
Table 16. Baseline probabilities of recurrent PE.
Parameter Value (probabilistic) References
Recurrent
PE On Treatment
3-month probability of recurrent PE
(short-term LMWH+VKA)†
0.017 (Beta: α= 14;
β=811)
Quinlan, 2004165
Annual probability of recurrent PE
(lifetime LMWH+VKA)Ŧ
0.031 (Normal:
µ=0.031; σ=0.012)
Agnelli, 200316
Off Treatment/ Untreated
First month probability of recurrent PE 0.263 (Beta: α= 5;
β=14)
Barritt, 1960166
Annual probability of recurrent PE 0.041 (Normal:
µ=0.041; σ=0.009)
Agnelli, 200316
Treatment-
related
bleeds
On Treatment
3-month probability of major bleed
(short-term LMWH+VKA)
0.014 (Beta: α= 14;
β=1,009)
Quinlan, 2004165
6-month probability of CRNM bleed
(short-term LMWH+VKA)
0.082 (Beta: α= 1,111;
β=12,452)
CADTH, 201699
Annual probability of major bleed
(lifetime LMWH/VKA)
0.027 (Normal: µ=
0.012; σ= 0.010)
Aujesky, 2005167
PE-related
mortality* On Treatment
Case fatality rate, treated± 0.6 (Beta: α= 23,040;
β=288,580)
Stein, 2012168
Probability of death (short-term, month 2
to 3)
0.008 (Normal:
µ=0.008; σ=0.0005)
Wells, 2016169
Probability of death (long-term, >3
months)
0.033 (Beta: α= 125;
β=153)
Schulman, 2006170
Off Treatment
Case fatality rate, untreated± 0.263 (Beta: α= 5;
β=14)
Barritt, 1960166
CRNM = clinically relevant non-major bleed; LMWH = low molecular weight heparin; PE = pulmonary embolism; VKA = vitamin K antagonist † Applies for the first six months of the model
Ŧ Applies from the seventh month onwards
±Applied to the cycle of an incident PE *After PE, mortality rates return to the Canadian general population age-specific mortality rate.
8.3.9 Utilities
Given that the diagnosis of PE occurs rapidly (within hours/days), no utility weights were
applied to outcomes associated with the diagnostic decision tree. Utility weights were applied to
each health state in the treatment Markov model. The length of utility impact was assumed to be
one month for PE, one week for major extracranial bleed, and permanent for both major
intracranial bleeds and CTEPH. Table 17 summarizes the utility values, a more detailed
description is available in the original treatment model99
.
Utility values for PE, extracranial bleed, and major intracranial bleed were based on thrombosis
clinic patients (n=215) with a history of lower limb DVT or PE in Ottawa, Ontario, Canada171
.

94
The utility values for PE was 0.75, extracranial bleed was 0.65, and major intracranial bleed was
0.15. The utility value for post intracranial bleed was 0.713 and was based on a population in the
United Kingdom. The utility value for CTEPH was 0.648 and based on 15 patients with CTEPH
in Spain. The majority of the utility values for health states in the treatment model were
determined through the standard gamble method although post intracranial bleed and CTEPH are
from a generic (i.e., EQ-5D) and disease-specific quality of life scale (i.e., Cambridge Pulmonary
Hypertension Outcomes Review), respectively. Age-specific Canadian population norms were
applied for patients not experiencing an acute event or long-term consequences of a
disease/treatment-related event. These were from the general population (n=1,555) in Canada
with health status measured using EQ-5D to estimate preference weights for population utility
values172
.
Table 17. Utility values for treatment-related health states
Parameter Description Utility value (probabilistic) Reference
Population
norm
General population
(n=1,555); EQ-5D
Canada
Age 55-64: 0.828 (Beta: α= 657.74;
β=136.63)
Age 65-75: 0.79 (Beta: α= 535.88;
β=142.45)
Age 75+: 0.705 (Beta: α= 463.41;
β=193.91)
Johnson 172
PE
EC bleed
Major IC bleed
Lower extremity DVT or PE
patients (n=215); standard
gamble
Canada
0.75 (Beta: α= 161.25; β=53.75)
0.65 (Beta: α= 139.75; β=75.25)
0.15 (Beta: α= 32.25; β=182.75)
Hogg,
2013171
Post IC bleed Population-based cohort
(n=2,425); EQ-5D
UK
0.713 (Beta: α= 1,729.03; β=695.98) Rivero-Arias,
2010173
CTEPH CTEPH patients (n=15); EQ-
5D
Spain
0.648 (Beta: α= 9.72; β=5.28) Roman,
2013174
Death 0 Assumption PE = pulmonary embolism; EC = extracranial; IC = intracranial; CTEPH = chronic thromboembolic pulmonary hypertension
8.3.10 Costs
Given the model’s perspective (i.e., public health care payer), only direct medical costs were
considered. Whenever possible, the most current BC cost estimates were used. If BC costs were
unavailable, costs are estimated from the literature were used. Where costs were unavailable
from Canada conversion of currency was conducted using the Bank of Canada currency
converter175
. All cost estimates reflected 2016/2017 Canadian dollar and, if necessary, prices

95
were adjusted to 2016 values using the health care component of the consumer price index
inflation calculator from the Bank of Canada176
.
Resources with equal utilization across all diagnostic strategies (i.e., initial physician clinical
examination) were omitted from the analysis. Similarly, given that symptoms of PE may be
undifferentiated, costs of other tests performed for differential diagnosis purposes unrelated to
PE (e.g., chest X-ray, ECG) were considered outside of the scope of this study’s interest.
8.3.10.1 Program Costs for Implementation of Clinical Decision Support Tool
The cost of implementing the clinical decision support tool was based on the costs from the
University of Calgary’s Clinical Research Unit in designing a clinical decision support tool for
PE which included the development process and linking the tools to a database for data
collection177
. Costs for maintenance of the tool were also obtained from the University of
Calgary. The cost of implementation of an online-based clinical decision support tool in Calgary
was estimated to be $30,000 with annual maintenance costs of $5,000.
8.3.10.2 Per patient diagnostic test costs
8.3.10.2.1 Risk Stratification with Wells’ Score and PERC
In order to calculate the cost per patient for the clinical decision support tool program
(implementation and annual costs), the number of patients eligible for assessment (those
suspected of PE in British Columbia) must be established. Data from CIHI suggests that for all
of British Columbia, there were 1,477,564 ED visits in 2014/2015178
. An audit of CTs for
diagnosing PE was conducted in Fraser Health Authority in 2012/2013 over a 1.5 year period179
.
In this audit, it was reported for 850,000 ED visits in the Fraser Health Authority, 3,555 CT
examinations for PE were performed which gives an estimate of 4.18 CT examinations for PE
per 1,000 ED visits. It has also been reported that the Fraser Health Authority covers 1.8 million
of 4.631 million residents in British Columbia (39%)180
. Using these estimates, the number of
patients suspected of PE in British Columbia and eligible for diagnostic imaging by CT were
calculated:

96
3,555 CT examinations over 1.5 years provides an estimate of 2,370 per year. Assuming
2,370 CT scans represents 39% of all CT scans in British Columbia, then this would
suggest 6,097 examinations for PE.
Applying the estimate of 4.18 CT examinations for PE per 1,000 ED visits to the total
number of 1,477,564 ED visits in 2014/2015 for all of British Columbia, this would
suggest 6,180 examinations for PE.
Given the estimates of 6,097 to 6,180 examinations for PE, the decision analytic model assumed
that approximately 6,139 CT examinations for PE are performed each year. Thus the cost per
patient for the clinical decision support tool program for patients assessed by the Wells’ Score
was averaged over 6,139 patients suspected of PE in British Columbia.
In addition to costing the clinical decision support tool program over all patients assessed by the
Wells’ Score, the cost of emergency physician time to complete the clinical score was
incorporated. The time to complete the Wells’ Score was based on expert opinion (five minutes),
this value was slightly lower than previously reported (10 minutes, range of 5 – 15)181
. However,
in British Columbia, the physician fee for an emergency department consultation is not time-
dependent; the length of an emergency department consultation is variable and based on several
factors reflective of patient characteristics and available hospital resources. As the average length
of a consultation is unknown, the review assumed the consultation rate of an emergency
department consultation ($128.34) was per hour. Based on a completion time of five minutes for
the Wells’ score and the cost per hour for an emergency consultation of $128.34, the total cost of
completing the Wells’ Score was estimated to be $10.70. Taking into consideration the cost of
the clinical decision support tool, the total cost per patient for the Wells’ Score was $12.49. To
estimate the cost of assessing PERC after Wells’, it is assumed that the cost of implementation
and maintenance of a clinical decision support tool is already incorporated into the Wells’ Score,
thus the additional cost of PERC is only the time cost of completing PERC. The total cost per
patient for the PERC score was $10.70 (
Table 18).

97
8.3.10.2.2 Laboratory and imaging tests (D-Dimer and CT)
Laboratory and diagnostic costs included both the tests and the physician’s charge for
interpretation of the test. Physician billing were obtained from the British Columbia Ministry of
Health Medical Services Commission Payment Schedule. The physician cost of a D-dimer test
was $23.59. The physician cost of a CT was $98.38 and the cost of a CT test was $725. The cost
of a CT test was based on data provided by the British Columbia Ministry of Health.
Table 18. Per patient costs
Risk
stratification
and tests
Parameter Value Reference(s) Total
cost per
patient
Wells Score
Cli
nic
al
dec
isio
n
support
tool
Cases of suspected PE 6,139 Calculated $12.49
Lifetime, years 5 Assumption
Implementation. cost $30,000 University of Calgary177
Annual maintenance. cost $5,000 University of Calgary177
Clinical decision support
tool, cost per patient^
$1.79 Calculated
Com
ple
tion
of
Wel
ls’
Sco
re
Time, minutes (range) 5 (0-15) Expert opinion, NICE181
Emergency physician
consultation, cost
$128.34 BC Schedule of Fees182
Completion of Wells’
Score, cost per patient
$10.70 Calculated
PERC Completion of PERC Score $10.70 Calculated $10.70
D-Dimer D-Dimer Physician Fee $23.59 BC Schedule of Fees182
$23.59
CT CT Physician Fee $98.39 BC Schedule of Fees182
$823.38
CT Imaging Test $725 BC Ministry of Health
^Completion time by emergency physician assumed to be equivalent to Wells’ Score; &CT Physician Fee + CT Imaging Test
PE = pulmonary embolism; Pulmonary Embolism Rule-out Criteria; CT = computed tomography
8.3.10.3 Treatment Costs
The treatment costs of patients with positive test results for PE included: anticoagulation therapy,
laboratory tests, and physician fees. The standard of care for patients diagnosed with PE was
initial parenteral anticoagulation (i.e., LMWH) followed by at least three-months of oral
administration of VKAs which was overlapped with LMWH until systemic anticoagulation is
achieved. Given the findings of the recently published Markov model suggesting that this
treatment regimen remains the most likely cost-effective intervention99
, treatment in the
reference case was assumed to be this regimen. VKA requires monitoring of INR and dose
titration. The resources relating to laboratory tests for monitoring anticoagulant therapy was
based on the existing published Markov model 99
.

98
Drug costs were determined using the British Columbia Pharmacare Formulary183. No additional
markup or dispensing fee was applied.
Table 19. Anticoagulation treatment costs
Treatment Details Costs Monthly Costs References
Low-
molecular
Weight
Heparin
(LMWH)
LMWH for 7
days + Nursing
Time
LMWH:
$23.8212 / day
Nursing Time:
$12.51
$179.26 BC Ministry
of Health,
CADTH 99
Vitamin K
antagonist
(VKA)
Daily Warfarin $0.0715 / day%
$2.17
Total
Costs:
Months
0-3:
$47.75
Months
4-6:
27.23
Months
6+:
10.53
BC
PharmaCare
Formulary
Search183
Test /
Interpretation
Month
0-3 4-6 6+
INR test
# of INR Tests:
Months 0-3: 8
Months 4-6: 3
Months 6+: 1
$12.31 / test
$32.83 $12.31 $4.10 BC Schedule
of Fees182
INR and VKA
Interpretation
# of
Interpretations:
Months 0-3: 3
Months 4-6: 3
Months 6+: 1
$12.75 /
interpretation
$12.75 $12.75 $4.25 Ontario
Schedule of
Benefits184
INR = international normalized ratio
8.3.10.4 Event Costs
Costs to manage PE and treatment-related complications were based on the published Markov
model (Table 20)99
. The cost of PE management reflected a weighted cost based on an
assumption that 67% are in an inpatient setting while the remaining are in an outpatient service.
To estimate the costs of PE treated as an inpatient, the length of stay was assumed to be 7.8
days99
. This length of stay was used in the previously published model and was very similar to
the 7.5 days estimated using BC-based data. The resource use of treating PE in an outpatient
setting were the same as those previously used99
. These costs included consultations with an

99
emergency physician, a general practitioner, a specialist and blood counts.99
. Descriptions of
other event costs are detailed in Table 20.
As British Columbia specific costs were not available for treatment of PE, the Ontario Case
Costing Initiative provided hospital-related costs (i.e., length of hospitalization, nursing, in-
hospital pharmacy costs and overhead costs). The British Columbia Ministry of Health Medical
Services Commission Payment Schedule provided the physician billing fees for associated visits.
These sources provided estimates of event costs for PE (inpatient and outpatient), CRNM bleeds,
and EC bleeds. Estimates of resource use and costs for IC bleeds, CTEPH, and post-IC bleeds
were derived from the literature99
. The cost of an intracranial bleed used in the previously
published model was very similar to the $17,044 estimated using BC-based data.
Table 20. Event costs
Parameter Components Included Total Cost Source
PE
(inpatient)
PE as most responsible diagnosis (7.8 day LOS): $705499
Specialist Consultation: $169.06/visit
Specialist Follow-up: $80.39/visit
$8038.29 BC Schedule of
Fees182
,
PE
(outpatient)
ER Visit: $39999
ER Consultation: $128.34/visit
GP Consultation: $82.24/visit
Specialist Consultation: $169.06/visit
Specialist Follow-up: $80.39/visit
Blood Count: $5.77/test
$956.59 BC Schedule of
Fees182
CRNM
Bleed
ER Visit: $28599
ER Consultation: $128.34/visit
$417.36 BC Schedule of
Fees182
EC Bleed Cost of GI hemorrhage treatment99
$5591.79 BC Schedule of
Fees182
IC Bleed Acute treatment cost of hemorrhagic stroke which
included initial hospitalization and follow-up costs
$17,531.90 Goeree, 2005185
CTEPH PTE surgery was assumed in 56.8% of patients $47,867.86 Rubens, 2007186
Post-IC
Bleed
Yearly cost (adjusted to monthly costs for one-month
follow-up): $8,243
$696.61 Wells 2012187
PE = pulmonary embolism; LOS = length of stay; ER = emergency room; GP = general practitioner; GI = gastrointestinal; CRNM = clinically
relevant non-major; EC = extracranial; IC = intracranial; CTEPH = chronic thromboembolic pulmonary hypertension; PTE = pulmonary thromboendarterectomy
8.3.11 Model Validation
The model structure and data inputs were presented to two Canadian clinical experts to ensure
that the model, its parameters and its assumptions reflected Canadian clinical practice and the

100
available body of literature (face validity). Internal validity was assessed by ensuring the
mathematical calculations were performed correctly and were consistent with the model
specification. Logical discrepancies were assessed by evaluating it under hypothetical and
extreme conditions. The model also underwent external peer review.
The long-term component i.e. Markov model also underwent external validation
99. However,
given that the model was restructured for a slightly different application, further external
validation was conducted to ensure the revised model remained valid. Validation was done
independently by comparing rates of recurrent PE and death reported in other studies188
. To
externally validate the decision tree, the model’s outputs in terms of diagnostic accuracy (i.e.,
true positive, true negatives, false positive, false negatives) were compared to positive CT yield
established by the audit of CTs in diagnosing PE in the Fraser Health Authority, the yield
reported at Vancouver General Hospital and Richmond Hospital189
and interventions identified
in the clinical review (Appropriate Use of CT)190
.
8.3.12 Sensitivity Analysis
Sensitivity analyses were conducted to evaluate the degree to which the uncertainty in cost and
effectiveness parameters impacted the models’ findings. Sensitivity analyses were conducted to
explore situations in which the results would change and to characterize the impact of different
model assumptions. These included:
Patient demographics: The reference case represents the demographics of patients with
newly diagnosed PE in British Columbia, the population of patients suspected with PE may
differ and thus the age and proportion male were varied.
Time horizon: The reference case presented the lifetime cost-effectiveness of strategies.
Given that the long-term outcomes are based on extrapolation, shorter model durations
were explored (3 month, 1 year).
Discount rate: The reference case adopted the most recent discount rate recommendation
of 1.5%, the previously recommended discount rate of 5% was explored.
Prevalence of PE among suspected PE: The reference case model assumed the general
population suspected of PE reported in Canadian studies. However, some patients are at
increased risk of PE and thus this parameter was varied.

101
Cost of clinical decision support tool: Cost of implementation of the electronic clinical
decision support tool may vary for hospitals and regional health authorities. Sensitivity
analysis tested implementation costs of half and double the base case cost.
Time to complete Wells’ Score: The reference case assumed the time for an emergency
physician to complete the Wells’ Score was 5 minutes, a range of 0-15 minutes was
explored.
8.3.13 Probabilistic Sensitivity Analysis
The reference case findings for the economic evaluations reflect the deterministic results;
probabilistic results were based on 2,500 Monte Carlo simulations of the parameters’
distributions. For the simulation, probability distributions related to natural history, resource
utilization, costs and utilities were incorporated into the analysis, adopting standard methods for
defining parameter uncertainty. Risk stratification and diagnostic accuracy were characterized by
beta distributions, treatment effects were characterized by normal or beta distributions, transition
probabilities and relative risks were characterized by beta and normal distributions, utility values
were characterized by beta distributions, and event costs were characterized by gamma
distributions. To account for the correlation between sensitivity and specificity of the diagnostic
accuracy of CT, 5,000 paired values of sensitivity and specificity were generated based on the
empirical correlation structure. The probabilistic results characterize the extent to which
parameter uncertainty impacts the cost-effectiveness estimates in the model. Results of the
probabilistic analysis are presented on a cost-effectiveness acceptability curve (CEAC). This
graph presents the probability that each strategy is optimal given different willingness-to-pay
values for an additional QALY gained.
8.4 Results
8.4.1 Model Validation
For external validation, the model’s outputs were compared to independent clinical studies. The
current economic model was meant to reflect the general Canadian population, therefore, the
model’s predictions on mortality are compared to those reported in registry and cohort studies.

102
Table 21. Results of model validation exercise
Parameter Study Reported Results (95%CI) Model Prediction
All-cause
mortality
Lobo, 2006191
Registry of 4,145 patients
Age NR; 43.0% males
Setting: Spain
Total follow up: 3 months
after hospital discharge
Cumulative Mortality
3 months: 5.07% Cumulative Mortality
3 months: 7.87%
Pengo, 200613
Case study involving 223
patients
Age 60.8; 42.2% males
[treatment for minimum of
6 months and extended
based on individuals]
Setting: Italy
Total follow up: 10 years
Cumulative Mortality
3 months: 10.3% (6.3 to
14.4)
1 year: 13.4% (8.9 to 17.9)
10 years: 25.1% (14.2 to 36)
Cumulative Mortality
[in true positive cohort]
3 months: 7.87%
1 year: 9.19%
10 years: 20.04%
Major
bleeding
Lobo, 2006191
Cumulative Incidence
3 months: 1.39% Cumulative Incidence
3 months: 1.34%
Recurrent
PE
Lobo, 2006191
Cumulative Incidence
3 months: 1.71% Cumulative Incidence:
3 months: 1.62%
Recurrent
PE
Pengo, 200613
Cumulative Incidence 3 months: 4.9% (1.9 to 7.9)
1 year: 8.0% (4.2 to 11.8)
10 years: 29.1% (16.9 to
41.3)
Cumulative Incidence
3 months: 1.62%
1 year: 4.98%
10 years: 30.97%
CTEPH Pengo, 200613
Cumulative Incidence 6 months: 1.0% (8.1 to 17)
1 year: 3.1% (0.7 to 5.5)
2 years: 3.8% (1.1 to 6.5)
Cumulative Incidence 6 months: 0.003%
1 year: 0.005%
2 years: 0.008% PE = pulmonary embolism; CTEPH = chronic thromboembolic pulmonary hypertension; CI = confidence interval; NR = not reported
At three months, post-diagnosis, the cumulative mortality rate has been reported to range from
5.07% to 10.3%13,191
. The current model predicted 7.87%. Over a ten-year period, the model
predictions were found to slightly underestimate mortality although it remained within the
reported 95% confidence interval13
. The model closely predicted the 3-month cumulative
incidence of several clinical events reported by Lobo et al.191
, however, the model’s predicted
incidence of recurrent PE was lower than that of Pengo et al13
. The only health outcome found to
be very different was the cumulative incidence of CTEPH. The current model’s prediction was
nearly 100-fold lower than the reported incidence. The likely reason for this underestimation lied
with the model structure, where it is assumed patients develop CTEPH only upon experiencing a
recurrent PE. Given the low probability of developing PE (3.1%) and only about 3.46% of

103
patients have a recurrent PE by the sixth month, the incidence of CTEPH estimated in the model
is 0.0009%. As CTEPH is a relatively rare complication, no further changes were made to the
model structure to re-calibrate the model towards this clinical outcome. Rather, sensitivity
analyses are conducted varying the parameter related to CTEPH to understand the robustness of
the model’s findings.
In the clinical review yields of CT prior to the use of intervention ranged from 3% to 30.9%. The
interventions tested use a combination of a risk stratification (mostly Wells’ Score), followed by
rule-out with D-dimer testing, and diagnostic imaging of CT. The post-intervention yield ranged
from 9.2% to 33.1%, suggesting a change in yield of 0.2 to 13.2%. This is compared to the
model estimates of change in yield for the diagnostic comparators that incorporate risk
stratification (Wells’ Score, PERC, and/or D-Dimer) compared with CT alone. The change in
yield estimated in the model ranges from 2.8% to 6.9%. This range is narrower than those
reported in the literature.
The audit of CT in Fraser Health Authority suggested an overall yield of 6.91%192
. The yield is
the percentage of CT examinations that are positive for PE, whether true positive or false
positive. There were approximately 40 CT examinations for each of ten sites. The yield ranges
from 2.50-20.0% for the various hospitals in Fraser Health Authority. In a retrospective analysis
of 1424 CT examinations by Woo et al. at Vancouver General Hospital and Richmond Hospital
188 (13.2%) cases of PE were diagnosed. In this study the yield for inpatients was 14.0%
compared to 14.5% for emergency room patients and 6.8% for outpatients.189
Non-BC studies of
interventions for the appropriate use of CT reported a wide range of yields prior to the
intervention (3.0-30.9%, Figure 16). In the economic model, the yield of CT alone was 14.2%,
which was very similar to that reported by Woo et al. but more than double that reported by the
Fraser Health Authority in 2012/2013. For the other comparators in the model beyond use of CT
alone, the yield ranged from 17.0 to 21.1%. The low yield of Fraser Health Authority reflects
actual clinical practice in BC, but should be considered with caution since it is a single,
unpublished study. Despite the limitations of this data and incorporating the results from Woo et
al., there does seem to be varying yield across hospitals in BC with some performing lower than
what may be possible with additional risk stratification tools. The high yield for all diagnostic

104
strategies in the economic model may not reflect actual clinical practice but rather the ideal
diagnostic work-up; especially given the diagnostic accuracy of Wells’ Score, PERC, D-Dimer,
and CT were based on combined observational and experimental published studies. Overall,
yield is dependent on several factors including, the patient population and the context-specific
diagnostic accuracy of tests. It is expected that the diagnostic accuracy of tests when they are not
used in an experimental setting may be lower which may result in lower yields than those
reported by the model.
The patient population suspected of PE was also important. The model assumes that 9.25% of
patients with suspected PE will be diagnosed with PE, however, this is dependent on physicians’
clinical judgment. In populations where the probability of being diagnosed with PE is lower than
the yield will also be lower. The model parameters or structure were not changed to calibrate the
model to match the yield reported by the Fraser Health Authority, instead the prevalence of PE
was tested in the sensitivity analysis.
8.4.2 Base Case Results
Results of the base case analysis are presented in Table 22 and Figure 22 with disaggregated
costs in
Table 23. The strategy with the lowest cost was WellsPERCD-dimerCT with a total cost
of $1981 and an effectiveness of 12.489 QALYs. Two strategies were excluded as potential
preferred strategies: 1) D-dimerCT was less effective and more expensive than
WellsPERCD-dimerCT and 2)WellsD-dimerCT (high) was also ruled out as another
available strategy provided more benefit at a lower cost per benefit. The remaining strategies
resulted in the following ICURs. WellsD-dimerCT (moderate and high) came to an ICUR of

105
$30,000 per QALY gained compared to the baseline strategy of WellsPERCD-dimer-CT.
CT alone resulted in an ICUR of $364,900 per QALY gained compared to WellsD-dimerCT
(moderate and high). Overall, CT alone results in the highest total QALYs, as CT was more
accurate at diagnosing PE than interventions with risk stratification. However, it was only
marginally better than WellsD-dimerCT (moderate and high) with an incremental QALY
gain of 0.001 (0.4 quality-adjusted days).
Table 22. Base case deterministic results – sequential ICUR Strategy Cost
($)
Incremental
Cost
LYs Incremental
LYs
QALYs Incremental
QALYs
ICUR
($/QALY)
WellsPERC
D-dimerCT
1981 0 16.68 - 12.489 - -
D-dimerCT 2059 78 16.67 -0.0048
12.485 -0.004 Dominated
WellsD-
dimerCT
(high)
2080 99 16.68 0.00098 12.490 0.001 Extendedly
Dominated
WellsD-
dimerCT
(moderate and
high)
2193 113 16.69 0.0080 12.496 0.006 30,300
CT alone 2558 365 16.69 0.0016 12.497 0.001 364,900 LY = life year; QALY = quality-adjusted life year; ICUR = incremental cost-utility ratio; PERC = Pulmonary
Embolism Rule-out Criteria; CT = computed tomography
In Figure 22, the incremental costs and effects from each intervention are presented. The
connecting line represents the efficiency frontier, which links all strategies that are not
dominated. The interventions not at the frontier (D-dimerCT and WellsD-dimerCT (high)
are not preferred since they provide the same or less benefit at a higher cost than the other
interventions. The preferred strategy of the remaining interventions is dependent on the threshold
or willingness-to-pay value for additional benefit (cost per QALY gained).

106
Figure 22. Incremental Cost-effectiveness Plane
W+P+DD+CT = WellsPERCD-dimerCT; DD+CT = D-dimerCT; W+DD+CT = WellsD-dimerCT (high); W+DD+CT2 = WellsD-dimerCT (moderate and high); CT = CT alone QALY = quality-adjusted life year; CT = computed tomography
The CT alone strategy was associated with the greatest diagnostic and treatment costs, $823 and
$1,738, respectively (
Table 23); all patients receive CT which is an expensive diagnostic imaging technique.
Furthermore, treatment costs were higher as there is the highest probability of all strategies to be

107
false positive (6.35%; other comparators ranged from 2.7% to 4.3%) and receive inappropriate
treatment without any benefit. For other strategies, there were lower diagnostic costs (range
from $440 to $617) given a lower proportion of patients were tested with CT as they underwent
risk stratification (Wells’, PERC, D-Dimer). Similarly, long-term costs related to treatment and
complication with PE were lower compared with CT alone as less patients, correctly and
mistakenly, underwent treatment for PE.
Table 23. Disaggregated Costs and Effectiveness
Patients
with CT
(%)
Costs ($) Percent Diagnosed (%) Effectiveness (QALYs)
Strategy Dx
Costs
Tx
Costs
TP FP TN FN TP FP TN FN
WellsPERCD-
dimerCT
48.3 440.61 1508.09 7.45 2.77 87.98 1.79 0.85 0.35 11.17 0.15
D-dimerCT 58.7 506.91 1556.46 7.45 3.49 87.26 1.80 0.85 0.44 11.08 0.15
WellsD-dimerCT
(high)
59.7 526.56 1557.53 7.59 3.56 87.20 1.65 0.86 0.45 11.07 0.14
WellsD-dimerCT
(moderate and high)
71.6 617.04 1607.53 7.80 4.37 6.38 1.45 0.89 0.55 10.97 0.12
CT alone 100 823.38 1738.75 7.84 6.35 84.40 1.41 0.89 0.81 10.72 0.12 QALY = quality-adjusted life year; PERC = Pulmonary Embolism Rule-out Criteria; CT = computed tomography; Dx = diagnostic; Tx =
treatment; FN= false negative, FP= false positive, TN= true negative, TP= true positive
The percent of patients receiving a CT ranged from 48.3% for the WellsD-dimerPERCCT
strategy to 100% for the CT alone strategy (Table 23). Yield ranged from 14.2% (CT alone) to
21.1% with WellsD-dimerPERCCT (Figure 23). Strategies with more risk stratification
(Wells’, PERC, D-dimer) had higher yield as these strategies remove patients with a low
probability of having a PE from being diagnosed by CT. However, strategies with increased
yield were also more likely to mis-diagnosis patients that had PE and miss necessary treatment of
PE.

108
Not all interventions that encourage the use of risk stratification tools will have the same
compliance. For instance communication interventions were found to have lower yields than
guidelines. Furthermore, depending on how demanding a clinical decision support is, i.e.
whether ordering a CT requires completion or not, will affect the compliance of its use.
Assuming physicians normally use CT alone for diagnosing PE, Figure 23 illustrates the
influence of compliance to the various interventions on the diagnostic yield of CT. With greater
compliance to each intervention, the greater the improvement in diagnostic yield of CT. For
example, with a 50% compliance to WellsPERCD-dimerCT (represented by the gray
line) the yield is 16.3%, with 80% compliance this increased the yield to 18.4%.
Figure 23. Yield versus compliance rate of the intervention
PERC = Pulmonary Embolism Rule-out Criteria; CT = computed tomography

109
8.4.3 Sensitivity Analysis Results
Results of the sensitivity analyses are presented in Table 24. Overall conclusion of these results
were that the model was not sensitive to changes in parameters with respect to: age, proportion
of patients male, discount rate, cost of Wells’ clinical decision support tool and the time to
complete clinical decision rule (Wells’ and/or PERC).
When considering a time horizon of only 3 months, QALYs across all strategies were equal
(0.195 QALYs) and WellsPERCD-dimerCT was the lowest cost resulting in it being the
dominant strategy. With a time horizon of one year, WellsPERCD-dimerCT remains the
least costly strategy.
Reducing the prevalence of PE among suspected PE more than doubled the ICUR for WellsD-
dimerCT (moderate and high) compared to the base case of WellsPERCD-dimerCT
($30,300/QALY gained versus 75,267/QALY gained). WellsPERCD-dimerCT had
greater accuracy in identifying patients without PE, thus, a lower prevalence reduced the number
of patients diagnosed with PE. When the prevalence of PE among suspected PE was doubled, the
ICUR was more than halved for WellsD-dimerCT (moderate and high) compared to the
base case of WellsPERCD-dimerCT ($30,000/QALY gained versus $13,200/QALY
gained).
The model was also sensitive to doubling the risk of CTEPH. In this scenario CT alone was the
cost-effective option at an ICUR of $50,000 per QALY. This occurs since CT alone results in
the highest probability of identifying a true positive, therefore if the consequences of not treating
a true positive were very severe than CT alone was the preferred strategy.

110
Table 24. Sensitivity Analyses - Sequential ICUR
Strategy%
($/QALY)
Sensitivity Analysis W+P+DD+CT DD+CT W+DD+CT W+DD+CT2 CT
Reference Case - Dominated Dominated 30,300 364,900
Age (55) - Dominated Dominated 21,040 366,400
Male (40%) - Dominated Dominated Dominated 73,750
Time horizon (3 month) - Dominated Dominated Dominated Dominated
Time horizon (1 year) - Dominated Dominated 218,200 Dominated
Discount Rate (5%) - Dominated Dominated 42,760 363,900
Cost of Wells clinical decision
support tool (double)
- Dominated Dominated 30,186 364,900
Cost of Wells clinical decision
support tool (half)
- Dominated Dominated 30,371 364,900
Time to complete clinical
decision rule of Wells and
PERC (0 minutes)
- Dominated Dominated 32,814 364,900
Time to complete clinical
decision rule of Wells and
PERC (10 minutes)
- Dominated Dominated 27,800 364,900
Probability of CTEPH (double) - Dominated Dominated 35,350 41,558
Probability of CTEPH (half) - Dominated Dominated 30,314 364,899
Prevalence of PE among
suspected PE (double)
- Dominated Dominated 13,200 163,600
Prevalence of PE among
suspected PE (half)
- Dominated Dominated 75,267 383,800
%W+P+DD+CT = WellsPERCD-dimerCT; DD+CT = D-dimerCT; W+DD+CT = WellsD-dimerCT (high); W+DD+CT2 = WellsD-dimerCT (moderate and high); CT = CT alone
QALY = quality-adjusted life year; ICUR = incremental cost-utility ratio; PERC = Pulmonary Embolism Rule-out Criteria; PE = pulmonary
embolism; CTEPH = chronic thromboembolic pulmonary hypertension
8.4.4 Probabilistic Sensitivity Analysis Results
After 2,500 simulations, WellsPERCD-dimerCT dominated all other strategies except for
CT alone. CT alone resulted in an ICUR of $114, 669 per QALY gained compared to
WellsPERCD-dimerCT.
Cost-effectiveness acceptability curves for each of the five strategies are presented in Figure 24.
When only cost-savings are valued (at a willingness-to-pay (WTP) value of zero for additional
QALYs gained), the preferred strategy was WellsPERCD-dimerCT with a probability of
being the most cost-effective strategy of 30.7%. WellsPERCD-dimerCT had the highest
probability of being the most cost-effective strategy from a WTP value of 0 to approximately
$25,000/QALY gained. For WTP values greater than $25,000/QALY gained up to

111
$100,000/QALY gained, all five strategies have approximately 20% probability of being cost-
effective. This was the case as QALYs gained with each strategies were almost equivalent.
Figure 24. Cost-effectiveness acceptability curves
QALY = quality-adjusted life year; PERC = Pulmonary Embolism Rule-out Criteria; CT = computed tomography
8.4.5 Comparison of results to CADTH’s model
In the summer of 2017 CADTH released a draft report “Optimal Strategies for the Diagnosis of
Acute Pulmonary Embolism: A Health Technology Assessment”. This report considered the
costs and benefits of 120 different strategies for diagnosing pulmonary embolism. In addition to
the tools considered in our report, CADTH also considered Wells 2 tier, Geneva, Gestalt and Leg
Ultra-Sound. The CADTH analysis found that Gestalt->D-dimer->Leg Ultra-Sound->CT scan

112
was the cost-effective option at a threshold of $50,000 per QALY. This differs from the results
of our report that found that Wells->D-dimer->CT was the cost-effective option. Most
importantly we did not include Leg Ultra-Sound as an option in our diagnostic strategies because
no study looking at interventions for the optimal use of CT included Leg Ultra-Sound nor was it
included in the guidelines. Although both our analysis and the CADTH analysis used the same
structural model, some of the model inputs differed (Table 25).
Table 25. Important Differences in Model Inputs
Model Input Our Model CADTH Model
Prevalence of PE 9.25% 15.2%
Sensitivity of CT 84.8% 97.2%
Specificity of CT 93.0% 98.7%
Sensitivity of Wells 36.9% 13.2%
Specificity of Wells 97.8% 97.2%
Cost of CT $725 $580
A sensitivity analysis using the above CADTH inputs was run in our model. Overall costs were
higher and QALYs were lower using the CADTH inputs due to the higher prevalence of PE
(Table 26). However, strategies that use more CT scans resulted in lower costs and higher
QALYs using the CADTH model inputs compared to our reference case. This is due to the
higher diagnostic accuracy of CT, the lower cost of CT, and the higher prevalence of PE.
Overall, this combination of inputs resulted in CT alone being the cost-effective option at
$50,000 per QALY with an ICUR of $43,000 per additional QALY.
Table 26. Model Results with CADTH Inputs
Strategy Cost ($) Incremental
Cost ($)
QALYs Incremental
QALYs
ICUR
($/QALY)
WellsPERCD
-dimerCT
2561 - 12.417 - -
D-dimerCT 2609 48 12.425 0.008 6000
WellsD-
dimerCT (high)
2627 18 12.428 0.003 Extendedly
Dominated
WellsD-
dimerCT
(moderate and
high)
2695 68 12.443 0.015 4,778
CT alone 2867 172 12.447 0.004 43,000

113
8.5 Budget Impact Analysis
8.5.1 Budget Impact Analysis Methods
As previously estimated in the cost-effectiveness section, the number of people who are
suspected of PE was estimated to be 7,000 individuals. This was the target population for the
budget impact analysis. The time horizon for the budget impact analysis was five years, it was
assumed a clinical decision support tool’s lifetime was five years and that one tool was needed
for all of British Columbia; this would be a total cost of $30,000 for the first year of
implementation and $5,000 for annual maintenance. Once a clinical decision support tool was in
place, there is no limit on the capacity of the tool in the number of people that can be assessed
with a Clinical Score. We simulated the total budget impact of each strategy over 5 years
assuming an annual cohort of 7000 cases followed for a maximum of 5 years. For example, in
the year 1 post-implementation, we assume 7000 cases based on the estimated incidence. In year
2 post-implementation, we have 7000 incident cases associated with year 1 costs and 7000
prevalent cases associated with year 2 costs. We continue this pattern to year 5 post-
implementation.
The current scenario in British Columbia was no intervention with a clinical decision support
tool and all patients are diagnosed with PE by CT (CT alone strategy). Projected scenarios
included implementation of either: WellsPERCD-dimerCT or WellsD-dimerCT
(moderate and high). Costs and diagnostic accuracy for Wells’ Score, PERC, D-dimer testing,
and CT were based on values previously utilized in the cost-effectiveness analysis. Similarly,
treatment costs from the cost-effectiveness analysis were incorporated for patients who had PE
(true positives, false negatives) and those who are incorrectly diagnosed with PE (false
positives). However, as patients who were true negative did not receive further treatment, the
costs associated with these patients were only those short-term diagnostic costs of the strategy.
The total annual costs of each of these outcome groups is presented in Table 27. Costs
considered include program costs for the clinical decision support tool (implementation and
annual), diagnostic costs (risk stratification by Wells’ Score, PERC, D-dimer testing, and CT),
and future treatment costs for PE. Costs were based on the number of people presenting to the
emergency department suspected of PE.

114
Table 27. Total annual cost per patient by diagnostic test and disease outcome
Total annual
costs by year
TP FP FN
Year 1 $6,082 $6,052 $1,483
Year 2 $188 $172 $752
Year 3 $187 $172 $589
Year 4 $21 $1 $432
Year 5 $21 $1 $321
TP = true positive; FP = false positive; FN = false negative, True negatives have a $0 total annual cost
The average cost per Wells score is $10.70, per PERC score is $10.70, per D-Dimer is $23.60
and the average cost per CT is $823. Full details of these costs are provided in Table 18.
8.5.2 Budget Impact Analysis Results
The overall results of the budget impact analysis for implementing a clinical decision support
tool (WellsPERCD-dimerCT or WellsD-dimerCT (moderate and high)) in British
Columbia are presented in

115
Table 28. The one-year budget impact of the current scenario of CT only was $11.9 million and
the incremental budget impact of the clinical decision support tools was a cost avoidance of $4.1
million (WellsPERCD-dimerCT) and $2.2 million (WellsD-dimerCT (moderate and
high)). The incremental budget impact over a five-year time horizon was estimated at $11.6 to
$20.9 million in costs avoided for all of British Columbia for WellsD-dimerCT (moderate
and high) and WellsPERCD-dimerCT, respectively (Table 29).

116
Table 28. Budget impact results: 1 year
Costs, $ WellsPERC D-dimerCT
WellsD-dimer CT (moderate and
high)
CT alone
Clinical Decision Support Tool
Implementation 30,000 30,000 0
Annual Maintenance 5,000 5,000 0
Wells’ Score* 74,865 74,865 0
PERC * 47,932 - 0
D-dimer 132,357 105,760 0
CT 2,982,917 4,127,667 5,763,660
Total Diagnostic Costs 3,273,070 4,343,292 5,763,660
Treatment costs
TP 3,173,257 3,319,481 3,338,724
FP 1,173,131 1,851,072 2,691,223
FN 186,262 150,606 145,917
Total Treatment Costs 4,532,649 5,321,169 6,175,864
Total Budget Year 1 7,805,720 9,664,461 11,939.524
1 year cost difference
compared to CT alone -4,133,804 -2,275,063
PERC = Pulmonary Embolism Rule-out Criteria; CT = computed tomography; TP = true positive; FP = false positive; FN = false negative
*Costs of the physician time
117
Table 29. Budget impact results: 5 years
Costs, $ WellsPERC D-dimerCT
WellsD-dimer CT (moderate and
high)
CT alone
Clinical Decision Support Tool
Implementation 30,000 30,000 0
Annual Maintenance 5,000 5,000 0
Wells’ Score* 74,865 74,865 0
PERC * 47,932 - 0
D-dimer 132,357 105,760 0
CT 2,982,917 4,127,667 5,763,660
Total Diagnostic Costs 3,273,070 4,343,292 5,763,660
Treatment costs
Incident cohort 4,532,649 5,321,169 6,175,864
Total Budget Year 1 7,805,720 9,664,461 11,939.524
Clinical Decision Support
Tool: Annual Maintenance
5000 5000 0
Treatment costs
Treatment and diagnostic
costs of incident cohort
7,770,720 9,629,461 11,939.524
Treatment of prevalent cohort 225,497 231,158 253,197
Total Budget Year 2 8,001,217 9,865,619 12,192,720
Clinical Decision Support
Tool: Annual Maintenance
5000 5000
Treatment costs
Treatment and diagnostic
costs of incident cohort
7,770,720 9,629,461 11,939.524
Treatment of prevalent cohort 430,577 445,822 490,448
Total Budget Year 3 8,206,297 10,080,282 12,429,971
Clinical Decision Support
Tool: Annual Maintenance
5000 5000
Treatment costs
Treatment and diagnostic
costs of incident cohort
7,770,720 9,629,461 11,939.524
Treatment of prevalent cohort 270,341 501,350 1,035,310
Total Budget Year 4 8,271,558 10,135,811 12,484,385
Clinical Decision Support
Tool: Annual Maintenance
5000 5000
Treatment costs
Treatment and diagnostic
costs of incident cohort
7,770,720 9,629,461 11,939.524
Treatment of prevalent cohort 324,313 547,787 1,080,921
Total Budget Year 5 8,325,530 10,182,247 12,529,996
Total 5 year costs 40,610,323 49,928,420 61,576,596
5 year cost difference
compared to CT alone
-20,966,273 -11,648,176
PERC = Pulmonary Embolism Rule-out Criteria; CT = computed tomography; TP = true positive; FP = false positive; FN = false negative
*Costs of the physician time

118
8.6 Discussion
Overall, the economic model estimated very small differences in health benefits (QALYs gained)
between interventions for diagnosing PE in British Columbia. Total QALYs gained per
intervention ranged from 12.489 with WellsPERCD-dimerCT to 12.497 with CT alone,
suggesting the largest incremental difference of 0.001 QALYs (or 0.4 quality-adjusted life days)
gained in favour of CT alone. Results were robust to most sensitivity analyses undertaken.
However, the results were sensitive to prevalence of PE among suspected PE, time horizon and
the risk of CTEPH. Total costs per intervention ranged from $1981 with WellsPERCD-
dimerCT to $2558 with CT alone, suggesting costs avoided of $577 with WellsPERCD-
dimerCT compared with CT alone. The deterministic results were slightly different than the
probabilistic results. The deterministic results suggest that WellsD-dimerCT (moderate and
high) may be a cost-effective option, where the probabilistic analysis suggests this strategy is
dominated by WellsPERCD-dimerCT. With respect to yield, interventions improved the
positive yield of CT by 2.8 to 6.9% compared to CT alone (yield of 14.2%). When considering
only costs avoided, WellsPERCD-dimerCT had the highest probability of being cost-
effective compared to all other interventions (30.9%). However, as the WTP value increased and
health benefits are valued greater, all five interventions had approximately 20% probability of
being cost-effective. This is likely due to the very similar QALYs gained with each intervention.
The budget impact analysis suggested that instituting a decision support tool (WellsPERCD-
dimerCT or WellsD-dimerCT (moderate and high) would save $2.2 to 4.1 Million in the
first year. Over five years, $11.6 to 20.9 million in costs avoided for all of British Columbia for
WellsD-dimerCT (moderate and high) and WellsPERCD-dimerCT, respectively.
8.6.1 Limitations
There are some limitations with the economic model. Informal care costs were not taken into
account in the model and some of the costs were from other provinces (mostly Ontario). Costs to
the physician associated with potential legal suits for missing a diagnosis were not included,
although legal concerns are likely to influence use towards more CT examinations. With respect
to the diagnostic accuracy of D-dimer and PERC, the correlation between sensitivity and
specificity values were not preserved in the conduct of the probabilistic sensitivity analysis.
Although the risk of inappropriate anticoagulation treatment for patients who are incorrectly

119
diagnosed with PE was explored, other risks such as risk of radiation or contrast reaction
associated with CT was not explored. Evidence suggests that 1-3% of the population will have a
contrast reaction.193,194
This suggests that the difference in QALYs of DST strategies compared
to the CT alone strategy may be lower.
8.7 Conclusion
A cost-effectiveness analysis and budget impact analysis of interventions incorporating clinical
decision support tools (risk stratification by Wells’ Score, PERC, and/or D-dimer testing
followed by diagnostic imaging with CT) compared with CT alone in diagnosing PE was
conducted from the British Columbia public perspective. Results suggest that all interventions,
particularly, WellsPERCD-dimerCT, were less costly than CT alone; however, it was also
marginally less effective over a lifetime horizon (0.001 QALYs or 0.0016 LY). The budget
impact analysis estimated that the implementation of a clinical decision support tool in British
Columbia would result in costs avoided over a one- and five-year time horizon, with greatest
costs avoided with implementing WellsPERCD-dimerCT.
9 Overall Conclusions Overall, CT has high sensitivity and specificity for diagnosing PE, with sensitivity ranging from
81.7% to 87.5% and specificity ranging from 90.9% to 94.6%. A pooled stratified meta-analysis
suggests that the only intervention type that was significantly effective for increasing CT yield
was clinical decision support tools. Barriers such as time pressures and patient demands, as well
as facilitators such as staff acceptance and buy-in, may change the success of the intervention
and should be considered. Physicians interviewed were unaware of decision support tools for
diagnosing PE that would help increase appropriate use of CT, but felt that such a tool would be
helpful. Results from the cost-utility model suggest that an intervention of WellsPERCD-
dimerCT had the lowest costs with a total of $1981 and effectiveness of 12.489 QALYs.
WellsD-dimerCT resulted in an ICUR of $30,000 per QALY gained compared to the
baseline strategy of WellsPERCD-dimerCT. CT alone had the highest ICUR, of $364,900
per QALY gained compared to WellsD-dimerCT. CT alone resulted in the highest total
QALYs, as CT is more accurate at diagnosing PE than interventions with risk stratification.
However, it is only marginally better than WellsD-dimerCT (moderate and high) with an

120
incremental QALY gain of 0.001 (0.4 quality-adjusted life days) over a lifetime time horizon.
The budget impact analysis suggests that instituting a decision support tool with
WellsPERCD-dimerCT may result in substantial cost avoidance for the healthcare
system.

121
10 References 1. National Heart LaBI. What is Pulmonary Embolism? . Health Information for the Public:
Health Topics: Pulmonary Embolism 2011; https://www.nhlbi.nih.gov/health/health-
topics/topics/pe. Accessed Feb 2, 2017.
2. BT T, CA H. Overview of Acute Pulmonary Embolism. 2005. http://www.uptodate.com.
(subscription required). Accessed Feb 3 2017.
3. Tapson VF. Diagnosis, prognosis and therapeutic management of acute pulmonary
embolism. Hosp Pract (1995). 2016;44(3):164-172.
4. Goldhaber SZ, Visani L, De Rosa M. Acute pulmonary embolism: clinical outcomes in
the International Cooperative Pulmonary Embolism Registry (ICOPER). Lancet.
1999;353(9162):1386-1389.
5. Belohlavek J, Dytrych V, Linhart A. Pulmonary embolism, part I: Epidemiology, risk
factors and risk stratification, pathophysiology, clinical presentation, diagnosis and
nonthrombotic pulmonary embolism. Exp Clin Cardiol. 2013;18(2):129-138.
6. Bajc M, Neilly JB, Miniati M, et al. EANM guidelines for ventilation/perfusion
scintigraphy : Part 1. Pulmonary imaging with ventilation/perfusion single photon
emission tomography. Eur J Nucl Med Mol Imaging. 2009;36(8):1356-1370.
7. Miniati M, Prediletto R, Formichi B, et al. Accuracy of clinical assessment in the
diagnosis of pulmonary embolism. Am J Respir Crit Care Med. 1999;159(3):864-871.
8. Advocates CMT. Pulmonary Embolism 2017; http://www.clotsmatter.ca/learning/blood-
clots/pulmonary-embolism/. Accessed Feb 17 2017.
9. Schellhaass A, Walther A, Konstantinides S, Bottiger BW. The diagnosis and treatment
of acute pulmonary embolism. Dtsch Arztebl Int. 2010;107(34-35):589-595.
10. Anderson FA, Jr., Wheeler HB, Goldberg RJ, Hosmer DW, Forcier A. The prevalence of
risk factors for venous thromboembolism among hospital patients. Arch Intern Med.
1992;152(8):1660-1664.
11. Wells PS, Anderson DR, Rodger M, et al. Excluding pulmonary embolism at the bedside
without diagnostic imaging: management of patients with suspected pulmonary embolism
presenting to the emergency department by using a simple clinical model and d-dimer.
Ann Intern Med. 2001;135(2):98-107.
12. Guidelines on diagnosis and management of acute pulmonary embolism. Task Force on
Pulmonary Embolism, European Society of Cardiology. Eur Heart J. 2000;21(16):1301-
1336.
13. Pengo V, Lensing AW, Prins MH, et al. Incidence of chronic thromboembolic pulmonary
hypertension after pulmonary embolism. N Engl J Med. 2004;350(22):2257-2264.
14. (Australia) VMC. Pulmonary Embolism (PE) Diseases 2003;
http://www.myvmc.com/diseases/pulmonary-embolism-pe/. Accessed Feb 2, 2017.
15. Meyer G, Planquette B, Sanchez O. Long-term outcome of pulmonary embolism. Curr
Opin Hematol. 2008;15(5):499-503.
16. Agnelli G, Prandoni P, Becattini C, et al. Extended oral anticoagulant therapy after a first
episode of pulmonary embolism. Ann Intern Med. 2003;139(1):19-25.
17. Kearon C, Gent M, Hirsh J, et al. A comparison of three months of anticoagulation with
extended anticoagulation for a first episode of idiopathic venous thromboembolism. N
Engl J Med. 1999;340(12):901-907.

122
18. Kearon C, Ginsberg JS, Kovacs MJ, et al. Comparison of low-intensity warfarin therapy
with conventional-intensity warfarin therapy for long-term prevention of recurrent
venous thromboembolism. N Engl J Med. 2003;349(7):631-639.
19. Schulman S, Rhedin AS, Lindmarker P, et al. A comparison of six weeks with six months
of oral anticoagulant therapy after a first episode of venous thromboembolism. Duration
of Anticoagulation Trial Study Group. N Engl J Med. 1995;332(25):1661-1665.
20. van Gogh I, Buller HR, Cohen AT, et al. Extended prophylaxis of venous
thromboembolism with idraparinux. N Engl J Med. 2007;357(11):1105-1112.
21. AHD R, D H, D W. Risk factors and clinical significance of residual perfusion defects
after symptomatic pulmonary embolism. XXIst Congress of the International Society on
Thrombosis and Haemostasis; 2007; Geneva.
22. Wartski M, Collignon MA. Incomplete recovery of lung perfusion after 3 months in
patients with acute pulmonary embolism treated with antithrombotic agents. THESEE
Study Group. Tinzaparin ou Heparin Standard: Evaluation dans l'Embolie Pulmonaire
Study. J Nucl Med. 2000;41(6):1043-1048.
23. Sorensen HT, Mellemkjaer L, Steffensen FH, Olsen JH, Nielsen GL. The risk of a
diagnosis of cancer after primary deep venous thrombosis or pulmonary embolism. N
Engl J Med. 1998;338(17):1169-1173.
24. Sorensen HT, Horvath-Puho E, Pedersen L, Baron JA, Prandoni P. Venous
thromboembolism and subsequent hospitalisation due to acute arterial cardiovascular
events: a 20-year cohort study. Lancet. 2007;370(9601):1773-1779.
25. Becattini C, Agnelli G, Pesavento R, et al. Incidence of chronic thromboembolic
pulmonary hypertension after a first episode of pulmonary embolism. Chest.
2006;130(1):172-175.
26. Krans B, Deborah W. Pulmonary Embolism. 2016;
http://www.healthline.com/health/pulmonary-embolus#Overview1. Accessed Feb 3 2017.
27. Wedro B, Stoppler MC, Schiffman G. Pulmonary Embolism (Blood Clot in the Lung)
Pulmonary Embolism Index 2015;
http://www.medicinenet.com/pulmonary_embolism/page4.htm. Accessed Feb 3, 2017.
28. Kearon C. Diagnosis of pulmonary embolism. Cmaj. 2003;168(2):183-194.
29. Douma RA, Mos IC, Erkens PM, et al. Performance of 4 clinical decision rules in the
diagnostic management of acute pulmonary embolism: a prospective cohort study. Ann
Intern Med. 2011;154(11):709-718.
30. Wells PS, Anderson DR, Rodger M, et al. Derivation of a simple clinical model to
categorize patients probability of pulmonary embolism: increasing the models utility with
the SimpliRED D-dimer. Thromb Haemost. 2000;83(3):416-420.
31. Wells PS, Anderson DR, Rodger M, et al. Derivation of a simple clinical model to
categorize patients probability of pulmonary embolism-increasing the models utility with
the SimpliRED D-dimer. THROMBOSIS AND HAEMOSTASIS-STUTTGART-.
2000;83(3):416-420.
32. Wells PS, Anderson DR, Rodger M, et al. Excluding pulmonary embolism at the bedside
without diagnostic imaging: management of patients with suspected pulmonary embolism
presenting to the emergency department by using a simple clinical model and d-dimer.
Annals of internal medicine 2001;135(2):98-107.

123
33. Wolf SJ, McCubbin TR, Feldhaus KM, Faragher JP, Adcock DM. Prospective validation
of Wells Criteria in the evaluation of patients with suspected pulmonary embolism. Ann
Emerg Med. 2004;44(5):503-510.
34. Le Gal G, Righini M, Roy PM, et al. Prediction of pulmonary embolism in the
emergency department: the revised Geneva score. Ann Intern Med. 2006;144(3):165-171.
35. Kline JA, Mitchell AM, Kabrhel C, Richman PB, Courtney DM. Clinical criteria to
prevent unnecessary diagnostic testing in emergency department patients with suspected
pulmonary embolism. J Thromb Haemost. 2004;2(8):1247-1255.
36. Burkill GJ, Bell JR, Padley SP. Survey on the use of pulmonary scintigraphy, spiral CT
and conventional pulmonary angiography for suspected pulmonary embolism in the
British Isles. Clin Radiol. 1999;54(12):807-810.
37. Kearon C. Diagnosis of pulmonary embolism. CMAJ. 2003;168(2):183-194.
38. Pai RKr, Schaff Hr. Angiogram Heart Disease 2015; http://www.webmd.com/heart-
disease/angiogram#1. Accessed March 7 2017.
39. Medicine JH. Pulmonary Angiogram Health Library
http://www.hopkinsmedicine.org/healthlibrary/test_procedures/pulmonary/pulmonary_an
giogram_92,P07758/. Accessed March 7, 2017.
40. Torbicki A, Perrier A, Konstantinides S, et al. Guidelines on the diagnosis and
management of acute pulmonary embolism: the Task Force for the Diagnosis and
Management of Acute Pulmonary Embolism of the European Society of Cardiology
(ESC). Eur Heart J. 2008;29(18):2276-2315.
41. Miller GA, Sutton GC, Kerr IH, Gibson RV, Honey M. Comparison of streptokinase and
heparin in treatment of isolated acute massive pulmonary embolism. Br Med J.
1971;2(5763):681-684.
42. Wolfe MW, Skibo LK, Goldhaber SZ. Pulmonary embolic disease: diagnosis,
pathophysiologic aspects, and treatment with thrombolytic therapy. Curr Probl Cardiol.
1993;18(10):587-633.
43. A P, Bounameaux H, AJ P. Acute pulmonary embolism: diagnosis Pulmonary
Circulation. 2004:414-428.
44. Szigeti RG. D-Dimer Laboratory Medicine 2014 Accessed Feb 10 2017.
45. Staff H, Thompson Gr, Ginsberg JSr. D-Dimer Test DVT 2015. Accessed March 7 2017.
46. Wells PS, Ginsberg JS, Anderson DR, et al. Use of a clinical model for safe management
of patients with suspected pulmonary embolism. Ann Intern Med. 1998;129(12):997-
1005.
47. Investigators P. Value of the ventilation/perfusion scan in acute pulmonary embolism.
Results of the prospective investigation of pulmonary embolism diagnosis (PIOPED).
JAMA. 1990;263(20):2753-2759.
48. Perrier A, Bounameaux H, Morabia A, et al. Diagnosis of pulmonary embolism by a
decision analysis-based strategy including clinical probability, D-dimer levels, and
ultrasonography: a management study. Arch Intern Med. 1996;156(5):531-536.
49. Perrier A, Desmarais S, Miron MJ, et al. Non-invasive diagnosis of venous
thromboembolism in outpatients. Lancet. 1999;353(9148):190-195.
50. Konstantinides SV. 2014 ESC Guidelines on the diagnosis and management of acute
pulmonary embolism. Eur Heart J. 2014;35(45):3145-3146.
51. Hadjiliadis D, Zieve D. Pulmonary ventilation/perfusion scan. Medical Encyclopedia
2014 https://medlineplus.gov/ency/article/003828.htm. Accessed March 8 2017.

124
52. Kwon JW, Park HY, Kim YJ, Moon SH, Kang HY. Cost-effectiveness of Pharmaceutical
Interventions to Prevent Osteoporotic Fractures in Postmenopausal Women with
Osteopenia. J. 2016;23(2):63-77.
53. van Beek EJ, Kuyer PM, Schenk BE, Brandjes DP, ten Cate JW, Buller HR. A normal
perfusion lung scan in patients with clinically suspected pulmonary embolism. Frequency
and clinical validity. Chest. 1995;108(1):170-173.
54. Hull RD, Hirsh J, Carter CJ, et al. Diagnostic value of ventilation-perfusion lung
scanning in patients with suspected pulmonary embolism. Chest. 1985;88(6):819-828.
55. Mortensen J, Gutte H. SPECT/CT and pulmonary embolism. Eur J Nucl Med Mol
Imaging. 2014;41 Suppl 1:S81-90.
56. Sostman HD, Miniati M, Gottschalk A, Matta F, Stein PD, Pistolesi M. Sensitivity and
specificity of perfusion scintigraphy combined with chest radiography for acute
pulmonary embolism in PIOPED II. J Nucl Med. 2008;49(11):1741-1748.
57. Kruip MJ, Leclercq MG, van der Heul C, Prins MH, Buller HR. Diagnostic strategies for
excluding pulmonary embolism in clinical outcome studies. A systematic review. Ann
Intern Med. 2003;138(12):941-951.
58. Ten Wolde M, Hagen PJ, Macgillavry MR, et al. Non-invasive diagnostic work-up of
patients with clinically suspected pulmonary embolism; results of a management study. J
Thromb Haemost. 2004;2(7):1110-1117.
59. Kan Y, Yuan L, Meeks JK, Li C, Liu W, Yang J. The accuracy of V/Q SPECT in the
diagnosis of pulmonary embolism: A meta-analysis. Acta Radiol. 2015;56(5):565-572.
60. Staff MC. Pulmonary Embolism: Diagnosis. Feb 23. Available at:
http://www.mayoclinic.org/diseases-conditions/pulmonary-embolism/diagnosis-
treatment/diagnosis/dxc-20234752, 2017.
61. van Beek EJ, Wild JM, Fink C, Moody AR, Kauczor HU, Oudkerk M. MRI for the
diagnosis of pulmonary embolism. J Magn Reson Imaging. 2003;18(6):627-640.
62. Hatabu H, Gefter WB, Axel L, et al. MR imaging with spatial modulation of
magnetization in the evaluation of chronic central pulmonary thromboemboli. Radiology.
1994;190(3):791-796.
63. Hatabu H, Gefter WB, Kressel HY, Axel L, Lenkinski RE. Pulmonary vasculature: high-
resolution MR imaging. Work in progress. Radiology. 1989;171(2):391-395.
64. MacFall JR, Sostman HD, Foo TK. Thick-section, single breath-hold magnetic resonance
pulmonary angiography. Invest Radiol. 1992;27(4):318-322.
65. Rubin GD, Herfkens RJ, Pelc NJ, et al. Single breath-hold pulmonary magnetic
resonance angiography. Optimization and comparison of three imaging strategies. Invest
Radiol. 1994;29(8):766-792.
66. Meaney JF, Weg JG, Chenevert TL, Stafford-Johnson D, Hamilton BH, Prince MR.
Diagnosis of pulmonary embolism with magnetic resonance angiography. N Engl J Med.
1997;336(20):1422-1427.
67. Revel MP, Sanchez O, Couchon S, et al. Diagnostic accuracy of magnetic resonance
imaging for an acute pulmonary embolism: results of the 'IRM-EP' study. J Thromb
Haemost. 2012;10(5):743-750.
68. Prokop M. [Radiation dose and image quality in computed tomography]. Rofo.
2002;174(5):631-636.

125
69. Winer-Muram HT, Boone JM, Brown HL, Jennings SG, Mabie WC, Lombardo GT.
Pulmonary embolism in pregnant patients: fetal radiation dose with helical CT.
Radiology. 2002;224(2):487-492.
70. Zhou M, Hu Y, Long X, et al. Diagnostic performance of magnetic resonance imaging
for acute pulmonary embolism: A systematic review and meta-analysis. Journal of
Thrombosis and Haemostasis. 2015;13(9):1623-1634.
71. Gargani L, Volpicelli G. How I do it: lung ultrasound. Cardiovasc Ultrasound.
2014;12:25.
72. Reissig A, Kroegel C. Transthoracic ultrasound of lung and pleura in the diagnosis of
pulmonary embolism: a novel non-invasive bedside approach. Respiration.
2003;70(5):441-452.
73. Bouhemad B, Zhang M, Lu Q, Rouby JJ. Clinical review: Bedside lung ultrasound in
critical care practice. Crit Care. 2007;11(1):205.
74. Squizzato A, Galli L, Gerdes VE. Point-of-care ultrasound in the diagnosis of pulmonary
embolism. Crit Ultrasound J. 2015;7:7.
75. Squizzato A, Rancan E, Dentali F, et al. Diagnostic accuracy of lung ultrasound for
pulmonary embolism: a systematic review and meta-analysis. J Thromb Haemost.
2013;11(7):1269-1278.
76. Brenner DJ, Hall EJ. Computed tomography--an increasing source of radiation exposure.
N Engl J Med. 2007;357(22):2277-2284.
77. Dictionary M-W. Medical Definition of Computed Tomography. Accessed Feb 15, 2016.
78. Mahesh M. Fundamentals of Single and Multiple Row Detector Computed Tomography
Baltimore, MD. USA The Johns Hopkins University
79. Goldman LW. Principles of CT: multislice CT. J Nucl Med Technol. 2008;36(2):57-68;
quiz 75-56.
80. MedicineNet. Medical Definition of Multidetector Computed Tomography 2016;
http://www.medicinenet.com/script/main/art.asp?articlekey=40639. Accessed Feb 9
2017.
81. Dogan H, de Roos A, Geleijins J, Huisman MV, Kroft LJ. The role of computed
tomography in the diagnosis of acute and chronic pulmonary embolism. Diagn Interv
Radiol. 2015;21(4):307-316.
82. Community DSC. Dual Source CT Imaging http://www.dsct.com/index.php/the-
technology/introduction/dual-source-ct-imaging/. Accessed Feb 14, 2017.
83. Silverman PM, Cooper CJ, Weltman DI, Zeman RK. Helical CT: practical considerations
and potential pitfalls. Radiographics. 1995;15(1):25-36.
84. MedicineNet. Medical Definition of Helical CAT scan Medterms Medical Dictionary
Last Editorial Review: 2016;
http://www.medicinenet.com/script/main/art.asp?articlekey=9626. Accessed Feb 14
2017.
85. Goodman PC. Spiral CT for pulmonary embolism. Semin Respir Crit Care Med.
2000;21(6):503-510.
86. Schoepf UJ, Goldhaber SZ, Costello P. Spiral computed tomography for acute pulmonary
embolism. Circulation. 2004;109(18):2160-2167.
87. Stewart Crb. SPECT (single photon emission computed tomography) scan. 2016.
Accessed Feb 15, 2017.

126
88. Medicine AAoPi. CT scan parameters: Translation of terms for different manufacturers
Alexandria, VA, USA 2011.
89. A Brief History of CT 2013 http://www.impactscan.org/CThistory.htm. Accessed Feb 15
2017.
90. Goldman LW. Principles of CT and CT technology. J Nucl Med Technol.
2007;35(3):115-128; quiz 129-130.
91. Schembri GP, Miller AE, Smart R. Radiation dosimetry and safety issues in the
investigation of pulmonary embolism. Semin Nucl Med. 2010;40(6):442-454.
92. Parker MS, Hui FK, Camacho MA, Chung JK, Broga DW, Sethi NN. Female breast
radiation exposure during CT pulmonary angiography. AJR Am J Roentgenol.
2005;185(5):1228-1233.
93. The 2007 Recommendations of the International Commission on Radiological Protection.
ICRP publication 103. Ann ICRP. 2007;37(2-4):1-332.
94. Mayo JR. Radiation dose issues in longitudinal studies involving computed tomography.
Proc Am Thorac Soc. 2008;5(9):934-939.
95. Schoepf UJ, Costello P. CT Angiography for Diagnosis of Pulmonary Embolism: State of
the Art. Radiology. 2004;230(2):329-337.
96. Elias I, Oyaguez I, Alvarez-Sala LA, et al. Cost-effectiveness analysis of apixaban
compared to low-molecularweight heparins and vitamin k antagonists for treatment and
secondary prevention of venous thromboembolism. Farm. 2016;40(3):187-208.
97. Canada T. Pulmonary Embolism (PE): Treatment. 2016;
http://thrombosiscanada.ca/?page_id=18#.
98. Thaler J, Pabinger I, Ay C. Anticoagulant Treatment of Deep Vein Thrombosis and
Pulmonary Embolism: The Present State of the Art. Front Cardiovasc Med. 2015;2:30.
99. Klarenbach S, Lee K, Boucher M, So H, Manns B, Tonelli M. Direct Oral
Anticoagulants for the Treatment of Venous Thromboembolic Events: Economic
Evaluation. Ottawa (ON)2016.
100. Canada T. Pulmonary Embolism: Diagnosis and Management Canada: Thrombosis
Canada;2013.
101. Canada T. Pulmonary Embolism (PE): Diagnosis. 2016;
http://thrombosiscanada.ca/?page_id=18#.
102. Haider; MOVLJDE. Impact of Implementation of the Simplified Wells Criteria on
Referrals for Pulmonary Embolism. St. Joseph's Healthcare; 2014.
103. Higgins JP, Altman DG, Gøtzsche PC, et al. The Cochrane Collaboration’s tool for
assessing risk of bias in randomised trials. Bmj. 2011;343:d5928.
104. Whiting PF, Rutjes AW, Westwood ME, et al. QUADAS-2: a revised tool for the quality
assessment of diagnostic accuracy studies. Annals of internal medicine. 2011;155(8):529-
536.
105. Reitsma JB, Glas AS, Rutjes AW, Scholten RJ, Bossuyt PM, Zwinderman AH. Bivariate
analysis of sensitivity and specificity produces informative summary measures in
diagnostic reviews. Journal of clinical epidemiology. 2005;58(10):982-990.
106. Doebler P, Holling H. Meta-analysis of diagnostic accuracy with mada. Reterieved at:
https://cran. rproject. org/web/packages/mada/vignettes/mada. pdf. 2015.
107. Lu GM, Luo S, Meinel FG, et al. High-pitch computed tomography pulmonary
angiography with iterative reconstruction at 80 kVp and 20 mL contrast agent volume.
European radiology. 2014;24(12):3260-3268.

127
108. Wang F, Fang W, Lv B, et al. Comparison of lung scintigraphy with multi-slice spiral
computed tomography in the diagnosis of pulmonary embolism. Clinical nuclear
medicine. 2009;34(7):424-427.
109. He J, Wang F, Dai H-j, et al. Chinese multi-center study of lung scintigraphy and CT
pulmonary angiography for the diagnosis of pulmonary embolism. The international
journal of cardiovascular imaging. 2012;28(7):1799-1805.
110. Winer-Muram HT, Rydberg J, Johnson MS, et al. Suspected Acute Pulmonary
Embolism: Evaluation with Multi–Detector Row CT versus Digital Subtraction
Pulmonary Arteriography 1. Radiology. 2004;233(3):806-815.
111. Ohno Y, Higashino T, Takenaka D, et al. MR angiography with sensitivity encoding
(SENSE) for suspected pulmonary embolism: comparison with MDCT and ventilation–
perfusion scintigraphy. American Journal of Roentgenology. 2004;183(1):91-98.
112. Qanadli SD, Hajjam ME, Mesurolle B, et al. Pulmonary Embolism Detection:
Prospective Evaluation of Dual-Section Helical CT versus Selective Pulmonary
Arteriography in 157 Patients 1. Radiology. 2000;217(2):447-455.
113. Blachere H, Latrabe V, Montaudon M, et al. Pulmonary embolism revealed on helical CT
angiography: comparison with ventilation—perfusion radionuclide lung scanning.
American Journal of Roentgenology. 2000;174(4):1041-1047.
114. Reinartz P, Wildberger JE, Schaefer W, Nowak B, Mahnken AH, Buell U. Tomographic
imaging in the diagnosis of pulmonary embolism: a comparison between V/Q lung
scintigraphy in SPECT technique and multislice spiral CT. Journal of Nuclear Medicine.
2004;45(9):1501-1508.
115. Reissig A, Heyne J-P, Kroegel C. Sonography of lung and pleura in pulmonary
embolism: sonomorphologic characterization and comparison with spiral CT scanning.
CHEST Journal. 2001;120(6):1977-1983.
116. Okada M, Kunihiro Y, Nakashima Y, et al. Added value of lung perfused blood volume
images using dual-energy CT for assessment of acute pulmonary embolism. European
journal of radiology. 2015;84(1):172-177.
117. Megyeri B, Christe A, Schindera ST, et al. Accuracy of computed tomography
angiography in the detection of pulmonary embolism in patients with high body weight.
European journal of internal medicine. 2014;25(8):724-730.
118. Coche E, Verschuren F, Keyeux A, et al. Diagnosis of Acute Pulmonary Embolism in
Outpatients: Comparison of Thin-Collimation Multi–Detector Row Spiral CT and Planar
Ventilation-Perfusion Scintigraphy 1. Radiology. 2003;229(3):757-765.
119. Nilsson T, Söderberg M, Lundqvist G, et al. A comparison of spiral computed
tomography and latex agglutination D-dimer assay in acute pulmonary embolism using
pulmonary arteriography as gold standard. Scandinavian Cardiovascular Journal.
2002;36(6):373-377.
120. Stein PD, Fowler SE, Goodman LR, et al. Multidetector computed tomography for acute
pulmonary embolism. New England Journal of Medicine. 2006;354(22):2317-2327.
121. Downs SH, Black N. The feasibility of creating a checklist for the assessment of the
methodological quality both of randomised and non-randomised studies of health care
interventions. Journal of Epidemiology and Community Health. 1998;52(6):377-384.
122. Geyer BC, Xu M, Kabrhel C. Patient preferences for testing for pulmonary embolism in
the ED using a shared decision-making model. Am J Emerg Med. 2014;32(3):233-236.

128
123. Viechtbauer W. Conducting meta-analyses in R with the metafor package. J Stat Softw.
2010;36(3):1-48.
124. Raja AS, Ip IK, Dunne RM, Schuur JD, Mills AM, Khorasani R. Effects of Performance
feedback reports on adherence to evidence- based guidelines in use of CT for evaluation
of pulmonary embolism in the emergency department: A randomized trial. American
Journal of Roentgenology. 2015;205(5):936-940.
125. Geeting GK, Beck M, Bruno MA, et al. Mandatory assignment of modified wells score
before CT angiography for pulmonary embolism fails to improve utilization or
percentage of positive cases. American Journal of Roentgenology. 2016;207(2):442-449.
126. Booker MT, Johnson JO. Optimizing CT Pulmonary Angiogram Utilization in a
Community Emergency Department: A Pre- and Postintervention Study. J.
2017;14(1):65-71.
127. Dunne RM, Ip IK, Abbett S, et al. Effect of evidence-based clinical decision support on
the use and yield of CT pulmonary angiographic imaging in hospitalized patients.
Radiology. 2015;276(1):167-174.
128. Agarwal A, Persaud J, Grabinski R, Rabinowitz D, Bremner A, Mendelson R. Pulmonary
embolism: Are we there yet? Journal of Medical Imaging and Radiation Oncology.
2012;56(3):270-281.
129. Jimenez D, Resano S, Otero R, et al. Computerised clinical decision support for
suspected PE. Thorax. 2015;70(9):909-911.
130. Prevedello LM, Raja AS, Ip IK, Sodickson A, Khorasani R. Does clinical decision
support reduce unwarranted variation in Yield of CT pulmonary angiogram? American
Journal of Medicine. 2013;126(11):975-981.
131. Raja AS, Ip IK, Prevedello LM, et al. Effect of computerized clinical decision support on
the use and yield of CT pulmonary angiography in the emergency department. Radiology.
2012;262(2):468-474.
132. Hardin LV, Nguyen SA, Ravenel JG. Is E-mail Communication Effective in Changing
Ordering Patterns in the Emergency Department?. A Case Study of Computed
Tomography for Pulmonary Embolus. Acad Radiol. 2008;15(4):433-437.
133. Kanaan Y, Knoepp UD, Kelly AM. The influence of education on appropriateness rates
for CT pulmonary angiography in emergency department patients. Acad Radiol.
2013;20(9):1107-1114.
134. Stein EG, Haramati LB, Chamarthy M, Sprayregen S, Davitt MM, Freeman LM. Success
of a safe and simple algorithm to reduce use of CT pulmonary angiography in the
emergency department. American Journal of Roentgenology. 2010;194(2):392-397.
135. Ong CW, Malipatil V, Lavercombe M, et al. Implementation of a clinical prediction tool
for pulmonary embolism diagnosis in a tertiary teaching hospital reduces the number of
computed tomography pulmonary angiograms performed. Intern Med J. 2013;43(2):169-
174.
136. Murthy C, Davis R, Koegelenberg CF, Irusen EM, Pitcher RD. The impact of an
electronic clinical decision support for pulmonary embolism imaging on the efficiency of
computed tomography pulmonary angiography utilisation in a resource-limited setting.
Samj, S. 2016;106(1):62-64.
137. Walen S, de Boer E, Edens MA, van der Worp CA, Boomsma MF, van den Berg JW.
Mandatory adherence to diagnostic protocol increases the yield of CTPA for pulmonary
embolism. Insights imaging. 2016;7(5):727-734.

129
138. Raja AS, Greenberg JO, Qaseem A, Denberg TD, Fitterman N, Schuur JD. Evaluation of
patients with suspected acute pulmonary embolism: Best practice advice from the
Clinical Guidelines Committee of the American College of Physicians. Ann Intern Med.
2015;163(9):701-711.
139. Raymakers AJ, Mayo J, Marra CA, FitzGerald M. Diagnostic strategies incorporating
computed tomography angiography for pulmonary embolism: a systematic review of
cost-effectiveness analyses. J Thorac Imaging. 2014;29(4):209-216.
140. Lorenzetti DL, Topfer LA, Dennett L, Clement F. Value of databases other than medline
for rapid health technology assessments. Int J Technol Assess Health Care.
2014;30(2):173-178.
141. Glanville J FK, Yellowlees A, Kaunelis D, Mensinkai S. . Development and Testing of
Search Filters to Identify Economic Evaluations in MEDLINE and EMBASE. . Ottawa:
Canadian Agency for Drugs and Technologies in Health;2009.
142. Ward MJ, Sodickson A, Diercks DB, Raja AS. Cost-effectiveness of lower extremity
compression ultrasound in emergency department patients with a high risk of
hemodynamically stable pulmonary embolism. Acad Emerg Med. 2011;18(1):22-31.
143. Duriseti RS, Brandeau ML. Cost-effectiveness of strategies for diagnosing pulmonary
embolism among emergency department patients presenting with undifferentiated
symptoms. Ann Emerg Med. 2010;56(4):321-332 e310.
144. Duriseti RS, Shachter RD, Brandeau ML. Value of quantitative D-dimer assays in
identifying pulmonary embolism: implications from a sequential decision model. Acad
Emerg Med. 2006;13(7):755-766.
145. Doyle NM, Ramirez MM, Mastrobattista JM, Monga M, Wagner LK, Gardner MO.
Diagnosis of pulmonary embolism: a cost-effectiveness analysis. Am J Obstet Gynecol.
2004;191(3):1019-1023.
146. Righini M, Nendaz M, Le Gal G, Bounameaux H, Perrier A. Influence of age on the cost-
effectiveness of diagnostic strategies for suspected pulmonary embolism. J Thromb
Haemost. 2007;5(9):1869-1877.
147. Perrier A, Nendaz MR, Sarasin FP, Howarth N, Bounameaux H. Cost-effectiveness
analysis of diagnostic strategies for suspected pulmonary embolism including helical
computed tomography. Am J Respir Crit Care Med. 2003;167(1):39-44.
148. van Erkel AR, van Rossum AB, Bloem JL, Kievit J, Pattynama PM. Spiral CT
angiography for suspected pulmonary embolism: a cost-effectiveness analysis.
Radiology. 1996;201(1):29-36.
149. van Erkel AR, Pattynama PM. Cost-effective diagnostic algorithms in pulmonary
embolism: an updated analysis. Acad Radiol. 1998;5 Suppl 2:S321-327.
150. Paterson DI, Schwartzman K. Strategies incorporating spiral CT for the diagnosis of
acute pulmonary embolism: a cost-effectiveness analysis. Chest. 2001;119(6):1791-1800.
151. Lee JA, Zierler BK, Liu CF, Chapko MK. Cost-effective diagnostic strategies in patients
with a high, intermediate, or low clinical probability of pulmonary embolism. Vasc
Endovascular Surg. 2011;45(2):113-121.
152. Larcos G, Chi KK, Shiell A, Berry G. Suspected acute pulmonary emboli: cost-
effectiveness of chest helical computed tomography versus a standard diagnostic
algorithm incorporating ventilation-perfusion scintigraphy. Aust N Z J Med.
2000;30(2):195-201.

130
153. van Erkel AR, van den Hout WB, Pattynama PM. International differences in health care
costs in Europe and the United States: Do these affect the cost-effectiveness of diagnostic
strategies for pulmonary embolism? Eur Radiol. 1999;9(9):1926-1931.
154. Elias A, Molinier L, Bauvin E, Elias M, Duru G, Colin C. Integrating complete lower
limb venous ultrasound into diagnostic strategies for pulmonary embolism: a cost-
effectiveness analysis. Thromb Haemost. 2004;91(1):205-207.
155. Wells PS, Anderson DR, Rodger M, et al. Excluding pulmonary embolism at the bedside
without diagnostic imaging: management of patients with suspected pulmonary embolism
presenting to the emergency department by using a simple clinical model and d-dimer.
Ann Intern Med. 2001;135(2):98-107.
156. CADTH. Update to Guidelines for the Economic Evaluation of Health Technologies:
Canada. 2016 Oct; https://www.cadth.ca/update-guidelines-economic-evaluation-health-
technologies-canada.
157. CADTH. Guidelines for the economic evaluation of health technologies: Canada 2006
Mar.
158. Huisman MV, Klok FA. Diagnostic management of clinically suspected acute pulmonary
embolism. J Thromb Haemost. 2009;7 Suppl 1:312-317.
159. Ageno W, Squizzato A, Wells PS, Buller HR, Johnson G. The diagnosis of symptomatic
recurrent pulmonary embolism and deep vein thrombosis: guidance from the SSC of the
ISTH. J Thromb Haemost. 2013;11(8):1597-1602.
160. Eikelboom JW, Wallentin L, Connolly SJ, et al. Risk of bleeding with 2 doses of
dabigatran compared with warfarin in older and younger patients with atrial fibrillation:
an analysis of the randomized evaluation of long-term anticoagulant therapy (RE-LY)
trial. Circulation. 2011;123(21):2363-2372.
161. Kaatz S, Ahmad D, Spyropoulos AC, Schulman S, Subcommittee on Control of A.
Definition of clinically relevant non-major bleeding in studies of anticoagulants in atrial
fibrillation and venous thromboembolic disease in non-surgical patients: communication
from the SSC of the ISTH. J Thromb Haemost. 2015;13(11):2119-2126.
162. Jenkins D, Mayer E, Screaton N, Madani M. State-of-the-art chronic thromboembolic
pulmonary hypertension diagnosis and management. Eur Respir Rev. 2012;21(123):32-
39.
163. Brown MD, Rowe BH, Reeves MJ, Bermingham JM, Goldhaber SZ. The accuracy of the
enzyme-linked immunosorbent assay D-dimer test in the diagnosis of pulmonary
embolism: a meta-analysis. Ann Emerg Med. 2002;40(2):133-144.
164. Singh B, Parsaik AK, Agarwal D, Surana A, Mascarenhas SS, Chandra S. Diagnostic
accuracy of pulmonary embolism rule-out criteria: a systematic review and meta-
analysis. Ann Emerg Med. 2012;59(6):517-520 e511-514.
165. Quinlan DJ, McQuillan A, Eikelboom JW. Low-molecular-weight heparin compared
with intravenous unfractionated heparin for treatment of pulmonary embolism: a meta-
analysis of randomized, controlled trials. Ann Intern Med. 2004;140(3):175-183.
166. Barritt DW, Jordan SC. Anticoagulant drugs in the treatment of pulmonary embolism. A
controlled trial. Lancet. 1960;1(7138):1309-1312.
167. Aujesky D, Obrosky DS, Stone RA, et al. Derivation and validation of a prognostic
model for pulmonary embolism. Am J Respir Crit Care Med. 2005;172(8):1041-1046.
168. Stein PD, Matta F, Alrifai A, Rahman A. Trends in case fatality rate in pulmonary
embolism according to stability and treatment. Thromb Res. 2012;130(6):841-846.

131
169. Wells G KS, Elliott J, Carrier M, Hsieh S, Chen L, et al. . Direct oral anticoagulants for
the treatment
of venous thromboembolic events: a systematic review and network meta-analysis. Ottawa 2016
Jan.
170. Schulman S, Lindmarker P, Holmstrom M, et al. Post-thrombotic syndrome, recurrence,
and death 10 years after the first episode of venous thromboembolism treated with
warfarin for 6 weeks or 6 months. J Thromb Haemost. 2006;4(4):734-742.
171. Hogg K, Kimpton M, Carrier M, Coyle D, Forgie M, Wells P. Estimating quality of life
in acute venous thrombosis. JAMA Intern Med. 2013;173(12):1067-1072.
172. Johnson JA, Pickard AS. Comparison of the EQ-5D and SF-12 health surveys in a
general population survey in Alberta, Canada. Med Care. 2000;38(1):115-121.
173. Rivero-Arias O, Ouellet M, Gray A, Wolstenholme J, Rothwell PM, Luengo-Fernandez
R. Mapping the modified Rankin scale (mRS) measurement into the generic EuroQol
(EQ-5D) health outcome. Med Decis Making. 2010;30(3):341-354.
174. Roman A, Barbera JA, Castillo MJ, Munoz R, Escribano P. Health-related quality of life
in a national cohort of patients with pulmonary arterial hypertension or chronic
thromboembolic pulmonary hypertension. Arch Bronconeumol. 2013;49(5):181-188.
175. Daily currency converter 2016; http://www.bankofcanada.ca/rates/exchange/daily-
converter/. Accessed 2016 Sep 17.
176. Consumer Price Index, health and personal care, by province (Canada).
http://www.statcan.gc.ca/tables-tableaux/sum-som/l01/cst01/econ161a-eng.htm.
177. In: Spackman E, ed: University of Calgary Clinical Research Unit Feb 9 2017.
178. CIHI. NACRS Emergency Department Visits and Length of Stay by Province/Territory,
2014–2015. 2017; https://www.cihi.ca/sites/default/files/document/quickstats-static-
table_nacrs_2014-15_en.xlsx, 2017.
179. Wong K. CT for Pulmonary Embolism: Audit on Utilization and Yield in the Emergency
Departments of the Fraser Health Authority. In: Spackman E, ed2017.
180. Health F. About Fraser Health. 2017; http://www.fraserhealth.ca/about-us/about-fraser-
health/, 2017.
181. Langford N, Stansby G, Avital L. The management of venous thromboembolic diseases
and the role of thrombophilia testing: summary of NICE Guideline CG144. Acute Med.
2012;11(3):138-142.
182. Medical Services Commission Payment Schedule. Dec 1 2016;
http://www2.gov.bc.ca/assets/gov/health/practitioner-pro/medical-services-plan/msc-
payment-schedule-december-2016.pdf.
183. BC PharmaCare Formulary Search. https://pharmacareformularysearch.gov.bc.ca/, 2017.
184. Schedule of Benefits for Physician Services under the Health Insurance Act
http://www.health.gov.on.ca/en/pro/programs/ohip/sob/physserv/physserv_mn.html,
2017.
185. Goeree R BG, Petrovic R, Salama S. . Cost of stroke in Canada: a 1-year prospective
study. J Med Econ. 2005;8(147-67).
186. Rubens FD, Bourke M, Hynes M, et al. Surgery for chronic thromboembolic pulmonary
hypertension--inclusive experience from a national referral center. Ann Thorac Surg.
2007;83(3):1075-1081.

132
187. Canadian Collaborative for Drug Safety EaNM-A, Wells G, Coyle D, Cameron C,
Steiner S, Coyle K, et al. . Safety, effectiveness, and cost-effectiveness of new oral
anticoagulants compared with warfarin in preventing stroke and other cardiovascular
events in patients with atrial fibrillation. Ottawa: CADTH;2012 Apr 9
188. van Gogh I, Buller HR, Cohen AT, et al. Idraparinux versus standard therapy for venous
thromboembolic disease. N Engl J Med. 2007;357(11):1094-1104.
189. Woo JK, Chiu RY, Thakur Y, Mayo JR. Risk-benefit analysis of pulmonary CT
angiography in patients with suspected pulmonary embolus. American Journal of
Roentgenology. 2012;198(6):1332-1339.
190. Bromley E, Kennedy D, Miranda J, Sherbourne CD, Wells KB. The Fracture of
Relational Space in Depression: Predicaments in Primary Care Help Seeking. Curr
Anthropol. 2016;57(5):610-631.
191. Lobo JL, Zorrilla V, Aizpuru F, et al. Clinical syndromes and clinical outcome in patients
with pulmonary embolism: findings from the RIETE registry. Chest. 2006;130(6):1817-
1822.
192. Wong K. Audit of CT in Fraser Health Authority. 2017.
193. Pradubpongsa P, Dhana N, Jongjarearnprasert K, Janpanich S, Thongngarm T. Adverse
reactions to iodinated contrast media: prevalence, risk factors and outcome--the results of
a 3-year period. Asian Pacific Journal of Allergy and Immunology. 2013;31(4):299.
194. Goksel O, Aydın O, Atasoy C, et al. Hypersensitivity reactions to contrast media:
prevalence, risk factors and the role of skin tests in diagnosis–a cross-sectional survey.
International archives of allergy and immunology. 2011;155(3):297-305.

133
Appendix A: Diagnostic Accuracy
Table A1: Clinical Effectiveness Database Search Strategy
1 exp pulmonary embolism/
2 ((pulmonary or lung) adj4 (embolism* or embolus or emboli* or emboly or thromboemboli* or thrombo-
emboli* or microemboli* or microembolus or blood clot*)).ti,ab,kf.
3 Venous Thromboembolism/
4 ((venous or vein) adj4 (thromboemboli* or thrombo-emboli*)).ti,ab,kf.
5 VTE.ti,ab,kf.
6 or/1-5
7 exp Tomography, X-Ray Computed/ or Tomography Scanners, X-Ray Computed/
8 ((computed or computer* or electron beam) adj3 (tomograph* or angiograph*)).ti,ab,kf.
9 (CT scan* or X-ray CT or CT X Ray? or CAT scan* or multi-detector CT or tomodensitometry or cine CT
or Helical CT or spiral CT or Four Dimensional CT).ti,ab,kf.
10 (CTPA or CT pulmonary angiography or CT angiography).ti,ab,kf.
11 or/7-10
12 exp Magnetic Resonance Imaging/
13 (magnetic resonance imag* or MR imag* or MRI* or fMRI* or magnetic resonance tomograph* or MR
tomograph* or magnetization transfer contrast imag* or magnetisation transfer imag* or magnetization
transfer imag* or magnetisation transfer imag* or chemical shift imag* or NMR imag* or zeugmatography
or NMR tomography or proton spin tomography or magnetic resonance scan* or MR scan*).ti,ab,kf.
14 12 or 13
134
15 Perfusion Imaging/ or Tomography, Emission-Computed, Single-Photon/ or Radionuclide Imaging/
16 (radionuclide imag* or gamma camera imag* or perfusion imaging or lung perfusion or scintigraph* or
scintigram* or scintiphotograph* or laminoscintigraph* or scintillation or scintillograph* or
scintiscan).ti,ab,kf.
17 (ventilation-perfusion adj5 (imag* or scan* or SPECT)).ti,ab,kf.
18 ("ventilation/perfusion" adj5 (imag* or scan* or SPECT)).ti,ab,kf.
19 ((ventilation and perfusion) adj5 (imag* or scan* or SPECT)).ti,ab,kf.
20 ((VQ or V-Q or "v/q" or "V/P" or VP or V-P) adj5 (imag* or scan* or SPECT)).ti,ab,kf.
21 or/15-20
22 Positron-Emission Tomography/
23 (PET adj3 (scan* or imag*)).ti,ab,kf.
24 (FDGPET or FDG PET or PETCT or PET CT or positron).ti,ab,kf.
25 or/22-24
26 exp Lung/us
27 exp Ultrasonography/
28 (ultrasound or sonogra* or ultrasonic or ultrasonogra* or echotomogra* or echogra* or doppler).ti,ab,kf.
29 or/27-28
30 exp lung/
31 (lung or lungs or thoracic or thorax or chest).ti,ab,kf.
32 or/30-31
33 29 and 32
34 exp Echocardiography/
35 (cardiac echo* or heart echo* or echocardiogra* or echo-cardiogra* or cardiac echogra* or cardiac scan* or
cardial echography or cardioechography or heart echography or heart scanning or myocardium scanning or
ultrasound cardiography).ti,ab,kf.

135
36 or/26,33-35
37 11 or 14 or 21 or 25 or 36
38 6 and 37
39 (Randomized Controlled Trial or Controlled Clinical Trial or Pragmatic Clinical Trial).pt.
40 Randomized Controlled Trial/
41 exp Randomized Controlled Trials as Topic/
42 "Randomized Controlled Trial (topic)"/
43 Controlled Clinical Trial/
44 exp Controlled Clinical Trials as Topic/
45 "Controlled Clinical Trial (topic)"/
46 Randomization/
47 Random Allocation/
48 Double-Blind Method/
49 Double Blind Procedure/
50 Double-Blind Studies/
51 Single-Blind Method/
52 Single Blind Procedure/
53 Single-Blind Studies/
54 Placebos/
55 Placebo/
56 Control Groups/
57 Control Group/
58 (random* or sham or placebo*).ti,ab,hw,kf,kw.

136
59 ((singl* or doubl*) adj (blind* or dumm* or mask*)).ti,ab,hw,kf,kw.
60 ((tripl* or trebl*) adj (blind* or dumm* or mask*)).ti,ab,hw,kf,kw.
61 (control* adj3 (study or studies or trial*)).ti,ab,kf,kw.
62 (Nonrandom* or non random* or non-random* or quasi-random* or quasirandom*).ti,ab,hw,kf,kw.
63 allocated.ti,ab,hw.
64 ((open label or open-label) adj5 (study or studies or trial*)).ti,ab,hw,kf,kw.
65 or/39-64
66 Epidemiologic Methods/
67 exp Epidemiologic Studies/
68 Observational Studies as Topic/
69 Clinical Studies as Topic/
70 (Observational Study or Validation Studies or Clinical Study).pt.
71 (observational adj3 (study or studies or design or analysis or analyses)).ti,ab,kf.
72 cohort*.ti,ab,kf.
73 (prospective adj7 (study or studies or design or analysis or analyses)).ti,ab,kf.
74 ((follow up or followup) adj7 (study or studies or design or analysis or analyses)).ti,ab,kf.
75 ((longitudinal or longterm or (long adj term)) adj7 (study or studies or design or analysis or analyses or
data)).ti,ab,kf.
76 (retrospective adj7 (study or studies or design or analysis or analyses or data or review)).ti,ab,kf.
77 ((case adj control) or (case adj comparison) or (case adj controlled)).ti,ab,kf.
78 (case-referent adj3 (study or studies or design or analysis or analyses)).ti,ab,kf.
79 (population adj3 (study or studies or analysis or analyses)).ti,ab,kf.
80 (descriptive adj3 (study or studies or design or analysis or analyses)).ti,ab,kf.
81 ((multidimensional or (multi adj dimensional)) adj3 (study or studies or design or analysis or

137
analyses)).ti,ab,kf.
82 (cross adj sectional adj7 (study or studies or design or research or analysis or analyses or survey or
findings)).ti,ab,kf.
83 ((natural adj experiment) or (natural adj experiments)).ti,ab,kf.
84 (quasi adj (experiment or experiments or experimental)).ti,ab,kf.
85 ((non experiment or nonexperiment or non experimental or nonexperimental) adj3 (study or studies or design
or analysis or analyses)).ti,ab,kf.
86 (prevalence adj3 (study or studies or analysis or analyses)).ti,ab,kf.
87 case series.ti,ab,kf.
88 or/66-87
89 65 or 88
90 38 and 89
91 90 use pmez
92 lung embolism/
93 pulmonary embolism/
94 ((pulmonary or lung) adj4 (embolism* or embolus or emboli* or emboly or thromboemboli* or thrombo-
emboli* or microemboli* or microembolus or blood clot*)).ti,ab,kw.
95 Venous Thromboembolism/
96 ((venous or vein) adj4 (thromboemboli* or thrombo-emboli*)).ti,ab,kw.
97 VTE.ti,ab,kw.
98 or/92-97
99 exp computer assisted tomography/
100 ((computed or computer* or electron beam) adj3 (tomograph* or angiograph*)).ti,ab,kw.
101 (CT scan* or X-ray CT or CT X Ray? or CAT scan* or multi-detector CT or tomodensitometry or cine CT
or Helical CT or spiral CT or Four Dimensional CT).ti,ab,kw.

138
102 (CTPA or CT pulmonary angiograph* or CT angiograph*).ti,ab,kw.
103 or/99-102
104 exp nuclear magnetic resonance imaging/
105 (magnetic resonance imag* or MR imag* or MRI* or fMRI* or magnetic resonance tomograph* or MR
tomograph* or magnetization transfer contrast imag* or magnetisation transfer imag* or magnetization
transfer imag* or magnetisation transfer imag* or chemical shift imag* or NMR imag* or zeugmatography
or NMR tomography or proton spin tomography or magnetic resonance scan* or MR scan*).ti,ab,kw.
106 104 or 105
107 exp scintigraphy/ or single photon emission computer tomography/ or exp scintiscanning/ or lung
scintiscanning/
108 (radionuclide imag* or gamma camera imag* or perfusion imaging or lung perfusion or scintigraph* or
scintigram* or scintiphotograph* or laminoscintigraph* or scintillation or scintillograph* or
scintiscan).ti,ab,kw.
109 (ventilation-perfusion adj5 (imag* or scan* or SPECT)).ti,ab,kw.
110 ("ventilation/perfusion" adj5 (imag* or scan* or SPECT)).ti,ab,kw.
111 ((ventilation and perfusion) adj5 (imag* or scan* or SPECT)).ti,ab,kw.
112 ((VQ or V-Q or "v/q" or "V/P" or VP or V-P) adj5 (imag* or scan* or SPECT)).ti,ab,kw.
113 or/107-112
114 positron emission tomography/
115 (PET adj3 (scan* or imag*)).ti,ab,kw.
116 (FDGPET or FDG PET or PETCT or PET CT or positron).ti,ab,kw.
117 or/114-116
118 exp echography/
119 (ultrasound or sonogra* or ultrasonic or ultrasonogra* or echotomogra* or echogra* or doppler).ti,ab,kw.
120 or/118-119
121 exp lung/
122 (lung or lungs or thoracic or thorax or chest).ti,ab,kw.

139
123 or/121-122
124 120 and 123
125 (cardiac echo* or heart echo* or echocardiogra* or echo-cardiogra* or cardiac echogra* or cardiac scan* or
cardial echography or cardioechography or heart echography or heart scanning or myocardium scanning or
ultrasound cardiography).ti,ab,kw.
126 exp echocardiography/
127 or/124-126
128 103 or 106 or 113 or 117 or 127
129 98 and 128
130 (Randomized Controlled Trial or Controlled Clinical Trial or Pragmatic Clinical Trial).pt.
131 Randomized Controlled Trial/
132 exp Randomized Controlled Trials as Topic/
133 "Randomized Controlled Trial (topic)"/
134 Controlled Clinical Trial/
135 exp Controlled Clinical Trials as Topic/
136 "Controlled Clinical Trial (topic)"/
137 Randomization/
138 Random Allocation/
139 Double-Blind Method/
140 Double Blind Procedure/
141 Double-Blind Studies/
142 Single-Blind Method/
143 Single Blind Procedure/
144 Single-Blind Studies/

140
145 Placebos/
146 Placebo/
147 Control Groups/
148 Control Group/
149 (random* or sham or placebo*).ti,ab,hw,kf,kw.
150 ((singl* or doubl*) adj (blind* or dumm* or mask*)).ti,ab,hw,kf,kw.
151 ((tripl* or trebl*) adj (blind* or dumm* or mask*)).ti,ab,hw,kf,kw.
152 (control* adj3 (study or studies or trial*)).ti,ab,kf,kw.
153 (Nonrandom* or non random* or non-random* or quasi-random* or quasirandom*).ti,ab,hw,kf,kw.
154 allocated.ti,ab,hw.
155 ((open label or open-label) adj5 (study or studies or trial*)).ti,ab,hw,kf,kw.
156 or/130-155
157 observational study/
158 cohort analysis/
159 longitudinal study/
160 follow up/
161 retrospective study/
162 exp case control study/
163 cross-sectional study/
164 quasi experimental study/
165 prospective study/
166 (observational adj3 (study or studies or design or analysis or analyses)).ti,ab,kw.
167 cohort*.ti,ab,kw.
141
168 (prospective adj7 (study or studies or design or analysis or analyses)).ti,ab,kw.
169 ((follow up or followup) adj7 (study or studies or design or analysis or analyses)).ti,ab,kw.
170 ((longitudinal or longterm or (long adj term)) adj7 (study or studies or design or analysis or analyses or
data)).ti,ab,kw.
171 (retrospective adj7 (study or studies or design or analysis or analyses or data or review)).ti,ab,kw.
172 ((case adj control) or (case adj comparison) or (case adj controlled)).ti,ab,kw.
173 (case-referent adj3 (study or studies or design or analysis or analyses)).ti,ab,kw.
174 (population adj3 (study or studies or analysis or analyses)).ti,ab,kw.
175 (descriptive adj3 (study or studies or design or analysis or analyses)).ti,ab,kw.
176 ((multidimensional or (multi adj dimensional)) adj3 (study or studies or design or analysis or
analyses)).ti,ab,kw.
177 (cross adj sectional adj7 (study or studies or design or research or analysis or analyses or survey or
findings)).ti,ab,kw.
178 ((natural adj experiment) or (natural adj experiments)).ti,ab,kw.
179 (quasi adj (experiment or experiments or experimental)).ti,ab,kw.
180 ((non experiment or nonexperiment or non experimental or nonexperimental) adj3 (study or studies or design
or analysis or analyses)).ti,ab,kw.
181 (prevalence adj3 (study or studies or analysis or analyses)).ti,ab,kw.
182 case series.ti,ab,kw.
183 or/157-182
184 156 or 183
185 129 and 184
186 185 use oemezd
187 186 not conference abstract.pt.
188 91 or 187

142
189 limit 188 to (english or french)
190 limit 189 to yr="2006 -Current"
191 limit 190 to yr="2006 - 2010"
192 remove duplicates from 191
193 limit 190 to yr="2011 -Current"
194 remove duplicates from 193
195 192 or 194

143
Table A2: Detailed Characteristics of Included Studies
Author,
Year,
Country
Study Characteristics Participant Details Intervention Reference
standard
Outcomes
Measured
Quality
Lu, 2014
China
Study Design: RCT
Period of Data Collection: May
2013 – December 2013
Setting of conduct: single center.
Imaging unit of a hospital.
Number of included participants: 100
Inclusion Criteria: patients who were
referred to the imaging department
for a clinically indicated CTPA for
suspected PE were included in this
study.
Exclusion Criteria: patients with a
history of allergy to iodinated
contrast agent, age less than 18 years,
pregnant women, hyperthyroidism
and body weigh exceeding 80 kg.
Participant demographics: Group A
and B - 52.4±16.2 vs. 54.5±15.8
years.
Group A and B – 29 vs 27 male
Type: Dual
source CT
Details: CTPA
- group A, 100
kVp, 1.2 pitch,
60 ml of
contrast
medium and
filtered back
projection
algorithm;
CTPA - group
B, 80 kVp, 2.2
pitch, 20 ml of
contrast
medium and
sinogram
affirmed
iterative
reconstruction
Type: Consensus
reading
Details: un-
blinded consensus
reading of readers
was regarded as
the reference
standard
Image
quality,
diagnostic
accuracy
and
radiation
dose
At risk of
bias
Megyeri,
2014
Switzerland
Study Design: Retrospective NRS
Period of Data Collection:
September 2007 – April 2011
Setting of conduct: single center.
Emergency care unit of a tertiary-
care center
Number of included participants: 123
(Body Weight > 100kg); 114 (Body
Weight < 100 kg)
Inclusion Criteria: patients weighing
≥100 kg who underwent CTPA to
exclude PE
Type: Multi
detector CT
Details: 16-row
CT scanner by
using 16 × 0.75
mm
collimation,
Type: Composite
reference standard
Details: clinical
probability,
reference CTPA
result, additional
imaging when
Diagnostic
accuracy of
CTPA in
two patient
groups
At risk of
bias

144
The control group consisted of 114
patients weighing 75 to 99 kg who
underwent CTPA.
Exclusion Criteria: Not reported
Participant demographics: Age - BW
> 100kg: 57.8 +/- 14.8 years.
BW < 100kg: 59.2 +/- 15.8 years.
<100 kg group (n=114; 81=M,
33=F); >=100 kg group (n=123;
94=M, 29=F)
1.15 pitch, tube
voltage was set
at 100 kVp and
the quality
reference tube
current time
product at 100
mAs.
performed, and 90-
day follow-up
Okada, 2015
Japan
Study Design: Retrospective NRS
Period of Data Collection: April
2012 – March 2013
Setting of conduct: single center.
Setting unclear.
Number of included participants: 83
Inclusion Criteria: Included all initial
weighted average CTPA using the
dual-energy technique performed
Exclusion Criteria: presence of
motion artifact caused by insufficient
breath-holding or previous history of
PE
Participant demographics: Age -
64.5 +/- 15.1 years
31 males and 50 females
Type: Multi
detector CT
Details: 64-
slice dual-
source CT,
detector
collimation was
set to
64mm×0.6mm,
the gantry
rotation time
was 0.33s, and
the pitch value
was 0.5, CTPA
using dual-
energy
technique was
started with
bolus tracking
Type: Combined
tests
Details: CTPA /
LPBV + clinical
and physical
findings
Number and
locations of
intra-
pulmonary
clots,
Diagnostic
accuracy
values
At risk of
bias

145
measurement in
the pulmonary
artery at a
threshold of
100HU
Stein, 2006
International
Study Design: Prospective NRS
Period of Data Collection:
September 2001 – July 2003
Setting of conduct: Multi center.
Inpatient or outpatient clinical
centers
Number of included participants: 773
Inclusion Criteria: Patients who were
at least 18 years of age and had
clinically suspected acute pulmonary
embolism. Patients who were
referred for diagnostic imaging for
suspected pulmonary embolism.
Patients for whom the study nurse
was aware of a consultation request
for suspected pulmonary embolism.
Exclusion Criteria: unable to
complete testing within 36 hr;
abnormal creatinine levels or were
receiving long-term renal dialysis;
history of long-term anticoagulant
use; critically ill receiving ventilatory
support; allergic to contrast agents;
myocardial infarction within
preceding month; possible
pregnancy;
inferior vena caval filter in situ; no
suspected pulmonary embolism;
upper-extremity DVT; previously
enrolled in the study; VF or sustained
VT within 24 hr; shock or
hypotension; Planned to have
thrombolytic therapy within the next
Type: Multi
detector CT
Details: 4-row,
8-row, or 16-
row multi-
detector
scanners. For
patients <250
pounds scanned
on 4-slice
equipment,
collimation was
1.25 mm, table
speed 7.5
mm/rotation,
pitch 1.5
(usually
between 1.0-
2.0), voltage
120 kVp,
current 400
mA, and
rotation time
approximately
0.8 seconds.
Type: Composite
reference standard
Details:
Diagnostic
accuracy of
CT
At risk of
bias

146
24 hr; less than 18 years of age;
Participant demographics: Age -
51.7 +/- 17.1 years
62% females
Coche, 2003
Belgium
Study Design: Prospective NRS
Period of Data Collection: 21
months
Setting of conduct: single center.
Emergency department of urban
teaching hospital with an annual
census of 50,000 patients
Number of included participants: 94
Inclusion Criteria: clinical suspicion
of PE, age greater than 18 years,
absence of clinically suspected deep
venous thrombosis, and plasma D-
dimer levels greater than 500 ng/mL
Exclusion Criteria: D-dimer test that
was negative; clinical signs of deep
venous thrombosis; D-dimer values
that were positive with an obvious
alternative diagnosis; incomplete
study protocols; contraindications to
spiral CT; patient transfer; death; and
patient refusal or inability to
participate.
Participant demographics: Age - 62
± 18 years
66 [70%] were female and 28 male
Type: Multi
detector spiral
CT
Details: thin-
collimation
multi– detector
row CT
(collimation, 4
x 1 mm; pitch,
1.25, 120 kV,
and 144 mAs.)
Type: Combined
tests
Details:
Ventilation-
perfusion (V-P)
scintigraphy,
pulmonary digital
subtraction
angiography when
indicated, and
chest radiography
Episodes of
recurrent or
new deep
venous
thrombosis
or PE;
Diagnostic
accuracy of
CT
At risk of
bias
Quandli,
2000
France
Study Design: Prospective NRS
Period of Data Collection:
September 1996 – August 1998
Setting of conduct: single center.
Number of included participants: 158
Inclusion Criteria: age of 18–75
years, a clinical suspicion of acute PE
(dyspnea, chest pain, hemoptysis,
syncope, risk factors for
Type: Dual
section helical
CT
Details:
Pulmonary
Type: Pulmonary
Arteriography
Details: Pulmonary
digital subtraction
arteriography was
Presence of
PE, CT
Sensitivity,
CT
Specificity
At risk of
bias

147
Department of radiology
thromboembolic disease, abnormal
findings at chest radiography or
electrocardiography, or abnormal
arterial blood gas test results), and
the mental ability to give informed
consent.
Exclusion Criteria: having clinical
signs of life-threatening PE (seven
had cardiogenic shock or acute right
ventricular failure), renal failure (six
had a creatinine clearance level of
less than 35 mL per minute by using
the Cockroft formula or had
previously used nephrotoxic drugs),
or a history of allergy to iodinated
contrast media (five patients).
Twenty-six patients refused CT. Two
patients were excluded after selective
arteriography
Participant demographics: Age
Range 23 - 75 years
73 Males / 85 Females
dual-section
helical CT was
performed by
using 120 kV;
199 mA; 5-mm
collimation (2 x
2.5 mm); 7.5
mm/sec table
speed (pitch,
1.5); 15-cm z-
axis coverage;
and a 20-
second
scanning time.
performed in all
patients by using a
transfemoral
venous approach
and the Seldinger
technique.
Wang, 2009
China
Study Design: Prospective NRS
Period of Data Collection:
November 2000 – May 2001
Setting of conduct: single center.
Department of internal medicine
Number of included participants: 82
Inclusion Criteria: Included patients
with normal creatinine level and were
willing to undergo VQ scan and
CTPA.
Exclusion Criteria: Pregnant women,
patients who were currently
Type: Multi
detector CT
Details: CT
Images were
obtained with a
16 or 64-
detector CT
scanner after
Type: Composite
reference standard
Details: based
upon all imaging
modalities, all
available
laboratory
recorders, clinical
Diagnostic
accuracy
values
At risk of
bias

148
experiencing circulatory shock or had
hypotension or renal failure, were
hemodynamically unstable, were on
ventilatory support, had chronic
pulmonary hypertension, received
anticoagulation, or had a history of
allergy to contrast media.
Participant demographics: Age
Range 14 – 81 years
41 men / 41 women
intravenous
injection of
contrast
medium.
Interpretation
was based on
effective axial
slice thickness
of 1.25 mm.
Scans were
performed from
the level of the
aortic arch to 2
cm above the
diaphragm.
data, the opinions
of the physicians
responsible for
treatment and
outcomes.
Winer-
Muram,
2004
USA
Study Design: Prospective NRS
Period of Data Collection:
September 1999 - March 2001
Setting of conduct: single center.
emergency room and inpatient
populations of tertiary care center
and a public hospital
Number of included participants: 93
Inclusion Criteria: Patients who were
suspected of having acute PE on the
basis of clinical presentation were
eligible for the study.
Exclusion Criteria: age of less than
18 years, serum creatinine levels of
more than 1.5 mg/dL (132.6 mol/L)
within the previous 24 hours (unless
the patient was undergoing
hemodialysis for chronic renal
failure), history of severe allergic
reaction to iodinated contrast
material, pregnancy or possibility of
pregnancy, and recent lower-
extremity US study that demonstrated
deep venous thrombosis.
Type: Multi
detector CT
Details: CT
examinations
were performed
by using a four-
channel multi–
detector row
CT scanner.
Scanning was
performed
using 10-mm
nominal
collimation (4 x
2.5 mm), with
an effective
section width
of 3.2 mm, a
Type: Pulmonary
Arteriography
Details: All studies
were performed
with either a DFP-
2000A
angiographic unit
or an Integris
V3000
angiographic unit.
Presence of
PE, CT
Sensitivity,
CT
Specificity
At risk of
bias

149
Participant demographics: Age
Range: 19 - 88 years
39% males / 61% females
gantry rotation
speed of 0.5
seconds, a table
speed of 20
mm/sec, a pitch
of 1, a tube
voltage of 120
kV, and a tube
current of 200–
300 mAs.
Blachere,
2000
France
Study Design: Prospective NRS
Period of Data Collection: 18
months
Setting of conduct: single center.
inpatients, outpatient, intensive
care unit
Number of included participants: 179
Inclusion Criteria: clinically
suspected of having acute pulmonary
embolism
Exclusion Criteria: any
contraindication for the use of iodine
contrast material (renal failure,
history of allergy), unstable
hemodynamic status, and pregnancy.
Participant demographics: mean age
of 61 years (range, 20–88 years)
88 men and 91 women
Type: Helical
CT
Details:
Technical
parameters
included 3-mm
(n =82) or 2-
mm (n = 134)
collimation,
1.8–2.0 pitch,
120 kV, 170
mA, and 0.75-
sec scan time.
The choice of
collimation was
made according
to the patient’s
capacity to
breath-hold.
Type: Combined
tests
Details: All
patients underwent
ventilation–
perfusion
radionuclide lung
scanning, contrast-
enhanced helical
CT angiography,
and Doppler
sonography of the
legs
recurrence
of PE or of a
VTE
Diagnostic
accuracy of
CT
At risk of
bias
Ohno, 2004
USA
Study Design: Prospective NRS
Period of Data Collection: Not
reported
Number of included participants: 48
Inclusion Criteria: Clinically
suspected PE
Type: Multi
detector CT
Details: The
Type: pulmonary
angiography
Details:
Diagnostic
accuracy of
CT
At risk of
bias

150
Setting of conduct: single center.
Setting unclear
Exclusion Criteria: Not reported
Participant demographics: Mean age
55 years (range 27-73)
Male 26; Female 22
scans were
obtained with
140 kVp; 110
effective mAs;
collimation, 4 x
1 mm; pitch,
6:1;
reconstruction
collimation,
1.25 mm; and
scanning
rotations, 500
msec. During
scanning, 100
mL of contrast
material was
administered to
patients IV via
an antecubital
vein at 4
mL/sec with a
power injector
with an empiric
scanning delay
of 20 sec.
Reinartz,
2004
Germany
Study Design: Retrospective NRS
Period of Data Collection: January
2001 to April 2003
Setting of conduct: single center.
Setting not reported.
Number of included participants: 83
Inclusion Criteria: patients who had
V/Q lung scintigraphy in SPECT
technique as well as multi-slice spiral
CT within an interval of 3 days
Exclusion Criteria: Not reported
Type: Multi
slice spiral CT
Details: MSCT
examinations of
the chest were
done using a 4-
detector row
scanner after
Type: Consensus
reading
Details: The final
diagnosis was made
at a consensus
meeting while taking
into account all
imaging modalities,
Diagnostic
accuracy
data
At risk of
bias

151
Participant demographics: mean age
(SD) - 53.9 +/- 19.5 years (range 18-
88)
Male 36; Female 47
intravenous
application of
120 mL contrast
medium at a flow
rate of 3 mL/s.
Scan parameters
were 120 kV and
100 mA, using a
thin collimation
of 4 _ 1 mm and
a table speed of 7
mm per rotation.
Tube rotation
time was 0.5 s.
clinical data, D-
dimer levels, the
opinions of the
physicians
responsible for
treatment, and a
clinical follow-up of
at least 5 months
Reissig, 2001
Germany
Study Design: Prospective NRS
Period of Data Collection:
February 1998 to March 2000
Setting of conduct: single center.
Setting not reported.
Number of included participants: 69
Inclusion Criteria: Not reported
Exclusion Criteria: Not reported
Participant demographics: mean age
62.8 years (range 24-88)
Male 42; Female 27
Type: Spiral
CT
Details: No
details reported
Type: Combined
tests
Details: CTPA and
transthoracic
sonography
Diagnostic
accuracy
data
At risk of
bias
He, 2012
China
Study Design: NRS. Cross
sectional
Period of Data Collection: June
2007 to January 2011
Setting of conduct: Multi center.
Secondary care centers (including
academic centers).
Number of included participants: 544
Inclusion Criteria: Patients with
suspected PE (based on signs and
symptoms, laboratory findings,
medical history and predisposing
factors - assessed formally by Wells)
Exclusion Criteria: Abnormal serum
creatinine; unwilling to uncergo V/Q;
chest X-ray, and CTPA; pregnancy;
circulatory shock; hypotension; renal
Type: Multi
detector CT
Details: Scan
parameters for
CT: Injection to
scan delay of
14s; 120 kV
and 300 mA
using thin
collimation of
64 x 0.625 mm
Type: Composite
reference standard
Details: clinical
data, laboratory
recorders (D-dimer
and Doppler US
available), imaging
information (e.g.,
echocardiography),
CTPA, V/Q, right
heart cardiac
Diagnostic
accuracy
data
At risk of
bias

152
failure; hemodynamically unstable;
ventilatory support; anticoagulation;
history of allergy to contrast media;
received thrombolytic therapy before
examinations excluded
Participant demographics: mean age
(SD) - 53.3 +/- 16.9; Range = 20 to
91
235 Men (43.2%) /309 Women
(56.8%)
(supine, breath-
hold). 75 to 85
mL contrast
medium at 5
mL/s with
double power
injector.
catheterization,
and PA (performed
in patients with
indeterminate tests
by other
modalities) as well
as physician
opinions and 6-
month clinical
follow-up
Nilsson, 2002
Sweden
Study Design: Prospective NRS
Period of Data Collection: March
1999 and May 2001
Setting of conduct: Single center.
Emergency ward.
Number of included participants: 90
Inclusion Criteria: Hemodynamically
stable outpatients with symptoms of
acute PE presenting during the
daytime
Exclusion Criteria: Pregnancy,
previous adverse reactions to
contrast media, renal insufficiency
(serum-creatinin >150 mmol/l),
treatment with metformine, ongoing
anticoagulation therapy, two or more
previous VTE events, severe
malnutrition or cachexia, expected
survival less than 3 months,
advanced psychiatric disorder,
thrombocytopenia (TPK <70 X
109/l), known hepatitis or HIV
infection, acute myocardial infarction
or unstable hemodynamics.
Type: Spiral
CT
Details: Scan
parameters are
3 mm
collimation and
a table speed of
3 to 5 mm/s
(pitch of 1.3 to
1.7). The tube
current was 200
to 210 mA, the
rotation time
0.8 to 1 second,
and the tube
voltage 120
kV.
Type: Pulmonary
Angiography
Details: PA
examinations used
Siemens High Cor
or Philips Integris
digital, single
plane angiographic
equipment at 12.5
or 25 frames per
second. PA was
performed with the
standard Seldinger
technique using
the femoral
approach. At least
two oblique
projections of each
lung were
performed.
Diagnostic
accuracy
data
At risk of
bias
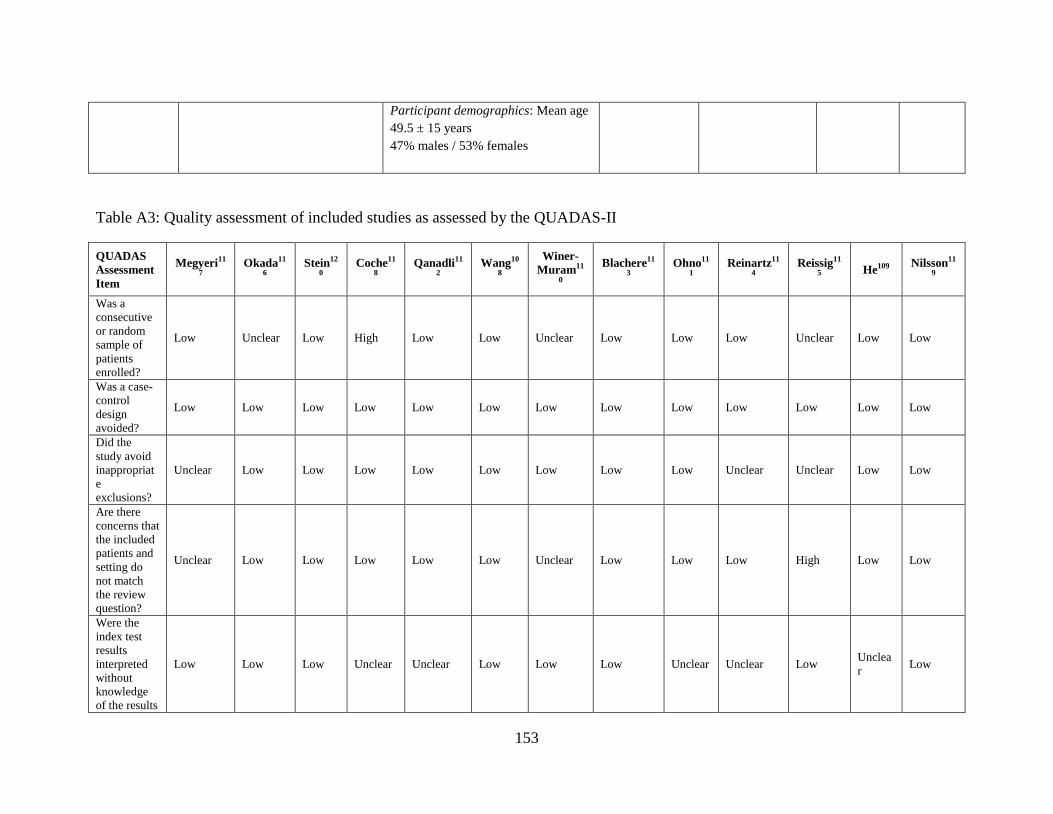
153
Participant demographics: Mean age
49.5 ± 15 years
47% males / 53% females
Table A3: Quality assessment of included studies as assessed by the QUADAS-II
QUADAS
Assessment
Item
Megyeri11
7
Okada11
6
Stein12
0
Coche11
8
Qanadli11
2
Wang10
8
Winer-
Muram11
0
Blachere11
3
Ohno11
1
Reinartz11
4
Reissig11
5 He109
Nilsson11
9
Was a
consecutive
or random
sample of
patients
enrolled?
Low Unclear Low High Low Low Unclear Low Low Low Unclear Low Low
Was a case-
control
design
avoided?
Low Low Low Low Low Low Low Low Low Low Low Low Low
Did the
study avoid
inappropriat
e
exclusions?
Unclear Low Low Low Low Low Low Low Low Unclear Unclear Low Low
Are there
concerns that
the included
patients and
setting do
not match
the review
question?
Unclear Low Low Low Low Low Unclear Low Low Low High Low Low
Were the
index test
results
interpreted
without
knowledge
of the results
Low Low Low Unclear Unclear Low Low Low Unclear Unclear Low Unclea
r Low

154
of the
reference
standard?
If a
threshold
was used,
was it
prespecified
?
Low Low Low Low Low Low Low Low Unclear Low Unclear Low Low
Are there
concerns that
the index
test, its
conduct, or
its
interpretatio
n differ from
the review
question?
Low Low Low Unclear Unclear Low Low Low Low Low Low Low Low
Is the
reference
standard
likely to
correctly
classify the
target
condition?
Low Low Low Low Low Low Low Low Low Low Low Low Low
Were the
reference
standard
results
interpreted
without
knowledge
of the results
of the index
test?
High Low Low Unclear Low High Low Low Unclear Unclear Low High Low
Are there
concerns that
the target
condition as
defined by
the reference
standard
Low Low Low Unclear Low Unclear Low Low Low Low Low Low Low

155
does not
match the
question?
Was there an
appropriate
interval
between the
index test
and
reference
standard?
Unclear Unclear Unclea
r Low Low Unclear Low Low Unclear Low Unclear
Unclea
r Low
Did all
patients
receive the
same
reference
standard?
Low Low Low High Low Low Low Low Low Low Low Unclea
r Low
Were all
patients
included in
the analysis
Unclear Low Low Low Low Low Low Low Low Low High Low Low

156
Appendix B: Patient Perspective
CT and PE Patient Perspective Search
MEDLINE
1. exp Tomography, X-Ray Computed/
2. ((computed or computer* or electron beam) adj3 (tomograph* or angiograph*)).tw,kw.
3. (CT scan* or X-ray CT or CT X Ray? or CAT scan* or multi-detector CT or
tomodensitometry or cine CT or Helical CT or spiral CT or Four Dimensional
CT).tw,kw.
4. (CTPA or CT pulmonary angiography or CT angiography).tw,kw.
5. 1 or 2 or 3 or 4
6. exp Pulmonary Embolism/
7. (pulmonary arter* adj5 embolism*).tw,kw.
8. ((pulmonary or lung*) adj5 (embol* or microembol* or thromboembol*)).tw,kw.
9. 6 or 7 or 8
10. patient acceptance of health care/ or patient satisfaction/ or patient preference/
11. health behavior/ or patient compliance/ or treatment refusal/
12. (attitudes or behavior* or behaviour* or experiences or perceptions or preference* or
"quality of life" or satisfaction).tw.
13. 10 or 11 or 12
14. 5 and 9 and 13
Embase
1. patient acceptance of health care/ or patient satisfaction/ or patient preference/
2. health behavior/ or patient compliance/ or treatment refusal/
3. (attitudes or behavior* or behaviour* or experiences or perceptions or preference* or
"quality of life" or satisfaction).tw.
4. 1 or 2 or 3
5. exp Tomography, X-Ray Computed/
6. ((computed or computer* or electron beam) adj3 (tomograph* or angiograph*)).tw,kw.
7. (CT scan* or X-ray CT or CT X Ray? or CAT scan* or multi-detector CT or
tomodensitometry or cine CT or Helical CT or spiral CT or Four Dimensional
CT).tw,kw.
8. (CTPA or CT pulmonary angiography or CT angiography).tw,kw.
9. 6 or 7 or 8
10. exp Pulmonary Embolism/
11. (pulmonary arter* adj5 embolism*).tw,kw.
12. ((pulmonary or lung*) adj5 (embol* or microembol* or thromboembol*)).tw,kw.
13. 10 or 11 or 12

157
14. 4 and 9 and 13
All EMB Reviews
1. patient acceptance of health care/ or patient satisfaction/ or patient preference/
2. health behavior/ or patient compliance/ or treatment refusal/
3. (attitudes or behavior* or behaviour* or experiences or perceptions or preference* or
"quality of life" or satisfaction).tw.
4. 1 or 2 or 3
5. exp Tomography, X-Ray Computed/
6. ((computed or computer* or electron beam) adj3 (tomograph* or angiograph*)).tw,kw.
7. (CT scan* or X-ray CT or CT X Ray? or CAT scan* or multi-detector CT or
tomodensitometry or cine CT or Helical CT or spiral CT or Four Dimensional
CT).tw,kw.
8. (CTPA or CT pulmonary angiography or CT angiography).tw,kw.
9. 6 or 7 or 8
10. exp Pulmonary Embolism/
11. (pulmonary arter* adj5 embolism*).tw,kw.
12. ((pulmonary or lung*) adj5 (embol* or microembol* or thromboembol*)).tw,kw.
13. 10 or 11 or 12
14. 4 and 9 and 13
PsychInfo
1. patient acceptance of health care/ or patient satisfaction/ or patient preference/
2. health behavior/ or patient compliance/ or treatment refusal/
3. (attitudes or behavior* or behaviour* or experiences or perceptions or preference* or
"quality of life" or satisfaction).tw.
4. 1 or 2 or 3
5. exp Tomography, X-Ray Computed/
6. ((computed or computer* or electron beam) adj3 (tomograph* or angiograph*)).tw,kw.
7. (CT scan* or X-ray CT or CT X Ray? or CAT scan* or multi-detector CT or
tomodensitometry or cine CT or Helical CT or spiral CT or Four Dimensional
CT).tw,kw.
8. (CTPA or CT pulmonary angiography or CT angiography).tw,kw.
9. 6 or 7 or 8
10. exp Pulmonary Embolism/
11. (pulmonary arter* adj5 embolism*).tw,kw.
12. ((pulmonary or lung*) adj5 (embol* or microembol* or thromboembol*)).tw,kw.
13. 10 or 11 or 12
14. 4 and 9 and 13
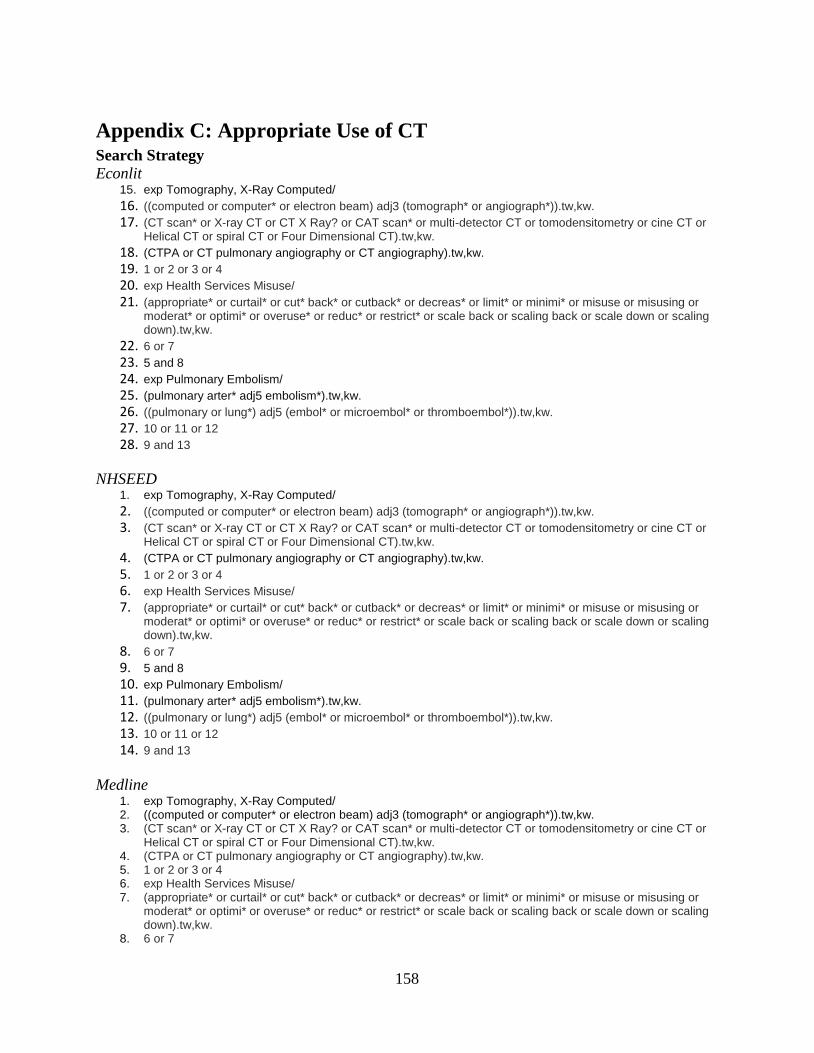
158
Appendix C: Appropriate Use of CT Search Strategy
Econlit 15. exp Tomography, X-Ray Computed/
16. ((computed or computer* or electron beam) adj3 (tomograph* or angiograph*)).tw,kw. 17. (CT scan* or X-ray CT or CT X Ray? or CAT scan* or multi-detector CT or tomodensitometry or cine CT or
Helical CT or spiral CT or Four Dimensional CT).tw,kw. 18. (CTPA or CT pulmonary angiography or CT angiography).tw,kw. 19. 1 or 2 or 3 or 4 20. exp Health Services Misuse/ 21. (appropriate* or curtail* or cut* back* or cutback* or decreas* or limit* or minimi* or misuse or misusing or
moderat* or optimi* or overuse* or reduc* or restrict* or scale back or scaling back or scale down or scaling down).tw,kw.
22. 6 or 7 23. 5 and 8 24. exp Pulmonary Embolism/ 25. (pulmonary arter* adj5 embolism*).tw,kw. 26. ((pulmonary or lung*) adj5 (embol* or microembol* or thromboembol*)).tw,kw. 27. 10 or 11 or 12 28. 9 and 13
NHSEED 1. exp Tomography, X-Ray Computed/
2. ((computed or computer* or electron beam) adj3 (tomograph* or angiograph*)).tw,kw. 3. (CT scan* or X-ray CT or CT X Ray? or CAT scan* or multi-detector CT or tomodensitometry or cine CT or
Helical CT or spiral CT or Four Dimensional CT).tw,kw. 4. (CTPA or CT pulmonary angiography or CT angiography).tw,kw. 5. 1 or 2 or 3 or 4 6. exp Health Services Misuse/ 7. (appropriate* or curtail* or cut* back* or cutback* or decreas* or limit* or minimi* or misuse or misusing or
moderat* or optimi* or overuse* or reduc* or restrict* or scale back or scaling back or scale down or scaling down).tw,kw.
8. 6 or 7 9. 5 and 8 10. exp Pulmonary Embolism/ 11. (pulmonary arter* adj5 embolism*).tw,kw. 12. ((pulmonary or lung*) adj5 (embol* or microembol* or thromboembol*)).tw,kw. 13. 10 or 11 or 12 14. 9 and 13
Medline 1. exp Tomography, X-Ray Computed/ 2. ((computed or computer* or electron beam) adj3 (tomograph* or angiograph*)).tw,kw. 3. (CT scan* or X-ray CT or CT X Ray? or CAT scan* or multi-detector CT or tomodensitometry or cine CT or
Helical CT or spiral CT or Four Dimensional CT).tw,kw. 4. (CTPA or CT pulmonary angiography or CT angiography).tw,kw. 5. 1 or 2 or 3 or 4 6. exp Health Services Misuse/ 7. (appropriate* or curtail* or cut* back* or cutback* or decreas* or limit* or minimi* or misuse or misusing or
moderat* or optimi* or overuse* or reduc* or restrict* or scale back or scaling back or scale down or scaling down).tw,kw.
8. 6 or 7

159
9. 5 and 8 10. exp Pulmonary Embolism/ 11. (pulmonary arter* adj5 embolism*).tw,kw. 12. ((pulmonary or lung*) adj5 (embol* or microembol* or thromboembol*)).tw,kw. 13. 10 or 11 or 12 14. 9 and 13 15. limit 14 to (english or french) 16. limit 14 to (comment or editorial or letter) 17. 15 not 16
EMBASE 1. exp Tomography, X-Ray Computed/ 2. ((computed or computer* or electron beam) adj3 (tomograph* or angiograph*)).tw,kw. 3. (CT scan* or X-ray CT or CT X Ray? or CAT scan* or multi-detector CT or tomodensitometry or cine CT or
Helical CT or spiral CT or Four Dimensional CT).tw,kw. 4. (CTPA or CT pulmonary angiography or CT angiography).tw,kw. 5. 1 or 2 or 3 or 4 6. (appropriate* or curtail* or cut* back* or cutback* or decreas* or limit* or minimi* or misuse or misusing or
moderat* or optimi* or overuse* or reduc* or restrict* or scale back or scaling back or scale down or scaling down).tw,kw.
7. 5 and 6 8. lung embolism/ 9. (pulmonary arter* adj5 embolism*).tw,kw. 10. ((pulmonary or lung*) adj5 (embol* or microembol* or thromboembol*)).tw,kw. 11. 8 or 9 or 10 12. 7 and 11 13. limit 12 to (english or french) 14. limit 12 to (conference abstract or conference proceeding or editorial or letter) 15. 13 not 14
Cochrane 1. exp Tomography, X-Ray Computed/ 2. ((computed or computer* or electron beam) adj3 (tomograph* or angiograph*)).tw,kw. 3. (CT scan* or X-ray CT or CT X Ray? or CAT scan* or multi-detector CT or tomodensitometry or cine CT or
Helical CT or spiral CT or Four Dimensional CT).tw,kw.4. 5. (CTPA or CT pulmonary angiography or CT angiography).tw,kw. 6. 1 or 2 or 3 or 4 7. (appropriate* or curtail* or cut* back* or cutback* or decreas* or limit* or minimi* or misuse or misusing or
moderat* or optimi* or overuse* or reduc* or restrict* or scale back or scaling back or scale down or scaling down).tw,kw.
8. 5 and 6 9. lung embolism/ 10. (pulmonary arter* adj5 embolism*).tw,kw. 11. ((pulmonary or lung*) adj5 (embol* or microembol* or thromboembol*)).tw,kw. 12. 8 or 9 or 10 13. 7 and 11 14. limit 12 to (english or french) 15. limit 12 to (conference abstract or conference proceeding or editorial or letter) 16. 13 not 14

160
Table C1: Characteristics
Author,
Year,
Country
Objective and method Clinical
context
Participant Details Details of Intervention Clinical Pathway
Agarwal,
2012,
Australia
Objective: To investigate the
level of adherence to local
diagnostic imaging guidelines
for suspected PE and to
ascertain the impact of
interventions
Study Design: Pre- post-
intervention
Methods: Retrospective audit
using Emergency Department
Information System and
Radiology Information System
between September 2005 and
March 2006, followed by
intervention and prospective
post-intervention data collection
between January 2008 and
March 2008.
Emergency
Department
in 855 bed
public
teaching
hospital
Inclusion Criteria: consecutive
patients referred by emergency
department of Royal Perth
Hospital for CTPA or VQ scan.
Exclusion Criteria: Patients less
than 18 years old, pregnant, d-
dimer or imaging requested for
diagnosis other than PE
Participant demographics:
Pre-intervention: 187
participants, 103 females and 84
males, mean age 55±18 years,
89 underwent CTPA, 98 had
VQ
Post-intervention: 109
subjects, 58 females and 51
males, mean age 59±20 years,
76 underwent CTPA, and 33
VQ.
Diagnostic Imaging
Pathways (DIP) online
clinical decisions
support tool.
Intervention included a
1-day teaching session
to DIP guidelines,
regular reminders at
daily handovers
Follow-up Time: 3
months
Guidelines on the Diagnostic
Imaging Pathways considered
gold standard which includes the
use of Wells score as a primary
screening tool to stratify patients
into low, intermediate or high
risk of PE
Booker,
2016,
United
States
Objective: To optimize the
utilization of CT pulmonary
angiogram for the diagnosis and
workup of acute chest pain to
reduce unnecessary radiation
and health system expense
Study Design: Pre- Post-
intervention
Emergency
department
in 700 bed
acute care
hospital
Inclusion Criteria: All patients
undergoing CTPA in Scipps
Mercy Hospital Emergency
Department
Exclusion Criteria: None
reported
Participant demographics:
Pre-intervention: 206 patients,
Presentation at monthly
emergency department
meeting highlighting
published protocols and
workup for pulmonary
embolism including
utility of Wells,
simplified Wells and
PERC scores, overview
of D-dimer and CTPA
None reported

161
Methods: Retrospective chart
evaluation for pulmonary
embolism scoring criteria and
D-dimer utilization collected
from August 2014 to October
2014 followed by intervention
starting January 28, 2015 and
prospective post-intervention
data collection between
February 2015 and April 2015.
mean age of 56.2 years, 40.3%
male and 59.7% female
Post-intervention: 206 patients,
mean age of 56.7 years, 45,1%
male and 54.9% female
utilization within the
emergency department.
Individual utilization
data was sent
confidentially to each
clinician
Follow-up Time: 3
months
Dunne,
2015,
United
States
Objective: To determine the
effect of clinical decision
support on use and yield of
inpatient CT pulmonary
angiographic imaging for acute
Pulmonary Embolism.
Study Design: Pre- Post-
intervention
Methods: Retrospective audit
prior to intervention
implementation on November 1,
2009, and prospective data
collection after.
793-bed
urban
teaching
hospital with
over 50,000
annual
admissions
Inclusion Criteria: Patients
older than 16 years
Exclusion Criteria: Patients in
hospice care
Participant demographics:
Pre-intervention: 3037 CT
pulmonary examinations, mean
age 57.8 (95%CI: 57.1-58.4),
and 40.7% male
Post-intervention: 2825 CT
pulmonary examinations, mean
age 57.9 (95% CI 57.3-58.5),
and 40.3% male
Clinical decision tool
informed providers of
the patient-specific pre-
test probability for PE
based on validated
decision rule when they
submitted an order for
CT. Advice could be
accepted and order
cancelled, or advice
could be ignored.
Follow-up Time: Not
reported
Physician selected clinical
suspicion of PE (low,
intermediate or high), and D-
dimer level to get clinical
decision tool support advice
Geetings,
2016,
United
States
Objective: To determine the
impact of embedding a pre-test
probability rule that is required
during the computerized
physician order-entry process on
the appropriateness of CT
angiography of the pulmonary
arteries for the diagnosis of
pulmonary embolism in the
emergency department
Study Design: Pre- post
intervention
Methods: Data was collected
Emergency
department
of a tertiary
care
university
hospital,
with 62,000
admissions
in year 1 of
study and
66,000
patients in
year 2
Inclusion Criteria: All
pulmonary CTA examinations
ordered for suspected
pulmonary embolism
Exclusion Criteria: Younger
than 18 years old
Participant demographics:
Pre-intervention: 46,834
patients, mean age 47.9 (SD
20.6), 44.7% male
Post-intervention: 49,673
patients, mean age 47.6 (SD
20.2), 44% male
Embedding a field for
modified Wells score in
the CTA order set.
Modified wells score
was required to order
CT, but CT could be
ordered regardless of
score.
Follow-up Time: 12
months
Not Applicable

162
before the intervention from
October 17, 2010 to October 17,
2011. Intervention implemented
on October 17, 2011 and post-
intervention data was recorded
until October 17, 2012
Hardin,
2008,
United
States
Objective: To evaluate the
effectiveness of e-mail
communication to reduce the
utilization of CT for pulmonary
embolism in young patients (age
40 and under)
Study Design: pre- post-
intervention
Methods: Data were
retrospectively collected 90
days prior to email
correspondence and
retrospectively collected 90
days after email correspondence
Emergency
department,
details not
reported
Inclusion Criteria: CT studies in
emergency department patients
aged 40 and younger
Exclusion Criteria: None
reported
Participant demographics:
Pre-intervention: 33 patients,
mean age 30.3, age range 19-40,
25 females and 8 males
Post-intervention: 32 patients,
mean age 30.2 years, age range
17-40, 26 females and 6 males.
Email sent to all
Emergency Department
physicians. Email
reported that use of CT
to diagnose PE was
increasing. To prevent
radiation exposure in
young females, V/Q
scan should be
considered as an
alternative method of
diagnosis.
Follow-up Time: 1.5
months
V/Q to replace CT scans in
patients under 40 years old
Jimenez,
2015,
Spain
Objective: To determine the
effect of an evidence-based
clinical decision support
algorithm on the use and yield
of CT pulmonary angiography
and outcomes of patients
evaluated in the emergency
department for suspected
pulmonary embolism
Study Design: pre- and post-
intervention
Methods: Pre-intervention data
were collected from January 11,
2011 to December 31st 2011,
and post intervention data were
collected from January 1, 2012
Academic
Urban
Emergency
Department
Inclusion Criteria: patient
presentation to the emergency
department and clinician
suspicion of acute symptomatic
pulmonary embolism
Exclusion Criteria: treatment
with therapeutic doses of
anticoagulants for more than 24
hours, life expectancy of less
than 3 months, documented
pregnancy, geographical
inaccessibility precluding
follow-up, younger than 18
years old, allergy to contrast
agents, renal insufficiency,
logistic problems, and
haemodynamic instability
Clinical Decision tool
intended to guide
diagnostic testing for
PE. No other details
reported
Follow-up Time: 12
months
Not reported

163
to December 31st 2012
Participant demographics:
Pre-intervention: 652 patients,
mean age 67.9 years, 5.4 days of
symptoms, sex distribution not
reported
Post-intervention: 711 patients,
mean age 69.8 years, 4,1 days of
symptoms, sex distribution not
reported
Kanaan,
2013,
United
States
Objective: To evaluate
appropriate utilization rates for
CT pulmonary angiography in a
tertiary center emergency
department before and after a
health care provider educational
intervention
Study Design: pre- and post-
intervention
Methods: Retrospective review
of radiology information
systems database 27 days before
intervention and 26 days after
intervention
Single
center ,
academic
Emergency
Department
Inclusion Criteria: Adult
patients 18 years or older
presenting to emergency
department who had CTPA
performed during emergency
department visit
Exclusion Criteria: No
exclusions
Participant demographics:
Pre-intervention: 100 patients,
mean age 47 (range 18-93), 65%
female
Post-intervention: 100 patients,
mean age 49 (range 18-82), 59%
female
Formal educational
intervention, consisting
of a 45-minute didactic
lecture followed by a
30-minute question and
answer session.
Education session was
attended by 30
emergency department
residents, 20 attending
physicians and 10
physician assistants.
Topics included,
clinical aspects,
imaging and other tests
for diagnosing PE,
indications,
contraindications and
side-effects, and a
summary of recent
published guidelines.
Emphasis on the
usefulness of D-dimer
testing and alternatives
to CT.
Follow-up Time: 26
days
Not applicable

164
Murthy,
2016,
South
Africa
Objective: To determine the
impact of an electronic clinical
decision support (CDS) for PE
on the efficiency of CTPA
utilization in a resource-limited
setting.
Study Design: Three phase
intervention study
Methods: The study was
conducted in 3 phases. Phase 1:
baseline observation (before
December 2012); Phase 2:
Introducing clinical guidelines
to combine modified Well’s and
D-dimer tests (December 2012
– December 2013); Phase 3:
Introducing CDS (in December
2013).
One 386-bed
public-sector
tertiary-level
teaching
hospital
Inclusion Criteria: Consecutive
CTPAs performed in the
respective time periods were
analyzed
Exclusion Criteria: excluded
patients who were pregnant,
post-partum or <18 years of age.
Participant demographics:
424 patients (Phase 1: 149;
Phase 2:174; Phase 3: 101)
Mean age 48.2 years,
male/female ratio 1:1.9,
Inpatients 50.2%, Outpatients
49.8%
Intervention 1: A PE
diagnostic algorithm
was distributed to all
hospital clinicians,
outlining the combined
role of the validated
modified Wells score
and the quantitative D-
dimer test in defining
the pre-test probability
of PE.
Intervention 2:
Clinicians were
prompted to enter the
Wells score and the D-
dimer test result,
thereby defining the
pre-test probability of
PE and hence the
appropriateness of the
CTPA request.
Follow-up Time: NR
Clinical guidelines explain the
combined role of the validated
modified Wells score and the
quantitative D-dimer test in
defining the pre-test probability
of PE. D-dimer is done if
modified Well’s score <= 4. If
D-dimer is negative, patient is
examined for other pathology or
discharged if stable. If Well’s
score is > 4, patient’s creatinine
level is measured. If it is <= 140
mmol/L CTPA is performed,
otherwise VQ scan or CTPA is
performed with renal support.
Ong,
2012,
Australia
Objective: To evaluate the
effect of implementing the
Wells score clinical prediction
tool (CPT) on rationalizing the
use of CT pulmonary
angiography (CTPA) for
diagnosing pulmonary
embolism (PE)
Study Design: Pre- post-
intervention
Methods: A retrospective study
was conducted over a 3-month
period (pre-intervention) and a
pre-test probability Wells score
Tertiary
teaching
hospital
Inclusion Criteria: Patients
investigated with
CTPA for suspected PE were
enrolled.
Exclusion Criteria: NR
Participant demographics: 268
patients included, no
demographics reported
Using Wells score,
patients were stratified
into pre-test probability
categories. Those
stratified high risk were
investigated with
CTPA. Low and
medium-risk patients
had D-dimer assays
performed and were
only imaged with
CTPA if this was
elevated. Completion of
the algorithm form was
required before the CT
radiographers would
Diagnostic algorithm suggests to
use of Wells score as a primary
screening tool to stratify patients
into low, intermediate or high
risk of PE, and assign D-dimer
and/or imaging methods
accordingly.

165
was assigned to each patient
based on information obtained
from medical records.
A prospective study was
conducted after a diagnostic
algorithm sheet was introduced
and clinicians were encouraged
to use this when assessing
patients for suspected PE.
perform a CTPA.
Recorded data for each
case included Wells
score, date of CTPA,
D-dimer level (if
available) and final
imaging result (PE or
no PE).
Follow-up Time: 7
months
Prevedello,
2013,
USA
Objective: To determine
whether previously documented
effects of clinical decision
support on CT for PE in the
emergency department (ie,
decreased use and increased
yield) are due to a decrease in
unwarranted variation.
Study Design: Retrospective
pre- post- intervention study
Methods: Retrospective data
collected from January 1, 2006
to March 31, 2009. Enrolled all
patients who had PE-CT
performed 18 months pre- and
post-clinical decision support
implementation. Intra- and
inter-physician variability in
yield (% PE-CT positive for
acute pulmonary embolism)
were assessed. Yield variability
was measured using logistic
regression accounting for
patient characteristics.
Academic
adult
medical
center
emergency
department
with
60,000
annual visits
Inclusion Criteria: All patients
presenting to the emergency
department who underwent
pulmonary embolism CT (PE-
CT) during the 18-month
periods before and after clinical
decision support
implementation.
Exclusion Criteria:
Examinations requested by
physicians who were not present
throughout the entire study
period were excluded from the
analysis.
Participant demographics:
Pre-intervention: 1524
patients, mean age 55.23 (SD
18.1) years, 65.2% female
Post-intervention: 1349
patients, mean age 55.07 (SD
17.7) years, 62.9% female.
The intervention
consisted of a clinical
decision support tool
for PE-CT (based on
the criteria of Wells)
within the institution’s
computerized physician
order entry system. The
clinical decision
support required
information about the
level of clinical
suspicion for
pulmonary embolism
(low, intermediate, or
high) and the serum D-
dimer level (not done,
unknown, normal, or
elevated).
Follow-up Time: NA
Not applicable
Raja,
2015,
USA
Objective: To assess whether
implementing emergency
department physician
ED of an
urban level 1
adult trauma
Inclusion Criteria: all attending
emergency physicians.
The intervention
consisted of quarterly
performance feedback
Not applicable

166
performance feedback reports
improves adherence to
evidence-based guidelines for
use of CT for evaluation of PE
beyond that achieved with
clinical decision support alone.
Study Design: Randomized
controlled trial
Methods: Imaging CDS was
deployed for all requests for CT
for evaluation of PE throughout
the study period. Ordering
providers could ignore the
evidence presented in CDS and
proceed with requests for CT for
evaluation of PE that deviated
from evidence-based guidelines
without interference. We
included all attending
emergency physicians and,
before randomization, stratified
them into quartiles by use of CT
for PE in 2012. Attending
physician assignment in the ED
was random, with all attending
physicians being equally likely
to work in all areas of the ED.
Attending physicians were then
randomized by quartile into two
groups using a random number
generator; the intervention
group received individualized
feedback reports on adherence
to evidence-based guidelines on
use of CT for evaluation of PE,
use (defined as number of CT
examinations for PE per 1000
patients), and yield (defined as
center Exclusion Criteria: both new
physicians who joined the group
after intervention start date and
physicians who left before study
completion were excluded from
the analysis.
Participant demographics: 43
attending physicians, 13 of
whom (30%) were women, were
included.
Control group: 21 physicians,
29% of women, Mean age 41.2
(SD 8.6) years, Mean
experience 9.2 (SD 9) years
Intervention group: 22
physicians, 32% of women,
Mean age 39.4 (SD 7.6) years,
Mean experience 8.3 (SD 8.4)
years
reports, sent via e-mail
that displayed both
individual physicians’
statistics and their
performance compared
with anonymized
results for the entire
group of emergency
physicians. The
frequency of feedback
report distribution was
selected to mirror other
physician performance
feedback reporting
initiatives at our
institution. In addition,
physicians were given
the medical record
numbers of any patients
for whom the CT
examinations ordered
for evaluation of PE
were deemed non-
adherent to evidence
based guidelines by
CDS to facilitate
individual chart review.
Follow-up Time: NA

167
percentage of CT examinations
for PE with positive findings),
whereas the control group did
not.
Raja,
2012,
USA
Objective: To determine the
effect of evidence-based clinical
decision support (CDS) on the
use and yield of computed
tomographic (CT) pulmonary
angiography for acute
pulmonary embolism (PE) in
the emergency department
(ED).
Study Design: Pre- post-
intervention
Methods: Use (number of
examinations per 1000 ED
visits) and yield of CT
pulmonary angiography were
compared before and after CDS
implementation. The authors
developed and validated a
natural language processing tool
to identify acute PE diagnoses.
Linear trend analysis was used
to assess for variation in CT
pulmonary angiography use.
Logistic regression was used to
determine variation in yield
after controlling for patient
demographic and clinical
characteristics.
793-bed
quaternary
care
institution
with 60 000
annual ED
visits.
Inclusion Criteria: included all
adult patients presenting to the
ED
Exclusion Criteria: NR
Participant demographics:
Pre-intervention: 3855
patients, 65.7% female, Mean
age 55.5 (SD 17.9) years
Post-intervention: 2983
patients, 63.9% female, Mean
age 55.3 (SD 17.9) years
We integrated CDS on
the basis of validated
decision rules into our
ED radiology
computerized physician
order entry system
(Percipio; Medicalis,
San Francisco, Calif)
during August 2007.
Follow-up Time: 2
months
The CDS consisted of three
rules. The first rule required that
ordering clinicians choose both a
D -dimer level (elevated, normal,
or not evaluated) and the clinical
suspicion of PE (high,
intermediate, or low). The
second rule displayed advice in
patients with an intermediate or
low level of suspicion in whom a
D –dimer assay was not
performed (“measuring a D -
dimer value in patients with a
low and/or intermediate clinical
suspicion of PE is an appropriate
first step in the work-up of acute
PE and will exclude the need for
CT pulmonary angiography in
some patients”). The third rule
displayed a second piece of
advice in patients with a normal
D -dimer level and intermediate
or low suspicion for PE (“based
on current evidence as well as
our experience at Brigham and
Women’s Hospital, diagnosing
an acute PE with CT pulmonary
angiography in low- or
intermediate-risk patients with a
normal D -dimer level is
extremely unlikely”). At each
stage, clinicians could either
cancel the imaging order or
ignore the advice.
Stein, Objective: To determine A large Inclusion Criteria: Patients with Two hour-long Not applicable

168
2010,
USA
whether the radiation exposure
to patients with suspected
pulmonary embolism (PE) could
be decreased by safely
increasing the use of
ventilation–perfusion (V/Q)
scanning and decreasing the use
of CT pulmonary angiography
(CTPA) through an educational
intervention.
Study Design: Pre- post-
intervention
Methods: Collaborative
educational seminars were held
among the radiology, nuclear
medicine, and emergency
medicine departments in
December 2006 and January
2007 regarding the radiation
dose and accuracies of V/Q
scanning and CTPA for
diagnosing PE. To reduce
radiation exposure, an imaging
algorithm was introduced in
which emergency department
patients with a clinical suspicion
of PE underwent chest
radiography. If the chest
radiograph was normal, V/Q
scanning was recommended,
otherwise CTPA was
recommended. We
retrospectively tallied the
number and results of CTPA
and V/Q scanning and
calculated mean radiation
effective dose before and after
the intervention. False-negative
urban
academic
medical
center
clinically suspected PE
Exclusion Criteria: NR
Participant demographics:
Pre-intervention:
CT: 66% women, mean age 55
years
VQ: 71% women, mean age
54.7 years
Post-intervention:
CT: 65.9% women, mean age
56.7 years
VQ: 74% women, mean age
50.8 years
seminars were held
with the available
emergency department
staff, including
residents and attending
physicians. It was
recommended to the
emergency department
clinicians that stable
patients with a clinical
suspicion of PE should
initially be imaged with
chest radiography. If
the chest radiography
findings were normal
and further imaging for
suspected PE was
deemed appropriate by
clinical assessment, the
emergency department
staff was advised to
request a V/Q scan. If
the chest radiograph
showed a pleural or
parenchymal
abnormality, CTPA
was recommended. If
either examination was
equivocal or the
imaging results were
discordant with the
clinical impression, the
emergency department
staff was advised to
request the alternative
test in addition. The
algorithm was provided
to the emergency
department staff as a
handout, which resulted

169
findings were defined as
subsequent thromboembolism
within 90 days.
in a collaborative,
consultative approach
between the imaging
services and the
emergency department
staff.
Follow-up Time: 90
days
Walen,
2016,
The
Netherlands
Objective: To determine if
mandatory adherence to a
diagnostic protocol increases the
rate of CT pulmonary
angiographies (CTPAs) positive
for pulmonary embolism (PE).
Study Design: Prospective
observational
Methods: Data was
prospectively collected from
January 2014 to June 3, 2014
The percentage of positive
CTPA scans was calculated and
compared with previous cohort
(Walen et al. Insights Imaging).
Odds ratios were calculated as a
measure of association between
dichotomous variables and
CTPA findings.
NR Inclusion Criteria: all patients
with suspected PE requiring a
CTPA scan.
Exclusion Criteria: NR
Participant demographics:
All patients: 53.4% women,
mean age 64 (range 49 – 73)
years
As an intervention
every physician in our
hospital requesting a
CTPA for pulmonary
embolism was asked to
document Wells-scores
on the request form
and—if available—to
document D-dimer.
Special templates of the
request form with a pre-
printed Wells scoring
table were distributed
among requesting
physicians. When the
required information
was lacking on the
request forms our
diagnostic
radiographers urged the
requesting doctor to
provide the necessary
clinical data. However,
no scans were refused.
If a scan was
nevertheless performed
without the clinical data
documented on the
request form, the scores
were retrospectively
obtained. Electronic
Not applicable

170
and paper medical files
were searched for
clinical characteristics
and relevant medical
history.
Follow-up Time: NA

171
Table C2: Quality Assessment using Downs and Blacks Checklist
Author (Year) Agarwal1
28
Booke12
6
Dunne12
7
Geeting125 Harding1
32
Jimenez129 Kanaan1
33
Murthy136 Ong135 Prevedello1
30
Raja138 Raja131 Stein134 Walen137
Is the
hypothesis/aim/objective of
the study clearly
described?
Yes Yes Yes Yes Yes Yes Yes Yes Yes Yes Yes Yes Yes Yes
Are the main outcomes to
be measured clearly
described in the
Introduction or Methods
section?
Yes Yes Yes Yes Yes Yes Yes Yes Yes Yes Yes Yes Yes Yes
Are the characteristics of
the patients included in the
study clearly described ?
Yes Yes Yes Yes Yes No Yes Yes No Yes Yes Yes Yes Yes
Are the interventions of
interest clearly described?
Yes Yes Yes Yes Yes No Yes Yes Yes Yes Yes Yes Yes Yes
Are the distributions of
principal confounders in
each group of subjects to
be compared clearly
described?
No No Yes Yes No No No Unclear Unclea
r
Unclear Unclear Unclear Unclear Unclear
Are the main findings of
the study clearly
described?
Yes Yes Yes Yes Yes Yes Yes Yes Yes Yes Yes Yes Yes Yes
Does the study provide
estimates of the random
variability in the data for
the main outcomes?
Yes No Yes Yes Yes Yes No No No No No No No Yes
Have all important
adverse events that may be
a consequence of the
intervention been
Yes Yes Yes Yes Yes Yes Yes No No No No No Yes Yes

172
reported?
Have the characteristics of
patients lost to follow-up
been described?
Yes No No Yes Yes Yes Yes NA NA NA NA NA No NA
Have actual probability
values been reported for
the main outcomes?
Yes Yes Yes Yes Yes Yes Yes Yes No No Yes Yes Yes Yes
Were the subjects asked to
participate in the
study representative of the
entire population from
which they were recruited?
Unclear Unclear Unclear Unclear Unclear Unclear Unclear Yes Unclea
r
Yes Yes Unclear Unclear Unclear
Were those subjects who
were prepared to
participate
representative of the entire
population from which
they were recruited?
Unclear Unclear Unclear Unclear Unclear Unclear Unclear Yes Unclea
r
Yes Yes Unclear Unclear Unclear
Were the staff, places, and
facilities where the
patients were treated,
representative of the
treatment the majority of
patients receive?
Yes Yes Yes Yes Yes Yes Yes Yes Yes Yes Yes Yes Yes Unclear
Was an attempt made to
blind study subjects to the
intervention they have
received ?
No No No No No No No No No No No No No No
Was an attempt made to
blind those measuring the
main outcomes of the
intervention?
Yes No No No No No No Unclear Yes No No No No Yes

173
If any of the results of the
study were based on “data
dredging”, was this made
clear?
Yes Yes Yes Yes Yes Yes Yes Yes Yes Yes Yes Yes Yes Yes
In trials and cohort
studies, do the analyses
adjust for different lengths
of follow-up of patients, or
in case-control studies, is
the time period between
the intervention and
outcome the same for
cases and controls ?
NA NA NA NA NA NA NA NA NA NA Yes NA NA NA
Were the statistical tests
used to assess the main
outcomes appropriate?
Yes Yes Yes Yes Yes Yes Yes Yes No Yes Yes Yes Yes Yes
Was compliance with the
intervention/s reliable?
Yes Yes Yes Yes Yes Yes Yes Yes Yes Yes Yes Yes Yes Yes
Were the main outcome
measures used accurate
(valid and reliable)?
Yes Yes Yes Yes Yes Yes Yes Yes Yes Yes Yes Yes Yes Yes
Were the patients in
different intervention
groups (trials and cohort
studies) or were the cases
and controls (case-control
studies) recruited from the
same population?
NA NA NA NA NA NA NA NA NA NA Yes NA NA NA
Were study subjects in
different intervention
groups (trials and cohort
studies) or were the cases
and controls (case-control
studies) recruited over the
same period of time?
No No No No No No No No No No Yes No No No

174
Were study subjects
randomized to intervention
groups?
No No No No No No No No No No Yes No No No
Was the randomized
intervention assignment
concealed from both
patients and health care
staff until recruitment was
complete and irrevocable?
NA NA NA NA NA NA NA NA NA NA Unclear NA NA NA
Was there adequate
adjustment for
confounding in the
analyses from which the
main findings
were drawn?
Unclear Unclear Yes Unclear Unclear No No Unclear Unclea
r
Unclear Unclear Unclear Unclear Unclear
Were losses of patients to
follow-up taken into
account?
NA NA NA NA NA NA NA NA NA NA NA NA No NA
Q27. Did the study have
sufficient power to detect a
clinically important effect
where the probability
value for a difference
being due to chance is
less than 5%?
Yes Yes Yes Yes Yes Yes Yes Yes Yes Yes Yes Yes Yes Yes
Total 16 13 16 16 15 13 14 13 9 12 17 11 12 13
NA: Not applicable

175
Appendix D: Cost-Effectiveness and Budget Impact Analysis
Search Strategy
MEDLINE March 10, 2017
1 embolism/ or pulmonary embolism/
2 thromboembolism/ (
3 thrombosis/
4 embolism, paradoxical/ or venous thromboembolism/
5 venous thrombosis/ or thrombophlebitis/ or upper extremity deep vein thrombosis/
6 (embolus or embolism?).tw.
7 thromboembolism?.tw.
8 (thrombosis or thrombosus or thromboses).tw.
9 (phlebothromboses or phlebothrombosis).tw.
10 (thrombophlebitis or thrombophlebitides).tw.
11 phlegmasia alba dolens.tw.
12 paget schroetter syndrome.tw.
13 or/1-12
14 Diagnosis/
15 di.fs. [Diagnosis]
16 sensitiv$.mp.
17 diagnos$.mp.
18 (predictive value or accurac$).mp.
19 "Sensitivity and Specificity"/
20 or/14-19
21 13 and 20
22 tomography/
23 magnetic resonance imaging/ or cholangiopancreatography, magnetic resonance/ or
diffusion magnetic resonance imaging/ or echo-planar imaging/ or magnetic resonance
angiography/ or magnetic resonance imaging, cine/
24 tomography, emission-computed, single-photon/ or cardiac-gated single-photon emission
computer-assisted tomography/
25 tomography, emission-computed/ or positron-emission tomography/ or tomography,
emission-computed, single-photon/ or cardiac-gated single-photon emission computer-assisted
tomography/
26 tomography, optical/ or tomography, optical coherence/
27 tomography, x-ray/ or tomography, x-ray computed/ or cone-beam computed tomography/
or spiral cone-beam computed tomography/ or four-dimensional computed tomography/ or
tomography, spiral computed/ or x-ray microtomography/
28 computed tomography.tw.
29 ((helical or spiral or multislice) adj5 tomography).tw.
30 spiral CT.tw.
31 or/22-30
32 13 and 31
33 Ultrasonography/
34 ((leg or compression) adj5 (ultrasound or ultrasonography)).tw.
35 Ultrasonography, Doppler/

176
36 us.fs. [Ultrasonography]
37 or/33-36
38 13 and 37
39 angiography/ or angiocardiography/ or angiography, digital subtraction/ or aortography/ or
cerebral angiography/ or cineangiography/ or coronary angiography/ or phlebography/ or
portography/
40 pulmonary angiography.mp.
41 or/39-40
42 13 and 41
43 ventilation perfusion scintigraphy.tw.
44 "Perfusion Imaging"/
45 myocardial perfusion imaging/
46 ri.fs. [Radionuclide Imaging]
47 ra.fs. [Radiography]
48 "V/P(SCAN)".tw.
49 MDCT.tw.
50 "V/P(PLANAR)".tw.
51 "V/Q".tw.
52 ((lung or ventilation or perfusion) adj5 scintigraphy).tw.
53 or/43-52
54 13 and 53
55 Clinical Laboratory Techniques/
56 "Diagnostic Techniques and Procedures"/
57 Fibrin Fibrinogen Degradation Products/
58 D-dimer.mp.
59 Biological Markers/
60 immunoassay/
61 fluoroimmunoassay/ or fluorescence polarization immunoassay/
62 immunoblotting/ or blotting, western/ or blotting, far-western/
63 immunochromatography/
64 immunoenzyme techniques/ or enzyme-linked immunosorbent assay/ or enzyme-linked
immunospot assay/ or enzyme multiplied immunoassay technique/
65 immunosorbent techniques/
66 radioallergosorbent test/ or radioimmunoprecipitation assay/ or radioimmunosorbent test/
67 radioimmunoassay/ or immunoradiometric assay/
68 ELISA.tw.
69 or/55-68
70 13 and 69
71 ((Well$2 or Geneva) adj3 (score? or criteria or method?)).tw.
72 clinical probability.tw.
73 probability assessment.mp.
74 or/71-73
75 13 and 74
76 exp economics/
77 quality of life/
78 value of life/

177
79 quality-adjusted life years/
80 models, economic/
81 markov chains/
82 monte carlo method/
83 decision tree/
84 economic$.tw.
85 ec.fs.
86 (cost? or costing? or costly or costed).tw.
87 (price? or pricing?).tw.
88 (pharmacoeconomic? or (pharmaco adj economic?)).tw.
89 budget$.tw.
90 expenditure$.tw.
91 (value adj1 (money or monetary)).tw.
92 (fee or fees).tw.
93 "quality of life".tw.
94 qol?.tw.
95 hrqol?.tw.
96 "quality adjusted life year?".tw.
97 qaly?.tw.
98 cba.tw.
99 cea.tw.
100 cua.tw.
101 markov$.tw.
102 (monte adj carlo).tw.
103 (decision adj2 (tree? or analys$ or model$)).tw.
104 utilit$.tw.
105 ((clinical or critical or patient) adj (path? or pathway?)).tw.
106 (managed adj2 (care or network)).tw.
107 or/76-106
108 13 and 20 and 107
109 13 and 31 and 107
110 13 and 37 and 107
111 13 and 41 and 107
112 13 and 53 and 107
113 13 and 69 and 107
114 13 and 74 and 107
115 or/108-114
116 comment/ or editorial/ or letter/
117 115 not 116
118 limit 117 to yr="1990 -Current"
119 limit 118 to English language
120 limit 119 to humans
121 119 not 120
122 from 121 keep 7,12,15-16,18,23,29,36
123 120 or 122 [English]
124 118 not 119 [Non-English]