computer analysis of the dead sea scroll manuscriptsnachumd/papers/tamar.pdf · abstract the dead...
TRANSCRIPT

TEL AVIV UNIVERSITYRAYMOND AND BEVERLY SACKLER
FACULTY OF EXACT SCIENCESBLAVATNIK SCHOOL OF COMPUTER SCIENCE
Computer Analysis of the Dead SeaScroll Manuscripts
Thesis submitted in partial fulfillment of the requirements for the M.Sc.degree in the School of Computer Science, Tel Aviv University
by
Tamar Lavee
The research for this thesis has been carried out at Tel Aviv Universityunder the supervision of Prof. Nachum Dershowitz
September 2013

AbstractThe Dead Sea Scrolls were discovered in the Qumran area and elsewhere in the Judeandesert beginning in 1947 and were photographed in infrared during the 1950s. Recently,the Israel Antiquities Authority embarked on an ambitious project to digitize all thefragments using multi-spectral cameras and make them available on-line.
The use of computerized tools to investigate images of historical documents has beenshown to produce significant contributions in the historical study of the Cairo Genizahand many other collections. Such tools may contribute to the resolution of open questionsrelated to research on the scrolls, such as who wrote the scrolls, and to facilitate piecingtogether the fragments of the scrolls.
This work deals with initial steps of image processing of the scrolls, focusing on twomain problems: image binarization and character recognition. We developed two methodsof obtaining high quality binary images of the scrolls. The first method is based on themulti-spectral images taken at different wavelengths. We show that the use of differentwavelength of the same image allows us to produce a more informative binary image. Thesecond method combines the results of several binarization methods to build an accurateclassifier that separates between the text and the background of the fragments.
Finally, we adapt a keypoint detection method based on the identification of con-nected components in the image, to locate the letters in the images. We use a characterspotting technique to search for a given query letter within these keypoints. This tech-nique extracts features from the image that are shown to differentiate between Hebrewcharacters, and uses a Dynamic Time Warping algorithm to compare different features ofletters. We show that this approach is capable of distinguishing between different scriptsof the scrolls, and thus, it may by used to identify fragments written by the same hand.


Contents
1 Introduction 6
2 Multispectral Image Binarization 82.1 Background . . . . . . . . . . . . . . . . . . . . . . . . . . . . . . . . . . 82.2 Preprocessing Steps . . . . . . . . . . . . . . . . . . . . . . . . . . . . . . 82.3 Binarization Method . . . . . . . . . . . . . . . . . . . . . . . . . . . . . 102.4 Experiments and Results . . . . . . . . . . . . . . . . . . . . . . . . . . . 10
3 Combining Binarization Methods 143.1 Background . . . . . . . . . . . . . . . . . . . . . . . . . . . . . . . . . . 143.2 Binarization Methods . . . . . . . . . . . . . . . . . . . . . . . . . . . . . 143.3 Keypoint Detection and Clustering . . . . . . . . . . . . . . . . . . . . . 163.4 Evaluation of Binary Result . . . . . . . . . . . . . . . . . . . . . . . . . 183.5 Combination by Clustering Score . . . . . . . . . . . . . . . . . . . . . . 183.6 Iterative Combination of Binarization Methods . . . . . . . . . . . . . . . 203.7 Confidence Based Combination . . . . . . . . . . . . . . . . . . . . . . . 20
4 Character Spotting 244.1 Background . . . . . . . . . . . . . . . . . . . . . . . . . . . . . . . . . . 244.2 Feature Extraction . . . . . . . . . . . . . . . . . . . . . . . . . . . . . . 254.3 Matching algorithm . . . . . . . . . . . . . . . . . . . . . . . . . . . . . . 254.4 Experiments and Results . . . . . . . . . . . . . . . . . . . . . . . . . . . 264.5 Applications . . . . . . . . . . . . . . . . . . . . . . . . . . . . . . . . . . 28
5 Conclusions and Further Research 32
4


Chapter 1
Introduction
The Dead Sea Scrolls were written between the third century bce and the first ce, andwere discovered in the Qumran area and elsewhere in the Judean desert beginning in1947. These fragmentary documents have taught the world a great deal about Jewishhistory in the late Second Temple period and about sectarian Judaism, and they haveprovided much background knowledge relevant to the birth of Christianity. In addition,the Dead Sea Scrolls have enhanced our understanding of the textual transmission of theBible. Following their discovery, all the scrolls were photographed using infrared (IR)film and Kodak filters [1].
The Israel Antiquities Authority, in collaboration with Google, Inc., has recently em-barked on an ambitious project to digitize all the fragments using multi-spectral camerasand make the images available on the Internet [2]. As a result, scholars will soon be facedwith thousands of fragmentary documents, but without computer aids that would makeit possible to find sought-after needles in a proverbial haystack of on-line images. Theproblems are even more acute since optical character recognition does not provide qualitysearchable texts for such historical documents.
This work deals with initial steps of image processing of the scrolls, focusing on twomain problems: image binarization and character recognition. These are essential stepsin many possible applications and techniques that will enable further exploration of theseimages, such as OCR, palaeographic classification, joins identification and more.
Image binarization is the process of separating the foreground, namely, the text, fromthe background, providing a black-and-white binary image. This is an essential stage ofevery document image-processing system. In images of historical manuscripts such as thescrolls this is a very challenging task, as degradation and different kinds of damage leadto variability both in the background and in the foreground. Many methods have beensuggested to binarize non-uniform document images ([3, 4]). Other methods have beenproposed to solve typical problems of historical documents ([5, 6]). In this work we inves-tigate the results of known binarization methods on the Dead Sea scrolls, and we proposedifferent methods of combinations between the different algorithms. Another suggestedapproach is to use the information captured in images taken in different wavelength, asare available for the scrolls.
After obtaining a binary image, the next step is to identify the characters in the image.In [7], a method has been suggested to detect Hebrew letters in the Cairo Genizah, basedon the fact that in Hebrew script, the letters are not connected. We apply this method
6

and adapt it to the images of the scrolls, and use the obtained information in orderto improve the binarization result. We use the achieved keypoints as candidates for acharacter spotting algorithm, aiming to identify the correct letter in the keypoint, andto distinguish between the different scripts of the fragments.
The structure of the thesis is as follows. In Chapter 2 we investigate the multi-spectralimages and their ability to provide an accurate binary image. Chapter 3 deals with theassessment of the different binarization methods and their combination. In Chapter 4,we apply a character spotting technique and show how it can be used for further researchof the Dead Sea Scrolls manuscripts.
7

Chapter 2
Multispectral Image Binarization
2.1 BackgroundAs part of the recent preservation efforts, all the fragments of the Dead Sea Scrolls arebeing photographed with high resolution multi-spectral cameras. It has long been knownthat infrared imaging dramatically improve legibility of scrolls that are impossible to readwith the naked eye [1]. In this chapter we investigate whether the multi-spectral imagesin different wavelengths may be utilized to achieve a more accurate binary image, onein which the letters are well identified and the variability in the background has littleinfluence on the result.
For each fragment of the scrolls we have photographs taken at 12 different wavelengths,between 445nm and 924nm (see Figure 2.1). The illumination is identical in all the 12images and they are perfectly aligned.
When examining the different images, it is clear that the higher the wavelength, thehigher the image contrast. This observation was verified by Faigenbaum et al [8], whoshowed that the image taken at 924nm is the image with the highest contrast among theavailable images. Therefore, when choosing a single image to use in order to achieve abinary output, this would be the natural choice. However, we assume that the differentwavelength images together contain more information than any one alone. The imageswere combined as part of the binarization process of the scrolls. The binarization isperformed using an SVM classifier, where the features of each pixel are its grayscalevalues in the images of the different wavelength. The following sections describe indetails the preprocessing steps, the binarization method, and the results obtained inseveral experiments.
2.2 Preprocessing StepsAll the images of the scrolls contain the scroll fragment located in the center, as well as acolor ruler and an identification tag in the margins. The fragment is fixed by tape, whichis also used in some cases to hold several fragment pieces assembled together. Thesefeatures can be seen in the images of Figure 2.1.
Prior to the binarization step, all these objects were removed and the parchment areawas identified by means of the following process:
8
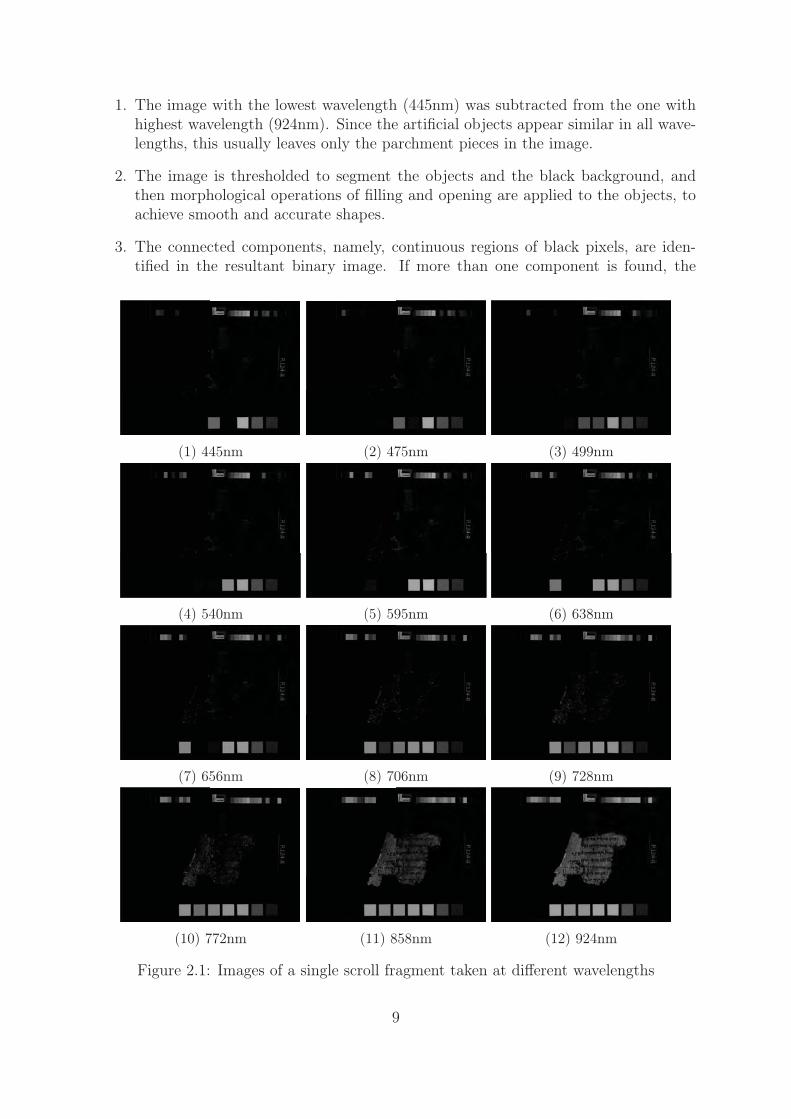
1. The image with the lowest wavelength (445nm) was subtracted from the one withhighest wavelength (924nm). Since the artificial objects appear similar in all wave-lengths, this usually leaves only the parchment pieces in the image.
2. The image is thresholded to segment the objects and the black background, andthen morphological operations of filling and opening are applied to the objects, toachieve smooth and accurate shapes.
3. The connected components, namely, continuous regions of black pixels, are iden-tified in the resultant binary image. If more than one component is found, the
(1) 445nm (2) 475nm (3) 499nm
(4) 540nm (5) 595nm (6) 638nm
(7) 656nm (8) 706nm (9) 728nm
(10) 772nm (11) 858nm (12) 924nm
Figure 2.1: Images of a single scroll fragment taken at different wavelengths
9

parchment is identified as the one that contains the image’s central pixel.
All the steps described below were conducted using the masked image achieved bythe above steps.
2.3 Binarization MethodThe different wavelengths are combined to achieve a binary image by the followingmethod:
1. The baseline for each fragment is the result of Sauvola’s method [3] on the singlehighest wavelength (924nm).
2. Given k different wavelengths (1 ≤ k ≤ 12), we train an SVM classifier using anequal number of foreground and background pixels. The features of each pixel areits gray-scale values in the k different images, scaled to the range [0, 1]. The labelof each pixel is its value in the baseline binary image.
3. The achieved SVM model is used to classify every pixel in the image as foregroundor background, according to its k features. The obtained image is our binary result.
We used LIBSVM [9] code (for Matlab) to create the SVM model and classify.
2.4 Experiments and ResultsThe method described above was applied to different combinations of wavelengths in orderto evaluate the contribution of each of the images to the desired result of an accuratebinary image. To evaluate the output obtained from different combinations, manually-made ground-truth binary images are used, and the following measures are calculated:
Stotal The fraction of pixels that were correctly classified as foreground or background.
Sfg The success rate on the foreground area, namely, the fraction of the foreground thatwas correctly classified.
Sbg The success rate on the background area, namely, the fraction of the backgroundthat was correctly classified.
To analyze the contribution of different wavelengths, we performed three differentexperiments. The data set included 18 fragments, each containing images of 12 differentwavelengths and a ground-truth binary image. First, each wavelength was used in theabove scheme as a single reference. Table 2.1 shows the average scores obtained for eachof the wavelengths separately. The results show, as expected, that the high wavelengthsproduce better results than the lower ones. Additionally, the scores show that while theforeground is well detected in all of the images, the challenging task is the correct identi-fication of the background. In the lowest wavelengths, which are very dark, almost all ofthe pixels are classified as black, as reflected by the very high foreground success and low
10

Stotal Sfg Sbg
445nm 0.145 0.965 0.091475nm 0.172 0.959 0.119499nm 0.201 0.959 0.151540nm 0.323 0.949 0.283595nm 0.510 0.935 0.483638nm 0.644 0.940 0.627656nm 0.753 0.933 0.744706nm 0.902 0.937 0.901728nm 0.933 0.939 0.933772nm 0.955 0.943 0.956858nm 0.965 0.950 0.966924nm 0.964 0.953 0.965
Table 2.1: Average binarization scores of single wavelengths.
background success. As the wavelength increases, the foreground detection significantlyimproves.
In the second experiment, the effect of incrementally adding and removing each wave-length is tested. First, the model is trained with groups of increasing size, starting withthe lower wavelength, and adding a single wavelength at a time up to the whole group of12 images. The results obtained in this experiment are shown in Figure 2.2a. The plotshows that adding each wavelength increased the success of background identification,and the most significant improvement occurred up to the 8th wavelength. The highestscore in this experiment was the score for all wavelengths, with average total success of0.97. Second, the effect of removing each wavelength is tested by starting with all of thewavelengths, and then removing the lowest one in each step. The results are shown in
(a) (b)
Figure 2.2: Binarization scores of different groups of wavelengths. The wavelengths arenumbered from 1 to 12, in increasing order. In (a), each wavelength is added incremen-tally, starting with the lowest wavelength. In (b), in each step the lowest wavelength isremoved, starting with the group of all 12 wavelengths.
11

Figure 2.2b. While all of the groups obtained high scores, the plot shows that removinga few of the lowest wavelengths increased the success rate, especially due to better fore-ground identification. The highest average success of 0.9714 was obtained both by thegroups of the highest 10 and of the highest 8 wavelengths.
The results above show that combining multiple wavelengths yields better accuracy ofthe binary image. However, it is questionable whether the whole group of 12 wavelengthsis necessary to obtain this result, since figure 2.2a shows that the improvement is lesssignificant when adding the highest three wavelengths, and figure 2.2b shows that not allof the lower wavelengths are required.
Since testing all the possible groups of wavelengths is not feasible, the final experimentwas to perform feature selection for the SVM model to find which wavelengths bestpredict the ground truth binary image. This was done using a sequential feature selection,performed on a sample of pixels of each fragment in the data set of 18 fragments. The18 groups of selected wavelengths contained between 1 to 7 wavelengths, with an averageof 3.3 wavelengths. Figure 2.3 shows the number of times each wavelength was selected.The most common wavelengths are the two highest wavelengths and the lowest one, andall groups contained at least one of the three highest wavelengths. These result confirmthe assumption that using all wavelengths is redundant and that the higher wavelengthsare the major contributors to the result, but once one or two of the highest wavelengthswere chosen, we may get more from adding a lower one than from adding another highone. Hence, an optimal set of wavelength for image binarization of the scrolls shouldinclude wavelengths 1,11 and 12. Such a set will provide both accurate and informativeresult and an efficient solution.
Figure 2.3: Feature selection results for the 12 different wavelengths. The plot shows thenumber of times each wavelength was selected in the set of experiments.
12


Chapter 3
Combining Binarization Methods
3.1 BackgroundMany binarization methods have been suggested to approach the typical problems ofhistorical or damaged documents. In such documents, global methods like Otsu’s thresh-olding [10], usually perform poorly, since tears, stains, and ink fading lead to high vari-ation within one fragment. A global threshold fails to capture all the details, and theoutcome contains many black regions that do not represent the document’s foreground.The results of local methods like Sauvola’s may suffer from the opposite problem: sincethey only consider the local neighborhood of each pixel, the variation within the letterscaused by a damaged parchment or by ink fading leads to under-recognition of letters.
The scroll images are of varying quality: some fragments are highly damaged, whileothers are well-conserved. The fragments have gone through different kinds of deteriora-tion: tears, stains, and ink fading are very common. As a result, the different availablemethods produce varying results on the scroll images, as each algorithm is designed tosolve a particular problem.
In this section, we consider the results of several state-of-the-art binarization methodson the images of the scrolls, and we suggest a few methods of combining their results.Two approaches are suggested: First, combining the different binarizations by optimizingthe result of the next step: the identification of the letters in the image. This step iscommon to many document image-processing applications that may follow, such as OCRand palaeographic classification. The second approach obtains continuous value for eachpixel , representing how confident each method is in its decision, and uses this value tobuild a more accurate classifier.
3.2 Binarization MethodsThis section describes the different binarization methods used in this chapter. The inputfor all of the methods (except for the multi-spectral method) was the single image of thehighest wavelength. The binarization is done only on the parchment area of the image,which was extracted by the pre-processing steps described in Section 2.2.
14
Otsu
Otsu [10] thresholding computes a single threshold which separates between the twoclasses, the background and the foreground. This is done by searching for the thresholdthat maximizes the relation between the within-class variance and the between-classvariance of the two classes.
Sauvola
Sauvola algorithm [3] defines a different threshold for each pixel. A sample of pixels inthe image is defined as the base pixels, for which the threshold is calculated directly, andthe threshold for the non-base pixels is interpolated from the nearest base pixels. Thethreshold for a base pixel (x, y) is calculated as follows:
T (x, y) = m(x, y)
[1 + k
(s(x, y)
R− 1
)]
where m(x, y) is the mean of gray level among the pixel’s neighborhood, s(x, y) is thelocal standard deviation, and R is the standard deviation range (usually set to 128). Theparameter k is positive and usually defined to be in the range 0.2–0.5. In a high contrastregion, s(x, y) ≈ R, so T (x, y) ≈ m(x, y). When the contrast is low, T (x, y) < m(x, y),that is, the threshold is set to a darker gray level.
Bar-Yosef
Bar-Yosef et al. [6] developed a multi-staged binarization method, addressing the specificproblems of Hebrew historical documents. A global threshold is applied to achieve aninitial binary image, followed by an evaluation procedure of each connected componentin these image. This is done by considering the seed image of each letter, comprisedof its darker pixels. Characters that are identified as noisy are iteratively refined byre-classifying the pixels in the local neighborhood of the seed image.
Su
Su et al. [5] introduced a binarization technique that makes use of the high-contrastregions in the image. First, the high-contrast pixels are located based on the minimumand maximum of the pixel’s neighborhood, and a contrast image is built, in which onlythe high-contrast pixels are black. The high-contrast pixels usually lay around the textstroke boundaries. The image is then segmented using local thresholds that are estimatedfrom the detected high-contrast pixels within a local neighborhood window: each pixel isclassified according to the number of high-contrast pixels surrounding it, and accordingto its intensity relative to that of the high-contrast neighbors.
Faigenbaum
Faigenbaum et al. [11] developed a simple method in order to binarize images of ostraca.Given manually marked regions of background and foreground, the grayscale histogramof each class is calculated. Each pixel is assigned to the class in which its value is mostcommon.
15

Instead of manually selecting foreground and background regions, we used a sampledset of text and background pixels from Sauvola’s result.
Multi-spectral
This is the multi-spectral SVM classifier described in Chapter 2, trained with the fourhighest wavelengths.
Table 3.1 shows the average scores obtained by the different methods on a set of 24fragments of the scrolls, for which we prepared ground-truth binary images. On thisimage set, contrary to the different wavelengths results in Table 2.1, the main difficultyseems to be text identification. The reasons for this are the use of only one wavelengthand the fact that this set includes more images, some of them containing very fadedletters.
Stotal Sfg Sbg
Otsu 0.965 0.882 0.971Sauvola 0.972 0.778 0.987Bar-Yosef 0.960 0.920 0.963Su 0.967 0.810 0.980Faigenboum 0.951 0.851 0.959Multispectral 0.964 0.900 0.970
Table 3.1: Average binarization scores of the different binarization methods.
3.3 Keypoint Detection and Clustering
3.3.1 Keypoint Detection
The first step in the identification process is calculating the physical measurements ofthe text lines of each fragment: the height of the lines and the space between the lines.These parameters are calculated using the same method used on the Genizah documents[12], based on the Hough transform of the image. However, in contrast to the Genizahdocuments, the scrolls contain very small fragments, many of them with very few letters.On such pieces, this method fails to identify the lines, since it assumes that the fragmentscontain several relatively straight and uniform lines of text.
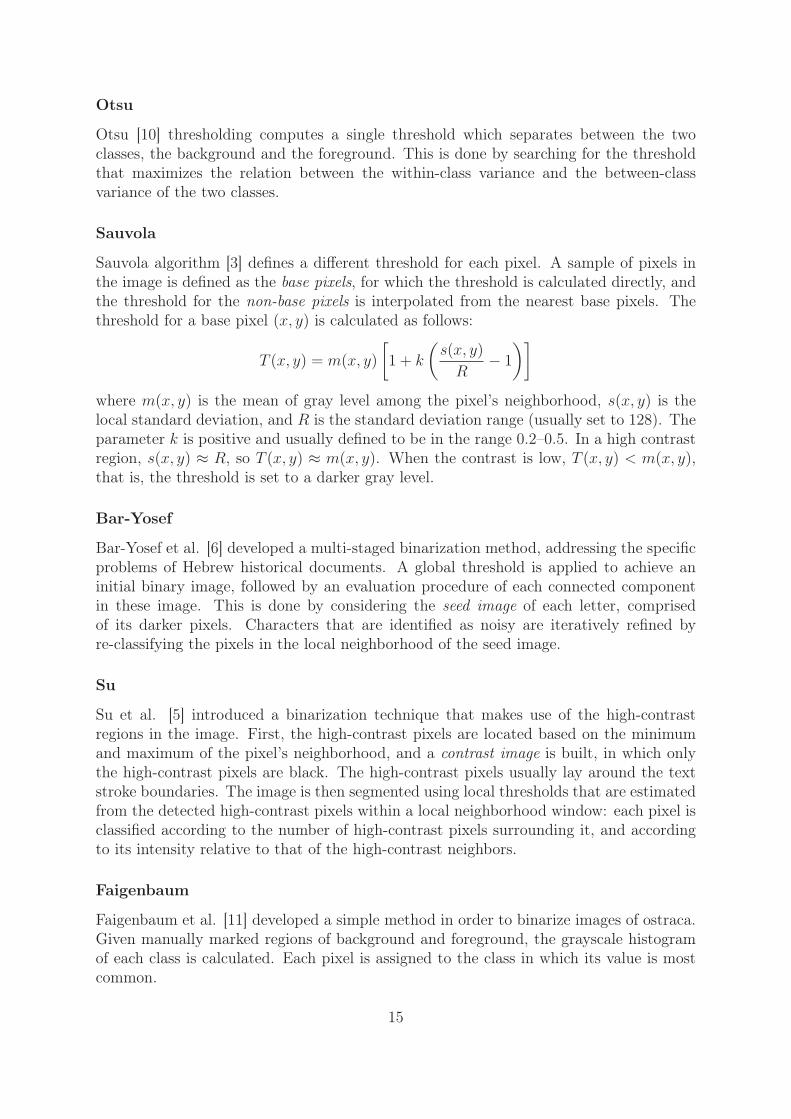
Therefore, we used the fact that the scrolls were divided by scholars into plates, andthe fragments that are grouped together on a plate are assumed to originate from thesame scroll and should have common characteristics. The fragments were divided intotwo groups: big fragments, which contain several lines of text, and small fragments, inwhich text lines cannot be identified (see Figure 3.1). First, the physical measurement ofthe big fragments were calculated using the above method. Then, for the small fragments,the measurements were defined to be the average of the values measured for all the bigfragments in the same plate.
The keypoint detection method uses the fact that, in Hebrew writing, letters areusually separated. First, the connected components (CC) of the binarized images are
16
calculated. To filter out fragmented letter parts and fragments arising from stains andborder artifacts, we compare the size of the CC to the height of the lines that wasestimated in the previous step. Each keypoint frame is encoded to a single vector using theSIFT descriptor [13], which encodes histograms of gradients. The scale of each detectedkeypoint is taken as the maximum dimension of the associated CC.
Figure 3.1: An example of a plate (manuscript 4Q393) containing three large fragmentsand six small ones
3.3.2 Keypoint Clustering
The next step is to cluster the obtained group of descriptors, in order to build a dictionaryof all the letters in the fragment. As before, this is an impossible task when we deal withfragments that contain very few letters. Thus, instead of performing the clustering onthe fragment level, we perform the clustering on the plate level, obtaining a separatedictionary of the letters for all the fragments on the same plate.The descriptors of each plate are clustered using the k-means method with Euclideandistance, with k = 50. To select the right value of k, we tested the results of differentvalues, between 15 − 105, and compared the sum of distances between the descriptorsand their clusters’ centroids. The sum of distances is expected to decrease as k increases,but around the value of 50 the decrease slows down. Therefore, k = 50 was chosen as theoptimal value.
17

3.4 Evaluation of Binary ResultHaving in mind the goal of the next step – achieving a dictionary of letters by clusteringthe keypoints - we aim to evaluate the output of the different binarization algorithmsby evaluating the clusters extracted from the binary images. A good clustering resulthas high intra-cluster similarity (letter descriptors within a cluster are similar) and lowinter-cluster similarity (descriptors from different clusters are dissimilar). In our case,high intra-cluster similarity indicates that each cluster indeed represents a single letter,and low inter-cluster similarity indicates that the clusters represent different letters. Thepresence of noise in the binary image, caused by stains, tears, and broken letters, thatare mistakenly recognized as keypoints, is expected to lead to poor results in the senseof these two characteristics. We compared three different measures that formalize thesetwo goals:
1. Davies-Bouldin index (DB) [14]: Suppose we have N clusters. For each clusterCi, let Si be the average of the Euclidean distances between the elements of Ci andtheir centroid. For each pair of clusters Ci, Cj, let Mi,j be the distance between theircentroids. For every i, j we define Ri,j =
Si+Sj
Mi,jas a measure for the quality of the
separation between the two clusters, and for each cluster Ci, let Di = maxj:i �=j Ri,j.Then the DB index is defined as:
DB =1
N
N∑i=1
Di
2. The ratio (R) between the intra-cluster and the inter-cluster similarity. Let Sbe the average of the intra-cluster distances, that is, using the notations above,S̄ = 1
N
∑Ni=1 Si, and let M be the average inter-cluster similarity, M = 1
N
∑Ni=1 Mi.
Then the ratio measure is:
R =S
M
3. The mean distance (M) between every descriptor and its cluster’s centroid.This measures only the intra-cluster similarity of all clusters. Assuming there aren samples, let ak be the distance between the k’th sample and the centroid of thecluster it is assigned to. Then the score is:
M =1
n
n∑k=1
ak
3.5 Combination by Clustering Score
3.5.1 Method Outline
In a given fragment, for each pixel we have a decision – black or white - from eachexpert (binarization method), and each expert has a clustering score as calculated for
18

the particular fragment. The naive way of combining the methods would be to choosethe majority vote for each pixel. Using the score of the clustering result, we can use theweighted votes of the experts. Thus, for each pixel x, y we calculate the sum:
Sx,y =k∑
i=1
wi · di
where k is the number of experts, di is the decision made by the i’th expert (−1 forbackground, 1 for foreground), and wi is the clustering score, normalized to the range[0, 1]. We assign the value according to the majority, that is:
B(x, y) =
{1 if Sx,y > 0
−1 otherwise
3.5.2 Experiments and Results
The above method was applied to a set of 230 fragments, from 15 different plates. Thethree measures described in section 3.4 were tested separately as the weights of thebinarization methods. The simple combination by majority vote was also tested. Table3.2 shows the average clustering scores obtained by the different methods and by the fourcombinations. Overall, the scores do not seem to improve in the different combinations,compared to the individual methods, and there is little difference between the differentcombinations. However, in many cases, the keypoint detection in the combined imagesprovides a higher detection rate of the characters in the image, as can be seen in Figure3.2.
Ot. Sa. BY Su Fai. Mul. SimpleComb.
DBComb.
RComb.
MComb.
DB 1.64 1.64 1.67 1.65 1.72 1.61 1.72 1.73 1.65 1.72R 0.51 0.54 0.54 0.52 0.59 0.55 0.65 0.64 0.55 0.65M 72.2 69.3 73.5 69.9 72.0 69.9 72.7 73.1 72.9 72.8
Table 3.2: Average clustering scores obtained by individual binarization methods and thedifferent combinations.
(a) (b) (c) (d)
Figure 3.2: Keypoints detected in different binary images: Otsu (a), Sauvola (b), Bar-Yosef (c) and the R-combination result (d). While in the individual methods not all thecharacters are recognized, the combination led to a better recall of the letters.
19

3.6 Iterative Combination of Binarization MethodsThe method described below considers the quality of the clustering with regard to eachletter descriptor separately. The best binary result of a single letter is the one that makesit closest to the centroid of the cluster it belongs to. Thus, we try to optimize the achievedresult by selecting for each letter individually its best binary representation. This is donein an iterative manner, by the following steps:
1. Separately, for each binary image, the keypoints (candidate letters) are detected.Then, a single set of keypoints is built for each fragment by merging the keypointsfrom all of the binary images. If the overlap between two keypoints spans morethan 90% of their area, only one of them is taken.
2. The obtained keypoints are clustered to achieve the representative letters (the clus-ters’ centroids). This is done on the plate level, for each binary method separately.
3. For each keypoint, the best binarization method is selected locally according to theobtained clusters. The best method is the one that makes the keypoint closest toits centroid.
4. The image keypoints of the new combined image are detected.
5. We go back to 2.
After applying the first iteration, the achieved results seem to be cleaner of noisecaused by tears and stains, since detected keypoints in these areas belong to less cohesiveclusters. However, parts of the characters also disappear in the binary output, probablyfor the same reason. This leads to even lower success in the second iteration, which isbased on keypoint detection performed on the output of the first iteration. In the future,we suggest trying a different measure for the success of a binarization method for eachkeypoint, perhaps using the results of the character spotting method described in Chapter4.
3.7 Confidence Based Combination
3.7.1 Method outline
This method uses the output of different binarization methods to classify each pixelseparately, considering how confident each expert is in its decision. For each pixel, insteadof a binary value (−1 or 1), we extract a continuous value, between −1 and 1,where −1means it is a background pixel and 1 means it is foreground. This value is the confidencevalue, and the closer it is to one of the ends, the more confident the method is with theclassification of the pixel. After achieving a confidence value for each method, a two-stepSVM model is built in the following way:
1. An auxiliary SVM model is trained for each method, where each pixel in the sampledset is represented by the method’s confidence value, and the output is the method’sdecision for this pixel.
20
2. For each method, each pixel is classified using the trained SVM, and its confidencelevel is extracted, namely, the signed distance of the pixel from the supportingvector (negative for pixels classified as −1, positive otherwise).
3. An SVM classifier is trained, where the features of each pixel are the differentconfidence measures obtained from the previous step. The labels are taken from abinary outcome of a method that is not included in the combination.
4. The combined model is applied to each pixel, to achieve the binary image.
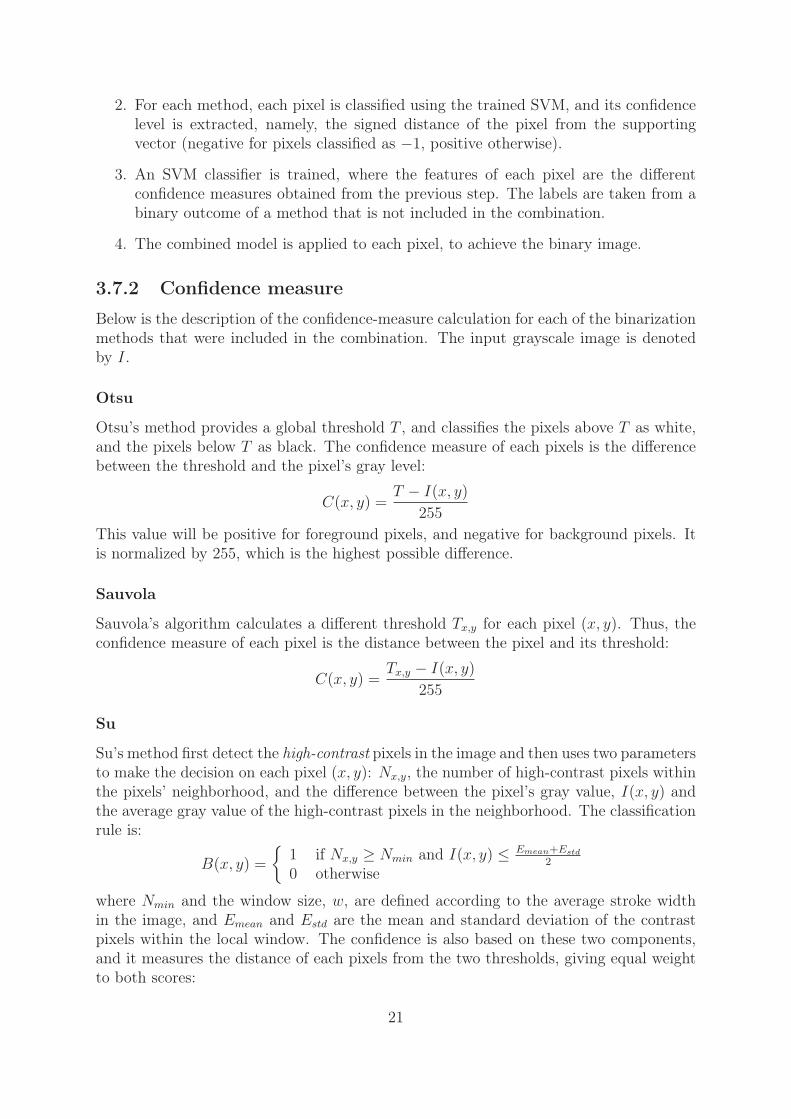
3.7.2 Confidence measure
Below is the description of the confidence-measure calculation for each of the binarizationmethods that were included in the combination. The input grayscale image is denotedby I.
Otsu
Otsu’s method provides a global threshold T , and classifies the pixels above T as white,and the pixels below T as black. The confidence measure of each pixels is the differencebetween the threshold and the pixel’s gray level:
C(x, y) =T − I(x, y)
255
This value will be positive for foreground pixels, and negative for background pixels. Itis normalized by 255, which is the highest possible difference.
Sauvola
Sauvola’s algorithm calculates a different threshold Tx,y for each pixel (x, y). Thus, theconfidence measure of each pixel is the distance between the pixel and its threshold:
C(x, y) =Tx,y − I(x, y)
255
Su
Su’s method first detect the high-contrast pixels in the image and then uses two parametersto make the decision on each pixel (x, y): Nx,y, the number of high-contrast pixels withinthe pixels’ neighborhood, and the difference between the pixel’s gray value, I(x, y) andthe average gray value of the high-contrast pixels in the neighborhood. The classificationrule is:
B(x, y) =
{1 if Nx,y ≥ Nmin and I(x, y) ≤ Emean+Estd
2
0 otherwise
where Nmin and the window size, w, are defined according to the average stroke widthin the image, and Emean and Estd are the mean and standard deviation of the contrastpixels within the local window. The confidence is also based on these two components,and it measures the distance of each pixels from the two thresholds, giving equal weightto both scores:
21
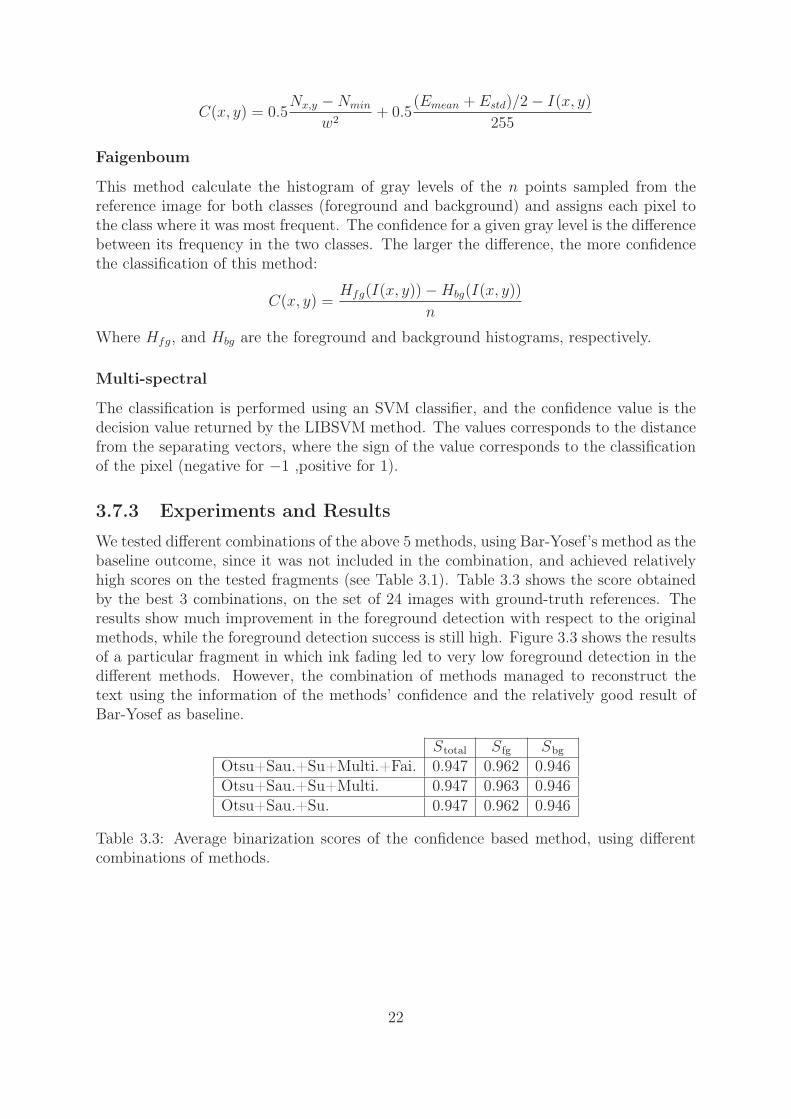
C(x, y) = 0.5Nx,y −Nmin
w2+ 0.5
(Emean + Estd)/2− I(x, y)
255
Faigenboum
This method calculate the histogram of gray levels of the n points sampled from thereference image for both classes (foreground and background) and assigns each pixel tothe class where it was most frequent. The confidence for a given gray level is the differencebetween its frequency in the two classes. The larger the difference, the more confidencethe classification of this method:
C(x, y) =Hfg(I(x, y))−Hbg(I(x, y))
n
Where Hfg, and Hbg are the foreground and background histograms, respectively.
Multi-spectral
The classification is performed using an SVM classifier, and the confidence value is thedecision value returned by the LIBSVM method. The values corresponds to the distancefrom the separating vectors, where the sign of the value corresponds to the classificationof the pixel (negative for −1 ,positive for 1).
3.7.3 Experiments and Results
We tested different combinations of the above 5 methods, using Bar-Yosef’s method as thebaseline outcome, since it was not included in the combination, and achieved relativelyhigh scores on the tested fragments (see Table 3.1). Table 3.3 shows the score obtainedby the best 3 combinations, on the set of 24 images with ground-truth references. Theresults show much improvement in the foreground detection with respect to the originalmethods, while the foreground detection success is still high. Figure 3.3 shows the resultsof a particular fragment in which ink fading led to very low foreground detection in thedifferent methods. However, the combination of methods managed to reconstruct thetext using the information of the methods’ confidence and the relatively good result ofBar-Yosef as baseline.
Stotal Sfg Sbg
Otsu+Sau.+Su+Multi.+Fai. 0.947 0.962 0.946Otsu+Sau.+Su+Multi. 0.947 0.963 0.946Otsu+Sau.+Su. 0.947 0.962 0.946
Table 3.3: Average binarization scores of the confidence based method, using differentcombinations of methods.
22

(a) Original image (b) Bar-Yosef (c) Otsu (d) Sauvola
(e) Su (f) Faigenboum (g) Multispectral (h) Combination
Figure 3.3: Results of the different binarization methods: (a) is the input grayscalefragment; (b) is Bar-Yosef’s result, which was used as baseline; (c)–(g) are the output ofthe different methods, and (h) is the result of the combination of all five methods.
23

Chapter 4
Character Spotting
4.1 BackgroundSearching for a letter or a word in historical documents is a challenging task. Traditionaloptical character recognition (OCR) methods do not perform well on such documents,as degradation and different kinds of damages lead to broken and smeared characters,holes, and other artifacts. As an alternative to OCR, a word spotting technique wasproposed [15]. The main idea of word spotting is that the search is performed on theimages without converting them to textual representation. The goal is to find all thesub-images in the document image that are similar to the given query image.
Character searching in the Dead Sea Scrolls is challenging due to some unique featuresof this data set. First, the Scrolls are written in a Hebrew alphabet, which is characterizedby a high similarity among letters. Second, since many fragments are damaged anddegenerated, characters frequently appear broken or partial. Finally, the scrolls werewritten by many different authors and contain a variety of handwritings, as well as specialscribal markings, some of which are of unknown meaning.
Instead of searching the whole fragment, we use the detected keypoints obtained bythe method described in Chapter 3.3.1 as candidate characters, and we try to match eachone of them the query character. We use a Dynamic Time Warping algorithm, which wasproved effective in similar word spotting tasks [16]. The main advantage of this algorithmis the ability to measure the similarity between images of varying size. This is importantsince the scrolls were written by hand, so the size of the characters is not uniform evenwithin the same fragment.
In [17], different column features were suggested to identify a query word. Rabaev etal. [18] presented special features that deal with the special characteristics of the Hebrewscript. We tested the usability of a set of similar features on the scrolls, using themboth as column and row features. We also tested the matching of partial letters, aimingto achieve better recall of relevant characters. We suggest a few applications of thismethod that in the future may facilitate the recognition of joins and the identification ofthe period in which a fragment was written. Additionally, the character spotting can beextended to a word spotting technique, and it can be used as part of an OCR mechanism.
24

4.2 Feature ExtractionThe algorithm measures the similarity between a set of features extracted for the queryand the candidate letter. The features are extracted for each column of pixels in theimage. The following features were tested:
1. Projection profile (PP): the number of black pixels in the column.
2. Upper/Lower character profile (UP/LP): the location of the upper/lower black pixel
3. Transition profile (TP): The number of transitions between background and fore-ground pixels in the column.
4. The distance between the upper and lower boundaries of the column (DULP).
As opposed to word spotting, when matching a single character, the row profile may beas informative as the column profile. Thus, for each candidate, the above features wereextracted twice, once for the columns and once for the rows (applied to the transposedimage). Figure 4.1 demonstrate the different column features.
Figure 4.1: The column features extracted for each letter
4.3 Matching algorithmGiven a query character and a candidate character, the feature vectors of both of themare compared using a Dynamic Time Warping algorithm (DTW). The DTW methodperforms a non-linear sequence alignment, which is suitable for handwritten text, inwhich we expect to find variation in size even within instances of the same letter.
Each character is represented by a set of m d-dimensional vectors, where m is thewindow width and d is the number of features. Given two character windows, A and B,the DTW matching algorithm simultaneously aligns the two sets of feature vectors, FA
and FB, by finding a path that matches them, using the recurrence equation:
DTW (i, j) = dist(FA(i), FB(j)) +min
⎧⎨⎩
DTW (i− 1, j)DTW (i, j − 1)DTW (i− 1, j − 1)
⎫⎬⎭
25

where dist(·, ·) is the squared Euclidean distance between the two d-dimensional vectors,representing the i’th column of A and the j’th column of B. The matching error formatching the two images, A and B, is defined as:
err(A,B) =1
lDTW (FA, FB)
where l is the length of the warping path recovered by the algorithm.
4.4 Experiments and Results
4.4.1 Feature selection
The performance of the different features was tested on two relatively big fragments, indifferent preservation conditions: one is well preserved, while the other contains manytears and holes. The binary image we used is the result of the R-combination describedin Section 3.5, since the keypoint detection in this result achieved high recall of thecharacters in the image. The two images together contain 524 candidate characters, eachwas assigned the correct classification, i.e. the Hebrew letter it represents (numberedstarting from 1), or 0 for no letter. Four query characters were selected for each fragment,and their images were cut from the fragments’ binary images. The selected letters arerelatively frequent in the fragments. Figure 4.2 shows the two images and the queryletters used for each of them.
(a) (b)
Figure 4.2: The fragments used for the features testing, and the query letters taken fromeach of them
First, we compared the performance of using column feature and row features. We ranthree experiments, with the five features described above: (1) using the score obtainedfrom the column features, (2) using the score obtained from the row features, and (3)using the the average of the two scores. Figure 4.3 shows the ROC curves obtained usingthese three scores. Overall, the row features’ performance was much better than both the
26

column features and the average of scores. This makes sense, as many Hebrew charactershave common upper or lower profiles, but the horizontal profiles are more variable.
Figure 4.3: ROC curve for matching scores using column features, row features, and both
Next, we tested each of the features separately as row features. Figure 4.4a shows theROC curve of each of the single features. The best features are UP, DULP and PP. Thisis consistent with the results reported in [18], claiming that the best features are DULPand PP. We added the UP feature, which captures the left contour of the letter (whenused as a row feature) and seems to perform very well.
Figure 4.4b shows the performance of groups of row features. We started with theDULP and PP features, and tested the effect of adding more features. As expectedthe addition of UP gives the greatest improvement, and no significant improvement isachieved by adding the other features to these three.
(a) (b)
Figure 4.4: ROC curves for matching with the different features (a) separately and (b)with different groups of features
27

4.4.2 Matching Partial Characters
The Dead Sea Scrolls are characterized by many tears, small torn pieces and fragmentsthat have deteriorated along the margins, leading to the appearance of broken letters.Since the keypoint detection method assumes that the letters are connected, broken let-ters will probably be split into more than one keypoint, and the method above will fail tomatch them to the correct reference letter. To address this, we tested the concept of par-tial character matching: when a match is not found between the candidate keypoint andthe reference letter, we attempt to perform a match between the keypoint and parts ofthe reference letter. Although this approach was able to identify more correct keypoints,it also caused a decrease in precision, since parts of letters have fewer unique character-istics, and they achieved a high matching score with many irrelevant keypoints. This isdemonstrated in Figure 4.5, which shows the results of matching the letter lamed andtwo partial images of it. While the partial matches managed to identify some instancesof the letter that were not discovered by the whole letter, they also matched many wrongletters and their precision is much lower than that of the whole letter.
Figure 4.5: Character and partial character matching results of the Hebrew letter lamed.The legend shows the query letters used. The red frames are the keypoints matched tothe whole letter, and the blue and magenta frames are the matches of the upper andlower parts, respectively.
4.5 Applications
4.5.1 Script Identification
We examined the ability of the character spotting method to distinguish between differentHebrew scripts. The scrolls were written in many different Hebrew scripts, and theidentification of the fragment’s script may help join scroll fragments together and providesome knowledge about the fragment’s origin. We used a table of Hebrew scripts of thescrolls, taken from [19] (see Figure 4.6). The table contains 16 different scripts, namedaccording to the manuscript they appear in. We matched each letter separately to eachof the candidate letters in a set of 200 fragments, taken from 10 different plates. Wefound that the different scripts yield different matching results, that is, for any particularHebrew letter that appears in the fragments, we had 11–16 different query characters of
28
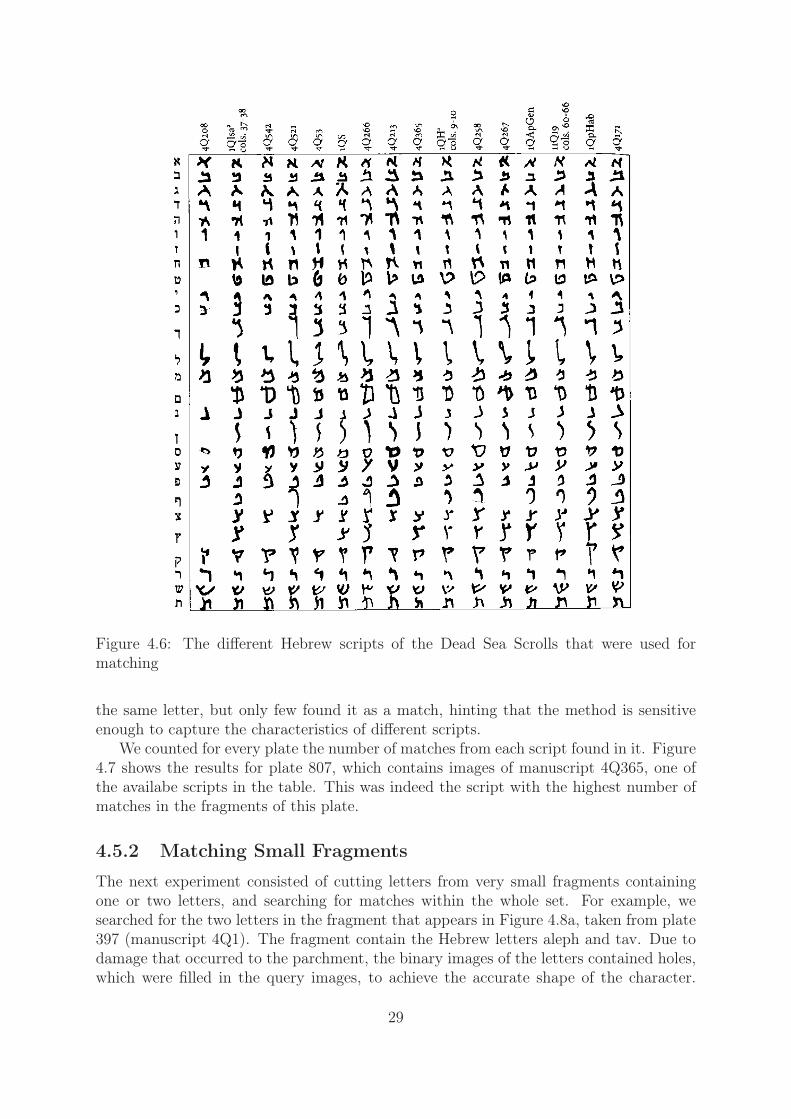
Figure 4.6: The different Hebrew scripts of the Dead Sea Scrolls that were used formatching
the same letter, but only few found it as a match, hinting that the method is sensitiveenough to capture the characteristics of different scripts.
We counted for every plate the number of matches from each script found in it. Figure4.7 shows the results for plate 807, which contains images of manuscript 4Q365, one ofthe availabe scripts in the table. This was indeed the script with the highest number ofmatches in the fragments of this plate.
4.5.2 Matching Small Fragments
The next experiment consisted of cutting letters from very small fragments containingone or two letters, and searching for matches within the whole set. For example, wesearched for the two letters in the fragment that appears in Figure 4.8a, taken from plate397 (manuscript 4Q1). The fragment contain the Hebrew letters aleph and tav. Due todamage that occurred to the parchment, the binary images of the letters contained holes,which were filled in the query images, to achieve the accurate shape of the character.
29

Figure 4.7: The number of matches of the different script in the fragments of plate 807.
We searched for matching characters in the set of 200 fragments, taken from 10 differentplates. Figure 4.8b shows the number of matches found for each of the two letters, ineach of the tested plates. The majority of the matchings of the letter aleph belong toplate 397, while the results of the letter tav don’t show a clear preference to one of theplates. These results imply that in some cases matching the characters may be helpfulin learning about the origin of small fragments.
(a) The fragment from plate 397 from whichthe letters were taken (original and binary).
(b) The number of matches of the two let-ters in the different plates.
4.5.3 Character Recognition
After performing matching with each of the reference scripts, we tried to use the resultsto identify the characters. Each keypoint that was matched to one or more query letterswas assigned a letter in the following way: The most common letter among the matchingletters was chosen, and if there was a tie, the one with the best average matching score
30

wins. We tested this method on the two fragments in Figure 4.2. The success rate was63% for the fragment of 4.2a, and 53% for the fragment in 4.2b. This initial result maybe improved in the future by considering the relevant scripts and by performing moreprocessing of the results, such as measuring the similarity between candidates that areassigned to the same letter.
31
Chapter 5
Conclusions and Further Research
The Dead Sea Scrolls are considered by many to be the greatest archaeological discoveryof the twentieth century. They continue to excite scholars as well as lay people due totheir great antiquity and the light they shed on the origins of Judaism and Christianity.The use of modern computerized tools may contribute to the resolution of remainingopen questions related to the scrolls research, such as who wrote the scrolls, or, rather,to which community or communities did the writers belong.
This work has taken a few first steps towards computer-aided research of the DeadSea Scrolls. We started with the fundamental step of image binarization, and developedtwo ways of achieving high-quality binary images of the scrolls. The first is based onthe multi-spectral images taken at different wavelengths. We showed that a combinationof several different wavelengths provides a more accurate binary image than any singleone of them. This confirms the assumption that the infrared images contain valuableinformation and may improve image legibility.
The second binarization method utilizes the advantages of several state-of-the-artbinarization methods that were developed to solve common problems in binarization ofdocument images. We showed that using the information of how confident each methodis in its decision regarding each pixel allowed the building of a more accurate classifier.This method was able to reconstruct the foreground of fragments even in cases where theink has faded.
Finally, we applied a character spotting technique to search for and to identify theletters in the scroll fragments. This method makes use of features that can differentiatebetween Hebrew letters with high accuracy. We showed that this method is able todistinguish between different Hebrew scripts and thus, in the future it may be utilizedto determine which fragments are written by the same scribe, and to piece togetherfragmented scrolls. Additionally, the character spotting method can be used to build acharacter recognition system for the Dead Sea scrolls fragments, as well as a platform forword searching in the text.
32
Bibliography
[1] Gregory Bearman. Imaging the dead sea scrolls for conservation purposes. SPIENewsroom. 29th December, 2008.
[2] The Leon Levy Dead Sea Scrolls digital library website. http://www.deadseascrolls.org.il/home.
[3] Jaakko Sauvola and Matti Pietikäinen. Adaptive document image binarization. Pat-tern Recognition, 33(2):225–236, 2000.
[4] Yibing Yang and Hong Yan. An adaptive logical method for binarization of degradeddocument images. Pattern Recognition, 33(5):787–807, 2000.
[5] Bolan Su, Shijian Lu, and Chew Lim Tan. Binarization of historical documentimages using the local maximum and minimum. In Proceedings of the 9th IAPRInternational Workshop on Document Analysis Systems, pages 159–166. ACM, 2010.
[6] Itay Bar-Yosef, Isaac Beckman, Klara Kedem, and Itshak Dinstein. Binarization,character extraction, and writer identification of historical hebrew calligraphy doc-uments. International Journal of Document Analysis and Recognition (IJDAR),9(2-4):89–99, 2007.
[7] Lior Wolf, Nachum Dershowitz, Liza Potikha, Tanya German, Roni Shweka, andYaacov Choueka. Automatic paleographic exploration of genizah manuscripts. Cod-icology and Palaeography in the Digital Age II, 2:6, 2011.
[8] Shaus A. Sober B. Turkel E. Piasetzky E Faigenbaum, S. Potential contrast evalua-tion - the best of all possible images.
[9] Chih-Chung Chang and Chih-Jen Lin. LIBSVM: A library for support vector ma-chines. ACM Transactions on Intelligent Systems and Technology, 2:27:1–27:27,2011. Software available at http://www.csie.ntu.edu.tw/~cjlin/libsvm.
[10] Nobuyuki Otsu. A threshold selection method from gray-level histograms. Automat-ica, 11(285-296):23–27, 1975.
[11] Shira Faigenbaum, Barak Sober, Arie Shaus, Murray Moinester, Eli Piasetzky, Gre-gory Bearman, Michael Cordonsky, and Israel Finkelstein. Multispectral images ofostraca: acquisition and analysis. Journal of Archaeological Science, 2012.
33

[12] Lior Wolf, Liza Potikha, Nachum Dershowitz, Roni Shweka, and Yaacov Choueka.Computerized paleography: Tools for historical manuscripts. In Image Processing(ICIP), 2011 18th IEEE International Conference on, pages 3545–3548. IEEE, 2011.
[13] David G Low. Distinctive image features from scale-invariant keypoints. Interna-tional Journal of Computer Vision, 60(2):91–110, 2004.
[14] David L Davies and Donald W Bouldin. A cluster separation measure. PatternAnalysis and Machine Intelligence, IEEE Transactions on, (2):224–227, 1979.
[15] R Manmatha and WB Croft. Word spotting: Indexing handwritten archives. Intel-ligent Multimedia Information Retrieval Collection, pages 43–64, 1997.
[16] Toni M Rath and Raghavan Manmatha. Word image matching using dynamic timewarping. In Computer Vision and Pattern Recognition, 2003. Proceedings. 2003IEEE Computer Society Conference on, volume 2, pages II–521. IEEE, 2003.
[17] Toni M Rath and Raghavan Manmatha. Features for word spotting in historicalmanuscripts. In Document Analysis and Recognition, 2003. Proceedings. SeventhInternational Conference on, pages 218–222. IEEE, 2003.
[18] Irina Rabaev, Ofer Biller, Jihad El-Sana, Klara Kedem, and Itshak Dinstein. Casestudy in hebrew character searching. In Document Analysis and Recognition (IC-DAR), 2011 International Conference on, pages 1080–1084. IEEE, 2011.
[19] Martin G Abegg Jr. The linguistic analysis of the dead sea scrolls: More than(initially) meets the eye. Rediscovering the Dead Sea Scrolls: An Assessment of Oldand New Approaches and Methods, page 48, 2010.
34