computer-produced distribtion ci maps of disease* ... nominator of the various jargons, ......
TRANSCRIPT

ciCOMPUTER-PRODUCED DISTRIBTION
&CAC
PAPS OFR N KADE
Repritmed 30mm96ANNALS OF TH NE Y ACADEMY OF SCio-.I-NCES
September 3016

COMPUTER-PRODUCEDDISTRIBUTION MAPS OF DISEASE*
Howard C. Hopps
Division of Geographic PathologyThe Armed Forces Institute of Pathology
Washington, D. C.
I am a pathologist. I know relatively little about computer technology, butI do know enough to realize that it is the means to solve one of my majorproblems-a problem in medical intelligence-if I'm smart enough to specifyrealistic objectives and to see to it that the input data is adequate to thetask. My associates and I have worked a little over two years now in developinga system to solve our problem. We've come a long way, but there's a longway yet to go.
A great deal of blood, sweat, tears-and money-has been poured intothe problem of pattern recognition. Our problem is a rather different one:the rapid production of patterns. These patterns would be derived fromvirtually an infinite assortment of patternable data available in the abundantliterature dealing with the ecology of disease. We are not so naive as to proposethat an infinite number of map patterns will be produced: rather we proposethat, of the enormous number of potential patterns (assuming an adequatedata base), the user will request those relatively few patterns which may meethis particular needs.
We have chosen maps as the principal pattern form to display informationfor two reasons: First, because the diseases we are mainly interested in arestrongly influenced by a wide variety of ecological faciors, e.g., temperature,rainfall, humidity, the amount and mineral content of surface water, agriculturalpractices, population densities of various plants and animals including man, thekinds of people involved (not only age and sex, but race, ethnic group, andtribe)-and a hundred other factors closely tied to geographic location.Second, because mapmakers have a unique advantage over those persons whocommunicate information by other forms of graphic display for three generalreasons:
I. Extensive and continual usage of map forms, beginning in early child-hood, has conditioned most "educated" people to an intuitive understandingof maps.
*Supported by the Advanced Research Project Agency through a contract toUniversities Associated for Research and Education in Pathology (DA 49-092-ARO-130) and monitored by the U. S. Army Research Office.
779
780 Annals New York Academy of Sciences
2. The map is ideally suited to a consideration of multiple factors simul-taneously (e.g., place-both geographic and political-in relation to topog-raphy, population density, the location of towns and cities, the location andcharacter of transportation routes, and time zones).
3. Through the use of rather simple devices, such as isarithms (more prop-erly termed isopleths), one can achieve a three dimensional effect (quantitybeing the third dimension, quality and location the other two) in a twodimensional presentation.
We believe that a mechanism (system) which can produce many kindsof map-patterns quickly, in response to specific query, will offer two veryimportant advantages: First, such a mechanism will make it possible to havecurrent information about the distribution of specific diseases and the distribu-tion of known important causally related agents or conditions (e.g., in the caseof infectious disease, insect vectors or animal reservoirs). Second, the rapidavailability of a large number and wide variety of disease/environmental mapswill give the observer an opportunity to compare location-patterns of unknownbut possibly related ecological factors and, in this way, suggest causal rela-tionships that might otherwise never have come to mind.
From a broader point of view, the MOD (Mapping Of Disease) projectis an effort to illuminate the geographic pathology of disease. Geographicpathology is, in a sense, a kind of comparative pathology-one in which place(rather than species) is the primary variable. Geographic pathology attemptsto answer the questions: What (disease); Where (is it); and Why (is it there).Of course geographic pathology includes aspects of epidemiology since it isalso concerned with prevalence and incidence and the interplay among complexcausal factors, but it goes beyond epidemiology in its concern for the patho-genesis and the pathological effects of the disease under study.
One particular interest has been with infectious diseases as will be evidentfrom my illustrations, but I emphasize that the MOD system is applicable toany study of diseases in which geographic/environmental factors are important.To be more specific, the computerized MOD project has two principal objec-tives. First, and most important, to develop a system which will include:
I. Standardized procedures for preprocessing medical information so thatit is suitable for computer manipulation.
2. A storage/ retrieval mechanism to act upon such preprocessed medicalinformation, together with a complex editing program that will allow updating,will provide for immediate identification of material in conflict, will identifydata sources, etc.
3. Programs whereby the computer can "instruct" a plotter to preparecontour maps reflecting quantitative aspects of incidence and/or prevalenceof specific diseases. distribution of such causally related factors as animalrescrvoirs. insect vectors, climatic factors, and soil factors.

°I - _F o -
Hopr 3: Computer-Produced Distribution Maps 781
4. Programs whereby unmappable supporting information (to accompanythe maps) can be printed out, thus extending the usefulness of the mappedmedical information by pointing out certain limitations.
5. Programs allowing computer manipulation of the data to show signifi-cant interrelationships directly.
6. Programs whereby other types of graphic display of information canbe generated to show direct cause and effect relationships (e g., line graphs)pertaining to prevalence and/or incidence of a given disease.
The second objective is to produce meaningful mapst (and other graphicdisplays) that show the distribution of a disease(s) in terms of prevalence,incidence, severity, etc., along with distributions of (and interrelationshipsamong) selected causally related factors. Quantitative as well as qualitativeaspects will be considered, with major emphasis on contour-type maps, thecontour lines representing isarithms (isopleths).
The MOD project is primarily concerned with problems of data processing;there are many conventional aspects to these problems, but there are twounique aspects: (I) preprocessing a wide variety of physical and biomedicaldata, converting them to a compatible form which will allow subsequentcomputer manipulation and output of meaningful information relating todisease prevalence/incidence/ecological factors; and (2) developing a computerprogram to contour-iplot disease data which are often represented by relativelysparse data points.
In relation to the first aspect, one of the major problems is to structure adata analysis vocabulary and develop a hierarchial system for the qualitativeand quantitative characterization of disease and ecological information. Thisrequires cutting across disciplinary boundaries, identifying the common de-nominator of the various jargons, and converting the narrative and tabulard'ita into a miscible form.
Although the primary concern of this monograph is the processing of data,our work on the MOD project is such that I feel compelled to mentionimportant limitations in the data available to us. There are many places inthe world where the data base. dealing with many disease situations, is alto-gether inadequate for any meaningful collation, much less effective computermanipulation. We fully recognize that no system of information processingcan convert bad data into good data!
,Technical Considerations: The various maps (graphic representations of spatiallydistributed data) will, ordinarily, be printed on transparent stock and overlayed ontobase mapi which contain physical and political geographic data. population data.etc. Of course, multiple transparent overlays, each presenting a different kind ofinformation. may be layered togeth . to show the extent of pattern match, etc. Ihave already mentioned that quantitative aspects of the data can be handled by theuse of isarithms.

782 Annals New York Academy of Sciences
However, there are large pools of data (derived from cultural anthropolo-gists, economists, geologists, meteorologists, agricultural experts, epidemiolo-gists, pathologists, etc.) relating to disease/environment situations which couldbe meaningfully collated and effectively computer-manipulated.
Many of the most important problems are characterized by the leastminimally adequate relevant information, but we must identify what informa-tion the.-t is and learn its limitations. We must work toward correctingdeficiencies in the data base, but even more important, we must developbetter methods of using what information is available.
We are at the stage of world development where many important judg-ments must be made in the absence of hard data. If we don't use what datais available what shall we use?
Now to return to the problem of data manipulation. An article in Naturedescribes the present situation well in terms of needs and accomplishmentsin the field of automatic data processing and computer mapping; these com-ments are very pertinent to the MOD project. It is stated that ". . . only atiny proportion of the mass of demographic and climatic information collectedby governments ever sees print in map form. Information is simply tabulatedby area, and the possibility of spotting regularities or corrmiations-say theincidence of pellagra, family expenditure on food, and the provision of medicalservices in the eastern United States-is very remote indeed. Such interestingrelations as have been found are the result of years of searching, and merelyincrease the sense of frustration that there is no better way of doing it."1
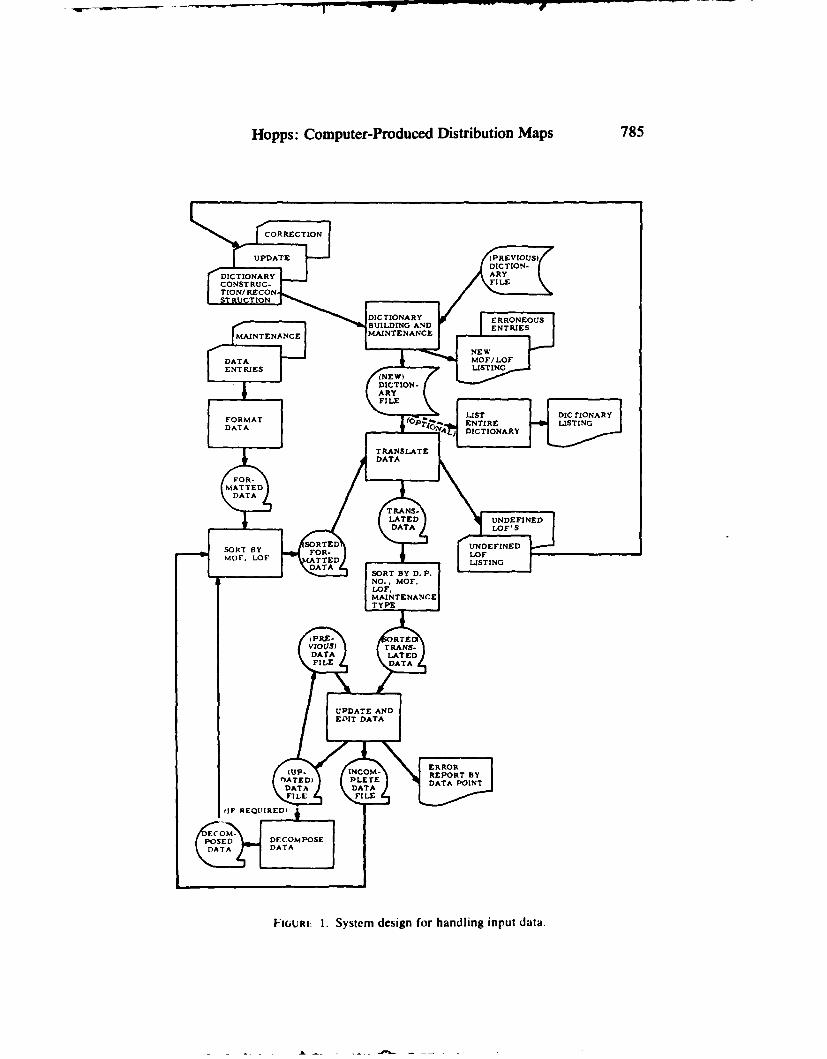
Because the principal output of our system is distribution maps, I willpresent a series of these maps to illustrate certain inherent problems, ways ofattacking these problems, and some of our progress in overcoming theseproblems. I must emphasize that the maps which we have produced reflectefforts to develop technical methods, not-at this time--efforts to displaynew medical information. As a matter of fact, a major part of our work oncomputer production of maps has been based on a single convenient tabularsource of data which was assembled some years ago by Dr. Jaques M. May (seeTABLE I ). I will discuss our approach to structuring a data-analysis vocabularywhich allows us to convert words of various qualitative and quantitative valueto dots, or lines, or shaded areas on a map. But before getting into datastructuring I will give a brief synopsis of our system design for handling inputdata (see FIGURE I). I shall not pursue this aspect of the project furtherbecause I want to concentrate on data structuring and map production.
Our approach to a data-structuring vocabularly is shown in FIGuRE 2.which illustrates the characterization of and relationships amoni
I. l-ots-Order Factors (l.OF's) represent tLe most specific name or descrip-tor of a particular disease 'environmental situation, e.g., pine trees, raccoons.degrees (of temperature). schistosomiasis, or Nigeri,.n.

Hopps: Computer-Produced Distribution Maps 783
TABLE I *
SOUTH AMEPICAN DATA USED IN MAP AND GRAPH GENERATION
Human Infection Rates of Schistosomiasis (S. mansoni)
Grouped by Province
Extracted from Source Document Added by MOD Personnel
Inf. Rate LO, LA Inf. RateCountry (%) (nearest degree) (%)
VenezuelaAragua 24.8 -67, +9 24
Carabobo 9.9 -68, +10 9
Miranda 10.3 -66, +10 11
Distrito Federal 31.6 -67, +-11 32
Guarico (Intradermo) 30 -66, +8 31
Dutch Guiana Present -55. +5 1
BrazilMaranhao 0.46 -45, -5 1Piaui 0.04 -42, -8 1
Ceara 0.94 -39, -5 1
Rio Grande do Norte 2.32 -37, -5 2
Paraiba 7.53 -37, -7 8
Pernambuco 25.17 -38, -8 26
Alagoas 20.48 -37, -9 21
Sergipe 30.13 -38, -11 31
Bahia 16.55 -42, -12 17
Espirito Santo 1.63 -41. - 20 2
Minas Gerais 4.41 -45, -18 4
Rio de Janeiro 0.10 -43, -22 1Parana 0.12 -49, -22 1Sio Paulo Present -52. -24 1
Santa Catarina 0.00 -51, -27 0
Goias 0.03 -49. -13 1
Matto Grosso 0.007 --55, -17 i
*From May. J. M., Ed. 1961. Studies in Disease Ecology. Hafner Publishing Co..
Inc. New York. N. Y.
2. Middle-Order Factors (MOF's) represent the set of all LOF's whichdescribe the same aspect of disease/envirornmental situations. A MOF repre-
sents a category of descriptive terms that pertains to only one particular aspectof disease--it requires LOF's to give it substance. Examples are given in the
follovking list.
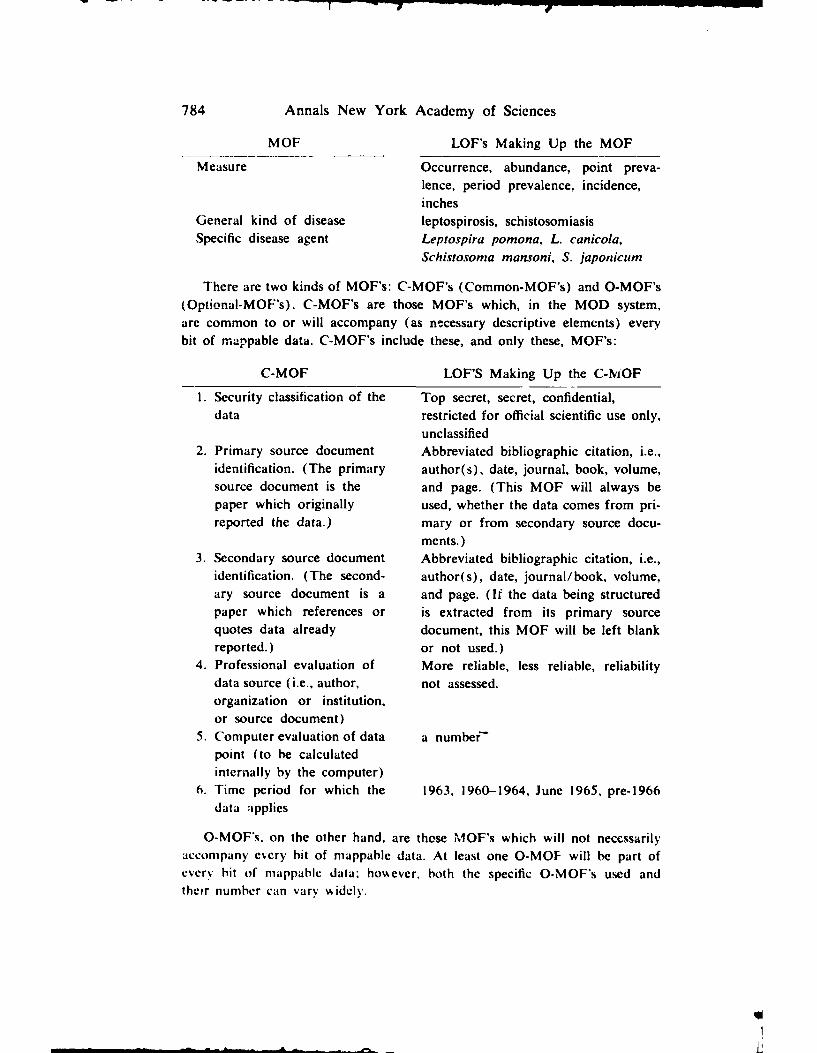
784 Annals New York Academy of Sciences
MOF LOF's Making Up the MOF
Measure Occurrence, abundance, point preva-lence, period prevalence, incidence,inches
General kind of disease leptospirosis, schistosomiasisSpecific disease agent Leptospira pomona, L. canicola,
Schistosoma mansoni, S. japonicum
There are two kinds of MOF's: C-MOF's (Common-MOF's) and O-MOF's(Optional-MOF's). C-MOF's are those MOF's which, in the MOD system,are common to or will accompany (as ne:cessary descriptive elements) everybit of mappable data. C-MOF's include these, and only these, MOF's:
C-MOF LOF'S Making Up the C-MOF
I. Security classification of the Top secret, secret, confidential,data restricted for official scientific use only,
unclassified2. Primary source document Abbreviated bibliographic citation, i.e.,
identification. (The primary author(s), date, journal, book, volume,source document is the and page. (This MOF will always bepaper which originally used, whether the data comes from pri-reported the data.) mary or from secondary source docu-
ments.)3. Secondary source document Abbreviated bibliographic citation, i.e.,
identification. (The second- author(s), date, journal/book, volume,ary source document is a and page. (ft the data being structuredpaper which references or is extracted from its primary sourcequotes data already document, this MOF will be left blankreported.) or not used.)
4. Professional evaluation of More reliable, less reliable, reliabilitydata source (i.e., author, not assessed.organization or institution,or source document)
5. Computer evaluation of data a numberfpoint (to he calculatedinternally by the computer)
6. Time period for which the 1963, 1960-1964, June 1965. pre-1966data applies
O-MOF's, on the other hand, are those MOF's which will not necessarilyaccompany e~ery bit of mappable data. At least one O-MOF will be part ofevery bit of mappable data. however. both the specific O-MOF's used andtheir number can vary Aidely.
Hopps: Computer-Produced Distribution Maps 785
CORRECTION
UPDATE (PREVIOUS)DICTION.
DICTIONARY ARYCONSTRUC- FILETfON/RECON
TION
D CTIONARY ERRONEOUSBUILDING AND
NTE G A. CC ENTRIESMAINTENANCE MAINTENANCE
NEWDATA MOF/LOFENTRIES LISTING
(NEW)DICTION-ARYFILE
FORMAT LIST DIC rIONARY
DATA ýnIRE LISTING
TRANSLATE
1ONARY
DATA
FOR-MATTEDDATA
TRANS.LATED UNDEFINED
i DATA LOFIS
SORT BY SOR ED UNDEFINEDMOF LOY FO - LOF
T ED INGDATA
LISTSORT BY D. P.
71 NO MOF.Loiý.MAINTENANCETYPE
(PRE- RTED)VZOVS) TRANS-DATA LATEDFILE DATA
UPDATE ANDEDIT
DATA I
4up- INCOM- ERRORREPORT BY
f)ATrD) PLETE DATA POINTDATA DATAFILE FILE
(IF PEOLIRED)
.0 DECOMPOSE
.AT A DATAE C'OM_
FiGum. 1. System design for handling input data.

",16 Annals New York Academy of Sciences
[ both a.-aidelC.MOF's a• , uppor.ing j0-MOF a
Sbranches
.OESSML EVALUATIOe 5 Nii
in m~aI ~ ~Q m~ OF's
---- 0 DOCUMliENTr •
bibliographiiltiolw
"Orchad mutiMp data paints;
-~~ Ls.-t,. I sho
LOC . location of tree (USA, Ind., Monroe Co.; etc.)VAL - size of tree ( abundant; 14%; etc.)
entire combination = I data point
FIGURE 2. A tree-like (hierarchal) relationship of terms for disease/environmentaldescriptions. See text for explanations.
High-Order Factors (HOF's) represent a specific combination of LOF's, inwhich each LOF belongs to (is drawn from) a different MOF, i.e., in whichno MOF contributes more than one LOF.
Poly-Order Factors (POF's) represent a specific combination of LOF's.in which at least two LOF's belong to (are drawn from) the same MOF, i.e.,in which at least one MOF contributes more than one LOF. For example, the
following is a HOF: Incidence (measure) of schistosomiasis (general kind ofdisease) due to Scitistosoma mansoni (specific disease agent) in Indians(animal host infected) as determined by fecal analysis. during 1958 (timeperiod for %rihich data applies). This statement would be a POF if. at specificdisease agent an additional LOF was added (from the same MOF). e.g.. and.('nhii'osolna h/matohitln or if. at animal host infected an additional 1.OF

- __ I 7
Hopps: Ccmputer-Produced Distribution Maps 787
(from the same MOF) was added. e.g., and Caucasians. FIGURE 3 should helpto clarify this relationship.
Factor is a general term including LOF's, MOF's, HOF's, and/or POF's.LOF's, MOF's, HOF's, and POF's can be viewed together as a kind of hierarchyor a kind of matrix, as shown in FIGURES 2 and 3.
In order to map factors, location and values must be coupled with them.Location (LOC) is an exact geographic position, stated as precisely as possible.of each bit of mappable data. For purposes of the MOD system, each bitof data can have two, and only two, LOC's accompanying it:
1. Geographic location by W 088"31', N 37°29';longitude and latitude W 044018', S 17°09'
2. Geographic location by Pope County, Ill.political unit USA, North America
Minas Gerais provinceBrazil, South America
Value (VAL) is an alphabetic and/or numerical symbol expressing onemember of the set of all possible results, that result-set describing the functionalrelationship governing a specific factor (HOF or POF) as it ranges over theset of all possible LOC's. For example: 0. 1, 2, 3.... : 0, 0.01, 0.02, 0.07.
HOF or POF
Hierarchy MOF0 0 LOF
a MOF a MOF a MOF a MOF
LOP L0" LWP LOP 4 aHOF
LOP LOF LOF Lor
Matrix LOF LOP LOF rLF1 4 a HOF
LOF LOF LOF LOf 4 a POF
LOIF LOF LOF LOF
F-IuuL 3. Relationship among term categories. See text for explanations.
788 Annals New York Academy of Sciences
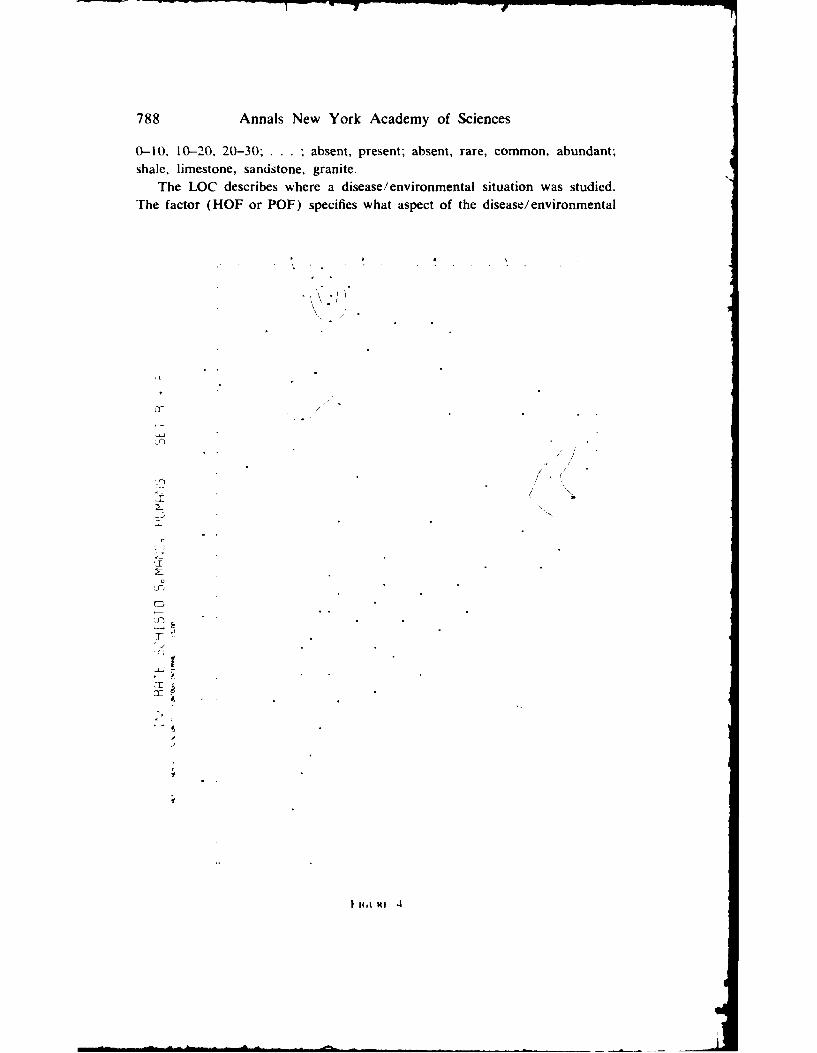
0-10, 10-20, 20-30; . . . ; absent, present; absent, rare, common, abundant;shale, limestone, sandstone, granite.
The LOC describes where a disease/environmental situation was studied.The factor (HOF or POF) specifies what aspect of the disease/environmental
"" 7
//
n Er
/
CD
A
1I, N

Hopps: Computer-Produced Distribution Maps 789
100
0 A
-320 __
-60 _______ ___ ____
FIux5

r -- T - 7
790 Annals Ncw York Academy of Sciences
*10-,
cc
-NM
-60-
II.HI6

V _____ -w~~~~~ ... 11 II
Hopps: Computer-Produced Distribution Maps 791
FIGURE, 7.
situation was studied. The VAL describes the result or conclusion reached bythe studies. A data point is the combination of a specific LOC. a specific HOFor POF. and a specific VAL. In general, LOF's and MOF's cannot be mapped,because by themselves they do not convey enough information to he meaning-fully mapped. However, HOF's and POF's can be meaningfully mapped. witheach HOF or POF serving as the description ( legend) of its corresponding map.
Ilurning now to the production of maps. contour-type rivim~ have proved
fo he extremely useful tools in studying various environmental charaictcristi,:s
or factor%. particularly those considered by the earth sciences. Stich mapshal\e grcail poltential %'!ttle inl Many studies of' disease sittlialions. Tlhu%. a generail
di•'l~k on t1 his [\PC of 11ap is altlogether pertinent to the pre~sent phase tithe MODf project.

792 Annals New York Academy of Sciences
4
uLJ
4
Cr.
U)0
LM
U.1
a
-60-
11l(,Ltlkl 8.
Hopps: Computer-Produced Distribution Maps 793
tnhecI~on flit¢ 5•St•,.iwu~r,*t IS ,,JntnOf,) ,n Mn
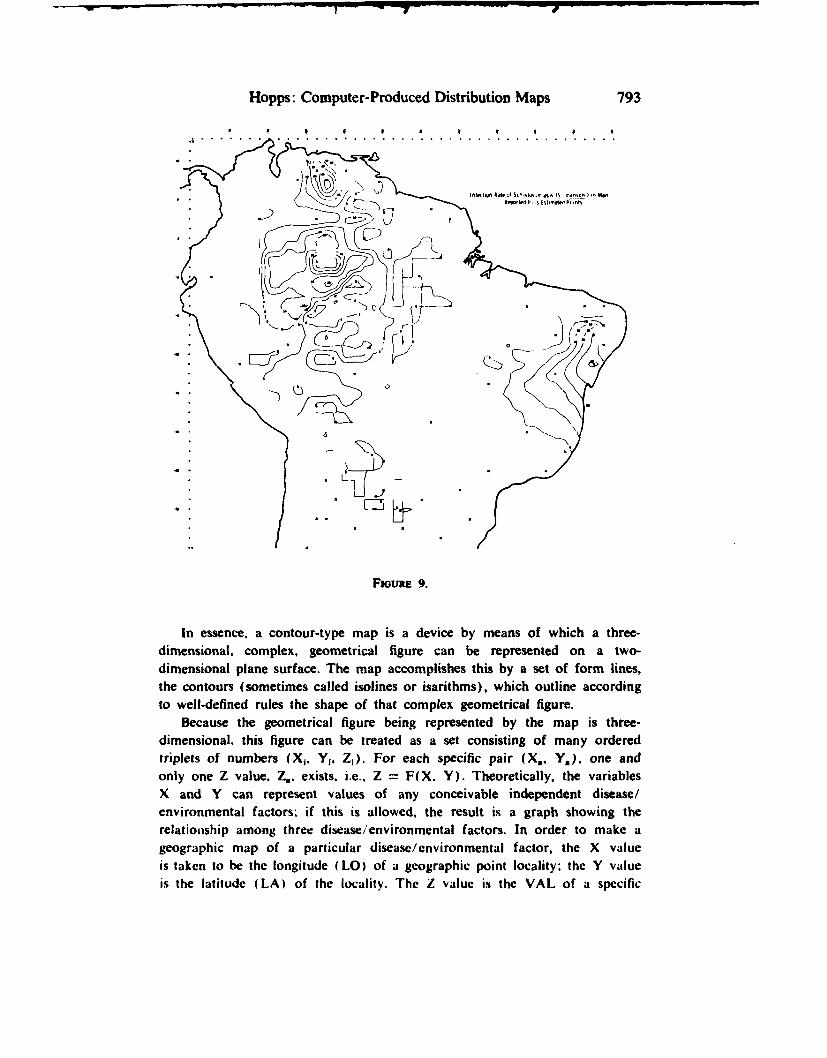
FIGoRE 9.
In essence, a contour-type map is a device by means of which a three-dimensional, complex, geometrical figure can be represented on a two-dimensional plane surface. The map accomplishes this by a set of form lines,the contours (sometimes called isolines or isarithms), which outline accordingto well-defined rules the shape of that complex geometrical figure.
Because the geometrical figure being represented by the map is three-dimensional, this figure can be treated as a set consisting of many orderedtriplets of numbers (X,. Y1, Z,). For each specific pair (X., Y.), one andonly one Z value. Z,. exists, i.e., Z = F(X. Y). Theoretically, the variablesX and Y can represent values of any conceivable independent disease/environmental factors; if this is allowed, the result is a graph showing therelationship among three disease/environmental factors. In order to make ageographic map of a particular disease/environmental factor, the X valueis taken to be the longitude (LO) of a geographic point locality; the Y valueis the latitude (LA) of the locality. The Z value is the VAL of a specific

794 Annals New York Academy of Sciences
It70,o6 6
-7* 083.*14
1'p -1 10 c-110M O
*0~6ISI~IILIA~0IIU020646?746S44646 710:oo~lok 0 o 0o,0, o00300o0oloo"i o000O"000ono"0f00o~oCo00o 0000a .606 666.44 2/2 00. .000005050000000000000000000000.0.00050000. 00n-'~ 0000001 ~ ~ ~ ~ ~ oG 6n1 - oool 664.66 4.1 I0)0 c000 o0000 n0 o ",, oo"000000000 2000.""0000.005
a 666 46n6 44 0/ ,o oo0,ojo rnni 0000 no -uooono L0000000000000. 00 r00000000-. 500Ioow 0 ono4D 6I6466)4 44O 12oo O000000C000000000000000000000000,.0C 00000 'in"0,0.OOf
4o~oc-oo1 o 00600000. 00,.,,o000000).00000 00400000000, oclo0o no00 1000 n 00 ,"I n0* .~ 666 646 * .1 )000000000000000000000000000 000000000000o000
000000000fl000000 000
0000031000oJo-o-o'"G ...00000.00000 ,0ro~oo O -ooooooooo~oooo oooooo ooo W 000000.
GoO)o'0.o~ooý '00000o000.0 0.no.o00o00o00on I 'on "Oeo.00ooo0"coo~soooc0,o ono D 00
c0000000,0,) j.n0) o)o, ., 000 1OJoooo00,o 03)00000 005 0000000000 00000Oo) 00000000D000000300 .)0000300300000.pooo"Osooo Oo nOOqo-obooOn oloolon 0000000 <00)0no'0I00.0000nlcO0,Go000o300,0 -- G'1 lot0000 C, ,o n o I.... . ........Oo- 000o nOO.06o130n 0)01,00 000)00ooon ooi ooooOIOcoOOtoooom~nj ,0o1( ......'0'0In-
OOOOO)00'0000.0)0000o0)000003oo )~ 00.'o, o _oooo ooa.,o00.0,00 ``1` "00 .00000000000000,)0304000000000 00000 -0" on00 1
60
000000-)oog o OL)oo 0,.0,..000,~oo"o~o~o0000S0 00 "of.'. O,,,0.0> on400 ,ooOOOO0000 0, '000000013))0000 c 100 10010000)00) (`oj u ,o 000000.o0000nr0,000)n o A o. ;.'0000000000G .00'00000003000)50050.r300.........0000)000000Go Goo 0 c.0,0,,0o0000o000000000 0-00000,0 00,00000000)00 00300"0300000o00000 000 00/
0000000005003031. 0n, 1 -o OO -oo)0,0 00.300,00 0 0 000 000 00 000 00 00o 000 o0 D0D00 0 0 0 0 ) 0 00 0 0 0 0
5 O 2 600010003.,0no)) 00OooO0,)0,000 '00 ,0 0I0000000000000.00)00)0) 0000',)0() 0)00 oo 0000000 00 46 6'
00 6 000)) 0) 003 00.00 0 o00 0 00 0.00 0 03 0 00 0, 0,0000000050000 00000000I0"0000`6 0'"G .n0 46.. 0o,. . .C6 0 00), 003GO 0 O0 - 4. oŽ)0.0,Coo 0000, 00 - u,, .. 0,o0 " 000.,0)00.0000000' " 0 0 0'. I0 00 ) 0 0 -020 0.''.66...
000000000)0)0.0000..0,07..,000030 00), ,0. ),ooO., 00000, 00 00050000)000050,0 500 0,2)0 00 6 o600C010000OOU)0,.~o~o'00,,00000fl00 G I'00,) 00000000)0,1 00 C)000,00, I0)000000000 '/ , 46 )"1",Go= ,-o0oo000, c "0 .o00,- 0.'00003)0400,000 000000, c000000050002,0000050400000.000 0/0 064.,.0
4000o. 300,00,,.0000 '000.000000000:0 0,0', 00', 'o 5000 1 I0.00 Q00O000)O~OO " /2 6 6 0 1*000600)033 `0o 0.0o,) _o030.0 )0.0000000300,0005 0000 00nnlo --- 0q 0.00000)0 000000 20 146 4 0610610)0000 3aa ,00' o)0"a 00000 '00000co '00 0000.003 00 00 000 0' 0 00000000005 0 n0o5000.0 00 6 64 60 060000000000a0o oOjooo- 0,-00.0) )00000. ,, I0con. on0 0..10.00000 0,00000000
000000r
0.. OOoo. O I00000 I 2 4I04 0
000600,00, ooo0.o.o000 ;0,o000 0.00.0,0 ,0,, 000.)0000,000000 20 6 6 0000000o00" 0.O6 o0,00oo,0 -- ,0 ocj"n,o,2-0 con,0 10 000000 0 00000000000000000 00; 06...... 0000) 0),0,000000,0,0,0 U,`00,0~ 00,0 j' 00,ý 0)00000,000000 00 , o 'G0000000 2......00
4000000)00 0)0,0 )000000000) 000ý 000205000000,0 00000oo 00 5 500o 30001 00 20/ 66o00000000, n, .)000 00 .o , 0.'c,0. 0)000.. 1.in1" c I'l . cnol 00X, 0 0.050000 0)00000//)000000):o.o. oj-0,000oo0 O" "T0,W G00.0 30):c no 0 ,0, 0 '.50,,0000.0))00 0000 4600)000)0"I I00)00 on'.0 0.00, 0, 00)0000 00)0000000 0 00 000000I000000 22.O00 DO0"000 C) O 10005,0.0,o 1 0,)00000 t0 In0 3000 Ono00' CO10
005').O, 000011. 0
C0000.00co 00.C,O 1-, 1-0000000,0000J0,) 00 on,00, 000- 0000 0 0 0 0 30o0,000))000000050000000000)00030 000000030000.7000000005000000 'r00O"n OOO'c" ono soOOOO"o.0000000c 0000o ,o0'.,,,(Q000,000 W71-7- 1-1-oo.0 ,,,.00000000)0000000-4500.)004000, 10
)06000ooo000o~ "I0~ Uo03 00,0l I00o0.0 G0 000 05000 oOOO.000'; 003000.00.000 '0).0 -11 1,1*000000000.0o .00,000000.,00000000 000 004000., 5) 000005000.00000000000.,11" 0)0 403Go .... 000.oO,.000 Ol.n 0 . ..'000)0090.,0o 0030000,00 00).00070000. 0)n0000000000 "0000. 00 Io5,n1
00600000o O00oO.)000000000 00000000000,~ 000)00~0000o0 00000000.0,000. ;o)0,5002 .,00000co '1.0 )000000)0000.00006000000044000000000.5 co0000000 00 n100 '
600000,,)00- 00 0000,0000000000000 )0&00000o0000'Oo.500000,00000000 0'... 4000003,0c'.00000600,00000 o000000001 00,0.0000000011,00000.000000000000.0' .000Co 10000. A oo)0000',,I 000 0030000'0t00l000.,500 0000.300O 30.2000,0)050 G0),000-.'
00 00040
3 004
000330300000o00000060000000030000,0,,I oO)04)000005000030ol 01,01-000000000000t 000000O..000
0000040000000000.0.060.0 o . C00,301,000)01/ 000000,'.0000000000000On I0000000000 c"I." 1`.ooO1. o'0 .0,0"I
oooco0000000o 5oO,,2.0. .000003000,00 1000000,.0. '01000550000o00)00000 0000000000000
0 0 0 0 0 0 0 0 0 , 0 0 000"" ,0 0 , 0 ) 0 -0 0 0 0 0 ) o 0 0 0 0 ' ) 0 5 0~o o , O O 0 0 0 3 0 0 0(30 0 0 0 0 0 0 0 3 - r 1 )0 0 5 0 000000 ........ 03)0. , "000)0,.30)00. 000000000o U0.00 n0,0000000000) o00 ,0,000. 0', 0 0..0 .
C0GQp D OOU 1- 0)_ 0"D `O7)61- 0ofO01 1031- 4O 01
" .'OLF I U R -1 0.ýr -1 - - , - - -
caontourl' is o~ a ý Oie th"t onet an, inii "0me fcotgosajcngeogaphi p0n localtie ocLnO, LAn), whichnl h5v te am 0A. orth
fctorC. bein mapped.~ ( uj, oý-o Q~jowooaoI Oý0i"-ao h..fl dcuspotr rgam in concins thseii as
factr contrutdfo thatpriua eogdatai point localted as us.o~ in making a. Wahen
hcntounes of ine that4 ontrnecparent incetite numere lai overthc bUSase ap
Ha 'i' u 4 the~ rneul as o ar very firs inemt it)L plot scitsm neto

Hopps: Computer-Produced Distribution Maps 795
1k~ - I
'Jr y l 1:
1:4.......... 7..
FIGURE IF
k~.M ..........rn.......s..t.PSSSSS~tSI ...........PPPP
*...* *... ..............
.. *..........
.............. . 3 *t* ..
............... 9
hwH 12

0 -ýT - _ 7 IFI
796 Annals New York Academy of Sciences
Changing grid sizes, modifying queries, etc. led to a long succession ofmaps, most better, a few worse. Several of these are shown: FIGURES 7 and 8(composite-acetate overlay and base map) indicate a schistosomiasis infectedpopulation living out in the ocean (!) because of an unrealistic extrapolationbetween positive value data points and (inserted) 0 value data poirLa. This
|AF RAY, OF SCVSlTORIASIS I. -AI'I I, ...
.UOA fotA SIJYI-Of',AI[ SVDFAr
AVA M,. I . C . AL I V&t .VOO
A -ALI I' I"V IICL
1 I• At5 eV AL . S0 1 I o. • COt r . [: { ;
I12.21 L IT 0 . A F lC C' . . I' C-I•o.o I. W ...... ..,, 0.. b's C C' ,''
-1,.11 a II ML IAT III°, 0 .. 'A°*** **** C*,,
1..8 1o)'SLJV 1(1*. .... ' VO1.
I.. IA'."p ......lVVVA.
- ,. ... ...r .. .......
- .I. *K . * 'A*• a*
*C ... ........
-i .1 ¶a• j • r , • a • * * * . o * * ..** ...............
-:.. • • . ,• • . .... ... ........... ............ ...
-. ) . V - ... . ........-F.0' E 111
... .. ... .. ... ..
A. A ., II I
8... ..............
situation is corrected in FIGURE 9, but spurious data is represented in western
Brazil and northern Argentina because of fruitless efforts to contour-relate
sparse low incidence values.FIGURE 10 represents an effort to get fast read-out. This seems a plausible
".qujick look" method (based on data in TABLE I ) to determine whether or not
the higher resolution, but slower and more laborious, plotter technique would
h justified.
'sIC A. < ...
8.VI '2V ...
V.V2 ICV1

Hopps: Computer-Produced Distribution Maps 797
FIGURES I I and 12 (based on data from TABLE i) were produced using aNaval oceanographic program. They illustrate the unrealities of data plots ifone bases fine analyses on relatively sparse data, somewhat analogous to averag-ing "rough" Figures such as 10, 9. 7. 3, and carrying out the result to threedecimal places.
/
FIGURE 14.
FIGURE 13 presents a different approach to extrapolation in that it is basedon a sixth-degree trend surface computation.
FIGURE 14 is a hand-drawn map based upon the computer produced linesof FIGURE 13. For reasons not apparent to -is the points of highest disease inci-dence have "drifted."
The most promising system for handling relatively sparse data points is amethod described hy Toblcr` using a simpler algorithm. In essence, it is to useonly the three closest points surrounding a grid point and to fit a plane through
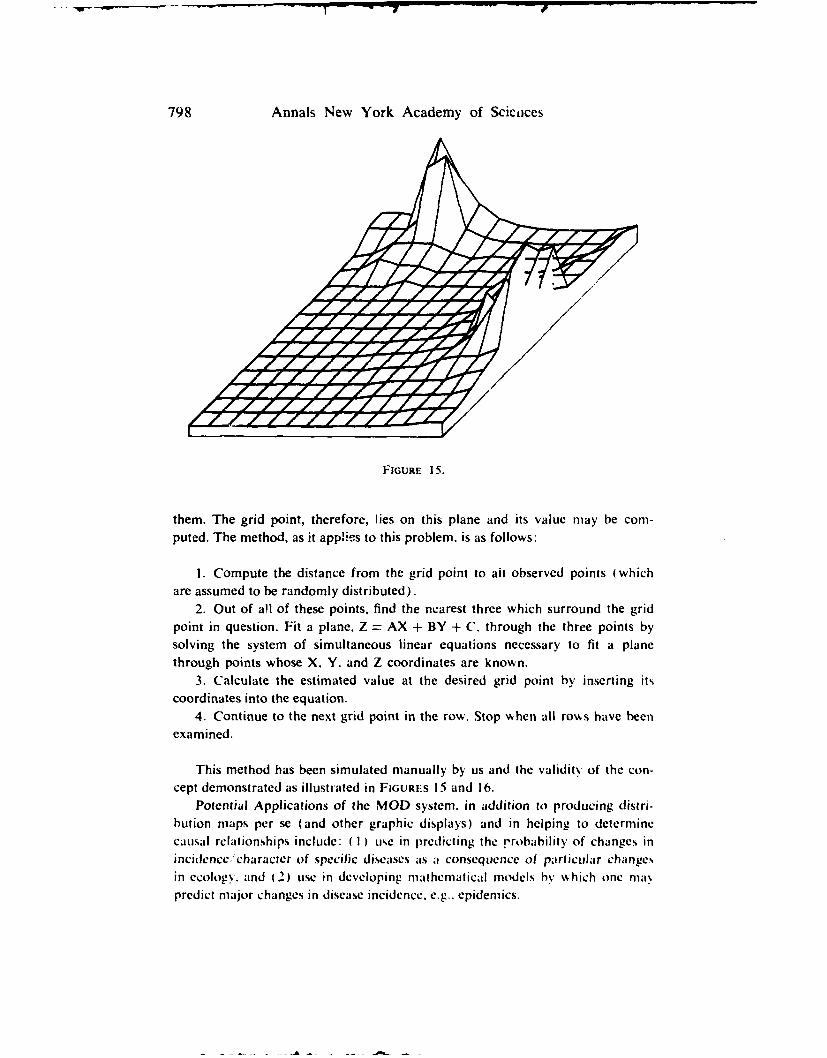
798 Annals New York Academy of Sciences
FIGURE 15.
them. The grid point, therefore, lies on this plane and its value may be com-puted. The method, as it app!.,,s to this problem. is as follows:
1. Compute the distance from the grid point to ali observed points (whichare assumed to be randomly distributed).
2. Out of a!l of these points, find the nearest three which surround the gridpoint in question. Fit a plane, Z = AX + BY + C, through the three points bysolving the system of simultaneous linear equations necessary to fit a planethrough points whose X. Y. and Z coordinates are known.
3. Calculate the estimated value at the desired grid point by inserting itscoordinates into the equation.
4. Continue to the next grid point in the row. Stop when all ro\s have beenexamined.
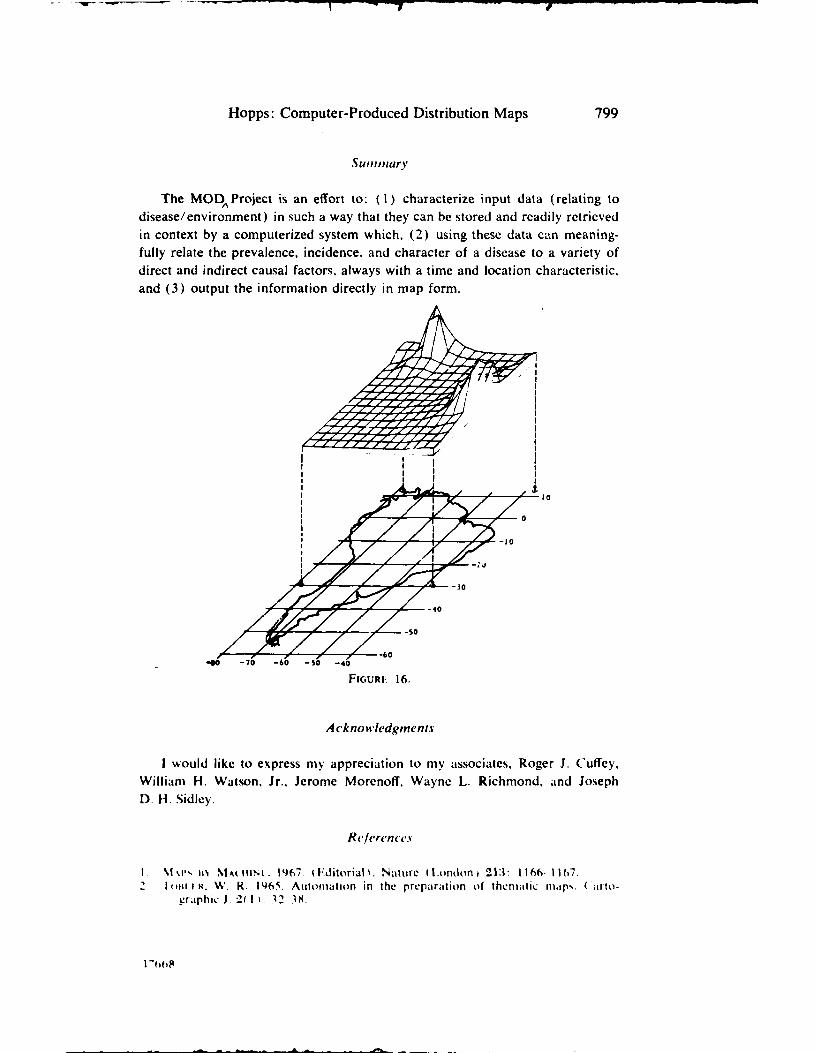
This method has been simulated manually by us and the validity of the con-cept demonstrated as illustrated in FIGURES 15 and 16.
Potential Applications of the MOD system. in addition to producing distri-bution maps per se (and other graphic displays) and in helping to determinecausal relationships include: ( I ) use in predicting the rrobability of changes inincidence 'character of specific diseases as a consequence of particular changesin ecology. and (2) use in developing mathematical models by \ hich one nia\predict major changes in disease incidence. e.g.. epidemics.
Hopps: Computer-Produced Distribution Maps 799
Summary
The MOD,,Project is an effort to: (I) characterize input data (relating todisease/environment) in such a way that they can he stored and readily retrievedin context by a computerized system which, (2) using these data can meaning-fully relate the prevalence, incidence, and character of a disease to a variety ofdirect and indirect causal factors, always with a time and location characteristic,and (3) output the information directly in map form.
//;0
-a -70 -60 -!5 -40
FIGURE 16.
A cknowledgments
I would like to express my appreciation to my associates, Roger J. Cuffey,William H. Watson. Jr.. Jerome Morenoff, Wayne L. Richmond, and JosephD. H. Sidley.
References
I % ,", • M,,IN" . 1967. 1Fditorial . Nature (London, 213: 1166-1167.2 I PI .I H. W, R. 1965. Autionialion in the preparation of theniatic nllap%. ( arto-
graphic J. 2( l , 32 3I .