computer simulation on the effect of...
TRANSCRIPT

Jurnal Teknik Lingkungan Volume 19 Nomor 2, Oktober 2013 (Hal 112-129)
112
COMPUTER SIMULATION ON THE EFFECT OF
FISH CAGE RELOCATION TO NITRATE CONCENTRATION
IN AN ELONGATED RESERVOIR
SIMULASI KOMPUTER TENTANG EFEK PEMINDAHAN
KARAMBA JARING APUNG TERHADAP KONSENTRASI NITRAT
DI RESERVOIR PANJANG
*1Priana Sudjono
and
2Amallia Ashuri
1Dept. of Environment Engineering, Bandung Institute of Technology, Indonesia
2Research Centre of Human Settlement, Bandung, Indonesia
e-mail: [email protected],
Abstract: Fish cages to breed fish for food had grown uncontrollable in Jatiluhur long-shaped reservoir. As the
number of fish cages is pretty high and some additional nutrient from the overland water enters the reservoir,
they can raise Nitrogen concentration in the reservoir water. Nitrogen is one of nutrient that is used by aquatic
weeds to grow so it triggers eutrophication in the reservoir. Then it can give nuisance to the machinery of the
electric generators and the agriculture lands. The research used computer model to prove the reduction of
nitrogen concentrations through relocations of fish cages to upstream sides. The basic idea of reduction is by
taking advantage of the biochemical processes in the flowing water to the outlet gate. The source of nitrogen is
the overland water and the residue of pallet. Then computations on concentrations of Nitrate based on
horizontal scheme that divides the reservoir into some segments along the water flow from inlet to outlet. In a
segment, a homogeneous condition is applied, and the waters move from one segment to the adjacent
downstream segment. Preceding those, scenarios on the percentage of relocated fish cages were developed as it
is a way to obtain amount of reduction of Nitrate concentrations at the outlet zone. It is found that the amounts
of Nitrogen reductions at the outlet zone depend on the number of relocated fish cages and the distance of the
relocated zones.
Keywords: Fish cages, water quality, reservoir, computer model.
Abstrak: Karamba jarring apung untuk membesarkan ikan sebagai makanan telah tumbuh tanpa kontrol di
reservoir bentuk panjang Jatiluhur. Sejalan dengan jumlah karamba yang cukup banyak dan tambahan nutrient
dari aliran limpasan memasuki reservoir dapat meningkatkan konsentrasi Nitrogen di dalam reservoir.
Nitrogen adalah salah satu nutrient yang digunakan oleh tumbuhan air untuk berkembang biak sehingga hal ini
memicu eutrofikasi di revervoir. Kemudian hal ini dapat memberi gangguan pada permesinan di pembangkit
tenaga listrik dan tanah pertanian. Penelitian ini menggunakan model komputer untuk membuktikan terjadinya
penurunan konsentrasi nitrogen melalui pemindahan karamba jaring apung kearah hulu. Ide dasar penurunan
adalah memanfaatkan proses biokimia pada aliran air yang menuju pintu keluar. Sumber Nitrogen adalah
aliran limpasan dan sisa makanan ikan. Kemudian komputasi konsentrasi Nitrate berdasarkan pada skema
horizontal yang dibagi-bagi menjadi segmen sepanjang aliran air dari inlet ke outlet. Di dalam segmen
kondisinya homogen, dan air bergerak dari satu segmen ke segmen dihilirnya. Selanjutnya, skenario pada
persentase pemindahan karamba jaring apung dikembangkan karena hal ini adalah cara untuk mendapatkan
jumlah penurunan konsentrasi nitrate di zona outlet. Akhirnya diperoleh bahwa jumlah penurunan Nitrogen di
zona outlet tergantung pada jumlah karamba jarring apung yang dipindahkan dan jarak pemindahan.
Kata kunci: karamba jaring apung, kualitas air, model k omputer, reservoir.
113 Jurnal Teknik Lingkungan Vol. 19 No. 2 Priana Sudjono dan Amallia Ashuri
INTRODUCTION
Fish cages in reservoirs have been growing uncontrollably since economic crisis stoke Indonesia in
1997. This is a way to provide jobs for people and at the same time it supplies the demand of food.
Unfortunately, fish cages in reservoirs impact quality of the water (i.e. Porter et at., 1987; Degefua et
al., 2011; Demetrio et al., 2011). These situations have been taking place in Jatiluhur reservoir thus
the water contains high concentration of nutrient such as Nitrogen (N) and Phosphorous (P). The
source of nutrient is the residue of fish pellet in addition to the polluted main river inflow and eroded
soil particles from the catchment. In order to restore the water quality, advantages of the
biodegradation process along the reservoir is utilized to reduce the concentration of nutrient in the
outlet zone. The paper discusses the results of computer simulations on the relocation of fish cage to
the upstream side.
There are indications that degradation of water in some reservoirs has been taking place. In
Gajahmungkur reservoir, it was found that the pollutants come from eroded soils about 891 ton per
year (Pujiastuti et al., 2013). Additionally, fish cage contributes 81,963 ton Nitrogen per year and
28,501 ton phosphorous per year. Similarly, it was reported that algal blooming at the surface area of
Sutami reservoir. The phosphorous load is around 39 to 195 kg P per year (Juantari et al., 2013).
Moreover, Achmad (2001) reported that some lakes and reservoir are polluted by domestic wastes
water such as in Batujai reservoir. The Index of Pollution is higher for the reservoir than that for the
main river water. Tjahjo (2010) stated that the main source of pollutant in the cascaded reservoir,
Sagululing, Cirata, and Jatiluhur, is naturally polluted by the eroded materials containing nutrients and
also by residue of fish pellet in cages. Furthermore, Machbub (2010) proposed a solution to increase
the water quality by reducing the number of fish cage. The number of fish cage in Saguling reservoir
should be reduced to about 3600 units, Cirata reservoir to about 7000 units, and Jatiluhur reservoir to
about 6700 units.
There are some forms of Nitrogen in water. In impounded water, nitrogen follows bio-chemical
and physical processes as known as nitrogen cycles. The biochemical processes in the water consists
of photosynthesis, respiration, and degradation of organic materials in the water and the sediment.
Nitrogen is basically found in natural water in such amount that is stable for the consumption of the
ecosystems. Increment of nitrogen by human or nature will stimulate the growth of aquatic weeds as
part of nitrogen cycle. The sun light determines the growth of phytoplankton that raises the
photosynthesis process. The light penetration reduces then the biochemical processes also decrease.
As the velocity of flow is very small, the dead organisms are deposited in the bottom then the
decomposer bacteria will produce NH3. The decomposition process uptakes oxygen in the water then
the dissolved oxygen reduces dramatically that disrupts the biological life in the water. Moreover, the
de-oxygenation may take place as the oxygen is used by organic in the sediment, algae and other
aquatic lives. Nitrification is an oxidation process of ammonia (NH4+) to be nitrate (NO3
-) by
Nitrosomonas bacteria. Nitrate and ammonium can become macrophytes and algae through
assimilation processes. Nitrate may become NO2 to be uptaken by blue green algae or it releases to
air. By taking advantages that nitrogen is degradable; relocation of fish cages upstream may reduce
the concentration at the outlet zones.
Nitrogen in water can be reduced by physical, chemical, and biological process. Physical-chemical
process through coagulation can be applied as physical and chemical characteristics among reservoir
and water treatment may have some similarities. Coagulation can be applied in reservoirs as stated by
Cheng et al. (2003) but the applicability in deep reservoir need further research as chemical compound
will also give nuisance to other aquatic life. Together with the dead micro algae, Nitrogen in the form
of flock will settle down to the bottom and then the sediment can be dredged. Jianga and Shenb
(2006) proposed dredging, although it is costly, as the first step to remove sediment as an internal
loading. In deep reservoir, this way is not practicable. Naturally, in water rich nitrogen, water
hyacinth will grow fast and uncontrollably. Luckily, it can physically be removed from the water to
load on land. As almost all reservoirs in Java contain high nutrient, Tjahjo et al. (2010) suggested
quick actions for controlling and reducing the entering pollutants at the upstream side of Citarum
River. At the same time the number of Fish Cage should be reduced and controlled in order to avoid
further water quality degradation such as eutrophication.
Eutrophication is a gradual process to enrich a water body because the supply of Nitrogen and
Phosphorous is abundant. During the process, nutrient in the water will be conversed by green cell
Jurnal Teknik Lingkungan Vol. 19 No. 2 Priana Sudjono dan Amallia Ashuri 114
through photosynthesis. The green cells, such as phytoplankton and algae, grow producing color and
odor of the water (ie. Peiris and Miguntanna, 2012; Smith et al., 1999). The dead aquatic weeds will
settle down at the bottom and the degradation process will occur. The effects of eutrophication
process in each reservoir vary temporally and spatially as it is under the influence of hydrodynamic of
water flowing through the reservoir (ie. Boegman et al., 2001; Xu et al., 2010; Dingguo et al., 2011).
Taking account of the hydrodynamic characteristics, Sudjono (2003) stated that the quality of water
flowing through the elongated reservoir such as Jatiluhur reservoir is not uniform. The hydrodynamic
characteristic is under the influence of physical characteristics of the reservoir such as depth,
hydraulic radius, and the shoreline number. The consequence of those characteristics is that sun light
penetration varies then physical and biochemical processes are spatially differs.
The fate of nitrogen in the water needs to be predicted in order to manage the concentration. Under
the role of bio-chemical processes, the nitrogen as nutrient for aquatic lives is closely related to the
hydrodynamic of the flowing water in the reservoir and the physical characteristics of the reservoir
such as depth and the riverine shaped or shoreline number. To comprehend the process, several
research related to the nitrogen cycle in reservoir had been done. The information on the rate of
nitrification, denitrification, deposition and death rate of the aquatic live had been investigated but the
applicability depends on the local conditions. The cycle of nitrogen is transformed into mathematical
forms by making use of some coefficients found in laboratory research. It concerns on the
transformation of nitrification, denitrification, degradation, and deposition. Additional problem is
about data scarcity that is commonly found in developing countries. So the prediction may not reach
accurate results. However, the alteration of water quality in respect to the change in some source of
pollutants should be possible to be explained through simulation results.
Mathematic models on water quality in impounded waters had been developed since half century
ago. The model can be in the form of empirical formulae or numerical formulation. Several empirical
formulae to estimate the role of nutrient had been developed, eg. Vollenweider (1976); Jones and
Bachmann (1976), Dillon and Rigler (1975). Lake Okeechobee had also been studied by
implementing those formulae and the modified by Kratzer and Brezonik (1984). Their formulae were
developed based on data of a specific reservoir so that the formulae may be only applicable for the
specified reservoirs (Sudjono and Novendra, 2002). Previous research confirmed that the fate of
Nitrogen is under the influence of hydrodynamics of flowing water in a reservoir (Boegman et al.,
2001; Dingguo et al., 2011). Some developers implement several numerical methods such as Runge-
Kutta in solving the equations (Ali, 1974). Water quality models had already been initiated in many
part of the world. For example in Japan (Kusuda, 1984), in Lake Burley Griffin (Cullen et al., 1979).
Moreover, DHL (1986) demonstrate a transport model in a reservoir based on schematization of
nutrient cycle in water. There are basically two schemes applied in a model, these are one box for
mostly uniform conditions and multiple boxes for non uniform conditions. Further study by Sudjono
(2003) indicates that in elongated reservoirs, the biochemical and physical processes are not uniform
for every part along the water flow. The significant differences on depth, velocity of flow, temperature
stratifications may be the reasons to produce segmentation along the water flow as this research will
take advantages upon these situations.
Even though nitrate is not the only chemicals compound causing water quality degradation in a
reservoir, its role to speed up the eutrophication processes is significant. The source of Nitrogen can
be internal activity such as fish breeding and external activities such as agriculture in the catchment
area. One of the efforts to reduce Nitrogen in outlet zones is fish cage relocations to upstream sites of
the reservoir. In the research, simulations of the nitrate reduction as a result of fish cage relocations
are conducted by using a mathematic model based on horizontal segmentation of elongated reservoir.
COMPUTATIONAL METHODS
The computation on overland flow
Rainwater drops on a segment, then it will infiltrate through the soil pores in to lower soil layer in
case it has not been filled with water yet or unsaturated. The water in soil layers will move
horizontally to the downstream direction making the downstream soil layers quickly saturated. The
horizontal subsurface flow to saturated layer will emerge to the upper soil layers as return flow. Rain
on to saturated layers will be overland water. The amount of flowing water from an area is the

115 Jurnal Teknik Lingkungan Vol. 19 No. 2 Priana Sudjono dan Amallia Ashuri
combination of overland flow and returned flow. The processes of flow generation are schematized in
Figure 1.
The study area is divided into array for the right side and the left side of the reservoir as shown in
Figure 2. The division of the catchment into arrays depends on the topography and the velocity of
water flowing in the reservoir. An array, then, is divided into segments. The length of the segment
depends on the average overland flow velocity. The properties of the area and the surface slope
influence the overland flow velocity. Every segment is horizontally divided into layers that the main
characteristic of a layer is the hydraulic conductivity. In order to compute the quantity of overland
flow, the overland flow was calculated using computer model ISTFM (Sudjono, 1995 and 2003).
Figure 2. The segment in the Jatiluhur reservoir
The basic computation of the overland flow and subsurface flow in a soil layer is based on the
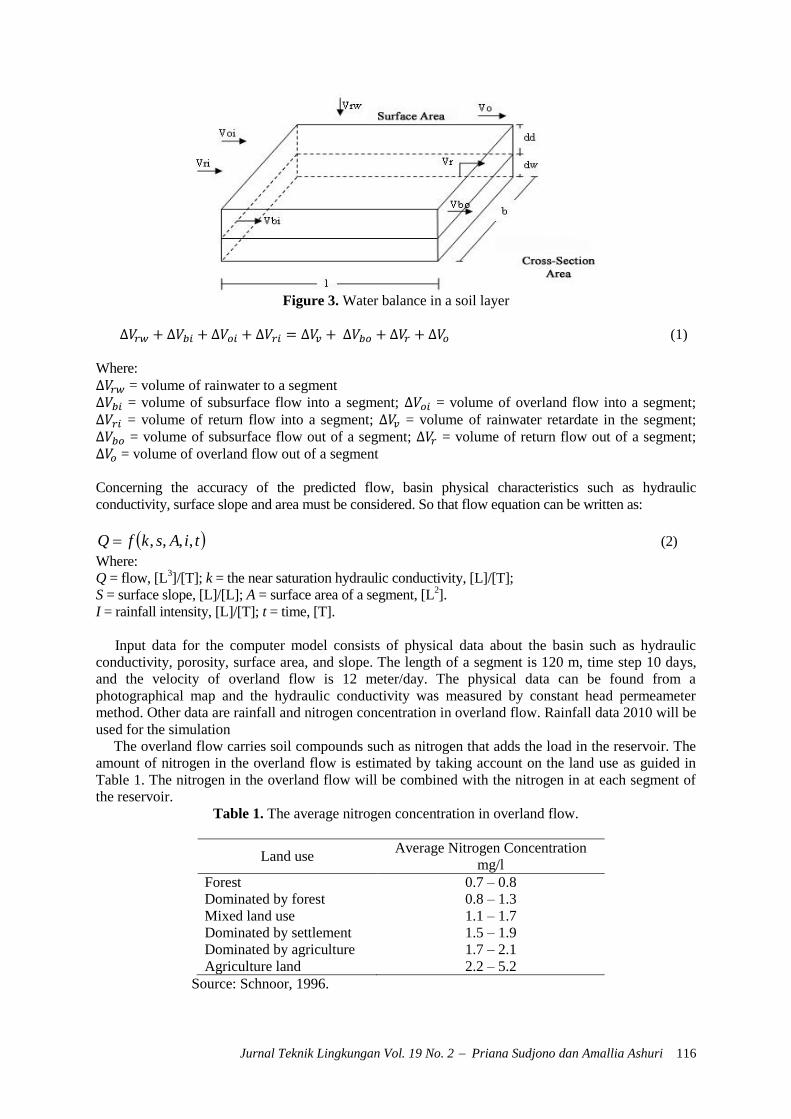
water balance at every soil layer as a piece of land as shown in Figure 3. The principle of water
balance in a soil layer is in equation 1
Figure 1. Rainfall in generating stream water
Jurnal Teknik Lingkungan Vol. 19 No. 2 Priana Sudjono dan Amallia Ashuri 116
Figure 3. Water balance in a soil layer
∆𝑉𝑟𝑤 + ∆𝑉𝑏𝑖 + ∆𝑉𝑜𝑖 + ∆𝑉𝑟𝑖 = ∆𝑉𝑣 + ∆𝑉𝑏𝑜 + ∆𝑉𝑟 + ∆𝑉𝑜 (1)
Where:
∆𝑉𝑟𝑤 = volume of rainwater to a segment
∆𝑉𝑏𝑖 = volume of subsurface flow into a segment; ∆𝑉𝑜𝑖 = volume of overland flow into a segment;
∆𝑉𝑟𝑖 = volume of return flow into a segment; ∆𝑉𝑣 = volume of rainwater retardate in the segment;
∆𝑉𝑏𝑜 = volume of subsurface flow out of a segment; ∆𝑉𝑟 = volume of return flow out of a segment;
∆𝑉𝑜 = volume of overland flow out of a segment
Concerning the accuracy of the predicted flow, basin physical characteristics such as hydraulic
conductivity, surface slope and area must be considered. So that flow equation can be written as:
tiAskfQ ,,,, (2)
Where:
Q = flow, [L3]/[T]; k = the near saturation hydraulic conductivity, [L]/[T];
S = surface slope, [L]/[L]; A = surface area of a segment, [L2].
I = rainfall intensity, [L]/[T]; t = time, [T].
Input data for the computer model consists of physical data about the basin such as hydraulic
conductivity, porosity, surface area, and slope. The length of a segment is 120 m, time step 10 days,
and the velocity of overland flow is 12 meter/day. The physical data can be found from a
photographical map and the hydraulic conductivity was measured by constant head permeameter
method. Other data are rainfall and nitrogen concentration in overland flow. Rainfall data 2010 will be
used for the simulation
The overland flow carries soil compounds such as nitrogen that adds the load in the reservoir. The
amount of nitrogen in the overland flow is estimated by taking account on the land use as guided in
Table 1. The nitrogen in the overland flow will be combined with the nitrogen in at each segment of
the reservoir.
Table 1. The average nitrogen concentration in overland flow.
Land use Average Nitrogen Concentration
mg/l
Forest 0.7 – 0.8
Dominated by forest 0.8 – 1.3
Mixed land use 1.1 – 1.7
Dominated by settlement 1.5 – 1.9
Dominated by agriculture 1.7 – 2.1
Agriculture land 2.2 – 5.2
Source: Schnoor, 1996.

117 Jurnal Teknik Lingkungan Vol. 19 No. 2 Priana Sudjono dan Amallia Ashuri
Prediction on Nitrate Concentration along the Reservoir
TREM (Tropical Reservoir Eutrophication Model) was developed to predict alteration of chemical
concentrations in an elongated reservoir such as Jatiluhur (Sudjono 2003). It is assumed that the
condition in the segment is steady state and completely mixed. The application of the TREM requires
the Jatiluhur reservoir to be divided into 9 segments where the water detention in a segment is the
length of a time step (Δt). Then the water will move to aside downstream segment. In other words, the
water in the segment comes from the upstream segment together with overland flow from the
segment’s catchment area. The most upstream segment receives water from the mainstream, Citarum
River, and the overland flow from the catchment of the segment. At the most downstream segment,
the water moves out through the outlet gate. Evaporation and water withdrawn by Water Supply
Company are also taken into consideration. The schematized figure on the movement of the water in
the reservoir is depicted in Figure 4.
Figure 4. The scheme of horizontal segmentation of a reservoir
Equation (3) is applied for the most upstream segment or the first segment.
𝑉1𝑡 = 𝑉𝑟1
𝑡 + 𝑉𝑠1𝑡 − 𝑉𝑜1
𝑡 (3)
𝑉𝑟1𝑡 is the volume of the main river entering the reservoir.
Assuming that the water will move to the ` downstream segment, the equation (4) can be applied.
𝑉𝑛𝑡 = 𝑉𝑛−1
𝑡−1 + 𝑉𝑠𝑛𝑡 − 𝑉𝑜𝑛
𝑡 (4)
Where, 𝑉𝑛−1𝑡−1 is the volume of water from the previous segment at the previous time (t-1); 𝑉𝑠𝑛
𝑡 is the
volume of overland flow; 𝑉𝑜𝑛𝑡 is the volume of water loss.
Pollutant in the reservoir can be from the river water, overland flow, and activities in the reservoir
such as fish culture. The computation needs those data at each segment.
The nitrogen balance for the most upstream segment is presented in equation (5)
𝐿𝑛𝑡 = 𝐿𝑟1
𝑡 + 𝐿𝑖1𝑡 − 𝑙1
𝑡 (5)
For other segments, equation (6) can be applied
𝐿𝑛𝑡 = 𝐿𝑟𝑛−1
𝑡−1 + 𝐿𝑖𝑛𝑡 − 𝑙𝑛
𝑡 (6)
During a time step (∆t), the concentration of nitrogen will change following first order of reaction as
presented in equation (7).
Cnt = Cn−1
t−1 𝑒−𝑘∆𝑡 (7)
Where Cnt is the concentration of Nitrogen at segment (n) at time (t), and k is the coefficient of first
order reaction. The application of first order of reaction can only produce rough estimations. A
comprehensive equation on nitrogen degradation can be applied into the TREM.
Computer Simulation
The goal of the simulation is to investigate the reduction of nitrate in the outlet zone as a result of
fish cage relocation. The variable of the simulation is the number of fish cage relocated from segment
8th and the location of the relocated fish cage, ie. Segment second, third, and fourth. The number of
relocated and location for the simulation are presented in Table 2. Preceding the simulation,
computation on overland flow in the reservoir catchment was done.

Jurnal Teknik Lingkungan Vol. 19 No. 2 Priana Sudjono dan Amallia Ashuri 118
Table 2. The scenario of the Fish Cage relocation from segment 8th
Scenari
o
Segment
for the
relocatio
n
The
percentage of
the relocated
fish cages
A Segment
2nd
20
B 50
C 100
D Segment
3rd
20
E 50
F 100
G Segment
4th
20
H 50
I 100
The shape of Jatiluhur reservoir is river like following the main river of Citarum. The reservoir is
divided into segments that are equal in volume as shown in Figure 4. By dividing the reservoir into
segments accordance to flow direction, the elongated reservoir may considered as completely mixed
conditions for every segment. In other words, the applied model is based on horizontal segmentation
across flow directions.
THE JATILUHUR RESERVOIR
Fish Cage in the Reservoir
The study area is Jatiluhur reservoir that diverts Citarum River. The function of the reservoir is
water irrigation and electric generation. Since last decade, people cultivate fish in floating cages. The
number fish cage grew 8673 units between March 2005 and August 2006 and at the current time it is
more than 20000 units. As shown in Figure 5, the number of fish cages was still growing and Figure 6
shows the location or the fish cage. The reason of growth is that the fish production was very high as
the quality of water was relatively acceptable for fish breeding. Moreover, the growth is stimulated by
wrong notion that reservoir is a common property and it is an open access for everyone to utilize or
take the benefit.
Figure 5. The growth of fish cage in Jatiluhur Reservoir
119 Jurnal Teknik Lingkungan Vol. 19 No. 2 Priana Sudjono dan Amallia Ashuri
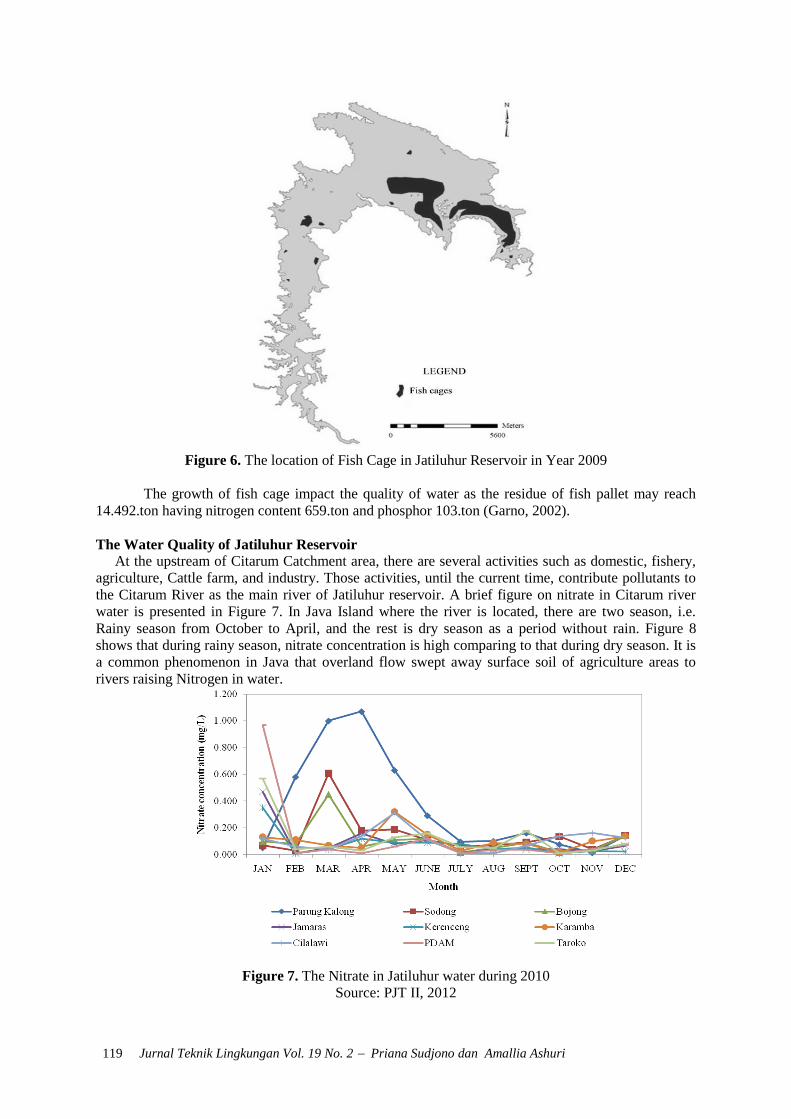
Figure 6. The location of Fish Cage in Jatiluhur Reservoir in Year 2009
The growth of fish cage impact the quality of water as the residue of fish pallet may reach
14.492.ton having nitrogen content 659.ton and phosphor 103.ton (Garno, 2002).
The Water Quality of Jatiluhur Reservoir
At the upstream of Citarum Catchment area, there are several activities such as domestic, fishery,
agriculture, Cattle farm, and industry. Those activities, until the current time, contribute pollutants to
the Citarum River as the main river of Jatiluhur reservoir. A brief figure on nitrate in Citarum river
water is presented in Figure 7. In Java Island where the river is located, there are two season, i.e.
Rainy season from October to April, and the rest is dry season as a period without rain. Figure 8
shows that during rainy season, nitrate concentration is high comparing to that during dry season. It is
a common phenomenon in Java that overland flow swept away surface soil of agriculture areas to
rivers raising Nitrogen in water.
Figure 7. The Nitrate in Jatiluhur water during 2010
Source: PJT II, 2012
Jurnal Teknik Lingkungan Vol. 19 No. 2 Priana Sudjono dan Amallia Ashuri 120
In general, the quality of Citarum water is low for raw water supply and even for fish
breeding (Ilosangi, 2001). Moreover, measurement at 25 points along Jatiluhur reservoir done by
Sukristiyanti et al. (2007), found that water turbidity at some points is around 0.3 – 11 NTU.
Further research found that it is caused by some activities at the upsream side and at the vicinity of
the reservoir such as domestics, cattle farm, agriculture, and industry, and activity in the reservoir
such as fish breeding in cages (Garno, 2003). In fact, fish breeding activity using fish cage raises the
water fertility indicated by rising concentration of phosphorous, phytoplankton and sediment. The fish
feed contain 4.86 percent nitrogen and 0.26 to 1 percent phosphorous (Nastiti et al., 2001). The
excessive feeding may enrich nutrient in water that promotes algae and phytoplankton blooming.
It is estimated that those activities contribute 0.88 mg N/L and 0.06 mg P/L in which those
amounts exceed the concentration to reach eutrophication process, i.e. 0.3 mg-N/L and 0.01 mg-P/L.
Additionally, contribution from fish breeding activity is 3.1 ton-N/year and 128 kg-P/year (Abery et
al., 2005). Nitrogen in nature is dominated by Nitrate as it is the most stable form comparing to
Ammonia and Nitrite. Jong et al. (2009) estimated that pollution of Nitrate rise 2.3 percent annually.
High Nitrate concentration may promote eutrophication and it will increase nuisance to water
purification and machinery of electric generation, and agriculture products.
RESULTS AND DISUSSION
The computation on Nitrate concentration in the reservoir water begun from the estimation of
overland flow on the catchment area. As the reservoir is divided into some segments, the existence of
fish cages belongs to the segments. Relocation of the fish cages as set in the scenario is analyzed for
its effects to Nitrate concentration in all segments.
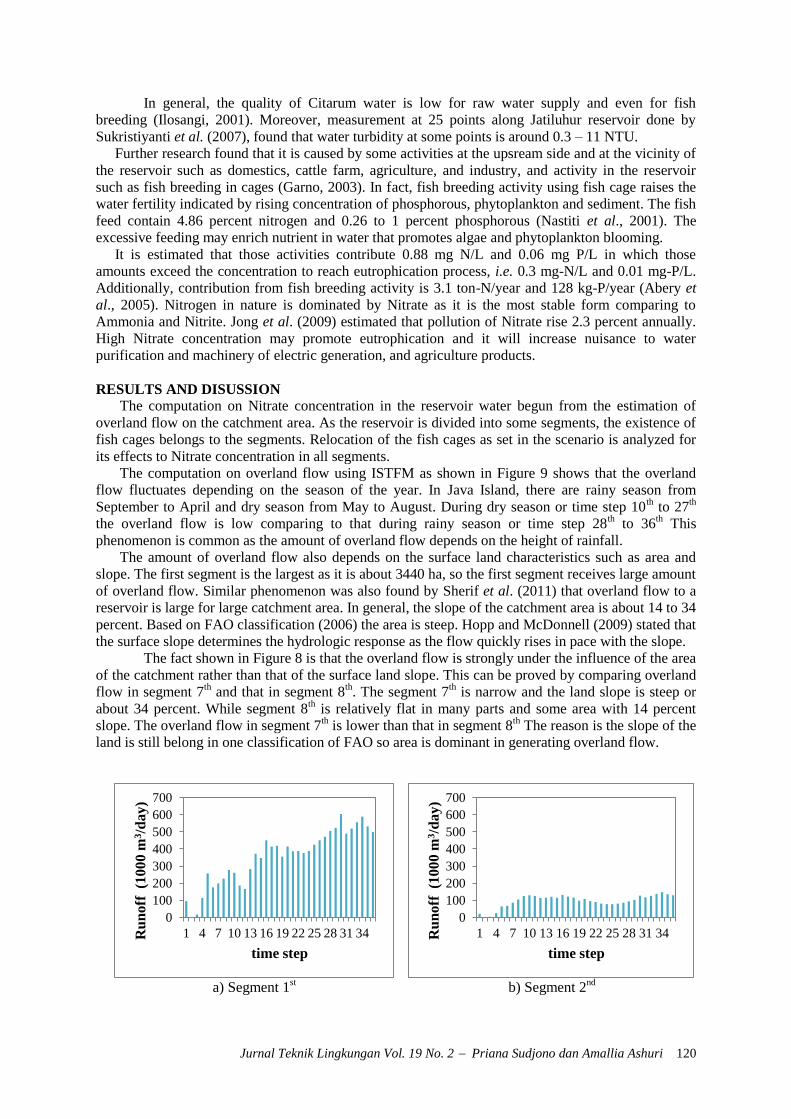
The computation on overland flow using ISTFM as shown in Figure 9 shows that the overland
flow fluctuates depending on the season of the year. In Java Island, there are rainy season from
September to April and dry season from May to August. During dry season or time step 10th to 27
th
the overland flow is low comparing to that during rainy season or time step 28th to 36
th This
phenomenon is common as the amount of overland flow depends on the height of rainfall.
The amount of overland flow also depends on the surface land characteristics such as area and
slope. The first segment is the largest as it is about 3440 ha, so the first segment receives large amount
of overland flow. Similar phenomenon was also found by Sherif et al. (2011) that overland flow to a
reservoir is large for large catchment area. In general, the slope of the catchment area is about 14 to 34
percent. Based on FAO classification (2006) the area is steep. Hopp and McDonnell (2009) stated that
the surface slope determines the hydrologic response as the flow quickly rises in pace with the slope.
The fact shown in Figure 8 is that the overland flow is strongly under the influence of the area
of the catchment rather than that of the surface land slope. This can be proved by comparing overland
flow in segment 7th and that in segment 8
th. The segment 7
th is narrow and the land slope is steep or
about 34 percent. While segment 8th is relatively flat in many parts and some area with 14 percent
slope. The overland flow in segment 7th is lower than that in segment 8
th The reason is the slope of the
land is still belong in one classification of FAO so area is dominant in generating overland flow.
a) Segment 1
st
b) Segment 2
nd
0
100
200
300
400
500
600
700
1 4 7 10 13 16 19 22 25 28 31 34Ru
no
ff (1
00
0 m
3/d
ay
)
time step
0
100
200
300
400
500
600
700
1 4 7 10 13 16 19 22 25 28 31 34Ru
no
ff (1
00
0 m
3/d
ay
)
time step

121 Jurnal Teknik Lingkungan Vol. 19 No. 2 Priana Sudjono dan Amallia Ashuri
c) Segment 3
rd
d) Segment 4
th
e) Segment 5
th
f) Segment 6
th
g) Segment 7
th
h) Segment 8
th
i) Segment 9
th
Figure 8. The overland flow on segments through the year
0
100
200
300
400
500
600
700
1 4 7 10 13 16 19 22 25 28 31 34
Ru
no
ff (1
00
0 m
3/d
ay
)
time step
0
100
200
300
400
500
600
700
1 4 7 10 13 16 19 22 25 28 31 34Ru
no
ff (1
00
0 m
3/d
ay
)
time step
0
100
200
300
400
500
600
700
1 4 7 10 13 16 19 22 25 28 31 34Ru
noff
(1
00
0 m
3/d
ay
)
time step
0
100
200
300
400
500
600
700
1 4 7 10 13 16 19 22 25 28 31 34Ru
no
ff (1
000 m
3/d
ay)
time step
0
100
200
300
400
500
600
700
1 4 7 10 13 16 19 22 25 28 31 34
Ru
noff
(1
000 m
3/s
)
time step
0
100
200
300
400
500
600
700
1 4 7 10 13 16 19 22 25 28 31 34
Ru
noff
(1
000 m
3/s
)
time step
0
100
200
300
400
500
600
700
1 4 7 10 13 16 19 22 25 28 31 34
Ru
no
ff (1
00
0 m
3/s
)
time step
Jurnal Teknik Lingkungan Vol. 19 No. 2 Priana Sudjono dan Amallia Ashuri 122
The overland flow leaches surface soil then some amount of soils containing nutrients are
brought to the reservoir. The amount of nutrient depends mostly on the rainfall height or the amount
of the overland flow. Addition to that, the amount of nutrient depends on the soil types, the agriculture
activity, the surface slope, and the variation of land use (Chen et al., 2012). The amount of nutrient
brought from agriculture lands is the most significant (Wu et al., 2012). Moreover agriculture practice
using excessive fertilizer and compost from animal manure is the main source of nutrient (Carpenter
et al., 1998). The rate of nitrogen up taken by plant cannot keep pace with the application of fertilizer
that is usually excessive (Howarth et al., 2002). In the computation, the nutrient in the form of Nitrate
in the overland flow is added to the nitrate that has already been in the reservoir at each segment.
Even though, the amount of nitrogen in the overland flow is still very low comparing to that in the
water of polluted Citarum River.
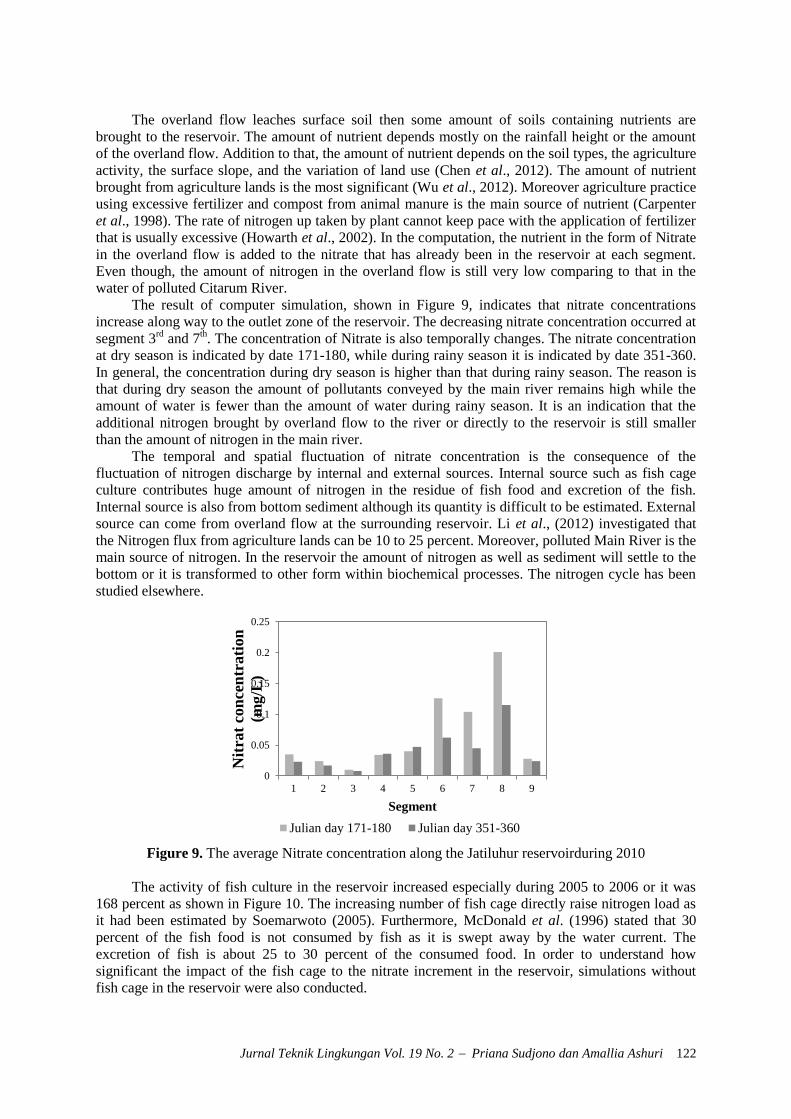
The result of computer simulation, shown in Figure 9, indicates that nitrate concentrations
increase along way to the outlet zone of the reservoir. The decreasing nitrate concentration occurred at
segment 3rd
and 7th. The concentration of Nitrate is also temporally changes. The nitrate concentration
at dry season is indicated by date 171-180, while during rainy season it is indicated by date 351-360.
In general, the concentration during dry season is higher than that during rainy season. The reason is
that during dry season the amount of pollutants conveyed by the main river remains high while the
amount of water is fewer than the amount of water during rainy season. It is an indication that the
additional nitrogen brought by overland flow to the river or directly to the reservoir is still smaller
than the amount of nitrogen in the main river.
The temporal and spatial fluctuation of nitrate concentration is the consequence of the
fluctuation of nitrogen discharge by internal and external sources. Internal source such as fish cage
culture contributes huge amount of nitrogen in the residue of fish food and excretion of the fish.
Internal source is also from bottom sediment although its quantity is difficult to be estimated. External
source can come from overland flow at the surrounding reservoir. Li et al., (2012) investigated that
the Nitrogen flux from agriculture lands can be 10 to 25 percent. Moreover, polluted Main River is the
main source of nitrogen. In the reservoir the amount of nitrogen as well as sediment will settle to the
bottom or it is transformed to other form within biochemical processes. The nitrogen cycle has been
studied elsewhere.
Figure 9. The average Nitrate concentration along the Jatiluhur reservoirduring 2010
The activity of fish culture in the reservoir increased especially during 2005 to 2006 or it was
168 percent as shown in Figure 10. The increasing number of fish cage directly raise nitrogen load as
it had been estimated by Soemarwoto (2005). Furthermore, McDonald et al. (1996) stated that 30
percent of the fish food is not consumed by fish as it is swept away by the water current. The
excretion of fish is about 25 to 30 percent of the consumed food. In order to understand how
significant the impact of the fish cage to the nitrate increment in the reservoir, simulations without
fish cage in the reservoir were also conducted.
0
0.05
0.1
0.15
0.2
0.25
1 2 3 4 5 6 7 8 9
Nit
rat
con
cen
trati
on
(mg/L
)
Segment
Julian day 171-180 Julian day 351-360
123 Jurnal Teknik Lingkungan Vol. 19 No. 2 Priana Sudjono dan Amallia Ashuri
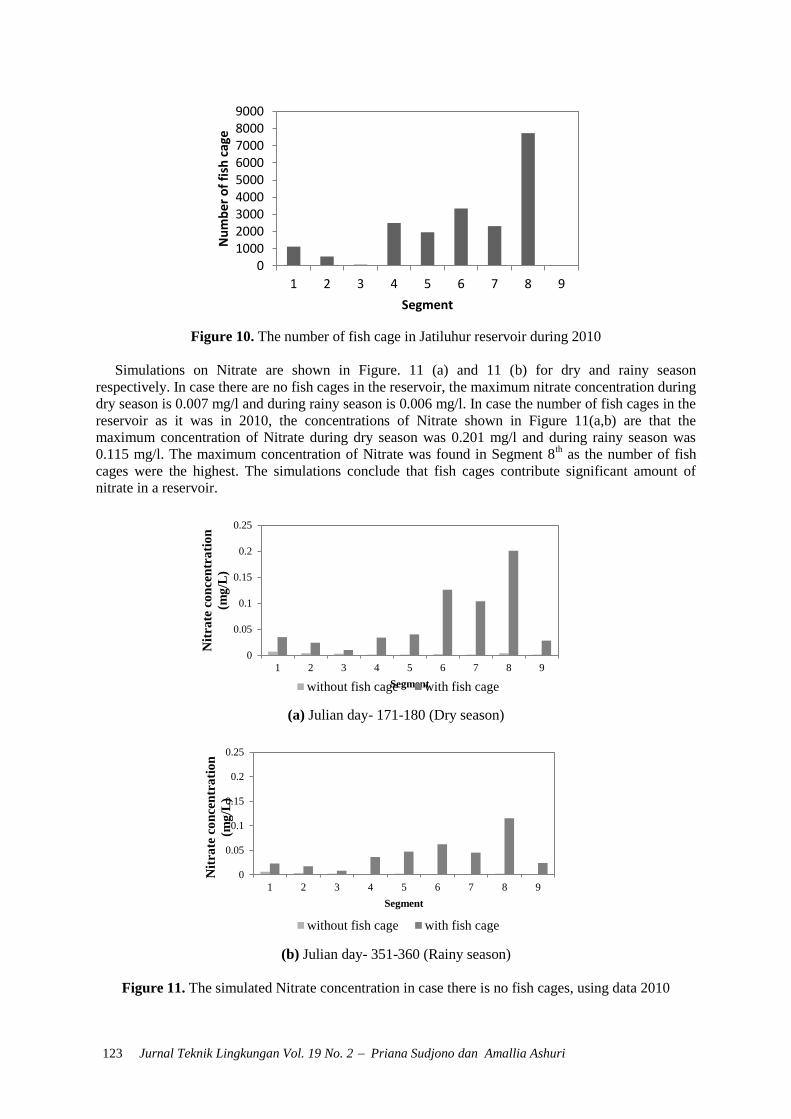
Figure 10. The number of fish cage in Jatiluhur reservoir during 2010
Simulations on Nitrate are shown in Figure. 11 (a) and 11 (b) for dry and rainy season
respectively. In case there are no fish cages in the reservoir, the maximum nitrate concentration during
dry season is 0.007 mg/l and during rainy season is 0.006 mg/l. In case the number of fish cages in the
reservoir as it was in 2010, the concentrations of Nitrate shown in Figure 11(a,b) are that the
maximum concentration of Nitrate during dry season was 0.201 mg/l and during rainy season was
0.115 mg/l. The maximum concentration of Nitrate was found in Segment 8th as the number of fish
cages were the highest. The simulations conclude that fish cages contribute significant amount of
nitrate in a reservoir.
(a) Julian day- 171-180 (Dry season)
(b) Julian day- 351-360 (Rainy season)
Figure 11. The simulated Nitrate concentration in case there is no fish cages, using data 2010
0100020003000400050006000700080009000
1 2 3 4 5 6 7 8 9
Nu
mb
er o
f fi
sh c
age
Segment
0
0.05
0.1
0.15
0.2
0.25
1 2 3 4 5 6 7 8 9
Nit
rate
co
nce
ntr
ati
on
(mg
/L)
Segment without fish cage with fish cage
0
0.05
0.1
0.15
0.2
0.25
1 2 3 4 5 6 7 8 9
Nit
rate
co
nce
ntr
ati
on
(mg
/L)
Segment
without fish cage with fish cage
Jurnal Teknik Lingkungan Vol. 19 No. 2 Priana Sudjono dan Amallia Ashuri 124
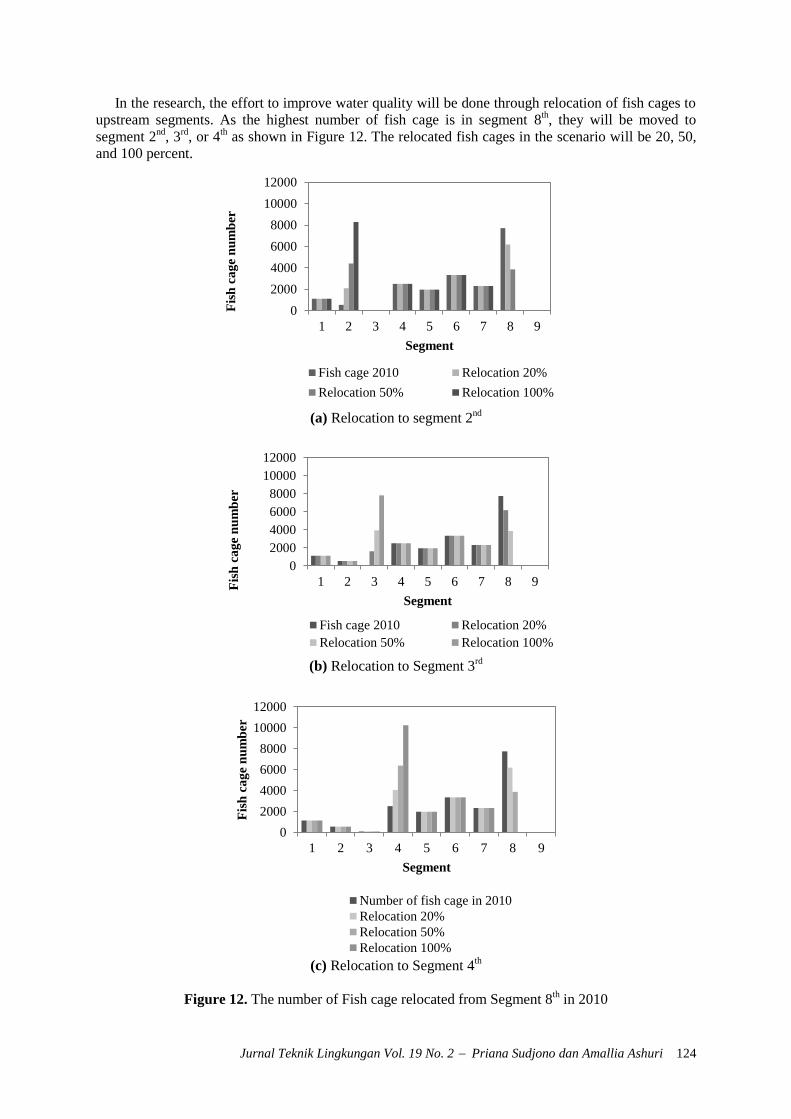
In the research, the effort to improve water quality will be done through relocation of fish cages to
upstream segments. As the highest number of fish cage is in segment 8th, they will be moved to
segment 2nd
, 3rd
, or 4th as shown in Figure 12. The relocated fish cages in the scenario will be 20, 50,
and 100 percent.
(a) Relocation to segment 2
nd
(b) Relocation to Segment 3
rd
(c) Relocation to Segment 4
th
Figure 12. The number of Fish cage relocated from Segment 8th in 2010
0
2000
4000
6000
8000
10000
12000
1 2 3 4 5 6 7 8 9
Fis
h c
ag
e n
um
ber
Segment
Fish cage 2010 Relocation 20%
Relocation 50% Relocation 100%
0
2000
4000
6000
8000
10000
12000
1 2 3 4 5 6 7 8 9Fis
h c
ag
e n
um
ber
Segment
Fish cage 2010 Relocation 20%
Relocation 50% Relocation 100%
0
2000
4000
6000
8000
10000
12000
1 2 3 4 5 6 7 8 9
Fis
h c
ag
e n
um
ber
Segment
Number of fish cage in 2010
Relocation 20%
Relocation 50%
Relocation 100%

125 Jurnal Teknik Lingkungan Vol. 19 No. 2 Priana Sudjono dan Amallia Ashuri
The estimated amount of Nitrate from fish cage activity depends on the number of fish cage. The
Nitrate added to the targeted segment is 2.1 ton/day, 5.26 ton/day, and 10.52 ton/ day for relocation 20
percent, 50 percent, and 100 percent respectively. Consequently, the increment of nitrate
concentration in segment 2nd
is 1.40 percent, 3.49 percent, and 6.98 percent in case the number of fish
cage from segment 8th is 20 percent, 50 percent, and 100 percent respectively as shown in Figure
13(a). Similarly, the increment of nitrate in segment 3rd
is 2.86 percent, 7.17 percent, and 14.35
percent as shown in Figure 13(b). The same pattern is also happen for segment 4th these are 0.57
percent, 1.43 percent and 2.86 percent as shown in Figure 13(c). In case the indication of the
increment of nitrate concentration is in percentage, the results can be confusing as the percentage is
the comparison of the concentration to the measured data. In general, the Nitrate concentrations at the
targeted segments increase proportional to the number of fish cage received. While the Nitrate
concentration of the origin segment or segment 8th reduces by the amount proportional to the removed
fish cages.
a. Relocation to segment 2nd
b. Relocation to segment 3rd
c. Relocation to Segment 4
th
Figure 13. The Nitrate concentration caused by relocation of fish cage from segment 8th
0
0.05
0.1
0.15
0.2
0.25
1 2 3 4 5 6 7 8 9Nit
rate
co
nce
ntr
ati
on
(mg
/L)
Segment Condition in 2010 Relocation 20%Relocation 50% Relocation 100%
0
0.05
0.1
0.15
0.2
0.25
1 2 3 4 5 6 7 8 9
Nit
rate
co
nce
ntr
ati
on
(mg
/L)
Segment Condition in 2010 Relocation 20%
Relocation 50% Relocation 100%
Jurnal Teknik Lingkungan Vol. 19 No. 2 Priana Sudjono dan Amallia Ashuri 126
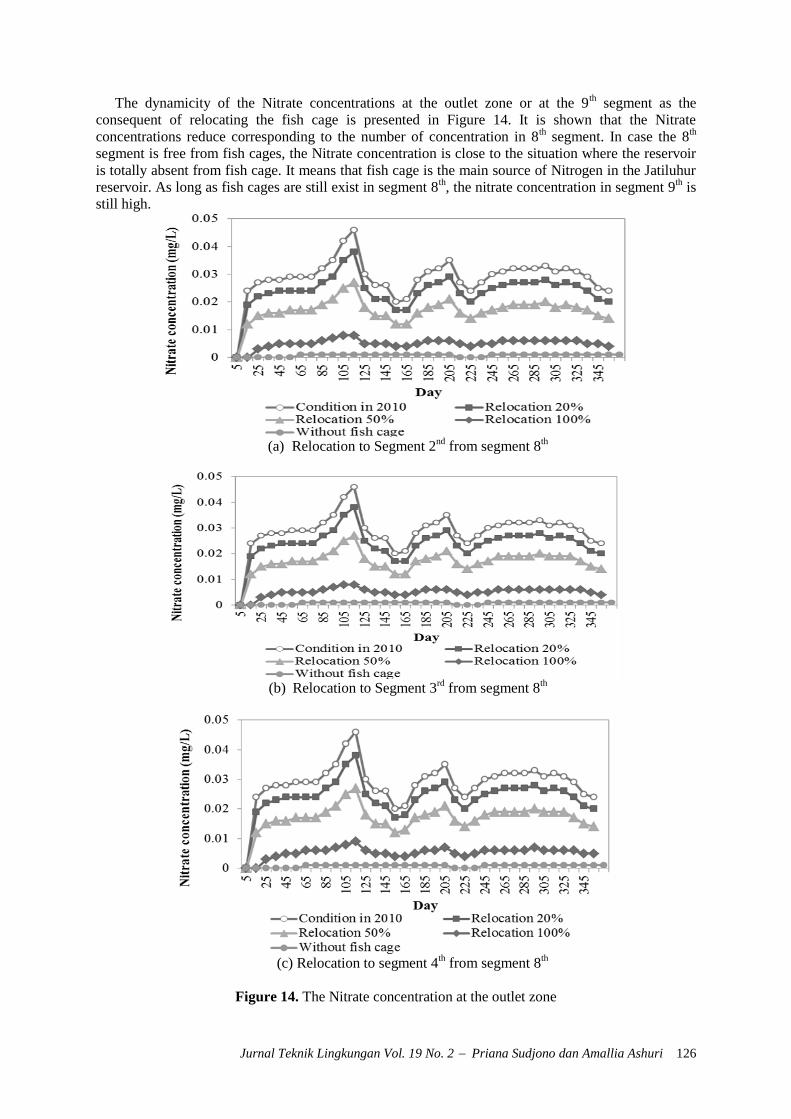
The dynamicity of the Nitrate concentrations at the outlet zone or at the 9th segment as the
consequent of relocating the fish cage is presented in Figure 14. It is shown that the Nitrate
concentrations reduce corresponding to the number of concentration in 8th segment. In case the 8
th
segment is free from fish cages, the Nitrate concentration is close to the situation where the reservoir
is totally absent from fish cage. It means that fish cage is the main source of Nitrogen in the Jatiluhur
reservoir. As long as fish cages are still exist in segment 8th, the nitrate concentration in segment 9
th is
still high.
(a) Relocation to Segment 2
nd from segment 8
th
(b) Relocation to Segment 3
rd from segment 8
th
(c) Relocation to segment 4
th from segment 8
th
Figure 14. The Nitrate concentration at the outlet zone
127 Jurnal Teknik Lingkungan Vol. 19 No. 2 Priana Sudjono dan Amallia Ashuri
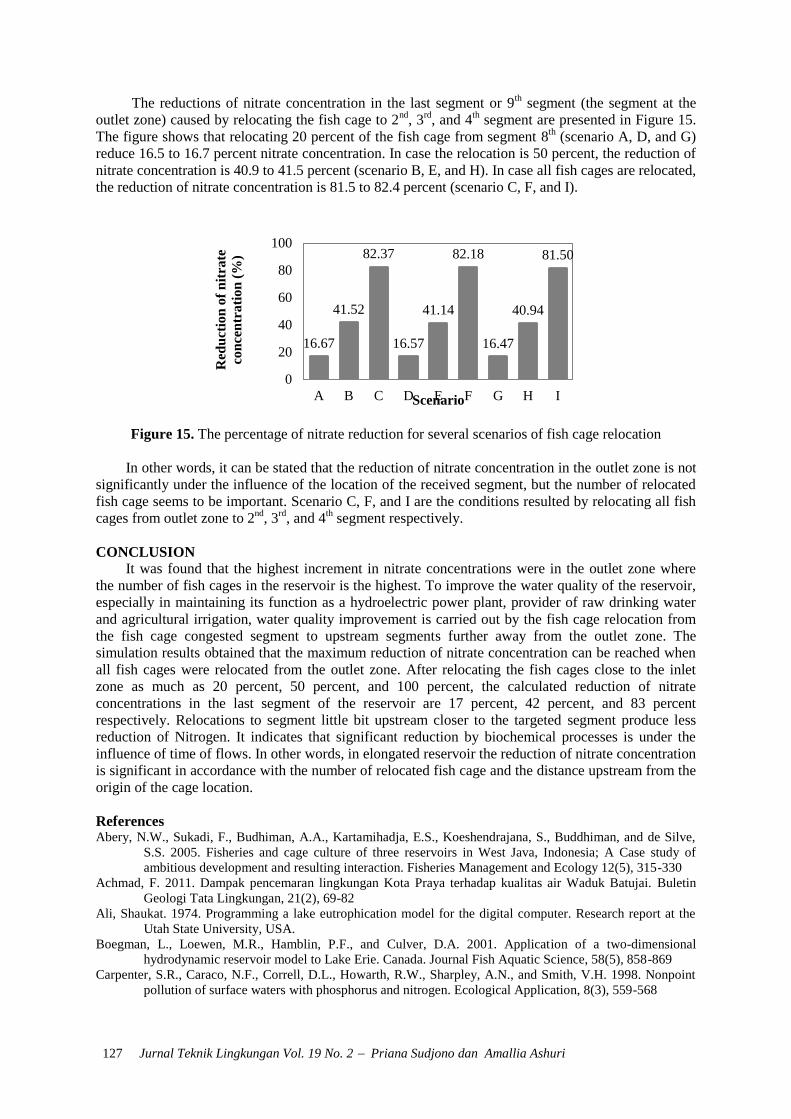
The reductions of nitrate concentration in the last segment or 9th segment (the segment at the
outlet zone) caused by relocating the fish cage to 2nd
, 3rd
, and 4th segment are presented in Figure 15.
The figure shows that relocating 20 percent of the fish cage from segment 8th (scenario A, D, and G)
reduce 16.5 to 16.7 percent nitrate concentration. In case the relocation is 50 percent, the reduction of
nitrate concentration is 40.9 to 41.5 percent (scenario B, E, and H). In case all fish cages are relocated,
the reduction of nitrate concentration is 81.5 to 82.4 percent (scenario C, F, and I).
Figure 15. The percentage of nitrate reduction for several scenarios of fish cage relocation
In other words, it can be stated that the reduction of nitrate concentration in the outlet zone is not
significantly under the influence of the location of the received segment, but the number of relocated
fish cage seems to be important. Scenario C, F, and I are the conditions resulted by relocating all fish
cages from outlet zone to 2nd
, 3rd
, and 4th segment respectively.
CONCLUSION
It was found that the highest increment in nitrate concentrations were in the outlet zone where
the number of fish cages in the reservoir is the highest. To improve the water quality of the reservoir,
especially in maintaining its function as a hydroelectric power plant, provider of raw drinking water
and agricultural irrigation, water quality improvement is carried out by the fish cage relocation from
the fish cage congested segment to upstream segments further away from the outlet zone. The
simulation results obtained that the maximum reduction of nitrate concentration can be reached when
all fish cages were relocated from the outlet zone. After relocating the fish cages close to the inlet
zone as much as 20 percent, 50 percent, and 100 percent, the calculated reduction of nitrate
concentrations in the last segment of the reservoir are 17 percent, 42 percent, and 83 percent
respectively. Relocations to segment little bit upstream closer to the targeted segment produce less
reduction of Nitrogen. It indicates that significant reduction by biochemical processes is under the
influence of time of flows. In other words, in elongated reservoir the reduction of nitrate concentration
is significant in accordance with the number of relocated fish cage and the distance upstream from the
origin of the cage location.
References Abery, N.W., Sukadi, F., Budhiman, A.A., Kartamihadja, E.S., Koeshendrajana, S., Buddhiman, and de Silve,
S.S. 2005. Fisheries and cage culture of three reservoirs in West Java, Indonesia; A Case study of
ambitious development and resulting interaction. Fisheries Management and Ecology 12(5), 315-330
Achmad, F. 2011. Dampak pencemaran lingkungan Kota Praya terhadap kualitas air Waduk Batujai. Buletin
Geologi Tata Lingkungan, 21(2), 69-82
Ali, Shaukat. 1974. Programming a lake eutrophication model for the digital computer. Research report at the
Utah State University, USA.
Boegman, L., Loewen, M.R., Hamblin, P.F., and Culver, D.A. 2001. Application of a two-dimensional
hydrodynamic reservoir model to Lake Erie. Canada. Journal Fish Aquatic Science, 58(5), 858-869
Carpenter, S.R., Caraco, N.F., Correll, D.L., Howarth, R.W., Sharpley, A.N., and Smith, V.H. 1998. Nonpoint
pollution of surface waters with phosphorus and nitrogen. Ecological Application, 8(3), 559-568
16.67
41.52
82.37
16.57
41.14
82.18
16.47
40.94
81.50
0
20
40
60
80
100
A B C D E F G H I
Red
uct
ion
of
nit
rate
con
cen
tra
tio
n (
%)
Scenario

Jurnal Teknik Lingkungan Vol. 19 No. 2 Priana Sudjono dan Amallia Ashuri 128
Charles R. O'Melia. 1998. Coagulation and sedimentation in lakes, reservoirs and water treatment plants. Water
Science and Technology, 37(2), 129-135
Chen, N., Wu, J., and Hong, H. 2012. Effect of storm events on riverine nitrogen dynamics in a subtropical
watershed, Southeastern China. Science of the Total Environment, 431, 357-365
Cheng,W.P., Ruey Fang Yu, Chien Hsun Chen, and Che Hsun Chi. 2004. Enhanced coagulation on reservoir
water by dual inorganic coagulants. Environmental Engineering Science. 20(3), 229-235
Cullen, P., Rosich, R., and P.Bek. 1978. A phosphorous budget for Lake Burley Griffin and management
implications for urban lakes. Research Project No. 75/92. Australian Water Resources Council,
Technical Paper No.31, Canberra, 1978.
Degefua, F., S. Mengistub, and M. Schagerlc. 2011. Influence of fish cage farming on water quality and
plankton in fish ponds: A case study in the Rift Valley and North Shoa reservoirs, Ethiopia.
Aquaculture, 316(1–4), 129–135
Demetrio, J.A., Gomez, L.C., Latini, J.D., and Agostinho, A.A. 2012. Influence of net cage farming on the diet
of associated wild fish in a Neotropical Reservoir. Aquaculture 330-333, 172-178
DHL (Delft Hydraulic Laboratory). 1986. Water quality in relation to pollution. Prepared for water quality
course during research project BTA-155 at the Water Research Centre, Ministry of Public Works of
Indonesia. Bandung 1986.
Dillon, P.J., and F.H. Rigler. 1975. A simple method for predicting the capacity of a lake for development based
on lake Trophic Status." J. Fish. Res. Bd. Canada. 31, 1519-1531.
Dingguo, Huichao, J.D., and Wei, L. 2011. Influence of thermal density flow on hydrodynamics of Xiangxi Bay
in Three Georges Reservoir, China. Procedia Environmental Science. 10B, 1637-1645
FAO. 2006. Guidelines for Soil Description 4th
Edition.
Garno, Y.S. 2002. Beban pencemaran limbah perikanan budidaya dan eutrofikasi di perairan Waduk pada DAS
Citarum. Jurnal Teknologi Lingkungan, 3(2), 112-120
Garno, Y.S. (2003).Status kualitas perairan Waduk Juanda. Jurnal Teknologi Lingkungan, P3TL-BPPT, 4(3),
128-135
Hopp, L. and McDonnell, J.J. 2009. Connectivity at the hillslope scale: Identifying interactions between storm
size, bedrock permeability, slope angle and soil depth. Journal of Hydrology, 376(3-4), 378-391
Howarth, Robert W., Andrew Sharpley, and Walker. 2002. Sources of nutrient pollution to coastal waters in the
United States: Implications for achieving coastal water quality goals. Estuaries and Coasts 25(4), 656-
676
Ilosangi, E.S. 2001. Evaluasi kualitas air Waduk Jatiluhur selama Periode 1996-2000 (Suatu Kajian bagi Tujuan
Pengelolaan Waduk). Laporan Tugas Akhir. Bogor: Institut Pertanian Bogor
Jianga, Jian-Guo., and Yun-Fen Shenb. 2006. Estimation of the natural purification rate of a eutrophic lake after
pollutant removal. Ecological Engineering, 28(2), 166–173
Jones, J.R., and R.W. Bachmann. (1976). "Prediction of Phosphorous and Chlorophyll levels in lakes. J. Wat.
Poll. Control Fed. 48, 2176-2182.
Jong, R.D., Drury, C.F., Yang, J.Y., and Campbell, C.A. 2009. Risk of water contamination by Nitrogen in
Canada as estimated by the IROWC-N model. Journal of Environmental Management, 90(10), 3169-
3181
Juantari, G.Y., Sayekti, R. W., and D. Harisuseno. 2013. Status trofik dan daya tampung beban pencemaran
Waduk Sutami. Jurnal Teknik Pengairan, 4(1), 61-66
Kratzer, Charles., and Patrick L. Brezonik. 1984. Application of Nutrient Loading Models to the analysis of
trophic condition in Lake Okeechobee, Florida. Environmental Management, 8, 109-120.
Kusuda, Tetsuya. 1984. Water control management in lakes and reservoirs. Study Meeting on Creating Better
Environment at the Dept. of Civil Engineering Hydraulics, Kyushu University, Fukuoka, Japan.
Li, Z.G., Lin, L., Sagisaka, M., Yang, P., and Wu, W.B. 2012. Global-Scale modelling of potential changes in
terrestrial Nitrogen cycle from a growing Nitrogen deposition. Procedia Environmental Sciences, 13,
1057-1068
Machbub, B. 2010. Model perhitungan daya tampung beban pencemaran air danau dan waduk. Jurnal Sumber
Daya Air, 6(4), 129-144
McDonald, M.E., Tikkanen, C.A., Axler, R.P., Larsen, C.P., and Host, G. 1996. Fish simulation culture model
(FISH-C): A Bioenergetics based model for aquacultural waste load application. Aquaculture
Engineering, 15(4), 243-259
Nastiti, A.S., Krismono, and Kartamihardja, E.S. 2001. Dampak budidaya ikan dalam keramba jaring apung
terhadap peningkatan unsur N and P di perairan Waduk Saguling, Cirata, dan Jatiluhur. Jurnal
Penelitian Perikanan Indonesia, 7(2), 22-30
Peiris, A.T.A. and Miguntanna, N.P. 2012. Analysis of nutrients in Kurunegala Lake, Srilanka. SAITM
Research Symposium on Engineering Advancements (SAITM – RSEA 2012), 72-74
129 Jurnal Teknik Lingkungan Vol. 19 No. 2 Priana Sudjono dan Amallia Ashuri
Porter, C.B., M.D. Krom, M.G. Robbins, L. Brickell, and A. Davidson. 1987. Ammonia excretion and total N
budget for gilthead seabream (Sparus aurata) and its effect on water quality conditions. Aquaculture.
66(3–4), 287–297
Pujiastuti, P., Ismail, B., and Pranoto. 2013. Kualitas dan beban pencemaran perairan waduk Gajah Mungkur.
Jurnal Ekosains, 5(1), 59-75
Schnoor, J.L. 1996. Environmental modeling: Fate and transport of pollutants in water, air, and soil. New York:
John Willey and Sons
Sherif, M.M., Mohamed, M.M., Shetty, A., and Almulla, M. 2011. Rainfall-Runoff modeling of three wadis in
the northern area of UAE. Journal of Hydrologic Engineering, 16(1), 10-20
Smith, V.H., G.D. Tilman, J.C. Nekola. 1999. Eutrophication: impacts of excess nutrient inputs on freshwater,
marine, and terrestrial ecosystems. Environmental Pollution 100, 179-196
Soemarwoto, O. (2005). Pengelolaan jaring apung. Prosiding Seminar Pengelolaan Waduk dan Danau 12
Oktober 2004
Sudjono, P. 1995. A mathematical concept of runoff prediction model for small tropical catchment areas. Wat.
Sci. Tech., 31(9), 27-36
Sudjono, P. 2003. Preliminary development of horizontal segmentation model for water quality prediction in
elongated reservoirs. Jurnal Teknik Sipil Universitas Tarumanagara. 9, 1-15
Sunmdjono, Priana and Otte S. Novendra. 2002. Trophic analysis of Saguling Dam using empirical formulae.
Jurnal Teknik Lingkungan -IATPI and Teknik Lingkungan ITB. 8(1), 39-48.
Sudjono, Priana. 1999. ISTFM computer programming, surface runoff computation for tropical basin. Dept. of
Environmental Engineering - Institute Technology in Bandung, Research Report Number: 19835399
Sukristiyanti, Lestiana, H., Maria, R., Karningsih, N., dan Sutarman. 2007. Observasi kualitas air pada Waduk
Jatiluhur. Prosiding Seminar Geoteknologi, Kontribusi Ilmu Kebumian dalam Pembangunan
Berkelanjutan, Lembaga Ilmu Pengetahuan Indonesia. 119-124
Tjahjo, D.W.H. and S.E. Purnamaningtyas. 2008. Kajian kualitas air dalam evaluasi pengembangan perikanan di
waduk Ir. H. Djuanda, Jawa Barat. Jurnal Litbang Perikanan, 16(1), 15-29
Tjahjo, D.W.H. and S.E. Purnamaningtyas. 2010. Bio-Limnologi waduk kaskade sungai Citarum, Jawa Barat.
Limnotek. 17(2), 147-157
Vollenweider. R.A. 1976. Advances in defining critical loading levels for Phosphorous in lake eutrophication."
Mem. Ist. Ital. Idrobiol, 33, 53-83.
Wu, L., Long, T.Y., Liu, X., and Guo, J.S. 2012. Impacts of climate and land-use changes on the migration of
non-point source Nitrogen and Phosphorus during Rainfall-Runoff in the Jialing River Watershed,
China. Journal of Hydrology, 475, 26-41
Xu, J., Yin, K., Liu, H., Lee, J.H.W., Anderson, D.M., Ho, A.Y.T., and Harrison, P.J. 2010. A comparison of
eutrophication impacts in two harbours in Hong Kong with different hydrodynamics. Journal of Marine
Systems. 83(4), 276-286
Acknowledgment The research was funded by Bakrie Scholarship fund. Great thanks to Dr. Eko W. Irianto, at Research Center of
Water Resources - Ministry of Public Works, for discussion during the completion of the research.