computer vision algorithm for barley kernel identification
TRANSCRIPT

Manuscript published:
Szczypiński, P. M., & Zapotoczny, P. (2012). Computer vision algorithm for barley kernel identification, orientation estimation and surface structure assessment. Computers and Electronics in Agriculture, 87, 32-38
http://dx.doi.org/10.1016/j.compag.2012.05.014
Computer vision algorithm for barley kernelidentification, orientation estimation and surface
structure assessmentPiotr M. Szczypiński 1, Piotr Zapotoczny 2
1 Institute of Electronics, Technical University of Lodz, Wolczanska 211/215, 90-924 Lodz, Poland
2 Department of Agri-Food Process Engineering, University of Warmia and Mazury in Olsztyn, Heweliusza 14, 10-718 Olsztyn, Poland
AbstractThis paper presents an algorithm for analyzing barley kernel images to evaluate cereal grain quality and
perform grain classification. The input data comprised digital images of kernels obtained from an optical scanner.The algorithm identified individual kernels’ smooth and wrinkled regions, described their orientation relative tothe axis of symmetry, crease visibility and germ location. We were also able to determine the size of the wrinkledand smooth areas on a grain’s surface, which allowed automatic grain classification and kernel quality assessment.The proposed algorithm was tested using barley grain images, and validated by comparison with the evaluationresults of a professional assessor. The validation of the algorithm confirmed that it is efficient and robust allowingaccurate description of over 93% of kernel samples in comparison with the expert.
HighlightsAn algorithm to analyze barley kernel images was proposed. The algorithm identified the wrinkled and smooth regions of individual kernels with a mean accuracy of 99%. The algorithm eliminated the need for human involvement in the assessment process.
KeywordsDigital image analysis; Automated kernel grading; Cereal grain classification
1. IntroductionThe process of manufacturing products of superior quality requires raw materials that are of equally high
standard. The suitability of raw materials for industrial use is determined by their physical, chemical and sensoryattributes. In plant breeding, the quality of seeds and parent material has a significant bearing on new varieties andbreeding lines. Research centers around the world are attempting to develop quick and effective methods forevaluating the quality of raw materials, based on the assessment of selected attributes for specific applications inproduction and breeding (Brosnan and Sun, 2004, Mendoza et al., 2007 and Reum and Zhang, 2007).

The processing suitability of agricultural products is highly influenced by variable growing conditionsand environmental factors. In the food processing industry, the quality grade of raw materials is classified (withinthe species) based on information about a given variety. This, however, has drawbacks. When affected by differentenvironmental conditions, for example, the same genotype may produce different phenotypic responses (Jezowski,1981 and Jezowski et al., 1993). Decisions on raw materials’ processing suitability made solely on based ongenotype features can be misleading (Rybinski and Szot, 2006). Several methods for analyzing grain varieties areavailable in practice, including immunological methods, DNA analyses, HPLC, protein electrophoresis andisoenzyme analyses (ISTA, 2012). Most of those techniques are expensive, time-consuming, and only available tospecialist laboratories. Alternative methods for evaluating the quality and varietal uniformity of cereal grains are,therefore, needed. Computer image analyses, which offer such an alternative, have already been carried out formore than 10 years (Zayas and Steele, 1996, Neuman et al., 1987, Neuman et al., 1989a, Neuman et al., 1989b,Majumdar and Jayas, 1999, Majumdar and Jayas, 2000a, Majumdar and Jayas, 2000b, Majumdar and Jayas,2000c and Majumdar and Jayas, 2000d). Jayas et al., 2000, Visen et al., 2001, Visen et al., 2002, Paliwal et al.,2001, Paliwal et al., 2003a and Paliwal et al., 2003b, and Zapotoczny et al. (2005). Shouche et al. (2001) used aflatbed scanner to discriminate fifteen Indian wheat varieties. From a group of 45 indices of geometric dimensionsand shapes, they identified 5 indices that support varietal discrimination. Utku (2000) used a CCD camera todevelop a system that distinguishes 31 wheat varieties. Various attempts have been made to identify grain classesand varieties based on differences in the geometric properties of kernels (Zayas et al., 1986, Shouche et al., 2001and Brosnan and Da-Wen, 2002). Studies showed that vision systems (MVS) could successfully be used foridentification of pests and the level of fungal infections in grains (Ruan et al., 2001 and Ridgway et al., 2002).MVS can also be used to analyze variations in the color of wheat grains caused by changes in moisture, fungalinfections and overheating (Luo et al., 1999 and Ruan et al., 2001). Dalen (2004) used flatbed scanner images toevaluate the extent of damage to rice grains with 99% accuracy within a relatively short period of time (about 3min). Strumiłło et al. (1999) developed a computer-aided system for evaluating the sowing suitability of seedsusing X-ray images. In our previous study (Zapotoczny et al., 2008, Markowski et al., 2006, Zapotoczny, 2011aand Zapotoczny, 2011b), we relied on computer-assisted image analysis to discriminate between cereal grainvarieties. Different varieties of wheat and malting barley grains were classified with an accuracy of nearly 100%.However our statistical models based on variables obtained from grains harvested in a given year failed to providereliable results in successive years. Image analysis also proved to be an unsatisfactory method for evaluating grainquality (Zapotoczny, 2011a). The correlation coefficients between color, surface texture and geometric attributesof grains and the technological properties of the resulting flour were unsatisfactory (Zapotoczny, 2008). Previousstudies focused on the evaluation of color, geometric and texture properties of individual kernels or bulk grainimages. To our knowledge, there have been no attempts to measure the color, geometrical and textural features ofparts of grain kernels such as dorsal (back) and ventral (front) sides of kernels, the crease and the germ. Withregard to malting barley varieties, the wrinkled and the smooth sections of the kernel should be analyzedseparately. The size and the attributes of the wrinkled surface are determined by varietal characteristics and theaccumulation of reserve compounds in kernels. In this respect, this study attempted to develop an algorithm toautomatically discriminate kernels positioned on the ventral or dorsal side and to identify various textured areason the analyzed side. As a result, regions were identified, and color component (RGB, XYZ, L * ab), texture andshape descriptors of kernel surfaces were determined (Szczypinski et al., 2007 and Szczypinski et al., 2009). Ourapproach improved the efficiency of varietal discrimination by analyzing the correlations between variablesobtained from the image analysis and the technological quality properties of grain (moisture content, germinationenergy, malting, total protein, viscosity, extraactivity of malt). The proposed system for evaluating the quality andvarietal homogeneity of cereal grains could be dedicated to flour milling and grain processing companies.
This article proposes a computer-generated algorithm for preliminary analysis of kernel images. Thealgorithm will identify the imaged kernels, it will determine their orientation relative to their axis of symmetry, thelocation of the germ and the visibility of the crease (dorsal or ventral side of the kernel). The proposed algorithmwill support image segmentation by identifying the areas of individual grains and the size of smooth and wrinkledareas on the grain’s surface.

2. Materials and methods
2.1. Image analysisImages of barley kernels (Fig. 1a) were obtained using an Epson 4490 flatbed scanner interfaced with a
computer. The scanner uses a Charge Coupled Device (CCD) sensor array with the light sources located on itsside, which allows to obtain fairly good focus on small three-dimensional objects such as kernels. The downsideof this method of image acquisition is the uneven surface illumination of the kernels. Images were captured incolor at a resolution of 400 DPI, 24 bits per pixel and stored in an uncompressed format not to introduce anyadditional artifacts. Kernels were positioned on the surface of the scanner in non-touching fashion, with a meandistance of at least 3 mm resulting in grain distance of at least 50% of the average grain’s width, which allows tofit several hundred kernels in one image. For the acquisition the scanner’s cover was removed and the scanner wasplaced in a compartment inlaid with black velvet. This resulted in images, in which the kernels are relativelybright compared with the dark background, allowing the application of simple and efficient computer algorithmsto identify the kernel regions.
Kernels were placed by hand, they were roughly aligned with no predefined locations, thus theircoordinates in the image are unspecified. Also, their orientations were not imposed, and thus some of them arevisible from the dorsal side – the crease is not visible, whilst others show the ventral side exposing the crease. Thekernel orientation with respect to the germ–brush direction (anteroposterior axis) was not predetermined, yet mostof the kernels were aligned perpendicular to the scanner’s image sensors array. Due to this fact and the alreadymentioned location of the light sources, the crease is noticeable as a darker line near the main axis of the kernelsand the wrinkled region is visible as a texture comprising brighter and darker patches.
(a) (b)
Fig. 1. Example fragment of (a) the input image and (b) its histogram.
Based on the image properties we developed an image processing algorithm, which involves three keyprocedures. The first one is image segmentation and identification of individual kernels. The second onedetermines each kernel’s orientation with respect to the dorsoventral and the anteroposterior axes. Finally, thethird procedure aims at finding the wrinkled area of the kernel, since one of our goals is to verify whether thecharacteristics of the wrinkled region may be used for classification of varieties or assessing the dryness ofkernels.

2.2. Segmentation and identificationThe first step of the algorithm involves image segmentation or binarization (Gonzalez and Woods, 2006,
Jähne and Haussecker, 2000 and Otsu, 1979), which splits the image pixels into two subsets: those that are a partof the background and those belonging to the kernel regions. The image histogram, which represents the numberof pixels having the same brightness as a function of the brightness, is bimodal in the case of images underconsideration (Fig. 1b). Therefore it shows two maxima, one related to the dark background and the other relatedto the brighter kernel regions, with a minimum in between. In this case the image segmentation is feasible byapplying image grayscale thresholding – the pixels with a gray-level below that of the minimum fall into thebackground, while the rest are categorized as belonging to the kernels. In the binary image (Fig. 2a) positivevalues (white) represent the grain regions and zero values (black) represent the background. However, thecontours of the kernels in the binary image are not always smooth. Moreover, the kernel areas are not alwaysuniformly connected and some of them contain holes. What’s more, there are some small crumb areas which maybe incorrectly identified as kernels. To correct these discrepancies, we applied a procedure that involves thefollowing three steps: (i) morphological opening with a circular structuring element of the radius equal to sevenpixels; (ii) morphological closing with the same structuring element; and (iii) selection of regions based on theircorresponding areas. The opening removes small-sized peninsula-shaped remains located near the kernel contours,while the closing removes any gulf-shaped cavities and open spaces. In addition, we estimated the mean area ofthe kernel regions in the images. Our procedure assumes that kernel areas should fall within the range of 50% and150% of the mean. Following this assumption, regions with areas that are excessively small or excessively largeare removed during the selection process (Fig. 2b), preventing the identification of small crumbs or multipletouching grains as individual kernels.
(a) (b)
Fig. 2. The result of the segmentation (a) after the image gray-scale thresholding and (b) followed by morphologicalclosing and opening.
2.3. Orientation solvingAs already mentioned, there are two aspects of orientation analysis, determination of orientation with
respect to the anteroposterior and the dorsoventral axes. Therefore, our approach involves two steps of imageanalysis, the first one aims at localization of the longitudinal axis of symmetry and the second one establishes thepresence of the crease.
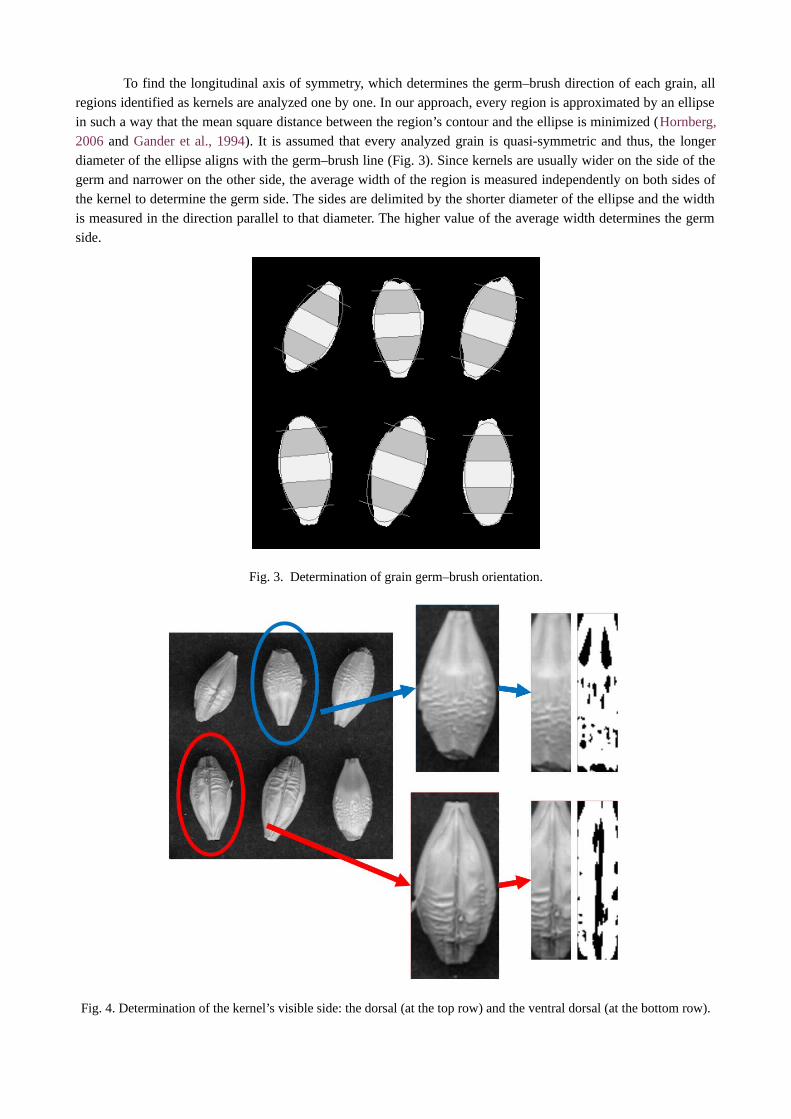
To find the longitudinal axis of symmetry, which determines the germ–brush direction of each grain, allregions identified as kernels are analyzed one by one. In our approach, every region is approximated by an ellipsein such a way that the mean square distance between the region’s contour and the ellipse is minimized (Hornberg,2006 and Gander et al., 1994). It is assumed that every analyzed grain is quasi-symmetric and thus, the longerdiameter of the ellipse aligns with the germ–brush line (Fig. 3). Since kernels are usually wider on the side of thegerm and narrower on the other side, the average width of the region is measured independently on both sides ofthe kernel to determine the germ side. The sides are delimited by the shorter diameter of the ellipse and the widthis measured in the direction parallel to that diameter. The higher value of the average width determines the germside.
Fig. 3. Determination of grain germ–brush orientation.
Fig. 4. Determination of the kernel’s visible side: the dorsal (at the top row) and the ventral dorsal (at the bottom row).
At this stage, the kernels in the image are localized, their contours and areas are calculated, and theorientation of the germ–brush direction is known. In the next step every region, examined individually, istransformed onto a new image in such a way that the center of gravity of the grain becomes the center of the newimage, the germ–brush direction is oriented vertically and the germ is positioned at the bottom. The new imagesize and transformation are computed based on the ellipse size and the orientation of its larger diameter. Thetransformed image’s brightness function is interpolated by means of bilinear interpolation. The new image is usedfor the purpose of crease detection and later to find the wrinkled area.
The crease, if the ventral side of the kernel is visible, forms a dark elongated area stretching across themid-line of the grain (Fig. 4). To determine the presence of that area we again use the image gray-levelthresholding. In this case only the small rectangular area of the image is examined, the height of which is equal tothe length of the larger diameter of the ellipse, the width equal to 1/4 of the ellipse width and its location being thecentral part of the kernel transformed image. We found that in most cases the crease of barley kernel resides insuch a rectangular area and thus it is reasonable to limit the crease search to this region only. The threshold levelused for the image segmentation is set individually for each kernel as the average gray-level within the rectangulararea. After the segmentation, the lengths of any segments darker then the threshold value are measured. If anylength is higher than half of the grain’s length, the kernel is labeled as one with the ventral side visible. Otherwise,the kernel is labeled as visible from the dorsal side.
2.4. Wrinkled region detectionWrinkled regions of the barley kernels are distinguished by a texture of brighter and darker patches.
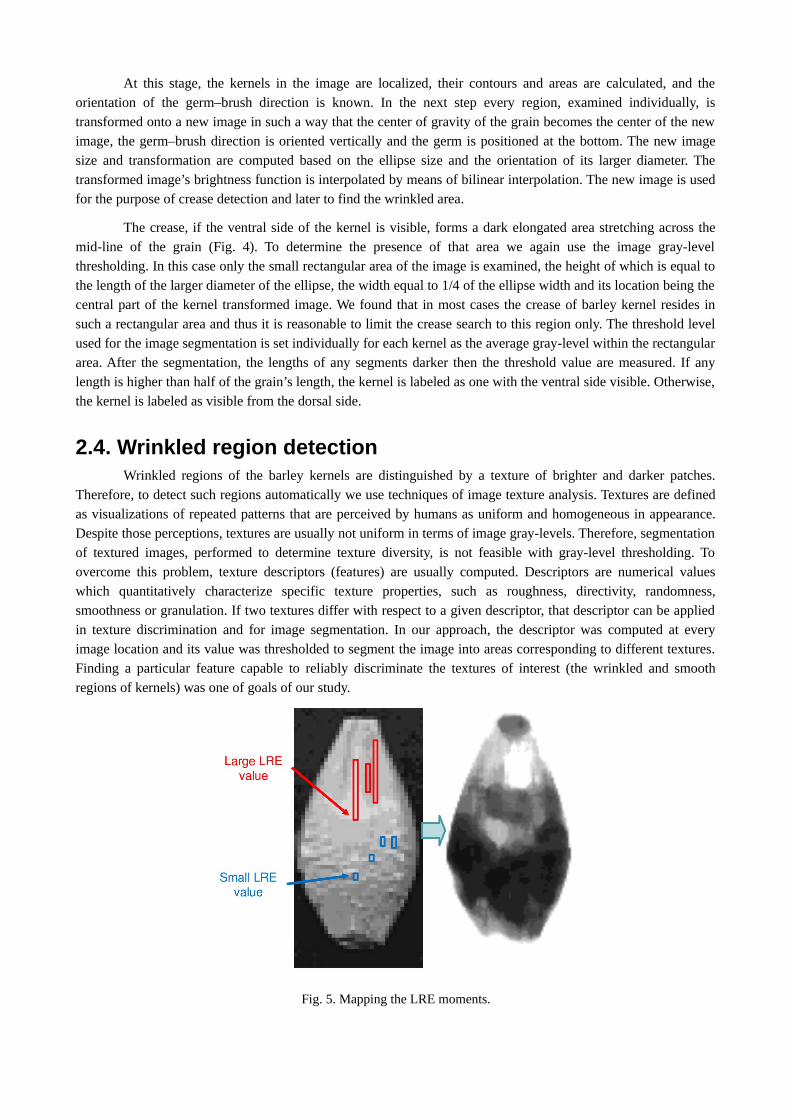
Therefore, to detect such regions automatically we use techniques of image texture analysis. Textures are definedas visualizations of repeated patterns that are perceived by humans as uniform and homogeneous in appearance.Despite those perceptions, textures are usually not uniform in terms of image gray-levels. Therefore, segmentationof textured images, performed to determine texture diversity, is not feasible with gray-level thresholding. Toovercome this problem, texture descriptors (features) are usually computed. Descriptors are numerical valueswhich quantitatively characterize specific texture properties, such as roughness, directivity, randomness,smoothness or granulation. If two textures differ with respect to a given descriptor, that descriptor can be appliedin texture discrimination and for image segmentation. In our approach, the descriptor was computed at everyimage location and its value was thresholded to segment the image into areas corresponding to different textures.Finding a particular feature capable to reliably discriminate the textures of interest (the wrinkled and smoothregions of kernels) was one of goals of our study.
Fig. 5. Mapping the LRE moments.

To accomplish this task the MaZda software (Szczypinski et al., 2007, Szczypinski et al., 2009,Szczypiński et al., 2011, Klepaczko et al., 2010 and Thybo et al., 2004) was applied to find the texture descriptorcapable of correct discrimination of the two areas. The software can compute up to several hundred varioustexture descriptors and then it estimates their discriminative strength. We found the Long Runs Emphasis (LRE)(Haralick, 2005) moment of the run-length matrix (RLM) computed for vertical runs proved to be most effectivein differentiating the areas of interest. The RLM holds counts of pixel runs with the specified gray-scale level andlength (Fig. 5). It can be computed for a chosen direction of pixel runs, such as horizontal or vertical. The LREmoment’s value is higher if many long runs of pixels have similar gray-levels. Otherwise its value is low. Smoothareas of homogeneous brightness level result in long runs and a high corresponding LRE value. On the other hand,wrinkled areas are characterized by low LRE values.
Based on RLM’s LRE moment, an algorithm that facilitates wrinkled area extraction was developed. Thealgorithm takes the rotated image of an individual kernel as the input. For every pixel of the input image, pixels inthe vertical run including that pixel and having a similar gray-scale to the pixel, are counted. The brightness of allthe pixels in a run may vary from the brightness of the reference pixel by no more than k, where k is a parameterof the algorithm. Next, the corresponding pixel in the output image is substituted with the number of countedpixels in the run. Following this, the output image is smoothed by means of a median n × n filter, and thresholdedat the level of t, where n and t are also parameters of the algorithm. The experiment was performed to establishappropriate values of the algorithm parameters. The reference image was used, in which an experienced assessordepicted the wrinkled regions manually. It was established that wrinkled regions automatically detected arecomparable with regions manually outlined for k = 8, n = 3 and t = 5. Thus, this set of parameters was used foranalysis of other images of barley kernels.
3. Results and discussion
3.1. Algorithm validationThe algorithm was written in C language and compiled for the Microsoft Windows platforms utilizing the
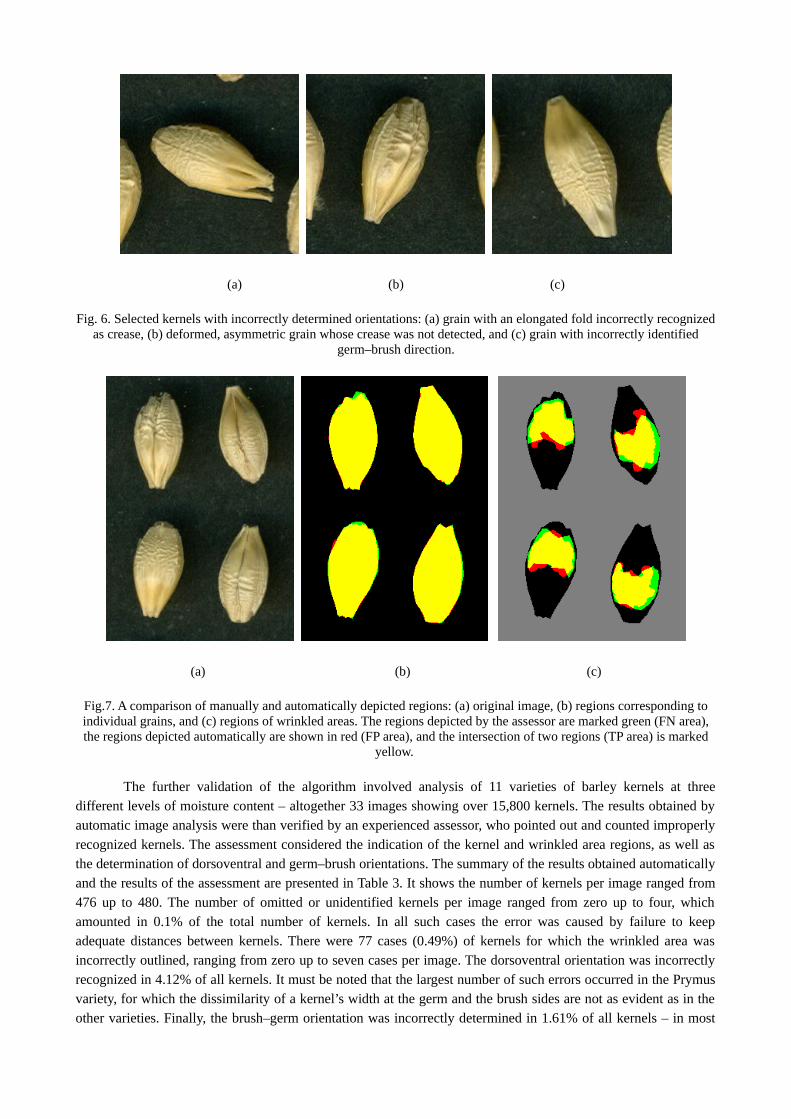
Intel’s OpenCV library implementations of basic image processing operations. The computation time wasmeasured on a 2673 × 4031 pixels color image of 543 Blask barley kernels – 272 on dorsal sides and 271 onventral sides. On a computer with a 650 GHz Intel i5 CPU the algorithm took 68 s to process the image (126 msper kernel). The algorithm correctly identified and counted all the kernels in the image, it correctly identified thegerm–brush direction in 532 cases (98%) and dorsoventral orientation in 525 cases (96.7%). Selected kernelswhich produced incorrect results are presented in Fig. 6. In Fig. 6a, the crease was not exposed, but the presenceof a black line of elongated fold casing led to incorrect classification. Fig. 6b shows a highly asymmetric kernelwhose orientation was incorrectly recognized due to a side-wise location of the crease. The grain in Fig. 6c isabnormally narrow on the germ side, and as the result, the germ–brush direction was incorrectly identified.
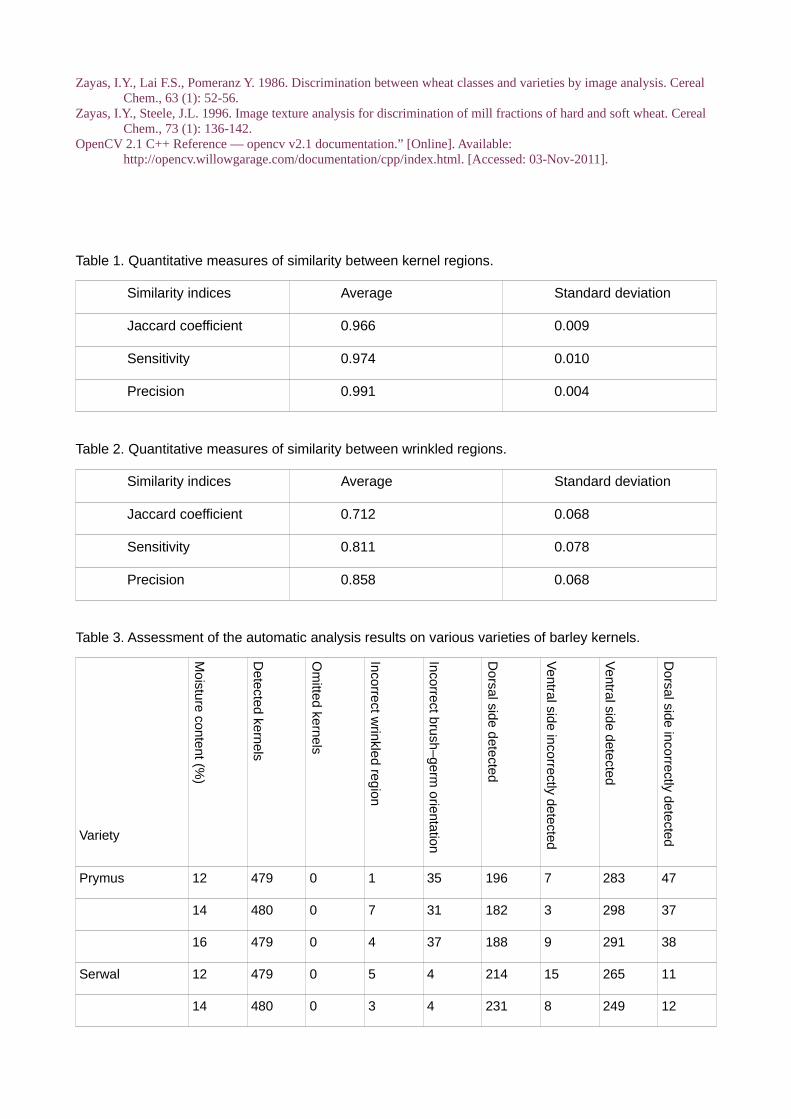
The algorithm was developed to support image segmentation and specify the regions corresponding toindividual grains and sub-regions of wrinkled areas. To validate the segmentation procedure, the regions producedby the algorithm were compared with the corresponding regions depicted by a professional grain quality assessor.The number of pixels was counted, including pixels belonging to both regions (number of true positives – TP),pixels belonging only to the manually depicted region (number of false negatives – FN) and pixels belongingexclusively to the automatically obtained region (number of false positives – FP). Subsequently, three quantitativemeasures were computed: the Jaccard similarity coefficient (ratio of TP to the sum of TP, FN and FP), precision(ratio of TP to the sum of TP and FP) and recall (ratio of TP to the sum of TP and FN). The average values ofquantitative measures, averaged for all grains, and standard deviation values are listed in Table 1 and Table 2.Selected examples of the compared regions are presented in Fig. 7.
(a) (b) (c)
Fig. 6. Selected kernels with incorrectly determined orientations: (a) grain with an elongated fold incorrectly recognizedas crease, (b) deformed, asymmetric grain whose crease was not detected, and (c) grain with incorrectly identified
germ–brush direction.
(a) (b) (c)
Fig.7. A comparison of manually and automatically depicted regions: (a) original image, (b) regions corresponding toindividual grains, and (c) regions of wrinkled areas. The regions depicted by the assessor are marked green (FN area),the regions depicted automatically are shown in red (FP area), and the intersection of two regions (TP area) is marked
yellow.
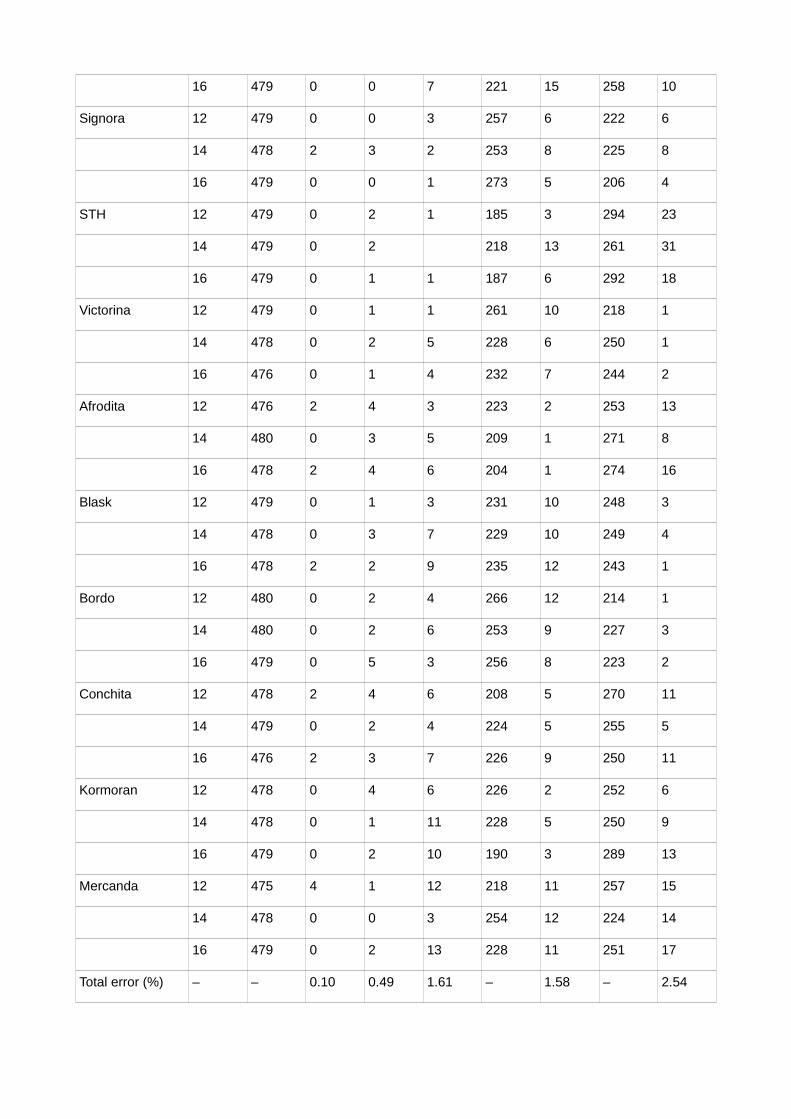
The further validation of the algorithm involved analysis of 11 varieties of barley kernels at threedifferent levels of moisture content – altogether 33 images showing over 15,800 kernels. The results obtained byautomatic image analysis were than verified by an experienced assessor, who pointed out and counted improperlyrecognized kernels. The assessment considered the indication of the kernel and wrinkled area regions, as well asthe determination of dorsoventral and germ–brush orientations. The summary of the results obtained automaticallyand the results of the assessment are presented in Table 3. It shows the number of kernels per image ranged from476 up to 480. The number of omitted or unidentified kernels per image ranged from zero up to four, whichamounted in 0.1% of the total number of kernels. In all such cases the error was caused by failure to keepadequate distances between kernels. There were 77 cases (0.49%) of kernels for which the wrinkled area wasincorrectly outlined, ranging from zero up to seven cases per image. The dorsoventral orientation was incorrectlyrecognized in 4.12% of all kernels. It must be noted that the largest number of such errors occurred in the Prymusvariety, for which the dissimilarity of a kernel’s width at the germ and the brush sides are not as evident as in theother varieties. Finally, the brush–germ orientation was incorrectly determined in 1.61% of all kernels – in most

such cases the kernels were deformed, their shape was distorted or a fragment was missing. Total percentage ofcorrectly recognized and depicted kernels reached 93.7%.
4. ConclusionsIn this study, we presented a novel algorithm for analyzing visual images of barley kernels. The algorithm
identified and counted kernels within the image, depicted wrinkled and smooth regions of kernels and alsodetermined orientation relative to the germ–brush direction and the location of the crease. The validation of thealgorithm confirmed that it is efficient and robust allowing accurate description of over 93% of kernel samples.The regions of individual kernels determined automatically matched the areas identified by the expert with a highdegree of precision.
Further studies are planned to identify the correlations between texture and color parameters of thestudied regions and the technological properties of grain. The algorithm is planned to be used in the preprocessingof hyperspectral images, which significantly expands its scope of application. We expect that the properidentification of kernel regions and their orientations will enable more accurate recognition of the grain varieties,moisture estimation or potential for germination and growth. Moreover, the proposed algorithm eliminates theneed for human involvement in the assessment process, thus increasing the objectivity, reliability andreproducibility of the results generated by the automated procedure.
AcknowledgmentThe author are grateful for the financial support provided by the Ministry of Scientific Research within
the framework of Grant No. 4498/B/P01/2010/39.
ReferencesBrosnan, T., Da-Wen, Sun. 2002. Inspection and grading of agricultural and food products by computer vision systems –
a review. Comput. Electron. Agric., 36:193-213.Brosnan, T., Sun, D.W. 2004. Improving quality inspection of food products by computer vision – a review. Journal of
Food Engineering, 61, 3–16.Dalen, G. 2004. Determination of size distribution and percentage of broken kernels of rice using flatbed scaninig and
image analysis. Food Research International. 37, 51-58Gander, W., Golub, G.H., Strebel, R., 1994. Fitting of Circles and Ellipses, Least Square Solution. Tech. Rep. 1994TR-
217. ETH Zurich, Institute of Scientific Computing.Gonzalez R.C., Woods R.E. 2006, Digital Image Processing, Prentice-Hall, Inc., Upper Saddle River, NJ (2006)Haralick, R. M., “Statistical and structural approaches to texture,” Proceedings of the IEEE, vol. 67, no. 5, pp Homberg A. 2006, Handbook of Machine Vision, Wiley-VCH, John Wiley, Weinheim, Chichester (2006)International Rules for Seed Testing. 2011. International Seed Testing Associations ISTA, Edition 2011part 8.8
www.seedtest.orgJähne B. and Haussecker H., 2000, Computer Vision and Applications: A Guide for Students and Practitioners,
Academic Press, San Diego (2000)Jayas, D.S., Paliwal, J., Visen, N.S. 2000. Multi-layer neural networks for image analysis of agricultural products. J.
Agric. Engang. Res. 77(2), 119-128Jezowski S., Surma M., and Adamski T., 1993. Genetic parameters for some morphological and physiological
characteristics of the stem of barleyDHlines (in Polish). Zesz. Nauk. AR Wroclaw, 223, 215-221.Jezowski, S., 1981. Analysis of relationship between lodging grade and some morphological characteristics determining
lodging resistance of barley. Genet. Pol., 28: 33-38.Klepaczko, A., Szczypiński, P., Daniel, P., Pazurek, M. 2010. Local Polynomial Approximation for Unsupervised
Segmentation of Endoscopic Images”, in Computer Vision and Graphics, t. 6375, Red. Berlin, Heidelberg: Springer Berlin Heidelberg, s. 33-40.
Luo, X., Jayas, D.S., Symons, S.J. 1999. Identifications of damaged kernels in wheat using a colour machine vision system. Journal of Cereal Science. 30, 49-59
Majumdar, S., Jayas, D.S. 2000a. Classification of cereal grains using machine vision: I. Morphology models. AmericanSociety of Agricultural Engineering. 43(6) 1669-1675
Majumdar, S., Jayas, D.S. 2000b. Classification of cereal grains using machine vision: III. Texture Models. Morphology

models. American Society of Agricultural Engineering. 43(6) 1681-1687Majumdar, S., Jayas, D.S. 2000c. Classification of cereal grains using machine vision: II. Color Models. Morphology
models. American Society of Agricultural Engineering. 43(6) 1677-1680Majumdar, S., Jayas, D.S. 2000d. Classification of cereal grains using machine vision: VI. Combined Morphology,
Color, and Texture Models. American Society of Agricultural Engineering. 43(6) 1689-1694Markowski M., Ratajski A., Konopko H., Zapotoczny P., Majewska K. 2006, Rheological behavior of hot-air-puffed
amaranth seeds, Int. J. Food Propert., 9 (2), pp. 195–203.Mendoza, F, Dejmek, P., Agullera, J.M. 2007. Colour and image texture analysis in classification of commercial of
commercial potato chips. Food Research International, 40(9), 1146-1154.Neuman, M., Sapristein, H D., Shwedyk, E., Bushuk, W. 1987. Discrimination of wheat class and variety by digital
image analysis of whole grain samples. Journal of Cereal Science. 6, 125-132Neuman, M., Sapristein, H D., Shwedyk, E., Bushuk, W. 1989a. Wheat grain color analysis by digital image processing:
I. Methodology. Journal of Cereal Science. 10(3), 175-182Neuman, M., Sapristein, H D., Shwedyk, E., Bushuk, W. 1989b. Wheat grain color analysis by digital image processing:
II. Wheat class determination. Journal of Cereal Science. 10(3), 183-182Otsu, N. 1979. A threshold selection method from gray-level histograms, systems, man and cybernetics, IEEE Trans., 9
(1) (1979), pp. 62–66Paliwal, J., Visen, N.S., Jayas, D.S. 2001. Evaluation of neural network architectures for cereal classification using
morphological features. J. Agric. Engang. Res. 79(4), 361-370.Paliwal, J., Visen, N.S., Jayas, D.S., White N.D.G. 2003a. Cereal grain and dockage identification using machine vision.
Biosystems Engineering. 85(1), 51-57Paliwal, J., Visen, N.S., Jayas, D.S., White N.D.G. 2003b. Comparison of a neural network and non-parametric
classifier for grain kernel identification. Biosystems Engineering. 85(4), 405-413Reum, D., Zhang, Q. 2007. Wavelet based multi-spectral image analysis of maize leaf chlorophyll content Original
Research Article, Computers and Electronics in Agriculture, 56, (1), 60-71. Ridgway, C., Davies, E.R., Chambers, J., Mason, D.R., Bateman, M. 2002. Rapid machine vision method for the
detection of insects and other particulate bio-contaminants of bulk grain in transit. Biosystems Eng., 83 (1): 21-30.
Ruan, R., Ning, S., Luo, L., Chen, X., Chen, P., Jones, R., Wilcke, W., Morey, V. 2001. Estimation of weight percentage of scabby wheat kernels using an automatic machine vision and neural network based system. Trans. ASAE, 44(4): 983-988.
Rybiński, W., Szot, B. 2006. Estimation of genetic variability of yielding traits and physical properties of seeds of spring barley (Hordeum vulgare L.) mutants. Int. Agrophysics, 20:, 219-227.
Shouche, S.P., Rastogi, R., Bhagwat, S.G., Sainis, J.K. 2001. Shape analysis of grains of Indiana wheat varieties. Computers and electronics in agriculture. 33, 55-76
Strumiłło, P., J. Niewczas, P. Szczypiński, P. Makowski, and W. Woźniak, 1999. Computer System for Analysis of X-Ray Images of Wheat Grains, Int. Agrophysics, vol. 13, no. 1, pp. 133-140.
Szczypinski, P. M, Strzelecki, M., Materka, A. 2007. Mazda - a software for texture analysis, International Symposium on Information Technology Convergence (ISITC 2007), Jeonju, Korea, 2007, pp. 245-249.
Szczypinski, P. M, Strzelecki, M., Materka, A., Klepaczko, A. 2009. MaZda - A software package for image texture analysis,” Computer Methods and Programs in Biomedicine, vol. 94, no. 1, pp. 66-76.
Szczypiński, P., Klepaczko, A., Strzelecki, M. 2011. An Intelligent Automated Recognition System of Abnormal Structures in WCE Images”, in Hybrid Artificial Intelligent Systems, t. 6678, E. Corchado, Berlin, Heidelberg: Springer Berlin Heidelberg, s. 140-147.
Thybo, A. K., Szczypinski, P. M, Karlsson, A. H, Donstrup, S. Stodkilde-Jorgensen H. S, and. Andersen H. J, 2004, Prediction of sensory texture quality attributes of cooked potatoes by NMR-imaging (MRI) of raw potatoes in combination with different image analysis methods, Journal of Food Engineering, vol. 61, no. 1, pp. 91-100.
Utku, H. 2000. Application of the feature selection method to discriminate digitized wheat varieties. Journal of Food Engineering. 46, 211-216
Visen, N.S., Paliwal, J., Jayas, D.S., White, N.D.G. 2001. Specialist neural networks for cereal grain classification. Biosystems Engineering. 82(2), 151-159
Visen, N.S., Shashidhar, N.S., Paliwal, J., Jayas, D.S. 2002. Identification and segmentation of occluding groups of grain kernels in a grain sample image. J. Agric. Engang. Res. 79(2), 159-166
Zapotoczny P. 2008. The method of assessing the quality of wheat using computer vision systems for obtaining a unification of the material. National Science Centre. 1089/P06/2005/29 (in. polish)
Zapotoczny, P. 2011a. Discrimination of Wheat Grain Varieties Using Image Analysis and Neural Networks. Part I. Single kernel texture. Journal of Cereal Science, 54 (1); 60-68
Zapotoczny, P. 2011b. Discrimination of wheat grain varieties using image analysis: morphological features. European Food Research and Technology. 233, 769–779
Zapotoczny, P. Zielińska, M. Nita, Z. 2008. Application of image analysis for the varietal classification of barley. morphological features. Journal of Cereal Science 48 (2008) 104–110
Zapotoczny, P., Majewska, K. 2010. A comparative analysis of color measurements of the seed coat and endosperm of wheat kernels performed by various techniques. International Journal of Food Properties, 13: 1–15.
Zayas, I.Y., Lai F.S., Pomeranz Y. 1986. Discrimination between wheat classes and varieties by image analysis. Cereal Chem., 63 (1): 52-56.
Zayas, I.Y., Steele, J.L. 1996. Image texture analysis for discrimination of mill fractions of hard and soft wheat. Cereal Chem., 73 (1): 136-142.
OpenCV 2.1 C++ Reference — opencv v2.1 documentation.” [Online]. Available: http://opencv.willowgarage.com/documentation/cpp/index.html. [Accessed: 03-Nov-2011].
Table 1. Quantitative measures of similarity between kernel regions.
Similarity indices Average Standard deviation
Jaccard coefficient 0.966 0.009
Sensitivity 0.974 0.010
Precision 0.991 0.004
Table 2. Quantitative measures of similarity between wrinkled regions.
Similarity indices Average Standard deviation
Jaccard coefficient 0.712 0.068
Sensitivity 0.811 0.078
Precision 0.858 0.068
Table 3. Assessment of the automatic analysis results on various varieties of barley kernels.
Variety
Mo
isture
conte
nt (%)
De
tected
kerne
ls
Om
itted ke
rnels
Inco
rrect w
rinkle
d re
gion
Inco
rrect b
rush
–ge
rm o
rienta
tion
Do
rsal side
dete
cted
Ve
ntral sid
e in
corre
ctly dete
cted
Ve
ntral sid
e d
etecte
d
Do
rsal side
inco
rrectly de
tecte
d
Prymus 12 479 0 1 35 196 7 283 47
14 480 0 7 31 182 3 298 37
16 479 0 4 37 188 9 291 38
Serwal 12 479 0 5 4 214 15 265 11
14 480 0 3 4 231 8 249 12
16 479 0 0 7 221 15 258 10
Signora 12 479 0 0 3 257 6 222 6
14 478 2 3 2 253 8 225 8
16 479 0 0 1 273 5 206 4
STH 12 479 0 2 1 185 3 294 23
14 479 0 2 218 13 261 31
16 479 0 1 1 187 6 292 18
Victorina 12 479 0 1 1 261 10 218 1
14 478 0 2 5 228 6 250 1
16 476 0 1 4 232 7 244 2
Afrodita 12 476 2 4 3 223 2 253 13
14 480 0 3 5 209 1 271 8
16 478 2 4 6 204 1 274 16
Blask 12 479 0 1 3 231 10 248 3
14 478 0 3 7 229 10 249 4
16 478 2 2 9 235 12 243 1
Bordo 12 480 0 2 4 266 12 214 1
14 480 0 2 6 253 9 227 3
16 479 0 5 3 256 8 223 2
Conchita 12 478 2 4 6 208 5 270 11
14 479 0 2 4 224 5 255 5
16 476 2 3 7 226 9 250 11
Kormoran 12 478 0 4 6 226 2 252 6
14 478 0 1 11 228 5 250 9
16 479 0 2 10 190 3 289 13
Mercanda 12 475 4 1 12 218 11 257 15
14 478 0 0 3 254 12 224 14
16 479 0 2 13 228 11 251 17
Total error (%) – – 0.10 0.49 1.61 – 1.58 – 2.54