computer vision based crack detection and analysiskdana/publications/prasanna2012.pdf · computer...
TRANSCRIPT
Computer Vision Based Crack Detection and Analysis
Prateek Prasanna, Kristin Dana, Nenad Gucunski and Basily Basily
Rutgers University, New Jersey
ABSTRACT
Cracks on a bridge deck should be ideally detected at an early stage in order to prevent further damage. To ensuresafety, it is necessary to inspect the quality of concrete decks at regular intervals. Conventional methods usuallyinclude manual inspection of concrete surfaces to determine defects. Though very e↵ective, these methods aretime-ine�cient. This paper presents the use of computer-vision techniques in detection and analysis of crackson a bridge deck. High quality images of concrete surfaces are captured and subsequently analyzed to buildan automated crack classification system. After feature extraction using the training set images, statisticalinference algorithms are employed to identify cracks. The results demonstrate the feasibility of the proposedcrack observation and classification system.
Keywords: Cracks, Classification, Computer Vision
1. INTRODUCTION
With the rapidly developing infrastructure in transportation, safety of roads needs to be ensured so as to reducethe number of accidents. Crack formation is one of the early signs of degradation. Hence, detection of cracks atearly stages helps take necessary precautions in order to prevent further damage. Current traditional methods ofcrack detection on a bridge deck involve significant manual labor. Grids are first marked along the entire length ofthe bridge. A skilled engineer then walks from one section of a grid to another closely inspecting the surface andmarking the location of cracks. Apart from being time-ine�cient, such methods heavily depend on the experienceof the specialist. This method also tends to be inaccurate. Failure of detection of these initial cracks might leadto decrease in longevity of bridge and sometimes collapse. The Federal Highway Administrations (FHWA) LongTerm Bridge Performance (LTBP) program focuses on detailed periodic inspections, monitoring, and evaluationof the population of bridges representing the national bridge inventory by taking advantage of nondestructiveevaluation (NDE) techniques and visual inspections. NDE techniques may include ground-penetrating radarto detect flaws and corrosion inside the structures and sensor technologies that monitor tra�c loading, cracksdue to fatigue and corrosion, overloads and various environmental conditions. One of the new methods that isbeing incorporated into this testing scheme is crack-detection using image processing and pattern recognitiontechniques. This project concentrates on the detection and analysis of cracks based on machine-learning basedclassification algorithms. Methods discussed here include local curve fitting and feature based classification usingsupport vector machines. The aim of this project is to build an automated crack-detection system that can besuccessfully integrated with a robot such that the process would be more time and cost-e↵ective.
2. PREVIOUS WORK
As this area of research is relatively new in the field of civil and construction engineering, work done is in theinitial stage. The few of the prior methods for crack detection include image processing based methods (waveletand fourier transforms, canny filters, sobel filters),1 percolation-based techniques,2–4 impact echo method5 andPCA-based techniques.6 Automated crack inspection systems have been proposed in prior work7 where laplacianof gaussian algorithms have been implemented. Stereovision techniques have been used in automated distresssurvey systems.8 Another crack detection scheme makes use of maximum a posteriori (map) classifier, whichrelies on a set of geometric characteristics of the segmented binary regions9 . Other work includes methods ofcrack detection on asphalt surfaces. There is major di↵erence between the appearance of cracks on concrete andasphalt surfaces. In asphalt cracks, the background is very distinct from the cracks whereas, in concrete cracks,there are distractors present in the form of blobs and stains all over the image. This problem is illustrated inFigure 1 and Figure 2.

Figure 1: Crack on an asphalt surface. The crack is very distinct from the background and can easily besegmented.
Figure 2: Cracks on a concrete surface. The cracks are not very distinct from the background and are surroundedby blobs and stains which makes segmentation di�cult..
With the cracks on asphalt surface, simple edge detection methods can almost perfectly detect the cracks.But when it comes to the concrete surface, simple edge detection gives erroneous results because of the presenceof the additional image clutter around the cracks as illustrated in Figure 4.
3. METHODOLOGY
3.1 Collection and labeling of data
As part of this project, a bridge was surveyed in Gainesvlle, Virginia (Courtesy: CAIT, Rutgers University).Video images were collected along the entire bridge deck and still frames were extracted from these videos. Sincelabeled data was unavailable, the labeling for cracked and uncracked points was done by visual inspection.
3.2 Edge-detection based classification
Forty crack and forty non-crack points were selected in each of the 50 images and their co-ordinates were saved.A 9⇥9 window around the feature points was selected and their pixel values as obtained from the canny edgedetector was saved in subsequent rows of 9 elements each. A second set of feature vectors was obtained with theimages blurred, with the notion that spurious edges would be removed. SVM algorithm was implemented forlinear, quadratic and RBF (Radial Basis Function) kernels respectively using bioinformatics toolbox in Matlab.The last 500 observations were used as the validation data.
3.3 Classification using histogram-based features in regions and along local curves
Sub-regions with 30⇥30 neighborhoods were selected in grayscale image space. Subsequently, curves were fittedto pixels whose intensity lied a fixed percentage below the average block intensity. The curve fiting was doneusing both RANdom SAmple Consensus (RANSAC)10 and least squares estimation, but in most cases, leastsquares estimation was found su�cient. The blue lines in Figure 5 are the local curves.
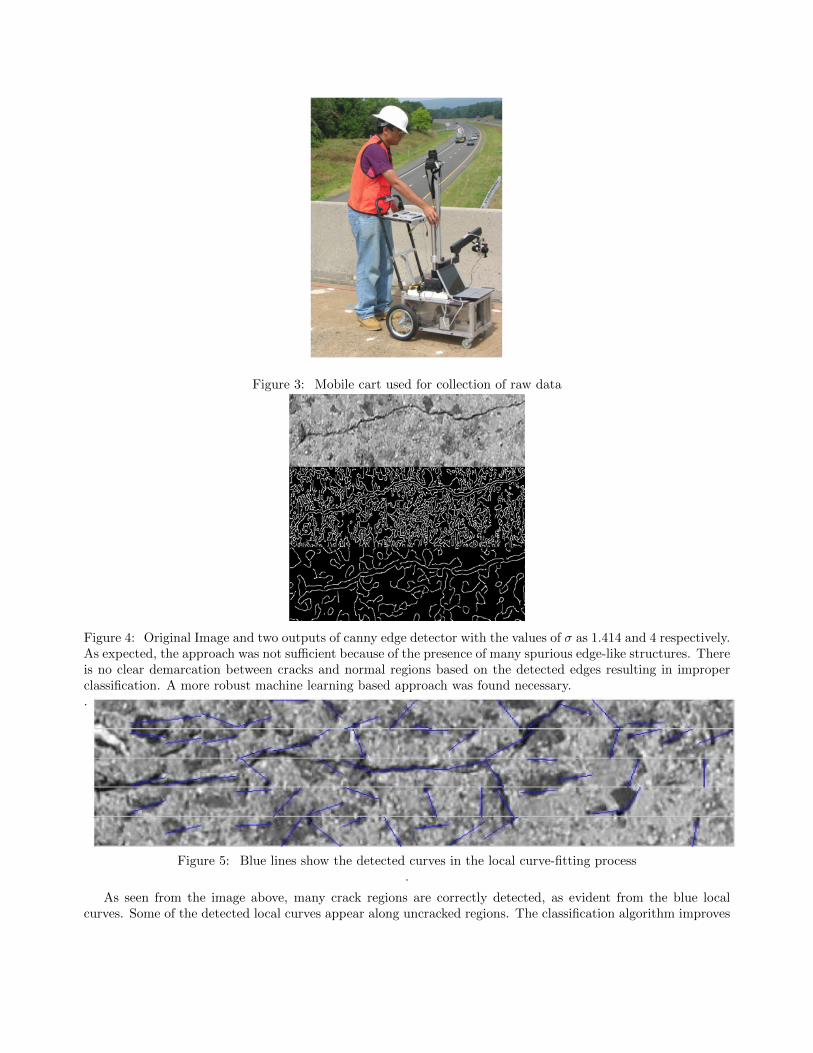
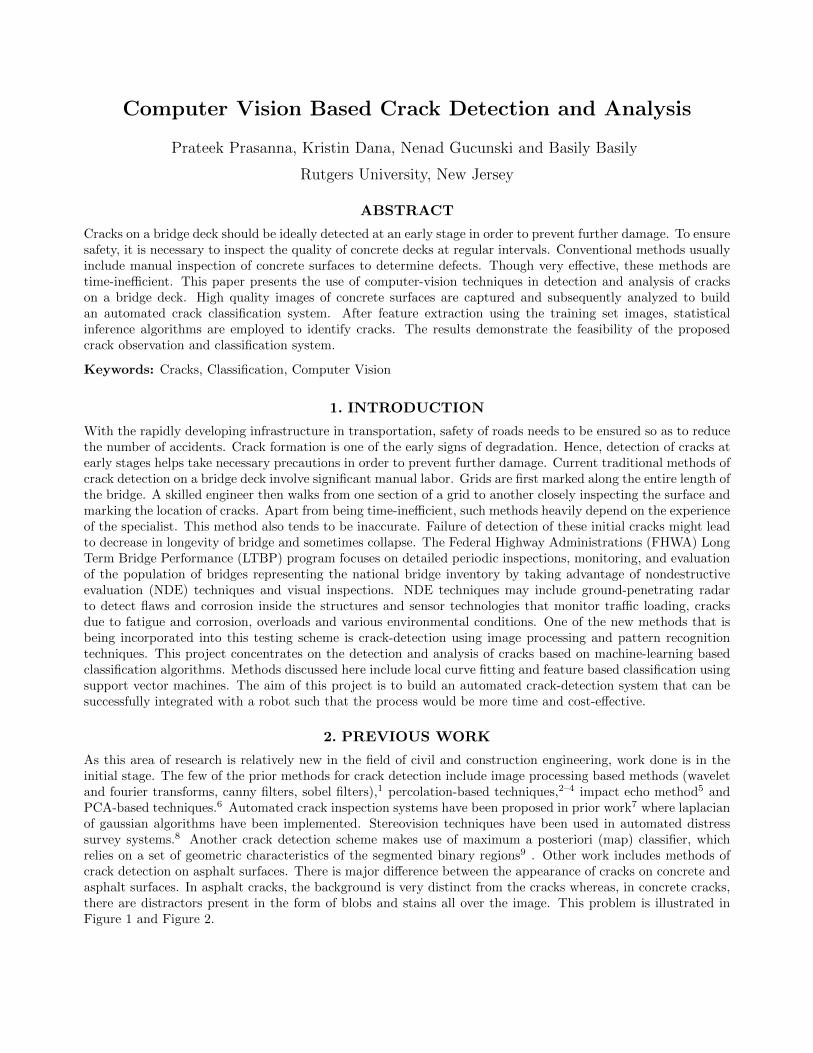
Figure 3: Mobile cart used for collection of raw data.
Figure 4: Original Image and two outputs of canny edge detector with the values of � as 1.414 and 4 respectively.As expected, the approach was not su�cient because of the presence of many spurious edge-like structures. Thereis no clear demarcation between cracks and normal regions based on the detected edges resulting in improperclassification. A more robust machine learning based approach was found necessary..
Figure 5: Blue lines show the detected curves in the local curve-fitting process.
As seen from the image above, many crack regions are correctly detected, as evident from the blue localcurves. Some of the detected local curves appear along uncracked regions. The classification algorithm improves
upon this incorrect curve-fitting by classifying the detected curves as cracks or no-cracks.
3.3.1 Feature vectors
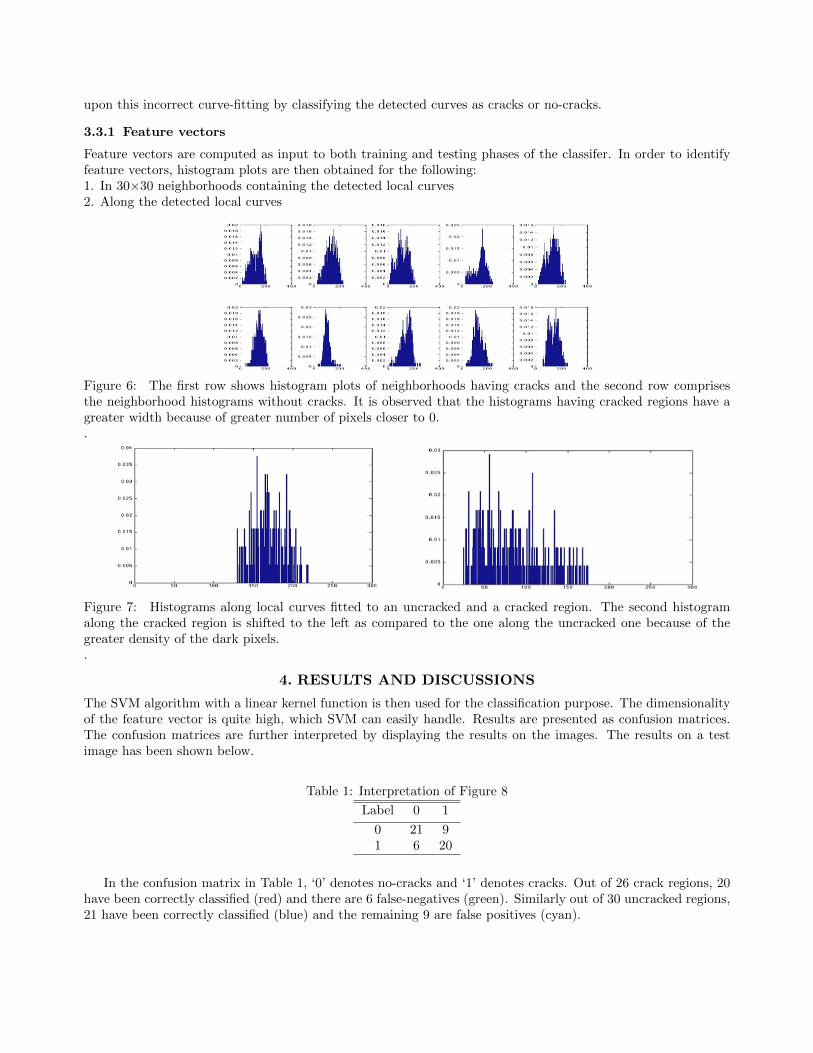
Feature vectors are computed as input to both training and testing phases of the classifer. In order to identifyfeature vectors, histogram plots are then obtained for the following:1. In 30⇥30 neighborhoods containing the detected local curves2. Along the detected local curves
Figure 6: The first row shows histogram plots of neighborhoods having cracks and the second row comprisesthe neighborhood histograms without cracks. It is observed that the histograms having cracked regions have agreater width because of greater number of pixels closer to 0..
Figure 7: Histograms along local curves fitted to an uncracked and a cracked region. The second histogramalong the cracked region is shifted to the left as compared to the one along the uncracked one because of thegreater density of the dark pixels..
4. RESULTS AND DISCUSSIONS
The SVM algorithm with a linear kernel function is then used for the classification purpose. The dimensionalityof the feature vector is quite high, which SVM can easily handle. Results are presented as confusion matrices.The confusion matrices are further interpreted by displaying the results on the images. The results on a testimage has been shown below.
Table 1: Interpretation of Figure 8
Label 0 1
0 21 91 6 20
In the confusion matrix in Table 1, ‘0’ denotes no-cracks and ‘1’ denotes cracks. Out of 26 crack regions, 20have been correctly classified (red) and there are 6 false-negatives (green). Similarly out of 30 uncracked regions,21 have been correctly classified (blue) and the remaining 9 are false positives (cyan).

Figure 8: Original images along with classification results. Red lines show correctly detected cracks and bluelines show the correctly detected non-crack regions. Green lines show undetected cracks and the lines in cyanshow the non-crack regions classified as cracks..
4.1 Classifier performance
The classification algorithm was tested on 118 crack and non-crack regions and the confusion matrix below showsthe results obtained.
Table 2: Classifier performance
Label 0 1
0 53 161 12 37
The false positives and false negatives rates were found to be 13.5% and 10.2% respectively. The classificationaccuracy was computed to be 76.3%
5. CONCLUSION
An automated crack detection system has been proposed. The method implemented uses a histogram-basedclassification algorithm. The detection rate of the classifier has been found to be approximately 76%. Futurework involves improving accuracy and making the system real-time. Training data on one location would beused to build the classifier and testing would be done on another location of similar structural composition. Theautomated bridge inspection method improves upon the traditional visual inspection scheme and can thereforelead to improvement in maintenance and rehabilitation of bridge decks in terms of the operation cost.
6. ACKNOWLEDGEMENTS
This research is supported by FHWA, U.S. Department of Transportation.
REFERENCES
[1] Abdel-Qader,I., Abudayyeh,O. and Kelly, M.E. Analysis of edge detection techniques for crack identificationin bridges. Journal of Computing in Civil Engineering, Am Soc Civil Engineers, 17 (3) (2003), pp. 255-263.
[2] Yamaguchi,T., Suzuki,K. , Hartono,P. , and Hashimoto.,S. An e�cient crack detection method usingpercolation-based image processing . Proc. of ICIEA2008, vol.3, pp.1875-1880, (2008).
[3] Yamaguchi,T., Suzuki,K. , Hartono,P. , and Hashimoto.,S. . Percolation approach to image-based crack de-tection. Proceedings of the 7th international conference on Quality Control by Articial Vision, (2005).
[4] Wang,P. and Huang,H. Comparison Analysis on Present Image-based Crack Detection Methods in ConcreteStructures. 3rd International Congress on Image and Signal Processing , (2010).
[5] Hlava,Z. Detection of crack in a concrete element by impact-echo method. Proceedings of the ULTRAGARSAS(ULTRASOUND), Vol.64, No.2 , (2009).
[6] Abdel-Qader,I., Pashaie-Rad,S., Abudayyeh,O. and Yehia,S. PCA-Based algorithm for unsupervised bridgecrack detection. Advances in Engineering Software 37, (2006).
[7] Salim Lim,R., Manh La,H., Shan,Z. and Sheng,W., Developing a Crack Inspection Robot for Bridge Mainte-nance. IEEE International Conference on Robotics and Automation, (2011).
[8] Kelvin C. P. Wang and Weiguo G., Automated Real-Time Pavement Crack Detection and Classification.Highway IDEA Project 111
[9] Oliveira, H. and Correia,P.L. Automatic crack detection on road imagery using anisotropic di↵usion andregion linkage. 18th European Signal Processing Conference , (2010).
[10] Fischler, Martin A. and Bolles, Robert C. Random sample consensus: a paradigm for model fitting withapplications to image analysis and automated cartography. Commun. ACM, Vol. 24, No. 6. (June 1981), pp.381-395., ,(1981).