computer visualization: introduction spring, 2014 university of texas – pan american csci 6361,...
TRANSCRIPT
Computer Visualization:Introduction
Spring, 2014
University of Texas – Pan AmericanCSCI 6361, Spring 2014

About the Course …
• Welcome and introductions
• Handout - Syllabus and Schedule
Visualization …
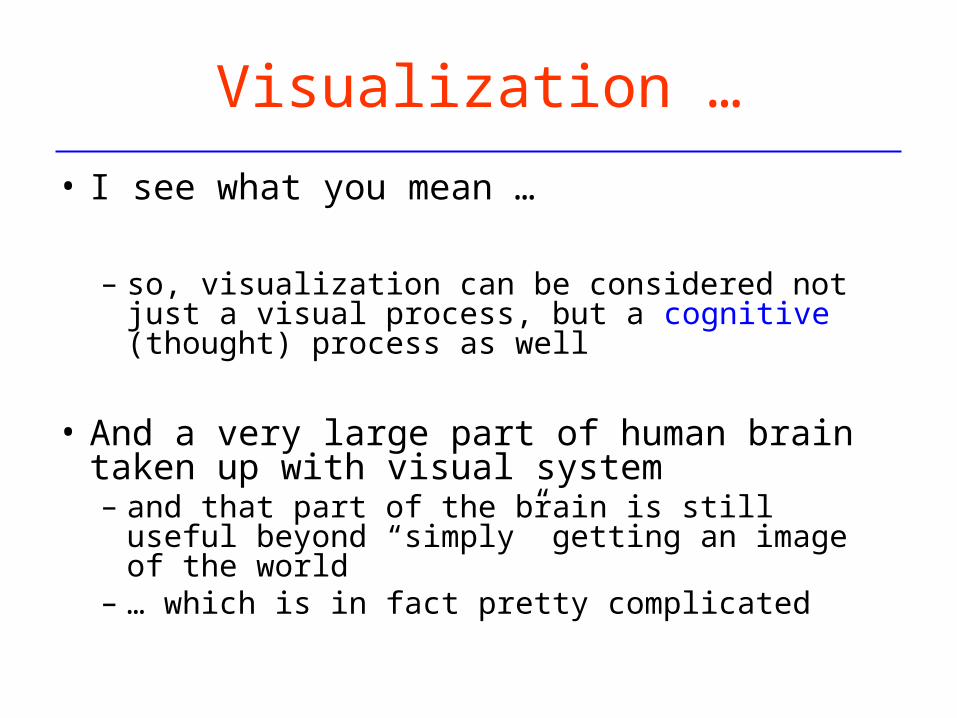
• I see what you mean …
– so, visualization can be considered not just a visual process, but a cognitive (thought) process as well
• And a very large part of human brain taken up with visual system– and that part of the brain is still useful beyond
“simply” getting an image of the world– … which is in fact pretty complicated

Visual Pathways of Humans
• And a very large part of human brain taken up with visual system– and that part of the brain is still useful beyond “simply” getting an image of the world
– … which is in fact pretty complicated

Overview
• Visualization – what it is, why use– Visualization and insight …and what insight is– Induction and deduction …. Logic of Discovery and Logic of Justification
• Scientific visualization and information visualization– The physical and abstract– … and data visualization, too
• Data analysis and data types– The challenges of N-dimensional data visualization
• Imaging, Computer Graphics and Visualization– Distinctions among
• Data exploration and data mining– Putting the “human in the loop”

Visualization is …
• Visualize:– “To form a mental image or vision of …”– “To imagine or remember as if actually seeing …”– Firmly embedded in language, if you see what I mean
• (Computer-based) Visualization:– The use of computer-supported, interactive, visual
representations of ______ data to amplify cognition– Cognition is the acquisition or use of knowledge
• Scientific Visualization: physical
• Information Visualization: abstract

Visualization is not New
• Cave guys, prehistory, hunting
• Directions and maps
• Science and graphs– e.g, Boyle: p = vt
• … but, computer based visualization is new– … and the systematic delineation of the design
space of (especially information) visualization systems is growing nonlinearly
Visualization and Insight
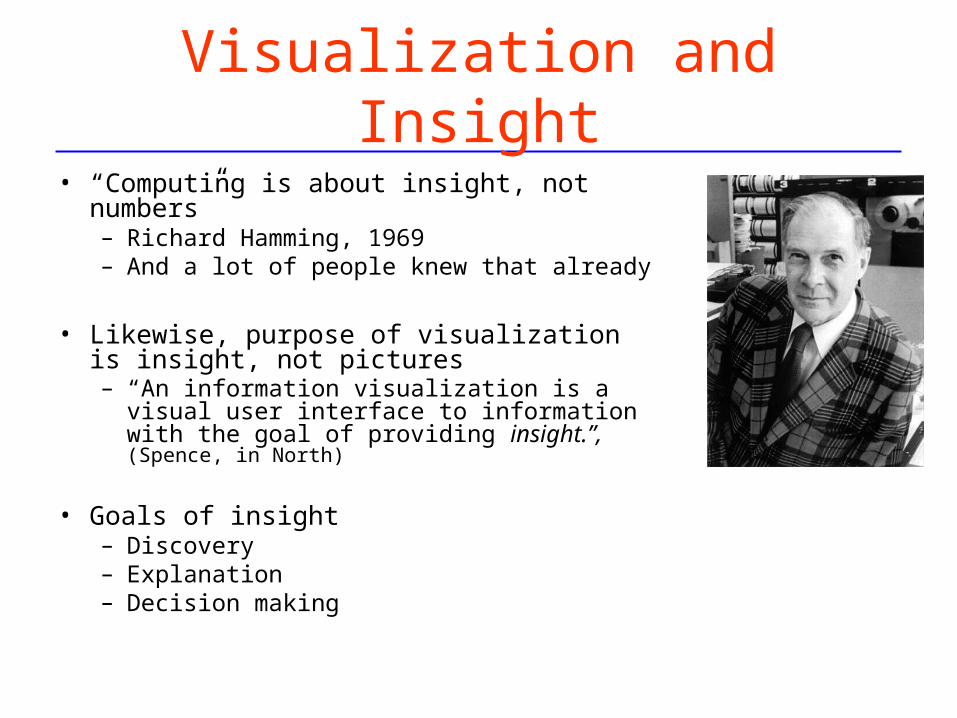
• “Computing is about insight, not numbers”– Richard Hamming, 1969– And a lot of people knew that already
• Likewise, purpose of visualization is insight, not pictures– “An information visualization is a visual user
interface to information with the goal of providing insight.”, (Spence, in North)
• Goals of insight– Discovery– Explanation– Decision making

Visualization and Insight
• Computing is about insight, not numbers• Hamming, 1969• … and a lot of people got it right away
• Likewise, purpose of visualization is insight, not pictures
• Goals of insight:• Discovery• Decision making• Explanation
“Computing is about insight, not numbers”

“Computing is about insight, not numbers”
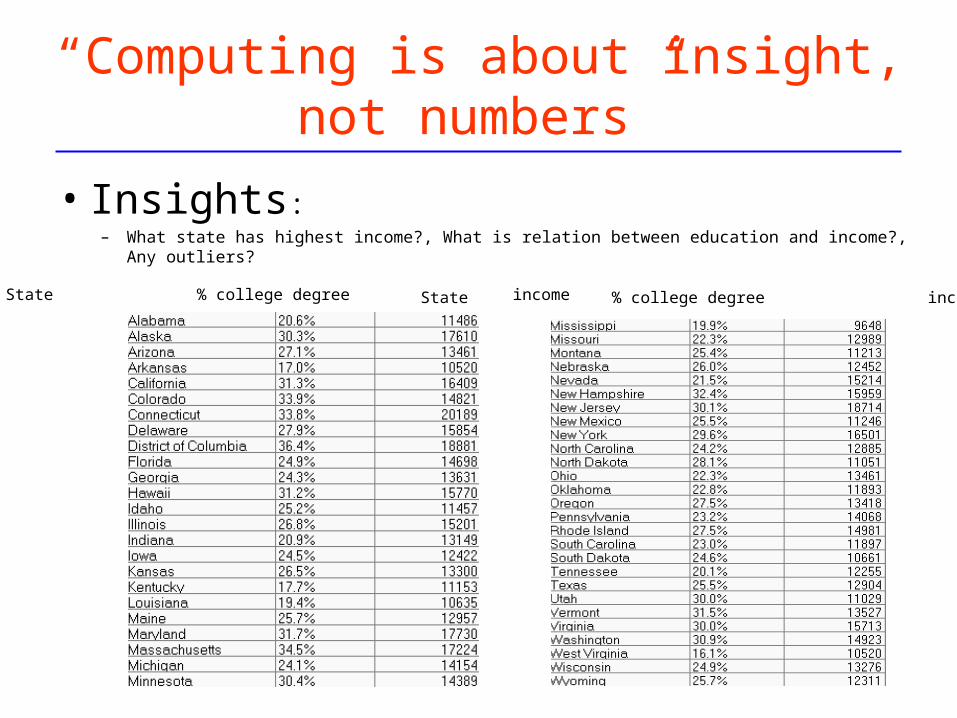
• Numbers – states, %college, income:State % college degree income State % college degree income
“Computing is about insight, not numbers”
• Insights:– What state has highest income?, What is relation between education and income?, Any outliers?
State % college degree income State % college degree income

“Computing is about insight, not numbers”
• Insights:– What state has highest income?, What is relation between education and income?, Any
outliers?

“Computing is about insight, not numbers”
• Insights:– What state has highest income?, What is relation between education and income?, Any
outliers?
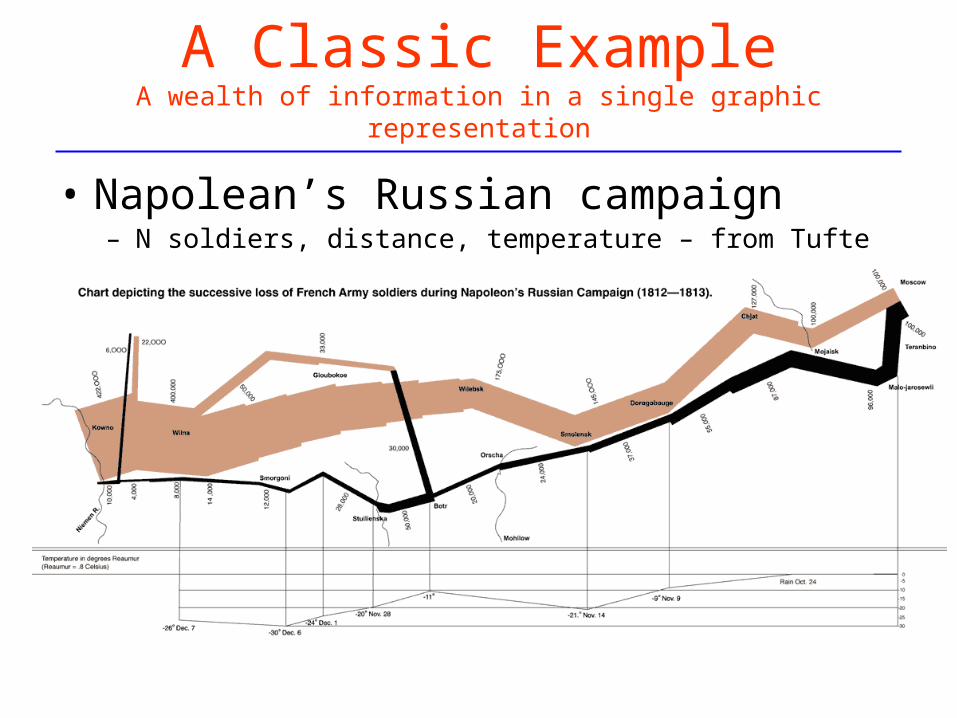
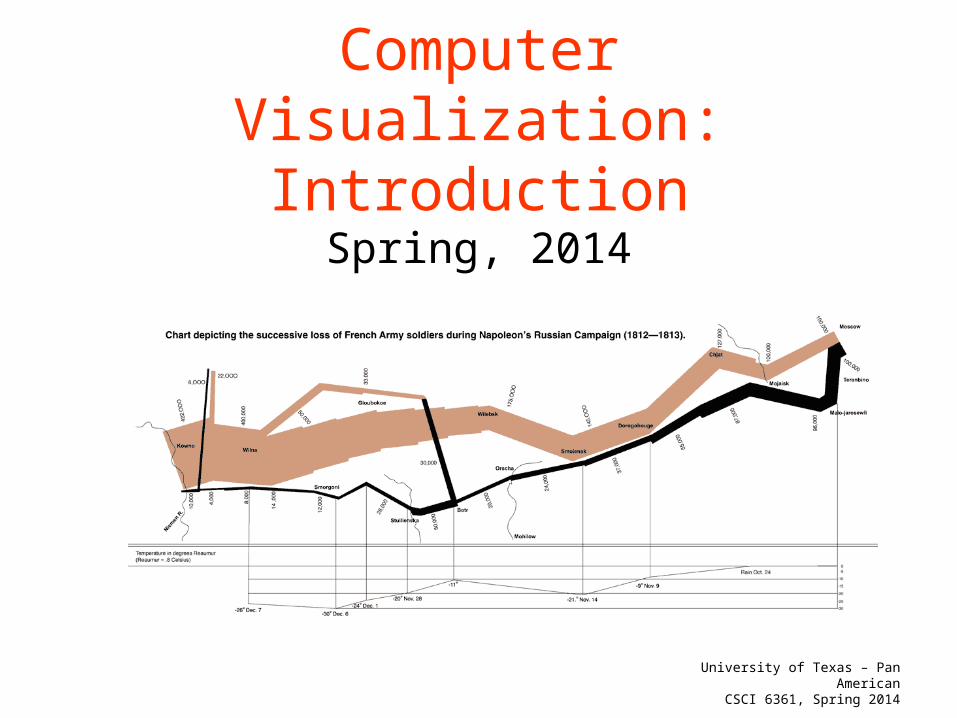
A Classic ExampleA wealth of information in a single graphic representation
• Napolean’s Russian campaign– N soldiers, distance, temperature – from Tufte
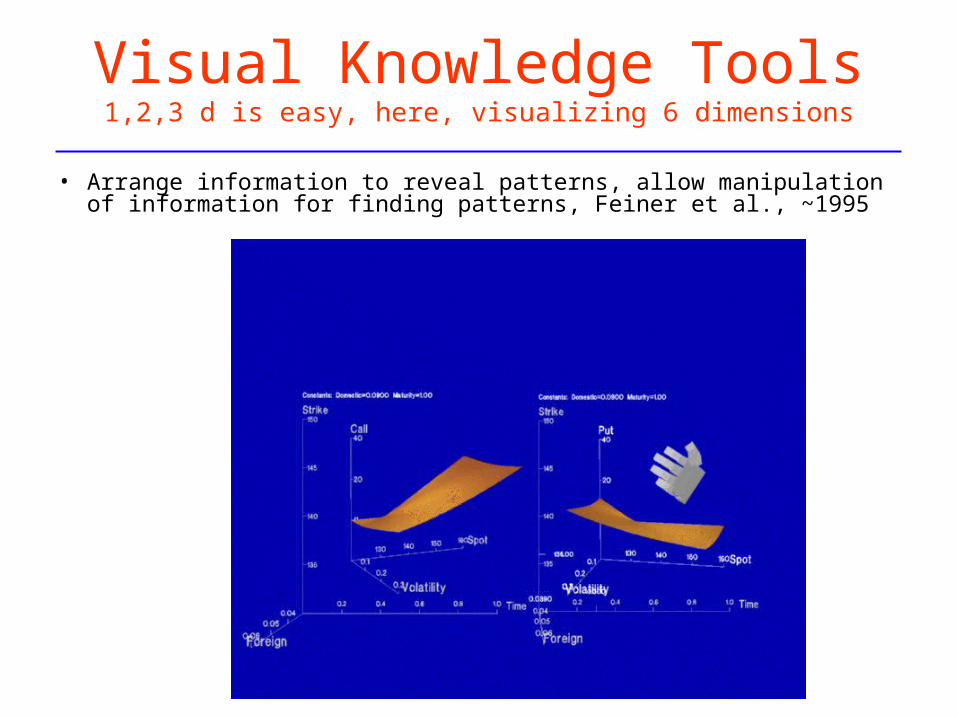
Visual Knowledge Tools1,2,3 d is easy, here, visualizing 6 dimensions
• Arrange information to reveal patterns, allow manipulation of information for finding patterns, Feiner et al., ~1995
And Insight can be Quick …
• Some examples ….

London Subway – ActualA jumble
• x
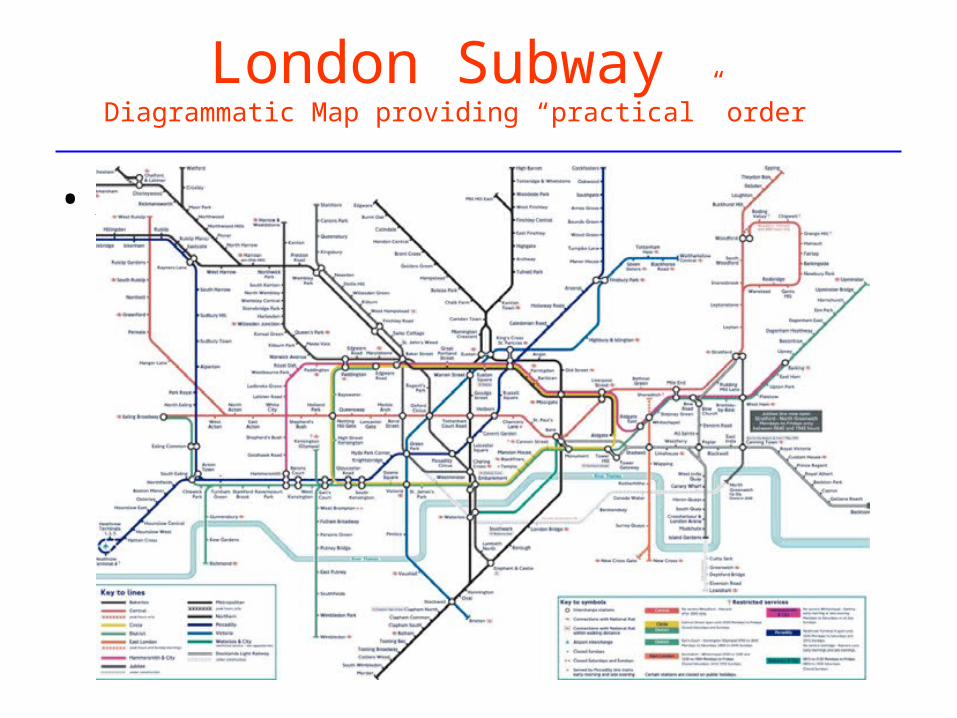
London Subway Diagrammatic Map providing “practical” order
• x

And, For what it’s worth …Insight into state names in country music songs

Pie Chart …
• http://infosthetics.com/archives/2008/09/funniest_pie_chart_ever.html
(humor)
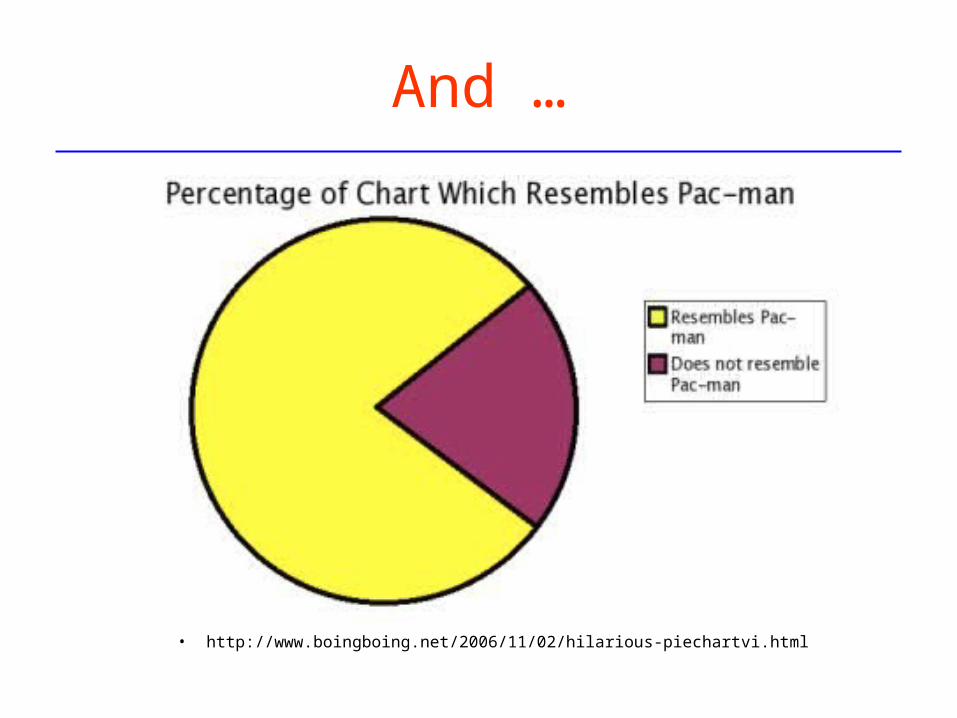
And …
• http://www.boingboing.net/2006/11/02/hilarious-piechartvi.html
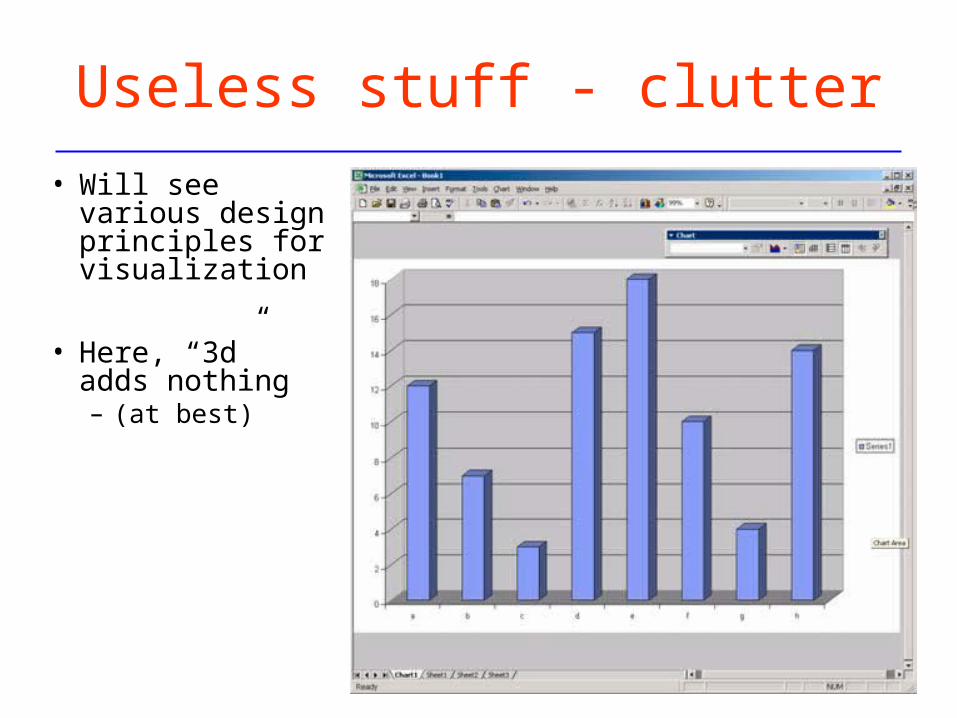
Useless stuff - clutter
• Will see various design principles for visualization
• Here, “3d” adds nothing– (at best)
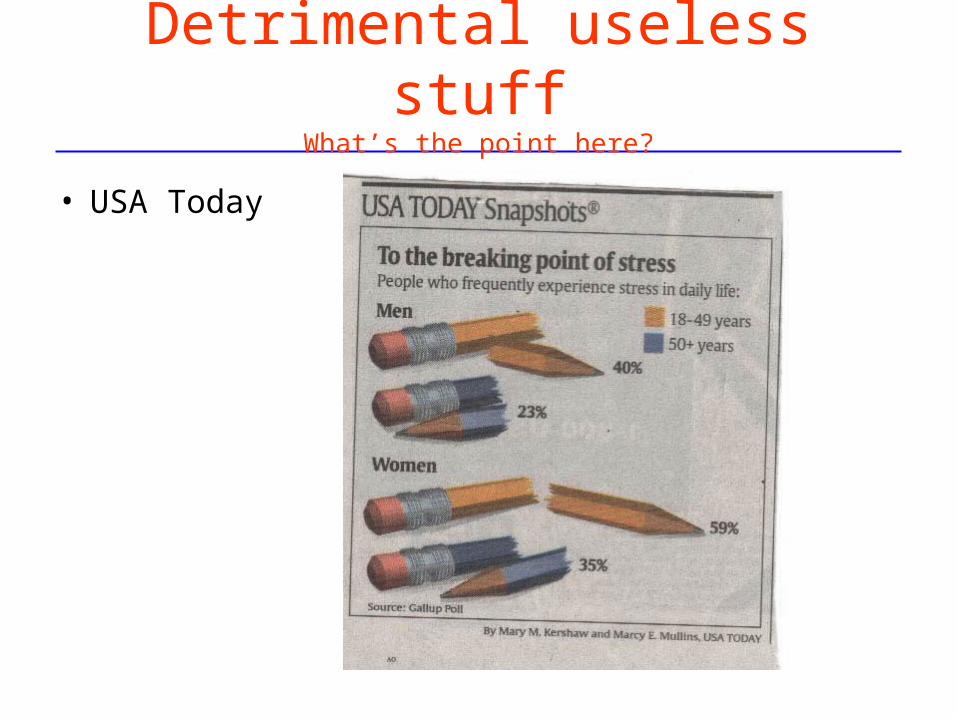
Detrimental useless stuffWhat’s the point here?
• USA Today

A Final Example
• Presented to decision makers– To launch or not– Temp in 30’s
• “Chart junk”
• Finding form of visual representation is important– cf. “Many Eyes”

A Final Example
• With right visualization, insight (pattern) is obvious– Plot o-ring damage vs. temperature

Why Visualize? (The domain scientist and the computer scientist)
Hudson, 2003
Why Visualize? (The domain scientist and the computer scientist)
• Why? … for insight – As noted, for discovery, decision making, and explanation– Here, will focus on the “scientist” / “computer scientist” collaboration
• Domain Scientist:The biologist, geologist, …
– “I’d rather be in the lab!”
• Computer Scientist:– “I’d rather be developing algorithms!”
• And an interesting place to be is right in the middle …– … which is what visualization is about– … so, requires knowing about “scientist” (a human) and “computing
and display” system (which you know a fair amount about already)Hudson, 2003
Why Visualize? Domain Scientist Reply
• “If Mathematics is the Queen of the Sciences, then Computer Graphics is the Royal Interpreter.”
• Experiments and simulations produce reams of data
– And science is about understanding, not numbers
• Vision is highest-bandwidth channel between computer and scientist
• Visualization (visual representations)– Puts numbers back into a relevant framework and allows
understanding of large-scale features, or detailed features
Hudson, 2003
Why Visualize? Computer Scientist Reply
• Fine, CS is a synthetic discipline: – “Toolsmiths”
• “Driving Problem Approach”– Forces you to do the hard parts of a problem– Acid test for whether your system is useful– Teaches you a little about other disciplines
• It’s a lot of fun to be there when your collaborator uses the tool to discover or build something new
Hudson, 2003
Bringing Multiple Specialties to Bear
• Interdisciplinary work often leads to synergies
• Enables attacks on problems that a single discipline cannot work on alone, e.g.,– Advanced interfaces
• Physics, Computer Science
– Physical properties of DNA: • Chemistry, Physics
– Properties and shape of Adenovirus: • Gene Therapy, Physics and Computer Science
– CNT/DNA computing elements: • Computer Science, Physics, Chemistry, Biochemistry
Hudson, 2003

About (Scientific) Visualization
• “Scientific visualization is not yet a discipline founded on well-understood principles. In some cases we have rules of thumb, and there are studies that probe the capabilities and limitations of specific techniques. For the most part,however, it is a collection of ad hoc techniques and lovely examples.” – Taylor, 2000
Hudson, 2003
About (Scientific) Visualization
• “Scientific visualization is not yet a discipline founded on well-understood principles. In some cases we have rules of thumb, and there are studies that probe the capabilities and limitations of specific techniques. For the most part,however, it is a collection of ad hoc techniques and lovely examples.” – Taylor, 2000
• Or maybe that’s wrong …– Maybe in fact we (people) know a lot about visualization, e.g., 2-
d and 3-d graphs, because we have been doing it since, well, the cave days
• Either way the systematic delineation of the design space of display techniques for computer based visualization is early on Hudson, 2003

Scientific Visualization Data Examples
• Visualization of data computed from physical simulations (on possibly powerful computers) - examples
• Visualization of data observed from physical phenomena (e.g., clashes of accelerated particles)

Visualization – Main Ideas
• Definition:– “The use of computer-supported, interactive visual representations of
data to amplify cognition.”• Card, Mackinlay Shneiderman ’98• This is among the most widely accepted contemporary working definitions
• Visuals help us think– Provide a frame of reference, a temporary storage area
• Cognition → Perception
• Pattern matching
• External cognition aid– Role of external world in thinking and reason
• Larkin & Simon ’87• Card, Mackinlay, Shneiderman ‘98
“…amplify cognition…”
• “It is things that make us smart…” – Don Norma and others
• Humans think by interleaving internal mental action with perceptual interaction with the world
– Try 34 x 72 without paper and pencil (or calculator)
• This interleaving is how human intelligence is expanded– Within a task (by external aids)– Across generations (by passing on techniques)
• External graphic (visual) representations are an important class of external aids
• “External cognition”
“… amplifying cognition…” (opt.)
• Don Norman (cognitive scientist):
– The power of the unaided mind is highly overrated. Without external aids, memory, thought, and reasoning are all constrained. But human intelligence is highly flexible and adaptive, superb at inventing procedures and objects that overcome its own limits. The real powers come from devising external aids that enhance cognitive abilities. How have we increased memory, thought, and reasoning? By the invention of external aids: It is things that make us smart. (Norman, 1993, p. 43)
When to use Visualization?
• Many other techniques for data analysis– Data mining, DB queries, machine learning…
• Visualization most useful in exploratory data analysis:
– Don’t know (exactly) what you’re looking for …– Don’t have a priori questions ...– Want to know what questions to ask …
• I.e., to determine questions, or, hypotheses
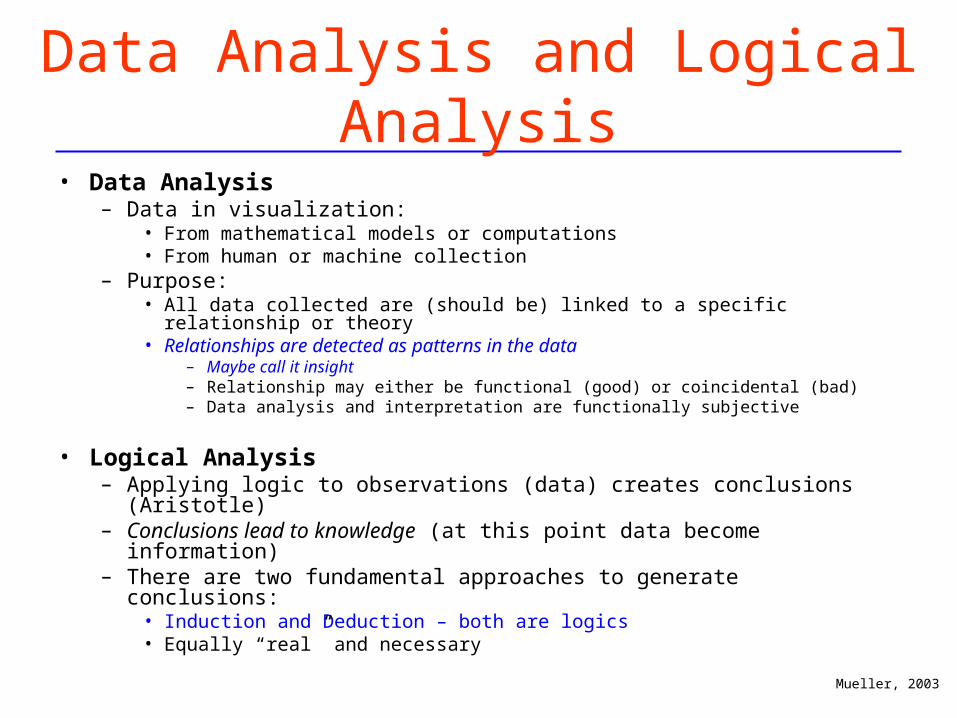
Data Analysis and Logical Analysis
• Data Analysis– Data in visualization:
• From mathematical models or computations• From human or machine collection
– Purpose:• All data collected are (should be) linked to a specific relationship or theory• Relationships are detected as patterns in the data
– Maybe call it insight– Relationship may either be functional (good) or coincidental (bad)– Data analysis and interpretation are functionally subjective
• Logical Analysis– Applying logic to observations (data) creates conclusions (Aristotle)– Conclusions lead to knowledge (at this point data become information)– There are two fundamental approaches to generate conclusions:
• Induction and Deduction – both are logics• Equally “real” and necessary
Mueller, 2003
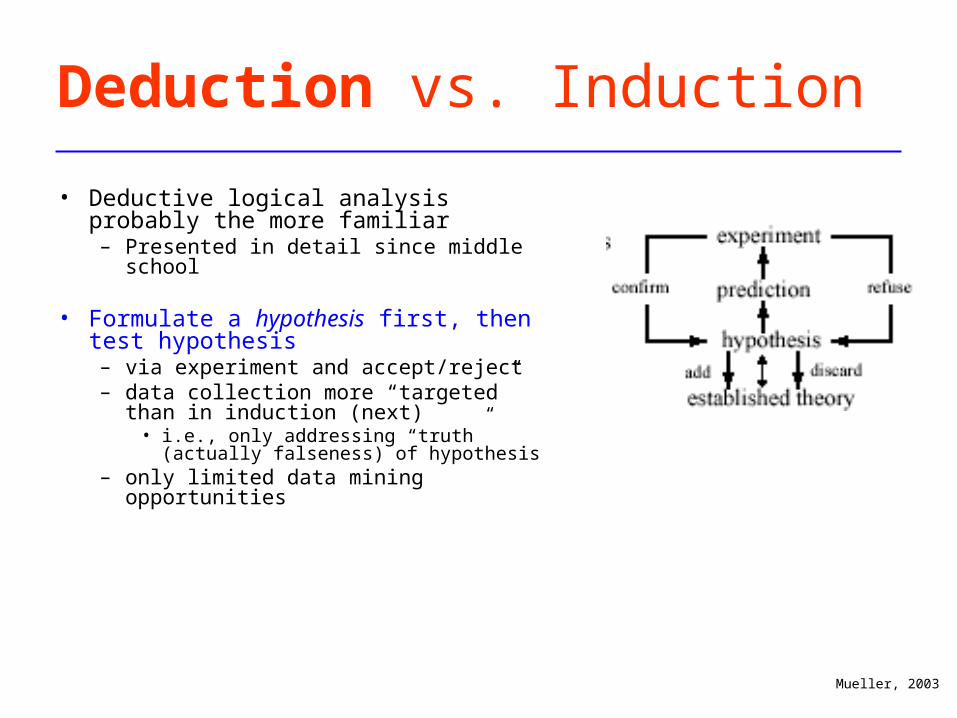
Deduction vs. Induction
• Deductive logical analysis probably the more familiar– Presented in detail since middle school
• Formulate a hypothesis first, then test hypothesis– via experiment and accept/reject– data collection more “targeted” than in
induction (next)• i.e., only addressing “truth” (actually
falseness) of hypothesis– only limited data mining opportunities
Mueller, 2003

Deduction vs. Induction
• Inductive logical analysis part of scientific process, and reasoning generally, – but perhaps delineation of elements less familiar
• Like, where do the hypotheses come from?– Insight?
• Make observations first, then draw conclusions– organized data survey (structured analysis,
visualization) of the raw data provide the basis for the interpretation process
– interpretation process will produce knowledge that is being sought
– experience of individual scientist (observer) is crucial– important: selection of relevant data, collection method,
and analysis method– data mining is an important knowledge discovery
strategy – ubiquitious data collection, filtering, classification, and
focusing is crucialMueller, 2003

Logic of Discovery
• Where do the hypothesis come from?
• Probably familiar with: Logic of justification– Concerned with deductive reasoning– Falsification of theories and hypothesis– “Writing up the experiment”
• Also, Logic of discovery– Concerned with inductive reasoning– Just as can specify with some precision the elements of deductive
reasoning, can specify element of inductive reasoning– “Getting ideas (hypotheses) to test experimentally”
• Visualization does play role in each– Emphasis here is on induction, as is perhaps the less familiar

About the Data to be VisualizedSome details
• Origin:– real world data
• measured from real-world objects and processes (sensors, statistics, surveys)– model data
• computed by machines (numerical simulations, scientific computations)– design data - edited by humans
• Size: - number of samples and data items (kB, GB, MB, TB)• Type:
– scalar or multi-variate, N-dimensional: number of attributes per data item (attribute vector)
– scalar or vector (e.g., flow direction)• Range and domain:
– qualitative (non-numerical) vs. quantitative (measurements)• Value:
– categorical (nominal): • categories are disjunct, no intrinsic rank (e.g., {yellow, red, green})
– ordinal data: • data members of ordered sequence of categories (e.g. {tiny, small, large, huge})
Mueller, 2003

Dataset DimensionalityMore about the data
• Number of variables involved and dimension of each variable
• Univariate data:– a single variable– visualization can be a simple plot v = f(x)
• Bivariate data– two variables– visualization can be a surface v = f(x, y)
• Trivariate data – ex., flame simulation– three variables– visualization can be volume rendering v =
f(x, y, z)– occlusions become a problem since we
must visualize a 3D dataset on a 2D screen• Multivariate or N-D data (for N > 2)
– visualization becomes challenging
Mueller, 2003

Multivariate DataAgain, 1,2,3 d is easy - Practical Example
• You (a person) can be considered a multi-dimensional data point when it comes to your statistical properties, examples are:
– annual salary, rent, mortgage, stock revenues and losses, life insurance, credit card balance
– number of children, pets, cars, computers, telephones, cell phones, kidneys– money spent on CDs, computer games, eating out, movies, comic books, DVDs– hours spent surfing the web, sick leaves, vacations, watching TV, making phone
calls– location of residence (zip code), profession, nationality, family status, age,
interests• Large commercial interest to identify and target certain groups of people
• Another example: Categorize all web pages or text documents • The general task is:
– identify the cluster of datapoints that fit a certain metric or set of criteria• The general problem is:
– automated (statistical) methods usually fail for large and fuzzy problem spaces
• Visualization can help:– but... how does one visualize data in N-space?

Terminology
• Scientific Visualization– Field in computer science that encompasses user interface, data
representation and processing algorithms, visual representations, and other sensory presentation such as sound or touch (McCormick, 1987)
• Data Visualization– More general than scientific visualization, since it implies treatment of
data sources beyond the sciences and engineering, e.g., financial, marketing, numerical data generally
– Includes application of statistical methods and other standard data analysis techniques (Rosenblum, 1994)
• Information Visualization– Concerned typically with more abstract, often semantic, information,
e.g., hypertext documents, WWW, text documents
Shroeder et al., 2002
Contexts of Visualization
• If data spatio-temporal (up to 3 spatial coordinates and time), – typically scientific visualization methods used
• If data higher dimensional (>4), or abstract, – typically information visualization techniques used
• Human perceptual system is highly tuned to space-time relations– This (3-d, or 4 with time) coordinate system understood with little or no
explanation
• Visualization of abstract data typically requires extensive explanation to understand what, and its representation, being viewed
• Still, there is overlap:– Often, first step in IV visualization process is to project abstract data into the
spatial-temporal domain (3d + time), and use SciViz techniques to view– Projection process can be quite complex, involving methods of statistical
graphics, data mining, etc., or may just select subset of dimensions to view
Shroeder et al., 2002
Imaging, Computer Graphics, and Visualization
• Imaging, or image processing– Study of 2D pictures, or images– Includes techniques to transform, extract information from, analyze, and enhance
images
• Computer graphics– Process of creating images using a computer– Includes both 2D and 3D
• Visualization– Process of exploring, transforming, and viewing data as images (or other sensory
forms) to gain understanding and insight into data
• Distinguishing visualization from computer graphics:– Dimensionality of data is 3D or greater– Concerned with data transformation, i.e., information is repeatedly created and
modified to enhance extracting meaning from data– Naturally interactive, human included directly in process of creating,
transforming, and viewing data
Shroeder et al., 2002
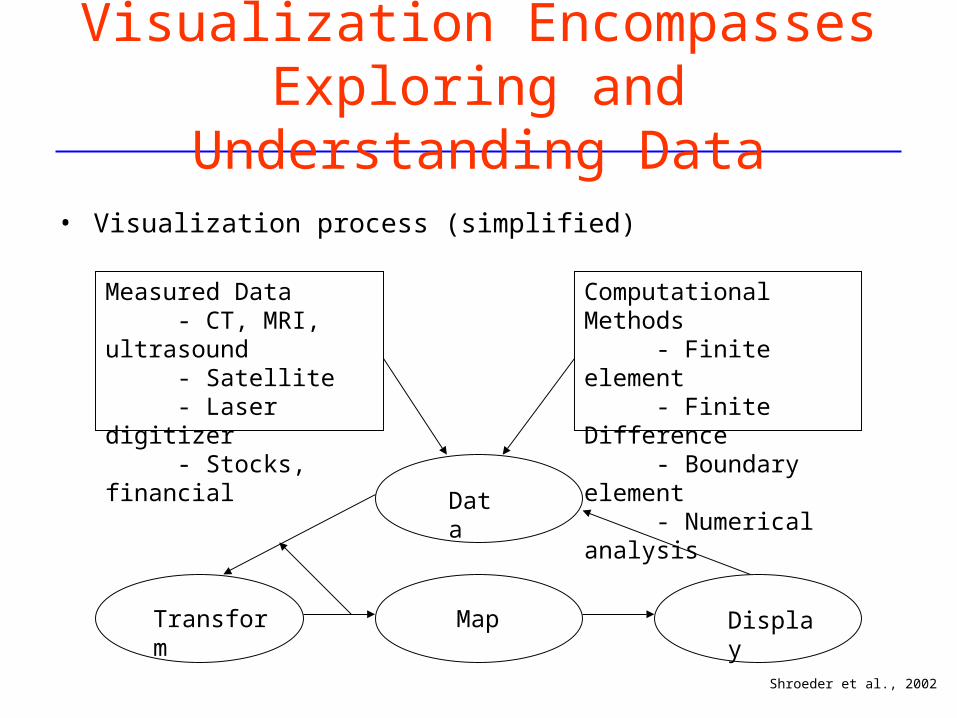
Visualization Encompasses Exploring and Understanding Data
• Visualization process (simplified)
Shroeder et al., 2002
Transform Map Display
Data
Measured Data - CT, MRI, ultrasound - Satellite - Laser digitizer - Stocks, financial
Computational Methods - Finite element - Finite Difference - Boundary element - Numerical analysis

Data Exploration and Mining Techniques - The User in the Loop
• View refinement and navigation loop:– view and navigation control is important for extended and
detailed visual spaces that contain (visually) mapped data– working memory needs focus+context to perform better
Mueller, 2003
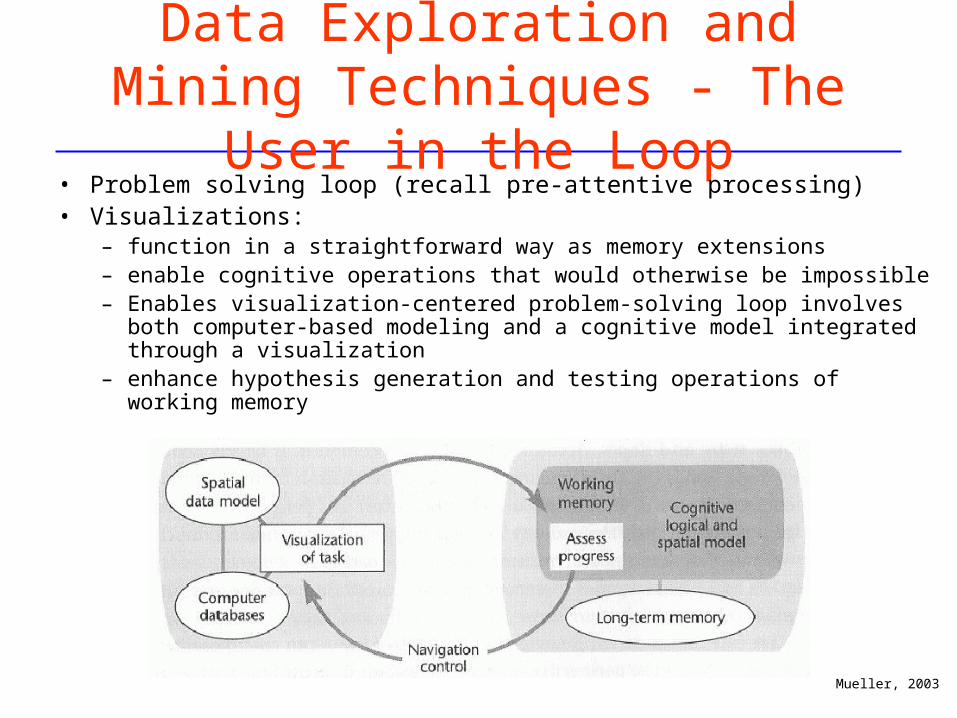
Data Exploration and Mining Techniques - The User in the Loop
• Problem solving loop (recall pre-attentive processing)• Visualizations:
– function in a straightforward way as memory extensions– enable cognitive operations that would otherwise be impossible– Enables visualization-centered problem-solving loop involves both
computer-based modeling and a cognitive model integrated through a visualization
– enhance hypothesis generation and testing operations of working memory
Mueller, 2003
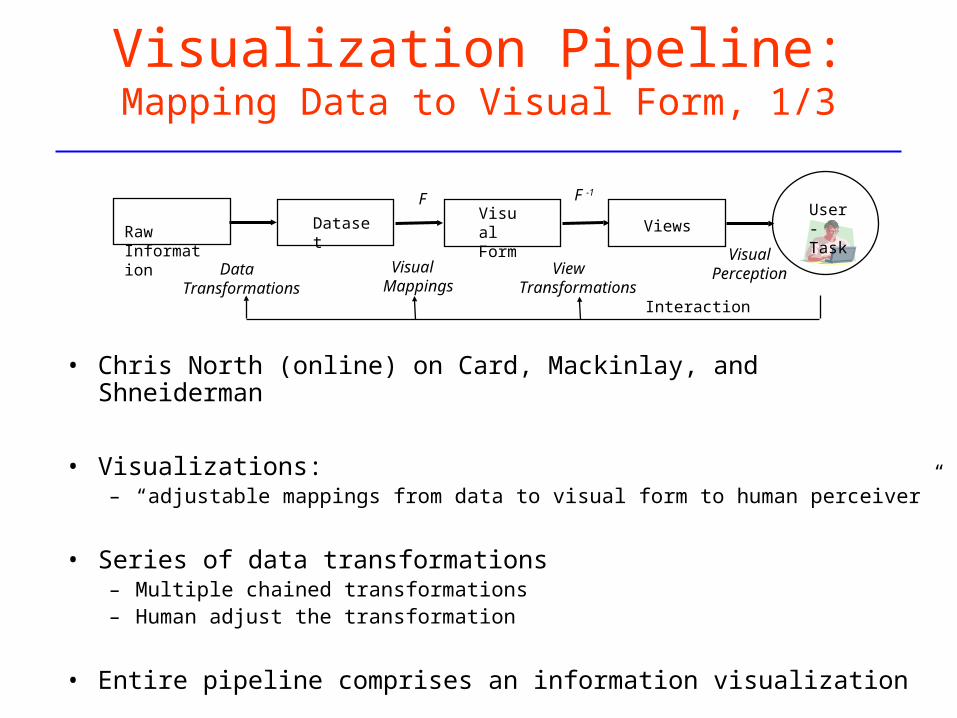
Visualization Pipeline:Mapping Data to Visual Form, 1/3
• Chris North (online) on Card, Mackinlay, and Shneiderman
• Visualizations: – “adjustable mappings from data to visual form to human perceiver”
• Series of data transformations– Multiple chained transformations– Human adjust the transformation
• Entire pipeline comprises an information visualization
RawInformation
VisualForm
Dataset Views
User - Task
DataTransformations
VisualMappings
ViewTransformations
F F -1
Interaction
VisualPerception
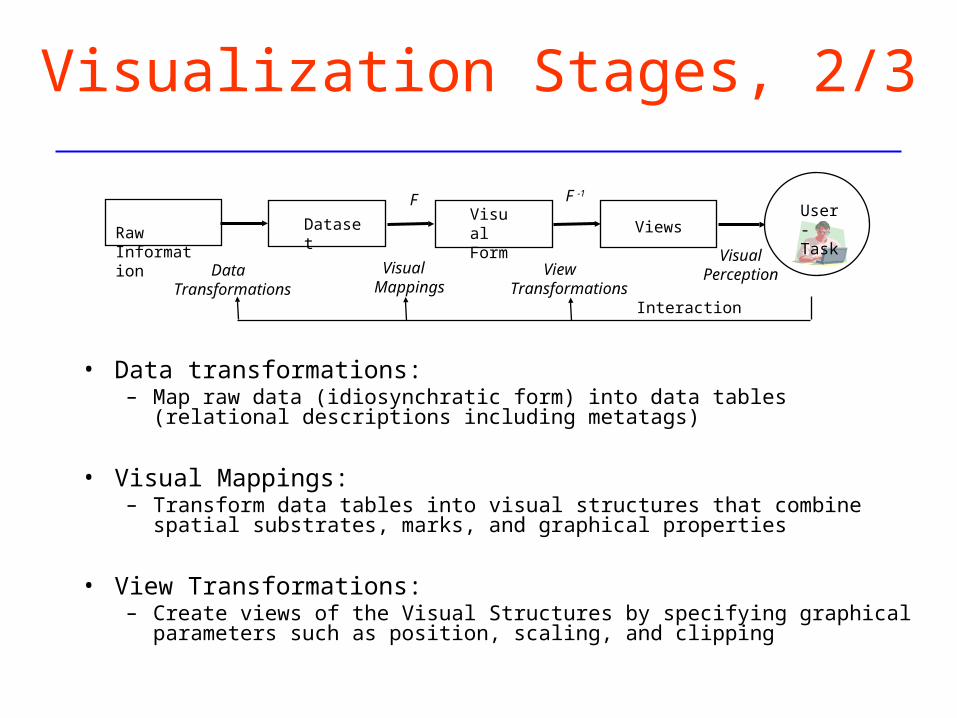
Visualization Stages, 2/3
• Data transformations:– Map raw data (idiosynchratic form) into data tables (relational descriptions
including metatags)
• Visual Mappings:– Transform data tables into visual structures that combine spatial
substrates, marks, and graphical properties
• View Transformations:– Create views of the Visual Structures by specifying graphical parameters
such as position, scaling, and clipping
RawInformation
VisualForm
Dataset Views
User - Task
DataTransformations
VisualMappings
ViewTransformations
F F -1
Interaction
VisualPerception

Information Structure, 3/3
• Visual mapping is starting point for visualization design
• Includes identifying underlying structure in data, and for display– Tabular structure– Spatial and temporal structure– Trees, networks, and graphs– Text and document collection structure– Combining multiple strategies
• Impacts how user thinks about problem - Mental model
RawInformation
VisualForm
Dataset Views
User - Task
DataTransformations
VisualMappings
ViewTransformations
F F -1
Interaction
VisualPerception

IBM’s Many Eyes
• Multiple visualizations

IBM’s Many Eyes
• Life expectancy vs. health care costs
• http://manyeyes.alphaworks.ibm.com/manyeyes/visualizations/life-expectancy-vs-per-capita-annu

IBM’s Many Eyes
• Visualization types

• .
End …