computerized investing seminar: november 2008...
TRANSCRIPT

Computerized Investing Seminar: Computerized Investing Seminar: November 2008November 2008
AAII Stock Investor ProAAII Stock Investor Pro
Andy ProphetAndy ProphetAAII Silicon Valley ChapterAAII Silicon Valley Chapter
“Give an investor a fish and they will eat today“Give an investor a fish and they will eat today
Teach an investor to fish and they will eat for a lifetime!”Teach an investor to fish and they will eat for a lifetime!”

November 08November 08AAII Silicon Valley ChapterAAII Silicon Valley Chapter
SISI--Pro User’s GroupPro User’s Group 22
Presentation OverviewPresentation Overview
• Navigating SI-Pro• Selecting a Company• Screening Strategies• Stock Notebook Tabs• Valuation• Using Custom Screening Criteria• Prospecting Using Dividend Screen• Summary & Closing Comments• Resources & References• Questions & Comments

November 08November 08AAII Silicon Valley ChapterAAII Silicon Valley Chapter
SISI--Pro User’s GroupPro User’s Group 33
Investing StepInvesting Step--byby--StepStepScreeningScreening
AnalysisAnalysis
Buy & Buy & MonitorMonitor
SellSell
Remember: Remember:
Screening is only the first step and should Screening is only the first step and should notnot be considered as “buy” be considered as “buy” recommendationrecommendation
Using screeners assumes the investor is prepared to spend timefollowing the steps outlined above

November 08November 08AAII Silicon Valley ChapterAAII Silicon Valley Chapter
SISI--Pro User’s GroupPro User’s Group 44
Stock Screeners: Key CharacteristicsStock Screeners: Key Characteristics– Quantitative data: Company balance sheet,
income statement, earnings etc.– Updated on regular basis (week, monthly yearly)– Many come with pre-defined screens such as:
• Martin Zwieg• Dividend (High Relative Yield, Drips, or Non-Drips) • O’Shaughnessy• Buffet• Many others
– Screens and be customized
November 08November 08AAII Silicon Valley ChapterAAII Silicon Valley Chapter
SISI--Pro User’s GroupPro User’s Group 55
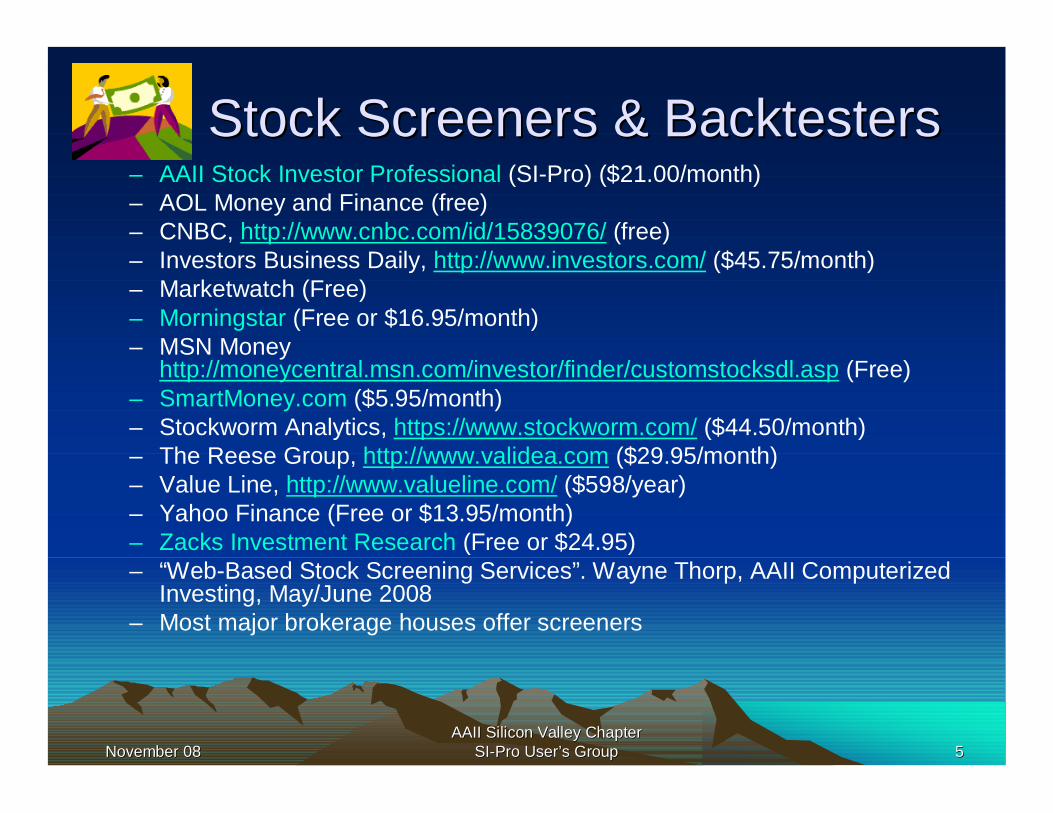
Stock Screeners & Stock Screeners & BacktestersBacktesters– AAII Stock Investor Professional (SI-Pro) ($21.00/month)– AOL Money and Finance (free)– CNBC, http://www.cnbc.com/id/15839076/ (free)– Investors Business Daily, http://www.investors.com/ ($45.75/month)– Marketwatch (Free)– Morningstar (Free or $16.95/month)– MSN Money
http://moneycentral.msn.com/investor/finder/customstocksdl.asp (Free)– SmartMoney.com ($5.95/month)– Stockworm Analytics, https://www.stockworm.com/ ($44.50/month)– The Reese Group, http://www.validea.com ($29.95/month)– Value Line, http://www.valueline.com/ ($598/year)– Yahoo Finance (Free or $13.95/month)– Zacks Investment Research (Free or $24.95)– “Web-Based Stock Screening Services”. Wayne Thorp, AAII Computerized
Investing, May/June 2008– Most major brokerage houses offer screeners

November 08November 08AAII Silicon Valley ChapterAAII Silicon Valley Chapter
SISI--Pro User’s GroupPro User’s Group 66
Stock Screeners & Stock Screeners & BacktestersBacktestersContinuedContinued
– Zacks Research Wizard & Backtester ($1800/year, advanced version$3000/year) (see Sep/Oct 08 issue of Computerized Investing for detailed review)
– Mechanical Investing Backtester, Jamie Gritton,http://www.backtest.org/ (free)
– Keelix Backtester, http://keelix.com/dp/node/37 (free)

November 08November 08AAII Silicon Valley ChapterAAII Silicon Valley Chapter
SISI--Pro User’s GroupPro User’s Group 77
SISI--Pro can helpPro can help– Screen stocks based upon their financial qualities– Display and analyze screening results
• Use organized program displays to study how a company stacks up to its competition and the market
• Print standard or custom reports for a single company or a groupof companies
• Export data to spreadsheet or text file for additional study
• Export to in SSG data format for analysis within BetterInvesting’s Stock Investor’s Toolkit program
– Learn about screening strategies and analysis through pre-programmed screens and articles
– Create tracking lists (portfolios) for further study

November 08November 08AAII Silicon Valley ChapterAAII Silicon Valley Chapter
SISI--Pro User’s GroupPro User’s Group 88
SISI--ProPro• Powerful fundamental screening system providing
detail company and industry data– 50+ preinstalled screening strategies– Ability to create your own screens
• Covers 8,900 companies– NYSE (2,148), Amex (597), NASDAQ National and
SmallCap markets (3,123), and NASDAQ Bulletin Board stocks (2,733)ADRs (520), REITs (255), Closed-end funds (193)
• Detailed sector (12) and industry (100) data• Fundamental data supplied by Reuters and earnings
estimates supplied by I/B/E/S (Institutional Brokers Estimate System)

November 08November 08AAII Silicon Valley ChapterAAII Silicon Valley Chapter
SISI--Pro User’s GroupPro User’s Group 99
Features Stock Investor ProPricing for annual Subscription $198 ($247 non-members)Platform Window s Update interval monthly (CD), w eekly (Web)Pre-defined screening f ilters 56Create personalized screens yes, using any data f ieldCompany coverage 8,600 stocksIndustry data 12 broad sectors and 100
industriesDepth of company data 2,200+ per companyCompany Financials 7 years of detailed income and
cash f low statements and balance sheets
Earnings Estimates quarterly, annual, and long-term grow th estimates along w ith recent surprise data
Price data 10 years of monthly h/l/c/v dataCharts & Graphs 6 chartsStock ticker tracking unlimitedExporting data yes, in 6 formats including ExcelCreate custom fields yes, 250 f ieldsReports 7 standard plus custom reportsNAIC SSG Data f iles yes, for all stocks

November 08November 08AAII Silicon Valley ChapterAAII Silicon Valley Chapter
SISI--Pro User’s GroupPro User’s Group 1010
Financial Statement Data SI Pro SI ProIncome Statement Balance SheetSales 8Qs, 7Ys Cash 8Qs, 7Ys Cost of Sales 8Qs, 7Ys Accounts Receivable 8Qs, 7YsGross Income 8Qs, 7Ys Inventory 8Qs, 7Ys Depreciation, Amortization 8Qs, 7Ys Short-Term Investments 8Qs, 7Ys Research & Development Expenses 8Qs, 7Ys Total Current Assets 8Qs, 7Ys Unusual Expense/Income 8Qs, 7Ys Net Plant & Equipment 8Qs, 7YsTotal Operating Expenses 8Qs, 7Ys Investments 8Qs, 7YsOperating Income 8Qs, 7Ys Goodwill/Intangible Assets 8Qs, 7Ys Non-Operating Income/Expenses 8Qs, 7Ys Total Long-Term Assets 8Qs, 7YsPretax Income 8Qs, 7Ys Total Assets 8Qs, 7Ys Income Taxes 8Qs, 7Ys Accounts Payable 8Qs, 7YsIncome After Taxes 8Qs, 7Ys Short-Term Debt 8Qs, 7Ys Nonrecurring Items 8Qs, 7Ys Total Current Liabilities 8Qs, 7YsNet Income 8Qs, 7Ys Long-Term Debt 8Qs, 7YsEPS (Basic, Continuing & Diluted) 8Qs, 7Ys Total Liabilities 8Qs, 7YsDividends 8Qs, 7Ys Preferred Stock 8Qs, 7Ys
Total Common Equity 8Qs, 7YsStatement of Cash Flows Total Liabilities & Owner's Equity 8Qs, 7YsNet Cash from Operations 8Qs, 7YsNet Cash from Investing Activities 8Qs, 7Ys Capital Expenditures 8Qs, 7YsNet Cash From Financial Activities 8Qs, 7YsCash Flow 8Qs, 7YsFree Cash Flow 8Qs, 7Ys

November 08November 08AAII Silicon Valley ChapterAAII Silicon Valley Chapter
SISI--Pro User’s GroupPro User’s Group 1111
Weekly Data DownloadsWeekly Data Downloads

Navigating SINavigating SI--ProPro

November 08November 08AAII Silicon Valley ChapterAAII Silicon Valley Chapter
SISI--Pro User’s GroupPro User’s Group 1313

November 08November 08AAII Silicon Valley ChapterAAII Silicon Valley Chapter
SISI--Pro User’s GroupPro User’s Group 1414
The Stock NotebookThe Stock Notebook• Automatically opens with the program
– Stock Notebook #1—Untitled
• Consists of 11 tabs– Each displays a related group of data– The View tab is the default tab
• Information about the notebook is displayed within the toolbar and lower portion of the notebook
• Multiple notebooks can be open at once• Think of a notebook as a template where a
screen, portfolio and/or view can applied

November 08November 08AAII Silicon Valley ChapterAAII Silicon Valley Chapter
SISI--Pro User’s GroupPro User’s Group 1515
Multiple notebooks can be open at once

Selecting a CompanySelecting a Company

November 08November 08AAII Silicon Valley ChapterAAII Silicon Valley Chapter
SISI--Pro User’s GroupPro User’s Group 1717
Find windowshortcut

November 08November 08AAII Silicon Valley ChapterAAII Silicon Valley Chapter
SISI--Pro User’s GroupPro User’s Group 1818
“Active” companyhighlighted in yellow

November 08November 08AAII Silicon Valley ChapterAAII Silicon Valley Chapter
SISI--Pro User’s GroupPro User’s Group 1919
Views Are Displayed Within NotebookViews Are Displayed Within Notebook• Program starts up with “Standard” view• Views are selected from the View menu on toolbar
view editor shortcut

November 08November 08AAII Silicon Valley ChapterAAII Silicon Valley Chapter
SISI--Pro User’s GroupPro User’s Group 2020
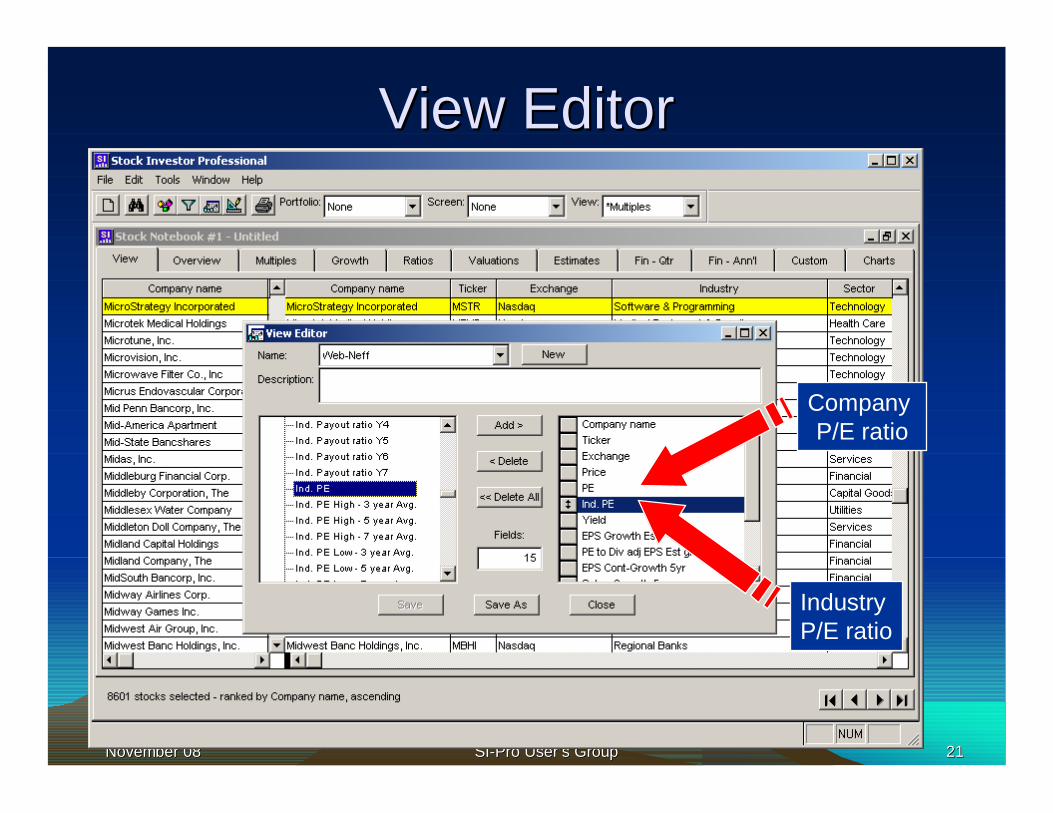
View EditorView Editor• Views contain company and industry data• Standard field picker on the left side of the
window• Running count of fields is kept in lower box• Fields are added by double-clicking or
selecting field and clicking on Add >• Double-clicking a field group will add all
elements to the view• Duplicate entries are not allowed• Order can be changed by dragging the box in
front of field name
November 08November 08AAII Silicon Valley ChapterAAII Silicon Valley Chapter
SISI--Pro User’s GroupPro User’s Group 2121
View EditorView Editor
Industry P/E ratio
Company P/E ratio

November 08November 08AAII Silicon Valley ChapterAAII Silicon Valley Chapter
SISI--Pro User’s GroupPro User’s Group 2222
Morningstar Dividend Investor ViewMorningstar Dividend Investor View

November 08November 08AAII Silicon Valley ChapterAAII Silicon Valley Chapter
SISI--Pro User’s GroupPro User’s Group 2323
PortfoliosPortfolios• A portfolio allows you to create a select group of
securities and give it a name– Stocks that you own, a hypothetical portfolio, or securities
that have passed a screen you created– Allows you to follow group from update to update
Portfolio editor shortcut

November 08November 08AAII Silicon Valley ChapterAAII Silicon Valley Chapter
SISI--Pro User’s GroupPro User’s Group 2424
Portfolios continuedPortfolios continued– Portfolio creation
Manually using Portfolio EditorImport from text fileSave the results of a screen as a portfolio
– A screen can be executed against a portfolio– Reports can be run on these specific securities
November 08November 08AAII Silicon Valley ChapterAAII Silicon Valley Chapter
SISI--Pro User’s GroupPro User’s Group 2525
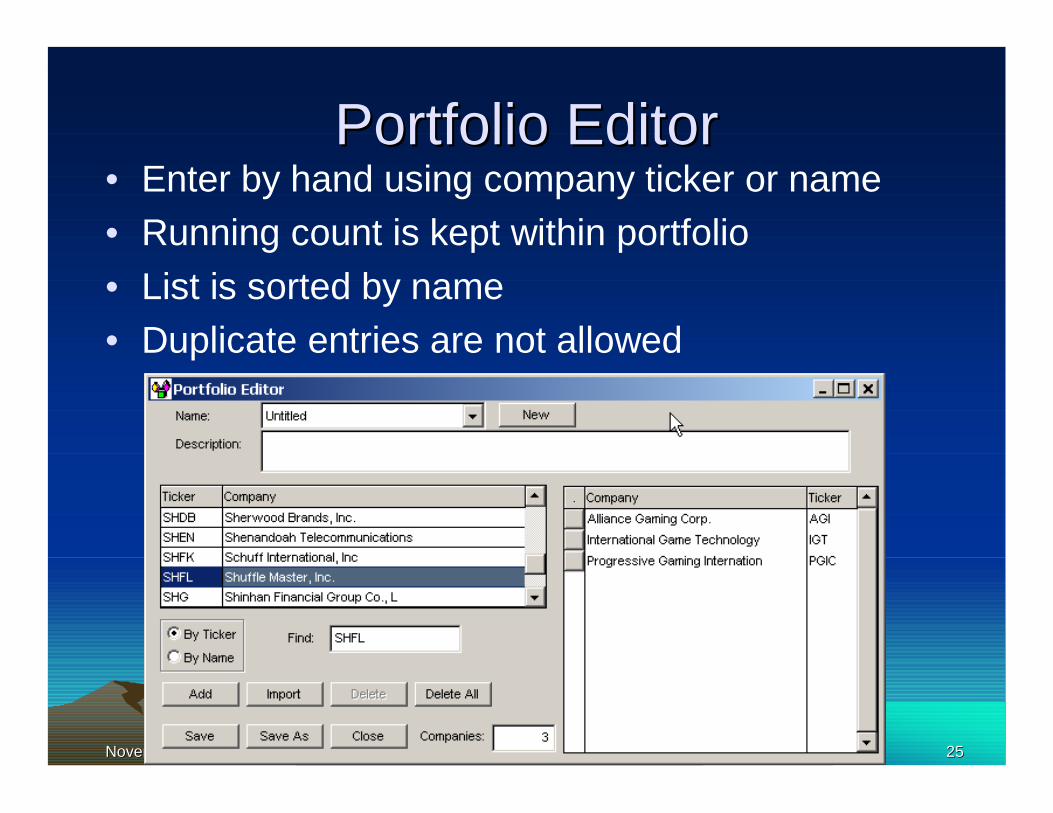
Portfolio EditorPortfolio Editor• Enter by hand using company ticker or name• Running count is kept within portfolio• List is sorted by name• Duplicate entries are not allowed

November 08November 08AAII Silicon Valley ChapterAAII Silicon Valley Chapter
SISI--Pro User’s GroupPro User’s Group 2626
Saving PortfolioSaving Portfolio

November 08November 08AAII Silicon Valley ChapterAAII Silicon Valley Chapter
SISI--Pro User’s GroupPro User’s Group 2727
Portfolios Are Loaded From ToolbarPortfolios Are Loaded From Toolbar

Screening StrategiesScreening Strategies

November 08November 08AAII Silicon Valley ChapterAAII Silicon Valley Chapter
SISI--Pro User’s GroupPro User’s Group 2929
Building a Screening StrategyBuilding a Screening Strategy• Variables, Relationships, and values
– For example: Market cap > 150 (O’Shaughnessy Growth Screen)
• Comparative relationships– EPS (Y1) > EPS (Y2) (O’Shaughnessy Growth Screen)
• Formula Builder i.e. add (+), subtract (-), multiply (*), divide (/)– Sustainable growth = (ROE 12m)*(1-(payout ratio 12m))/100
(custom formula)
– Sustainable growth >= 15• The order of the relationships or formulas is important:
– Start with the basic criteria…i.e. minimum capitalizations or minimum sales
– Next: insert key criteria such as “Free cash flow/share (12m) > 0” and “Sales-growth 5yr >= 7” etc.
– End with criteria that may help narrow screening but not mandatory: % Rank-Rel Strength 52-week >= 65 (O’Shaughnessy Growth Screen)

November 08November 08AAII Silicon Valley ChapterAAII Silicon Valley Chapter
SISI--Pro User’s GroupPro User’s Group 3030
ScreeningScreening• You can either select a screen from the
pull-down menu on the toolbar or through the Screen Editor
• By selecting a Screen from the toolbar, it runs and loads the passing companies automatically
• The Screen Editor allows you to edit screens, run them, and see how many companies pass each individual criteria

November 08November 08AAII Silicon Valley ChapterAAII Silicon Valley Chapter
SISI--Pro User’s GroupPro User’s Group 3131
Use Screens to Filter PortfoliosUse Screens to Filter Portfolios

November 08November 08AAII Silicon Valley ChapterAAII Silicon Valley Chapter
SISI--Pro User’s GroupPro User’s Group 3232
Screen PullScreen Pull--Down MenuDown Menu
Screen editor shortcut

November 08November 08AAII Silicon Valley ChapterAAII Silicon Valley Chapter
SISI--Pro User’s GroupPro User’s Group 3333
Screen Editor Activated By:Screen Editor Activated By:
Screen editor shortcut
• Clicking on “Funnel” within toolbar
• Selecting “Screen Editor” from Tools menu
• Pressing <Alt> S on the keyboard

November 08November 08AAII Silicon Valley ChapterAAII Silicon Valley Chapter
SISI--Pro User’s GroupPro User’s Group 3434
Screens Are Run Against PortfoliosScreens Are Run Against Portfolios

November 08November 08AAII Silicon Valley ChapterAAII Silicon Valley Chapter
SISI--Pro User’s GroupPro User’s Group 3535
Saved Screen SelectionSaved Screen Selection• Selected from drop-down menu• Over 50 preinstalled (predefined) screens identified with asterisk (*) in
front of name (brings them to the top of the list)

November 08November 08AAII Silicon Valley ChapterAAII Silicon Valley Chapter
SISI--Pro User’s GroupPro User’s Group 3636
Predefined Screens in Help SystemPredefined Screens in Help System

November 08November 08AAII Silicon Valley ChapterAAII Silicon Valley Chapter
SISI--Pro User’s GroupPro User’s Group 3737
Select Items From Tree MenuSelect Items From Tree Menu

November 08November 08AAII Silicon Valley ChapterAAII Silicon Valley Chapter
SISI--Pro User’s GroupPro User’s Group 3838
Operator Varies With Field TypeOperator Varies With Field Type

November 08November 08AAII Silicon Valley ChapterAAII Silicon Valley Chapter
SISI--Pro User’s GroupPro User’s Group 3939
Compare to Field, Value, NormCompare to Field, Value, Norm

November 08November 08AAII Silicon Valley ChapterAAII Silicon Valley Chapter
SISI--Pro User’s GroupPro User’s Group 4040
Count On/Off Toggle With ClickCount On/Off Toggle With Click

November 08November 08AAII Silicon Valley ChapterAAII Silicon Valley Chapter
SISI--Pro User’s GroupPro User’s Group 4141
Link Criteria With And/Or ConnLink Criteria With And/Or Conn

November 08November 08AAII Silicon Valley ChapterAAII Silicon Valley Chapter
SISI--Pro User’s GroupPro User’s Group 4242
Factor Is a Multiplier for the “Compare To” Factor Is a Multiplier for the “Compare To” ElementElement

November 08November 08AAII Silicon Valley ChapterAAII Silicon Valley Chapter
SISI--Pro User’s GroupPro User’s Group 4343
Apply Button Runs Screen Against Apply Button Runs Screen Against NotebookNotebook

November 08November 08AAII Silicon Valley ChapterAAII Silicon Valley Chapter
SISI--Pro User’s GroupPro User’s Group 4444
Saving Results as a PortfolioSaving Results as a Portfolio
Stock Notebook TabsStock Notebook Tabs

November 08November 08AAII Silicon Valley ChapterAAII Silicon Valley Chapter
SISI--Pro User’s GroupPro User’s Group 4646
Overview Tab: DescriptionOverview Tab: Description

November 08November 08AAII Silicon Valley ChapterAAII Silicon Valley Chapter
SISI--Pro User’s GroupPro User’s Group 4747
Overview Tab: PricesOverview Tab: PricesMonthly and Annual Price DataMonthly and Annual Price Data

November 08November 08AAII Silicon Valley ChapterAAII Silicon Valley Chapter
SISI--Pro User’s GroupPro User’s Group 4848
Overview Tab: Share StatisticsOverview Tab: Share Statistics

November 08November 08AAII Silicon Valley ChapterAAII Silicon Valley Chapter
SISI--Pro User’s GroupPro User’s Group 4949
Multiples TabMultiples Tab
• Collection of financial multiples– Yearly averages for each of the last 7 years
Historical perspective of the company’s valuation level
Price/earnings ratios based upon estimates for the current year and the next 2 years
• Able to see how company ranks against companies in its Industry and Sector as well as in the overall Universe

November 08November 08AAII Silicon Valley ChapterAAII Silicon Valley Chapter
SISI--Pro User’s GroupPro User’s Group 5050
Multiples TabMultiples Tab
November 08November 08AAII Silicon Valley ChapterAAII Silicon Valley Chapter
SISI--Pro User’s GroupPro User’s Group 5151
Growth Rates TabGrowth Rates Tab
• Growth rates for selected Income Statement and Statement of Cash Flow items
• 1-, 3-, 5-, and 7-year growth rates as well as growth rate 1 year ago
• Able to see whether growth rates are slowing or increasing
• Universe, Sector and Industry comparisons

November 08November 08AAII Silicon Valley ChapterAAII Silicon Valley Chapter
SISI--Pro User’s GroupPro User’s Group 5252
Growth RatesGrowth Rates
November 08November 08AAII Silicon Valley ChapterAAII Silicon Valley Chapter
SISI--Pro User’s GroupPro User’s Group 5353
Ratios TabRatios Tab
• Profitability, Liquidity, Debt Management, and Asset Management ratios
• Current (last 12 months) and each of the last 7 years
• Universe, Sector and Industry comparisons– Many ratios are industry specific

November 08November 08AAII Silicon Valley ChapterAAII Silicon Valley Chapter
SISI--Pro User’s GroupPro User’s Group 5454
Ratios TabRatios Tab
November 08November 08AAII Silicon Valley ChapterAAII Silicon Valley Chapter
SISI--Pro User’s GroupPro User’s Group 5555
Estimates TabEstimates Tab• Estimates are provided by I/B/E/S• Earnings Surprise for past quarter• Quarterly estimates given for the current
and next quarter– Range for current estimate– Recent trend in estimates
• Annual estimates given for each of the next 3 years
• A long-term (5-year) growth rate in estimated earnings is also provided

November 08November 08AAII Silicon Valley ChapterAAII Silicon Valley Chapter
SISI--Pro User’s GroupPro User’s Group 5656
Estimates TabEstimates Tab
Sue Score (Standardized Unanticipated Earnings): Measures the number of standard deviations from the actual announced earnings and how it differs from the estimated earnings

November 08November 08AAII Silicon Valley ChapterAAII Silicon Valley Chapter
SISI--Pro User’s GroupPro User’s Group 5757
Charts Tab: Annual Earnings and PricesCharts Tab: Annual Earnings and Prices

November 08November 08AAII Silicon Valley ChapterAAII Silicon Valley Chapter
SISI--Pro User’s GroupPro User’s Group 5858
Charts Tab: Cash Flow & Free Cash FlowCharts Tab: Cash Flow & Free Cash Flow

November 08November 08AAII Silicon Valley ChapterAAII Silicon Valley Chapter
SISI--Pro User’s GroupPro User’s Group 5959
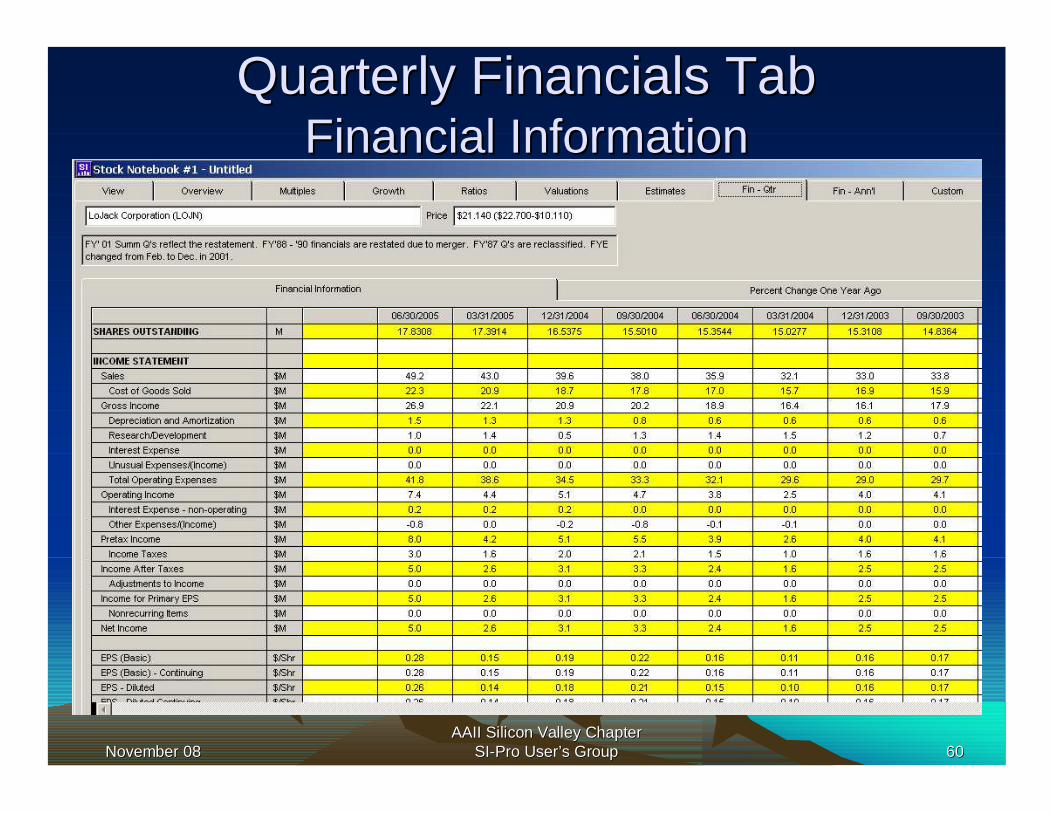
Quarterly FinancialsQuarterly Financials• Selected Income Statement, Balance
Sheet, and Statement of Cash Flow items for each of the last 8 fiscal quarters
• Where “Flash” results are also posted– Quarterly sales and EPS figures that have
been announced but not yet filed
• Sub-tab shows the percent change in the financial data from quarter to quarter
November 08November 08AAII Silicon Valley ChapterAAII Silicon Valley Chapter
SISI--Pro User’s GroupPro User’s Group 6060
Quarterly Financials TabQuarterly Financials TabFinancial InformationFinancial Information

November 08November 08AAII Silicon Valley ChapterAAII Silicon Valley Chapter
SISI--Pro User’s GroupPro User’s Group 6161
Quarterly Financials TabQuarterly Financials TabPercent Change From One Year AgoPercent Change From One Year Ago

November 08November 08AAII Silicon Valley ChapterAAII Silicon Valley Chapter
SISI--Pro User’s GroupPro User’s Group 6262
Annual Financial Statements TabAnnual Financial Statements TabTotalTotal

November 08November 08AAII Silicon Valley ChapterAAII Silicon Valley Chapter
SISI--Pro User’s GroupPro User’s Group 6363
Cash Flow & Balance SheetCash Flow & Balance Sheet

November 08November 08AAII Silicon Valley ChapterAAII Silicon Valley Chapter
SISI--Pro User’s GroupPro User’s Group 6464
Balance SheetBalance Sheet

November 08November 08AAII Silicon Valley ChapterAAII Silicon Valley Chapter
SISI--Pro User’s GroupPro User’s Group 6565
Percent Change Year to YearPercent Change Year to Year

November 08November 08AAII Silicon Valley ChapterAAII Silicon Valley Chapter
SISI--Pro User’s GroupPro User’s Group 6666
Common SizeCommon Size

ValuationValuation

November 08November 08AAII Silicon Valley ChapterAAII Silicon Valley Chapter
SISI--Pro User’s GroupPro User’s Group 6868
Valuations TabValuations Tab• Two common methods for valuations
– Discounted cash flow: • Usually company-by-company • Based on the present value of future stream of earn ings or
dividends. • Not used in screening programs (formulas get too complex)• Best done elsewhere such as in a spreadsheet
– Comparative:• Measures how cheap or expensive a company is to its
peers. Common measures found in screening programs are:
– Price/earnings– Dividends– Cash-flow– Free cash-flow– Sales

November 08November 08AAII Silicon Valley ChapterAAII Silicon Valley Chapter
SISI--Pro User’s GroupPro User’s Group 6969
Using Valuation TabUsing Valuation Tab
• Provides a quick feel as to whether the current price is fair relative to past valuation levels and growth rates
• Using the multiples, assumes trends in behavior will continue into the near future
• Using the 5-year average smoothes and normalizes the data

November 08November 08AAII Silicon Valley ChapterAAII Silicon Valley Chapter
SISI--Pro User’s GroupPro User’s Group 7070
Valuations Tab (continued)Valuations Tab (continued)• 12-month price projections based on Price-
Earnings Ratio, Dividends, Cash Flow and Free Cash Flow, and Sales
• SI-Pro finds the “trend” in the value by taking current value and extending it by its 5-year growth rate
• The trend value is multiplied by the current multiple (to find the valuation) or the 5-year average multiple (to find the average valuation)

November 08November 08AAII Silicon Valley ChapterAAII Silicon Valley Chapter
SISI--Pro User’s GroupPro User’s Group 7171
ValuationsValuations

Using Custom Screening CriteriaUsing Custom Screening Criteria

November 08November 08AAII Silicon Valley ChapterAAII Silicon Valley Chapter
SISI--Pro User’s GroupPro User’s Group 7373
Custom Fields Are Used:Custom Fields Are Used:• To create a new financial ratio, percent
change, etc., by creating an algebraic formula that uses fields that already exist in the program
• In all program elements such as screens, views, other custom fields, etc.
• Limitations– 250 custom fields

November 08November 08AAII Silicon Valley ChapterAAII Silicon Valley Chapter
SISI--Pro User’s GroupPro User’s Group 7474
Sample Formula Sample Formula Sustainable Growth Rate (SGR)Sustainable Growth Rate (SGR)
• The maximum growth rate that a firm can sustain without having to increase financial leverage.
– Calculated as:
• ROE x (1 - dividend-payout ratio)• SGR: A measure of how much a firm can grow without borrowing
more money. After the firm has passed this rate, it must seek funds from another source to facilitate growth.

November 08November 08AAII Silicon Valley ChapterAAII Silicon Valley Chapter
SISI--Pro User’s GroupPro User’s Group 7575
250 Custom Fields250 Custom Fields

November 08November 08AAII Silicon Valley ChapterAAII Silicon Valley Chapter
SISI--Pro User’s GroupPro User’s Group 7676
Sustainable Growth Using Custom Field EditorSustainable Growth Using Custom Field Editor

Prospecting Using Dividend ScreenProspecting Using Dividend Screen

November 08November 08AAII Silicon Valley ChapterAAII Silicon Valley Chapter
SISI--Pro User’s GroupPro User’s Group 7878
What Dividend Yield Can What Dividend Yield Can –– And Can’t And Can’t –– Tell UsTell Us
• Reference: “Dividend yields are equity risk premiums” Michael Rozeff, Journal of Portfolio Management, 1984

November 08November 08AAII Silicon Valley ChapterAAII Silicon Valley Chapter
SISI--Pro User’s GroupPro User’s Group 7979
HighHigh--Yield DividendYield DividendScreening CriteriaScreening Criteria
• Company must provide Dividend Re-Investment Plan (Drip)• Dividends for last 4 quarters (trailing 12 months) > or = dividends for
last fiscal year• Annual dividend must increase over each of the last 5 years• Company pays dividend over at least 6 years• Annualized growth in dividends over the last 5 years > median
annualized dividend for the industry over the last 5 years• Current dividend yield is > average yield last 5 years• Payout ratio for the last 4 quarters (trailing 12 months) is < or = 50%• Annualized earnings growth rate over the last 5 years must be > or =
to median annualized earnings growth rate for industry over the same period
• Limit to 30 companies the highest dividend yields

November 08November 08AAII Silicon Valley ChapterAAII Silicon Valley Chapter
SISI--Pro User’s GroupPro User’s Group 8080
HighHigh--Yield Dividend Screening CriteriaYield Dividend Screening CriteriaShown in Screen Editor Shown in Screen Editor (excluding Drip criteria)(excluding Drip criteria)

Closing Remarks & SummaryClosing Remarks & Summary

November 08November 08AAII Silicon Valley ChapterAAII Silicon Valley Chapter
SISI--Pro User’s GroupPro User’s Group 8282
Summary & Closing CommentsSummary & Closing Comments• Download the trial version and get familiar with the tabs• Weekly updates for SI Pro users• Start by using a pre-set screening strategies
– There is wide range of strategies… chose one or two that are compatible with your investment goals
– Remember: Pre-set screening strategies will often result in high turnover in the lists of stocks, so please do your due diligence
• Do your analysis!– Buying stocks solely on screening strategies is not
recommended
• As you become familiar with SI-Pro, try developing some custom criteria
• Feel free to tinker!!

November 08November 08AAII Silicon Valley ChapterAAII Silicon Valley Chapter
SISI--Pro User’s GroupPro User’s Group 8383
SISI--Pro ResourcesPro Resourceswww.aaii.comwww.aaii.com
• Weekly updates for SI Pro users• Archive of past updates• Access archived issues of Stock Investor News at the
Stock Investor section of the AAII Web site – Tips on how to better use SI Pro– Published quarterly
• Troubleshooting guide• Join the Silicon Valley SI-Pro User’s Group

November 08November 08AAII Silicon Valley ChapterAAII Silicon Valley Chapter
SISI--Pro User’s GroupPro User’s Group 8484
ReferencesReferences
– “Predicting the Market’s Future With O’Shaughnessy”, Cara Scantizzi, Computerized Investing, Sep/Oct 06, pages 23 – 27
– “Predicting Markets of Tomorrow: A Contrarian Investment Strategy for the Next Twenty Years”, James P. O’Shaughnessy, Penguin Group, 2006 or “Predicting the Markets of Tomorrow: The James O’Shaughnessy Approach”, AAII Journal, Aug 06 (see http://www.aaii.com/includes/DisplayArticle.cfm?Article_Id=2930)
– “Martin Zweig’s Winning on Wall Street”, Martin E. Zweig, Warner Books, 1990
– SI Pro Field Definitions List: http://www.aaii.com/stockinvestor/programinfo/proflddefs.pdf
– SI Pro Newsletters: Past Issues http://www.aaii.com/stockinvestor/sinews/pastissues.cfm
– SI Pro Stock Screens Performance Report http://www.aaii.com/stockscreens/performance.cfm

November 08November 08AAII Silicon Valley ChapterAAII Silicon Valley Chapter
SISI--Pro User’s GroupPro User’s Group 8585
References (References (ContinuedContinued))– SI Pro Frequently Asked Questions
http://www.aaii.com/includes/DisplayArticle.cfm?Article_Id=2856– Troubleshooting guide http://www.aaii.com/stockinvestor/troubleshooting/– Getting Started Guide http://www.aaii.com/stockinvestor/gettingstarted/index.cfm– Stock Screens 8-Year Performance (spreadsheet)
http://www.aaii.com/stockscreens/monthly.xls– Stock Screens 8-Year Month-by-Month Performance (spreadsheet)
http://www.aaii.com/stockscreens/monthly_cumulative.xls– RiskGrade Web Site http://www.riskgrades.com/retail/myportfolio/table.cgi– AAII Silicon Valley Web Site http://siliconvalleyaaii.org/– “Your Next Great Stock: How to Screen the Market for Tomorrow’s Top
Performers”, Jack Hough, Wiley Press, 2008– “The 52 Week High and Momentum Investing”, Thomas George & Chuan-Yang,
Journal of Finance, 2004– “Returns to Buying Winners and Selling Losers: Implications for Stock Market
Efficiency “, Narasimhan Jedgadeesh & Sheridan Titman, Journal of Finance, 1993

November 08November 08AAII Silicon Valley ChapterAAII Silicon Valley Chapter
SISI--Pro User’s GroupPro User’s Group 8686
References (References (ContinuedContinued) ) Dividend InvestorsDividend Investors
• Dividends4life: http://www.dividends4life.com/
• The Dividend Guy Blog: http://www.thedividendguyblog.com/• Dividend Investor Blog: http://www.dividendinvestingblog.com/• Dividends Matter: http://www.dividendsmatter.com/
• Dividend Investor: http://www.dividendinvestor.com/• The Div Net: http://www.thediv-net.com/• The Money Gardner: http://www.themoneygardener.com/
• Dividends Anonymous: http://www.dividendsanonymous.com/• Morningstar Dividend Investor:
http://www.morningstar.com/Products/Store_StocksMDI.html?t1=1225413917
• Dividend Growth Investor: http://www.dividendgrowthinvestor.com/• Motley Fool Income Investor: http://www.fool.com/investing/dividends-
income/index.aspx?source=ifltnvsnv0000001
November 08November 08AAII Silicon Valley ChapterAAII Silicon Valley Chapter
SISI--Pro User’s GroupPro User’s Group 8787
SISI--Pro User’s GroupPro User’s Group• Exchange knowledge on how to use SIPro• Meet on regular basis… once a quarter or more frequently if needed• Moderated listserver, where group members exchange ideas and share
files: – Subscribe: [email protected]
• Discuss new and innovative screens• Presentation topics could include:
– Review popular screens and the underlining criteria– How to modify screens to suit ones own needs– How to use the list of stocks for further analysis– Educate group members on how to use pre-defined screens– Invite guest speakers from other regional user groups or the national office to
present how they are utilizing SIPro– Discussion techniques for back testing screens– Provide feedback to SIPro developers for future features
• User’s group is open to AAII members and users of SIPro… however, group members are expected contribute on a regular basis.

November 08November 08AAII Silicon Valley ChapterAAII Silicon Valley Chapter
SISI--Pro User’s GroupPro User’s Group 8888
EndEnd