computers & graphics - mat.ucsb.edu
TRANSCRIPT

Technical Section
Immersive full-surround multi-user system design$
JoAnn Kuchera-Morin a,n, Matthew Wright a, Graham Wakefield a, Charles Roberts a,Dennis Adderton a, Behzad Sajadi b, Tobias Höllerer a, Aditi Majumder b
a AlloSphere Research Group and Media Arts Technology Program, University of California Santa Barbara, United Statesb Department of Computer Science, University of California Irvine, United States
a r t i c l e i n f o
Article history:Received 3 April 2013Received in revised form6 December 2013Accepted 20 December 2013Available online 18 January 2014
Keywords:VR systemsDisplay technologyMulti-userMultimodal interactionImmersion
a b s t r a c t
This paper describes our research in full-surround, multimodal, multi-user, immersive instrument designin a large VR instrument. The three-story instrument, designed for large-scale, multimodal representa-tion of complex and potentially high-dimensional information, specifically focuses on multi-userparticipation by facilitating interdisciplinary teams of co-located researchers in exploring complexinformation through interactive visual and aural displays in a full-surround, immersive environment.We recently achieved several milestones in the instrument0s design that improves multi-user participa-tion when exploring complex data representations and scientific simulations. These milestones includeaffordances for “ensemble-style” interaction allowing groups of participants to see, hear, and exploredata as a team using our multi-user tracking and interaction systems; separate visual display modes forrectangular legacy content and for seamless surround-view stereoscopic projection using 4 high-resolution, high-lumen projectors with hardware warping and blending integrated with 22 small-footprint projectors placed above and below the instrument0s walkway; and a 3D spatial audio systemenabling a variety of sound spatialization techniques. These facilities can be accessed and controlled by amultimodal framework for authoring applications integrating visual, audio, and interactive elements. Wereport on the achieved instrument design.
Published by Elsevier Ltd.
1. Introduction
This paper presents design decisions and results from 5 years ofongoing research involving the AlloSphere [1,2], a three-story,immersive instrument designed to support collaborative scientific/artistic data exploration and empower human perception andaction. To support group experiences of research, working, andlearning, we believe that computer systems need to accommodatephysically co-located users in immersive multimodal1 environ-ments. We focus on research driving the full-surround, immersive,and multimodal aspects of the facility, allowing content to drive itstechnological development. Research in the facility is thus two-fold: (1) multimedia systems design to develop a large, interactive,multimodal instrument, and (2) data generation, representation,and transformation – using a diverse set of applications to drivethe development of the instrument0s capabilities for real-timeinteractive exploration. Our research maxim is that content drives
technology, with no feature being added to our production systemwithout first being explored in a prototype application. Our facilityis designed to operate in two modes: desktop mode provides theopportunity to bring legacy content quickly into the system forrapid turnaround, while surround mode facilitates full-surroundimmersion (as shown in Fig. 1).
We believe that interdisciplinary teams encompassing the phy-sical sciences, life sciences, social sciences as well as the arts willproduce audiovisual data representations that will lead to increasedunderstanding of large and complex biological systems, socialnetworks, and other heterogeneous, high-dimensional information.The design process for our instrument and its computationalinfrastructure has thus been driven by the goal of providingmulti-user capabilities supporting interdisciplinary research teams.
We designed, built, and equipped our facility using in-houseplanning and expertise, rather than relying on a commercial orintegrator-driven solution. The physical infrastructure includes alarge perforated-aluminum capsule-shaped screen (two 16-foot-radius tilt-dome hemispheres connected by a 7-foot wide cylind-rical section) in a three story near-to-anechoic room. A 7-foot-wide bridge through the center of the facility provides space for upto 30 users simultaneously. The hemispheres0 locations on thesides instead of overhead and underneath support the concept oflooking to the horizon at the equator of the instrument0s
Contents lists available at ScienceDirect
journal homepage: www.elsevier.com/locate/cag
Computers & Graphics
0097-8493/$ - see front matter Published by Elsevier Ltd.http://dx.doi.org/10.1016/j.cag.2013.12.004
☆This article was recommended for publication by Dirk Reiners.n Corresponding author. Tel.: þ1 805 893 3010, Mobile: þ1 805 729 2272,
fax: þ1 805 893 2930.E-mail address: [email protected] (J. Kuchera-Morin).1 Here by “multimodal” we are specifically referring to vision, hearing,
and physical interaction.
Computers & Graphics 40 (2014) 10–21

infrastructure, while the joining cylindrical section avoids the in-phase acoustic echoes that would be present inside a perfectlyspherical structure. The perforated screen allows for the 3D spatialaudio system as well as the multi-user tracking system to beplaced outside the sphere.
Over the past few years, we have focused on true multimod-ality, attempting an equal balance among visual, audio andinteractive representation, transformation and generation acrossa diverse set of content areas. We have also concentrated on full-surround stereoscopic visual design as well as 3D spatial audio toincrease immersion in the instrument. Visual calibration has beena key component of this work and we have achieved a seamlessview across the multiple projectors lighting the sphere surface.Multi-user interaction using a variety of devices has been anotheractive area of research and is detailed in this document. Webelieve that all these affordances facilitate immersive, multi-userparticipation.
The design of the facility is complemented by the developmentof a computational framework providing an integrated mediainfrastructure for working with visual, audio, and interactive data.It features a unified programming environment with componentsfor creating interactive, 3D, immersive, multimedia applicationsthat can be scaled from the 3-story instrument to laptops ormobile devices. We found that off-the-shelf VR software and gameengines lack the flexibility to represent many forms of complexinformation (particularly in terms of audio [3]). Media languagessuch as Max [4] and Processing [5] work well for prototyping, butdo not easily scale to large VR simulations. In addition, an in-house, open-source approach was chosen to foster a developmentcommunity around the facility and to prevent roadblocks indevelopment.
A variety of scientific projects and artistic explorations havedriven the design and implementation of the instrument anddevelopment framework. We present several of these projects thatdemonstrate multi-user, multimodal interaction and illustrate ourefforts in interactive, immersive data modeling and analysis.
1.1. Related work
The history of unencumbered immersive visualization systemscan be traced back to CAVE-like infrastructures designed for immer-sive VR research [6]. These systems were designed to model virtualreality to real-world problems that allowed a user to move freely inthe environment without the need for head-mounted displays andother devices that encumber the user0s sense of self [7].
CAVEs had their roots in scientific visualization rather than flightsimulation or video games and were closely connected to highperformance computing applications [8]. Some of these environ-ments were developed from CAVEs to six-sided cubes as in theStarCAVE [9] and Iowa State0s Virtual Reality Application Center. Theyalso developed into multiple-room venues that include immersivetheater-like infrastructures, video conferencing rooms, and smallimmersive working group rooms similar to a small CAVE. Facilities
such as these include the Louisiana Immersive Technologies Enterprise(LITE)2 and Rensselaer Polytechnic0s Experimental Media and Perform-ing Arts Center (EMPAC).3
As the first VR environments were being designed for a numberof varying applications that gravitated toward a single trackeduser, smaller more low-cost immersive systems were developed[10–12]. There now exist a plethora of systems from the desktop toplasma screens [13] and large high-resolution displays [14] thatallow for immersive visualization in a number of fields. There arealso a number of VR laboratories dedicated to specific applications,such as USC0s Institute for Creative Technologies, designed formultidisciplinary research focused on exploring and expandinghow people engage with computers through virtual characters,video games, simulated scenarios and other forms of human–computer interaction [15] or UC Davis0s KeckCAVES (W. M. KeckCenter for Active Visualization in the Earth Sciences) [16].
A key difference of the instrument described in this submissionto CAVEs and related VR facilities lies in the instrument0s ability toprovide immersive and interactive surround-view presentations toa group of people4 who can collaborate with different roles in datanavigation and analysis. The screen geometry avoids visual arti-facts from sharp discontinuity at corners, enabling seamlessimmersion even with non-stereoscopic projection, as shown inFig. 2. Stereo content can be presented to a large set of users whoparticipate in presentations from a bridge through the center ofthe facility. Users are generally positioned around 5 m distancefrom the screen, resulting in an audio and stereovision “sweetspot” area that is much larger than in conventional environments.
While we believe that there are many benefits to our instru-ment design we also acknowledge its limitations. For example, thebridge provides limited room for multiple users to move from onelocation to another, and so navigation of virtual spaces tends toconsist of one user “driving” or “flying” the shared viewpoint witha handheld device, as opposed to, e.g., a (single-user) system basedon head-tracking, which could allow navigation in a virtual spacevia walking, head movements, etc., and would also allow a user towalk all the way around a virtual object to observe it from all sides.Similarly, since every user sees the same left- and right-eye videoregardless of location along the bridge, virtual objects closer thanthe screen appear to track or follow a user as he or she walks alongthe bridge. This means that correspondence between virtual 3Dlocation (e.g., in an OpenGL scene) and real physical space dependson the viewing position, complicating gestural interaction withvirtual objects. Another limitation is that there is almost noambient light beyond projected content, so cameras used forvision recognition and tracking will be limited to the infraredspectrum. While we do have head tracking capabilities in theinstrument, large groups of users are mainly facilitated in non-
Fig. 1. Fisheye photographs of multiple users interacting with full-surround audiovisual content in real time. AlloBrain (left), ray-traced cuboids (center), and world map(right).
2 http://www.lite3d.com3 http://empac.rpi.edu4 Groups of up to 30 people can be accommodated. Groups of up to 5 active
users are common.
J. Kuchera-Morin et al. / Computers & Graphics 40 (2014) 10–21 11

tracked scenarios. All in all, these design decisions were madespecifically to favor the design of multi-user, participatory, immer-sive, data exploration environments.
Our facility is positioned between VR environments that givefully immersive experiences to a small number of users at a timeand full-dome planetarium style theaters, which have extremelyhigh outreach potential but limited capabilities for individualinteraction and collaboration [17]. There have been experimentswith stereoscopy and interaction at several planetaria, and in somecases the use of stereoscopic presentation in production mode[18,19], but we believe that we are pursuing a unique combinationof interactive group collaboration, stereographics, and multimodalimmersion.
2. System overview
The AlloSphere has been designed and always used as aninstrument. It is connected to a computing cluster, facilitating thetransformation of computation to real-time interactive instrumen-tation. It was designed to minimize artifacts when representinginformation visually, sonically, and interactively in real-time. Thecapsule-shaped full-surround aluminum screen is perforated tomake it acoustically transparent, allowing loudspeakers to beplaced anywhere outside the screen. The instrument is acousticallyand visually isolated from the rest of the building, and issuspended within a near-to-anechoic chamber to eliminate stand-ing waves in the audio domain [20].
Multimodality is a key component for knowledge discovery inlarge datasets [21]. In particular, almost all of our content comple-ments visualization with sonification, attempting to take advan-tage of the unique affordances of each sensory modality. Forexample, while human spatial perception is much more accuratein the visual domain, frequency and other temporal perceptionbenefit from higher resolution in the audio domain, so wheneverdepicting complex information that takes the form of frequencyrelationships or temporal fine structure, we always considermapping those frequencies and structures into the perceptualregimes of pitch and/or rhythm. Sound also greatly supportsimmersion; in designing full-surround displays an importantconsideration is that we hear sounds from every direction butcan see only a limited frontal field of view.
Since it is intended as an interactive, immersive, scientific display,our design attempts to smoothly integrate instrumentation, computa-tion and multimodal representation, forming a seamless connection
of the analog to the digital that can encompass heterogeneous formsof information, including measurements from instrumental devices aswell as simulations of mathematical models and algorithms.
2.1. Research and production systems, surround and desktop views
Since our primary research goals include both media systemsdesign and interactive immersive, multimodal, data explorationacross content areas, we have to maintain two or more separatesystems in many areas of the instrument0s infrastructure. Theprimary distinction is between research, the bleeding edge systemsincorporating our best practices and latest technology, versusproduction, systems employing more popular, mainstream, and/or easy-to-use technologies. While research is what advances thestate of the art in media systems design, we believe that produc-tion is also vital to ensure that people can easily use the instru-ment and bring diverse content into it, as well as to provide aplatform for content research that may be more familiar to domainresearchers.
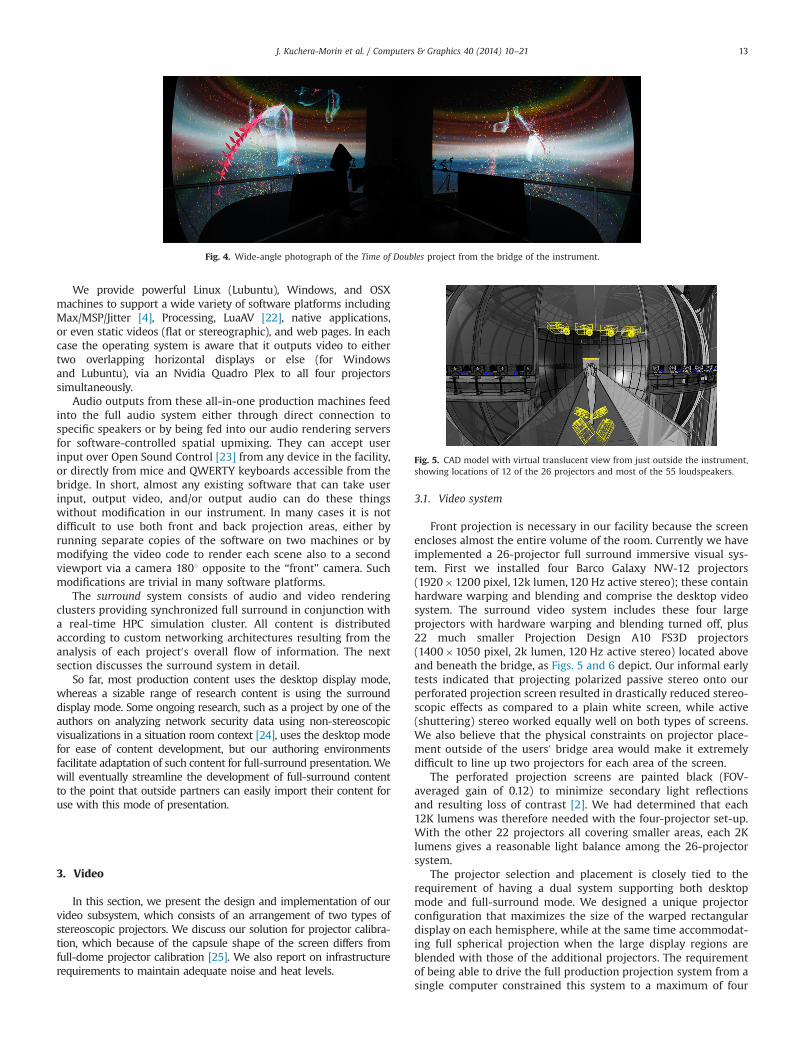
With this distinction in mind, and to provide flexibility forvarious uses of the instrument, we have engineered two separatevideo display systems. Our current desktop video system providestwo large quasi-rectangular lit areas somewhat like movie screenson either side of the bridge, as Figs. 3 and 4 show in context. Eachis lit by a pair of overlapping (by 265 pixels) projectors withhardware geometry correction and edge blending, resulting in afield of view of approximately 1271 (horizontal) by 441 (vertical).The aspect ratio of 127C44� 2:89 compares favorably to theaspect ratio of the pixels: ð2� 1920�265ÞC1200� 2:98, indicat-ing that the hardware-warped content does not significantlydistort the aspect ratio.
To balance the goals of immersion, lack of apparent geometricdistortion (i.e., “looking rectangular”), and privileging many viewpositions along the bridge to support multiple users, this hardwarewarping is “to the hemisphere,” meaning that parallel columns ofrendered pixels fall along longitude lines of the screen and parallelrows along latitude lines.
Vitally, the “desktop” display mode provides the abstraction ofa standard desktop-like rectangular flat screen driven by a singlecomputer, allowing scientists and artists to start working in theinstrument with their own content as seen on standard displaytypes. One might wonder why we do not implement the desktopdisplay mode by first calibrating the surround display and thenrendering just the pixels of the desired quasi-rectangular areas;the reason is that such a solution would require an intermediatestage of video capture and distribution to multiple, coordinatedrendering machines to perform warping, which would introduceadditional complexity and latency.
Fig. 2. Fisheye photograph of a group of researchers immersed in full surroundnon-stereoscopic data.
Fig. 3. A view of the AlloSphere instrument from above (looking through theperforated screen), with one desktop window behind.
J. Kuchera-Morin et al. / Computers & Graphics 40 (2014) 10–2112
We provide powerful Linux (Lubuntu), Windows, and OSXmachines to support a wide variety of software platforms includingMax/MSP/Jitter [4], Processing, LuaAV [22], native applications,or even static videos (flat or stereographic), and web pages. In eachcase the operating system is aware that it outputs video to eithertwo overlapping horizontal displays or else (for Windowsand Lubuntu), via an Nvidia Quadro Plex to all four projectorssimultaneously.
Audio outputs from these all-in-one production machines feedinto the full audio system either through direct connection tospecific speakers or by being fed into our audio rendering serversfor software-controlled spatial upmixing. They can accept userinput over Open Sound Control [23] from any device in the facility,or directly from mice and QWERTY keyboards accessible from thebridge. In short, almost any existing software that can take userinput, output video, and/or output audio can do these thingswithout modification in our instrument. In many cases it is notdifficult to use both front and back projection areas, either byrunning separate copies of the software on two machines or bymodifying the video code to render each scene also to a secondviewport via a camera 1801 opposite to the “front” camera. Suchmodifications are trivial in many software platforms.
The surround system consists of audio and video renderingclusters providing synchronized full surround in conjunction witha real-time HPC simulation cluster. All content is distributedaccording to custom networking architectures resulting from theanalysis of each project0s overall flow of information. The nextsection discusses the surround system in detail.
So far, most production content uses the desktop display mode,whereas a sizable range of research content is using the surrounddisplay mode. Some ongoing research, such as a project by one of theauthors on analyzing network security data using non-stereoscopicvisualizations in a situation room context [24], uses the desktop modefor ease of content development, but our authoring environmentsfacilitate adaptation of such content for full-surround presentation. Wewill eventually streamline the development of full-surround contentto the point that outside partners can easily import their content foruse with this mode of presentation.
3. Video
In this section, we present the design and implementation of ourvideo subsystem, which consists of an arrangement of two types ofstereoscopic projectors. We discuss our solution for projector calibra-tion, which because of the capsule shape of the screen differs fromfull-dome projector calibration [25]. We also report on infrastructurerequirements to maintain adequate noise and heat levels.
3.1. Video system
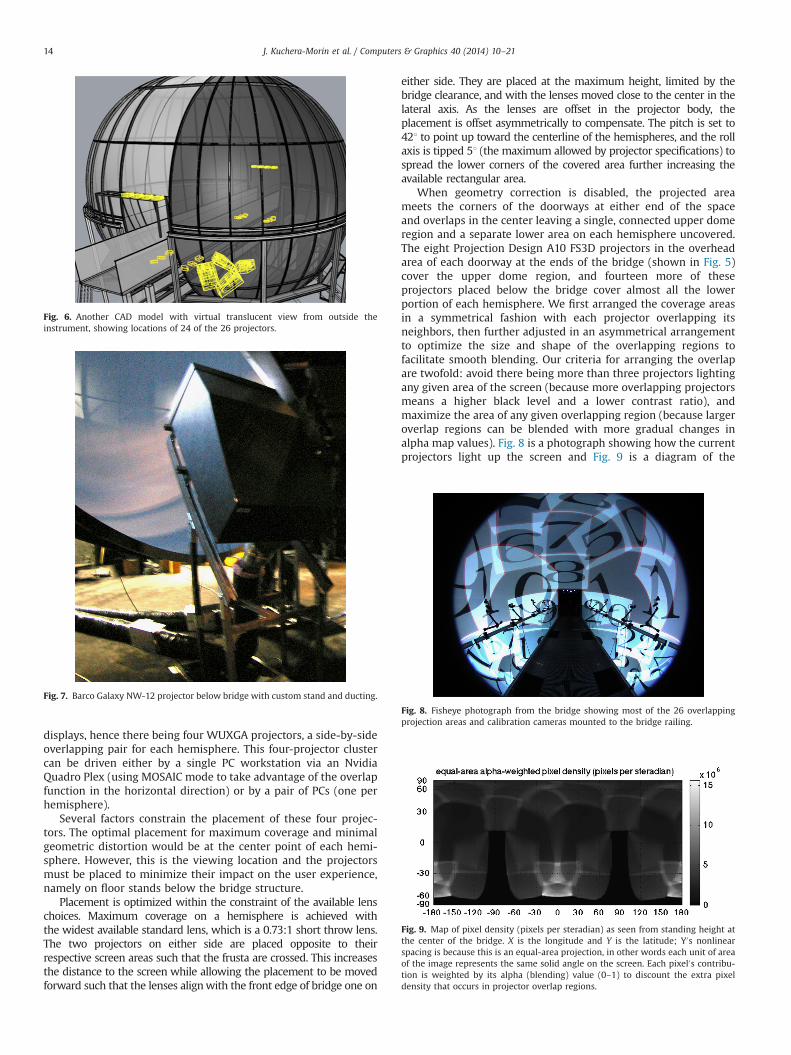
Front projection is necessary in our facility because the screenencloses almost the entire volume of the room. Currently we haveimplemented a 26-projector full surround immersive visual sys-tem. First we installed four Barco Galaxy NW-12 projectors(1920�1200 pixel, 12k lumen, 120 Hz active stereo); these containhardware warping and blending and comprise the desktop videosystem. The surround video system includes these four largeprojectors with hardware warping and blending turned off, plus22 much smaller Projection Design A10 FS3D projectors(1400�1050 pixel, 2k lumen, 120 Hz active stereo) located aboveand beneath the bridge, as Figs. 5 and 6 depict. Our informal earlytests indicated that projecting polarized passive stereo onto ourperforated projection screen resulted in drastically reduced stereo-scopic effects as compared to a plain white screen, while active(shuttering) stereo worked equally well on both types of screens.We also believe that the physical constraints on projector place-ment outside of the users0 bridge area would make it extremelydifficult to line up two projectors for each area of the screen.
The perforated projection screens are painted black (FOV-averaged gain of 0.12) to minimize secondary light reflectionsand resulting loss of contrast [2]. We had determined that each12K lumens was therefore needed with the four-projector set-up.With the other 22 projectors all covering smaller areas, each 2Klumens gives a reasonable light balance among the 26-projectorsystem.
The projector selection and placement is closely tied to therequirement of having a dual system supporting both desktopmode and full-surround mode. We designed a unique projectorconfiguration that maximizes the size of the warped rectangulardisplay on each hemisphere, while at the same time accommodat-ing full spherical projection when the large display regions areblended with those of the additional projectors. The requirementof being able to drive the full production projection system from asingle computer constrained this system to a maximum of four
Fig. 4. Wide-angle photograph of the Time of Doubles project from the bridge of the instrument.
Fig. 5. CAD model with virtual translucent view from just outside the instrument,showing locations of 12 of the 26 projectors and most of the 55 loudspeakers.
J. Kuchera-Morin et al. / Computers & Graphics 40 (2014) 10–21 13
displays, hence there being four WUXGA projectors, a side-by-sideoverlapping pair for each hemisphere. This four-projector clustercan be driven either by a single PC workstation via an NvidiaQuadro Plex (using MOSAIC mode to take advantage of the overlapfunction in the horizontal direction) or by a pair of PCs (one perhemisphere).
Several factors constrain the placement of these four projec-tors. The optimal placement for maximum coverage and minimalgeometric distortion would be at the center point of each hemi-sphere. However, this is the viewing location and the projectorsmust be placed to minimize their impact on the user experience,namely on floor stands below the bridge structure.
Placement is optimized within the constraint of the available lenschoices. Maximum coverage on a hemisphere is achieved withthe widest available standard lens, which is a 0.73:1 short throw lens.The two projectors on either side are placed opposite to theirrespective screen areas such that the frusta are crossed. This increasesthe distance to the screen while allowing the placement to be movedforward such that the lenses alignwith the front edge of bridge one on
either side. They are placed at the maximum height, limited by thebridge clearance, and with the lenses moved close to the center in thelateral axis. As the lenses are offset in the projector body, theplacement is offset asymmetrically to compensate. The pitch is set to421 to point up toward the centerline of the hemispheres, and the rollaxis is tipped 51 (the maximum allowed by projector specifications) tospread the lower corners of the covered area further increasing theavailable rectangular area.
When geometry correction is disabled, the projected areameets the corners of the doorways at either end of the spaceand overlaps in the center leaving a single, connected upper domeregion and a separate lower area on each hemisphere uncovered.The eight Projection Design A10 FS3D projectors in the overheadarea of each doorway at the ends of the bridge (shown in Fig. 5)cover the upper dome region, and fourteen more of theseprojectors placed below the bridge cover almost all the lowerportion of each hemisphere. We first arranged the coverage areasin a symmetrical fashion with each projector overlapping itsneighbors, then further adjusted in an asymmetrical arrangementto optimize the size and shape of the overlapping regions tofacilitate smooth blending. Our criteria for arranging the overlapare twofold: avoid there being more than three projectors lightingany given area of the screen (because more overlapping projectorsmeans a higher black level and a lower contrast ratio), andmaximize the area of any given overlapping region (because largeroverlap regions can be blended with more gradual changes inalpha map values). Fig. 8 is a photograph showing how the currentprojectors light up the screen and Fig. 9 is a diagram of the
Fig. 6. Another CAD model with virtual translucent view from outside theinstrument, showing locations of 24 of the 26 projectors.
Fig. 7. Barco Galaxy NW-12 projector below bridge with custom stand and ducting.
Fig. 8. Fisheye photograph from the bridge showing most of the 26 overlappingprojection areas and calibration cameras mounted to the bridge railing.
Fig. 9. Map of pixel density (pixels per steradian) as seen from standing height atthe center of the bridge. X is the longitude and Y is the latitude; Y0s nonlinearspacing is because this is an equal-area projection, in other words each unit of areaof the image represents the same solid angle on the screen. Each pixel0s contribu-tion is weighted by its alpha (blending) value (0–1) to discount the extra pixeldensity that occurs in projector overlap regions.
J. Kuchera-Morin et al. / Computers & Graphics 40 (2014) 10–2114

resulting pixel density across the entire screen. Projector place-ment beneath the bridge and over the bridge doorways providescomplete visual coverage in some of the most difficult areas of thescreen.
The 26 projectors receive video signals from 13 HewlettPackard z820 workstations each containing two Nvidia K5000stereo graphics cards; together these form our first prototype full-surround visual system. For the desktop visual system (describedin Section 2.1), a separate HP z820 machine drives all four Barcoprojectors via an Nvidia Quadro Plex containing Nvidia K5000graphics cards. Barco Galaxy NW-12 projectors each have two DVIinputs and can switch between them (as well as turn on and offhardware warping and blending) via commands sent via ethernet.Thus the surround and desktop display modes use differentcomputers but some of the same projectors, and we can easilyswitch between them under software control.
3.1.1. Video timing synchronizationThe integration of these 26 projectors forced us to synchronize
two different projector technologies that to our knowledge havenot been integrated before. The Barco projectors have a single120 Hz interleaved left and right eye input where the ProjectionDesign (PD) projectors have a dual channel 59.98 Hz left and righteye input. To synchronize these two subsystems, a QuantumComposers model 9612 pulse generator acts as a dual-channelhouse sync source. The PD projectors operate only within a narrowfrequency range around 59.98 Hz. The Barcos are more tolerant ofvarying input rates and can receive 119.96 Hz (2�59.98) with theappropriate ModeLine in the xorg.conf file. The pulse generatorhas two outputs, T1 and T2, which we dedicate respectively to the199.96 Hz and 59.98 Hz projection subsystems. Though theseshare the same period ð1=119:96 HzÞ, each has its own pulsewidth. T10s width gives it a 50% duty cycle at 1/119.96 Hz:W ¼ 1=2nð1=119:96 HzÞ � 4:1681 ms. T20s width is set to 0.4 μslonger than the entire period, so that it just misses every otherrising edge and therefore runs at half the frequency (59.98 Hz).Table 1 shows all these settings, which are saved to memory toload each time the unit is powered on, making the system morerobust to power failure.
According to the Nvidia Gen-Lock mode of operation, a displaysynchronized to the TTL house-sync input is a “server” display,whereas the multiple displays synchronized over the Frame-Locknetwork are “client” displays. In order to combine the Gen-Lockand Frame-Lock networks, the server display must reside on acomputer for which it is the only display for that machine.Therefore we dedicate two additional (low-end) computers toprovide synchronization for our system, each acting as a “server”display, one at 59.98 Hz and the other at 119.96 Hz. Each of thesemachines accepts the appropriate house-sync signal from thepulse generator at the TTL input of an Nvidia G-sync card andprovides the Frame-Lock signal to be sent to the video renderingworkstations at the RJ45 output of the same board. Thus, we cansynchronize a Frame-Lock network to the house-sync by isolatingthe “server” display to a screen that is not seen in the sphere.Furthermore, the entire system is robust to power cycles by being
configured to initiate synchronization on startup. The overallresult is that all projectors and shutter glasses switch betweenleft-eye and right-eye at the same time, so that stereographicswork seamlessly throughout the instrument.
3.1.2. Pixel densityWe have analyzed the estimated 3D positions of all projected
pixels output by the calibration method described in Section 3.2.Fig. 9 is an equal-area projection of a map of pixel density (i.e.,pixels per steradian) in each direction as seen from a standingposition in the center of the bridge. Values range from zero in theuncovered sections to a maximum of about 15 M pixels persteradian. (Naturally the areas with lower pixel density havecorrespondingly larger pixel sizes.) We see that almost the entirescreen (minus the two doorways) is lit down to over 601 below thehorizon. Of course the pixel density varies greatly in overlapregions compared to regions covered by a single projector; wetried to discount this by weighting each pixel linearly by its alphavalue, but the overlap regions are still clearly visible. We also see asmooth gradient of pixel density along the images projected by theBarcos, since the throw distance varies greatly between the topand bottom rows of pixels.
We also see that each Barco projector lights an area muchgreater than any Projection Design projector, so that even with theBarcos0 greater resolution (2.3 M vs. 1.47 M pixels each), the pixeldensity is significantly greater in the overhead dome and especiallybelow the areas the Barcos cover. This is a result of the need for thedesktop display mode to use few enough pixels to make realtimerendering practical from a single machine for production content.While this design facilitates use of the instrument, it poses limita-tions to the visual resolution of the display at the most importantarea (i.e., where people naturally and comfortably rest their gaze).
Fig. 10 is a histogram showing the distribution of the areacovered by each pixel in the instrument, and Table 2 gives theminimum, mean, and maximum of the pixel areas for each of the26 projectors and for the instrument as a whole. Our estimate ofpixel area again starts with the 3D coordinates of the estimated“center” of each pixel as output by the calibration methoddescribed in Section 3.2. We neglect the local screen curvature inthe region of each pixel (approximating it as planar) and modeleach pixel as a parallelogram. The (approximately) vertical vectorthat is equivalent to two of the sides of the parallelogram is half ofthe vector difference between the pixels immediately above andbelow, and likewise in the other direction. The cross productbetween these two vectors gives the area. Given the estimatedposition p̂r;c of the pixel at row r and column c of a given projector,
Table 1Pulse generator settings for our custom synchronizationsystem.
Parameter Value
T1 width 0.00416805 sT1 amp. 3.80 VT2 width 0.00833650 sT2 amp. 3.80 VPeriod 1=119:96 Hz� 0:00833610 s
Fig. 10. Histogram of estimated size (area in square centimeters) of all pixels.
J. Kuchera-Morin et al. / Computers & Graphics 40 (2014) 10–21 15

the estimated area is given by
verticalr;c ¼ 0:5ðp̂r�1;c� p̂rþ1;cÞ ð1Þ
horizontalr;c ¼ 0:5ðp̂r;c�1� p̂r;cþ1Þ ð2Þ
arear;c ¼ Jverticalr;c � horizontalr;c J ð3ÞThis estimate ignores a one-pixel-wide border around eachprojector.
Currently the 26 projectors give an uneven distribution ofapproximately 41.5 million pixels. We believe that achieving eye-limited resolution in the instrument requires a minimum ofapproximately 50 million pixels evenly distributed on the spheresurface, which will probably require completely separating thedesktop and surround display systems by adding additionalprojectors to the surround display system to light the areascurrently covered only by the Barcos.
3.2. Video calibration and multi-user surround stereographics
We deployed software for calibrating and registering multipleoverlapping projectors on nonplanar surfaces [26]. This softwareuses multiple uncalibrated cameras to produce a very accurateestimate of the 3D location of each projector pixel on the screensurface as well as alpha maps for smooth color blending inprojector overlap regions. We use 12 cameras (shown in Fig. 8)with fisheye lenses to calibrate our 26-projector display into aseamless spherical surround view. First we calibrate our fisheyecameras to be able to undistort the images they produce. Thenstandard structure-from-motion techniques [27] are used torecover the relative position and orientation of all the adjacentcamera pairs with respect to each other, up to an unknown scalefactor. Next, stereo reconstruction recovers the 3D locations of theprojector pixels in the overlap region of the cameras. Followingthis, through a non-linear optimization, the unknown scale factorsand the absolute pose and orientation of all the cameras are
recovered with respect to one of the cameras that is assumed to bethe reference camera. This allows us to recover the 3D location ofall the projector pixels in this global coordinate system usingstereo reconstruction. Finally, in order to find a camera-independent coordinate system, we use the prior knowledge thatthere are two gaps in the screen at the beginning and end of thebridge corridor (see Fig. 5). Using this information, we recover the3D location of the corridor and align the coordinate system with itsuch that the corridor is along the Z-axis and the Y-direction isupwards.
The recovered 3D locations of the pixels are then used to warpthe images such that overlapping pixels from the different projectorsshow the same content. However, the method of warping provided(based on a projection matrix and UV map per projector) does notscale well to surround stereoscopic projection. Hence, we developedalternative systems based on the same projector calibration data.The solution principally in use renders the scene to an off-screentexture and then applies a pre-distortion map from this texture toscreen pixels in a final render pass. We are also currently refining asecond solution performs the pre-distortion warp on a per-vertexbasis “while” rendering to the screen in a single pass. As noted in[28], warping by vertex displacement is in many cases more efficientthan texture-based warping, avoiding the necessity of multiplerendering passes and very large textures (to avoid aliasing). Theprincipal drawback of vertex-based pre-distortion is incorrect inter-polation between vertices (linear rather than warped). This errorwas apparent only for extremely large triangles, and was otherwisefound to be acceptable (because incorrect curvature draws lessattention than a broken line). Using higher-polygon-count objectsor distance-based tessellation reduces the error. Looking toward afuture of higher-performance rendering, we have also implementeda third solution of physically based rendering using the results of theprojector calibration in which the entire scene is rendered with ray-casting and ray-tracing techniques, incorporating the OmniStereoadjustments for full-dome immersion at interactive rates (see Fig. 1).
Where the classic, single-user CAVE performs stereoscopicparallax distortion according to the orientation of the single user(e.g., by head tracking), in our multi-user instrument no directioncan be privileged. Instead, we employ a 3601 panoramic approachto stereoscopics along the horizontal plane. This results in an idealstereo parallax in the direction of vision but is compromised in theperiphery, in a similar fashion to OmniStereo [29]. The stereoeffect is attenuated with elevation, since at the apex of the sphereno horizontal direction has privilege and it is impossible todistinguish “right” from “left.” We found panoramic cylindricalstereography through the OmniStereo [29] slice technique topresent an acceptable stereo image, but to be prohibitivelyexpensive due to repeated rendering passes per slice. Reducingthe number of slices introduced visible, sharp discontinuities intriangles crossing the slice boundaries. Panoramic cylindricalstereography through per-vertex displacement on the GPU provedto be an efficient and discontinuity-free alternative (with the samebenefits and caveats as for vertex-based pre-distortion outlinedabove).
3.3. Projector mounting, sound isolation, and cooling
We custom fabricated floor stands for the Barco projectors withchannel-strut steel and standardized hardware (shown in Fig. 7).The projectors are massive (70 kg / 154.2 pounds each) and needto be placed at an overhead height, so we designed rigid four-legged stands with a large footprint for high stability. Cantileveredbeams made from double-strut I-beams atop the legged frameallow the projector placement to extend over the lower portion ofthe screen. The beams are hinged to the leg structure for proper
Table 2Pixel area statistics per projector. Left column is projector number (same number-ing scheme as Fig. 8); numbers 9–12 are Barcos. Units for other columns are squarecentimeters.
Projector Min Mean Max
1 0.0842 0.1068 0.11522 0.0751 0.1172 0.12993 0.0745 0.0946 0.10204 0.0749 0.0913 0.09715 0.0842 0.1154 0.12896 0.0895 0.1193 0.13217 0.0858 0.1081 0.11618 0.0832 0.1000 0.10589 0.0711 0.2136 0.3203
10 0.0496 0.2249 0.345811 0.0764 0.2084 0.324212 0.0267 0.2111 0.324313 0.0651 0.1157 0.226014 0.0494 0.0863 0.142415 0.0316 0.0618 0.088316 0.0198 0.0423 0.074417 0.0266 0.0600 0.087818 0.0471 0.0891 0.134219 0.0782 0.1214 0.154720 0.0678 0.1147 0.303721 0.0433 0.0803 0.155122 0.0290 0.0609 0.086923 0.0170 0.0373 0.067524 0.0255 0.0593 0.087325 0.0242 0.0848 0.440726 0.0553 0.1150 0.3264All 0.0170 0.1177 0.4407
J. Kuchera-Morin et al. / Computers & Graphics 40 (2014) 10–2116

incline of 421, and swivel brackets join the projector mountingplates to the cantilever beams to allow for the roll angle of 51.
In order to preserve the audio quality within the instrument,we must isolate the noise of equipment located within the near-to-anechoic chamber. Since front projection is our only option, theprojectors reside inside the chamber (and indeed inside thesphere). The large Barco projectors located beneath the bridge(as shown in Figs. 5 and 7) generate by far the most noise.
The sound isolation enclosures provided by the projectioncompany needed to be re-engineered due to our stringent speci-fications of noise floor within the chamber. A rear compartment ofthe enclosures was engineered to act as an exhaust manifold withacoustic suppression. The compartment was lined with AMI “QuietBarrier Specialty Composite,” a material which achieves a highlevel of noise abatement with a sandwich structure of a highdensity loaded vinyl barrier between two lower density layers ofacoustical foam. An aluminized mylar surface skin providesthermal protection for use at elevated temperatures. The heatedexhaust from the Barco Galaxy 12 projectors collects in thismanifold compartment.
We removed the very loud factory-supplied fans and insteadadded an exhaust duct at the output where we attached 6-in.diameter insulated ducting. Low noise in-line duct fans (PanasonicWhisperline FV-20NLF1 rated at 240 cfm with a noise specificationof 1.4 sones) draw the hot exhaust air from the enclosure outthrough the original fan ports to the room0s HVAC intake vents.Fig. 7 shows one projector in its modified enclosure with ductingand an in-line fan.
Table 3 shows a series of audio noise measurements withvarious equipment on or off and also comparing the noise from theoriginal Barco projector enclosures to our redesigned enclosures.Our custom design reduced the projector noise by 13.3 dB, and webelieve that we can reduce it even further by isolating the noise ofthe cooling fans.
4. Audio
We have designed a series of loudspeaker layouts to supportmultiple sound spatialization techniques including WavefieldSynthesis (WFS), Ambisonics, Vector Based Array Panning (VBAP)and Distance Based Array Panning (DBAP) [30,31].
Currently we are using the third prototype audio systemcontaining three rings of Meyer MM4XP loudspeakers (12 eachin the top and bottom plus 30 in the middle for 54 total) plus onelarge Meyer X800 subwoofer, driven by five AudioFire 12 firewire400 audio interfaces from Echo Audio connected to a MacPro.Our fourth prototype will add almost 100 more MM4XP loudspea-kers to the existing 3-ring design, planned at 100 speakerson the horizontal to support WFS plus 20 each in the top andbottom rings, and has been mapped out in CAD to help plan theinstallation.
To keep down the audio noise floor, the speakers0 powersupplies (Meyer MPS-488), along with the audio interfaces andthe audio rendering computers, are located in an acousticallyisolated equipment room on the ground floor of the facility,outside of the near-to-anechoic chamber. Since each loudspeakercarries an independent audio signal, one cable per loudspeakercomes up through the ceiling of this equipment room into a cabletray and then to the speaker0s position outside the screen. We planto eventually isolate all video and audio rendering computers inthis machine room.
A sixth Echo AudioFire 12 interface attached to the productionLubuntu box allows audio rendering from the same single com-puter that can drive the four Barco projectors. These 12 audiooutput channels go to 12 of the 60 audio inputs on the fiveAudioFire 12 boxes connected to the MacPro. Having realtimeaudio along with 10G ethernet connection between these twomachines supports several audio rendering architectures along aspectrum of distributed computing complexity, including directlyaddressing 12 of the 54.1 speakers, a static 12:56 matrix upmix,taking the 12 output channels as inputs to network-controlleddynamic sound spatialization software [32] running on the Mac-Pro, and encoding any number of dynamic sources to second-orderAmbisonics on Lubuntu with a 54.1 decode on OSX.
We have designed our own custom speaker mounting hard-ware (shown in Fig. 11) according to our acoustic studies andspatial configuration discussed above. The mounting system isdesigned to prevent sympathetic vibrations so that there is nospeaker buzz.
5. Interactivity
5.1. Ensemble–style interaction and the deviceserver
We use the term “ensemble–style interaction” to describe ourapproach to multi-user interactivity, by analogy with a musicalensemble [33] . At one extreme, one user actively manipulates theenvironment via interactive controls while other users observepassively. We also support many other models in which multipleusers adopt various roles and then perform associated tasksconcurrently. One form consists of a team of researchers workingtogether across the large visual display, each researcher perform-ing a separate role such as navigation, querying data, or modifyingsimulation parameters. Another configuration gives eachresearcher an individual tablet display while immersed in thelarge display system. These tablets can both display a personalizedview of specific parts of the information and also provide theability to push a new view to the large display to be shared withother researchers.
Table 3Audio noise measurements (dB SPL, A-Weighted, from center of bridge) as moreequipment is turned on. Below the line are older measurements taken with originalunmodified projector enclosures.
Condition dB
All equipment turned off 28.6Panasonic fans on 33.2Fans and Barco projectors on 40.9Entire current system on 43.2
Everything off except original fans in factory projector enclosures 49.0Barcos on inside factory enclosures 56.5 Fig. 11. Meyer MM4XP loudspeaker on custom mount. Left side of image shows
sound absorption materials and right side shows the back of the projection screen.
J. Kuchera-Morin et al. / Computers & Graphics 40 (2014) 10–21 17

In order to simplify incorporating multiple heterogenous inter-active devices in VR applications we developed a program namedthe DeviceServer to serve as a single networked hub for inter-activity [34,35]. The DeviceServer removes the need for contentapplication developers to worry about device drivers and providesa simple GUI enabling users to quickly configure mappings frominteractive device controls to application functionalities accordingto their personal preferences. Multiple devices (e.g., for multipleusers) can be freely mapped to the same application, e.g., eachcontrolling different parameters, or with inputs combined so thatmultiple devices control overlapping sets of parameters. Thisscheme offloads signal processing of control data onto a separatecomputer from visual and audio renderers; all signal processing isperformed via JIT-compiled Lua scripts that can easily be iteratedwithout having to recompile applications. Interactive configura-tions can be saved and quickly recalled using Open Sound Control[23] messages.
5.2. Tracking and other devices
There is a 14-camera tracking system [36] installed in theinstrument, which can track both visible and infrared LEDs. Fig. 12shows a researcher using LED gloves tracked by the system.Integrating the tracking system into the overall design requiredcareful consideration. Cameras must be located behind the screen,so as not to block visual projection, but also must be positioned ina way that affords tracking multiple users on the bridge simulta-neously. Custom mounts were designed for the cameras in orderto hold their twin apertures directly in front of screen perforations,which were slightly widened to increase the cameras' field of view.These mounts attach to the screen via machine screws that insertdirectly into nearby screen perforations. Of the 14 cameras, 10 arecurrently mounted in a ring around the outside surface of the topof the sphere, with the remaining 4 mounted in the openings oneither side of the bridge.
The emitters used with our active stereo projectors and glassesalso use infrared light, and out of the box there is interference suchthat glasses in line of sight of IR tracking LEDs are not able tosynchronize. Luckily there is enough frequency separationbetween the wavelengths of the two sources of IR light that wewere able to solve this problem with optical filters attached to theIR receivers of the shutter glasses. We tested two types of filters:Long Wavepass Filter (LPF) and Schott Color Glass Filter (CG).Although the long wavepass filter had the better bandpass rangefor our application, the problem is that this type of filter isdirectional, correctly blocking interference from IR LEDs at certainhead angles but not at others. In contrast, the performance of thecolor glass filter does not depend on direction, and these allowedperfect operation of the shutter glasses alongside the IR LEDs even
though they pass the highest IR frequencies (containing about 25%of the energy from the emitters).
Other devices are being continuously integrated into theinstrument in order to augment multi-user control of applications.Recently, an array of Microsoft Kinects was installed to scan userson the bridge and re-project them within the artificial ecosystemof the Time of Doubles artwork [37], as Fig. 13 shows.
In addition to providing interactive controls to multiple users,our current research also gives users individual viewports into datavisualizations [38]. Using tablet devices, users can interactivelyexplore detailed textual information that would otherwise disrup-tively occlude the shared large-screen view. Fig. 17 shows multipleresearchers using tablets to explore a graph visualization of socialnetwork data. Each user has a tablet controlling a cursor on thelarge shared screen to select individual nodes in the graph. Thetextual information associated with selected graph nodes thenappears on the tablet of user performing the selection. When usersfind information that they think would be interesting to others theycan push the data to the shared screen for everyone to see.
Mobile devices interact with applications using the app Control[39], available for free from both the Apple App Store and theAndroid Market. Control is our open source application enablingusers to define custom interfaces controlling virtual reality, art,and music software.
6. Projects tested displaying multi-user capabilities
We believe that use of the system through developing ourresearch content is the most important driver of technology [40].Over the past 5 years we have focused on projects crossing diversecontent areas that facilitate the development of multimodality,multi-user interaction, and immersion. Of our many successfulprojects, here we will describe a small subset that focuses onmulti-user group participation as described above.
6.1. AlloBrain
The AlloBrain research project (shown in Fig. 1 (left) and Fig. 14)gives roles to an ensemble of researchers for collaborative dataexploration while immersed in the fMRI data both visually andsonically. One user navigates the shared viewpoint with a wirelessdevice while other people use various devices to query the data.Fig. 12. Researcher using the tracked gloves to explore fMRI brain data.
Fig. 13. Two visitors feeding and being consumed by artificial life organisms in theTime of Doubles artwork (2012). Visitors0 occupation of physical space is detected byan array of Kinect depth cameras, and re-projected into the virtual world as regionsof nutritive particle emanation, while physical movements cause turbulence withinthe fluid simulation.
J. Kuchera-Morin et al. / Computers & Graphics 40 (2014) 10–2118

6.2. TimeGiver
The TimeGiver project (Figs. 15 and 16) explores multi-useraudience group participation in the desktop display mode. Audi-ence members download a custom biometric app to their smartphones, made specifically for this interactive installation, that uses
the phone0s LED and camera to obtain a photoplethysmogram(PPG) that captures heart rate, blood flow, level of blood oxygena-tion, etc. The app can also interface with low-cost off-the-shelfelectroencephalography (EEG) sensors to monitor brainwave activ-ity. These time-varying physiological data dynamically determinethe visual and the sonic output of the installation.
6.3. Graph browser
The GraphBrowser application (Fig. 17) enables multiple usersto collaboratively explore annotated graphs such as social net-works or paper coauthorship networks. The desktop display modeshows the full graph stereographically, while tablet devices heldby each researcher display individualized additional textual infor-mation. There are two roles for researchers in this application:navigation and node querying. Navigation controls allow a navi-gator to rotate the graph, move the virtual camera and manipulateglobal parameters of the visualization presented on the shareddisplay. Concurrently, additional researchers can select nodes andquery them for associated textual data and view the query resultson personal tablets. By displaying text on tablets we avoidoccluding the shared display with text that is particular toindividual researchers and also provide a more optimal readingexperience by enabling individuals to customize viewing distanceand text size.
In order to foster collaboration the shared display shows avisual browsing history of each user. Each researcher (actuallyeach tablet device) has a unique associated color, used both for aselection cursor on the shared display (which the user moves viatouch gestures on his or her tablet) and also to mark previouslyqueried nodes. This strategy helps researchers to identify unex-plored areas of the graph and also provides contextual awarenessof the other users0 activities. We also enable individuals to pushdata they deem of interest to collaborators from their individualtablet to the shared display for everyone to analyze
Fig. 14. Multiple users with wireless devices and gestural control mining fMRI data.
Fig. 15. The TimeGiver project maps audience participants0 EEG and PPG temporalpatterns to create an immersive audiovisual installation.
Fig. 16. Close-up of two participants in the TimeGiver project using their smartphones to monitor blood pulse via PPG; the person on the right is also wearing ahead-mounted EEG device.
Fig. 17. Tablets providing personal views and search and annotation tools in GraphBrowser, a project for collaborative graph exploration. Left: photo of two users interactingwith the system. Center: graph as it appears on the shared display, with three color-coded cursors and already-visited nodes highlighted. Right: textual data and a graphicalrepresentation of already-visited nodes, as would appear on a tablet. (For interpretation of the references to color in this figure caption, the reader is referred to the webversion of this paper.)
Fig. 18. “Slice Viewer” representation of copper tungsten volumetric dataset.
J. Kuchera-Morin et al. / Computers & Graphics 40 (2014) 10–21 19

simultaneously. Fig. 17 shows two researchers exploring socialnetwork data using tablets and the shared display.
6.4. Copper tungsten
Our series of Copper Tungsten visualizations employs bothdesktop and surround display modes to give our materials sciencecollaborators different ways to view the same volumetric dataset.These scientists are familiar with volumetric visualizations thatare 3D but not stereoscopic. The first, “Slice Viewer” (Fig. 18), isinspired by tools commonly used to view MRI volumetric datasets;it uses the desktop display mode to show three interactivelymovable, orthogonal slices through the volume. The left half ofthe display shows the three slices in context in 3D perspective,while the right half shows the same three slices in a flat (viewport-aligned) fashion so that detail will be most apparent.
The second (Fig. 19), also using the desktop display mode butwith stereographics, is a volumetric rendering of the datasettaking advantage of alpha-blending (translucency) to be able tosee into the volume. Unfortunately the size and amount of detail ofthis dataset makes it impossible to apprehend the entire 3Dvolume visually; occlusion makes it difficult to see the insidestructure of the volume.
The third visualization of this dataset uses the surround displaymode in conjunction with raycasting rendering in a distance field,allowing the researchers to “go inside” the dataset rather thanview it from a perspective looking in from outside.
6.5. Preliminary conclusions from the various projects
As we build out the system with a diverse set of content areasdriving the design, we believe that there is a common set ofbenefits of our instrument. First and foremost, multiuser groupinteraction in an environment in which the users are unencum-bered by technical devices seems to facilitate natural communica-tion among groups of researchers. Not only does each user havehis or her own sense of self while immersed in a dataset, but alsoeach user has a sense of the other users0 selves, which seems tofacilitate communication within the group. With the instrumentdesign mimicking real-world immersion, namely looking to thehorizon, having no visual corner artifacts, full surround audio, andvarious forms of interaction including gestural control, we believethat a group of researchers can interact and can be immersed in acomplex dataset much in the same way that they are immersed inthe real world. Through these projects we have found that thisinstrument design facilitates immersion even in scenarios that arenon-stereoscopic (for example when viewing panoramic photo-graphs as shown in Fig. 2).
7. Conclusions and future work
Technology development has been intricately linked withsystem use throughout our ongoing research in this large-scale,full-surround, immersive, multimodal instrument. The plurality ofprogramming environments supported by the desktop-like displaymode facilitates easy access to the use of the instrument, while thein-house authoring software scales easily from single-screen tofull-dome immersive display. A notable benefit of this approachhas been the low barrier of entry for developing content. Wecontinue to build the in-house infrastructure as an active researcharea.
A vital component of future work is the evaluation of theeffectiveness of the instrument across heterogeneous content areasusing immersion, multi-user interaction and multimodality. As wescale up the instrument another important research area willinclude a better authoring environment for surround mode. Wehave an effective way of bringing in legacy content and we nowfocus on full-surround, omnistereo, and real-time physically basedrendering.
We are currently prototyping how multi-user, real-time meta-programming can be applied in our intensely demanding multi-media environment. Our goal is that multiple researchers (artists,scientists, technologists) can write and rewrite applications as theyare immersed within them without pausing to recompile andreload the software [41], and simply by opening a local networkaddress on laptop or mobile device browser to view code editorsand graphical interfaces. Changes from multiple users are mergedand resolved through a local Git repository, and notificationsbroadcast to all machines of the rendering cluster, with live C/Cþþ code changes recompiled on the fly.
As we continue to build the instrument through contentresearch, we will scale to many different platforms and devicesfrom large immersive full-dome display to mobile platformdevices, specifically focusing on 3D and immersion. The differentscaled platforms will be connected together through our softwareinfrastructure to make a multi-dimensional interconnected systemfrom large full-dome instruments to small mobile devices that willbe utilized as windows within windows for multiple resolutions ofscale. We imagine an interrelated network where live-coding willfacilitate communities of digital interactive research across manydifferent application areas.
Acknowledgments
The authors wish to thank David Adams, Gustavo Rincon,Joseph Tilbian, Carole Self, Drew Waranis, Karl Yerkes, and LarryZins. This material is based in part upon work supported by theRobert W. Deutsch Foundation, the National Science Foundationunder Grant numbers 0821858, 0855279, and 1047678, by the U.S.
Fig. 19. Volumetric view of copper tungsten dataset at four stages of rotation.
J. Kuchera-Morin et al. / Computers & Graphics 40 (2014) 10–2120

Army Research Laboratory under MURI Grant number W911NF-09-1-0553, as well as ONR Grants N00014-13-1-0273 and N00014-13-1-0872.
References
[1] Höllerer T, Amatriain X, Kuchera-Morin J. The Allosphere: a large-scaleimmersive surround-view instrument. In: Emerging display technologiesworkshop (EDT 2007), San Diego, CA, 2007.
[2] Amatriain X, Kuchera-Morin J, Höllerer T, Pope ST. The AlloSphere: Immersivemultimedia for scientific discovery and artistic exploration. IEEE MultiMed2009;16(2):64–75.
[3] Wakefield G, Smith W. Cosm: A toolkit for composing immersive audio-visualworlds of agency and autonomy. In: Proceedings of the international computermusic conference, 2011.
[4] Zicarelli D. How I learned to love a program that does nothing. http://dx.doi.org/101162/014892602320991365 2002.
[5] Reas C, Fry B. Processing: programming for the media arts. AI & SOCIETY, 2006.[6] Cruz-Neira C, Sandin DJ, DeFanti TA, Kenyon RV, Hart JC. The CAVE audio visual
experience automatic virtual environment. Commun ACM 1992;35(6):64–72,http://dx.doi.org/10.1145/129888.129892.
[7] DeFanti TA, Sandin DJ, Cruz-Neira C. A “room” with a “view”. IEEE Spectr1993;30(10):30–3, http://dx.doi.org/10.1109/6.237582.
[8] Cruz-Neira C, Sandin DJ, DeFanti TA. Surround-screen projection-based virtualreality: the design and implementation of the CAVE. In: Proceedings of the20th annual conference on computer graphics and interactive techniques,SIGGRAPH 093. New York, NY, USA: ACM; 1993. p. 135–42. ISBN 0-89791-601-8.URL: ⟨http://doi.acm.org/10.1145/166117.166134⟩.
[9] DeFanti TA, Dawe G, Sandin DJ, Schulze JP, Otto P, Girado J, et al. The StarCAVE,a third-generation CAVE and virtual reality optiportal. Future Gener ComputSyst 2009;25(2):169–78, http://dx.doi.org/10.1016/j.future.2008.07.015 URL:⟨http://www.sciencedirect.com/science/article/pii/S0167739X08001167⟩.
[10] Leigh J, Dawe G, Talandis J, He E, Venkataraman S, Ge J, et al. AGAVE: Accessgrid augmented virtual environment. In: Proceedings of AccessGrid retreat,Argonne, IL, 2001.
[11] Steinwand D, Davis B, Weeks N. Geowall: Investigations into low-cost stereodisplay systems. 2002 USGS Open File Report, 2002.
[12] Fairn M, Brunet P, Techmann T. Minivr: a portable virtual reality system.Comput Graph 2004;28(2):289–96 URL: ⟨http://dx.doi.org/10.1016/j.cag.2003.12.013⟩.
[13] DeFanti TA, Acevedo D, Ainsworth RA, Brown MD, Cutchin S, Dawe G, et al.The future of the CAVE. Cent Eur J Eng 2011;1:16–37, http://dx.doi.org/10.2478/s13531-010-0002-5.
[14] Ni T, Schmidt GS, Staadt OG, Livingston MA, Ball R, May R. A survey of largehigh-resolution display technologies, techniques, and applications. In: Pro-ceedings of the IEEE conference on virtual reality, VR 006. Washington,DC, USA: IEEE Computer Society; 2006. p. 223–36. ISBN 1-4244-0224-7.URL: ⟨http://dx.doi.org/10.1109/VR.2006.20⟩.
[15] Georgila K, Black AW, Sagae K, Traum D. Practical evaluation of human andsynthesized speech for virtual human dialogue systems. In: Internationalconference on language resources and evaluation (LREC), Istanbul, Turkey,2012. URL: ⟨http://people.ict.usc.edu/traum/Papers/lrec-speechsynthesis2012.pdf⟩.
[16] Cowgill E, Bernardin TS, Oskin ME, Bowles C, Yıkılmaz MB, Kreylos O, et al.Interactive terrain visualization enables virtual field work during rapidscientific response to the 2010 Haiti earthquake. Geosphere 2012;8(4):787–804, http://dx.doi.org/10.1130/GES00687.1 URL: ⟨http://geosphere.gsapubs.org/content/8/4/787.full.pdfþhtml⟩.
[17] Lantz E. A survey of large-scale immersive displays. In: Proceedings of the2007 workshop on emerging displays technologies: images and beyond: thefuture of displays and interaction, EDT 007. New York, NY, USA: ACM. ISBN 978-1-59593-669-1; 2007, URL: ⟨http://doi.acm.org/10.1145/1278240.1278241⟩.
[18] Christopoulos D, Gaitatzes A, Papaioannou G, Zyba G, Designing a real-timeplayback system for a dome theater. In: Proceedings of Eurographics 7thinternational symposium on virtual reality, archaeology and intelligent cul-tural heritage (VAST), 2006. p. 1–6. URL: ⟨http://www.virtuality.gr/Papers/VAST-2006/VAST-2006signed.pdf⟩.
[19] University of Hawaii at Hilo. Imiloa Astronomy Center. URL: ⟨http://www.imiloahawaii.org/⟩; 2012 [accessed September 2012].
[20] Conant D, Chu W, McNally T, Hoover KA, Pope S. Acoustics of a largeimmersive environment the allosphere. J Acoust Soc Am 2008;123(5):2981,http://dx.doi.org/10.1121/1.2932496 URL: ⟨http://link.aip.org/link/?JAS/123/2981/1⟩.
[21] Ernst M, Bulthoff H. Merging the senses into a robust percept. Trends CognitSci 2004;8(4):1–8, http://dx.doi.org/10.1016/j.tics.2004.02.002 URL: ⟨http://www.sciencedirect.com⟩.
[22] Wakefield G, Smith W, Roberts C. LuaAV: extensibility and heterogeneity foraudiovisual computing. In: Linux audio conference, 2010.
[23] Wright M, Freed A. Open sound control: A new protocol for communicatingwith sound synthesizers. In: International computer music conference, Inter-national computer music association, 1997. p. 101–4.
[24] Stockman N, Vamvoudakis KG, Devendorf L, Höllerer T, Kemmerer, R,Hespanha JP. A mission-centric visualization tool for cybersecurity situationawareness. Technical Report UCSB CS Tech Report 2012-07; University ofCalifornia Santa Barbara, Department of Computer Science; 2012. URL: ⟨http://www.cs.ucsb.edu/research/tech_reports/reports/2012-07.pdf⟩.
[25] Dingeldey F, Schiewe M, Gerhardt J, Ahlers KI, Haulsen I. Interactive immersive3d stereoscopic dome with automatic calibration. In: Proceeding of theEurographics 2010 conference, 2010.
[26] Sajadi B. Auto-registration techniques for immersive multi-projector displays[Ph.D. thesis]. Irvine:University of California; 2012.
[27] Hartley R, Zisserman A. Multiple view geometry in computer vision. Cambridge,England: Cambridge University Press; 2000.
[28] Bailey M, Clothier M, Gebbie N. Realtime dome imaging and interaction:towards immersive design environments. ASME Conf Proc 2006;2006(42578):813–21, http://dx.doi.org/10.1115/DETC2006-99155 URL: ⟨http://link.aip.org/link/abstract/ASMECP/v2006/i42578/p813/s1⟩.
[29] Simon A, Smith RC, Pawlicki RR. Omnistereo for panoramic virtual environ-ment display systems. In: Proceedings of the IEEE virtual reality 2004, VR 004.Washington, DC, USA: IEEE Computer Society; 2004. p. 67. ISBN 0-7803-8415-6.URL: ⟨http://dx.doi.org/10.1109/VR.2004.56⟩.
[30] Amatriain X, Höllerer T, Kuchera-Morin J, Pope ST. Immersive audio and musicin the allosphere. In: Proceedings of the international computer musicconference, International computer music association, 2007. p. 276–83.
[31] Amatriain X, Castellanos J, Höllerer T, Kuchera-Morin J, Pope ST, Wakefield G, et al.Experiencing audio and music in a fully immersive environment. In: Kronland-Martinet R, Ystad S, Jensen K, et al., editors. Computer music modelingand retrieval. Sense of sounds. Berlin, Heidelberg: Springer-Verlag; 2008.p. 380–400, http://dx.doi.org/10.1007/978-3-540-85035-9_27 ISBN 978-3-540-85034-2.
[32] McGee R, Wright M. Sound element spatializer. In: Proceedings of theinternational computer music conference, 2011.
[33] Kuchera-Morin J. Performing in quantum space: a creative approach ton-dimensional computing. Leonardo 2011;44(5):462–3.
[34] Roberts C. Towards a dynamic framework for interactivity [Master0s thesis].University of California Santa Barbara; 2009.
[35] Roberts C, Wright M, Kuchera-Morin J, Putnam L. Dynamic interactivity insidethe alloSphere. In: Proceedings of the international conference on newinterfaces for musical expression, 2010. p. 57–62. URL: ⟨http://www.nime.org/proceedings/2010/nime2010_057.pdf⟩.
[36] PhaseSpace, Inc. Phasespace motion capture j products : Impulse x2 motioncapture solution. URL: ⟨http://phasespace.com/impulse_motion_capture.html⟩; 2012 [accessed September 2012].
[37] Ji H, Wakefield G. Virtual world-making in an interactive art installation: timeof doubles. In: Bornhofen, S., Heudin, J.-C., Lioret, A., Torrel, J.-C., editors.Virtual worlds. Science eBook, France, 2013. ISBN: 979-10-91245-06-7.
[38] Roberts C, Alper B, Kuchera-Morin J, Höllerer T. Augmented textual dataviewing in 3d visualizations using tablets. in: 2012 IEEE symposium on 3Duser Interfaces (3DUI), IEEE, 2012. p. 101–4.
[39] Roberts C. Control: Software for end-user interface programming and inter-active performance. In: Proceedings of the international computer musicconference, 2011.
[40] Putnam L, Wakefield G, Ji H, Alper B, Adderton D, Kuchera-Morin J. Immersed inunfolding complex systems. In: Beautiful visualization, O0Reilly, 2010. p. 1–19.
[41] Smith W, Wakefield G. Augmenting computer music with just-in-timecompilation. In: Proceedings of the international computer music conference,2009. p. 439–42.
J. Kuchera-Morin et al. / Computers & Graphics 40 (2014) 10–21 21