concentra bank consolidated financial statements …
TRANSCRIPT

CONCENTRA BANK
CONSOLIDATED FINANCIAL STATEMENTS
DECEMBER 31, 2020

Concentra – 2020 Consolidated Financial Statements Page 1
TABLE OF CONTENTS
REPORTS
Management’s Responsibility for Financial Reporting 2
Independent Auditors’ Report 3
CONSOLIDATED FINANCIAL STATEMENTS
Consolidated Balance Sheet 6
Consolidated Statement of Income 7
Consolidated Statement of Comprehensive Income 8
Consolidated Statement of Changes in Equity 9
Consolidated Statement of Cash Flows 10
NOTES TO CONSOLIDATED FINANCIAL STATEMENTS
Note 1 General Information 11
Note 2 Summary of Significant Accounting Policies 11
Note 3 Securities 23
Note 4 Transfers of Financial Assets 24
Note 5 Derivative Assets and Liabilities 28
Note 6 Loans Receivable 29
Note 7 Allowance and Net Provision for Credit Losses 31
Note 8 Other Assets 33
Note 9 Income Taxes 33
Note 10 Deposits 34
Note 11 Loans and Notes Payable 35
Note 12 Other Liabilities 35
Note 13 Share Capital 36
Note 14 Fee for Service Income 37
Note 15 Gain on Financial Instruments 37
Note 16 Salaries and Employee Benefits Expense 37
Note 17 Commitments and Contingencies 37
Note 18 Risk Management 38
Note 18.1 Credit Risk 38
Note 18.2 Market Risk 43
Note 18.3 Liquidity and Funding Risk 46
Note 18.4 Capital Management 48
Note 19 Fair Value of Assets and Liabilities 50
Note 20 Related Party Disclosure 52
Note 21 Impact of COVID-19 53
Note 22 Subsequent Event 53

Concentra – 2020 Consolidated Financial Statements Page 2
MANAGEMENT’S RESPONSIBILITY FOR FINANCIAL REPORTING
The accompanying Consolidated Financial Statements of Concentra Bank (“the Bank”) were prepared by management who is responsible for the integrity and fairness of the information presented and for ensuring that all the information in the Management’s Discussion and Analysis is consistent with the Consolidated Financial Statements. This responsibility includes the selection of appropriate accounting policies and making objective judgements and estimates in accordance with International Financial Reporting Standards, in accordance with the requirements of the Bank Act (Canada), and the related rules and regulations issued by the Office of the Superintendent of Financial Institutions Canada.
In discharging this responsibility for the integrity and fairness of the Consolidated Financial Statements and for the accounting systems from which they are derived, management maintains the necessary systems of internal control to provide reasonable assurance that transactions are authorized, assets are safeguarded and proper records are maintained. This control is augmented by written policies and procedures, the careful selection and training of qualified staff, the creation of organizational structures that provide a well-defined division of responsibilities and accountability for performance, and the written communication of policies and guidelines for
business conduct throughout the Bank. This system of internal controls is supported by a compliance function
which is designed to ensure compliance with all regulatory requirements and by an internal audit function which carries out periodic audits of the operations of the Bank.
The Board of Directors carries out its responsibilities for reviewing the Consolidated Financial Statements through its Audit and Conduct Review Committee which is composed entirely of directors who are neither officers nor employees of the Bank. The Audit and Conduct Review Committee reviews the Consolidated Financial Statements and recommends approval to the Board of Directors. Other responsibilities of the Audit and Conduct Review
Committee include meeting regularly with management, internal audit and the Bank’s external auditors, to discuss the effectiveness of internal controls over the financial reporting process as well as the planning and results of the external audit. Both the external and internal auditors have full and free access to the Audit and Conduct Review Committee.
The Office of the Superintendent of Financial Institutions Canada examines and inquires into the business affairs of the Bank as deemed necessary to determine whether the provisions of the Bank Act (Canada), having reference to the safety of the depositors, are being duly observed and that Concentra is in a sound financial condition.
KPMG LLP, the external auditors are appointed by the shareholders of the Bank, upon the recommendation of the Audit and Conduct Review Committee, to perform an independent audit of the Consolidated Financial Statements and provide an opinion thereon; their report is presented separately.
Don Coulter, Paul Masterson,
President and Chief Executive Officer Chief Financial Officer
Regina, Canada
March 3, 2021

KPMG LLPHill Centre Tower II 1881 Scarth Street, 20th Floor Regina Saskatchewan S4P 4K9 CanadaTelephone (306) 791-1200 Fax (306) 757-4703
KPMG LLP is a Canadian limited liability partnership and a member firm of the KPMG network of independent member firms affiliated with KPMG International Cooperative (“KPMG International”), a Swiss entity. KPMG Canada provides services to KPMG LLP.
INDEPENDENT AUDITORS’ REPORT To the Shareholders of Concentra Bank
Opinion
We have audited the consolidated financial statements of Concentra Bank (the Entity), which comprise:
the consolidated balance sheet as at December 31, 2020
the consolidated statement of income for the year then ended
the consolidated statement of comprehensive income for the year then ended
the consolidated statement of changes in equity for the year then ended
the consolidated statement of cash flows for the year then ended
and notes to the consolidated financial statements, including a summary of significant accounting
policies
(Hereinafter referred to as the “financial statements”).
In our opinion, the accompanying financial statements present fairly, in all material respects, the consolidated financial
position of the Entity as at December 31, 2020, and its consolidated financial performance and its consolidated cash
flows for the year then ended in accordance with International Financial Reporting Standards (IFRS).
Basis for Opinion
We conducted our audit in accordance with Canadian generally accepted auditing standards. Our responsibilities under
those standards are further described in the “Auditors’ Responsibilities for the Audit of the Financial Statements”
section of our auditors’ report.
We are independent of the Entity in accordance with the ethical requirements that are relevant to our audit of the
financial statements in Canada and we have fulfilled our other ethical responsibilities in accordance with these
requirements.
We believe that the audit evidence we have obtained is sufficient and appropriate to provide a basis for our opinion.
Other Information
Management is responsible for the other information. Other information comprises Management’s Discussion and
Analysis.
Our opinion on the financial statements does not cover the other information and we do not and will not express any
form of assurance conclusion thereon.

Page 2
In connection with our audit of the financial statements, our responsibility is to read the other information identified
above and, in doing so, consider whether the other information is materially inconsistent with the financial statements
or our knowledge obtained in the audit and remain alert for indications that the other information appears to be
materially misstated.
We obtained Management’s Discussion and Analysis as at the date of this auditors’ report.
If, based on the work we have performed on this other information, we conclude that there is a material misstatement
of this other information, we are required to report that fact in the auditors’ report.
We have nothing to report in this regard.
Responsibilities of Management and Those Charged with Governance for the Financial Statements
Management is responsible for the preparation and fair presentation of the financial statements in accordance with
International Financial Reporting Standards (IFRS), and for such internal control as management determines is
necessary to enable the preparation of financial statements that are free from material misstatement, whether due to
fraud or error.
In preparing the financial statements, management is responsible for assessing the Entity’s ability to continue as a
going concern, disclosing as applicable, matters related to going concern and using the going concern basis of
accounting unless management either intends to liquidate the Entity or to cease operations, or has no realistic
alternative but to do so.
Those charged with governance are responsible for overseeing the Entity’s financial reporting process.
Auditors’ Responsibilities for the Audit of the Financial Statements
Our objectives are to obtain reasonable assurance about whether the financial statements as a whole are free from
material misstatement, whether due to fraud or error, and to issue an auditors’ report that includes our opinion.
Reasonable assurance is a high level of assurance, but is not a guarantee that an audit conducted in accordance with
Canadian generally accepted auditing standards will always detect a material misstatement when it exists.
Misstatements can arise from fraud or error and are considered material if, individually or in the aggregate, they could
reasonably be expected to influence the economic decisions of users taken on the basis of the financial statements.
As part of an audit in accordance with Canadian generally accepted auditing standards, we exercise professional
judgment and maintain professional skepticism throughout the audit.
We also:
Identify and assess the risks of material misstatement of the financial statements, whether due to fraud or error,
design and perform audit procedures responsive to those risks, and obtain audit evidence that is sufficient and
appropriate to provide a basis for our opinion.
The risk of not detecting a material misstatement resulting from fraud is higher than for one resulting from error,
as fraud may involve collusion, forgery, intentional omissions, misrepresentations, or the override of internal
control.

Page 3
Obtain an understanding of internal control relevant to the audit in order to design audit procedures that are
appropriate in the circumstances, but not for the purpose of expressing an opinion on the effectiveness of the
Entity's internal control.
Evaluate the appropriateness of accounting policies used and the reasonableness of accounting estimates and
related disclosures made by management.
Conclude on the appropriateness of management's use of the going concern basis of accounting and, based on
the audit evidence obtained, whether a material uncertainty exists related to events or conditions that may cast
significant doubt on the Entity's ability to continue as a going concern. If we conclude that a material uncertainty
exists, we are required to draw attention in our auditors’ report to the related disclosures in the financial statements
or, if such disclosures are inadequate, to modify our opinion. Our conclusions are based on the audit evidence
obtained up to the date of our auditors’ report. However, future events or conditions may cause the Entity to cease
to continue as a going concern.
Evaluate the overall presentation, structure and content of the financial statements, including the disclosures, and
whether the financial statements represent the underlying transactions and events in a manner that achieves fair
presentation.
Communicate with those charged with governance regarding, among other matters, the planned scope and timing
of the audit and significant audit findings, including any significant deficiencies in internal control that we identify
during our audit.
Obtain sufficient appropriate audit evidence regarding the financial information of the entities or business activities
within the group Entity to express an opinion on the financial statements. We are responsible for the direction,
supervision and performance of the group audit. We remain solely responsible for our audit opinion.
Chartered Professional Accountants
Regina, Canada
March 3, 2021

Concentra – 2020 Consolidated Financial Statements Page 6
CONSOLIDATED BALANCE SHEET
As at December 31
(In Thousands of Canadian Dollars)
Note 2020 2019
ASSETS
Cash $ 763,710 $ 402,528
Securities 3 1,294,261 841,557
Loans Receivable
Retail loans 7,951,174 6,471,834
Commercial loans 877,667 1,086,996
6 8,828,841 7,558,830
Other
Derivative assets 5 15,877 12,022
Other securitization assets 4 94,277 77,594
Goodwill 19,248 19,248
Other assets 8 47,697 32,923
177,099 141,787
$ 11,063,911 $ 8,944,702
LIABILITIES
Deposits 10 $ 6,334,180 $ 4,377,099
Securitization Liabilities 4 3,921,683 3,553,627
Loans and Notes Payable 11 214,745 420,276
Other
Derivative liabilities 5 18,150 12,299
Accounts payable 13,118 56,025
Other liabilities 12 34,920 23,488
66,188 91,812
10,536,796 8,442,814
COMMITMENTS AND CONTINGENCIES 17
SHAREHOLDERS' EQUITY
Share capital 13 245,239 245,239
Retained earnings 268,322 253,414
Accumulated other comprehensive income 13,554 3,235
527,115 501,888
$ 11,063,911 $ 8,944,702
The accompanying notes form an integral part of these consolidated financial statements.
________________________________ ________________________________ Don Coulter Glen Dyrda President and Chief Executive Officer Director and Chair, Audit and Conduct Review Committee

Concentra – 2020 Consolidated Financial Statements Page 7
CONSOLIDATED STATEMENT OF INCOME
For the Year Ended December 31
(In Thousands of Canadian Dollars)
Note 2020 2019
INTEREST INCOME
Loans receivable $ 268,858 $ 270,433
Securities 22,527 26,915
291,385 297,348
INTEREST EXPENSE
Deposits 106,700 115,899
Securitization liabilities 67,373 67,029
Loans and notes payable 5,154 8,018
Other direct expenses 16,214 9,974
195,441 200,920
NET INTEREST INCOME 95,944 96,428
Provision for credit losses 7 8,894 6,894
NET INTEREST INCOME AFTER PROVISIONS 87,050 89,534
NON-INTEREST INCOME
Fee for service income 14 17,950 18,877
Gain on financial instruments 15 7,413 5,617
Investment property income - 66
25,363 24,560
NET INTEREST AND NON-INTEREST INCOME 112,413 114,094
NON-INTEREST EXPENSE
Salaries and employee benefits 46,222 40,465
Information technology 9,690 8,322
Other operating 8,574 10,110
Professional and advisory services 6,446 6,419
Capital and excise taxes 4,032 3,656
Occupancy 2,641 2,410
77,605 71,382
INCOME BEFORE INCOME TAXES 34,808 42,712
Income tax expense 9 9,425 12,630
NET INCOME $ 25,383 $ 30,082
The accompanying notes form an integral part of these consolidated financial statements.
Concentra – 2020 Consolidated Financial Statements Page 8
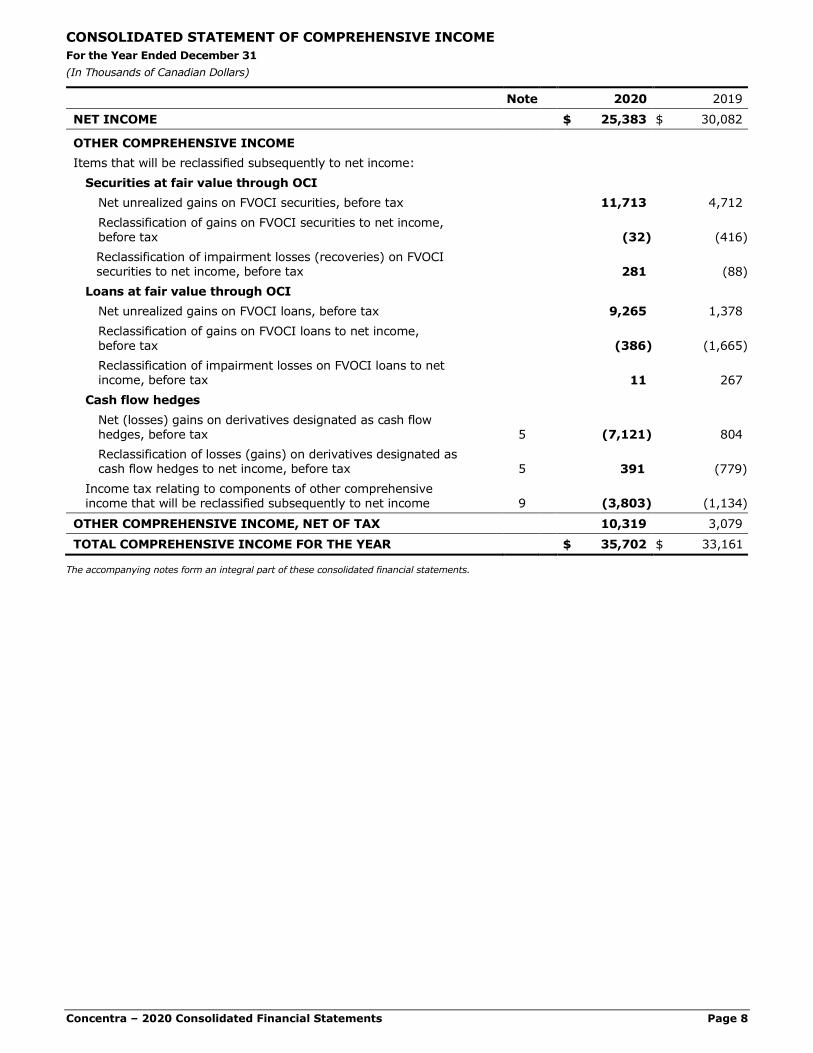
CONSOLIDATED STATEMENT OF COMPREHENSIVE INCOME For the Year Ended December 31
(In Thousands of Canadian Dollars)
Note 2020 2019
NET INCOME $ 25,383 $ 30,082
OTHER COMPREHENSIVE INCOME
Items that will be reclassified subsequently to net income:
Securities at fair value through OCI
Net unrealized gains on FVOCI securities, before tax 11,713 4,712
Reclassification of gains on FVOCI securities to net income, before tax (32) (416)
Reclassification of impairment losses (recoveries) on FVOCI securities to net income, before tax 281 (88)
Loans at fair value through OCI
Net unrealized gains on FVOCI loans, before tax 9,265 1,378
Reclassification of gains on FVOCI loans to net income,
before tax (386) (1,665)
Reclassification of impairment losses on FVOCI loans to net income, before tax 11 267
Cash flow hedges
Net (losses) gains on derivatives designated as cash flow hedges, before tax 5 (7,121) 804
Reclassification of losses (gains) on derivatives designated as cash flow hedges to net income, before tax
5 391 (779)
Income tax relating to components of other comprehensive income that will be reclassified subsequently to net income 9 (3,803) (1,134)
OTHER COMPREHENSIVE INCOME, NET OF TAX 10,319 3,079
TOTAL COMPREHENSIVE INCOME FOR THE YEAR $ 35,702 $ 33,161
The accompanying notes form an integral part of these consolidated financial statements.

Concentra – 2020 Consolidated Financial Statements Page 9
CONSOLIDATED STATEMENT OF CHANGES IN EQUITY
For the Year Ended December 31
(In Thousands of Canadian Dollars)
Note 2020 2019
SHARE CAPITAL
Balance, beginning of year $ 245,239 $ 245,239
Balance, end of year 13 245,239 245,239
RETAINED EARNINGS
Balance, beginning of year 253,414 233,807
Net income 25,383 30,082
Preferred dividends 13 (5,105) (5,105)
Common dividends 13 (5,370) (5,370)
Balance, end of year 268,322 253,414
ACCUMULATED OTHER COMPREHENSIVE INCOME
Securities at fair value through OCI, net of taxes
Balance, beginning of year 121 (2,951)
Other comprehensive income 8,740 3,072
Balance, end of year 8,861 121
Loans at fair value through OCI, net of taxes
Balance, beginning of year 724 736
Other comprehensive income (loss) 6,496 (12)
Balance, end of year 7,220 724
Cash flow hedges, net of taxes
Balance, beginning of year 2,390 2,371
Other comprehensive (loss) income (4,917) 19
Balance, end of year (2,527) 2,390
TOTAL ACCUMULATED OTHER COMPREHENSIVE INCOME 13,554 3,235
TOTAL SHAREHOLDERS’ EQUITY $ 527,115 $ 501,888
The accompanying notes form an integral part of these consolidated financial statements.

Concentra – 2020 Consolidated Financial Statements Page 10
CONSOLIDATED STATEMENT OF CASH FLOWS
For the Year Ended December 31
(In Thousands of Canadian Dollars)
Note 2020 2019
CASH FLOWS FROM (USED IN) OPERATING ACTIVITIES
Net income $ 25,383 $ 30,082
Adjustments to determine net cash from operating activities:
Net interest income (95,944) (96,428)
Provision for credit losses 7 8,894 6,894
Gain on financial instruments 15 (7,413) (5,617)
Decrease in fair value of assets held for sale - 75
Amortization of premises and equipment 8 1,321 1,252
Amortization of other intangible assets 8 1,026 660
Income tax expense 9 9,425 12,630
Changes in operating assets and liabilities:
Loans receivable, net of repayments and sales (1,288,391) 723,706
Other assets 496 (3,117)
Deposits, net of withdrawals 1,951,750 (449,069)
Securitization liabilities, net of repayments 431,991 (453,217)
Loans and notes payable, net of repayments (205,515) 104,708
Accounts payable (45,632) 25,263
Interest received 302,878 295,727
Interest paid (183,487) (195,837)
Net realized losses from derivatives (1,699) (2,063)
Net realized losses from derivatives designated as cash flow hedges (5,566) (356)
Income taxes paid (15,359) (17,892)
Net cash from (used in) operating activities 884,158 (22,599)
CASH FLOWS FROM (USED IN) INVESTING ACTIVITIES
Proceeds from sales and maturities of securities 333,100 687,743
Purchase of securities (843,004) (442,049)
Premises and equipment purchases, net of disposals (29) (188)
Intangible asset additions, net of disposals (1,761) (2,980)
Proceeds from disposal of assets held for sale - 19,039
Net cash from (used in) investing activities (511,694) 261,565
CASH FLOWS USED IN FINANCING ACTIVITIES
Dividends paid 13 (10,475) (10,475)
Cash outflow for lease financing (807) (669)
Net cash used in financing activities (11,282) (11,144)
NET INCREASE IN CASH 361,182 227,822
Cash, beginning of year 402,528 174,706
CASH, END OF YEAR $ 763,710 $ 402,528
The accompanying notes form an integral part of these consolidated financial statements.
NOTES TO CONSOLIDATED FINANCIAL STATEMENTS
For the Year Ended December 31
(In Thousands of Canadian Dollars Unless Otherwise Indicated)
Concentra – 2020 Consolidated Financial Statements Page 11
1. GENERAL INFORMATION
Concentra Bank (“the Bank”) is a Schedule 1 chartered bank domiciled in Canada that carries on business pursuant to the Bank Act (Canada) and is regulated by The Office of the Superintendent of Financial Institutions Canada (“OSFI”). The Bank’s registered head office is located at 333 – Third Avenue North, Saskatoon, Saskatchewan, Canada, S7K 2M2. The Bank provides commercial and retail banking and trust services to Canadian credit unions and retail and commercial clients. The Bank’s trust services are provided through its federally regulated subsidiary, Concentra Trust.
Credit Union Central of Saskatchewan (“SaskCentral”) holds 84.0% of the voting rights and is the controlling shareholder of the Bank.
2. SUMMARY OF SIGNIFICANT ACCOUNTING POLICIES
2.1 Basis of Presentation
(a) Statement of compliance
The consolidated financial statements of the Bank have been prepared in accordance with International Financial
Reporting Standards (“IFRS”) as issued by the International Accounting Standards Board (“IASB”).
The consolidated financial statements of the Bank have been prepared in accordance with subsection 308(1) of the Bank Act (Canada) which states that, except as otherwise specified by the OSFI, the consolidated financial statements are to be prepared in accordance with Canadian generally accepted accounting principles which require publicly accountable enterprises to report using IFRS. The significant accounting policies followed in the preparation of these consolidated financial statements, including the accounting requirements of OSFI, are summarized below. These policies have been consistently applied to all years presented and conform in all material respects to IFRS.
The consolidated financial statements for the year ended December 31, 2020, were approved for issue by the Board of Directors on March 3, 2021.
(b) Basis of measurement
The consolidated financial statements have been prepared on the historical cost basis except for: (1) assets/liabilities held for sale, which are measured at the lower of fair value less costs to sell and the previous carrying value of the assets/liabilities prior to being classified as held for sale; and (2) the following items which are measured at fair value:
• Financial assets at fair value through other comprehensive income (“FVOCI”)
• Financial assets at fair value through profit or loss (“FVTPL”) • Derivatives at fair value
(c) Functional and presentation currency
The consolidated financial statements are presented in Canadian dollars, which is the Bank’s functional currency. Except as otherwise indicated, financial information presented in Canadian dollars has been rounded to the nearest thousand.
(d) Use of estimates and judgement
The preparation of the consolidated financial statements in conformity with IFRS requires management to make judgements, estimates and assumptions that affect the application of accounting policies and the reported amounts of assets, liabilities, income and expenses. Actual results could materially differ from those estimates thereby impacting the consolidated financial statements. Management believes that the underlying assumptions are appropriate and that the Bank’s consolidated financial statements therefore present the financial position and results fairly.
Estimates and underlying assumptions are reviewed on an ongoing basis. Revisions to accounting estimates are recognized in the period in which the estimate is revised and in any future periods affected.
Accounting estimates and judgements which represent key sources of estimation uncertainty include the fair value, classification and impairment of financial assets, derecognized securitizations, goodwill impairment testing, litigation and other contingencies and measurement of hedging ineffectiveness.
Information about key estimates and critical judgements are described in Note 2.18.
2.2 Basis of Consolidation
The Bank conducts business through various corporate structures including subsidiaries and other investments. The consolidated financial statements include the Bank’s assets, liabilities and results of operations, after the elimination of intercompany transactions and balances, of all subsidiaries for which the Bank has concluded it controls. Control is achieved when the Bank has: (1) power over the investee; (2) exposure, or rights, to variable returns from its
NOTES TO CONSOLIDATED FINANCIAL STATEMENTS
For the Year Ended December 31
(In Thousands of Canadian Dollars Unless Otherwise Indicated)
Concentra – 2020 Consolidated Financial Statements Page 12
2. SUMMARY OF SIGNIFICANT ACCOUNTING POLICIES (continued)
involvement with the investee; and (3) the ability to use its power over the investee to affect the amount of the Bank’s returns. The Bank reassesses whether it controls an investee if facts and circumstances indicate that there are changes to one or more of these three elements of control.
Structured entities are entities that are created to accomplish a narrow and well-defined objective such as the securitization of particular assets or the execution of a specific borrowing or lending transaction. A structured entity is consolidated, if based on an evaluation of the substance of its relationship with the Bank and the structured entity’s
risks and rewards, the Bank concludes that it controls the entity. The Bank’s activities have not resulted in any circumstances that would require a structured entity to be consolidated within these consolidated financial statements.
The consolidated financial statements have been prepared using consistent accounting policies and valuation methods for like transactions and other events in similar circumstances.
The following entity is included in the consolidated financial statements of the Bank:
Concentra Trust – the Bank owns 100% of the common shares of Concentra Trust. As such, these consolidated
financial statements include the assets and liabilities and results of operations of this wholly owned subsidiary,
net of intercompany eliminations.
2.3 Financial Instruments
2.3.1 Recognition and Initial Measurement
The initial measurement of a financial instrument is at fair value plus transaction costs that are directly attributable to its purchase or issuance. For instruments measured at fair value through profit or loss, transaction costs are recognized immediately in profit or loss.
Regular-way purchases and sales of financial assets are recognized on the settlement date. All other financial assets and financial liabilities, including derivatives, are initially recognized on the trade date at which the Bank becomes a party to the contractual provisions of the instrument.
2.3.2 Classification and Subsequent Measurement
(a) Financial assets: debt instruments
Financial assets which meet the definition of debt, including loans and debt securities, are classified into one of
the following measurement categories:
• Amortized cost; • FVOCI; or • FVTPL
Debt instruments may be designated at FVTPL upon initial recognition if doing so eliminates or significantly reduces an accounting mismatch which would otherwise arise. For all other debt instruments, classification is determined based on an assessment of: (i) the business model under which the asset is held; and (ii) the contractual cash
flow characteristics of the instrument.
(i) Business model assessment
The business model assessment involves determining whether financial assets are managed in order to generate cash flows from collection of contractual cash flows, from the sale of the financial assets, or both. The Bank assesses business models at a portfolio level reflective of how groups of assets are managed together to achieve a particular business objective. For the assessment of business models the Bank takes into consideration the following factors:
• How the performance of assets in a portfolio is evaluated and reported to key decision makers within the Bank’s business lines;
• The risks that affect the performance of assets held within a business model and how those risks are managed;
• Whether the assets are held for trading purposes (i.e., assets that the Bank acquires or incurs principally for the purpose of selling or repurchasing in the near term, or holds as part of a portfolio that is managed together for short-term profit or position taking);
• How management compensation is determined for those responsible for managing the assets; and • The frequency, reason for sales, and volume of sales in prior periods and expectations about future sales
activity.

NOTES TO CONSOLIDATED FINANCIAL STATEMENTS
For the Year Ended December 31
(In Thousands of Canadian Dollars Unless Otherwise Indicated)
Concentra – 2020 Consolidated Financial Statements Page 13
2. SUMMARY OF SIGNIFICANT ACCOUNTING POLICIES (continued)
(ii) Cash flow characteristics assessment
The cash flow characteristics assessment involves assessing the contractual features of an instrument to determine if they give rise to cash flows that are consistent with a basic lending arrangement. Contractual cash flows are consistent with a basic lending arrangement if they represent cash flows that are solely payments of principal and interest (“SPPI”) on the principal amount outstanding.
Principal is defined as the fair value of the instrument at initial recognition. Principal may change over the life
of the instrument due to repayments.
Interest is defined as consideration for the time value of money and the credit risk associated with the principal amount outstanding and for liquidity risk and administrative costs, as well as a profit margin.
In performing this assessment, the Bank takes into consideration contractual features that could change the amount or timing of contractual cash flows, such that the cash flows are no longer consistent with a basic lending arrangement. If the Bank identifies any contractual features that could modify the cash flows of the
instrument such that they are no longer consistent with a basic lending arrangement, the related financial
asset is classified and measured at FVTPL.
Debt instruments measured at amortized cost
Debt instruments are measured at amortized cost if they are held within a business model whose objective is to hold for collection of contractual cash flows where those cash flows represent SPPI. After initial measurement, debt instruments in this category are carried at amortized cost using the effective interest rate method. The effective interest rate is the rate that discounts estimated future cash payments or receipts through the expected
life of the financial asset to the gross carrying amount of a financial asset. Amortized cost is calculated taking into account any discount or premium on acquisition, transaction costs and fees that are an integral part of the effective interest rate. Amortization of premiums, discounts and other transaction costs is included in interest income in the consolidated statement of income.
Impairment of debt instruments measured at amortized cost is calculated using the expected credit loss (“ECL”) approach. Debt instruments, including loans and securities are presented net of the related allowance for impairments on the consolidated balance sheet.
Debt instruments measured at FVOCI
Debt instruments are measured at FVOCI if they are held within a business model whose objective is to hold for collection of contractual cash flows and for selling financial assets, where the assets’ cash flows represent payments that are SPPI. Subsequent to initial recognition, unrealized gains and losses on debt instruments measured at FVOCI are recorded in other comprehensive income (“OCI”), unless the instrument is designated in a fair value hedge relationship. When designated in a fair value hedge relationship any changes in fair value due
to changes in the hedged risk are recognized in the consolidated statement of income. Premiums, discounts and related transaction costs are amortized over the expected life of the instrument to interest income in the consolidated statement of income using the effective interest rate method.
Impairment of debt instruments measured at FVOCI is calculated using the ECL approach. An allowance for credit losses is not recognized in the consolidated balance sheet for FVOCI debt instruments as the carrying value of these instruments is equal to fair value and therefore should not be reduced. Instead, an impairment reserve equal to the calculated allowance is recognized in OCI with a corresponding charge to net provision for credit
losses in the consolidated statement of income. Upon derecognition of a FVOCI debt instrument the accumulated unrealized fair value gains and losses, together with the impairment reserve, are recycled from accumulated other comprehensive income (“AOCI”) to the consolidated statement of income.
Debt instruments measured at FVTPL
Debt instruments measured at FVTPL include assets held for trading purposes, assets held as part of a portfolio managed on a fair value basis, assets whose cash flows do not represent payments that are SPPI, and assets which are designated as such at initial recognition. These instruments are measured at fair value in the
consolidated balance sheet, with transaction costs recognized immediately in the consolidated statement of income as part of gain on financial instruments in the consolidated statement of income. Realized and unrealized gains and losses are recognized as part of gain on financial instruments in the consolidated statement of income.

NOTES TO CONSOLIDATED FINANCIAL STATEMENTS
For the Year Ended December 31
(In Thousands of Canadian Dollars Unless Otherwise Indicated)
Concentra – 2020 Consolidated Financial Statements Page 14
2. SUMMARY OF SIGNIFICANT ACCOUNTING POLICIES (continued)
(b) Financial assets: equity instruments
Financial assets which meet the definition of equity are measured at FVTPL, unless an election is made to designate them at FVOCI upon purchase.
For equity instruments measured at FVTPL, changes in fair value are recognized as part of gain on financial instruments in the consolidated statement of income.
The Bank can elect to classify non-trading equity instruments at FVOCI. This election will be used for certain equity
investments for strategic or longer term investment purposes. The FVOCI election is made upon initial recognition, on an instrument-by-instrument basis and once made is irrevocable. Both realized and unrealized gains and losses on these instruments are recorded in OCI and are not subsequently reclassified to the consolidated statement of income. Dividends received are recorded in interest income in the consolidated statement of income. Any transaction costs incurred upon purchase of the security are added to the cost basis of the security and are not reclassified to the consolidated statement of income on sale of the security.
(c) Financial liabilities
Financial liabilities are classified as measured at amortized cost or FVTPL. A financial liability is classified as at FVTPL if it is classified as held-for-trading, it is a derivative or it is designated as such on initial recognition. Financial liabilities may be designated at FVTPL when one of the following criteria is met:
• The designation eliminates or significantly reduces an accounting mismatch which would otherwise arise; or • The financial liability contains one or more embedded derivatives which significantly modify the cash flows
otherwise required.
Financial liabilities at FVTPL are measured at fair value with changes in fair value being recognized in the consolidated statement of income. Other financial liabilities are measured at amortized cost using the effective interest method.
With the exception of its derivative financial instruments which are FVTPL, the Bank’s holdings in financial liabilities are classified as measured at amortized cost.
2.3.3 Derecognition
Financial assets are derecognized when the contractual rights to receive the cash flows from these assets have ceased to exist or when the Bank has transferred substantially all the risks and rewards of ownership of the assets.
Where substantially all of the risks and rewards of ownership of the financial asset are neither retained nor transferred, the Bank derecognizes the transferred asset only if it no longer controls the asset. Control is represented by the practical ability to sell the transferred asset without the need to impose additional restrictions. If the Bank retains control over the asset, it will continue to recognize the asset to the extent of its continuing involvement. When a financial asset is derecognized in full, a gain or loss is recognized in net income for an amount equal to the difference between the carrying amount of the asset and the value of the consideration
received, including any new assets and/or liabilities recognized.
Financial liabilities are derecognized when the associated obligation has been discharged, cancelled or otherwise extinguished.
2.3.4 Derivative Financial Instruments and Hedge Accounting
The Bank enters into derivative transactions to hedge interest rate and foreign currency risks, and for economic and asset/liability management purposes. The Bank also enters into derivative transactions on an intermediary basis on behalf of its clients. The Bank does not have a trading program for derivatives.
Derivative financial instruments are classified as FVTPL and measured at fair value in the consolidated balance sheet. Changes in fair value are included in the consolidated statement of income within gain on financial instruments unless they are designated in a qualifying hedge accounting relationship.
Hedge accounting may be applied where a derivative is highly effective in offsetting either changes in the fair value or cash flows attributable to the risk being hedged, both at inception and over the life of the underlying asset or liability. The hedging relationship is required to be documented at inception detailing the particular risk management objective and strategy for undertaking the hedge transaction. The Bank assesses, both at the
inception of the hedge and on an ongoing basis, whether the hedging instruments have been highly effective in offsetting changes in the fair value or cash flows of the hedged items.
NOTES TO CONSOLIDATED FINANCIAL STATEMENTS
For the Year Ended December 31
(In Thousands of Canadian Dollars Unless Otherwise Indicated)
Concentra – 2020 Consolidated Financial Statements Page 15
2. SUMMARY OF SIGNIFICANT ACCOUNTING POLICIES (continued)
Cash flow hedges
In a cash flow hedging relationship, the effective portion of the change in the fair value of the hedging derivative, net of income taxes, is recorded in OCI while the ineffective portion is recorded within gain on financial instruments in the consolidated statement of income. All components of each derivative’s change in fair value have been included in the assessment of cash flow hedge effectiveness. When a hedging instrument expires or is sold, or when a hedge no longer meets the criteria for hedge accounting, hedge accounting is discontinued and the
amounts previously recorded in OCI are reclassified to net interest income during the periods when the variability in the cash flows of the hedged item affects net interest income. When a forecast transaction is no longer expected to occur, the amounts previously recorded in OCI are immediately reclassified to the statement of income and are recorded in gain on financial instruments.
Fair value hedges
In a fair value hedging relationship, changes in the fair value of the hedging derivative are offset in the consolidated
statement of income by the change in the fair value attributable to the hedged risk component of the hedged item. If the hedging instrument expires or is sold, or when the hedge no longer meets the criteria for hedge accounting, hedge
accounting is discontinued prospectively.
2.3.5 Offsetting
Financial assets and liabilities are offset and the net amount reported in the consolidated balance sheet only when there is currently a legally enforceable right to offset the recognized amounts and there is an intention to settle on a net basis or realize the asset and settle the liability simultaneously.
2.4 Impairment
(a) Financial assets
The Bank establishes an allowance for credit losses for the following categories of financial assets that are not measured at FVTPL:
• Financial assets at amortized cost; • Financial assets at FVOCI (excluding equity instruments); • Undrawn lending commitments;
• Commercial leases; and • Financial guarantee contracts
Expected credit loss impairment model
The Bank uses an ECL methodology to measure impairment of its financial instruments. ECLs reflect the present value of all cash shortfalls related to default events which may occur over a specified period of time. Consequently, the Bank’s allowance for credit losses are outputs of models with a number of underlying assumptions regarding
the choice of variable inputs and their interdependencies. The allowances reflect an unbiased, probability-weighted outcome which considers multiple scenarios, based on reasonable and supportable forecasts.
The Bank’s ECL impairment model measures loss allowances using a three-stage approach based on the change in credit risk since origination:
• Stage 1 – Where there has not been a significant increase in credit risk (“SICR”) since initial recognition of a financial instrument, an amount equal to 12 month ECLs is recorded. The ECL is computed using a probability of default occurring over the next 12 months. For those instruments with a remaining maturity of less than
12 months, a probability of default corresponding to remaining term to maturity is used.
• Stage 2 – When a financial instrument experiences a SICR subsequent to origination but is not considered to be in default, it is included in Stage 2. This requires the computation of ECL based on the probability of default over the remaining estimated life of the financial instrument.
• Stage 3 – Financial instruments that are considered to be in default are included in this stage. Similar to Stage 2, the allowance for credit losses captures the lifetime ECLs.
Financial assets may migrate forward or backward through the three stages as their credit risk deteriorates or
improves. When measuring ECLs, the Bank considers the maximum contractual period over which it is exposed to credit risk (expected life). All contractual terms are considered when determining the expected life, including prepayment and extension or rollover options.

NOTES TO CONSOLIDATED FINANCIAL STATEMENTS
For the Year Ended December 31
(In Thousands of Canadian Dollars Unless Otherwise Indicated)
Concentra – 2020 Consolidated Financial Statements Page 16
2. SUMMARY OF SIGNIFICANT ACCOUNTING POLICIES (continued)
Model parameters
The following variables represent the key inputs in the Bank’s ECLs:
• Probability of Default (“PD”) – an estimate of the likelihood of default over a given time horizon. • Loss Given Default (“LGD”) – an estimate of the loss arising in the case where a default occurs at a given
time. It is based on the difference between the contractual cash flows due and those that the lender would expect to receive, including from the realization of any collateral. It is usually expressed as a percentage of
the exposure at default. • Exposure at Default (“EAD”) – an estimate of the exposure at a future default date, taking into account
expected changes in the exposure after the reporting date, including repayments of principal and interest, whether scheduled by contract or otherwise, and expected drawdowns on committed facilities.
These parameters are generally derived from internally developed statistical models utilizing the Bank’s own historical loss data by major asset class with the exception of PD and LGD for commercial mortgages/loans and
securities. Due to the limited number of historical losses within these portfolios, the Bank has mapped its internal risk ratings to external ratings and utilized both public and proprietary third party data to determine the
appropriate parameters by rating.
Significant increase in credit risk
At each reporting date, the Bank assesses whether there has been a significant increase in credit risk for exposures since initial recognition by comparing the risk of default occurring over the remaining expected life from the reporting date and the date of initial recognition. The assessment considers borrower-specific quantitative and
qualitative information with the impact of forward-looking macroeconomic factors.
The common assessments for SICR on retail and non-retail portfolios include macroeconomic outlook, management judgement, and delinquency and monitoring. Quantitative models may not always be able to capture all reasonable and supportable information that may indicate a significant increase in credit risk. Qualitative factors may be assessed to supplement the gap. Examples of situations include changes in adjudication criteria for a particular group of borrowers, changes in portfolio composition, and natural disasters impacting certain portfolios. With regards to delinquency and monitoring, there is a rebuttable presumption that the credit risk of the financial
instrument has increased significantly since initial recognition when contractual payments are more than 30 days overdue. The Bank currently does not rebut this presumption, except for financial instruments where short-term
payment deferral agreements have been signed by the borrower and the Bank in response to the COVID-19 pandemic. However, a financial instrument granted short-term payment deferral due to the COVID-19 pandemic, does not preclude its migration to Stage 2 if the Bank determined that there was a SICR based on the Bank’s assessment of the changes in the risk of a default occurring over the expected life of an instrument.
For retail and small commercial exposures, the Bank considers past delinquency history for individual loans as the primary indicator of SICR. Additionally, the Bank assesses SICR at the portfolio level using historical correlations between macroeconomic factors and past default rates within the portfolio.
For its other commercial exposures, the Bank uses its internal risk rating scale unless an external credit rating is available. All exposures have a risk rating assigned that reflects the PD of the borrower which are reviewed and updated at least annually. Significant increase in credit risk is evaluated based on the risk rating migration of the exposures with consideration of forward-looking macroeconomic factors.
Forward-looking information
The measurement of ECLs for each stage and the assessment of significant increases in credit risk considers information about past events and current conditions as well as reasonable and supportable forecasts of future
events and economic conditions. The estimation and application of forward-looking information (“FLI”) requires significant judgement.
In its models, the Bank relies on forward-looking macroeconomic factors, such as the Canadian equity index, unemployment rates, house price index and oil prices. Where available, the Bank will utilize geographic specific
macroeconomic factors. Due to a limited loss history, the Bank has relied upon industry norms and best practices to identify key drivers of credit risk and credit losses for each portfolio of financial instruments and has estimated relationships between macroeconomic variables, credit risk and credit losses.
The Bank considers multiple probability-weighted scenarios to estimate the impact of FLI upon ECLs. The Bank considers both internal and external sources of information in order to achieve an unbiased measure of the scenarios used. The Bank relies upon forecasts generated by an external vendor that specializes in economic
forecasting in both the Canadian and global markets. The external vendor provides multiple forecasted scenarios which are then assessed and probability-weighted by the Bank using judgement. In the selection of scenarios

NOTES TO CONSOLIDATED FINANCIAL STATEMENTS
For the Year Ended December 31
(In Thousands of Canadian Dollars Unless Otherwise Indicated)
Concentra – 2020 Consolidated Financial Statements Page 17
2. SUMMARY OF SIGNIFICANT ACCOUNTING POLICIES (continued)
used for modelling ECLs, the Bank considered both the unprecedented impact and significant uncertainty COVID-19 has had to current economic conditions, including the timing of economic recovery and associated uncertainty regarding re-opening of the Canadian economy.
The Bank has chosen four scenarios to apply, with the base scenario being most heavily weighted and considered the most likely outcome in the context of current economic conditions as at December 31, 2020. The alternative scenarios represent either more optimistic or pessimistic outcomes and were weighted less heavily relative to the
base scenario.
The following table represents the values of the macroeconomic variables over the next four calendar quarters and the remaining 4-year forecast period used in determining the Bank’s ECLs. As the forecast period increases, information about the future becomes less readily available and projections are anchored on assumptions around structural relationships between economic parameters that are inherently much less certain.
Macroeconomic Base Scenario Alternative Scenario 1 Alternative Scenario 2 Alternative Scenario 3
Variables Calendar Quarters Average Q1 2021
- Q4 2021
Remaining 4-year period
Average Q1 2021
- Q4 2021
Remaining 4-year period
Average Q1 2021
– Q4 2021
Remaining 4-year period
Average Q1 2021
– Q4 2021
Remaining 4-year period
Q1 2021
Q2 2021
Q3 2021
Q4 2021
Canadian equity index
16,880 16,936 17,050 17,182 17,012 17,897 18,618 19,658 14,771 16,701 12,747 15,430
West Texas Intermediate oil price ($USD)
40.16 42.11 46.24 50.22 44.68 59.96 49.26 65.76 36.47 57.02 28.21 41.19
Canadian unemployment rate (%)
8.3 8.2 8.1 7.9 8.1 7.0 7.3 6.3 8.6 7.7 10.6 9.1
House price index (% change)
1.11 1.38 0.53 (0.47) 0.64 6.07 1.17 9.09 0.33 5.36 (1.56) 7.10
Presentation of allowance for credit losses
The Bank presents its allowance for credit losses in the consolidated financial statements as follows:
• For financial assets measured at amortized cost and commercial leases, as a deduction from the gross carrying amount;
• For debt instruments measured at FVOCI, no allowance is recognized in the consolidated balance sheet because the carrying value of these assets is their fair value. However, the amount of impairment that would otherwise have been recognized had the instrument been measured at amortized cost is recognized in OCI
with a corresponding charge to the net provision for credit losses in the consolidated statement of income;
and • For undrawn lending commitments, as a provision in other liabilities.
Modified financial assets
If the terms of a financial asset are modified or an existing financial asset is replaced with a new one, an assessment is made to determine if the financial asset should be derecognized. Where the modification does not
result in derecognition, the date of origination continues to be used to determine SICR. Where modification results in derecognition, the original asset is derecognized and the new asset is recognized at its fair value. The difference between the carrying value of the derecognized asset and the fair value of the new asset is recognized as a gain or loss in the income statement.
Definition of Default
The Bank considers a financial instrument to be in default (Stage 3) as a result of one or more loss events that occurred after the date of initial recognition of the instrument and the loss event has a negative impact on the
estimated future cash flows of the instrument that can be reliably estimated. This includes events that indicate:
• Significant financial difficulty of the borrower, • High probability of the borrower entering a phase of bankruptcy or a financial reorganization, or • Measurable decrease in the estimated future cash flows from the loan or value of the underlying collateral.
In addition to these observable indicators, there is a rebuttable presumption that default does not occur later than when a financial asset is 90 days past due. The Bank does not currently rebut this presumption, except for certain insured loans where, due to the strength of the underlying credit enhancement, it is reasonably certain that
collection efforts will result in a full recovery of the defaulted loan. Loans where short-term payment deferral agreements have been signed by the borrower and the Bank in response to the COVID-19 pandemic do not trigger a rebuttable presumption of default.
Write-off policy
The Bank writes off an impaired financial asset (and the related impairment allowance), either partially or in full, when there is no realistic prospect of recovery. Where financial assets are secured, write-off is generally after

NOTES TO CONSOLIDATED FINANCIAL STATEMENTS
For the Year Ended December 31
(In Thousands of Canadian Dollars Unless Otherwise Indicated)
Concentra – 2020 Consolidated Financial Statements Page 18
2. SUMMARY OF SIGNIFICANT ACCOUNTING POLICIES (continued)
receipt of any proceeds from the realization of security. In circumstances where the net realizable value of any collateral has been determined and there is no reasonable expectation of further recovery, write-off may occur earlier. In subsequent periods, any recoveries of amounts previously written off are credited to the net provision for credit losses in the consolidated statement of income.
(b) Property held for resale
Property held for resale acquired through the settlement of loans is valued at the lower of the outstanding balance
of the loan at the date of acquisition adjusted for costs incurred subsequent to foreclosure or repossession and the fair value of the property less costs of disposal. Property held for resale is sold as soon as practicable, with the proceeds used to reduce the outstanding net carrying value. Property held for resale is recorded in the consolidated balance sheet within residential mortgages.
(c) Financial guarantees
Certain loan assets are secured by limited financial guarantees issued by third parties unrelated to the underlying
borrower. When the financial guarantee forms an integral part of the loan asset, the contract is not recognized
separately and instead the value of the guarantee is considered when determining the allowance for credit losses for the related loan. When the financial guarantee does not form an integral part of the loan asset, it is recognized separately as a reimbursement asset equal to the lesser of: (1) the difference between the impaired carrying value of the loan and what the carrying value would be if impairment had not occurred; and (2) the maximum amount of the financial guarantee. Recoveries from financial guarantees are recorded within provision for credit losses in the consolidated statement of income to offset the associated impairment loss. Reimbursement assets are included in
other assets as an accounts receivable.
The Bank has not issued any financial guarantee contracts with the exception of limited guarantees related to assets that did not qualify for derecognition as described in Note 4.1.2.
(d) Non-financial assets
At each reporting date, the Bank reviews its non-financial assets (other than deferred income tax assets) to determine whether there are any indicators of impairment. If such indicators exist, an impairment test is performed to compare the carrying value of the assets to their recoverable amount. Goodwill is tested for impairment annually regardless of
whether an impairment indicator exists.
For impairment testing, assets are grouped together into the smallest possible group (“cash-generating unit”) that generates cash inflows from the continuing use of the assets that are largely independent of the cash inflows of other assets or cash-generating units. Goodwill arising from a business combination is allocated to the cash-generating unit or groups of cash-generating units that are expected to benefit from the synergies of the combination.
The recoverable amount is then determined as the greater of the present value of the cash flows expected to be
generated by an asset/cash-generating unit (“value-in-use”) or the fair value less costs of disposal, if determinable.
If the carrying value of an asset/cash-generating unit exceeds the recoverable amount, an impairment loss equal to the difference is recognized in the consolidated statement of income. Impairment losses on goodwill are never reversed. For other non-financial assets, an impairment loss may be reversed in subsequent periods only to the extent that the asset’s carrying value does not exceed what it would have been, net of amortization, had no impairment loss occurred.
2.5 Fair Value Measurement
Fair value is the price that would be received to sell an asset or paid to transfer a liability in an orderly transaction in the principal (or most advantageous) market at the measurement date under current market conditions (i.e.
an exit price) regardless of whether that price is directly observable or estimated using another valuation technique.
The Bank follows a fair value hierarchy to categorize the inputs used to measure fair value. The fair value hierarchy gives the highest priority to quoted prices (unadjusted) in active markets for identical assets or liabilities (Level 1) and the lowest priority to unobservable inputs (Level 3). Valuation techniques used to measure fair value
maximize the use of relevant observable inputs and minimize the use of unobservable inputs. The objective of using a valuation technique is to estimate the price at which an orderly transaction to sell the asset or to transfer the liability would take place between market participants at the measurement date under current market conditions. Fair values are determined by reference to quoted bid or asking prices, as appropriate, in the principal market or most advantageous market for that asset or liability to which the Bank has immediate access (Level 1).
Level 2 inputs are inputs other than quoted prices included within Level 1 that are observable for the asset or
liability, either directly or indirectly. Level 2 inputs include the following: (a) quoted prices for similar assets or

NOTES TO CONSOLIDATED FINANCIAL STATEMENTS
For the Year Ended December 31
(In Thousands of Canadian Dollars Unless Otherwise Indicated)
Concentra – 2020 Consolidated Financial Statements Page 19
2. SUMMARY OF SIGNIFICANT ACCOUNTING POLICIES (continued)
liabilities in active markets; (b) quoted prices for identical or similar assets or liabilities in markets that are not active; (c) inputs other than quoted prices that are observable for the asset or liability such as interest rates and yield curves observable at commonly quoted intervals, implied volatilities and credit spreads; and (d) market-corroborated inputs.
Fair values determined using valuation models require the use of assumptions concerning the amount and timing of estimated future cash flows and discount rates. In determining those assumptions, the Bank looks primarily to
external readily observable market inputs including factors such as interest rate yield curves, currency rates, and price and rate volatilities, as applicable (Level 2). In certain circumstances, the Bank uses one or more input parameters that are not based on observable market data or uses observable inputs that require significant adjustment based on unobservable inputs (Level 3). The impact on net income of valuations reflecting non-market observable inputs (Level 3 valuations) is disclosed in Note 19. The Bank believes that using possible alternative assumptions will not result in significantly different fair values.
The credit quality of financial assets and financial liabilities, including derivative instruments, is considered in determining the fair value of these instruments. In determining the credit quality of the instrument both the Bank’s own credit risk and the risk of the counterparty are considered elements of this credit quality.
The output of a model is always an estimate or approximation of a value that cannot be determined with certainty, and valuation techniques employed may not fully reflect all factors relevant to the positions the Bank holds. Valuations are therefore adjusted, where appropriate, to allow for additional factors including model risks, liquidity risk and counterparty credit risk.
2.6 Interest Income and Expense
Interest for all interest-bearing financial assets and liabilities is recognized within interest income and interest expense respectively in the consolidated statement of income. Transaction costs and premiums/discounts incurred in the acquisition of financial assets or issuance of financial liabilities are amortized to interest income or expense using the effective interest method. Dividends on equity instruments are recognized in the consolidated statement of income in securities interest income when the Bank’s right to receive payment is established.
Once a financial asset or a group of similar financial assets has been written down as a result of an impairment loss,
interest income is recognized at the rate of interest used to discount the future cash flows for the purpose of measuring the impairment loss.
2.7 Revenue from Contracts with Customers
Revenue is measured based on the consideration specified in a contract with a customer and excludes amounts collected on behalf of third parties. The Bank recognises revenue when it transfers control over a product or service to a customer.
Incremental costs of obtaining a contract are recognized in net income on a basis consistent with the transfer of control of the related product or service. The Bank utilizes a practical expedient and expenses these costs as they are incurred when the expected recognition period is one year or less.
The following is a description of the principal activities, by reporting segment, from which the Bank generates revenue including the nature of performance obligations, the timing of when these obligations are satisfied and significant payment terms:
(a) Commercial and Retail Banking
The Commercial and Retail Banking segment primarily generates revenue through its syndication and asset/liability servicing, professional services and banking services:
Syndication and servicing fees – represents fees earned by the Bank from syndication activities and ongoing asset/liability administration and servicing. Syndication fees are paid upon funding of the asset and recognized as revenue when the Bank transfers control of the syndicated interest to the co-owner. Servicing fees are paid monthly and are recognized as the related services are performed.
Professional fees – represents financial management consulting and other support services which the Bank
provides to its parent SaskCentral (Note 20) and other commercial clients. Revenue is recognized as the services are performed. Fees are billed and paid at the same frequency at which the services are provided.
Banking fees – consists of fees paid by loan and deposit customers for specific banking services. Certain services are ad-hoc in nature with payment and revenue recognition occurring upon completion of the requested task (e.g. account transfer fees). Other fees are provided on an ongoing basis (e.g. standby fees) and are recognized at the same time the services are delivered. Ongoing fees are typically billed and paid at the same frequency that the
services are provided.

NOTES TO CONSOLIDATED FINANCIAL STATEMENTS
For the Year Ended December 31
(In Thousands of Canadian Dollars Unless Otherwise Indicated)
Concentra – 2020 Consolidated Financial Statements Page 20
2. SUMMARY OF SIGNIFICANT ACCOUNTING POLICIES (continued)
(b) Trust
The Trust segment, a wholly owned subsidiary of the Bank, generates revenue through acting as trustee for personal/corporate trust arrangements and providing estate and registered plan related services:
Registered plan fees – primarily consists of fees paid to the Bank to act as trustee for a registered plan program. These trusteeships often cover an indefinite term. The Bank typically charges an upfront fee which is recognized as revenue upon establishment of the legal trust structure for the registered plan. Thereafter a recurring fee is charged
monthly, quarterly or annually to compensate the Bank for continuing to act as trustee and provide the necessary support services to the registered plan program. Revenue is recognized monthly as the related services are performed.
Trust fees – primarily consists of fees paid to the Bank to act as trustee for a custodianship, escrow or other personal/corporate trust arrangement. These arrangements often cover an indefinite term. The Bank typically charges an upfront fee which is recognized as revenue upon establishment of the legal trust structure. Thereafter
a recurring fee is charged quarterly or annually to compensate the Bank for continuing to act as trustee and provide the necessary support services to the trust. Revenue is recognized monthly as the related services are performed.
Estate fees – represents fees earned by the Bank for administering estates either as an executor/administrator or through the provision of specific services to a third party executor/administrator. When the Bank has been appointed as the executor/administrator, revenue is recognized when the estate is settled and control of the estate assets have transferred to the beneficiaries. At this point, the Bank is entitled to deduct its fee from the estate. When the Bank provides specified services to a third party executor/administrator, revenue is recognized as the related
services are performed. Billing and payment occurs upon completion of the agreed upon services.
2.8 Leases
The Bank classifies a contract, or component of a contract, as a lease if it conveys a right to control the use of an identifiable asset for a period of time in exchange for consideration.
(a) As lessee
With the exception of certain short-term and low-value leases, the Bank recognizes a right-of-use asset and lease liability for all leases at commencement.
Lease liabilities are initially measured at the present value of the lease payments due over the term of the lease, discounted using the interest rate implicit in the lease or, if that rate cannot be readily determined, at the Bank’s incremental borrowing rate. Lease payments included in the measurement of the lease liability include fixed contractual payments, variable contractual payments based upon a rate or index and any amounts payable with respect to purchase, extension and/or termination options when it is reasonably certain that the Bank will exercise the option. Subsequent to initial recognition, lease liabilities are measured at amortized cost using the effective
interest method.
Right-of-use assets are initially measured at cost, which comprises the initial amount of the lease liability plus initial direct costs and estimated decommissioning costs, less any lease incentives received. Right-of-use assets are subsequently amortized on a straight-line basis over the term of the lease or the estimated useful life of the asset, whichever is shorter. Right-of-use assets are recognized as part of the Bank’s premises and equipment within other assets on the consolidated balance sheet, while lease liabilities are included in other liabilities.
(b) As lessor
At inception, the Bank classifies a lease which transfers substantially all of the risks and rewards incidental to ownership of the underlying asset as a finance lease. All other leases are classified as operating leases.
When assets are held subject to a finance lease, the Bank recognizes a finance lease asset included in loans receivable in the consolidated balance sheet representing its net investment in the lease. Interest income is recognized over the term of the lease using the implicit interest rate, which reflects a constant rate of return.
For operating leases, the Bank recognizes lease payments received as income on a straight-line basis over the term of the lease.
NOTES TO CONSOLIDATED FINANCIAL STATEMENTS
For the Year Ended December 31
(In Thousands of Canadian Dollars Unless Otherwise Indicated)
Concentra – 2020 Consolidated Financial Statements Page 21
2. SUMMARY OF SIGNIFICANT ACCOUNTING POLICIES (continued)
2.9 Premises, Equipment and Other Intangible Assets
Premises and equipment are measured at cost less accumulated amortization and accumulated impairment losses. As no finite useful life for land can be determined, its carrying amount is not amortized. Buildings, building components, building improvements and equipment are carried at acquisition cost less subsequent amortization and impairment losses.
Amortization is recognized on a straight-line basis over the estimated useful life of the item of premises or
equipment. The applicable amortization periods are as follows:
Buildings 40 years Building components 20 years Building improvements 5 years Equipment 3 – 10 years
Amortization methods, residual values and estimates of useful lives are reassessed at each financial year end and
adjusted if appropriate.
Other intangible assets consist of acquired and internally developed software. Other intangible assets are carried at cost less accumulated amortization and accumulated impairment losses. The useful lives of intangible assets are assessed to be finite. Amortization is recognized on a straight-line basis over their estimated useful lives of 3 – 10 years.
2.10 Goodwill
Goodwill represents the excess of the purchase price over the fair value of the Bank’s share of the net identifiable
assets acquired in business combinations. The Bank’s goodwill is fully attributable to the Commercial and Retail Banking segment.
2.11 Income Taxes
Income tax expense comprises current and deferred tax. Current income tax and deferred income tax are recognized in net income except to the extent that it relates to items recognized directly in equity or in OCI. In these cases, the tax impact is also charged directly to equity or OCI.
(a) Current income tax
Current income tax is calculated for taxable earnings on the basis of the applicable tax law in the respective jurisdictions in the current year.
(b) Deferred income tax
Deferred income tax is provided in full, using the liability method, on temporary differences arising between the tax bases of assets and liabilities and their carrying amounts in the consolidated financial statements. Deferred income tax is determined using tax rates (and laws) that have been enacted or substantively enacted by the date
of the consolidated balance sheet and are expected to apply when the related deferred income tax asset is realized or the deferred income tax liability is settled.
The principal temporary differences arise from lease receivables, allowances for credit losses, amortization of premises and equipment, accrued expenses, the effective interest method, and carry-forward amounts.
A deferred income tax asset is recognized for unused tax losses, tax credits and deductible temporary differences to the extent that it is probable that future taxable profits will be available against which they can be utilized. Deferred income tax assets are reviewed at each reporting date and are reduced to the extent that it is no longer
probable that the related tax benefit will be realized.
2.12 Employee Benefits
(a) Pension benefits
The Bank has a defined contribution pension plan which is a post-employment benefit plan under which the Bank pays fixed contributions into a separate entity. The Bank has no legal or constructive obligation to the plan beyond the payment of these contributions.
The contributions are recognized as employee benefit expense when they are due in respect of service rendered
before the end of the reporting period. Prepaid contributions are recognized as an asset to the extent that a cash refund or a reduction in the future payments is available. Contributions to a defined contribution plan that are due more than 12 months after the end of the reporting period in which the employees rendered the service are discounted to their present value at the reporting date.
NOTES TO CONSOLIDATED FINANCIAL STATEMENTS
For the Year Ended December 31
(In Thousands of Canadian Dollars Unless Otherwise Indicated)
Concentra – 2020 Consolidated Financial Statements Page 22
2. SUMMARY OF SIGNIFICANT ACCOUNTING POLICIES (continued)
(b) Termination benefits
Termination benefits are employee benefits provided when employment is terminated by the Bank before the normal retirement date, or whenever an employee accepts an offer of benefits in exchange for the termination of employment. The Bank recognizes termination benefits at the earlier of the date when the Bank can no longer withdraw the offer of those benefits and the date the Bank recognizes costs for a restructuring provision which involves the payment of termination benefits. Benefits falling due more than 12 months after the date of the
consolidated balance sheet are discounted to present value.
2.13 Provisions
A provision is recognized if, as a result of a past event, the Bank has a present legal or constructive obligation that can be estimated reliably, and it is probable that an outflow of economic benefits will be required to settle the obligation.
2.14 Segment Reporting
Operating segments are reported in a manner consistent with the internal reporting provided to the chief
operating decision-maker. The chief operating decision-maker is the person or group that allocates resources to and assesses the performance of the operating segments of an entity. The Bank has identified its executive leadership team as the chief operating decision-maker.
All transactions between business segments are conducted on an arm’s length basis, with intra-segment revenue and costs being eliminated. Income and expenses directly associated with each segment are included in determining business segment performance.
The Bank has two primary lines of business: (1) Commercial and Retail Banking; and (2) Trust. The Commercial and Retail Banking segment includes residential mortgages, consumer loans, commercial lending, and equipment financing/leasing activities. Additionally the Commercial and Retail Banking segment accepts retail and corporate deposits, and provides consulting and treasury services. The Trust segment consists of personal, corporate, and registered plans trust products and services delivered through a wholly owned subsidiary of the Bank.
The Trust segment before the elimination of intercompany transactions and balances has total revenue of $10,231 (2019 - $10,485), net income of $955 (2019 - $854) and total assets of $18,400 (2019 - $18,888). The Trust
segment does not meet the quantitative thresholds to require separate disclosure.
2.15 Assets Under Administration
Assets administered by the Bank on behalf of its clients are recorded separately from the Bank’s assets and are not included on the consolidated balance sheet.
2.16 Comparatives
Except when a standard or interpretation permits or requires otherwise, all amounts are reported or disclosed
with comparative information. Where retrospective application or restatement applies, comparative figures have been adjusted to conform to the changes in presentation in the current year.
2.17 Standards, Amendments and Interpretations Issued But Not Yet Adopted
The following standards, amendments and interpretations have been issued by IASB and the following changes may have an impact on the Bank’s future financial statements.
Interest rate benchmark reform In August 2020, the IASB finalized its Phase 2 response to the ongoing Inter-bank Offered Rate (“IBOR”) and
other interest rate benchmark reform by issuing a package of amendments to IFRS standards which focus on accounting and disclosure matters that will arise once an existing benchmark rate is replaced with an alternative benchmark rate. The amendments provide practical expedients if contract modifications result directly from IBOR reform and occur on an economic equivalent basis. In these cases, changes may be accounted for by updating the effective interest rate. Further, existing hedging relationships are not required to be discontinued if changes in hedge documentation are required solely by IBOR reform. The amendments are effective for the Bank’s fiscal year beginning January 1, 2021 with early adoption permitted. The Bank is currently assessing the impact and
extent of disclosure requirements.
2.18 Critical Accounting Estimates and Judgements
The Bank’s financial statements are influenced by accounting policies, assumptions, material estimates and management judgement which necessarily have to be made in the course of preparation of these consolidated financial statements. The Bank makes estimates and assumptions that affect the reported amounts of assets and liabilities within the next financial year. All estimates and assumptions required in conformity with IFRS are best

NOTES TO CONSOLIDATED FINANCIAL STATEMENTS
For the Year Ended December 31
(In Thousands of Canadian Dollars Unless Otherwise Indicated)
Concentra – 2020 Consolidated Financial Statements Page 23
2. SUMMARY OF SIGNIFICANT ACCOUNTING POLICIES (continued)
estimates undertaken in accordance with the applicable standard. Estimates and judgements are evaluated on a continuous basis, and are based on past experience and other factors, including expectations with regard to future events. Accounting policies and management’s judgements for certain items are especially critical for the Bank’s results and financial position due to their materiality. Information regarding certain critical accounting estimates and judgements impacted by the COVID-19 pandemic are described in Note 21.
The following accounting estimates and judgements represent key sources of estimation uncertainty to the financial
statements:
• Fair value of financial instruments – determining the appropriate credit risk adjustments and interest rates for discounting expected future cash flows of financial instruments measured at fair value.
• Derecognized securitizations – assessing whether substantially all of the risks and rewards have been transferred and/or whether the Bank continues to control the transferred assets.
• Non-financial asset impairment testing – determining the appropriate discount rate and forecasting cash flows
used to determine the recoverable amount of a cash-generating unit. • Litigation and other contingencies – determining the probability of a loss arising and reliably estimating the
expenditure required to settle current and pending claims.
• Classification of financial assets – assessment of the business model within which assets are held and assessment of whether the contractual cash flows are SPPI.
• Impairment of financial assets – determining inputs into the ECL model (PD/LGD/EAD), determining when there has been a SICR, and the incorporation of forward-looking financial information into the impairment model
(including the selection and forecast of macroeconomic variables).
3. SECURITIES
The Bank’s debt securities are held within two distinct portfolios. The corporate portfolio consists of debt securities with a variety of terms and conditions held for liquidity management and yield purposes. The securitized portfolio consists of qualified debt securities held in segregated reinvestment accounts to satisfy obligations under certain securitization programs (see Note 4.1.2). The Bank also holds portfolios of equity and corporate debt securities representing longer-term, strategic investments which are measured at FVTPL.
Government securities are comprised of debt securities issued or guaranteed by Canadian federal and provincial governments. Corporate securities are comprised primarily of commercial paper and medium term notes. Asset-backed debt securities are comprised primarily of short-term paper backed by specifically pledged assets.
The maturity dates, fair value, and weighted average effective interest rates for the securities portfolio are as follows:
2020
Effective
Rate
Within
3 Months
Over
3 Months
to 1 Year
Over
1 Year
to 5 Years
Over
5 Years
No Fixed
Maturity
Total
Securities at FVOCI
Corporate Portfolio
Government
Federal 0.78% $ 5,200 $ 30,225 $ 269,528 $ - $ - $ 304,953
Provincial 1.25% - 95,811 168,103 - - 263,914
Corporate 1.50% 25,263 64,851 119,897 11,338 - 221,349
Asset-backed 0.27% 141,857 - - - - 141,857
Securitized Portfolio
Government
Federal 1.13% 124,992 103,040 65,159 - - 293,191
$ 297,312 $ 293,927 $ 622,687 $ 11,338 $ - $ 1,225,264
Accrued interest 2,977
Total securities at FVOCI $ 1,228,241
Securities at FVTPL
Equities - - - - 5,384 56,186 61,570
Corporate debt - - - 4,450 - - 4,450
$ 1,294,261
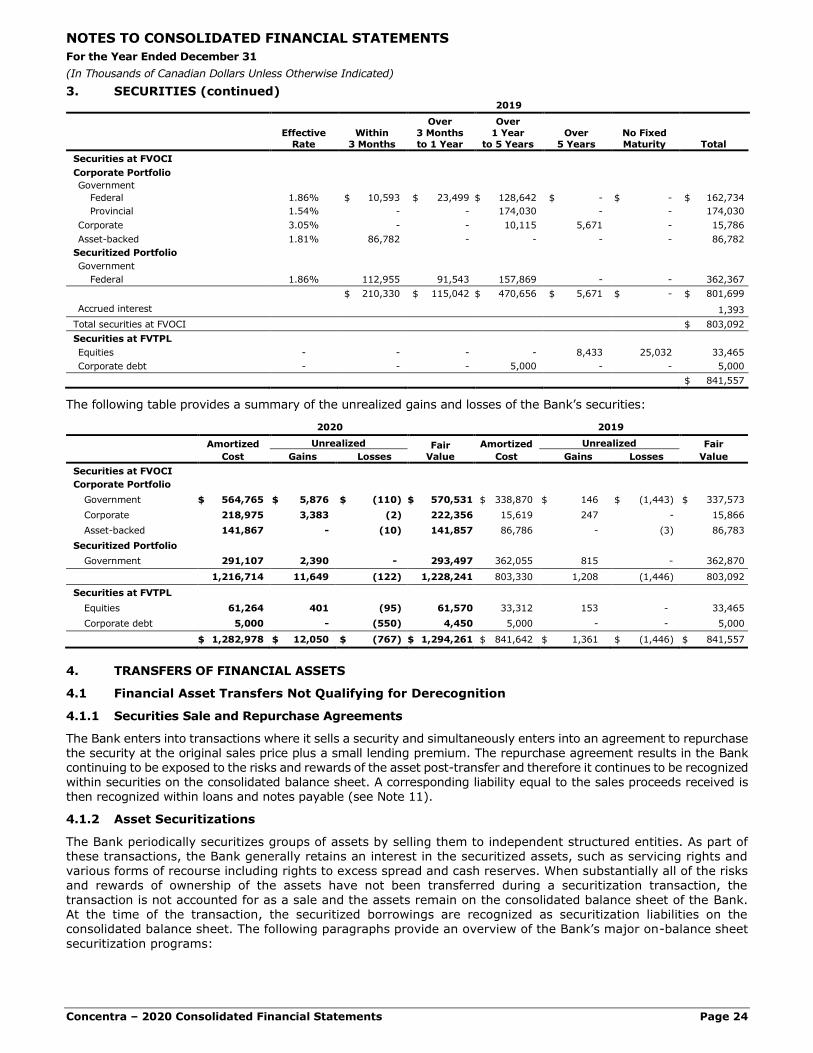
NOTES TO CONSOLIDATED FINANCIAL STATEMENTS
For the Year Ended December 31
(In Thousands of Canadian Dollars Unless Otherwise Indicated)
Concentra – 2020 Consolidated Financial Statements Page 24
3. SECURITIES (continued) 2019
Effective
Rate
Within
3 Months
Over
3 Months
to 1 Year
Over
1 Year
to 5 Years
Over
5 Years
No Fixed
Maturity
Total
Securities at FVOCI
Corporate Portfolio
Government
Federal 1.86% $ 10,593 $ 23,499 $ 128,642 $ - $ - $ 162,734
Provincial 1.54% - - 174,030 - - 174,030
Corporate 3.05% - - 10,115 5,671 - 15,786
Asset-backed 1.81% 86,782 - - - - 86,782
Securitized Portfolio
Government
Federal 1.86% 112,955 91,543 157,869 - - 362,367
$ 210,330 $ 115,042 $ 470,656 $ 5,671 $ - $ 801,699
Accrued interest 1,393
Total securities at FVOCI $ 803,092
Securities at FVTPL
Equities - - - - 8,433 25,032 33,465
Corporate debt - - - 5,000 - - 5,000
$ 841,557
The following table provides a summary of the unrealized gains and losses of the Bank’s securities:
2020 2019
Amortized
Cost
Unrealized Fair
Value
Amortized
Cost
Unrealized Fair
Value Gains Losses Gains Losses
Securities at FVOCI
Corporate Portfolio
Government $ 564,765 $ 5,876 $ (110) $ 570,531 $ 338,870 $ 146 $ (1,443) $ 337,573
Corporate 218,975 3,383 (2) 222,356 15,619 247 - 15,866
Asset-backed 141,867 - (10) 141,857 86,786 - (3) 86,783
Securitized Portfolio
Government 291,107 2,390 - 293,497 362,055 815 - 362,870
1,216,714 11,649 (122) 1,228,241 803,330 1,208 (1,446) 803,092
Securities at FVTPL
Equities 61,264 401 (95) 61,570 33,312 153 - 33,465
Corporate debt 5,000 - (550) 4,450 5,000 - - 5,000
$ 1,282,978 $ 12,050 $ (767) $ 1,294,261 $ 841,642 $ 1,361 $ (1,446) $ 841,557
4. TRANSFERS OF FINANCIAL ASSETS
4.1 Financial Asset Transfers Not Qualifying for Derecognition
4.1.1 Securities Sale and Repurchase Agreements
The Bank enters into transactions where it sells a security and simultaneously enters into an agreement to repurchase the security at the original sales price plus a small lending premium. The repurchase agreement results in the Bank continuing to be exposed to the risks and rewards of the asset post-transfer and therefore it continues to be recognized within securities on the consolidated balance sheet. A corresponding liability equal to the sales proceeds received is
then recognized within loans and notes payable (see Note 11).
4.1.2 Asset Securitizations
The Bank periodically securitizes groups of assets by selling them to independent structured entities. As part of these transactions, the Bank generally retains an interest in the securitized assets, such as servicing rights and various forms of recourse including rights to excess spread and cash reserves. When substantially all of the risks and rewards of ownership of the assets have not been transferred during a securitization transaction, the transaction is not accounted for as a sale and the assets remain on the consolidated balance sheet of the Bank. At the time of the transaction, the securitized borrowings are recognized as securitization liabilities on the consolidated balance sheet. The following paragraphs provide an overview of the Bank’s major on-balance sheet
securitization programs:

NOTES TO CONSOLIDATED FINANCIAL STATEMENTS
For the Year Ended December 31
(In Thousands of Canadian Dollars Unless Otherwise Indicated)
Concentra – 2020 Consolidated Financial Statements Page 25
4. TRANSFERS OF FINANCIAL ASSETS (continued)
National Housing Act Mortgage-Backed Securities and Canada Mortgage Bond programs
The Bank participates in the Canada Mortgage and Housing Corporation (“CMHC”) sponsored National Housing Act Mortgage-Backed Securities (“NHA MBS”) program where the Bank assigns all legal rights, interest and title in certain insured residential mortgages to CMHC in exchange for NHA MBS certificates. As the Bank continues to be exposed to substantially all of the risks and rewards of ownership of the original mortgages, the Bank has
determined that the assignment of the mortgages does not constitute a transfer. Therefore, the Bank continues to recognize the assets as loans within residential mortgages on the consolidated balance sheet.
Subsequently the Bank may sell its NHA MBS certificates to third parties or under the Canada Mortgage Bond (“CMB”) program to Canada Housing Trust (“CHT”), a CMHC sponsored trust. The securitized mortgages are subject to prepayment, in full or in part, and thus the future cash flows related to the transferred assets are uncertain including the amount of prepayment penalties paid by the borrower. The Bank remains exposed to this variability through the difference between the return on the insured residential mortgages and the interest and
indemnities paid on the related NHA MBS certificates (retained interest). As a result, the sale of the NHA MBS certificates does not transfer substantially all of the risks and rewards of ownership and the underlying mortgages continue to be recognized in the consolidated balance sheet with matching securitization liabilities being
established based on the proceeds received on the date of the transfer.
As part of a CMB transaction, the Bank may enter into a total return swap with highly rated counterparties, exchanging the cash flows of the CMB for those of the NHA MBS certificates transferred to CHT. Any excess or shortfall in these cash flows is absorbed by the Bank. The total return swaps are not recognized at fair value in
the Bank’s consolidated balance sheet as the risks and rewards of these derivatives are captured through the continued recognition of the mortgages and the associated securitization liabilities. Accordingly, the total return swaps are recognized on an accrual basis and are not fair valued through the consolidated statement of income.
Securitization obligations under the CMB program where the Bank has entered into a total return swap are non-amortizing liabilities with fixed maturity dates. Principal payments collected from the mortgages underlying the securitized NHA MBS certificates are transferred to CHT on a monthly basis where they are held and invested in eligible securities until the maturity of the CMB. To the extent that these eligible securities are not the Bank’s own
issued NHA MBS certificates, the investments are recognized on the Bank’s consolidated balance sheet within securities.
In the case of NHA MBS certificates sold to third parties, including sales to CHT under the CMB program where
the Bank has not entered into a total return swap, as scheduled and unscheduled payments are received, the cash flows are ultimately transferred to the holders of the NHA MBS certificates and the securitization liabilities are reduced accordingly.
Multi-Seller Conduit
The Bank sells non-insured residential mortgage loans to an intermediate multi-seller structured entity established for the limited purpose of securitization activities. The intermediate multi-seller structured entity funds such purchases through the issuance of interest bearing notes. Although the Bank has transferred all legal right, title and interest in the mortgages to the structured entity, the Bank also provides a limited financial guarantee in the form of a cash reserve. Through this credit enhancement, the Bank retains substantially all of the risks and rewards of the transferred assets and consequently the mortgage loans do not qualify for derecognition. The
structured entity has no recourse to the other assets of the Bank in the event of failure of debtors to pay when due. The proceeds received from the sale of the mortgage loans are recorded as a securitization liability on the consolidated balance sheet.
Securitized assets not qualifying for derecognition and associated securitization liabilities
The following table presents the carrying value and fair value of the financial assets transferred by the Bank under these programs that have not been derecognized and the related securitization obligations recognized on the consolidated balance sheet:
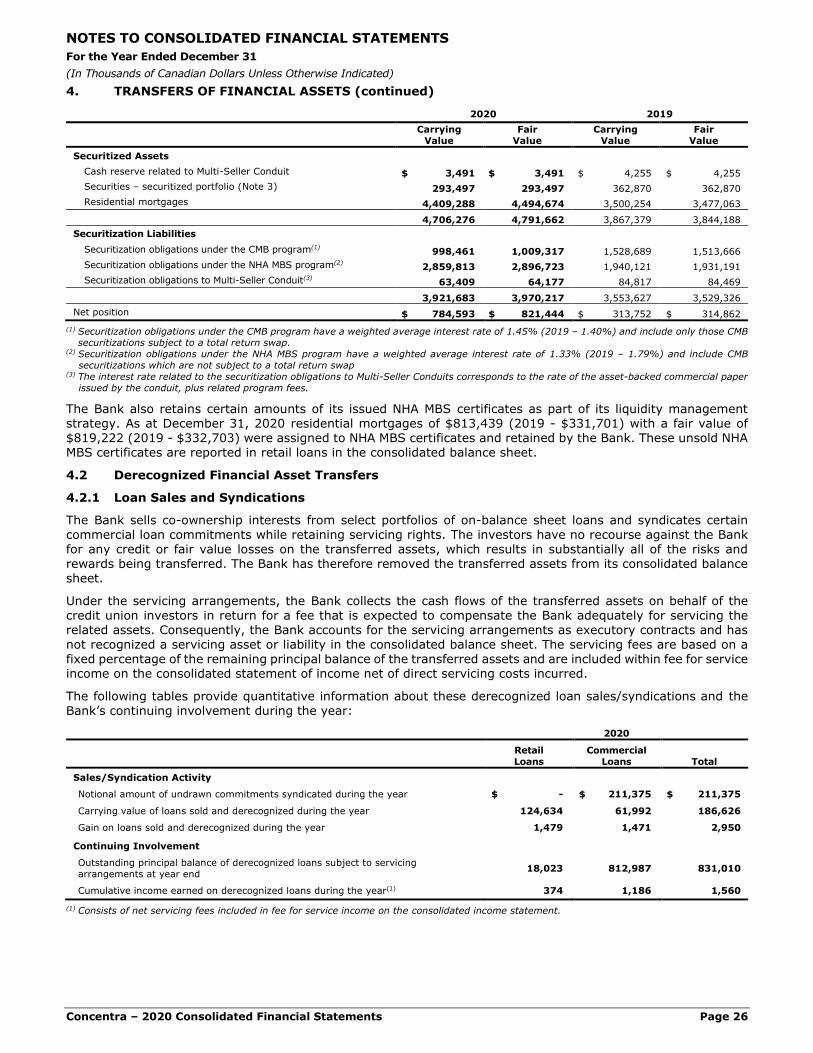
NOTES TO CONSOLIDATED FINANCIAL STATEMENTS
For the Year Ended December 31
(In Thousands of Canadian Dollars Unless Otherwise Indicated)
Concentra – 2020 Consolidated Financial Statements Page 26
4. TRANSFERS OF FINANCIAL ASSETS (continued)
2020 2019
Carrying
Value
Fair
Value
Carrying
Value
Fair
Value
Securitized Assets
Cash reserve related to Multi-Seller Conduit $ 3,491 $ 3,491 $ 4,255 $ 4,255
Securities – securitized portfolio (Note 3) 293,497 293,497 362,870 362,870
Residential mortgages 4,409,288 4,494,674 3,500,254 3,477,063
4,706,276 4,791,662 3,867,379 3,844,188
Securitization Liabilities
Securitization obligations under the CMB program(1) 998,461 1,009,317 1,528,689 1,513,666
Securitization obligations under the NHA MBS program(2) 2,859,813 2,896,723 1,940,121 1,931,191
Securitization obligations to Multi-Seller Conduit(3) 63,409 64,177 84,817 84,469
3,921,683 3,970,217 3,553,627 3,529,326
Net position $ 784,593 $ 821,444 $ 313,752 $ 314,862
(1) Securitization obligations under the CMB program have a weighted average interest rate of 1.45% (2019 – 1.40%) and include only those CMB securitizations subject to a total return swap.
(2) Securitization obligations under the NHA MBS program have a weighted average interest rate of 1.33% (2019 – 1.79%) and include CMB
securitizations which are not subject to a total return swap (3) The interest rate related to the securitization obligations to Multi-Seller Conduits corresponds to the rate of the asset-backed commercial paper
issued by the conduit, plus related program fees.
The Bank also retains certain amounts of its issued NHA MBS certificates as part of its liquidity management strategy. As at December 31, 2020 residential mortgages of $813,439 (2019 - $331,701) with a fair value of $819,222 (2019 - $332,703) were assigned to NHA MBS certificates and retained by the Bank. These unsold NHA MBS certificates are reported in retail loans in the consolidated balance sheet.
4.2 Derecognized Financial Asset Transfers
4.2.1 Loan Sales and Syndications
The Bank sells co-ownership interests from select portfolios of on-balance sheet loans and syndicates certain commercial loan commitments while retaining servicing rights. The investors have no recourse against the Bank for any credit or fair value losses on the transferred assets, which results in substantially all of the risks and
rewards being transferred. The Bank has therefore removed the transferred assets from its consolidated balance sheet.
Under the servicing arrangements, the Bank collects the cash flows of the transferred assets on behalf of the credit union investors in return for a fee that is expected to compensate the Bank adequately for servicing the related assets. Consequently, the Bank accounts for the servicing arrangements as executory contracts and has not recognized a servicing asset or liability in the consolidated balance sheet. The servicing fees are based on a fixed percentage of the remaining principal balance of the transferred assets and are included within fee for service income on the consolidated statement of income net of direct servicing costs incurred.
The following tables provide quantitative information about these derecognized loan sales/syndications and the Bank’s continuing involvement during the year:
2020
Retail
Loans
Commercial
Loans Total
Sales/Syndication Activity
Notional amount of undrawn commitments syndicated during the year $ - $ 211,375 $ 211,375
Carrying value of loans sold and derecognized during the year 124,634 61,992 186,626
Gain on loans sold and derecognized during the year 1,479 1,471 2,950
Continuing Involvement
Outstanding principal balance of derecognized loans subject to servicing
arrangements at year end 18,023 812,987 831,010
Cumulative income earned on derecognized loans during the year(1) 374 1,186 1,560
(1) Consists of net servicing fees included in fee for service income on the consolidated income statement.

NOTES TO CONSOLIDATED FINANCIAL STATEMENTS
For the Year Ended December 31
(In Thousands of Canadian Dollars Unless Otherwise Indicated)
Concentra – 2020 Consolidated Financial Statements Page 27
4. TRANSFERS OF FINANCIAL ASSETS (continued)
2019
Retail
Loans
Commercial
Loans Total
Sales/Syndication Activity
Notional amount of commitments syndicated during the year $ - $ 112,945 $ 112,945
Carrying value of loans sold and derecognized during the year 335,297 - 335,297
Gain on loans sold and derecognized during the year 1,665 - 1,665
Continuing Involvement
Outstanding principal balance of derecognized loans subject to servicing
arrangements at year end 208,094 844,495 1,052,589
Cumulative income earned on derecognized loans during the year(1) 1,023 943 1,966
(1) Consists of net servicing fees included in fee for service income on the consolidated income statement.
4.2.2 Asset Securitizations
Certain NHA MBS/CMB securitization transactions undertaken by the Bank qualify for derecognition when one of the following conditions are met:
• The Bank subsequently enters into an agreement to transfer its right to the excess spread to a third party;
• The Bank simultaneously enters into a derivative contract which transfers the residual prepayment risk of the mortgages to a third party; or
• The terms and conditions of the transferred assets are such that they are substantively risk free and the Bank has transferred control of these assets.
When the Bank has transferred its right to the excess spread, its continuing involvement is limited to servicing the transferred mortgages for which it receives a fixed monthly fee. The fixed fee provides adequate compensation for the cost of servicing and as such, no servicing asset or liability is recognized. When a portion of the transfer
price is payable in installments, a long-term interest bearing receivable is recognized in other securitization assets in the consolidated balance sheet.
For all other derecognized securitizations, the Bank’s continuing involvement consists of a retained interest asset representing its right to the excess spread and a servicing liability for the future cost of servicing the transferred
assets.
The following tables provides quantitative information about these derecognized securitization activities and the Bank’s continuing involvement during the year:
2020 2019
Securitization Activity
Carrying value of mortgages derecognized during the year $ 647,990 $ 620,660
Gain on sale of mortgages during the year 5,838 3,945
Continuing Involvement
Carrying value of deferred installments receivable - 160
Carrying value of retained interests 94,277 77,434
Total other securitization assets 94,277 77,594
Carrying value of servicing liabilities (Note 12) 15,864 12,360
Outstanding principal balance of derecognized loans at year end 2,806,983 2,259,239
Cumulative income earned on derecognized loans during the year 1,264 1,243
The following table provides the expected undiscounted cash flows payable to the MBS holders on the Bank’s securitization activities and transfers that are derecognized in their entirety:
MBS Liabilities
2021 $ 73,457
2022 75,869
2023 112,004
2024 270,557
2025 388,311
Thereafter 1,886,785
$ 2,806,983

NOTES TO CONSOLIDATED FINANCIAL STATEMENTS
For the Year Ended December 31
(In Thousands of Canadian Dollars Unless Otherwise Indicated)
Concentra – 2020 Consolidated Financial Statements Page 28
5. DERIVATIVE ASSETS AND LIABILITIES
Derivative financial instruments are financial contracts whose value is derived from an underlying interest rate, foreign exchange rate, equity instrument or index. Derivative contracts are expressed in notional amounts. The notional amounts, which are off-balance sheet, do not represent amounts exchanged and, thus, are not a measure of the Bank’s exposure through the use of derivatives. The notional amount is the reference amount used to determine the payment required by contract and is a common measure of business volume.
Swaps are contractual agreements to exchange a series of cash flows based on agreed upon rates to a notional
amount. Interest rate swaps are used to manage exposure to interest rate risk by modifying the repricing or interest rate characteristics of assets and liabilities. Exposure is managed through the exchange of fixed and floating interest rate payments based on notional amounts.
Forward rate contracts are used to determine the rate of interest to be paid or received beginning at a future date. A forward rate agreement manages the risk of fluctuating market interest rates by locking in a current interest rate for a transaction that will take place in the future. Payment based on a notional amount is paid or
received once at maturity.
Foreign exchange contracts are contractual obligations to buy or sell one currency against another, for settlement
on the day the contract expires. A foreign exchange contract manages the risk of fluctuating exchange rates by locking in a current price for a transaction that will take place in the future. Foreign exchange exposure is managed through entering into foreign exchange forward contracts.
2020
Notional Amount by Term to Maturity Fair Value
Within
3 Months
Over
3 Months
to 1 Year
Over
1 Year
to 5 Years
Over
5 Years Total
Asset Liability
Asset / Liability Management
Interest rate swaps $ 15,000 $ 15,000 $ 36,597 $ - $ 66,597 $ 73 $ 2,564
Designated in Fair Value Hedges
Interest rate swaps - - 10,000 - 10,000 401 15
Designated in Cash Flow Hedges
Forward rate contracts 104,600 60,600 - - 165,200 - 395
As Intermediary
Interest rate swaps 71,757 314,389 427,514 96,032 909,692 13,471 13,262
Forward rate contracts - - 11,078 10,590 21,668 788 780
Foreign exchange contracts 19,847 20,713 - - 40,560 1,144 1,134
91,604 335,102 438,592 106,622 971,920 15,403 15,176
$ 211,204 $ 410,702 $ 485,189 $ 106,622 $ 1,213,717 $ 15,877 $ 18,150
2019
Notional Amount by Term to Maturity Fair Value
Within
3 Months
Over
3 Months
to 1 Year
Over
1 Year
to 5 Years
Over
5 Years Total
Asset Liability
Asset / Liability Management
Interest rate swaps $ - $ 384,913 $ 63,162 $ - $ 448,075 $ 2,297 $ 3,954
Designated in Fair Value Hedges
Interest rate swaps - - 10,000 5,500 15,500 43 185
Designated in Cash Flow Hedges
Forward rate contracts 71,933 - - - 71,933 1,160 -
As Intermediary
Interest rate swaps 180,000 292,236 776,064 62,725 1,311,025 7,702 7,373
Forward rate contracts 10,000 - 11,078 10,590 31,668 485 456
Foreign exchange contracts 11,427 23,522 - - 34,949 335 331
201,427 315,758 787,142 73,315 1,377,642 8,522 8,160
$ 273,360 $ 700,671 $ 860,304 $ 78,815 $ 1,913,150 $ 12,022 $ 12,299

NOTES TO CONSOLIDATED FINANCIAL STATEMENTS
For the Year Ended December 31
(In Thousands of Canadian Dollars Unless Otherwise Indicated)
Concentra – 2020 Consolidated Financial Statements Page 29
5. DERIVATIVE ASSETS AND LIABILITIES (continued)
Derivative assets and liabilities are expected to be realized in the following periods:
2020 2019
Asset Liability Asset Liability
Within 12 months $ 8,250 $ 9,689 $ 9,368 $ 9,253
After 12 months 7,627 8,461 2,654 3,046
$ 15,877 $ 18,150 $ 12,022 $ 12,299
Results of hedge activities
The Bank uses forward rate agreements to hedge the variability in cash flows related to the issuance of obligations under the CMB and NHA MBS programs. Interest spreads are exposed to potential changes in interest rates from the time the commitment is made to fund the residential mortgages through to the actual funding date of the residential mortgages and to the ultimate funding of the obligation under the CMB and NHA MBS programs. Thus the forward rate agreement reduces the impact of interest rate changes on the interest spread between the residential mortgages to be securitized and the securitization liabilities. The Bank has designated this hedging
relationship as a cash flow hedge and the realized gains and losses are reclassified from OCI to net income over the period of the obligation under the securitization program.
The Bank is also exposed to interest rate risk through certain fixed rate deposits. To manage this risk the Bank enters into interest rate swaps which result in fair value changes of the hedging instruments offsetting, within a reasonable range, changes in the fair value of the fixed rate deposits resulting from changes in the interest rate environment. The Bank has designated this hedging relationship as a fair value hedge and the net difference between the fair value changes of the hedging instrument and the hedged risk component of fixed rate deposits
is recorded as the ineffective portion of fair value hedges in gain on financial instruments in the statement of income.
2020 2019
Cash Flow Hedges
Effective portion – net (losses) gains recorded in OCI during the year $ (7,121) $ 804
Reclassification of losses (gains) to net income during the year 391 (779)
Fair Value Hedges
Ineffective portion recorded in gain on financial instruments (Note 15) (56) 8
Reclassification of gains on hedged risk components from OCI to net income - 144
Unrealized losses on derivatives related to hedged risk components (362) (138)
6. LOANS RECEIVABLE
2020 2019
Gross
Carrying Value
Allowance for
Credit Losses Total
Gross
Carrying Value
Allowance for
Credit Losses Total
Loans at Amortized Cost
Retail Loans
Residential mortgages(1) $ 6,655,105 $ (4,141) $ 6,650,964 $ 5,203,789 $ (2,988) $ 5,200,801
Consumer loans 527,116 (8,481) 518,635 527,429 (6,272) 521,157
Commercial Loans
Commercial mortgages and loans 700,115 (21,050) 679,065 922,163 (15,966) 906,197
Commercial leases 199,662 (1,060) 198,602 182,319 (1,520) 180,799
Total loans at amortized cost $ 8,081,998 $ (34,732) $ 8,047,266 $ 6,835,700 $ (26,746) $ 6,808,954
Loans at FVOCI
Retail Loans
Residential mortgages 781,575 749,876
$ 8,828,841 $ 7,558,830
(1) Residential mortgages include $273 (2019 - $478) of property held for resale.
The Bank’s loans are principally held for the purpose of collecting the contractual cash flows with the following exceptions.

NOTES TO CONSOLIDATED FINANCIAL STATEMENTS
For the Year Ended December 31
(In Thousands of Canadian Dollars Unless Otherwise Indicated)
Concentra – 2020 Consolidated Financial Statements Page 30
6. LOANS RECEIVABLE (continued)
For residential mortgages, the Bank holds two separately identifiable sub-portfolios which it both sells and holds a significant portion of newly originated assets. As the business model for these portfolios are managed to generate cash flows through both sales and collection of the contractual cash flows, the loans are classified as at FVOCI.
For commercial mortgages and loans, the Bank’s overall business model is such that it issues loan commitments with the intent of selling down a pre-determined amount prior to funding in order to meet the established credit risk policy limits. The Bank’s credit risk policy creates a clear line of demarcation for each originated commercial asset resulting
in the recognition of two distinct sub-portfolios:
• A sub-portfolio which contains the portion of loans the Bank intends to sell which are measured at FVTPL. As these sales occur prior to funding, the Bank does not recognize loans at FVTPL in its consolidated balance sheet. Instead the portion of the commitment designated for sale is measured at FVTPL up to the date of transfer (Note 17); and
• A sub-portfolio which contains the portion of loans the Bank intends to hold on-balance sheet which are measured
at amortized cost.
The following table provides information on the unrealized gains and losses for the Bank’s loans measured at fair
value:
2020 2019
Amortized Unrealized Fair Amortized Unrealized Fair
Cost Gains Losses Value Cost Gains Losses Value
Loans at FVOCI
Residential mortgages $ 773,545 $ 8,484 $ (454) $ 781,575 $ 750,725 $ 518 $ (1,367) $ 749,876
The maturity dates and weighted average effective interest rate information for the loans portfolio are as follows:
2020
Effective
Rate
Within
3 Months
Over
3 Months
to 1 Year
Over
1 Year
to 5 Years
Over
5 Years
Total
Loans at Amortized Cost
Residential mortgages 2.75% $ 370,092 $ 1,609,869 $ 4,664,780 $ 3,463 $ 6,648,204
Consumer loans 9.03% 1,772 26,809 298,336 198,643 525,560
Commercial mortgages and loans 4.28% 78,709 176,505 428,867 12,959 697,040
Commercial leases 4.91% 1,089 12,811 159,658 26,079 199,637
Loans at FVOCI
Residential mortgages 4.67% 104,770 460,789 214,840 - 780,399
$ 556,432 $ 2,286,783 $ 5,766,481 $ 241,144 $ 8,850,840
Accrued interest 12,733
Total gross carrying value $ 8,863,573
2019
Effective
Rate
Within
3 Months
Over
3 Months
to 1 Year
Over
1 Year
to 5 Years
Over
5 Years
Total
Loans at Amortized Cost
Residential mortgages 3.04% $ 282,068 $ 1,256,265 $ 3,656,834 $ 2,712 $ 5,197,879
Consumer loans 8.03% 9,704 61,366 294,577 160,109 525,756
Commercial mortgages and loans 4.56% 90,713 200,109 600,630 26,708 918,160
Commercial leases 4.56% 2,086 11,563 154,799 13,848 182,296
Loans at FVOCI
Residential mortgages 4.59% 50,004 524,229 174,339 - 748,572
$ 434,575 $ 2,053,532 $ 4,881,179 $ 203,377 $ 7,572,663
Accrued interest 12,913
Total gross carrying value $ 7,585,576
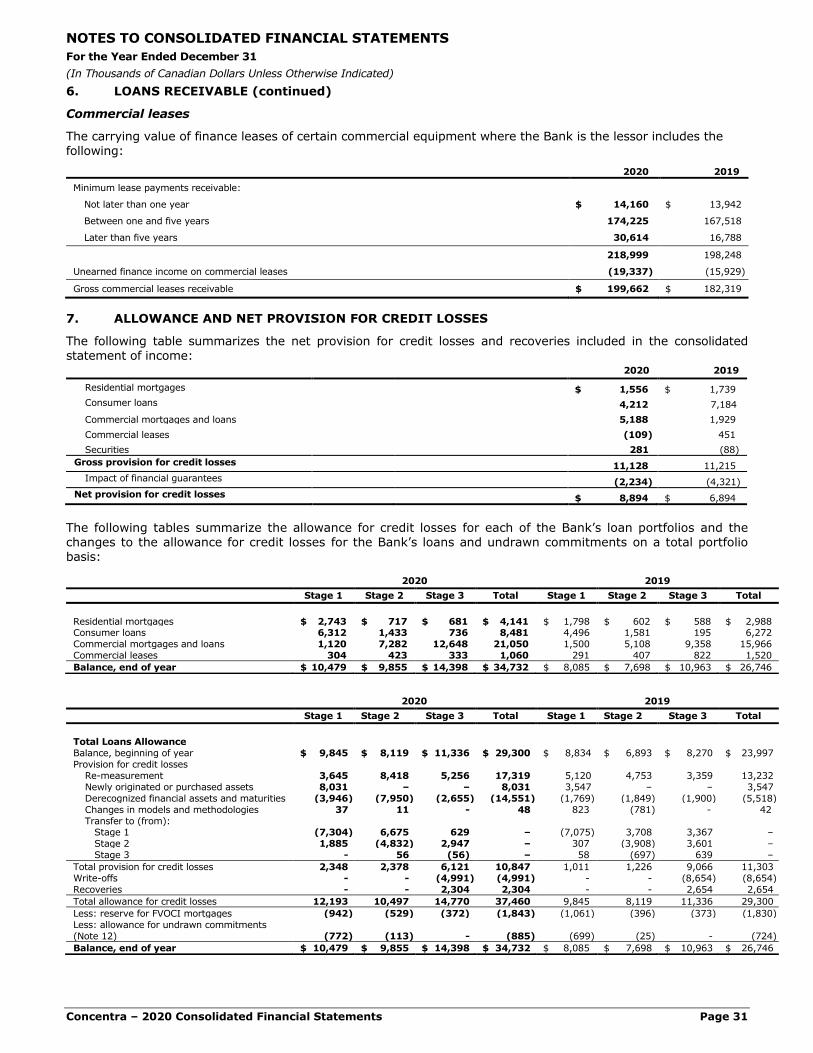
NOTES TO CONSOLIDATED FINANCIAL STATEMENTS
For the Year Ended December 31
(In Thousands of Canadian Dollars Unless Otherwise Indicated)
Concentra – 2020 Consolidated Financial Statements Page 31
6. LOANS RECEIVABLE (continued)
Commercial leases
The carrying value of finance leases of certain commercial equipment where the Bank is the lessor includes the following:
2020 2019
Minimum lease payments receivable:
Not later than one year $ 14,160 $ 13,942
Between one and five years 174,225 167,518
Later than five years 30,614 16,788
218,999 198,248
Unearned finance income on commercial leases (19,337) (15,929)
Gross commercial leases receivable $ 199,662 $ 182,319
7. ALLOWANCE AND NET PROVISION FOR CREDIT LOSSES
The following table summarizes the net provision for credit losses and recoveries included in the consolidated statement of income:
2020 2019
Residential mortgages $ 1,556 $ 1,739
Consumer loans 4,212 7,184
Commercial mortgages and loans 5,188 1,929
Commercial leases (109) 451
Securities 281 (88)
Gross provision for credit losses 11,128 11,215
Impact of financial guarantees (2,234) (4,321)
Net provision for credit losses $ 8,894 $ 6,894
The following tables summarize the allowance for credit losses for each of the Bank’s loan portfolios and the changes to the allowance for credit losses for the Bank’s loans and undrawn commitments on a total portfolio basis:
2020 2019
Stage 1 Stage 2 Stage 3 Total Stage 1 Stage 2 Stage 3 Total
Residential mortgages $ 2,743 $ 717 $ 681 $ 4,141 $ 1,798 $ 602 $ 588 $ 2,988 Consumer loans 6,312 1,433 736 8,481 4,496 1,581 195 6,272
Commercial mortgages and loans 1,120 7,282 12,648 21,050 1,500 5,108 9,358 15,966
Commercial leases 304 423 333 1,060 291 407 822 1,520
Balance, end of year $ 10,479 $ 9,855 $ 14,398 $ 34,732 $ 8,085 $ 7,698 $ 10,963 $ 26,746
2020 2019
Stage 1 Stage 2 Stage 3 Total Stage 1 Stage 2 Stage 3 Total
Total Loans Allowance
Balance, beginning of year $ 9,845 $ 8,119 $ 11,336 $ 29,300 $ 8,834 $ 6,893 $ 8,270 $ 23,997
Provision for credit losses
Re-measurement 3,645 8,418 5,256 17,319 5,120 4,753 3,359 13,232
Newly originated or purchased assets 8,031 – – 8,031 3,547 – – 3,547
Derecognized financial assets and maturities (3,946) (7,950) (2,655) (14,551) (1,769) (1,849) (1,900) (5,518)
Changes in models and methodologies 37 11 - 48 823 (781) - 42
Transfer to (from): Stage 1 (7,304) 6,675 629 – (7,075) 3,708 3,367 –
Stage 2 1,885 (4,832) 2,947 – 307 (3,908) 3,601 –
Stage 3 - 56 (56) – 58 (697) 639 –
Total provision for credit losses 2,348 2,378 6,121 10,847 1,011 1,226 9,066 11,303
Write-offs - - (4,991) (4,991) - - (8,654) (8,654)
Recoveries - - 2,304 2,304 - - 2,654 2,654
Total allowance for credit losses 12,193 10,497 14,770 37,460 9,845 8,119 11,336 29,300
Less: reserve for FVOCI mortgages (942) (529) (372) (1,843) (1,061) (396) (373) (1,830)
Less: allowance for undrawn commitments
(Note 12) (772) (113) - (885) (699) (25) - (724)
Balance, end of year $ 10,479 $ 9,855 $ 14,398 $ 34,732 $ 8,085 $ 7,698 $ 10,963 $ 26,746

NOTES TO CONSOLIDATED FINANCIAL STATEMENTS
For the Year Ended December 31
(In Thousands of Canadian Dollars Unless Otherwise Indicated)
Concentra – 2020 Consolidated Financial Statements Page 32
7. ALLOWANCE AND NET PROVISION FOR CREDIT LOSSES (continued)
The following tables present the changes to the allowance for credit losses for the Bank’s loans and undrawn commitments:
2020 2019
Stage 1 Stage 2 Stage 3 Total Stage 1 Stage 2 Stage 3 Total
Residential Mortgages
Balance, beginning of year $ 2,859 $ 998 $ 961 $ 4,818 $ 2,248 $ 191 $ 1,172 $ 3,611
Provision for credit losses
Re-measurement 963 630 1,234 2,827 1,154 301 1,644 3,099
Newly originated or purchased assets 2,658 - - 2,658 594 - - 594
Derecognized financial assets and maturities (1,926) (817) (999) (3,742) (476) (207) (1,522) (2,205)
Changes in models and methodologies 106 (293) – (187) 105 146 – 251
Transfer to (from):
Stage 1 (888) 761 127 - (783) 703 80 - Stage 2 - (91) 91 - 17 (155) 138 -
Stage 3 - 58 (58) - - 19 (19) -
Total provision for credit losses 913 248 395 1,556 611 807 321 1,739
Write-offs - - (333) (333) - - (630) (630)
Recoveries - - 30 30 - - 98 98
Total allowance for credit losses 3,772 1,246 1,053 6,071 2,859 998 961 4,818
Less: reserve for FVOCI mortgages (942) (529) (372) (1,843) (1,061) (396) (373) (1,830)
Less: allowance for undrawn commitments (87) - - (87) - - - -
Balance, end of year $ 2,743 $ 717 $ 681 $ 4,141 $ 1,798 $ 602 $ 588 $ 2,988
Consumer Loans Balance, beginning of year $ 4,701 $ 1,597 $ 195 $ 6,493 $ 3,655 $ 839 $ 276 $ 4,770
Provision for credit losses
Re-measurement 1,264 1,245 1,769 4,278 2,883 4,248 (957) 6,174
Newly originated or purchased assets 3,613 - 3,613 2,228 - - 2,228
Derecognized financial assets and maturities (1,539) (1,736) (644) (3,919) (611) (692) (289) (1,592)
Changes in models and methodologies 156 84 - 240 839 (465) - 374
Transfer to (from):
Stage 1 (1,715) 1,213 502 - (4,307) 1,022 3,285 -
Stage 2 - (970) 970 - 14 (3,364) 3,350 -
Stage 3 - - - - - 9 (9) -
Total provision for credit losses 1,779 (164) 2,597 4,212 1,046 758 5,380 7,184
Write-offs - - (3,070) (3,070) - - (7,689) (7,689) Recoveries - - 1,014 1,014 - - 2,228 2,228
Total allowance for credit losses 6,480 1,433 736 8,649 4,701 1,597 195 6,493
Less: allowance for undrawn commitments (168) - - (168) (205) (16) - (221)
Balance, end of year $ 6,312 $ 1,433 $ 736 $ 8,481 $ 4,496 $ 1,581 $ 195 $ 6,272
Commercial Mortgages and Loans
Balance, beginning of year $ 1,994 $ 5,117 $ 9,358 $ 16,469 $ 2,458 $ 5,470 $ 6,559 $ 14,487 Provision for credit losses
Re-measurement 1,377 6,589 1,391 9,357 1,123 111 1,983 3,217
Newly originated or purchased assets 1,421 - - 1,421 604 - - 604
Derecognized financial assets and maturities (400) (5,255) - (5,655) (637) (834) - (1,471)
Changes in models and methodologies (182) 247 - 65 (55) (366) - (421)
Transfer to (from):
Stage 1 (4,454) 4,454 - - (1,829) 1,829 - -
Stage 2 1,881 (3,755) 1,874 - 272 (366) 94 -
Stage 3 - (2) 2 - 58 (727) 669 -
Total provision for credit losses (357) 2,278 3,267 5,188 (464) (353) 2,746 1,929
Write-offs - - (35) (35) - - (21) (21) Recoveries - - 58 58 - - 74 74
Total allowance for credit losses 1,637 7,395 12,648 21,680 1,994 5,117 9,358 16,469 Less: allowance for undrawn commitments (517) (113) - (630) (494) (9) - (503)
Balance, end of year $ 1,120 $ 7,282 $ 12,648 $ 21,050 $ 1,500 $ 5,108 $ 9,358 $ 15,966
Commercial Leases
Balance, beginning of year $ 291 $ 407 $ 822 $ 1,520 $ 473 $ 393 $ 263 $ 1,129
Provision for credit losses Re-measurement 41 (46) 862 857 (40) 93 689 742
Newly originated or purchased assets 339 – – 339 121 – – 121
Derecognized financial assets and maturities (81) (142) (1,012) (1,235) (45) (116) (89) (250)
Changes in models and methodologies (43) (27) – (70) (66) (96) – (162)
Transfer to (from):
Stage 1 (247) 247 - – (156) 154 2 –
Stage 2 4 (16) 12 – 4 (23) 19 –
Stage 3 - - - – - 2 (2) –
Total provision for credit losses (recoveries) 13 16 (138) (109) (182) 14 619 451
Write-offs - - (1,553) (1,553) - - (314) (314)
Recoveries - - 1,202 1,202 - - 254 254
Balance, end of year $ 304 $ 423 $ 333 $ 1,060 $ 291 $ 407 $ 822 $ 1,520

NOTES TO CONSOLIDATED FINANCIAL STATEMENTS
For the Year Ended December 31
(In Thousands of Canadian Dollars Unless Otherwise Indicated)
Concentra – 2020 Consolidated Financial Statements Page 33
8. OTHER ASSETS
2020 2019
Accounts receivable $ 9,704 $ 5,261
Prepaid and deferred costs 3,334 3,129
Premises and equipment 6,945 4,373
Other intangible assets 5,872 5,140
Current income tax assets 6,333 329
Deferred income tax assets (Note 9) 15,509 14,691
$ 47,697 $ 32,923
Amortization recorded on premises and equipment for the year was $1,321 (2019 - $1,252). Amortization recorded on other intangible assets for the year was $1,026 (2019 - $660).
9. INCOME TAXES
Income taxes are included in the consolidated statement of income as follows:
2020 2019
Current income tax expense
Current tax on income for current year $ 5,389 $ 14,333
Current tax from adjustments for prior years (66) 230
5,323 14,563
Deferred income tax (recovery) expense
Origination and reversal of temporary differences 4,111 (2,501)
Deferred tax from adjustments for prior years (14) 560
Impact of tax rate changes 5 8
4,102 (1,933)
$ 9,425 $ 12,630
Income taxes are included in the consolidated statement of comprehensive income as follows:
2020 2019
Other comprehensive income
Current income tax expense
Net unrealized gains on FVOCI securities 3,155 1,271
Reclassification of gains on FVOCI securities to net income (9) (112)
Reclassification of impairment losses (recoveries) on FVOCI securities to net income 76 (23)
Net unrealized gains on FVOCI loans 2,495 370
Reclassification of gains on FVOCI loans to net income (104) (449)
Reclassification of impairment losses on FVOCI loans to net income 3 71
Net (losses) gains on derivatives designated as cash flow hedges (1,918) 216
Reclassification of losses (gains) on derivatives designated as cash flow hedges to net income 105 (210)
$ 3,803 $ 1,134
Reconciliation of income tax expense from operations:
2020 2019
Combined federal and provincial income tax rate applied to income from operations
(2020 – 26.9%; 2019 – 27.0%) $ 9,374 $ 11,532
Income tax expense adjusted for the effect of:
Adjustments related to prior periods (80) 790
Expenses not deductible for tax purposes 16 91
Impact of change in tax rates 5 8
Other 110 209
$ 9,425 $ 12,630

NOTES TO CONSOLIDATED FINANCIAL STATEMENTS
For the Year Ended December 31
(In Thousands of Canadian Dollars Unless Otherwise Indicated)
Concentra – 2020 Consolidated Financial Statements Page 34
9. INCOME TAXES (continued)
Deferred income taxes are calculated on all temporary differences under the liability method using an effective tax rate of 26.9% (2019 – 27.0%). The movement in deferred income taxes is as follows:
2020 2019
Balance, beginning of year $ 5,483 $ 3,550
Recognized in net income (4,102) 1,933
Balance, end of year $ 1,381 $ 5,483
The components of deferred income taxes are as follows: 2020 2019
Deferred income tax assets
Loans $ 14,896 $ 14,190
Other 613 501
15,509 14,691
Deferred income tax liabilities
Securitization activities (13,453) (8,758)
Other (675) (450)
(14,128) (9,208)
Net deferred income taxes $ 1,381 $ 5,483
Net deferred income taxes are anticipated to be realized as follows:
2020 2019
Net deferred income taxes (payable) recoverable
Within 12 months $ (4,542) $ 1,065
After more than 12 months 5,923 4,418
$ 1,381 $ 5,483
10. DEPOSITS
2020 2019
Credit union deposits $ 2,892,764 $ 1,039,932
Retail deposits 2,858,342 2,965,557
Commercial deposits 383,076 221,098
Capital market deposits 199,998 150,512
$ 6,334,180 $ 4,377,099
All deposits are recorded at amortized cost. The maturity dates and weighted average interest rates for the Bank's deposits are as follows:
2020
Effective
Rate
On
Demand/
Notice
Within
3 Months
Over
3 Months
to 1 Year
Over
1 Year
to 5 Years
Over
5 Years
Total
Credit Union deposits 0.80% $ 656,208 $ 490,320 $ 803,062 $ 938,955 $ - $ 2,888,545
Retail deposits 2.22% 139,692 231,321 1,030,688 1,424,161 - 2,825,862
Commercial deposits 0.92% 192,600 1,124 113,623 75,443 - 382,790
Capital market deposits 0.96% - - - 199,719 - 199,719
$ 988,500 $ 722,765 $ 1,947,373 $ 2,638,278 $ - $ 6,296,916
Accrued interest 37,264
$ 6,334,180

NOTES TO CONSOLIDATED FINANCIAL STATEMENTS
For the Year Ended December 31
(In Thousands of Canadian Dollars Unless Otherwise Indicated)
Concentra – 2020 Consolidated Financial Statements Page 35
10. DEPOSITS (continued)
2019
Effective
Rate
On
Demand/
Notice
Within
3 Months
Over
3 Months
to 1 Year
Over
1 Year
to 5 Years
Over
5 Years
Total
Retail deposits 2.54% $ 96,874 $ 144,376 $ 932,468 $ 1,758,469 $ - $ 2,932,187
Credit Union deposits 1.87% 409,887 270,465 225,621 130,675 - 1,036,648
Commercial deposits 1.77% 121,111 2,078 87,460 10,214 - 220,863
Capital market deposits 2.57% - - 149,931 - - 149,931
$ 627,872 $ 416,919 $ 1,395,480 $ 1,899,358 $ - $ 4,339,629
Accrued interest 37,470
$ 4,377,099
11. LOANS AND NOTES PAYABLE
2020 2019
Lines of credit $ 265 $ 581
Notes payable 214,480 302,436
Repurchase agreements (Note 4.1.1) - 117,259
$ 214,745 $ 420,276
All loans and notes payable are due within 12 months (2019 – within 12 months).
Lines of credit
The Bank maintains a $100,000 (2019 - $100,000) line of credit facility with SaskCentral. The line of credit bears interest at prime less 0.50% (2019 – prime less 0.50%) with an effective interest rate at December 31, 2020 of 1.95% (2019 – 3.45%). The line of credit is partially secured by securities or other assets that meet the minimum quality acceptable by SaskCentral. In accordance with the Clearing and Settlement Agreement with SaskCentral, SaskCentral may at its sole discretion make advances in excess of the line of credit as an overdraft. Overdrafts bear interest at prime plus 4.00% (2019 – prime plus 4.00%) with an effective interest rate at December 31,
2020 of 6.45% (2019 – 7.95%).
The Bank maintains a $400,000 (2019 - $500,000) Secured Credit Facility with a major Schedule 1 Canadian bank. The facility bears interest at the banker’s acceptance rate plus 0.65% (2019 – banker’s acceptance rate plus 0.50%) and is secured by insured residential mortgages or other qualified securities.
Notes payable
Notes payable consists of short-term instruments issued under the Bank’s Bearer Deposit Note (“BDN”) program. The
weighted average effective interest rate of these items is 0.83% at year end (2019 – 2.06%).
Repurchase agreements
Repurchase agreements represent obligations of the Bank under its various securities sale and repurchase agreements (see Note 4.1.1) utilized for ongoing liquidity management. The Bank had no outstanding repurchase agreements at December 31, 2020. The weighted average effective interest rate on outstanding repurchase agreements at year end was $nil (2019 – 1.82%).
Secured Funding Facilities
The Bank has access to two liquidity facilities sponsored by the Government of Canada, namely the Bank of Canada’s
Standing Term Liquidity Facility and Emergency Lending Assistance facility. The Bank had no outstanding balance (2019 – $nil) on these facilities. The facilities are secured by portfolios of non-mortgage loans, qualifying securities or deposits.
12. OTHER LIABILITIES
2020 2019
Servicing liabilities (Note 4.2.2) $ 15,864 $ 12,360
Current income tax liabilities 56 284
Deferred income tax liabilities (Note 9) 14,128 9,208
Allowance for undrawn commitments (Note 7) 885 724
Lease liabilities 3,987 912
$ 34,920 $ 23,488
NOTES TO CONSOLIDATED FINANCIAL STATEMENTS
For the Year Ended December 31
(In Thousands of Canadian Dollars Unless Otherwise Indicated)
Concentra – 2020 Consolidated Financial Statements Page 36
13. SHARE CAPITAL
The Bank is authorized to issue the following classes of shares:
• An unlimited number of voting common shares without par value • An unlimited number of non-voting Class A preferred shares without par value issuable in series • An unlimited number of non-voting Class B preferred shares without par value issuable in series
Common shares
Common shares are non-redeemable and represent the residual claim to the Bank’s property upon dissolution.
Common shares are entitled to receive dividends as and when declared by the Board subject to the rights of the Class A and Class B preferred shares. Voting privileges are determined on the basis of one vote per share. As a requirement of the bylaws, subject to the requirements of the Bank Act (Canada), common shares may only be issued to or transferred between cooperative corporations and other associated entities unless: (1) a special resolution is passed by a two-thirds majority shareholder vote (provided that if a shareholder owns, directly or indirectly, greater than 50% of the common shares of the Bank, such shareholder may only exercise up to 50%
of the total votes cast); (2) a non-viability contingent capital (“NVCC”) trigger event occurs; or (3) OSFI orders a directive under section 485 of the Bank Act (Canada) for the Bank to increase its capital.
Class A preferred shares
Class A preferred shares are entitled to preferential dividends as and when declared by the Board. The Class A preferred shares may be issued at any time or from time to time in one or more series provided each series of Class A preferred shares ranks in parity with every other series of Class A preferred shares with respect to dividends and return of capital. Before issuance of a series, the Board shall fix the number of shares that will form such series and
determine the designation, rights, privileges, restrictions and conditions specific to that series, subject to any limitations set out in the Bank Act (Canada) and the approval of OSFI. The Board has currently approved for issuance two series of Class A preferred shares: Series 1 and Series 2.
Class A - Series 1 preferred shares entitle the holders to an annual, non-cumulative fixed dividend of $1.15 per share for an initial period expiring on January 31, 2021. Upon expiration of this initial period, and every five years thereafter, the annual, non-cumulative fixed dividend rate of the Class A – Series 1 preferred shares will reset to an amount equal to the Government of Canada five-year bond yield plus 3.59%.
Class A – Series 2 preferred shares are entitled to a non-cumulative floating quarterly dividend at a rate equal to the 90-day Canadian treasury bill rate plus 3.59%.
Subject to a minimum amount of shares remaining outstanding in each series, upon expiration of the initial period and every five years thereafter, holders of the Class A – Series 1 preferred shares will have the right to exchange their shares for an equal amount of Class A – Series 2 preferred shares, or vice-versa.
The Class A – Series 1 and Series 2 preferred shares are redeemable at the option of the Bank for Twenty Five Dollars
($25.00) per share no earlier than January 31, 2021 subject to the approval of OSFI and the requirements of the Bank Act (Canada).
Upon the occurrence of a NVCC trigger event, the Class A – Series 1 and Series 2 preferred shares will be immediately cancelled for no consideration and the stated capital in respect of these classes of shares will immediately be reduced to $nil. From and after such date, the Class A – Series 1 and Series 2 shareholders shall have no right to receive, or assert a claim for any amount in respect of dividends or any payment upon a distribution of assets in the event of the liquidation, dissolution or winding-up of the Bank.
Information regarding the exchanges of shares between Class A – Series 1 and Class A – Series 2 occurring subsequent to December 31, 2020 is described in Note 22.
Class B preferred shares
Class B preferred shares are entitled to preferential dividends as and when declared by the Board. The Class B preferred shares may be issued at any time or from time to time in one or more series provided each series of Class B preferred shares ranks in parity with every other series of Class B preferred shares with respect to dividends and return of capital. Before issuance of a series, the Board shall fix the number of shares that will form such series and
determine the designation, rights, privileges, restrictions and conditions specific to that series, subject to any limitations set out in the Bank Act (Canada) and the approval of OSFI. There are currently no series of Class B preferred shares approved for issuance.
The following tables summarize the Bank’s share capital at year end including total dividends declared during the year:

NOTES TO CONSOLIDATED FINANCIAL STATEMENTS
For the Year Ended December 31
(In Thousands of Canadian Dollars Unless Otherwise Indicated)
Concentra – 2020 Consolidated Financial Statements Page 37
13. SHARE CAPITAL (continued)
2020
Share Capital Dividends Declared
# of Shares Amount $/Share Total
Common shares 9,621,114 $ 134,252 $ 0.56 $ 5,370
Class A preferred shares
Series 1 4,439,500 110,987 $ 1.15 5,105
$ 245,239 $ 10,475
2019
Share Capital Dividends Declared
# of Shares Amount $/Share Total
Common shares 9,621,114 $ 134,252 $ 0.56 $ 5,370
Class A preferred shares
Series 1 4,439,500 110,987 $ 1.15 5,105
$ 245,239 $ 10,475
14. FEE FOR SERVICE INCOME
2020 2019
Commercial and Retail Banking
Syndication and servicing fees $ 4,664 $ 5,331
Professional fees 2,197 1,924
Banking fees 1,262 1,587
Trust
Trust fees 7,867 7,968
Estate fees 1,327 1,469
Total revenue from contracts with customers 17,317 18,279
Rental income 633 598
Total fee for service income $ 17,950 $ 18,877
15. GAIN ON FINANCIAL INSTRUMENTS
2020 2019
Securities
Unrealized and realized (losses) gains on securities at FVTPL (913) 153
Realized gains on securities at FVOCI 32 416
Loans Receivable
Realized gains on loans at amortized cost 2,564 163
Realized gains on loans at FVOCI 386 1,665
Gain on derecognized securitizations 5,838 3,945
Derivatives and Hedging Activities
Unrealized and realized losses on derivatives (438) (733)
Ineffective portion of fair value hedges (56) 8
Total gain on financial instruments $ 7,413 $ 5,617
16. SALARIES AND EMPLOYEE BENEFITS EXPENSE
The Bank provides pension benefits to qualified employees. During the year the Bank contributed $2,120 (2019 - $1,774) to defined contribution and supplementary employee retirement plans. These costs are included in salaries and employee benefits. As a defined contribution pension plan, the Bank has no future liability or obligation for future contributions to fund benefits to plan members.
17. COMMITMENTS AND CONTINGENCIES
17.1 Credit Commitments
Loan commitments consist of authorized but undrawn lines of credit and loans, as well as letters of credit. Loan
commitments represent a maximum credit exposure to the Bank. If applicable, the maximum credit exposure to the Bank under certain letters of credit includes amounts for which the Bank has recourse to a third party lender.

NOTES TO CONSOLIDATED FINANCIAL STATEMENTS
For the Year Ended December 31
(In Thousands of Canadian Dollars Unless Otherwise Indicated)
Concentra – 2020 Consolidated Financial Statements Page 38
17. COMMITMENTS AND CONTINGENCIES (continued)
Origination commitments consist of agreements committing the Bank to fund a specified amount of qualifying consumer loans originated by third party brokers. As the commitments are not tied to specific borrowers, they do not represent a credit risk exposure and consequently are not subject to impairment. The committed amount represents the maximum amount of loans to be funded by the Bank over the term of the underlying agreements and the actual amount funded may be lower than the disclosed commitment.
The following tables summarize the contractual maturities of the financial assets underlying the Bank’s credit
commitments:
2020(1) 2019
Undrawn commitments for:
Loans at amortized cost $ 821,297 $ 479,598
Loans at FVTPL(1) 54,918 63,750
Letters of credit 35,420 38,990
Total loan commitments 911,635 582,338
Origination commitments - 8,500
Total credit commitments $ 911,635 $ 590,838
(1) Undrawn commitments for loans at FVTPL are priced at the date of funding based on the relevant market index. Consequently, the fair value of
these instruments is $nil as at December 31, 2020.
17.2 Litigation and other contingencies
The Bank is subject to various claims and litigation arising from time to time in the ordinary course of business. The Bank records a provision for litigation and other contingencies when it becomes probable that the Bank will incur a loss and the amount can be reliably estimated. The established provisions represent the Bank’s best estimate of the
expenditure required to settle current and pending claims and proceedings, including related legal costs, based on currently available information. However, given the uncertainties inherent in litigation proceedings, there is a possibility that the ultimate resolution may materially differ from current estimates.
18. RISK MANAGEMENT
The following note presents information about the Bank’s exposure to risks as a result of holding financial instruments and the management of its capital.
The Board is responsible for approving the Risk Appetite Framework and all Corporate Policies, including those
related to the management of credit risk, market risk, and liquidity and funding risk. Management Guidelines, approved by the Executive Risk Management Committee, are also in place to provide further risk controls, limits and tolerances in operations. Compliance with Risk Appetite, Corporate Policies and Management Guidelines is monitored on a monthly basis and reported to the Board on a quarterly basis through the Chief Risk Officer Report.
Management has established a formal risk management committee structure to provide a structured and disciplined approach to risk management. The Executive Risk Management Committee, chaired by the Chief Risk Officer, reviews the comprehensive assessment of current and emerging risks and provides oversight to the other
risk management committees. These committees include the Asset Liability Committee, the Investment Management Committee, the Technology Risk Management Committee, the Subordinated and Mezzanine Debt Financing Committee and the Trust Risk Management Committee.
The objectives and methodologies related to the management of credit risk, market risk and liquidity and funding risk have not changed significantly since December 31, 2019. The following is a description of these risks and how the exposures are managed.
18.1 Credit Risk
Credit risk is the risk of financial loss due to a borrower, guarantor or counterparty’s inability or unwillingness to fulfill contractual payment obligations.
Objectives, policies, and methodologies
• Operating in accordance with an approved business lending strategy, investment management strategy and identified target markets
• Segregating business generation activities from credit risk oversight
• Maintaining prudent credit granting criteria and entering into lending and investment transactions within the Bank’s expertise
• Undertaking regular stress testing to determine probable impacts and develop treatment plans
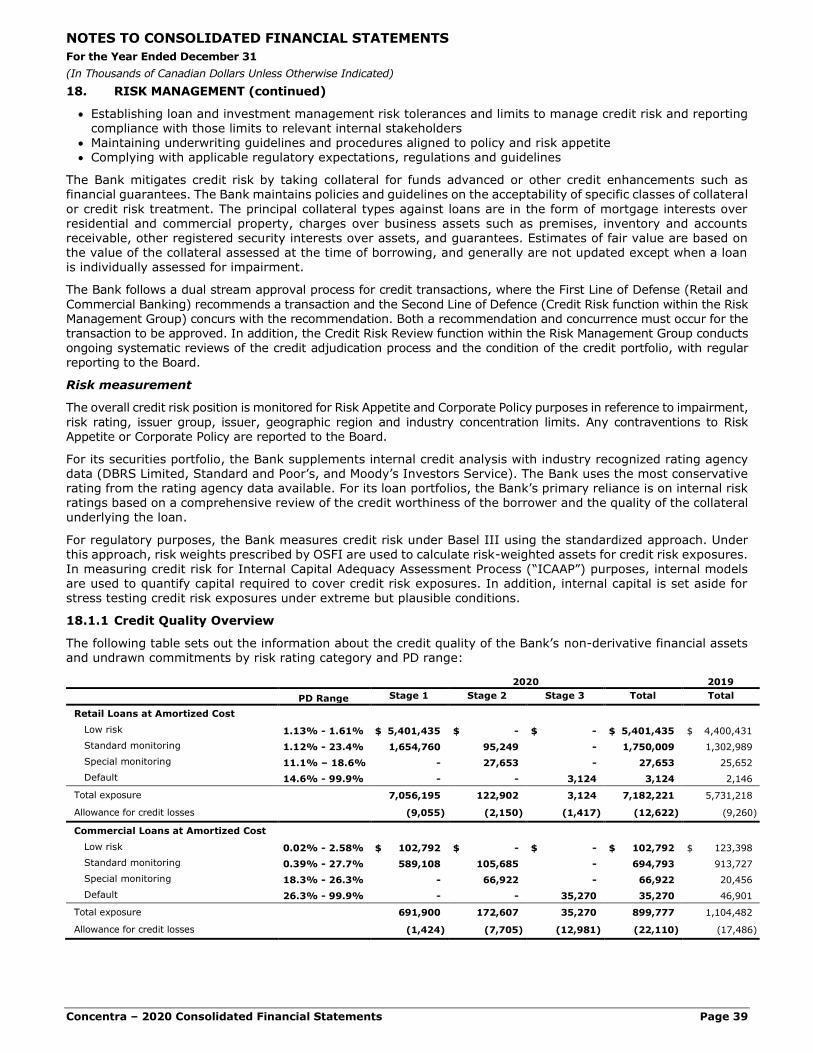
NOTES TO CONSOLIDATED FINANCIAL STATEMENTS
For the Year Ended December 31
(In Thousands of Canadian Dollars Unless Otherwise Indicated)
Concentra – 2020 Consolidated Financial Statements Page 39
18. RISK MANAGEMENT (continued)
• Establishing loan and investment management risk tolerances and limits to manage credit risk and reporting compliance with those limits to relevant internal stakeholders
• Maintaining underwriting guidelines and procedures aligned to policy and risk appetite • Complying with applicable regulatory expectations, regulations and guidelines
The Bank mitigates credit risk by taking collateral for funds advanced or other credit enhancements such as financial guarantees. The Bank maintains policies and guidelines on the acceptability of specific classes of collateral
or credit risk treatment. The principal collateral types against loans are in the form of mortgage interests over residential and commercial property, charges over business assets such as premises, inventory and accounts receivable, other registered security interests over assets, and guarantees. Estimates of fair value are based on the value of the collateral assessed at the time of borrowing, and generally are not updated except when a loan is individually assessed for impairment.
The Bank follows a dual stream approval process for credit transactions, where the First Line of Defense (Retail and
Commercial Banking) recommends a transaction and the Second Line of Defence (Credit Risk function within the Risk Management Group) concurs with the recommendation. Both a recommendation and concurrence must occur for the transaction to be approved. In addition, the Credit Risk Review function within the Risk Management Group conducts
ongoing systematic reviews of the credit adjudication process and the condition of the credit portfolio, with regular reporting to the Board.
Risk measurement
The overall credit risk position is monitored for Risk Appetite and Corporate Policy purposes in reference to impairment,
risk rating, issuer group, issuer, geographic region and industry concentration limits. Any contraventions to Risk Appetite or Corporate Policy are reported to the Board.
For its securities portfolio, the Bank supplements internal credit analysis with industry recognized rating agency data (DBRS Limited, Standard and Poor’s, and Moody’s Investors Service). The Bank uses the most conservative rating from the rating agency data available. For its loan portfolios, the Bank’s primary reliance is on internal risk ratings based on a comprehensive review of the credit worthiness of the borrower and the quality of the collateral underlying the loan.
For regulatory purposes, the Bank measures credit risk under Basel III using the standardized approach. Under this approach, risk weights prescribed by OSFI are used to calculate risk-weighted assets for credit risk exposures.
In measuring credit risk for Internal Capital Adequacy Assessment Process (“ICAAP”) purposes, internal models are used to quantify capital required to cover credit risk exposures. In addition, internal capital is set aside for stress testing credit risk exposures under extreme but plausible conditions.
18.1.1 Credit Quality Overview
The following table sets out the information about the credit quality of the Bank’s non-derivative financial assets and undrawn commitments by risk rating category and PD range:
2020 2019
PD Range Stage 1 Stage 2 Stage 3 Total Total
Retail Loans at Amortized Cost
Low risk 1.13% - 1.61% $ 5,401,435 $ - $ - $ 5,401,435 $ 4,400,431
Standard monitoring 1.12% - 23.4% 1,654,760 95,249 - 1,750,009 1,302,989
Special monitoring 11.1% – 18.6% - 27,653 - 27,653 25,652
Default 14.6% - 99.9% - - 3,124 3,124 2,146
Total exposure 7,056,195 122,902 3,124 7,182,221 5,731,218
Allowance for credit losses (9,055) (2,150) (1,417) (12,622) (9,260)
Commercial Loans at Amortized Cost
Low risk 0.02% - 2.58% $ 102,792 $ - $ - $ 102,792 $ 123,398
Standard monitoring 0.39% - 27.7% 589,108 105,685 - 694,793 913,727
Special monitoring 18.3% - 26.3% - 66,922 - 66,922 20,456
Default 26.3% - 99.9% - - 35,270 35,270 46,901
Total exposure 691,900 172,607 35,270 899,777 1,104,482
Allowance for credit losses (1,424) (7,705) (12,981) (22,110) (17,486)

NOTES TO CONSOLIDATED FINANCIAL STATEMENTS
For the Year Ended December 31
(In Thousands of Canadian Dollars Unless Otherwise Indicated)
Concentra – 2020 Consolidated Financial Statements Page 40
18. RISK MANAGEMENT (continued)
2020 2019
PD Range Stage 1 Stage 2 Stage 3 Total Total
Undrawn Commitments
Low risk 0.10% - 1.00% $ 576,335 $ - $ - $ 576,335 $ 274,538
Standard monitoring 0.80% - 19.5% 269,775 65,519 - 335,294 307,800
Special monitoring 17.9% - 23.9% - 6 - 6 -
Default - - - - - -
Total exposure(1) 846,110 65,525 - 911,635 582,338
Allowance for credit losses (772) (113) - (885) (724)
Retail Loans at FVOCI
Low risk 1.02 % - 1.53% $ 177,321 $ - $ - $ 177,321 $ 78,703
Standard monitoring 1.76% - 25.0% 573,322 22,111 - 595,433 662,997
Special monitoring 17.9% - 23.9% - 6,289 - 6,289 5,555
Default 23.9% - 99.9% - - 2,532 2,532 2,621
Total exposure 750,643 28,400 2,532 781,575 749,876
Impairment reserve(2) (942) (529) (372) (1,843) (1,830)
Securities at FVOCI
AAA/R1H 0.19% - 0.27% $ 809,927 $ - $ - $ 809,927 $ 612,748
AA/R1M 0.21% - 0.33% 114,114 - - 114,114 27,042
A/R1L 0.17% - 0.47% 243,580 - - 243,580 157,777
BBB/R2H 0.35% - 0.64% 51,166 - - 51,166 5,679
BB 0.64% - 0.68% - 9,454 - 9,454 -
Total exposure 1,218,787 9,454 - 1,228,241 803,246
Impairment reserve(2) (322) (44) - (366) (88)
(1) The total exposure for undrawn commitments represents the maximum amount the Bank is contractually committed to fund. Many of these contracts
will expire without being drawn upon and thereby reduce the Bank’s credit risk from the maximum commitment. (2) Impairment reserves represent the accumulated ECLs which have been reclassified from OCI to net income since inception of the FVOCI debt
instruments.
Additionally, the Bank holds cash of $763,710 (2019 - $402,528) on deposit with various highly rated financial institutions that maintain investment grade credit ratings.
For derivative financial instruments, credit risk is limited to the positive replacement cost (fair value) of the instruments as this represents the cost to replace these contracts at prevailing market rates if a default occurred. The Bank mitigates exposures by limiting the counterparties to interest rate and foreign exchange contracts to credit worthy Canadian financial institutions. In determining the credit quality of derivative instruments both the
Bank’s own credit risk and the risk of the counterparty are considered elements of the credit quality.
Credit risk is measured by using a credit equivalent amount. The credit equivalent amount is derived from the sum of the positive replacement cost and the potential credit risk exposure which reflects the potential change in replacement cost in relation to the remaining term to maturity of the contract. The risk-weighted amount is determined by applying standard measures of counterparty risk to the credit equivalent amount.
The following table provides information in relation to the Bank’s credit risk exposure for derivative financial transactions. Positive replacement cost is derived from the fair value of derivative financial instruments. Potential
credit risk exposure and risk-weighted equivalents are calculated in accordance with OSFI’s Guideline for Capital
Adequacy Requirements (“CAR”):
2020 2019
Interest
Rate Contracts
Foreign
Exchange Contracts Total
Interest
Rate Contracts
Foreign
Exchange Contracts Total
Notional amounts $ 1,173,157 $ 40,560 $ 1,213,717 $ 1,878,201 $ 34,949 $ 1,913,150
Positive replacement cost 14,732 1,144 15,876 11,687 335 12,022
Potential credit risk exposure 5,557 654 6,211 7,842 564 8,406
Credit equivalent amount 26,995 1,091 28,086 30,194 824 31,018
Risk-weighted equivalent 5,399 218 5,617 6,039 165 6,204

NOTES TO CONSOLIDATED FINANCIAL STATEMENTS
For the Year Ended December 31
(In Thousands of Canadian Dollars Unless Otherwise Indicated)
Concentra – 2020 Consolidated Financial Statements Page 41
18. RISK MANAGEMENT (continued)
18.1.2 Collateral and Other Credit Enhancements
Residential mortgages
All of the Bank’s residential mortgages are secured by a first charge mortgage against the underlying property. The Bank considers the value of the underlying collateral as a key indicator of credit quality and quantifies risk within its residential mortgages portfolio, in part, with reference to a mortgage’s loan-to-value (“LTV”) ratio. LTV is calculated as the ratio of the gross amount of the loan (or the amount committed for undrawn commitments)
to the value of the underlying collateral. For loans whose LTV exceeds 80% at origination, the Bank will obtain an additional credit enhancement in the form of default insurance. Default insurance is issued either by the government backed CMHC or another highly rated financial institution and covers shortfalls in the realized value of collateral relative to the principal balance of a defaulted loan upon completion of foreclosure procedures.
As at December 31, 2020, approximately 67.2% (2019 – 69.9%) of the Bank’s residential mortgages were insured against borrower default.
Consumer loans
Certain loans within the Bank’s consumer loans portfolio are treated as unsecured credit exposures due to the relatively poor collateral value provided by the underlying assets (used automobiles, home renovations, retail goods, etc.). Thus as a further credit enhancement, the Bank has entered into an arrangement with its largest third party originator to provide a limited financial guarantee over the loans they originate. The guarantee is secured by a cash reserve held on deposit with the Bank and the Bank has the right to reimburse any credit losses experienced within the portfolio from the funds held in the reserve. The originator’s guarantee is limited to the
value of the cash reserve and the Bank has no further recourse against the originator should actual losses exceed the reserve amount. As at December 31, 2020 the cash reserve had a balance of $6,813 (2019 - $4,760) providing credit enhancement to $443,163 (2019 - $329,207) of the Bank’s consumer loans.
Commercial mortgages and loans
Approximately 80.4% (2019 – 85.3%) of the Bank’s commercial portfolio consists of real estate and construction lending which are secured by a first charge mortgage over the underlying property. The Bank will also take collateral in the form of general security agreements over business assets and guarantees from shareholders
and/or members of the corporate group when appropriate. The Bank does not routinely update the valuation of collateral held against its commercial loans as its ongoing risk management practices are focused around the
general credit worthiness of the borrower rather than quality of collateral. Consequently, valuations of collateral are updated only when required to negotiate a significant restructuring/refinancing of an existing loan or to determine workout strategies for distressed assets.
Debt securities
Asset-backed debt securities totaling $141,857 (2019 – $86,782) consist of short-term paper backed by specifically pledged assets, which may include trade receivables, residential mortgages, auto loans and/or commercial leases. The issuers of these securities provide additional credit enhancement to the underlying asset pools such as cash reserves, overcollateralization and/or other limited financial guarantees. The Bank relies upon assessments of the collateral/credit enhancements performed by external rating agencies and only holds instruments which have received the highest possible credit rating of AAA/R1H.
The remaining debt securities held by the Bank are either senior unsecured obligations or guaranteed by the
Government of Canada. Consequently, for these instruments the creditworthiness of the issuer/guarantor is considered to be the most relevant indicator of credit quality with the underlying collateral, if any, having a limited impact on the Bank’s credit risk assessment.
18.1.3 Impaired Financial Assets
A loan is considered past due when a counterparty has not made a payment by the contractual due date. The following table presents the carrying value of loans that are past due but not classified as credit impaired (Stage 3) because they are either: (1) less than 90 days past due; (2) loans under short-term payment deferral in response
to COVID-19; or (3) fully insured and collection efforts are reasonably expected to result in full repayment:
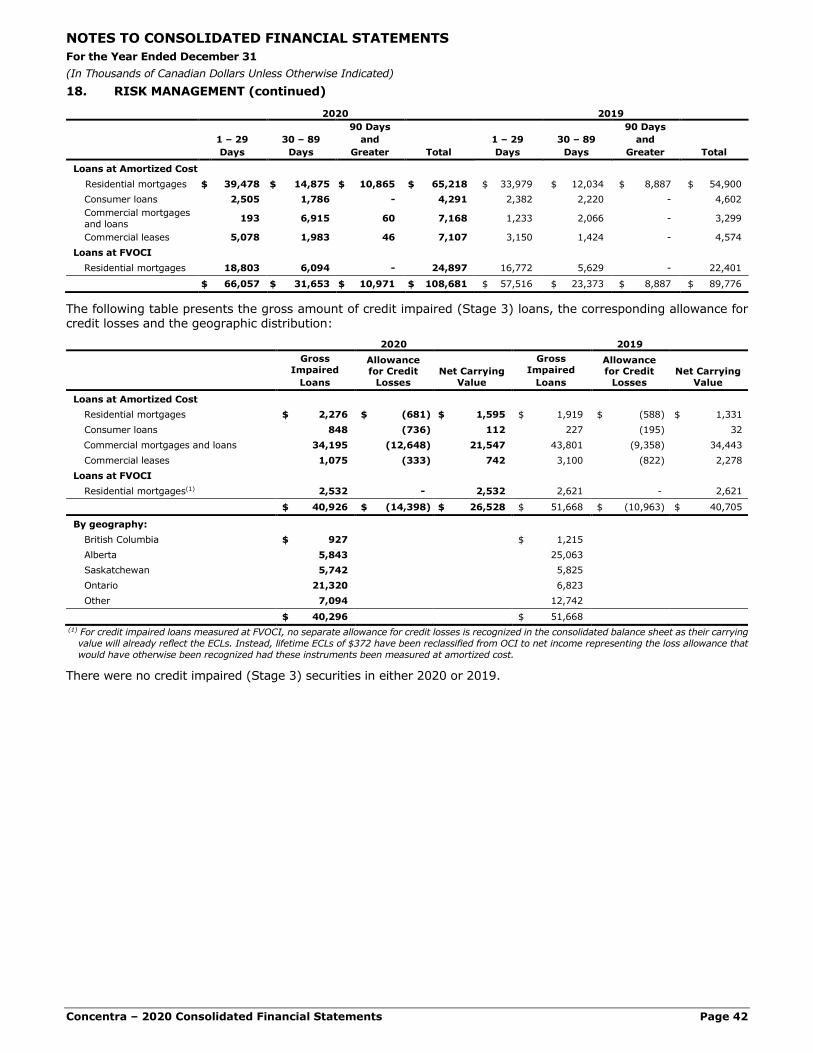
NOTES TO CONSOLIDATED FINANCIAL STATEMENTS
For the Year Ended December 31
(In Thousands of Canadian Dollars Unless Otherwise Indicated)
Concentra – 2020 Consolidated Financial Statements Page 42
18. RISK MANAGEMENT (continued)
2020 2019
1 – 29
Days
30 – 89
Days
90 Days
and
Greater Total
1 – 29
Days
30 – 89
Days
90 Days
and
Greater Total
Loans at Amortized Cost
Residential mortgages $ 39,478 $ 14,875 $ 10,865 $ 65,218 $ 33,979 $ 12,034 $ 8,887 $ 54,900
Consumer loans 2,505 1,786 - 4,291 2,382 2,220 - 4,602
Commercial mortgages
and loans 193 6,915 60 7,168 1,233 2,066 - 3,299
Commercial leases 5,078 1,983 46 7,107 3,150 1,424 - 4,574
Loans at FVOCI
Residential mortgages 18,803 6,094 - 24,897 16,772 5,629 - 22,401
$ 66,057 $ 31,653 $ 10,971 $ 108,681 $ 57,516 $ 23,373 $ 8,887 $ 89,776
The following table presents the gross amount of credit impaired (Stage 3) loans, the corresponding allowance for credit losses and the geographic distribution:
2020 2019
Gross
Impaired
Loans
Allowance for Credit
Losses
Net Carrying
Value
Gross
Impaired
Loans
Allowance for Credit
Losses
Net Carrying
Value
Loans at Amortized Cost
Residential mortgages $ 2,276 $ (681) $ 1,595 $ 1,919 $ (588) $ 1,331
Consumer loans 848 (736) 112 227 (195) 32
Commercial mortgages and loans 34,195 (12,648) 21,547 43,801 (9,358) 34,443
Commercial leases 1,075 (333) 742 3,100 (822) 2,278
Loans at FVOCI
Residential mortgages(1) 2,532 - 2,532 2,621 - 2,621
$ 40,926 $ (14,398) $ 26,528 $ 51,668 $ (10,963) $ 40,705
By geography:
British Columbia $ 927 $ 1,215
Alberta 5,843 25,063
Saskatchewan 5,742 5,825
Ontario 21,320 6,823
Other 7,094 12,742
$ 40,296 $ 51,668
(1) For credit impaired loans measured at FVOCI, no separate allowance for credit losses is recognized in the consolidated balance sheet as their carrying
value will already reflect the ECLs. Instead, lifetime ECLs of $372 have been reclassified from OCI to net income representing the loss allowance that
would have otherwise been recognized had these instruments been measured at amortized cost.
There were no credit impaired (Stage 3) securities in either 2020 or 2019.

NOTES TO CONSOLIDATED FINANCIAL STATEMENTS
For the Year Ended December 31
(In Thousands of Canadian Dollars Unless Otherwise Indicated)
Concentra – 2020 Consolidated Financial Statements Page 43
18. RISK MANAGEMENT (continued)
18.1.4 Credit Risk Concentrations
The following tables summarize the credit exposures by industry for the Bank’s loans and leases:
2020 2019
Gross
Carrying Value Undrawn
Commitments(1) Total Gross
Carrying Value Undrawn
Commitments(1) Total
Commercial Customers
Agriculture and forestry $ 87,059 $ 22,214 $ 109,273 $ 97,001 $ 31,514 $ 128,515
Construction 198,601 436,949 635,550 236,497 260,888 497,385
Commercial real estate 274,052 1,862 275,914 407,166 2,014 409,180
Credit union - 198,391 198,391 29 203,405 203,434
Health care 12,437 76,500 88,937 11,759 1,000 12,759
Hospitality 63,424 11 63,435 86,647 625 87,272
Manufacturing 31,945 6 31,951 66,141 6 66,147
Public administration 29,822 18,985 48,807 19,599 21,168 40,767
Transportation and warehousing 68,118 3,220 71,338 34,233 574 34,807
Utilities 19,484 - 19,484 13,462 - 13,462
Other 114,835 51,754 166,589 131,948 18,049 149,997
Retail Customers
Residential mortgages – insured 4,998,030 23,730 5,021,760 4,162,969 14,040 4,177,009
Residential mortgages – uninsured 2,438,650 62,891 2,501,541 1,790,696 2,889 1,793,585
Consumer loans 527,116 15,122 542,238 527,429 26,166 553,595
Total exposure $ 8,863,573 $ 911,635 $ 9,775,208 $ 7,585,576 $ 582,338 $ 8,167,914
(1) Excludes origination commitments as they are not tied to specific assets. See Note 17.1 for more information.
The following tables summarize the credit exposures by geographic region for the Bank’s loans and leases:
2020(1)
British
Columbia Alberta Saskatchewan Ontario Other Total
Outstanding $ 1,149,072 $ 1,843,749 $ 443,655 $ 4,669,585 $ 757,512 $ 8,863,573
Undrawn commitments(1) 202,768 44,301 193,263 390,100 81,203 911,635
Total exposure $ 1,351,840 $ 1,888,050 $ 636,918 $ 5,059,685 $ 838,715 $ 9,775,208
(1) Excludes origination commitments as they are not tied to specific assets. See Note 17.1 for more information.
2019(1)
British
Columbia Alberta Saskatchewan Ontario Other Total
Outstanding $ 985,821 $ 1,831,009 $ 428,370 $ 3,682,948 $ 657,428 $ 7,585,576
Undrawn commitments(1) 187,403 29,858 181,231 127,635 56,211 582,338
Total exposure $ 1,173,224 $ 1,860,867 $ 609,601 $ 3,810,583 $ 713,639 $ 8,167,914
(1) Excludes origination commitments as they are not tied to specific assets. See Note 17.1 for more information.
18.1.5 Counterparty Credit Risk
Counterparty credit risk is the risk that a counterparty to a derivative or FX spot transaction could default before the final settlement of the transaction.
In order to reduce counterparty credit risk exposure, the Bank uses, where possible, legally enforceable bi-lateral
and multi-lateral netting agreements with counterparties. All over-the-counter derivatives are executed under industry standards agreements such as an International Swaps and Derivatives Association (ISDA) agreement (or equivalent). The Bank uses legally enforceable collateral arrangements, such as a credit support annex (CSA) where the Bank has chosen to adopt an exchange of variation margin.
18.2 Market Risk
Market risk is the risk of financial loss in value of the Bank due to changes in interest rates, credit spreads, equity
prices, foreign exchange rates, market prices of financial instruments and implied volatilities.
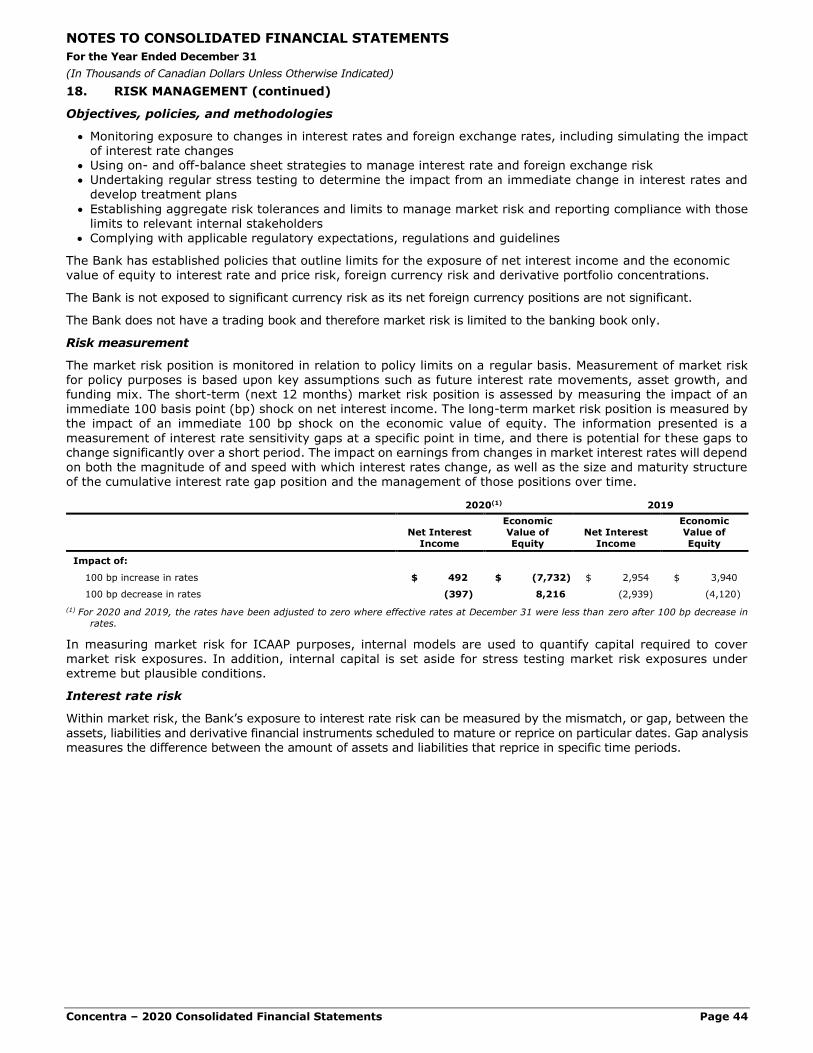
NOTES TO CONSOLIDATED FINANCIAL STATEMENTS
For the Year Ended December 31
(In Thousands of Canadian Dollars Unless Otherwise Indicated)
Concentra – 2020 Consolidated Financial Statements Page 44
18. RISK MANAGEMENT (continued)
Objectives, policies, and methodologies
• Monitoring exposure to changes in interest rates and foreign exchange rates, including simulating the impact of interest rate changes
• Using on- and off-balance sheet strategies to manage interest rate and foreign exchange risk • Undertaking regular stress testing to determine the impact from an immediate change in interest rates and
develop treatment plans
• Establishing aggregate risk tolerances and limits to manage market risk and reporting compliance with those limits to relevant internal stakeholders
• Complying with applicable regulatory expectations, regulations and guidelines
The Bank has established policies that outline limits for the exposure of net interest income and the economic value of equity to interest rate and price risk, foreign currency risk and derivative portfolio concentrations.
The Bank is not exposed to significant currency risk as its net foreign currency positions are not significant.
The Bank does not have a trading book and therefore market risk is limited to the banking book only.
Risk measurement
The market risk position is monitored in relation to policy limits on a regular basis. Measurement of market risk for policy purposes is based upon key assumptions such as future interest rate movements, asset growth, and funding mix. The short-term (next 12 months) market risk position is assessed by measuring the impact of an immediate 100 basis point (bp) shock on net interest income. The long-term market risk position is measured by the impact of an immediate 100 bp shock on the economic value of equity. The information presented is a
measurement of interest rate sensitivity gaps at a specific point in time, and there is potential for these gaps to change significantly over a short period. The impact on earnings from changes in market interest rates will depend on both the magnitude of and speed with which interest rates change, as well as the size and maturity structure of the cumulative interest rate gap position and the management of those positions over time.
2020(1) 2019
Net Interest
Income
Economic
Value of
Equity
Net Interest
Income
Economic
Value of
Equity
Impact of:
100 bp increase in rates $ 492 $ (7,732) $ 2,954 $ 3,940
100 bp decrease in rates (397) 8,216 (2,939) (4,120)
(1) For 2020 and 2019, the rates have been adjusted to zero where effective rates at December 31 were less than zero after 100 bp decrease in
rates.
In measuring market risk for ICAAP purposes, internal models are used to quantify capital required to cover market risk exposures. In addition, internal capital is set aside for stress testing market risk exposures under extreme but plausible conditions.
Interest rate risk
Within market risk, the Bank’s exposure to interest rate risk can be measured by the mismatch, or gap, between the
assets, liabilities and derivative financial instruments scheduled to mature or reprice on particular dates. Gap analysis measures the difference between the amount of assets and liabilities that reprice in specific time periods.

NOTES TO CONSOLIDATED FINANCIAL STATEMENTS
For the Year Ended December 31
(In Thousands of Canadian Dollars Unless Otherwise Indicated)
Concentra – 2020 Consolidated Financial Statements Page 45
18. RISK MANAGEMENT (continued)
Repricing dates are based on the earlier of maturity or the contractual repricing date and effective interest rates, where applicable, represent the weighted average effective yield. The tables below show the Bank’s gap position as at December 31:
2020
Floating
and on
Demand
Within
3 Months
Over
3 Months
to 1 Year
Over
1 Year
to 5 Years
Over
5 Years
Non-Interest
Sensitive Total
Assets
Cash $ 763,710 $ - $ - $ - $ - $ - $ 763,710
Securities - 448,017 293,927 532,615 16,721 2,981 1,294,261
Loans receivable 398,554 476,886 2,210,711 5,648,085 116,135 (21,530) 8,828,841
Other securitization assets - - - - - 94,277 94,277
Other non-sensitive assets - - - - - 82,822 82,822
Total assets 1,162,264 924,903 2,504,638 6,180,700 132,856 158,550 11,063,911
Liabilities and Shareholders’ Equity
Deposits 988,500 722,765 1,947,373 2,638,278 - 37,264 6,334,180
Securitization liabilities - 17,186 1,250,198 2,649,983 - 4,316 3,921,683
Loans and notes payable 265 69,114 144,320 - - 1,046 214,745
Other non-sensitive liabilities - - - - - 66,188 66,188
Shareholders’ equity - - - - - 527,115 527,115
Total liabilities and Shareholders’ equity 988,765 809,065 3,341,891 5,288,261 - 635,929 11,063,911
On-balance sheet gap 173,499 115,838 (837,253) 892,439 132,856 (477,379) -
Notional Amount of Derivative
Financial Instruments
Pay side instruments - (631,158) (232,795) (255,893) (53,311) (40,560) (1,213,717)
Receive side instruments - 733,355 157,195 229,296 53,311 40,560 1,213,717
Derivative financial instruments gap - 102,197 (75,600) (26,597) - - -
Total gap 173,499 218,035 (912,853) 865,842 132,856 (477,379) $ -
Total cumulative gap $ 173,499 $ 391,534 $ (521,319) $ 344,253 $ 477,379 $ -
2019
Floating and
on Demand
Within
3 Months
Over
3 Months
to 1 Year
Over
1 Year
to 5 Years
Over
5 Years
Non-Interest
Sensitive Total
Assets
Cash $ 402,528 $ - $ - $ - $ - $ - $ 402,528
Securities 1,724 237,043 113,120 474,170 14,104 1,396 841,557
Loans 564,334 350,143 1,982,242 4,579,764 95,503 (13,156) 7,558,830
Other securitization assets - - - 160 - 77,434 77,594
Other non-sensitive assets - - - - - 64,193 64,193
Total assets 968,586 587,186 2,095,362 5,054,094 109,607 129,867 8,944,702
Liabilities and Shareholders’ Equity
Deposits 627,872 416,919 1,395,480 1,899,358 - 37,470 4,377,099
Securitization liabilities - - 834,028 2,715,621 - 3,978 3,553,627
Loans and notes payable 581 244,796 172,567 - - 2,332 420,276
Other non-sensitive liabilities - - - - - 91,812 91,812
Shareholders’ equity - - - - - 501,888 501,888
Total liabilities and Shareholders’ equity 628,453 661,715 2,402,075 4,614,979 - 637,480 8,944,702
On-balance sheet gap 340,133 (74,529) (306,713) 439,115 109,607 (507,613) -
Notional Amount of Derivative Financial Instruments
Pay side instruments - (1,206,699) (172,612) (456,733) (42,158) (34,948) (1,913,150)
Receive side instruments - 933,436 504,537 403,571 36,658 34,948 1,913,150
Derivative financial instruments gap - (273,263) 331,925 (53,162) (5,500) - -
Total gap 340,133 (347,792) 25,212 385,953 104,107 (507,613) $ -
Total cumulative gap $ 340,133 $ (7,659) $ 17,553 $ 403,506 $ 507,613 $ -

NOTES TO CONSOLIDATED FINANCIAL STATEMENTS
For the Year Ended December 31
(In Thousands of Canadian Dollars Unless Otherwise Indicated)
Concentra – 2020 Consolidated Financial Statements Page 46
18. RISK MANAGEMENT (continued)
The weighted average interest rates of the financial instruments from the tables above are as follows:
2020
Floating
and on
Demand
Within
3 Months
Over
3 Months
to 1 Year
Over
1 Year
to 5 Years
Over
5 Years Total
Assets and receive side instruments 2.11% 1.33% 3.16% 3.03% 5.02% 3.19%
Liabilities and pay side instruments 0.35% 0.90% 1.46% 1.63% 1.66% 1.38%
2019
Floating
and on
Demand
Within
3 Months
Over
3 Months
to 1 Year
Over
1 Year
to 5 Years
Over
5 Years Total
Assets and receive side instruments 3.16% 2.27% 3.35% 3.21% 4.46% 3.89%
Liabilities and pay side instruments 1.31% 1.88% 2.02% 2.09% 2.08% 2.80%
18.3 Liquidity and Funding Risk
Liquidity and funding risk is the risk of financial loss due to an inability to access sources of funds or to generate sufficient cash or cash equivalents in a timely manner to meet all commitments as they become due, without raising funds at adverse rates or selling on a forced basis.
Objectives, policies, and methodologies
• Daily monitoring of cash flows
• Investing a prudent portion of the investment portfolio in liquid, low-risk, unencumbered instruments • Acquiring credit union, commercial, and retail deposits and accessing capital markets • Diversifying funding sources • Maintaining external credit facilities, including lines of credit, to support daily liquidity and business needs and
unforeseen liquidity events • Maintaining an investment grade market rating • Maintaining a liquidity plan, including a contingency funding plan, and funding strategy to ensure there is
sufficient cash and high quality cash equivalents to support daily liquidity needs
• Undertaking regular stress testing to assist in identifying, measuring and controlling liquidity and funding risks, assessing the adequacy of liquidity buffers in case of both internal and market-wide stress events, and developing treatment plans
• Establishing aggregate tolerances and limits to manage liquidity and funding risk and reporting compliance with those limits to relevant internal stakeholders
• Complying with applicable regulatory expectations, regulations and guidelines
Risk measurement
The assessment of the liquidity position reflects management’s estimates, assumptions, and judgements relative to current and future company specific operations and market conditions. The Bank’s liquidity position is monitored on a daily basis to ensure obligations can be met and cash is optimized for the balance sheet. The goal is to effectively use the Bank’s portfolio of high quality liquid assets (“HQLA”) and back stop liquidity facilities (see Note 12) to ensure liquidity access during constrained liquidity conditions.
The liquidity position is monitored for policy purposes in reference to the OSFI prescribed Liquidity Coverage Ratio (“LCR”) which is based on a 30 day liquidity stress scenario, with assumptions defined in the Liquidity Adequacy Requirements (“LAR”) Guideline. The LCR is calculated as the ratio of HQLA plus Eligible non-operational demand
and overnight deposits to net cash outflows over the next 30 days. HQLA are defined in the LAR Guideline, and are grouped into three main categories, with varying reductions applied to arrive at the amount included in the table that follows. The total weighted values for net cash outflows for the next 30 days are derived by applying the assumptions specified in the LAR Guideline to specific items, including loans. The Bank also incorporates a
number of internal liquidity measures to forecast liquidity requirements including a minimum Net Cumulative Cash Flow that is used to identify potential cash flow shortfalls at different points over a twelve month horizon.
Throughout 2020 and 2019 the Bank has been in compliance with the OSFI prescribed LAR Guideline.

NOTES TO CONSOLIDATED FINANCIAL STATEMENTS
For the Year Ended December 31
(In Thousands of Canadian Dollars Unless Otherwise Indicated)
Concentra – 2020 Consolidated Financial Statements Page 47
18. RISK MANAGEMENT (continued)
In October 2014, the Basel Committee on Banking Supervision (“BCBS”) released its final document on the Net Stable Funding Ratio (“NSFR”). Application of NSFR for Domestic Systemically Important Banks was implemented effective January 1, 2020 while the application of NSFR to small and medium-sized institutions is targeted for a later date. The Bank continues to monitor developments related to liquidity requirements.
Contractual obligations and commitments
The following tables provide a summary of the primary future contractual maturities for the Bank’s funding
liabilities and loan commitments which affect liquidity:
2020
On
Demand
Within
3 months
Over
3 months
to 1 year
Over
1 year
to 5 years
Over
5 years Total
Deposits $ 988,650 $ 736,529 $ 1,968,687 $ 2,640,314 $ - $ 6,334,180
Securitization liabilities - 21,503 1,250,198 2,649,982 - 3,921,683
Loans and notes payable 265 70,160 144,320 - - 214,745
Loan commitments 198,927 23,431 70,717 571,845 46,715 911,635
$ 1,187,842 $ 851,623 $ 3,433,922 $ 5,862,141 $ 46,715 $ 11,382,243
2019
On
Demand
Within
3 months
Over 3 months
to 1 year
Over 1 year
to 5 years
Over
5 years Total
Deposits $ 627,890 $ 429,940 $ 1,419,191 $ 1,900,078 $ - $ 4,377,099
Securitization liabilities - 3,978 834,028 2,715,621 - 3,553,627
Loans and notes payable 581 247,128 172,567 - - 420,276
Loan commitments 215,720 45,169 43,702 246,627 17,374 568,592
$ 844,191 $ 726,215 $ 2,469,488 $ 4,862,326 $ 17,374 $ 8,919,594
Collateral pledged
The Bank is required to pledge or hold collateral in segregated safekeeping accounts to support its lines of credit and repurchase agreements. The Bank is also required to post collateral to derivative counterparties when the sum of the mark to market of the derivative financial instruments in favour of the counterparty exceeds the established threshold. The following table summarizes the fair value and type of collateral pledged by the Bank to support its various obligations:
2020 2019
Note Securities
Total
Pledged Securities
Total
Pledged
Derivative liabilities 5 $ 3,500 $ 3,500 $ 599 $ 599
Loans and notes payable
Lines of credit 11 19,568 19,568 20,092 20,092
Repurchase agreements 11 - - 116,910 116,910
Total collateral pledged $ 23,068 $ 23,068 $ 137,601 $ 137,601
Offsetting financial assets and liabilities
Certain financial assets and financial liabilities are subject to enforceable master netting agreements or similar arrangements. Each agreement between the Bank and the counterparty allows for net settlement of the relevant financial assets and financial liabilities when both elect to settle on a net basis. In the absence of such an election,
financial assets and financial liabilities will be settled on a gross basis, however, each party to the master netting arrangement or similar agreement will have the option to settle all such amounts on a net basis in the event of default of the other party. Based on the terms of each agreement, an event of default includes failure by a party to make payment when due; failure by a party to perform any obligation required by the agreement (other than payment) if such failure is not remedied within periods defined in the respective agreements after notice of such failure is given to the party; or bankruptcy.

NOTES TO CONSOLIDATED FINANCIAL STATEMENTS
For the Year Ended December 31
(In Thousands of Canadian Dollars Unless Otherwise Indicated)
Concentra – 2020 Consolidated Financial Statements Page 48
18. RISK MANAGEMENT (continued)
The following table summarizes the financial assets and liabilities subject to master netting agreements or similar arrangements and the potential impact of these arrangements on the consolidated balance sheet:
2020
Note
Gross Amounts
of Recognized
Financial Instruments
Gross Amounts of Recognized
Financial
Instruments
Set Off in the Balance Sheet
Net Amounts of Financial
Instruments
Presented
in the Balance Sheet
Related Amounts Not Set Off
in the Balance Sheet
Net Amount(3)
Impact of
Master Netting
or Similar Agreements(1)
Collateral
Received/ Pledged(2)
Financial Assets
Derivative assets 5 $ 15,877 $ - $ 15,877 $ (4,020) $ (5,088) $ 6,769
Financial Liabilities
Derivative liabilities 5 $ 18,150 $ - $ 18,150 $ (4,020) $ - $ 14,130
Loans and notes payable
Lines of credit 11 265 - 265 - - 265
Repurchase agreements 11 - - - - - -
Total financial liabilities $ 18,415 $ - $ 18,415 $ (4,020) $ - $ 14,395
(1) Amounts that are subject to master netting arrangements or similar agreements but were not offset because they did not meet the net
settlement/simultaneous settlement criteria; or because the rights of set off are conditional upon the default of the counterparty only. (2) Collateral received/pledged amounts are reflected at fair value, but have been limited to the net balance sheet exposure so as not to include
any over-collateralization. (3) Not intended to represent the Bank’s actual exposure to credit risk, as a variety of credit mitigation strategies are employed in addition to
offsetting and collateral arrangements.
2019
Note
Gross Amounts of Recognized
Financial
Instruments
Gross Amounts
of Recognized
Financial Instruments
Set Off in the
Balance Sheet
Net Amounts
of Financial
Instruments Presented
in the
Balance Sheet
Related Amounts Not Set Off in the Balance Sheet
Net
Amount(3)
Impact of Master Netting
or Similar
Agreements(1)
Collateral
Received/
Pledged(2)
Financial Assets
Derivative assets 5 $ 12,022 $ - $ 12,022 $ (8,127) $ (3,030) $ 865
Financial Liabilities
Derivative liabilities 5 $ 12,299 $ - $ 12,299 $ (8,127) $ - $ 4,172
Loans and notes payable
Lines of credit 11 581 - 581 - (403) 178
Repurchase agreements 11 117,259 - 117,259 - (116,910) 349
Total financial liabilities $ 130,139 $ - $ 130,139 $ (8,127) $ (117,313) $ 4,699 (1) Amounts that are subject to master netting arrangements or similar agreements but were not offset because they did not meet the net
settlement/simultaneous settlement criteria; or because the rights of set off are conditional upon the default of the counterparty only. (2) Collateral received/pledged amounts are reflected at fair value, but have been limited to the net balance sheet exposure so as not to include
any over-collateralization. (3) Not intended to represent the Bank’s actual exposure to credit risk, as a variety of credit mitigation strategies are employed in addition to
offsetting and collateral arrangements.
18.4 Capital Management
The Bank manages and monitors capital from several perspectives, including regulatory and ICAAP capital. Under the Basel III framework, regulatory capital is allocated to three tiers: Common Equity Tier 1 (“CET 1”), Tier 1 and Tier 2. CET 1 regulatory capital comprises the more permanent components of capital and consists of common share capital, retained earnings and AOCI. In addition, goodwill and other items as prescribed by OSFI are
deducted from CET 1 regulatory capital. Tier 1 regulatory capital comprises of CET 1 and additional Tier 1 items
which include preferred shares. Tier 2 regulatory capital consists of general allowances (eligible stage 1 and stage 2 allowances) less deductions as prescribed by OSFI. Total regulatory capital is defined as the sum of Tier 1 and Tier 2 regulatory capital.
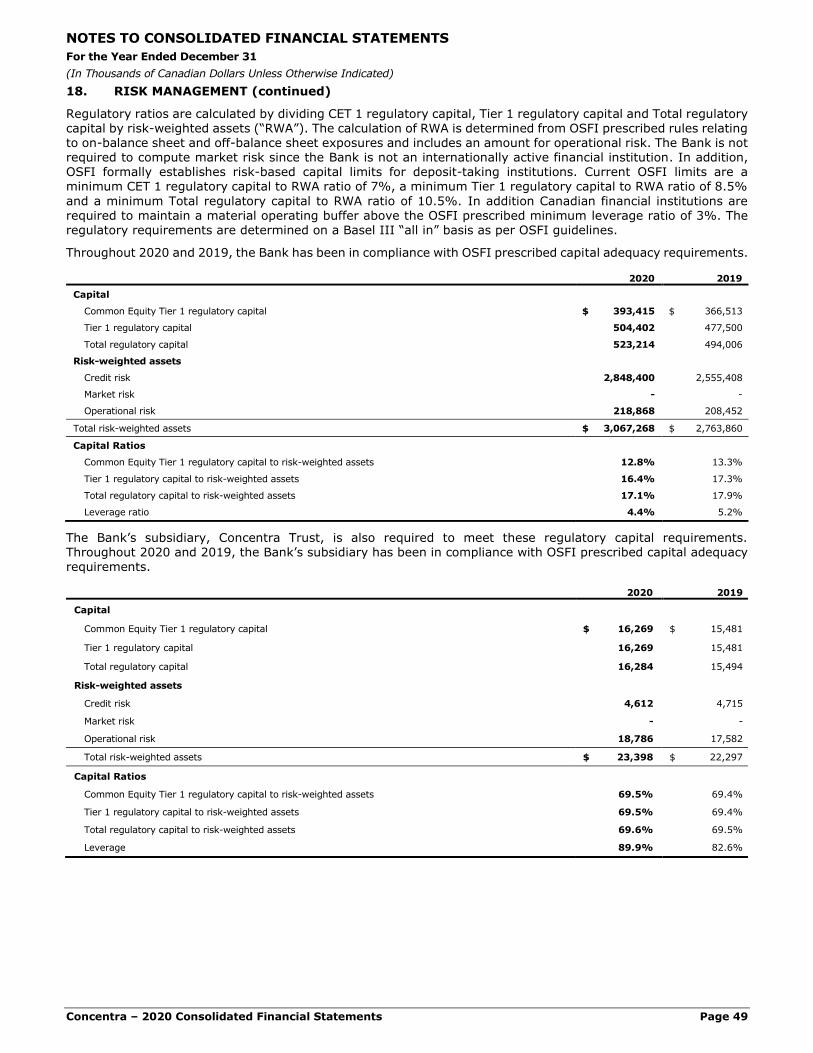
NOTES TO CONSOLIDATED FINANCIAL STATEMENTS
For the Year Ended December 31
(In Thousands of Canadian Dollars Unless Otherwise Indicated)
Concentra – 2020 Consolidated Financial Statements Page 49
18. RISK MANAGEMENT (continued)
Regulatory ratios are calculated by dividing CET 1 regulatory capital, Tier 1 regulatory capital and Total regulatory capital by risk-weighted assets (“RWA”). The calculation of RWA is determined from OSFI prescribed rules relating to on-balance sheet and off-balance sheet exposures and includes an amount for operational risk. The Bank is not required to compute market risk since the Bank is not an internationally active financial institution. In addition, OSFI formally establishes risk-based capital limits for deposit-taking institutions. Current OSFI limits are a minimum CET 1 regulatory capital to RWA ratio of 7%, a minimum Tier 1 regulatory capital to RWA ratio of 8.5%
and a minimum Total regulatory capital to RWA ratio of 10.5%. In addition Canadian financial institutions are required to maintain a material operating buffer above the OSFI prescribed minimum leverage ratio of 3%. The regulatory requirements are determined on a Basel III “all in” basis as per OSFI guidelines.
Throughout 2020 and 2019, the Bank has been in compliance with OSFI prescribed capital adequacy requirements.
2020 2019
Capital
Common Equity Tier 1 regulatory capital $ 393,415 $ 366,513
Tier 1 regulatory capital 504,402 477,500
Total regulatory capital 523,214 494,006
Risk-weighted assets
Credit risk 2,848,400 2,555,408
Market risk - -
Operational risk 218,868 208,452
Total risk-weighted assets $ 3,067,268 $ 2,763,860
Capital Ratios
Common Equity Tier 1 regulatory capital to risk-weighted assets 12.8% 13.3%
Tier 1 regulatory capital to risk-weighted assets 16.4% 17.3%
Total regulatory capital to risk-weighted assets 17.1% 17.9%
Leverage ratio 4.4% 5.2%
The Bank’s subsidiary, Concentra Trust, is also required to meet these regulatory capital requirements. Throughout 2020 and 2019, the Bank’s subsidiary has been in compliance with OSFI prescribed capital adequacy
requirements.
2020 2019
Capital
Common Equity Tier 1 regulatory capital $ 16,269 $ 15,481
Tier 1 regulatory capital 16,269 15,481
Total regulatory capital 16,284 15,494
Risk-weighted assets
Credit risk 4,612 4,715
Market risk - -
Operational risk 18,786 17,582
Total risk-weighted assets $ 23,398 $ 22,297
Capital Ratios
Common Equity Tier 1 regulatory capital to risk-weighted assets 69.5% 69.4%
Tier 1 regulatory capital to risk-weighted assets 69.5% 69.4%
Total regulatory capital to risk-weighted assets 69.6% 69.5%
Leverage 89.9% 82.6%

NOTES TO CONSOLIDATED FINANCIAL STATEMENTS
For the Year Ended December 31
(In Thousands of Canadian Dollars Unless Otherwise Indicated)
Concentra – 2020 Consolidated Financial Statements Page 50
19. FAIR VALUE OF ASSETS AND LIABILITIES
The fair values of assets and liabilities are based on relevant market prices and information available at the reporting date. Due to the use of subjective judgement and uncertainties, the aggregate fair value amounts disclosed in the consolidated financial statements should not be interpreted as necessarily being realizable in an immediate settlement or sale. The following is a summary of how the Bank determines the fair value of its financial instruments and other assets and liabilities measured at fair value on a recurring or non-recurring basis.
Cash, accounts receivable, loans and notes payable, and accounts payable are all short-term in nature and as
such, their fair value approximates carrying value.
The fair value of securities is established using market prices when available. Alternatively, fair values are determined using valuation models based on assumptions concerning the amount and timing of estimated future cash flows and discount rates.
The estimated fair value of loans reflects changes in general interest rates and credit worthiness of borrowers that have occurred since the loans were originated or purchased. The fair value of fixed interest rate loans is calculated
using discounted cash flows based on current rates of interest for similar lending arrangements. The fair value of floating interest rate loans approximates carrying value. The credit risk adjustment based on the perceived credit
worthiness of a borrower represents a significant unobservable input in the determination of fair value resulting in these instruments being classified at Level 3 in the fair value hierarchy.
The fair values of deposits with no stated maturity or due on demand are assumed to approximate carrying value. For the remainder of the deposits, fair value is calculated using discounted cash flows based on current market interest rates for similar maturities.
The fair value of derivative financial instruments is calculated by referring to the appropriate current market yields with matching terms to maturity. The fair values reflect the estimated amounts that the Bank would receive or pay to terminate the contracts at the reporting date.
Fair value hierarchy
The following tables present the carrying amounts and fair values of financial instruments and other assets and liabilities measured at fair value on a recurring and non-recurring basis, including their levels within the fair value hierarchy. The table does not include: (1) financial instruments whose fair value approximates carrying value due
to the short-term nature of the instrument; or (2) other assets and liabilities which are measured on a non-fair value basis, such as premises and equipment, goodwill and intangible assets:
2020
Carrying
Value Level 1 Level 2 Level 3
Fair
Value
Financial assets recorded at fair value
Securities at FVTPL $ 66,020 $ - $ 34,757 $ 31,263 $ 66,020
Securities at FVOCI 1,228,241 - 1,228,241 - 1,228,241
Loans at FVOCI 781,575 - - 781,575 781,575
Derivative assets 15,877 - 15,877 - 15,877
Financial assets recorded at amortized cost
Loans at amortized cost 8,047,266 - - 8,166,002 8,166,002
Other securitization assets 94,277 - 94,277 - 94,277
Financial liabilities recorded at fair value
Derivative liabilities 18,150 - 18,150 - 18,150
Financial liabilities recorded at amortized cost
Deposits 6,334,180 - 6,396,403 - 6,396,403
Securitization liabilities 3,921,683 - 3,970,217 - 3,970,217
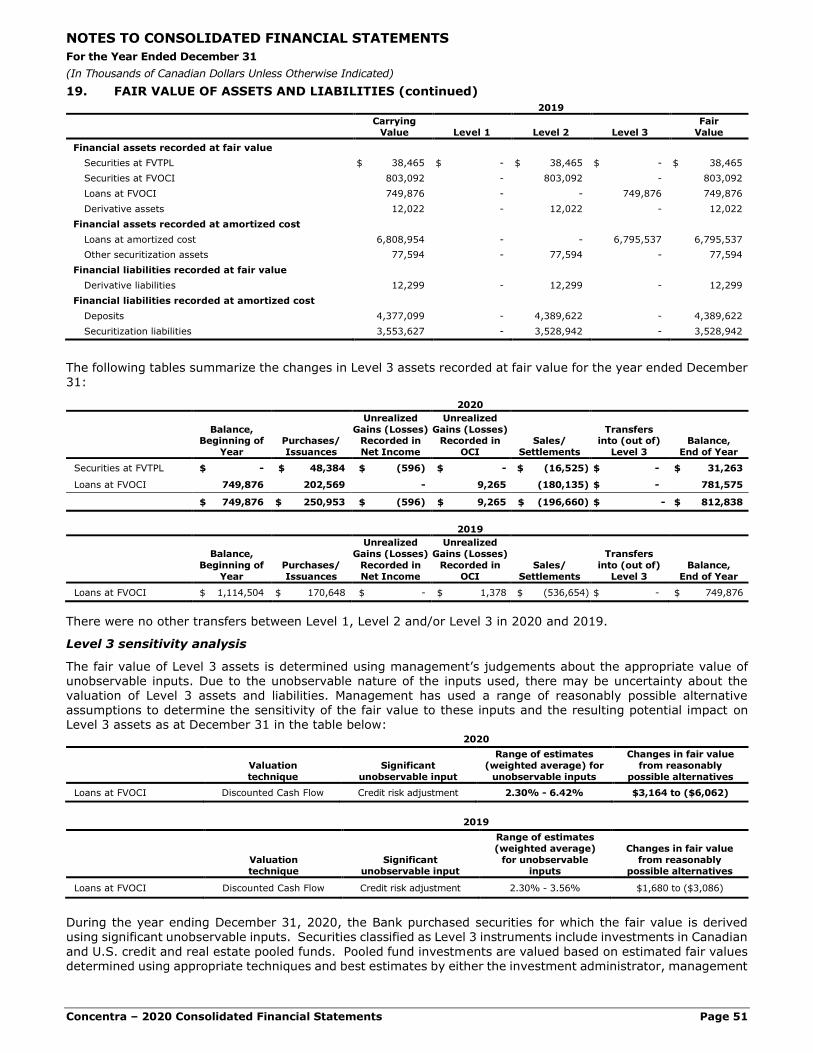
NOTES TO CONSOLIDATED FINANCIAL STATEMENTS
For the Year Ended December 31
(In Thousands of Canadian Dollars Unless Otherwise Indicated)
Concentra – 2020 Consolidated Financial Statements Page 51
19. FAIR VALUE OF ASSETS AND LIABILITIES (continued)
2019
Carrying
Value Level 1 Level 2 Level 3
Fair
Value
Financial assets recorded at fair value
Securities at FVTPL $ 38,465 $ - $ 38,465 $ - $ 38,465
Securities at FVOCI 803,092 - 803,092 - 803,092
Loans at FVOCI 749,876 - - 749,876 749,876
Derivative assets 12,022 - 12,022 - 12,022
Financial assets recorded at amortized cost
Loans at amortized cost 6,808,954 - - 6,795,537 6,795,537
Other securitization assets 77,594 - 77,594 - 77,594
Financial liabilities recorded at fair value
Derivative liabilities 12,299 - 12,299 - 12,299
Financial liabilities recorded at amortized cost
Deposits 4,377,099 - 4,389,622 - 4,389,622
Securitization liabilities 3,553,627 - 3,528,942 - 3,528,942
The following tables summarize the changes in Level 3 assets recorded at fair value for the year ended December 31:
2020
Balance, Beginning of
Year
Purchases/
Issuances
Unrealized
Gains (Losses) Recorded in
Net Income
Unrealized
Gains (Losses) Recorded in
OCI
Sales/
Settlements
Transfers into (out of)
Level 3
Balance,
End of Year
Securities at FVTPL $ - $ 48,384 $ (596) $ - $ (16,525) $ - $ 31,263
Loans at FVOCI 749,876 202,569 - 9,265 (180,135) $ - 781,575
$ 749,876 $ 250,953 $ (596) $ 9,265 $ (196,660) $ - $ 812,838
2019
Balance,
Beginning of
Year
Purchases/
Issuances
Unrealized
Gains (Losses)
Recorded in
Net Income
Unrealized
Gains (Losses)
Recorded in
OCI
Sales/
Settlements
Transfers
into (out of)
Level 3
Balance,
End of Year
Loans at FVOCI $ 1,114,504 $ 170,648 $ - $ 1,378 $ (536,654) $ - $ 749,876
There were no other transfers between Level 1, Level 2 and/or Level 3 in 2020 and 2019.
Level 3 sensitivity analysis
The fair value of Level 3 assets is determined using management’s judgements about the appropriate value of unobservable inputs. Due to the unobservable nature of the inputs used, there may be uncertainty about the valuation of Level 3 assets and liabilities. Management has used a range of reasonably possible alternative assumptions to determine the sensitivity of the fair value to these inputs and the resulting potential impact on Level 3 assets as at December 31 in the table below:
2020
Valuation
technique
Significant
unobservable input
Range of estimates
(weighted average) for
unobservable inputs
Changes in fair value
from reasonably
possible alternatives
Loans at FVOCI Discounted Cash Flow Credit risk adjustment 2.30% - 6.42% $3,164 to ($6,062)
2019
Valuation
technique
Significant
unobservable input
Range of estimates
(weighted average)
for unobservable
inputs
Changes in fair value
from reasonably
possible alternatives
Loans at FVOCI Discounted Cash Flow Credit risk adjustment 2.30% - 3.56% $1,680 to ($3,086)
During the year ending December 31, 2020, the Bank purchased securities for which the fair value is derived using significant unobservable inputs. Securities classified as Level 3 instruments include investments in Canadian
and U.S. credit and real estate pooled funds. Pooled fund investments are valued based on estimated fair values determined using appropriate techniques and best estimates by either the investment administrator, management

NOTES TO CONSOLIDATED FINANCIAL STATEMENTS
For the Year Ended December 31
(In Thousands of Canadian Dollars Unless Otherwise Indicated)
Concentra – 2020 Consolidated Financial Statements Page 52
19. FAIR VALUE OF ASSETS AND LIABILITIES (continued)
of the pooled fund, or appraisers. Where external appraisers are engaged to perform the valuation, the investment administrator ensures the appraisers are independent and compares the assumptions used with the administrator’s expectations based on current market conditions and industry practice to ensure the valuation captures the business and economic conditions specific to the investment. Significant unobservable inputs include discount rates, capitalization rates, rent forecasts, market interest rates and credit spreads. The year end fair values of the pooled funds are provided by the investment administrator and are recorded based on net asset
values. These net asset values are reviewed by management.
20. RELATED PARTY DISCLOSURE
Related party transactions are in the normal course of operations and are measured at the consideration established and agreed to by the parties. The following table summarizes the balances outstanding at year end and transactions during the year not noted elsewhere in the consolidated financial statements. The amounts outstanding are unsecured and will be settled in cash. No guarantees have been given or received. Related party
loan balances are included with groups of loans with similar credit risk characteristics when collectively assessing for impairment. Balances and transactions between the Bank and its subsidiary, which is a related party of the Bank, have been eliminated on consolidation and are not disclosed in this note.
The Bank has entered into transactions with the following related parties in the normal course of business:
SaskCentral – SaskCentral holds 84.0% (2019 – 84.0%) of the voting common shares resulting in control of the Bank. SaskCentral provides leased facilities and various financial services to the Bank. The Bank provides consultative and administrative services to SaskCentral.
Celero Solutions – an unincorporated entity of which SaskCentral owns 33.3% (2019 – 33.3%) thereby resulting in joint control. Celero Solutions provides information technology support and services to the Bank.
CUPS Payment Services (“CUPS”) – an unincorporated entity of which Sask Central owns 50.0% (2019 –50.0%) thereby resulting in joint control. CUPS provided payment processing services to the Bank up to January 1, 2020, after which these services were provided by Prairie Payments Joint Venture.
Prairie Payments Joint Venture (“PPJV”) – a joint venture formed January 1, 2020 of which SaskCentral holds a 33.3% interest thereby resulting in significant influence. All previous services performed
by CUPS were transferred to PPJV upon formation of the joint venture. PPJV provides payment processing services to the Bank.
2020 2019
SaskCentral
Assets and Liabilities
Cash deposited with $ 24,359 $ 16,170
Due from included in other assets 52 7
Loans payable to - 403
Interest payable to 3 17
Revenues and Expenses
Interest paid to 60 172
Fees for services received from 643 630
Non-interest expenses paid to 616 1,081
Other Transactions
Dividends paid to 4,512 4,512
Securities pledged on behalf of 20,350 20,603
Lease payments paid to 451 439
Celero Solutions
Due to included in other liabilities 6 222
Fee for services received from - 15
Capital assets purchased from 28 72
Fee for service paid to 2,748 3,001
CUPS Payment Services
Fee for service paid to - 77
Prairie Payments Joint Venture
Fee for service paid to 70 -

NOTES TO CONSOLIDATED FINANCIAL STATEMENTS
For the Year Ended December 31
(In Thousands of Canadian Dollars Unless Otherwise Indicated)
Concentra – 2020 Consolidated Financial Statements Page 53
20. RELATED PARTY DISCLOSURE (continued)
Key management compensation
The Bank has identified its directors and executive leadership team as key management personnel. The following table summarizes compensation earned by the Bank’s key management for the year ended December 31:
2020 2019
Directors
Honorariums and other short-term benefits $ 641 $ 714
Executive Leadership
Salaries and other short-term benefits 3,959 4,159
Post-employment benefits 244 229
Other long-term benefits 868 386
Termination benefits - 228
5,071 5,002
Total key management compensation $ 5,737 $ 5,716
At December 31, 2020, certain directors and key management were indebted to the Bank for an amount totaling $533 (2019 - $nil) and held deposits at the Bank totaling $99 (2019 - $6). The loans to and deposits held by
directors were granted under the same lending policies applicable to other members. Certain management loans qualify for the staff lending program at preferential rates.
21. IMPACT OF COVID-19
On March 11, 2020, the COVID-19 outbreak was declared a pandemic by the World Health Organization and continues to have a significant adverse impact on the Canadian economy. Public health measures implemented in several jurisdictions to limit the spread of the virus resulted in temporary restrictive measures placed upon non-essential businesses during 2020. Further restrictive public health measures implemented in the fourth
quarter to curb the second wave of the COVID-19 pandemic present the risk that economic activity could be adversely impacted beyond original expectations. The Bank continues to operate in an uncertain macroeconomic environment at this time.
The preparation of the consolidated financial statements in accordance with IFRS requires management to make estimates and assumptions that affect the recognized and measured amounts of assets, liabilities, net income,
comprehensive income and related disclosures. Significant estimates and assumptions are made in the
measurement of allowances for credit losses and assessing impairment of non-financial assets. Actual results could differ from these estimates and assumptions. The COVID-19 pandemic gives rise to heightened uncertainty as it relates to accounting estimates and assumptions and increases the need to apply judgement in evaluating the economic environment and its impact on significant estimates.
21.1 Allowance for credit losses
The uncertainty created by the COVID-19 pandemic has increased the level of judgement applied in estimating allowances for credit losses (see Note 2.4 (a)).
21.2 Impairment of non-financial assets
The disruption of economic activity caused by the COVID-19 pandemic required the Bank to apply a heightened level of judgement in evaluating the impact on short and long-term forecasted earnings and whether there were indicators that goodwill may have been impaired. The Bank concluded that the recoverable amounts of the CGUs were in excess of their carrying amounts.
22. SUBSEQUENT EVENTS
On January 31, 2021, holders of 551,000 Class A – Series 1 preferred shares exercised their right to exchange
their shares for an equal amount of Class A – Series 2 preferred shares, which entitle the holders to a quarterly non-cumulative floating dividend equal to the 90-day Canadian treasury bill rate plus 3.59%.