concept 20: scatterplots & correlation · quiz (level 2) schoology quiz: ... write down the...
TRANSCRIPT
Concept 20 Scatterplots & Correlation
Concept 20: Scatterplots & Correlation
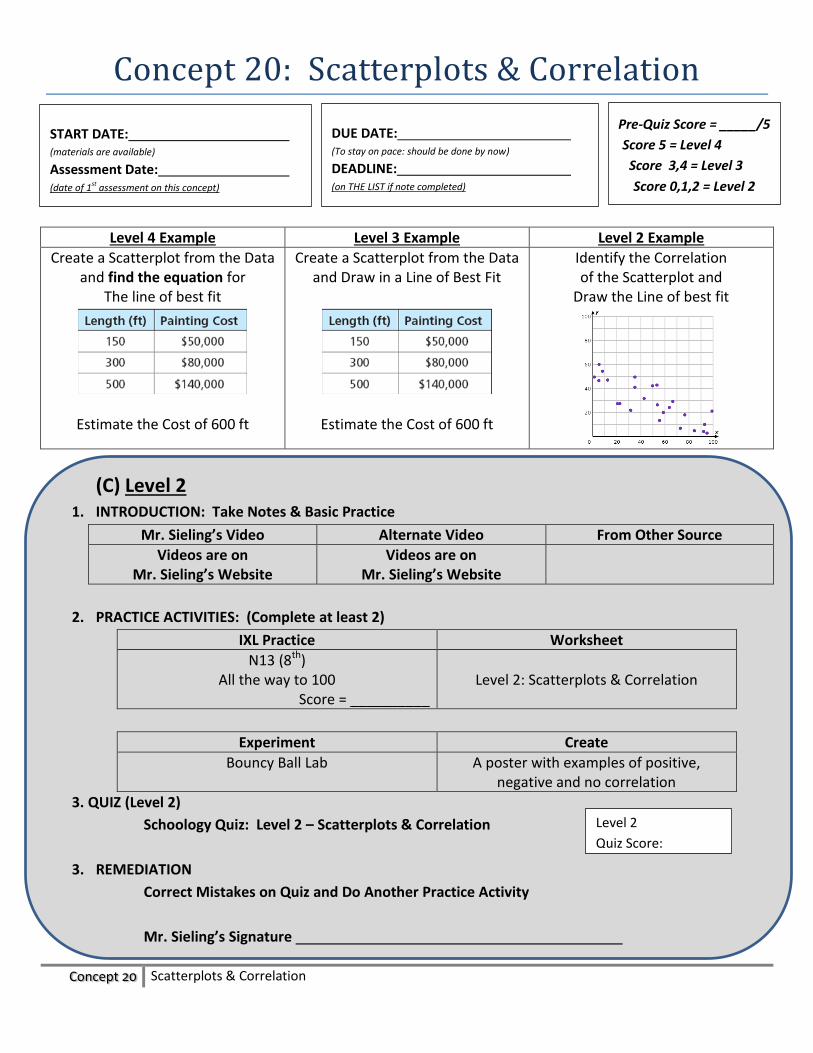
Level 4 Example Level 3 Example Level 2 Example
Create a Scatterplot from the Data and find the equation for
The line of best fit
Estimate the Cost of 600 ft
Create a Scatterplot from the Data and Draw in a Line of Best Fit
Estimate the Cost of 600 ft
Identify the Correlation of the Scatterplot and
Draw the Line of best fit
(C) Level 2
1. INTRODUCTION: Take Notes & Basic Practice
Mr. Sieling’s Video Alternate Video From Other Source
Videos are on Mr. Sieling’s Website
Videos are on Mr. Sieling’s Website
2. PRACTICE ACTIVITIES: (Complete at least 2)
IXL Practice Worksheet
N13 (8th) All the way to 100
Score = __________
Level 2: Scatterplots & Correlation
Experiment Create
Bouncy Ball Lab A poster with examples of positive, negative and no correlation
3. QUIZ (Level 2)
Schoology Quiz: Level 2 – Scatterplots & Correlation
3. REMEDIATION
Correct Mistakes on Quiz and Do Another Practice Activity
Mr. Sieling’s Signature
Pre-Quiz Score = _____/5
Score 5 = Level 4
Score 3,4 = Level 3
Score 0,1,2 = Level 2
Level 2
Quiz Score:
START DATE: (materials are available)
Assessment Date: (date of 1st assessment on this concept)
DUE DATE: (To stay on pace: should be done by now)
DEADLINE: (on THE LIST if note completed)

Concept 20 Scatterplots & Correlation
(B) Level 3
1. INTRODUCTION: Take Notes & Basic Practice
Mr. Sieling’s Video Alternate Video From Other Source
Videos are on Mr. Sieling’s Website
Videos are on Mr. Sieling’s Website
2. PRACTICE ACTIVITIES: (Complete at least 2)
IXL Worksheet
N6 (all the way to 100)
Score = __________
Level 3: Scatterplots & Correlation
Experiment Create
Foot Size & Hand Size Lab
An example of creating a scatterplot and drawing the line of best fit
3. QUIZ (Level 3)
Schoology Quiz: Level 3 – Scatterplots & Correlation
4. REMEDIATION
Correct Mistakes on Quiz and Do Another Practice Activity
Mr. Sieling’s Signature
(A) Level 4
1. INTRODUCTION: Take Notes & Basic Practice
Mr. Sieling’s Video Alternate Video From Other Source
Videos are on Mr. Sieling’s Website
Videos are on Mr. Sieling’s Website
2. PRACTICE ACTIVITIES: (Complete at least 2)
IXL Practice Worksheet
N7 (Alg1)
Score = __________
Level 4: Scatterplots & Correlation
Experiment Create
M&Ms Experiment
3. QUIZ (Level 2)
Schoology Quiz: Level 4 – Scatterplots & Correlation
4. REMEDIATION
Correct Mistakes on Quiz and Do Another Practice Activity
Mr. Sieling’s Signature
Level 3
Quiz Score:
Level 4
Quiz Score:
Concept 20 Scatterplots & Correlation
Notes Level 2:
Goals:
Create a scatterplot from given data
Identify the correlation of a scatterplot
Draw in a line of best fit by hand on a scatterplot
Notes:
Big Ideas Examples/Details
Concept # ________
Concept 20 Scatterplots & Correlation
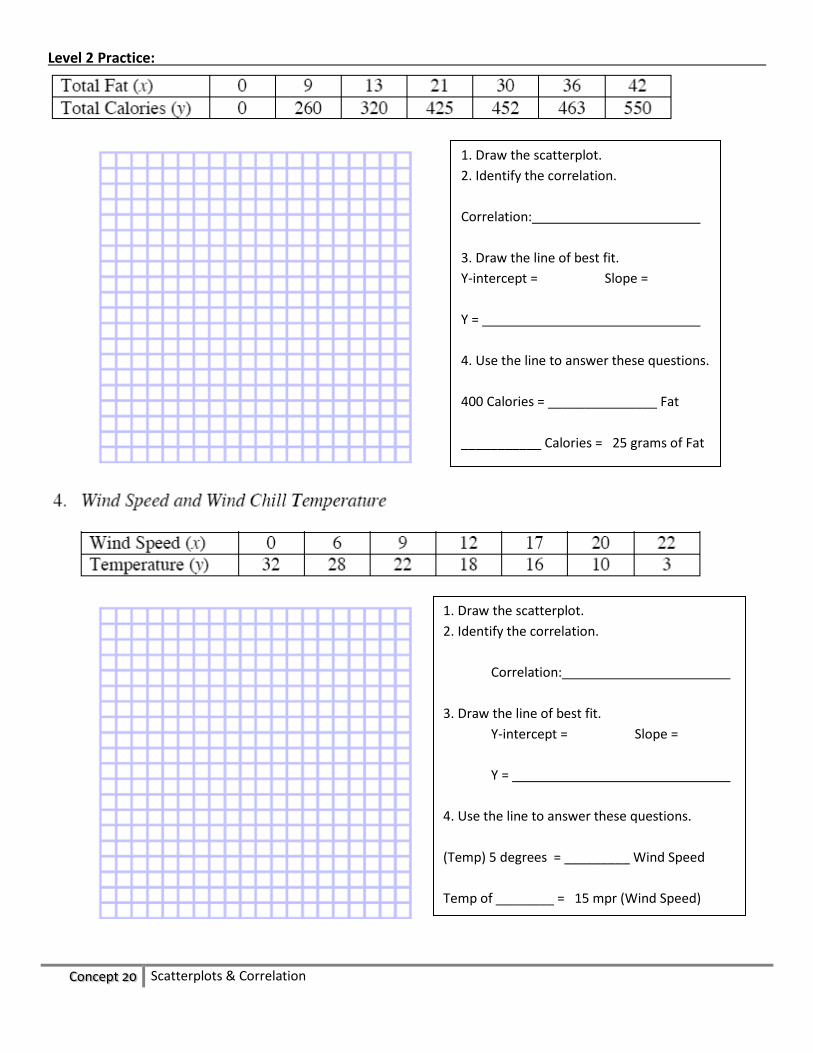
Level 2 Practice:
1. Draw the scatterplot.
2. Identify the correlation.
Correlation:
3. Draw the line of best fit.
Y-intercept = Slope =
Y =
4. Use the line to answer these questions.
400 Calories = _______________ Fat
___________ Calories = 25 grams of Fat
1. Draw the scatterplot.
2. Identify the correlation.
Correlation:
3. Draw the line of best fit.
Y-intercept = Slope =
Y =
4. Use the line to answer these questions.
(Temp) 5 degrees = _________ Wind Speed
Temp of ________ = 15 mpr (Wind Speed)
Concept 20 Scatterplots & Correlation
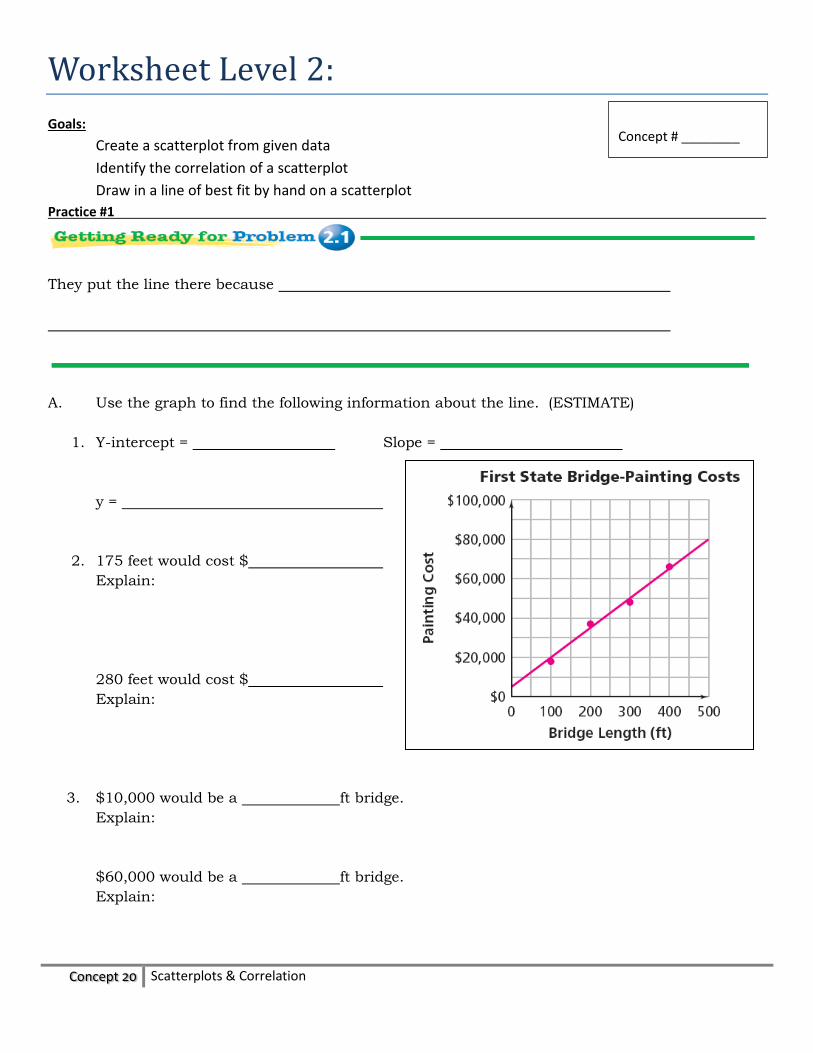
Worksheet Level 2:
Goals:
Create a scatterplot from given data
Identify the correlation of a scatterplot
Draw in a line of best fit by hand on a scatterplot
Practice #1
They put the line there because
A. Use the graph to find the following information about the line. (ESTIMATE)
1. Y-intercept = Slope =
y =
2. 175 feet would cost $
Explain:
280 feet would cost $
Explain:
3. $10,000 would be a ft bridge.
Explain:
$60,000 would be a ft bridge.
Explain:
Concept # ________
Concept 20 Scatterplots & Correlation
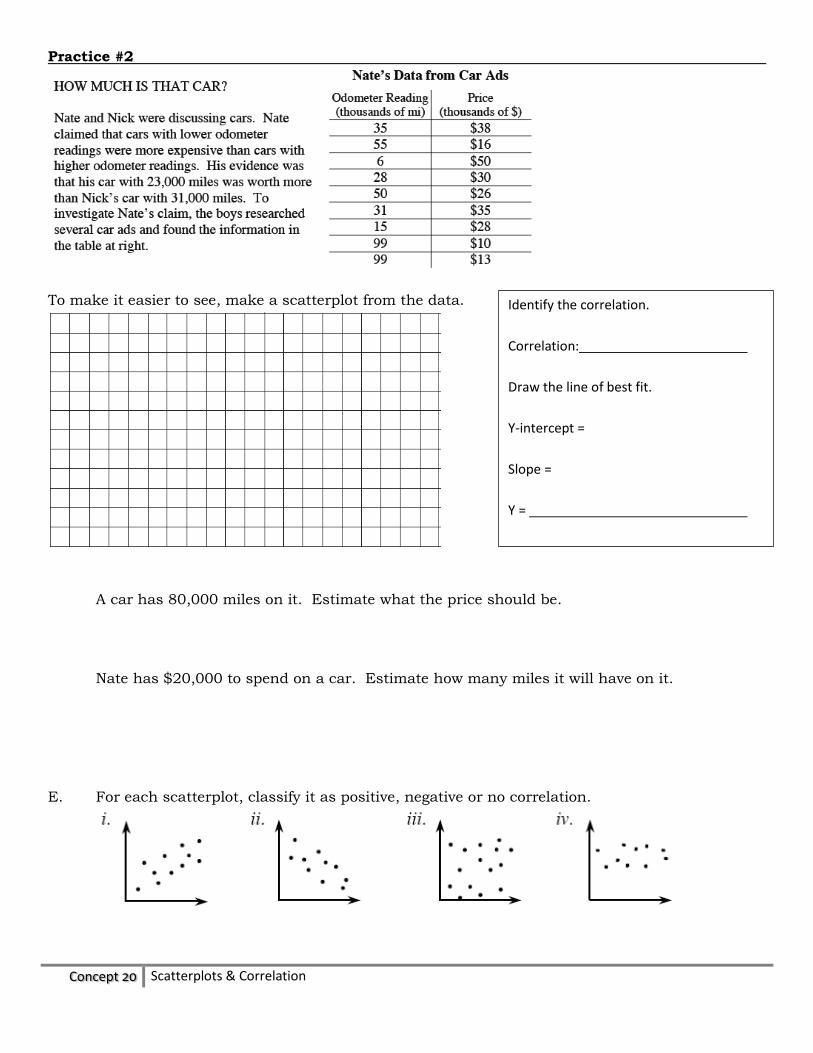
Practice #2
To make it easier to see, make a scatterplot from the data.
A car has 80,000 miles on it. Estimate what the price should be.
Nate has $20,000 to spend on a car. Estimate how many miles it will have on it.
E. For each scatterplot, classify it as positive, negative or no correlation.
Identify the correlation.
Correlation:
Draw the line of best fit.
Y-intercept =
Slope =
Y =
Concept 20 Scatterplots & Correlation
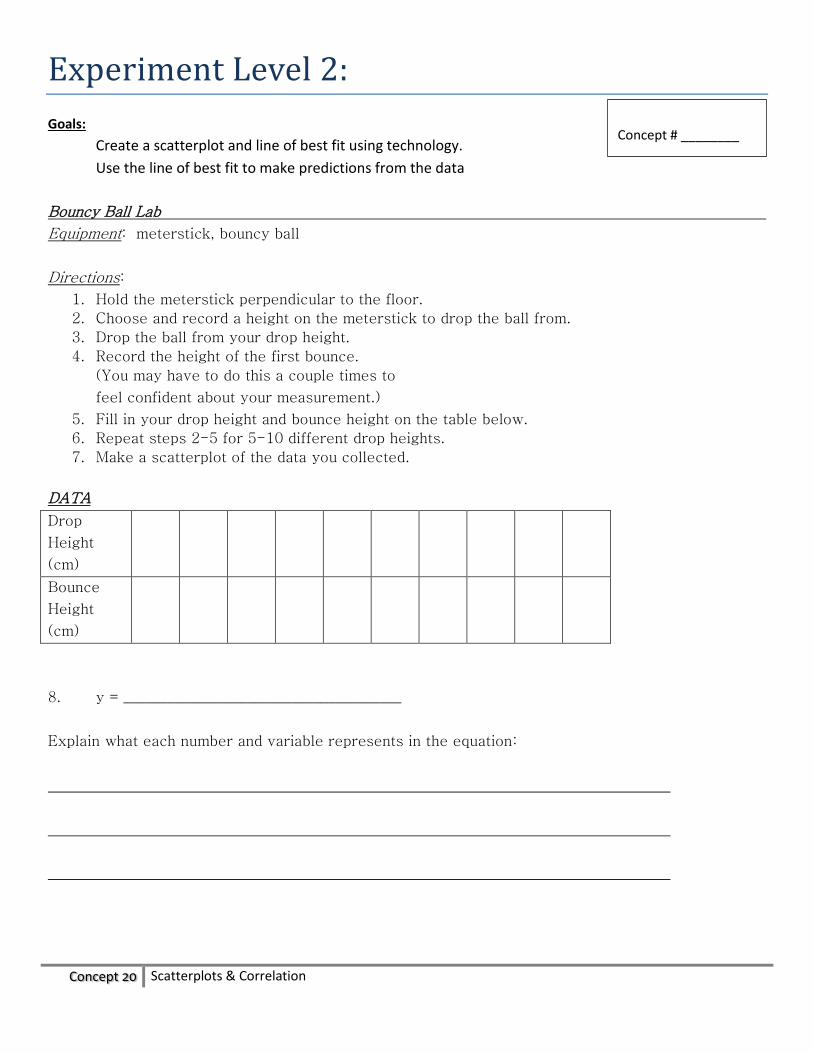
Experiment Level 2:
Goals:
Create a scatterplot and line of best fit using technology.
Use the line of best fit to make predictions from the data
Bouncy Ball Lab
Equipment: meterstick, bouncy ball
Directions:
1. Hold the meterstick perpendicular to the floor.
2. Choose and record a height on the meterstick to drop the ball from.
3. Drop the ball from your drop height.
4. Record the height of the first bounce.
(You may have to do this a couple times to
feel confident about your measurement.)
5. Fill in your drop height and bounce height on the table below.
6. Repeat steps 2-5 for 5-10 different drop heights.
7. Make a scatterplot of the data you collected.
DATA
Drop
Height
(cm)
Bounce
Height
(cm)
8. y = ______________________________________
Explain what each number and variable represents in the equation:
Concept # ________
Concept 20 Scatterplots & Correlation
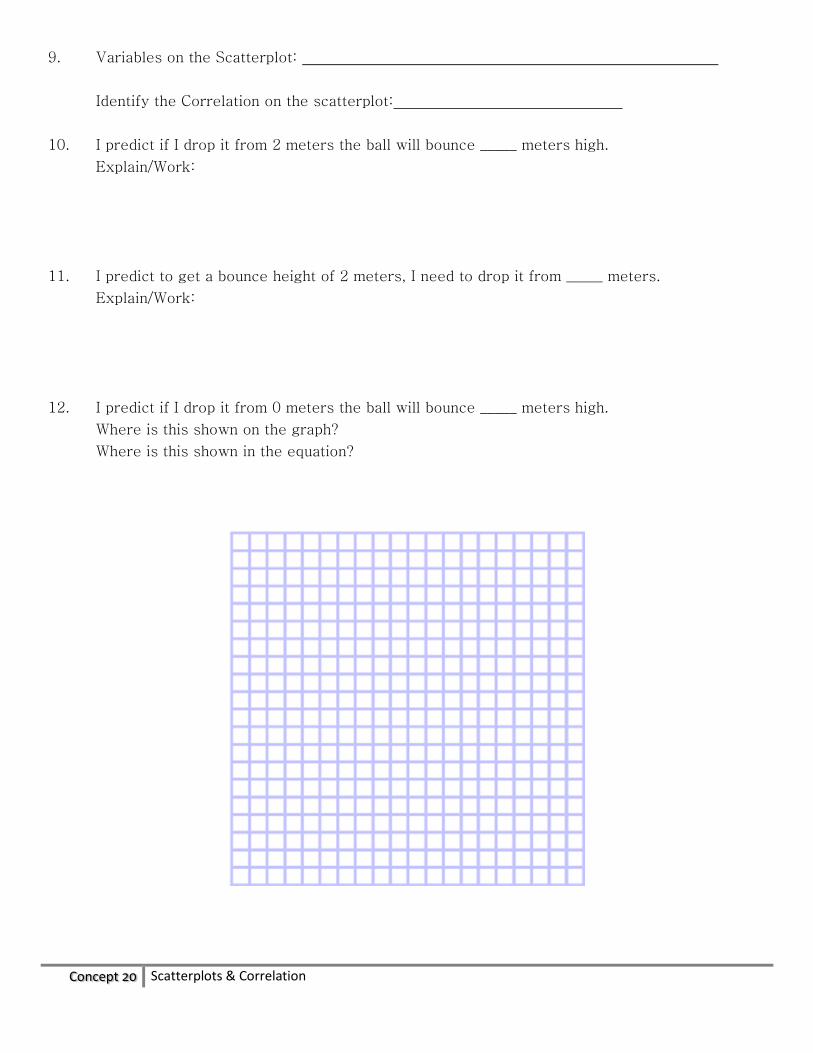
9. Variables on the Scatterplot:
Identify the Correlation on the scatterplot:
10. I predict if I drop it from 2 meters the ball will bounce _____ meters high.
Explain/Work:
11. I predict to get a bounce height of 2 meters, I need to drop it from _____ meters.
Explain/Work:
12. I predict if I drop it from 0 meters the ball will bounce _____ meters high.
Where is this shown on the graph?
Where is this shown in the equation?
Concept 20 Scatterplots & Correlation
Notes Level 3:
Goals:
Create a scatterplot and line of best fit using technology.
Use the line of best fit to make predictions from the data
Notes:
Big Ideas Examples/Details
Concept # ________
Concept 20 Scatterplots & Correlation
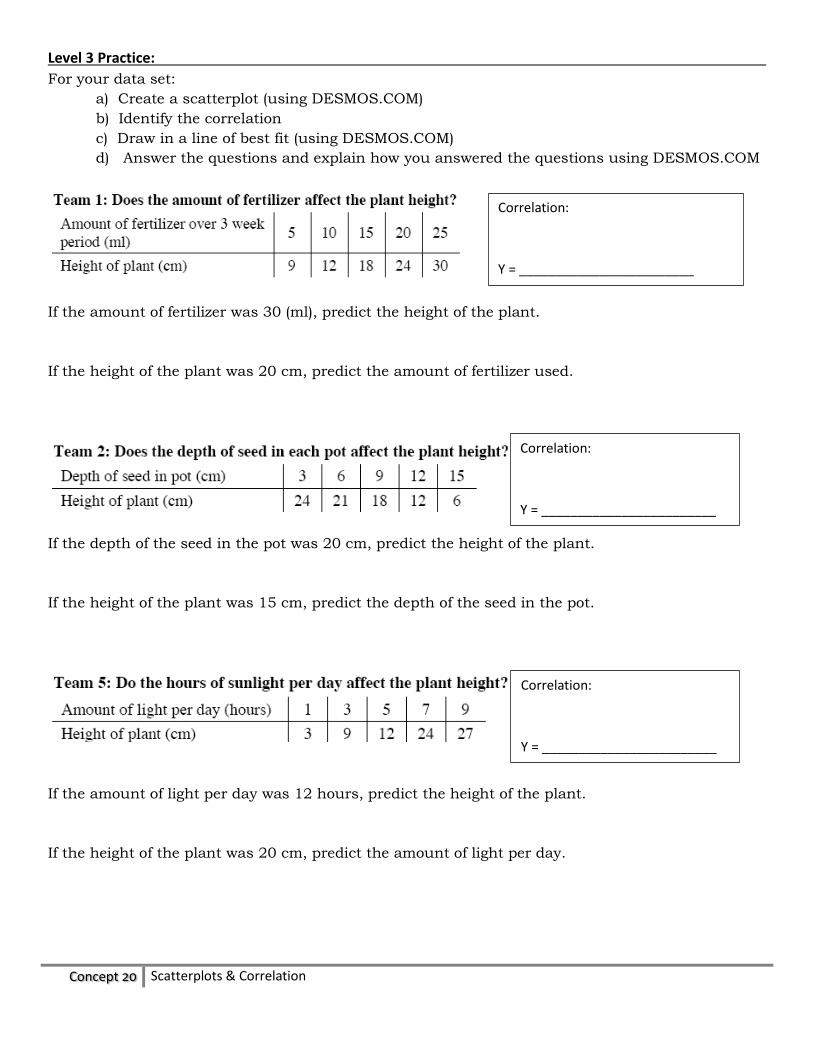
Level 3 Practice:
For your data set:
a) Create a scatterplot (using DESMOS.COM)
b) Identify the correlation
c) Draw in a line of best fit (using DESMOS.COM)
d) Answer the questions and explain how you answered the questions using DESMOS.COM
If the amount of fertilizer was 30 (ml), predict the height of the plant.
If the height of the plant was 20 cm, predict the amount of fertilizer used.
If the depth of the seed in the pot was 20 cm, predict the height of the plant.
If the height of the plant was 15 cm, predict the depth of the seed in the pot.
If the amount of light per day was 12 hours, predict the height of the plant.
If the height of the plant was 20 cm, predict the amount of light per day.
Correlation:
Y = ________________________
Correlation:
Y = ________________________
Correlation:
Y = ________________________
Concept 20 Scatterplots & Correlation
Worksheet Level 3:
Goals:
Create a scatterplot and line of best fit using technology.
Identify the correlation of a scatterplot.
Use the line of best fit to make predictions from the data
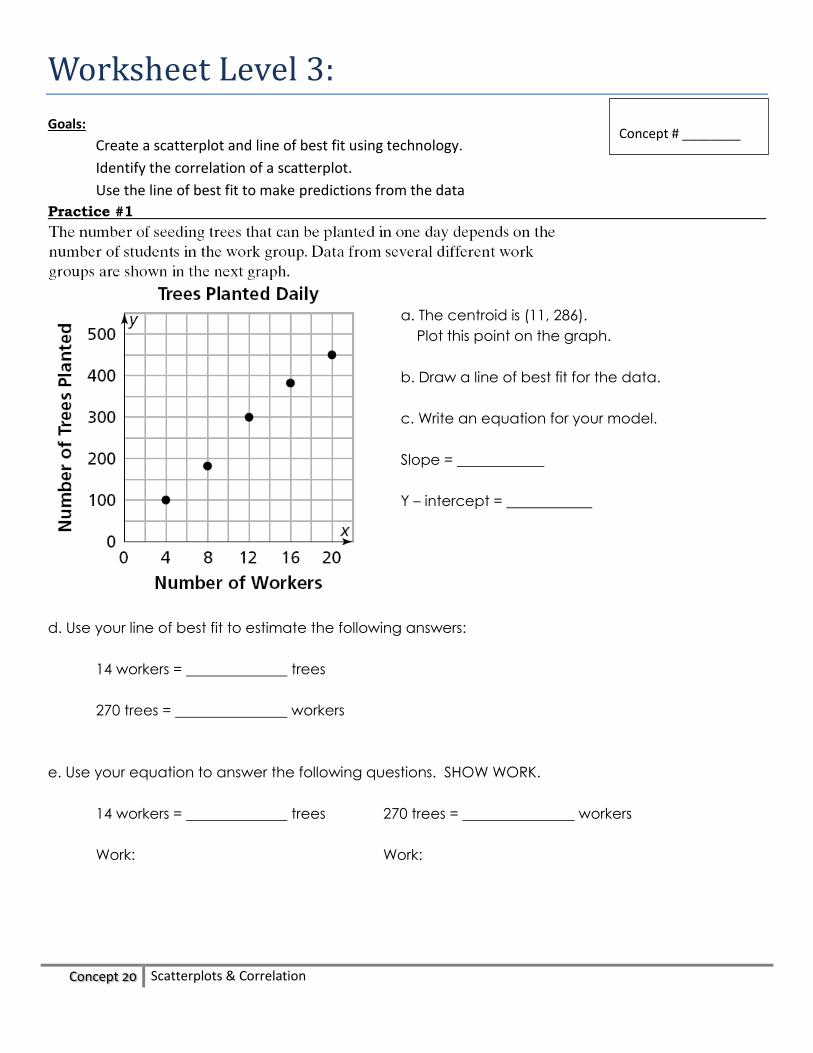
Practice #1
d. Use your line of best fit to estimate the following answers:
14 workers = trees
270 trees = workers
e. Use your equation to answer the following questions. SHOW WORK.
14 workers = trees 270 trees = workers
Work: Work:
Concept # ________
a. The centroid is (11, 286).
Plot this point on the graph.
b. Draw a line of best fit for the data.
c. Write an equation for your model.
Slope =
Y – intercept =
Equation =
Concept 20 Scatterplots & Correlation
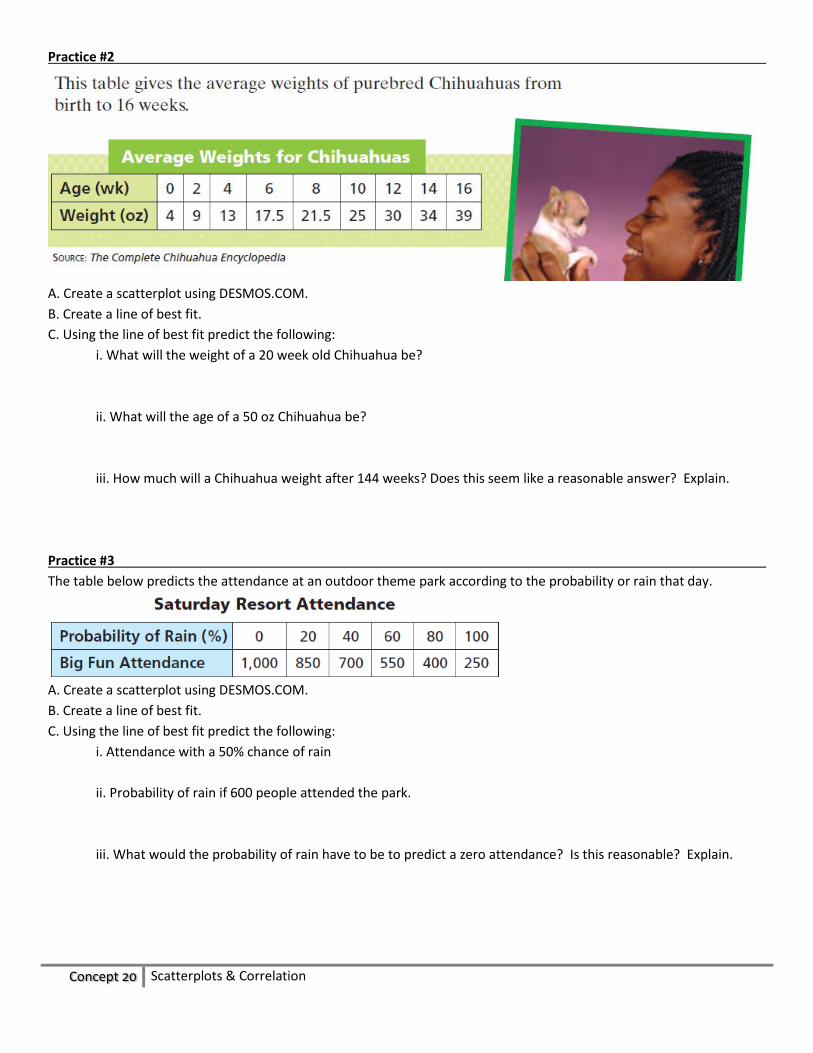
Practice #2
A. Create a scatterplot using DESMOS.COM.
B. Create a line of best fit.
C. Using the line of best fit predict the following:
i. What will the weight of a 20 week old Chihuahua be?
ii. What will the age of a 50 oz Chihuahua be?
iii. How much will a Chihuahua weight after 144 weeks? Does this seem like a reasonable answer? Explain.
Practice #3
The table below predicts the attendance at an outdoor theme park according to the probability or rain that day.
A. Create a scatterplot using DESMOS.COM.
B. Create a line of best fit.
C. Using the line of best fit predict the following:
i. Attendance with a 50% chance of rain
ii. Probability of rain if 600 people attended the park.
iii. What would the probability of rain have to be to predict a zero attendance? Is this reasonable? Explain.
Concept 20 Scatterplots & Correlation
Experiment Level 3:
Goals:
Create a scatterplot and line of best fit using technology.
Identify the correlation of a scatterplot.
Use the line of best fit to make predictions from the data
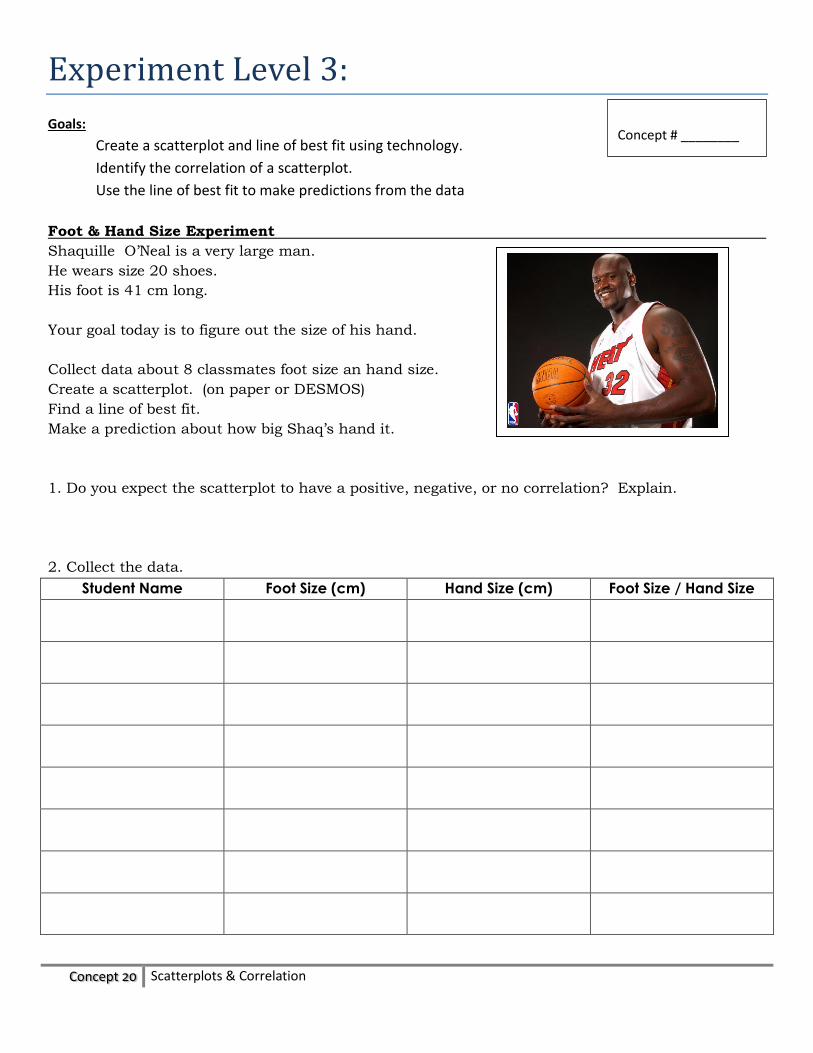
Foot & Hand Size Experiment
Shaquille O’Neal is a very large man.
He wears size 20 shoes.
His foot is 41 cm long.
Your goal today is to figure out the size of his hand.
Collect data about 8 classmates foot size an hand size.
Create a scatterplot. (on paper or DESMOS)
Find a line of best fit.
Make a prediction about how big Shaq’s hand it.
1. Do you expect the scatterplot to have a positive, negative, or no correlation? Explain.
2. Collect the data.
Student Name Foot Size (cm) Hand Size (cm) Foot Size / Hand Size
Concept # ________
Concept 20 Scatterplots & Correlation
3. Create your graph on graph paper or DESMOS. Draw in the line of best fit.
4. Write down the linear regression line. (the equation for the line of best fit)
Y =
What is the slope? What is the y-intercept?
6. Use your linear model to predict Shaq’s hand size. Explain.
Shaq’s Hand Size = cm

Concept 20 Scatterplots & Correlation
Concept 20 Scatterplots & Correlation
Notes Level 4:
Goals:
Create scatterplots and identify correlation
Create a line of best fit that may be linear or exponential.
Make predictions from the line of best fit.
Notes:
Big Ideas Examples/Details
Concept # ________
Concept 20 Scatterplots & Correlation
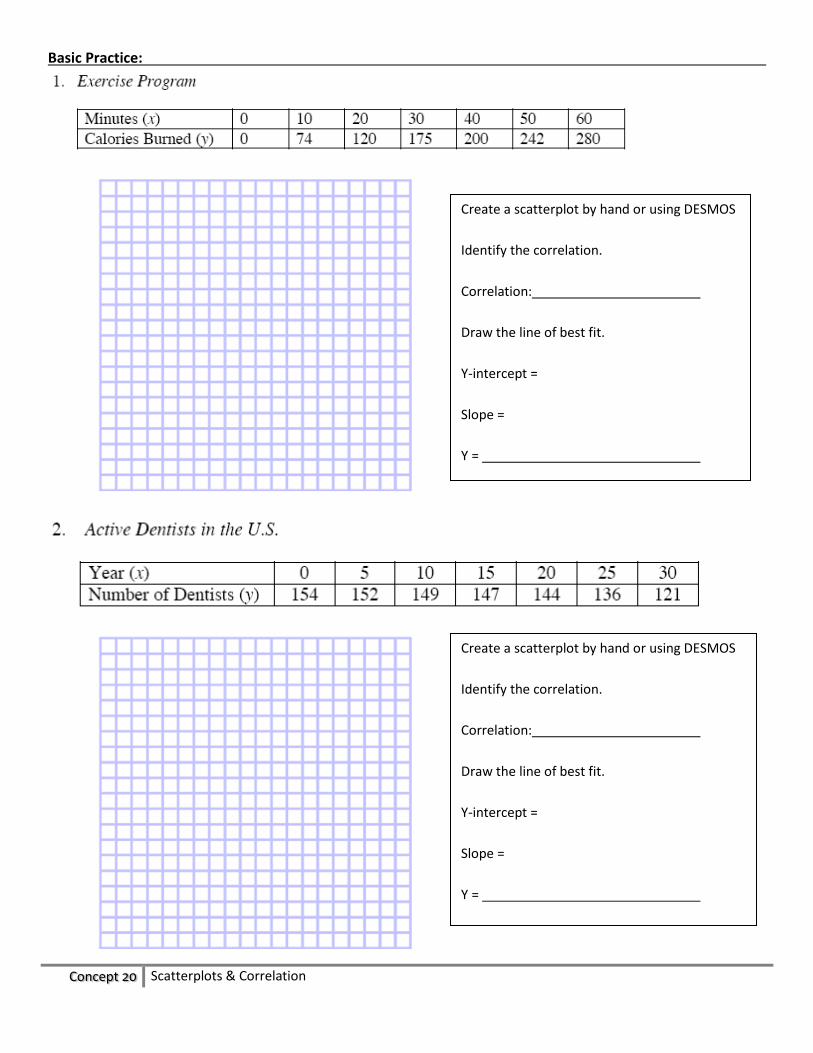
Basic Practice:
Create a scatterplot by hand or using DESMOS
Identify the correlation.
Correlation:
Draw the line of best fit.
Y-intercept =
Slope =
Y =
Create a scatterplot by hand or using DESMOS
Identify the correlation.
Correlation:
Draw the line of best fit.
Y-intercept =
Slope =
Y =
Concept 20 Scatterplots & Correlation
Worksheet Level 4:
Goals:
Create scatterplots and identify correlation
Create a line of best fit that may be linear or exponential.
Make predictions from the line of best fit
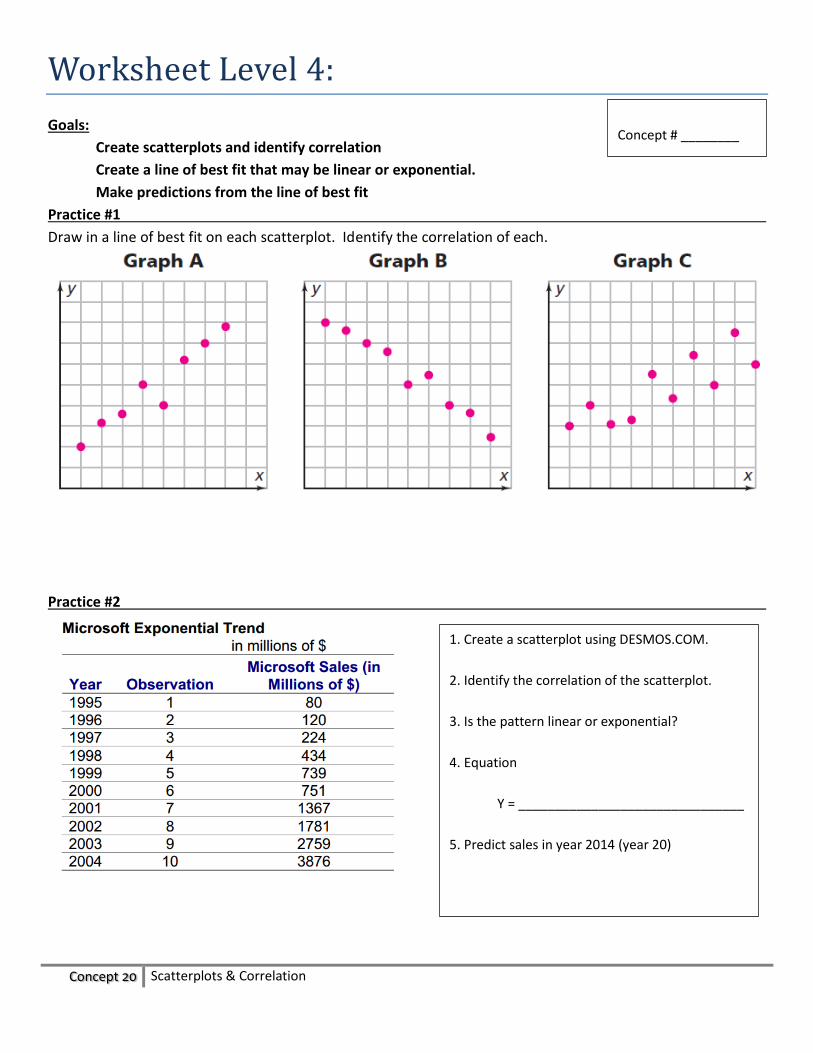
Practice #1
Draw in a line of best fit on each scatterplot. Identify the correlation of each.
Practice #2
Concept # ________
1. Create a scatterplot using DESMOS.COM.
2. Identify the correlation of the scatterplot.
3. Is the pattern linear or exponential?
4. Equation
Y = _______________________________
5. Predict sales in year 2014 (year 20)
Concept 20 Scatterplots & Correlation
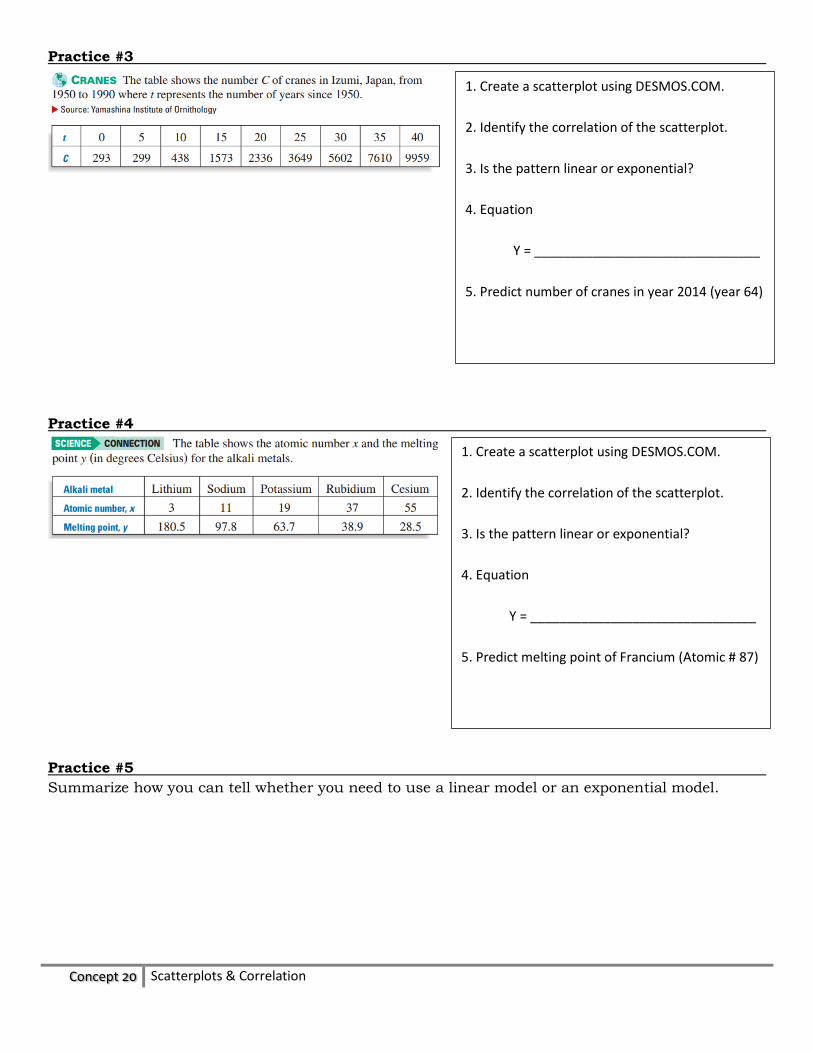
Practice #3
Practice #4
Practice #5
Summarize how you can tell whether you need to use a linear model or an exponential model.
1. Create a scatterplot using DESMOS.COM.
2. Identify the correlation of the scatterplot.
3. Is the pattern linear or exponential?
4. Equation
Y = _______________________________
5. Predict number of cranes in year 2014 (year 64)
1. Create a scatterplot using DESMOS.COM.
2. Identify the correlation of the scatterplot.
3. Is the pattern linear or exponential?
4. Equation
Y = _______________________________
5. Predict melting point of Francium (Atomic # 87)
Concept 20 Scatterplots & Correlation
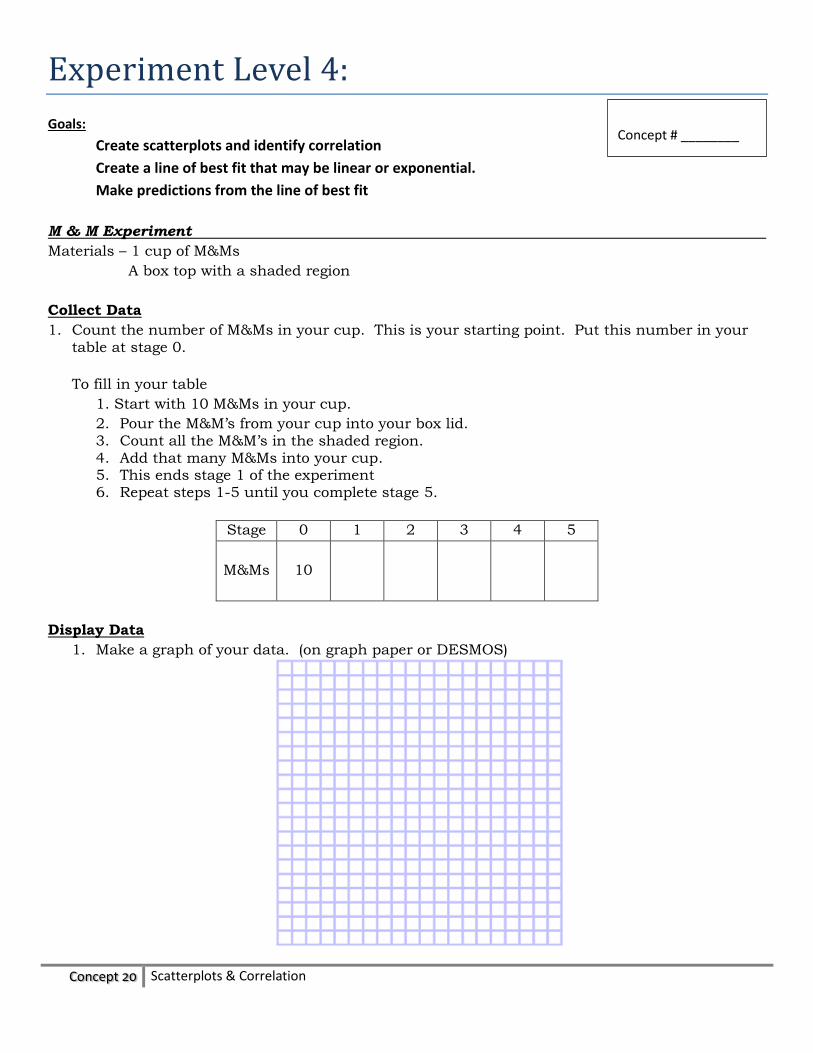
Experiment Level 4:
Goals:
Create scatterplots and identify correlation
Create a line of best fit that may be linear or exponential.
Make predictions from the line of best fit
M & M Experiment
Materials – 1 cup of M&Ms
A box top with a shaded region
Collect Data
1. Count the number of M&Ms in your cup. This is your starting point. Put this number in your
table at stage 0.
To fill in your table
1. Start with 10 M&Ms in your cup.
2. Pour the M&M’s from your cup into your box lid. 3. Count all the M&M’s in the shaded region. 4. Add that many M&Ms into your cup. 5. This ends stage 1 of the experiment 6. Repeat steps 1-5 until you complete stage 5.
Stage 0 1 2 3 4 5
M&Ms
10
Display Data
1. Make a graph of your data. (on graph paper or DESMOS)
Concept # ________
Concept 20 Scatterplots & Correlation
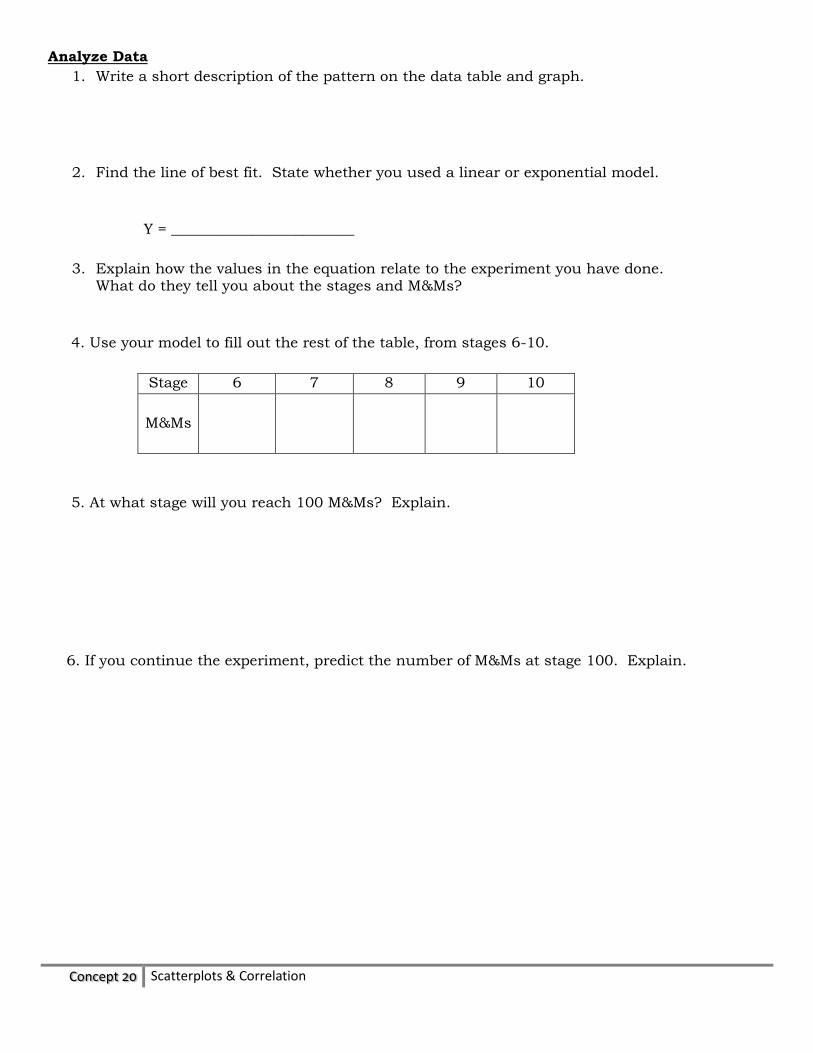
Analyze Data
1. Write a short description of the pattern on the data table and graph.
2. Find the line of best fit. State whether you used a linear or exponential model.
Y = _________________________
3. Explain how the values in the equation relate to the experiment you have done. What do they tell you about the stages and M&Ms?
4. Use your model to fill out the rest of the table, from stages 6-10.
Stage 6 7 8 9 10
M&Ms
5. At what stage will you reach 100 M&Ms? Explain.
6. If you continue the experiment, predict the number of M&Ms at stage 100. Explain.