concept mapping as a technique for scaffolding …
TRANSCRIPT

CONCEPT MAPPING AS A TECHNIQUE FOR SCAFFOLDING CONCEPT
LITERACY IN ACCOUNTING: THE CASE OF AN EXTENDED
PROGRAMME
by
Susan Immelman
Submitted in accordance with the requirements for the degree
Master of Arts in Applied Linguistics
in the Unit for Academic Literacy
at the University of Pretoria
Faculty of Humanities
Supervisor:
Prof. Adelia Carstens
Co-supervisors:
Ms Sonnette Smith
Dr Avasha Rambiritch
February 2018
ii
Abstract
While great strides have been made to improve accessibility to higher education in South Africa,
the educational excellence that is required to build a strong economy remains elusive, as
evidenced by low throughput numbers. Research suggests that students’ lack of conceptual
understanding might be at the heart of the problem. This study investigates the value of
concept mapping as a scaffolding technique to improve conceptual understanding.
Postpositivism served as the epistemological framework for the research. The quantitative
dimension involved a quasi-experiment with a test and a control group, whereas the qualitative
dimensions included questionnaire responses and observation. It was hypothesised that
Accounting students in an extended programme who were introduced to the concept mapping
technique would have an improved grasp of Accounting concepts, as would be indicated by an
improvement in their marks when completing an explantory paragraph of Accounting concepts
after the intervention. Qualitative data on students’ experience of using visual aids, and concept
mapping in particular, were also analysed. Students’ post-intervention marks of the test group
showed no improvement, and therefore no proof can be offered to support the claim that
concept mapping improves conceptual understanding. An analysis of students’ attitudes
towards concept mapping did, however, show enthusiam for the technique. Limitations of the
study included the absence of a pilot study and the time required to become familiar with
concept mapping. An unforeseen constraint on the study was the low student participation.
Key words: concept mapping, concept literacy, throughput, scaffolding, Constructivism, rote
learning, meaningful learning, visual aids, core concepts, extended programme

iii
Table of Contents
Abstract ................................................................................................................................................... ii
Table of Contents ................................................................................................................................... iii
Chapter 1: Introduction .......................................................................................................................... 1
1.1 Aim of the research ................................................................................................................. 1
1.2 Introduction to the chapter .................................................................................................... 1
1.3 Context and rationale ............................................................................................................. 2
1.3.1 Access and underpreparedness in South African Higher Education ............................... 2
1.3.2 Initial attempts at a solution: extended and augmented programmes .......................... 3
1.3.3 Challenges in mastering core concepts in core disciplines ............................................. 5
1.4 Overview of the empirical literature....................................................................................... 7
1.4.1 Studies in understanding concepts ................................................................................. 7
1.4.2 Dearth of studies on the pedagogical effectiveness of concept mapping in facilitating
concept literacy in Accounting ........................................................................................................ 8
1.4.3 A few notes on Accounting education .......................................................................... 10
1.5 Research questions ............................................................................................................... 11
1.6 Hypotheses ........................................................................................................................... 11
1.7 Chapter preview .................................................................................................................... 11
Chapter 2: Theoretical overview ........................................................................................................... 13
2.1 Introduction .......................................................................................................................... 13
2.2 The problem of rote learning ................................................................................................ 13
2.3 Constructivist theories of learning ........................................................................................ 14
2.3.1 What do constructivist theories of learning entail? ..................................................... 14
2.3.2 Piaget ............................................................................................................................ 14
2.3.3 Vygotsky and the notion of scaffolding ........................................................................ 16
2.3.4 Schema Theory .............................................................................................................. 17
2.3.5 Assimilation Theory ....................................................................................................... 19
2.3.6 Learning through transmission and Learning through discovery ................................. 20
2.4 Concept mapping as scaffolding tool .................................................................................... 22
2.4.1 Introduction .................................................................................................................. 22
2.4.2 Concept mapping as a scaffolding tool for meaningful learning .................................. 22
2.5 Conclusion ............................................................................................................................. 36
iv
Chapter 3: Methodology ....................................................................................................................... 37
3.1 Introduction .......................................................................................................................... 37
3.2 Research paradigm ............................................................................................................... 37
3.3 Research design and strategy ............................................................................................... 38
3.4 Population and sampling...................................................................................................... 39
3.5 Setting ................................................................................................................................... 41
3.6 Methods of data gathering ................................................................................................... 42
3.6.1 Pre-intervention questionnaire survey of students' experience in using visualisation
techniques for learning and memorisation .................................................................................. 42
3.6.2 Pre- and post-intervention expository paragraph ........................................................ 45
3.6.3 The concept maps ......................................................................................................... 51
3.6.4 Observation of concept mapping intervention ............................................................. 55
3.6.5 Post-intervention opinion survey (questionnaire) ........................................................ 55
3.7 Ethical considerations ........................................................................................................... 57
3.8 Conclusion ............................................................................................................................. 58
Chapter 4: Research findings and discussion ........................................................................................ 59
4.1 Introduction .......................................................................................................................... 59
4.2 Findings ................................................................................................................................. 59
4.2.1 Comparison of pre-intervention questionnaire responses of test and control groups 59
4.2.2 Pre- and post-intervention paragraph marks ............................................................... 61
4.2.3 Comparisons between the quantitative pre-intervention questionnaire results and the
results of the two groups .............................................................................................................. 63
4.2.4 The quantitative results of the post-intervention questionnaire ................................. 74
4.2.5 Possible link between pre- and post-intervention questionnaire responses for
memorisation and understanding ................................................................................................ 76
4.3 Research findings and analysis of the qualitative data ......................................................... 78
4.3.1 The qualitative data from the pre-intervention questionnaire .................................... 79
4.3.2 The qualitative data from the post-intervention questionnaire................................... 84
4.3.3 Observations of the concept mapping intervention ..................................................... 90
4.4 Relating the data to the first research sub-question ............................................................ 92
4.5 Relating the data to the second research sub-question ....................................................... 93
4.6 Relating the results to the research question ....................................................................... 94
4.7 Accepting or rejecting the hypothesis .................................................................................. 94
4.8 Factors influencing the results .............................................................................................. 95
4.9 Conclusion ............................................................................................................................. 96

v
Chapter 5: Conclusion ........................................................................................................................... 97
5.1 Introduction .......................................................................................................................... 97
5.2 Overview of the study ........................................................................................................... 97
5.3 Limitations of the study ...................................................................................................... 101
5.4 Suggestions for further research ........................................................................................ 102
Bibliography ........................................................................................................................................ 104
Appendices .......................................................................................................................................... 112
Appendix A ...................................................................................................................................... 113
Appendix B ...................................................................................................................................... 116
Appendix C ...................................................................................................................................... 118
Appendix D ...................................................................................................................................... 119
Appendix E ...................................................................................................................................... 121
Appendix F ...................................................................................................................................... 123
Appendix G ...................................................................................................................................... 129
Appendix H ...................................................................................................................................... 132
Appendix I ....................................................................................................................................... 136
1
Chapter 1: Introduction
1.1 Aim of the research
The purpose of this study is to investigate the effectiveness of concept mapping as a scaffolding
technique in students’ acquisition of concept literacy in an Accounting course. The research is
based on the premise that the multimodal nature of concept maps allows students a deeper
conceptual understanding of subject-specific terms than linear, text-based strategies on their
own.
Concept mapping, based on Ausubel’s Assimilation Theory, is a learning tool that was designed
by Novak (2002) to mirror the knowledge or cognitive structures created in the mind of the
learner when assimilating new concepts with prior knowledge (Leauby, Szabat & Maas,
2010:281; Novak & Cañas, 2008:7; Simon, 2007:274; Safayeni, Derbentseva & Cañas, 2005:2;
Maas & Leauby, 2005:76 & 79; Carnot, Feltovich, Hoffman, Feltovich & Novak, 2003) and to
make such knowledge explicit (Novak, 2010:111; Simon, 2007:274).
1.2 Introduction to the chapter
This chapter discusses the ongoing problems of access and underpreparedness of university
students, and how it affects throughput, despite the many interventions available. The initial
attempts at offering a solution to the problem of throughput will be discussed briefly. From this
discussion, the importance of mastering core concepts in core disciplines as a factor vital to
success will emerge. As will be seen, studies that have attempted to improve concept literacy
have had limited success so far. These studies made use of a variety of means (Jonker, 2016;
Madiba, 2014; Gablasova, 2012; Paxton, 2009), including the use of concept mapping across
various disciplines, such as Religion (Pui-lan, 2010), Health (Brennan, Brownson, Kelly, Ivey &
Leviton, 2012), Nursing (Clarke, 2015), Biology (Kinchin, 2000) and Accounting (Leauby et al.,
2010:287; Simon, 2007; Maas & Leauby, 2005).This explains the rationale for the present study.
The chapter concludes with the research questions and hypotheses of the study, and a preview
of the chapters that are to follow.

2
1.3 Context and rationale
1.3.1 Access and underpreparedness in South African Higher Education
The global objectives of access and excellence in higher education (Beckham, 2000:15) are of
particular significance for South Africa given its problematic background, as these objectives
need to be aligned, on the one hand, with rectifying the injustices of the past (Volbrecht &
Boughey, 2004:58), and the need to be competitive internationally, on the other (Novak,
2010:22). Since 1994, the objective of equality in access to higher education (CHE, 2013) has
been the focus of Higher Education in South Africa, as can be seen in numerous policy
documents, including the Education White Paper 3 (Department of Education, 1997), National
Plan for Higher Education (Ministry of Education, 2001), Strategic Plan 2011-2015 (Department
of Higher Education and Training, 2010) and Revised Strategic Plan 2010/11-2014/2015
(Department of Higher Education and Training, 2011). This move was particularly aimed at
redressing the disparities that existed in the country before the establishment of democracy
(Badsha & Harper, 2000:27).
There has been an increase of 80% in Higher Education participation since 1994 to a total of
more than 900 000 enrolments by 2010 (CHE, 2013:39). More significantly, towards the end of
the 1990s, large numbers of Black students were enrolling in previously White only institutions
(Badsha & Harper, 2000:28), with Black students making up almost half of the total number of
students at the University of Cape Town by 2004 (University of Cape Town, 2017). Black
students made up 79% of the total enrolment across the sector by 2010 (CHE, 2013:39). At
present, approximately 50% of the students at the University of Pretoria is Black (Bureau:
Institutional Research & Planning, 2016), 57% at the University of the Witwatersrand (2015) and
72% at the University of the Free State ([n.d.]).
However, it was soon realised that access in itself does not guarantee success, let alone the
excellence in education that is the desired outcome. It is apparent that there is a vast
discrepancy between the “elementary cognitive level” required at school and “higher-order
thinking skills” required at university (Joseph & Ramani, 2004:238). Furthermore, university
students do not have the necessary proficiency in their field of study, be it Accounting (Wilson,
Abraham & Mason, 2014:56; Maas & Leauby, 2005), Chemistry (Novak, 2002:77) or Science
(Norris & Phillips, 2003:235). This lack is especially noticeable with first year students (Nkomo &
Madiba, 2011:155). Students who manifest these problems are considered insufficiently

3
prepared for tertiary education, and the term now often used for such students is
“underprepared”. Koh (2014:456) reports that underpreparedness has been identified as one of
the primary reasons for students not completing their courses on time, if at all. It is therefore
clear that underprepared students are a factor in the attainment of the dual ideal of
educational success and excellence.
1.3.2 Initial attempts at a solution: extended and augmented programmes
There have been many attempts to address the problem of underpreparedness. Before the
advent of democracy in South Africa, academic support was made available to the small
numbers of Black students who had been allowed entrance into a university (Volbrecht &
Boughey, 2004:59). Subsequently, a variety of support courses, influenced by differing
philosophies, began to emerge in response to the issue of underpreparedness encountered in
the larger numbers now able to access higher education, with the intention of providing equal
opportunities for all (Mckenna, 2012:51; Boughey, 2010:5). As the numbers of students
increased, the format of academic support, or academic development as it came to be called
(Volbrecht & Boughey, 2004:63), began to take on many forms, from add-on support classes for
small groups of students, to bridging or foundation courses and extended or four-year
programmes, to absorption into and adjustment of mainstream courses (Mckenna, 2012:52;
Volbrecht & Boughey, 2004:63), and, ultimately, “institutional transformation” (Boughey,
2010:11). Support for students who are considered underprepared has, therefore, in many
cases, moved “from the margins to the mainstream” (Volbrecht & Boughey, 2004:65). However,
the varied nature of educational support is a response to more than the changing face of the
student body: it also forms a bridge between the ailing school system (Jonker, 2016:5) and
tertiary education. Thus, some higher education institutions currently offer subject-specific
academic development courses that are obligatory for all first year students.
Despite the proliferation of intervention types, the disappointing throughput rates since the
introduction of the DHE’s policies on wider access to higher education, in particular for
previously disadvantaged students, continue to cause concern and offer evidence of the failure
to intervene constructively (CHE, 2013:40). The CHE (2015) report gives the throughput rate for
completion of a three-year degree in the prescribed time as 23% for Black students, 25% for
Coloured students, 27% for Indian students and 43% for White students (CHE, 2015:63). It takes
another three years (the degree consequently being a six-year degree) for Black student

4
throughput to reach 55%, for Coloured student throughput to reach 51%, for Indian student
throughput to reach 61% and for White student throughput to reach 65% (CHE, 2015:63). Thus,
it takes twice the minimum completion time stipulated for half of the enrolled Black and
Coloured students to pass, both of which groups fall within the category of previously
disadvantaged. Even though the Indian students have a higher eventual throughput (61%), two
thirds of the students need six years to achieve this outcome, with only 27% passing in the
prescribed minimum time.
The CHE report also shows that extended degree programmes hardly fare better, with two-
thirds of the previously disadvantaged students taking six years to pass (CHE, 2015:64). In the
extended programme of the University of Pretoria, where this research is based, the
throughput rate in the allotted time for previously disadvantaged students shows a steady drop
from 20% in 2008, which is already low, to 8% in 2011 (Bureau: Institutional Research &
Planning, 2016). This extended programme is not exclusive to previously disadvantaged
students; rather, it is open to any student who has not attained the minimum requirements to
study for either a BSc or a BCom degree. It is therefore interesting to note that the pass rate for
white students on the programme for the same period is not much better. The 2008 pass rate
of 15% dropped to 6% in 2010 before recovering to 14% in 2011 (Bureau: Institutional Research
& Planning, 2016). While this is higher than the pass rate for previously disadvantaged students,
it is hardly indicative of success, and suggests that the problem of unpreparedness might now
be wider than previously thought, at least at foundation year level. What is certain, though, is
that this situation is plainly a great drain on both time and finances, and thus unsustainable.
Despite the interventions proposed in numerous Higher Education policy documents in the
years since the transition to a democratic government, the educational challenges persist and
we are clearly in need of alternative solutions. It is apparent that the idea of that which
disadvantages a student educationally is multi-faceted, being more than simply an issue of
access (Mckenna, 2012:52).
A particularly crucial issue arising from the multilingual South African context is language access
(Carstens, 2015:2; Mckenna, 2012:52; Nkomo & Madiba, 2011). Some would argue that the
majority of students have been sufficiently socialised in English by means of popular media;
however, this language socialisation is of a non-academic nature (Boughey, 2012:144). As
present research emphasises the importance of language usage in the expression of content

5
knowledge, the challenge, for many students, is therefore both conceptual (content) and
linguistic in nature (Madiba, 2014:68; Gablasova, 2012:13).
Context-specific language links to epistemological access, the “traditions of inquiry that were
developed and refined by the disciplines over time” (Jonker, 2016:5). Gajo (2007:568) sees
discourse as “structured by both the subject and the linguistic paradigms, which are at the same
time structured by it” and that “the process of putting subject knowledge into discourse
corresponds to a process of mediation”. Students new to the higher education environment are
bewildered by the unspoken rules of engagement in the various university disciplines
(Mckenna, 2012:58; Boughey, 2012; see also Lessard-Clouston, 2008:32). Because of the
unfamiliarity of the academic context, students therefore often contextualise subject-specific
information within their own, known backgrounds (Boughey, 2005; Meyer & Land, 2005:379;
see also Novak, 2010:44). Novak (2010:44) goes so far as to consider students and teachers, in
many ways, to be culturally “significantly different”.
Unless “the gaps between the respective worlds students and lecturers draw on” are bridged,
this divide remains (Boughey, 2005:240). The fact that what constitutes the discourse of a
discipline is often unclear, as it is based on implicit knowledge, is a further complicating factor in
the acquisition of academic literacy (Dalton-Puffer, 2011:196). At the most fundamental level,
the lack of epistemological access speaks to the lack of conceptual understanding of subject-
specific terminology, as a discipline is accessed through its vocabulary (Gablasova, 2012:35).
Without a clear grasp of the terms that inform a discipline, all knowledge scaffolded onto a
faulty conceptual understanding will be problematic.
We consequently need to look at ways of improving students’ understanding of the concepts
that are essential to their core subjects and not only their knowledge of appropriate
terminology and, in doing so, to improve their access to the epistemologies of their chosen
subject. The next section elaborates on the idea of conceptual understanding and concept
literacy.
1.3.3 Challenges in mastering core concepts in core disciplines
For this discussion, it is necessary to clarify the relationship between a term and a concept. The
vocabulary of general language is made up of words, whereas the vocabulary of a scientific
discipline is made up of specific terms that collectively make up its ‘terminology’ (Alberts,
6
2001:76). These terms represent concepts or “units of meaning” (Croft & Cruse, 2004:7) that
can be considered as “the building blocks of human knowledge” (Jonker, 2016:55). While a term
may be represented by a definition, a conceptual understanding of the term is essential to get
hold of its deeper significance (Novak, 2010:43). Furthermore, as terms and concepts are
inextricably linked, acquisition of one must be accompanied by acquisition of the other to
facilitate conceptual or meaningful understanding.
Concepts themselves are interrelated and cannot exist in isolation (Croft & Cruse, 2004:7;
Novak, 2002:552). Knowledge, then, according to Novak (2010:133), is “a well-organized
framework of concepts and propositions”. Accordingly, in order to understand a subject,
knowing the interrelations between its concepts is necessary. For a learning area, specific
concepts that are central to the subject are similarly interrelated so that understanding the core
concepts of a subject leads to understanding the subject.
From the idea of conceptual understanding has emerged the term “concept literacy”, which is
defined as the ability to “read, understand and use the learning area-specific words, terms and
related language forms which are part of knowledge formation in the different disciplines or
content areas” (Young, Van der Vlugt & Qanya, 2005). From this definition, the link between
understanding a concept and the language needed to express that understanding is made clear.
In fact, according to Vygotsky (1986:107), words are the “functional tools” needed to express
concepts, without which concepts cannot be communicated.
While concept literacy is a recent idea (Madiba, 2014), this relationship between language and
content (Gablasova, 2012:13), or what Gajo (2007:565) calls “the linguistic issues in subject
knowledge and the subject issues in linguistic knowledge” [author’s emphasis], has been
recognised for some time. In fact, according to Gablasova (2012:13), “part of mastering the
subject-matter is the learning of the appropriate way of communicating it”. This suggests that
scientific concepts have to be taught through classroom instruction, as opposed to the
acquisition of everyday concepts, which are acquired spontaneously (Vygotsky, 1986:157).
Vygotsky (1986:150), however, warns against the rote teaching of concepts as this may result in
“simulating a knowledge of the corresponding concepts but actually covering up a vacuum”.
Similarly, Novak and Gowin (1984:94) point out that students might show proficiency in solving
problems because certain solutions have been memorised, yet fail when unfamiliar problems
are set. This is evidence that the concepts have been learned but not understood.

7
Some of the literature refers to the term threshold concepts as distinct from core concepts in
that threshold concepts (Meyer & Land, 2005:373) are seen as providing an essential gateway
into a discipline “without which the learner cannot progress” (Knight, Callaghan, Baldock &
Meyer, 2014:126). However, while it is indisputable that the identification of the threshold
concepts for a specific discipline is complicated (Knight et al., 2014), the authenticity of the
Threshold Concept Hypothesis has been questioned (O'Donnell, 2010). Core concepts rather
than threshold concepts is therefore the term employed in this research.
1.4 Overview of the empirical literature
1.4.1 Studies in understanding concepts
An awareness of the connection between language and conceptual understanding has given
rise to empirical studies investigating the effectiveness of a variety of programmes and
language scaffolding techniques to improve learning. These include Content and Language
Integrated Learning (CLIL) programmes (Gablasova, 2012), switching between languages
(translanguaging) (Paxton, 2009), and using multilingual-glossaries (Jonker, 2016; Madiba,
2014).
Gablasova (2012) studied a CLIL programme in two schools in Slovakia with 72 high school
children, with Slovak being the home language and English the foreign language. She sought to
verify the quality of the content learning by investigating technical vocabulary acquisition. In
general, the knowledge acquisition of the students studying in a foreign language was found to
be comparable in breadth but not in depth with that of first-language students, thus pointing
towards a lack of conceptual understanding. The students had been specially selected to
participate in the CLIL programme, based on their good academic records. The context of that
study therefore does not reflect the context of the current research, which is based on
educational underpreparedness.
In identifying language access as a contributing factor to the problem of inadequate throughput
among students, Paxton (2009) investigated the use of students’ home languages as a
scaffolding tool for epistemological access. Students used codeswitching to describe subject-
specific terms in their home languages in order to create multilingual glossaries. According to
Paxton (2009), this created a familiar and non-threatening setting in which to grapple with a
subject’s technical terms, resulting in multi-faceted understanding. While this research is in
8
keeping with current ideas on effective support, no systematic research was done to assess the
effectiveness of the intervention, or to ascertain to what extent conceptual understanding, in
fact, had taken place.
In the study conducted by Jonker (2016) in a Humanities extended degree programme at the
University of Stellenbosch, multilingual subject-specific glossaries (English, Afrikaans and
isiXhosa) were similarly used as scaffolding to enhance subject-specific vocabulary attainment,
although the glossaries were in this case provided for the students rather than created by the
them. In this scenario, terminology attainment was facilitated in small tutorial groups (about 22
students), and the teaching approach was the students’ own construction of knowledge. Jonker
(2016:220) attributes the improved pass rate experienced to, among other things, students’
enhanced understanding of the threshold concepts of the relevant subject. On the other hand,
an analysis of the students’ written assignments indicated that students were unable to apply
the knowledge and this suggests a lack of conceptual understanding (Jonker, 2016:214).
The UCT Concept Literacy Project, which was started in 2007, appears to have the most
comprehensive scaffolding approach (Madiba, 2014) to facilitate conceptual understanding. The
project, which was first applied to Statistics, Economics and Law in a pilot project, is to be
implemented in two phases: firstly, the development of multilingual, online glossaries and,
secondly, the development of concept literacy by means of the multilingual glossaries. The
project is therefore aimed at providing a scaffolded approach to learning by means of
multilingual, multi-modal, online glossaries and follow-up tutorials conducted by multilingual
tutors. The follow-up tutorials, however, have so far been limited to isiXhosa-English and
Tshivenda-English. Transcriptions of the tutorials indicate greater insight into the subject
concepts, yet, as in the previous study, no performance assessment was done to measure the
success of the intervention in facilitating concept literacy.
1.4.2 Dearth of studies on the pedagogical effectiveness of concept mapping in facilitating concept literacy in Accounting
Concept mapping has been used across many disciplines, including Religion (Pui-lan, 2010),
Health (Brennan, Brownson, Kelly, Ivey & Leviton, 2012), Nursing (Clarke, 2015) and Biology
(Kinchin, 2000), amongst others. Great interest in the use of concept mapping has also been
shown in the field of Accounting (Leauby et al., 2010:287). Yet, even though enthusiasm is
generally expressed for the technique (Greenberg & Wilner, 2015:25), few empirical studies

9
exist on the pedagogical effectiveness of concept mapping in Accounting in facilitating concept
literacy. A summary of research into the effectiveness of concept mapping in Accounting by
Leauby et al. (2010:287) suggests that, though there are indications that concept mapping
facilitates concept literacy, none of the studies supports this assertion by means of measurable
results, either because of the limited number of participants, or the “less than rigorous design”
(Leauby et al., 2010:287) of the research, or the lack of investigation of peripheral variables that
might have influenced results (Leauby et al., 2010:287; Simon, 2007:305).
In one such study, Maas and Leauby (2005) looked at the effect of using concept mapping with
a group of 35 students who had enrolled for an introductory Accounting module. To measure
the effectiveness of the intervention, the end-of-unit test results of the group were compared
to that of a control group of 29 students. While no outright conclusion can be drawn from such
a limited sample size, the results were impressive enough to suggest further investigation into
the inclusion of concept maps in the Accounting curriculum (Maas & Leauby, 2005).
Simon (2007:274) conducted a study with two groups of final year undergraduate Accounting
students in which pre-created and student-created concept maps were used. When creating
their own maps, an activity all students found challenging, the stronger students were able to
create more complex maps with better linkages than poorer students, but even the stronger
students needed to have misconceptions corrected. The students who took part in the study
found concept mapping useful. This was especially true for Asian students, which, as Simon
(2007:274) remarks, might indicate that second-language speakers find a representation of
knowledge that is less language intense more accessible. However, because of the nature of the
research, no absolute conclusion can be drawn from this observation. While this study was
conducted with a large number of students, it did not assess whether there was any
improvement in student scores and therefore no measurable proof is offered of the
effectiveness of concept mapping in enhancing learning.
In the most comprehensive study, Leauby et al. (2010:289) compared the results of a cohort of
first-year Accounting students with those of a consecutive year, to assess whether concept
mapping improved learning. Both groups were taught using traditional methods, but for the
second group concept mapping was included in the curriculum, ranging from familiarising
students with the technique to the students eventually creating their own maps and being
assessed on these. The results did not support the study’s original hypothesis that concept
mapping would enhance leaning, although students did view the technique as advantageous.
10
No studies have been conducted in South Africa on the pedagogical effectiveness of concept
mapping in facilitating concept literacy as yet. The current study consequently aims to add to
the research on the use of concept mapping in Accounting education, as urged by Leauby et al.
(2010:287-289).
1.4.3 A few notes on Accounting education
As this research is based within the Accounting discipline, it is necessary to mention a few issues
pertaining to education in Accounting that are relevant to this study. According to Leauby et al.
(2010:284), “the effective use of accounting knowledge is based on a thorough understanding
of an integrated conceptual and technical business framework”. It is thus expected that
students should be able to apply what they have learnt as they continue with their study of
Accounting. Nevertheless, in Accounting education, students very often focus on rote learning
of information, rather than on the critical thinking required for decision making (Flood, 2014:88;
Needles 2014:42; Maas & Leauby, 2005:76). In such an environment, students see Accounting
as a technique that must be learned in order to pass examinations (Lucas & Mladenovic,
2014:136) and rote learning would thus appear to be the most appropriate learning style.
Indeed, Lucas and Mladenovic (2014:135) state that Accounting students who see knowledge as
factual are inclined towards rote learning whereas Accounting, in fact, requires abstract
reasoning. This lack of abstract reasoning surfaces when Accounting students enter the
workplace and it becomes apparent that students do not have the abilities that the workplace
needs (Greenberg & Wilner, 2015:25; Hassall & Joyce, 2014:394).
Having recognised these needs, the focus of Accounting education has changed from
“traditional textbook and rules-based knowledge” to an “emphasis on output skills” (Needles,
2014:28). Flood (2014:88) calls for the need to “strenuously interact with core concepts in
Accounting”. The Constructivist learning theory of making sense of the material being learnt
and building on prior knowledge is identified by many researchers as being the solution to the
Accounting education conundrum (Lucas & Mladenovic, 2014:127; Byrne & Willis, 2014:146).
Nonetheless, students do not have the ability to adapt their learning strategies independently
(Leauby et al., 2010:284), and therefore strategies need to be developed to assist them.
Concept mapping has been identified as a strategy that addresses all of the concerns expressed
here. On the other hand, Leauby et al. (2010:287) point out that, because of the seemingly
contrary nature of concept mapping when compared to the “number crunching” practice

11
traditionally used when teaching Accounting, it is viewed with suspicion in Accounting circles.
Yet, Accounting, being a hierarchical discipline, is suited to the concept mapping strategy
(Leauby, et al., 2010:288). These issues add impetus to the need for rigorous empirical research
into the feasibility of using concept mapping in Accounting education, as Leauby et al.
(2010:287-289) urge.
1.5 Research questions
The following main research question has arisen from the real-world problem and gaps
identified in the literature:
Is concept mapping an effective technique for scaffolding concept literacy among first-year
Accounting students in an extended curriculum programme?
This question can be divided into two sub-questions, namely:
1. How does concept mapping affect students’ comprehension of subject-specific concepts
and their associated terms?
2. What are the opinions of students about concept mapping as a technique for scaffolding
comprehension and memory of subject-specific concepts and their associated terms?
1.6 Hypotheses
The following hypotheses will be tested in this research:
The performance of students in the test group will significantly improve from the pre-
intervention test to the post-intervention test, based on their individual test scores.
There will be very little improvement in the performance of students in the control
group from the pre-intervention test to the post-intervention test, based on their
individual test scores.
The performance of students in the test group will improve more than the students in
the control group, based on the differences between their pre- and post-intervention
test scores.
1.7 Chapter preview
Chapter 2 provides a theoretical overview of Constructivist theories of learning that support the
use of concept mapping as a scaffolding tool for meaningful learning. Chapter 3 explains the
methodology, based on a Postpositivist research paradigm, which was used in this study, and

12
describes the instruments by which the quantitative and qualitative data of the test and control
group participants, the Accounting students in an extended programme, were collected. In
Chapter 4, the descriptive and inferential statistics of the collected data are described and the
findings analysed and discussed. The qualitative data are analysed using content analysis. To
conclude, Chapter 5 reflects on the use of concept mapping in facilitating meaningful learning
with reference to the results of this study, acknowledges the limitations of the study, and offers
suggestions for future research.
13
Chapter 2: Theoretical overview
2.1 Introduction
The aim of this research is to investigate the effectiveness of concept mapping in attaining
concept literacy in an Accounting environment. The previous chapter explained the need for
concept literacy by describing the problems currently experienced in higher education and the
attempts that have been made to solve these problems, especially in the foundation year of
students’ studies. The influence of concept literacy on educational success was thus
established, and, from a summary of key studies that investigated ways to improve concept
literacy, the fact that there is as yet no clear solution to this issue became apparent.
This chapter first problematises the practice of rote learning, and advocates teaching methods
that encourage deep learning. One of the learning theories that encourages profound
engagement with the learning process is Constructivism, and thus an overview is given of
Constructivist theories of learning. The role of the Vygotskyan notion of scaffolding in
constructivist approaches to teaching and learning is accentuated, with particular emphasis on
concept mapping as a type of scaffolding. Ausubel’s Assimilation Theory, with its strong focus
on meaningful learning, will be shown to have given birth to the concept mapping model.
Having thus established the legitimacy of the theory that underpins concept mapping, concept
mapping will be discussed in detail by providing reasons for its effectiveness and describing the
importance of its format.
2.2 The problem of rote learning
The issue of rote or surface learning is complex and needs some clarification. The problem is
that rote or surface learning can produce good results at school level. In fact, rote learning is
often encouraged by the type of assessment used at schools (Novak 2010:234; Simon,
2007:278), especially where verbatim recall is required, as in, for example, short answers and
definitions (Novak & Cañas, 2008:4). Students who are focused merely on passing tests need do
no more than rote learn answers (Lucas & Mladenovic, 2014:128), as information can be
memorised without needing to relate it in any way to previously held knowledge (Novak,
2010:23). Novak and Cañas (2008:11) elucidate the extent of the problem by declaring that rote
learning “contributes very little at best to our knowledge structures, and therefore cannot
underlie creative thinking or novel problem solving.” The lack of conceptual understanding

14
becomes especially pronounced once there is a need to apply the learned knowledge at higher
levels (Nkomo & Madiba, 2011; Norris & Phillips, 2003; Novak, 2002:549; Taber, 2000). Novak
(2010:38) therefore calls the rote learning favoured by many schools “disempowerment”.
In contrast, the main purpose of education should surely be “to empower learners to take
charge of their own meaning making” (Novak, 2010:13) [author’s emphasis]. If students are
interested in gaining the knowledge inherent in a task, they are more likely to employ deep
learning (Lucas & Mladenovic, 2014:128). New knowledge is then assimilated so that the focus
moves from the specific wording, or verbatim recall, to conceptual understanding.
Constructivism sought to address this issue, and the Constructivist theories of learning will be
discussed below.
2.3 Constructivist theories of learning
For about a century, Behaviourism was the predominant educational viewpoint (Novak &
Gowin, 1984:152). As it focused on modifying behaviour, it advocated rote learning in a teacher-
centred classroom. Behaviourism ignored a fundamental aspect of the human mind: we form
concepts in our minds and then label them by means of language symbols (Novak & Gowin,
1984:152). Thought and language are thus “interfunctional” (Vygotsky, 1986:1). In consequence
of this new understanding of learning, significant research went into the field of education in
the twentieth century, and resulted in the emergence of Constructivist theories of learning.
2.3.1 What do constructivist theories of learning entail?
Educational theorists of the twentieth century recognised the necessity of understanding the
psychology of the learning process in order to address the problem of inadequate concept
literacy (Novak, 2002:562). The ideas of the theorists most pertinent to the current research will
be discussed here.
2.3.2 Piaget
Jean Piaget (1896-1980), working in Switzerland, was the forerunner in the study of human
cognition, to which he dedicated sixty years of his life (Novak & Gowin, 1984:154). While some
of his theories are criticised now for their emphasis on developmental stages of cognitive
functioning (Novak, 2010:55; Novak & Gowin, 1984:154; Piaget, 1980:5), he is nevertheless
admired by many of his peers for his groundbreaking work into children’s speech and thought
processes, which revolutionised educational research (Novak, 2010:55; Vygotsky, 1986:12).
15
Piaget, in attempting to understand the process of learning, developed the Theory of Cognitive
Development, which contends that every being attempts to make sense of its environment and
to determine its future actions by developing knowledge structures or schemata. Balance
between these schemata and the environment is sought and this necessitates ongoing
adaptation of the environment, to fit in with pre-existing schemata (“assimilation”), or
adaptation of the schemata, to accommodate new information from the environment
(“accommodation”) (Lucas & Mladenovic, 2014:127; Lutz & Huitt, 2004; Huitt & Hummel, 2003;
Piaget, 1980:8; Nielsen, 1980). This “self-regulation” of “cognitive conflicts” results in cognitive
development (Zarotiadou & Tsaparlis, 2000:38). Prior knowledge is therefore consistently relied
upon in the stored schemata, because knowledge “always includes a process of assimilation to
previous structures” (Piaget, 1971:4). Piaget postulated that all human beings progress through
various stages of learning development or “adaptation” from childhood to adulthood, each
stage becoming increasingly sophisticated and, as the complexity of thought increases, the
schemata likewise become more complex and hierarchical to adequately store acquired
knowledge (Piaget, 1980:8-70). In fact, “the learning of a new operational concept depends
heavily on the child's previous level of cognitive development” (Lourenço & Machado,
1996:153). Piaget saw learning as taking place instinctively and incidentally, without the
requirement of an educational setting and with the child learning through self-activated
discovery (Nielsen, 1980).
Originally, his theories were embraced as they seemed to explain the problem of poor learning
among children, and curricula were adapted to include tasks according to “cognitive operational
capacity presumably required for understanding” (Novak, 2010:52). However, the theory of the
developmental stages of learning has been disproved as present research indicates that
children are developmentally ready to learn at a much younger age than at first supposed, and
that poor learning is rather the result of insufficient preparation for learning and inadequate
teaching (Novak, 2010:54).
Several of Piaget’s contemporaries investigated and theorised the learning process, most
notably Lev Vygotsky (1896-1934) and John Dewey (1859-1952). While these theorists worked
independently and consequently have divergent ideas, they differ primarily on whether they
consider the principal source of learning to be experience (Dewey), an individual experience
(Piaget), or a social experience (Vygotsky) (Lutz & Huitt, 2004:1; Vygotsky, 1986). However, they
also share many themes regarding the construction of knowledge so that the combined

16
educational philosophy, Constructivism, emerged from these individual ideas (Lutz & Huitt,
2004:13; Huitt & Hummel, 2003).
Constructivism maintains that the human brain is wired to take in information from birth, and
to construct meaning by interpreting new knowledge against the backdrop of what is already
known (Byrne & Willis, 2014:146; Lucas & Mladenovic, 2014; Taber, 2000:64). For some, this
aspect of “what is already known”, or prior knowledge, is seen, from the Constructivist
viewpoint, as fundamental to learning (Byrne & Willis, 2014:146). For others, it is the fact that
each student must construct his or her own meaning (Novak, 2010:81), as each individual will
have his or her own filters for constructing meaning, derived from parents, the environment
and his or her own personality. For Novak (2010:81), this is an essential point, as it
differentiates between “the psychology of learning” (individual construction of knowledge)
compared to “the epistemology of knowledge” (knowledge construction within disciplines). In
either case, the fundamental idea underlying Constructivism is that “the development of
meaning is more important than the acquisition of a large set of knowledge or skills that are
easily forgotten” (Lutz & Huitt, 2004:8). A further essential aspect of the acquisition of
knowledge, according to Dewey in particular, is student readiness – being curious about the
upcoming subject and having the necessary expertise to accomplish the task – and social
interaction (Lutz & Huitt, 2004:8). Lucas and Mladenovic (2014) state that, according to
Constructivist principles, students’ approach to learning is not necessarily dependent on their
learning styles but rather on their “perception” of the task, which is not necessarily the
perception originally intended by the lecturer. In this case, “perception” refers to the particular
way a student views the world and which affects the way he or she approaches the subject.
2.3.3 Vygotsky and the notion of scaffolding
While Vygotsky (1986:11) acknowledged Piaget’s theory of learning as “the best of its kind”, his
own theory developed “in exactly an opposite direction”. Unlike Piaget’s belief that learning is
self-activated and individual, Vygotsky believed that learning is socially mediated and that
conceptual thinking emerges from the “tasks” that interaction at various levels of society sets
(Vygotsky, 1986:108), because higher mental functions are the result of “mediated activity”
(Vygotsky, 1986:xxiv ). He also saw language as the necessary medium through which such
conceptual learning takes place (Novak, 2010:80; Novak & Cañas, 2008:15; Vygotsky, 1986:108).
17
From Vygotsky we have two concepts that are of particular interest to the present research.
Firstly, Vygotsky’s Zone of Proximal Development is the area in which learning takes place,
beyond but not out of reach of the present knowledge base of the student; it is that which is
achievable with adequate support (Novak & Cañas, 2008:15; Walqui, 2006:162; Vygotsky,
1986:187). Secondly, such adequate support, or mediation, refers to any instrument that makes
it possible for a student to reach the next level of achievement and may be animate, for
example a teacher, or inanimate, for example an online programme. This mediation is
sometimes known as the More Knowledgeable Other. As discussed in the previous paragraph,
language therefore becomes a powerful instrument of mediation (Walqui, 2006:161).
Although the concept of scaffolding, which refers to connecting the current level of a student’s
knowledge to the next higher level (Fennema-Bloom, 2009:33), did not originate with Vygotsky,
it was soon seen as a suitable metaphor for his Zone of Proximal Development (Brownfield,
2016:14; Novak, 2010:80; Walqui, 2006:163). Based as it is on the construction of knowledge by
means of support from a More Knowledgeable Other, scaffolding can be seen as socio-semiotic
in nature (Walqui, 2006:160), which is in keeping with Vygotsky’s strong emphasis on the social
nature of learning.
The approach of scaffolding is traditionally top-down, with the More Knowledgeable Other
guiding the student until he or she increasingly operates independently. While Vygotsky’s
original idea was that the mediator should be more knowledgeable than the student in order to
scaffold learning, subsequent researchers have acknowledged the role that peer collaboration
can play in scaffolded learning (Novak & Cañas, 2008:15; Walqui, 2006:167). For example, the
effectiveness of group work in knowledge acquisition might be due to the group members
operating within the same Zone of Proximal Development (Novak, 2002:551). It is now
suggested that mediation can operate in four ways: mediation by a more knowledgeable
person, group mediation, learning through teaching less knowledgeable students, and self-
directed learning (Walqui, 2006:168).
2.3.4 Schema Theory
Schema Theory, first posited by Bartlett in 1932, can be seen as a variant of the scaffolding
premise (Brewer & Nakamura, 1984:3), as it sees previously constructed knowledge, or
background knowledge, as essential for the attainment of new knowledge in an interactive
process between learner and text (Widmayer, 2005; Carrell & Eisterhold, 1983:556). Succinctly
formulated, Schema Theory deals with “the relationships between old and new knowledge”

18
(Brewer & Nakamura, 1984:71). Schema, also referred to in the plural form of schemata, is the
name given to the higher order knowledge structures, representing units of knowledge
(Rumelhart, 1980:34).
New information is built onto existing schemata and “all aspects of that schema must be
compatible with the input information” (Carrell & Eisterhold, 1983:557). As such, new
information may be added to previous knowledge without adaptation, or existing structures
may be adapted to accommodate new knowledge, or a new structure or schemata may be
created altogether. If the information is not understood according to its intended meaning, in
other words, the constructed schemata are defective, comprehension suffers (Brewer &
Nakamura, 1984:29). Schemata are stored in subject-specific or context-specific knowledge
structures, which can be at novice or expert level, depending on the stage of development.
Schema building is influenced by genres (for example letters, reports and brochures) and text
types (for example descriptive, persuasive and instructive), and is culturally driven (Widmayer,
2005).
Schema Theory further distinguishes between bottom-up (data-driven; from the specific to the
general) and top-down (concept-driven; from the general to the specific) processing. This
illustrates the hierarchical nature of Schema Theory (Carrell & Eisterhold, 1983:557). On the
other hand, Widmayer (2005) maintains that the structures are not necessarily hierarchical but
rather “meaning-driven”.
The function of schemata in learning can be illustrated in several ways. Information imbedded
in a schema is recalled more easily than a list of unrelated facts (Brewer & Nakamura, 1984:44).
Schema Theory supports the idea that problem-solving ability is incremental and results from
an accumulation of experience and perspectives (Widmayer, 2005). Thus, the more developed a
student’s schemata are in a certain body of knowledge, the more easily recall takes place
(Brewer & Nakamura, 1984:47). As will be seen in the next section, there are clear links
between Schema Theory, which attempts to provide a “valid metaphor for explaining students
[sic] knowledge structures and ability to recall information”, and Ausubel’s Assimilation Theory
(Widmayer, 2005), as, for example, both require that new concepts should be compatible with
existing conceptual knowledge to be assimilated.

19
2.3.5 Assimilation Theory
Ausubel (1962) developed Assimilation Theory to explain the learning process that facilitates
meaningful learning. He asserted that we think in concepts (Simon, 2007:277) and that
meaningful learning can only take place when new concepts or information are linked to the
student’s prior knowledge – the most important single factor in acquiring new knowledge
(Greenberg & Wilner, 2015:18; Novak, 2010:63; Simon, 2007:278; Safayeni et al., 2005:2;
Ausubel, 1962) - and expressed in clear concepts and language (Novak & Cañas, 2008:3).
Secondly, the prior knowledge of the student should be relevant and made applicable to the
new information (Novak, 2010:59). The quality of the learning will be decided by the quality of
the knowledge structures the student has already built (Novak, 2010:23). Thirdly, the student
needs to cooperate in the process of meaningful learning (Novak, 2010:59; Novak & Cañas,
2008:3-4; Carnot et al., 2003:6-7). The instructor has little control over whether students
cooperate in their learning or not; if students make no effort to assimilate the new information
(Novak, 2010: 60), or insist on rote learning of the definitions, procedures and statements, they
will not benefit from meaningful learning, no matter what learning strategy is used (Novak &
Cañas, 2008:3).
Conceptual knowledge structures are strongly hierarchical through the process of
“subsumption”, which is a term that Ausubel used to describe the linking of more specific
concepts (the least inclusive) to more general concepts (the most inclusive) (Novak, 2010:63,
Simon, 2007:278; Ausubel, 1962). Through the interactive process of “subsumption”, links or
relationships between concepts are identified and they create a network of connections (Novak,
2010:63). The overall meaning of a concept emerges from all the identified relationships (Novak
2010:65). Novak (2010:67) states that information that is gained by means of this “subsuming”
process can be recalled long after it has been learned, in contrast to rote learning, which needs
continuous reinforcement.
Ausubel’s Assimilation Theory evidences clear links to Constructivism (Lucas & Mladenovic,
2014:127) and, in particular, Piaget’s Cognitive Development Theory. However, in the process
described by Ausubel, both the newly-acquired knowledge and the existing knowledge
structures are adapted and changed, which is a departure from Piaget’s viewpoint (Nielsen,
1980). Moreover, while both Piaget and Ausubel’s ideas suggest that learning is a process that
needs time, they differ in that Piaget refers to the time it takes a learner to progress from one
developmental stage to another, whereas Ausubel is concerned with the “adequacy of the

20
relevant conceptual framework a person has in a specific domain of knowledge” (Novak,
2010:75) [author’s emphasis].
Ausubel suggests that, for learning to be effective, new concepts should be introduced to young
learners in the form of well-constructed examples of the subject-matter to aid them in
constructing feasible knowledge structures, whereas older learners would be experienced
enough to create such knowledge structures for themselves (Nielsen, 1980). Maas and Leauby
(2005:78) point out that students who have not been schooled in relating newly acquired
concepts to prior knowledge might find this process difficult, especially when they attempt to
link concepts of increasing complexity to weak knowledge structures. Often students are limited
in developing their ability to think in more meaningful or creative ways. Consequently, in order
to activate prior learning and to guide students towards the correct structuring of new
information, Ausubel proposes the use of advance organisers (Novak, 2002:559). These advance
organisers, similar to those advanced by Schema Theory, function as pre-learning tasks that
assist in “coaching” or scaffolding knowledge.
Because of this emphasis on guided knowledge construction, Assimilation Theory is seen as
teacher-centred, or “Learning through transmission”. It is, for example, important that the
teacher is able to establish the learner’s prior knowledge so that he or she can be adequately
guided in assimilating new knowledge (Novak, 2010; Simon, 2007:278). Furthermore, the
teacher needs to organise the knowledge structures and continuously evaluate student learning
(Novak, 2010). As such, Assimilation Theory is only practicable in an educational environment
(Simon, 2007:277). This also differs from Piaget, who believes that an educational environment
is not required for learning to take place (Nielsen, 1980).
In the next section, “Learning through transmission” will be compared to “Learning through
discovery” to establish the validity of the teacher-centred approach favoured by Ausubel’s
Assimilation Theory.
2.3.6 Learning through transmission and Learning through discovery
From the previous discussion, we see that learning can be either facilitated through the lecturer
(Learning through transmission) or by the students themselves (Learning through discovery)
(Alcina, 2009:3-4). In the first instance, the lecturer makes the cognitive processes necessary for
significant learning evident to students in an organised manner, the lecturer thus being the
21
focus of the activity. In the second instance, the student is the focus of significant knowledge
acquisition by means of self-directed learning, which might include lecturer facilitation (or any
other type of Knowledgeable Other – see Section 2.3.3), but which primarily means that the
learner selects and learns information he or she has identified as important (Alcina, 2009:3-4;
Novak and Cañas, 2008: 3; Simon, 2007:278; Kirschner, Sweller & Clark, 2006:78). Learning
through discovery, also known as inquiry learning, is favoured by Constructivists and has
become a “widely recommended” approach to teaching (Novak & Cañas, 2008:4), as it is seen
as a measure to counter the prevalent mode of rote learning (Novak, 2010:63). Tasks are set
without providing answers, with the idea that learners will discover the required concepts for
themselves.
This approach has been questioned because of the unlikelihood that someone would construct
the meaning of a complex idea independently without “at least a rudimentary conceptual
understanding of the phenomenon they are investigating”, and, furthermore, because of the
lack of research to prove the effectiveness of this type of learning (Novak & Cañas, 2008:4; see
also Novak, 2010:63; Kirschner et al., 2006). Indeed, rote learning has been erroneously
equated to teacher-centred learning approaches and significant learning to learner-centred
learning approaches, while, in practice, both strategies may be effectively used to foster
significant learning (Novak and Cañas, 2008:4; Simon, 2007:278). In fact, as Novak (2010:63)
declares, what we need now “is not more emphasis on inquiry learning, but rather more
emphasis on meaningful learning” [author’s emphasis].
Ideally, the relationship between teacher-centred and student-centred learning would be a
gradual shift in reliance on the former to the self-reliance of the latter (Simon, 2007:278). The
theory behind this is that when students are able to choose what and how to learn they will be
motivated to take responsibility for their own learning. In reality, this can take up more time
than a student has available and presumes that the student knows what knowledge is missing
(Simon, 2007:278), and may not be suitable for a first-year student (Kirschner et al., 2006:83). In
short, how can the student know what the student does not know? Zarotiadou and Tsaparlis
(2000:48) also report that, even in learner-centred approaches, students seem to benefit from
the accessibility of a teacher rather than from working in isolation. Thus, the teacher-centred
approach followed by Ausubel’s Assimilation Theory has validity.
Having established the theoretical underpinnings of this study, I now turn to Concept Mapping
as a particular strategy in scaffolding the learning of concept literacy.
22
2.4 Concept mapping as scaffolding tool
2.4.1 Introduction
In the section on the Constructivist theories of learning (Section 2.3), the role of scaffolding in
the facilitation of learning was considered. Many scaffolding tools are available for use in the
classroom, such as those suggested by Walqui (2006:170; see also Carstens, 2016) - modelling,
bridging, contextualisation, building schemata, re-presenting text and developing
metacognition. In this section, the contention that concept mapping is an ideal scaffolding tool
that leads to meaningful learning will be put forward, by means of a discussion of its format and
functioning. This forms the rationale on which this research is based.
2.4.2 Concept mapping as a scaffolding tool for meaningful learning
In response to the problems currently being experienced in education, Novak (2010:2) states
that it is time for “new educational practices that are guided by sound theory and make better
use of new technologies”. Concept mapping offers a valuable solution in the pursuit of
significant learning, and, as Maas and Leauby (2005:79) declare, this is a technique that
deserves consideration. The following section describes concept mapping and clarifies its
functionality and effectiveness.
2.4.2.1 Why concept mapping?
Concept mapping visually scaffolds knowledge
The technique, as illustrated in Figure 1, takes the form of a visual aid that depicts relationships
between concepts and therefore represents information in an alternative and visual way, which
aligns with the human facility of pattern identification (Simon, 2007:276). Utilising concept
mapping software such as CmapTools or similar software makes it possible to include a range of
images, further enhancing the visual nature of concept mapping (Novak & Cañas, 2008:8).
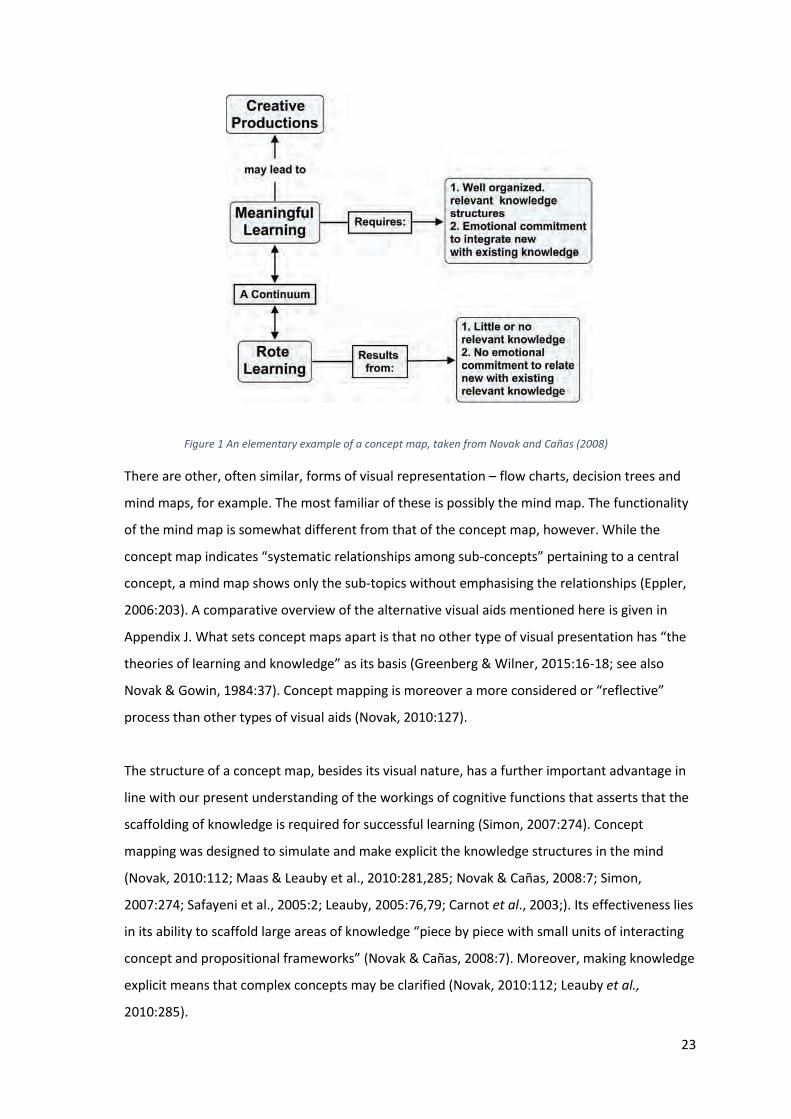
23
Figure 1 An elementary example of a concept map, taken from Novak and Cañas (2008)
There are other, often similar, forms of visual representation – flow charts, decision trees and
mind maps, for example. The most familiar of these is possibly the mind map. The functionality
of the mind map is somewhat different from that of the concept map, however. While the
concept map indicates “systematic relationships among sub-concepts” pertaining to a central
concept, a mind map shows only the sub-topics without emphasising the relationships (Eppler,
2006:203). A comparative overview of the alternative visual aids mentioned here is given in
Appendix J. What sets concept maps apart is that no other type of visual presentation has “the
theories of learning and knowledge” as its basis (Greenberg & Wilner, 2015:16-18; see also
Novak & Gowin, 1984:37). Concept mapping is moreover a more considered or “reflective”
process than other types of visual aids (Novak, 2010:127).
The structure of a concept map, besides its visual nature, has a further important advantage in
line with our present understanding of the workings of cognitive functions that asserts that the
scaffolding of knowledge is required for successful learning (Simon, 2007:274). Concept
mapping was designed to simulate and make explicit the knowledge structures in the mind
(Novak, 2010:112; Maas & Leauby et al., 2010:281,285; Novak & Cañas, 2008:7; Simon,
2007:274; Safayeni et al., 2005:2; Leauby, 2005:76,79; Carnot et al., 2003;). Its effectiveness lies
in its ability to scaffold large areas of knowledge “piece by piece with small units of interacting
concept and propositional frameworks” (Novak & Cañas, 2008:7). Moreover, making knowledge
explicit means that complex concepts may be clarified (Novak, 2010:112; Leauby et al.,
2010:285).

24
Additionally, in this process, the “bigger picture” is revealed. Because concepts and themes are
often addressed separately in class, students might continue to see them as unrelated (Leauby
et al., 2010:284; Greenberg & Wilner, 2015:22). According to Leauby et al. (2010:284), in such
cases students will “remain novices” because, without an awareness of the bigger picture,
reasoning will continue to be limited. On the other hand, concept mapping encourages the
identification of relationships and interrelationships, or cross-links, so that students are able to
form a better understanding of the whole (Chabeli, 2010; Leauby et al., 2010:28; Maas &
Leauby, 2005:77). Identification of such relationships are evidence of the student developing a
deeper understanding of the subject (Simon, 2007:280). The introduction of a new concept
could even result in the restructuring of previously incorporated concepts and relationships as
new meanings come to the fore (Simon, 2007:280; Novak & Gowin, 1984:17). Ausubel calls this
process “integrative reconciliation” (Simon, 2007:280; Ausubel, 1962). To further enhance the
students’ awareness of the bigger picture, concept maps should be used to “build upon each
other to integrate concepts” throughout a course (Greenberg & Wilner, 2015:17).
Concept mapping encourages student participation
Individually
From the previous paragraph, it is evident that the effective use of concept mapping depends
on student participation, one of the essential factors of Ausubel’s Assimilation Theory (Section
2.3.5). The need for a student to be a willing and active, emotionally involved participant if
meaningful learning is to take place (Chabeli, 2010; Novak, 2010; Novak & Cañas, 2008: 11;
Simon, 2007; Maas & Leauby, 2005:81;Zarotiadou & Tsaparlis, 2000) is, as we have seen, also a
requirement for the achievement of meaningful learning (Carnot et al., 2003:6-7). In fact,
Carnot et al. (2003:10) insist that “mental interaction with the subject matter to be learned
during the building of the concept map is key to the learner’s achievement” and that, even with
the use of a deep-learning activity like concept-mapping, students will only truly benefit if they
have an “active, deep and questioning approach” to their subject (Carnot et al., 2003:9). On the
other hand, students who have chosen rote learning as their learning method will not easily be
dissuaded from that path (Novak, 2002:558). The instructor’s responsibility in this scenario is to
provide the means by which students can effectively apply themselves (Novak, 2010:59).
There are two reasons why concept mapping is dependent on student participation. Firstly,
concept mapping is useful for establishing the student’s prior knowledge, which, as we have
seen, is another fundamental aspect of Ausubel’s Assimilation Theory (Leauby et al., 2010:281;
25
Novak & Cañas, 2008:7;) and in line with the Constructivist theories of learning. Secondly, the
quality of the various elements of the concept map that the student has constructed will
provide evidence that successful learning has taken place (Simon, 2007).
However, by making knowledge explicit, a misconception held by the student may also become
evident by means of this process. According to Novak and Gowin (1984:20), a misconception
refers to an unacceptable, but not necessarily wrong, understanding held by a student about a
concept, often evidenced by the relationship the student has indicated as the link between two
concepts. The assimilation of information is reliant on an individual’s learning style, emotional
response and harboured expectations, and is therefore personalised (Novak, 2002:555).
Misconceptions can consequently easily be formed and even become entrenched, especially as
“[i]n everyday use, language tends to be weakly defined, allowing increased scope for
misinterpreting what is heard” (Taber, 2000:64). This is also in line with Constructivist theory
which states that students construct their own knowledge by building onto previous knowledge.
Therefore, should this construction contain errors, students’ knowledge will be based on
misconceptions (Novak, 2002). Students who would be considered “able” (and, indeed, even
such “able” students may harbour misconceptions [Simon, 2007:292]) are often capable of
correcting misconceptions because of the strong cognitive structures they build, whereas “less
able” students might be building onto already faulty structures, further entrenching the
misconception (Novak, 2002:558). Concept mapping therefore facilitates the identification and
addressing of misconceptions (Novak, 2010:80; Novak & Cañas, 2008:5; Simon, 2007:281) so
that subsequent knowledge may be assimilated correctly (Leauby et al., 2010:285).
In groups
The value of shared learning, which echoes Vygotsky’s viewpoint of learning through
socialisation, is now generally recognised and educational methods that encourage interaction
and collaboration, such as concept mapping, are deemed valuable (Chabeli, 2010; Novak &
Cañas, 2008:15). Working in teams, students are able to “come to consensus on…their
collective knowledge” (Novak, 2010:118) and this helps them to tackle assignments that might
have proved too complex if worked on individually (Leauby et al., 2010:285). Novak (2010:173)
points out that there has been much talk recently on “the importance of teams in industry” and
that “the central purpose of teams is to learn how to do something better”. In a team setting,
the Constructivist principle of building from previous knowledge takes on wider significance, as
students’ previous knowledge is pooled. Thus, in identifying one another’s previous knowledge,

26
learning already takes place through the “richness and diversity of knowledge, skills, and
attitudes of the various team members—and also the problems associated with each person’s
idiosyncratic view of the world” (Novak, 2010:173). Working in teams, though, requires the
same level of commitment as working individually for meaningful learning to take place (Simon,
2007:283).
Group work is also an effective method of addressing misconceptions. Taber (2000:66) asserts
that one of the most successful ways of correcting misconceptions is by means of a group
concept-mapping task for a subject like Chemistry. This inevitably provokes peer discussion that
could bring misconceptions to the fore, because, although concepts are created by individuals,
they are “mediated socially” (Novak, 2002:551). While learning is not shared, meanings “can be
shared, discussed, negotiated, and agreed upon” (Novak & Gowin, 1984:20). Novak (2010: 137)
cautions that the correction of errors in understanding is not a quick process: incorrect
propositions need to be deconstructed and corrected propositions assimilated into existing
knowledge structures (Novak, 2010:140). However, through the negotiation that takes place in
a small group, the necessary realignment can be accomplished. Quite clearly, the correction of
misconceptions can never be accomplished through rote learning (Novak & Cañas, 2008: 9).
Finally, Novak and Cañas (2008:23) comment that using a pre-created “expert skeleton” map
will lessen the chance of misconceptions getting a foothold.
For struggling students
Meaningful learning requires motivation and effort from the student. It can be challenging to an
academically underprepared student but it is not unattainable by such a student. In fact,
research suggests that successful learning depends to a large degree upon the will to learn
(Novak, 2010:59; Novak, 2002:557), which could be an equalising factor among advantaged and
disadvantaged students.
Effective students have been shown to have a structured and disciplined approach to learning
(Carnot et al., 2003:9), which mirrors the functionality of concept mapping. Struggling students
or students from environments where rote learning dominates can therefore benefit from using
concept maps by being introduced to more structured learning processes (Simon, 2007:284).
Carnot et al. (2003:9) caution that, in these cases, struggling students, unused to such structure,
might find creating an entire concept map from scratch overwhelming and suggest that a
partially pre-constructed map might initially be more beneficial. The suggestion of Carnot et al.
(2003:9) has been supported by other researchers, such as Greenberg and Wilner (2015), Novak

27
and Cañas (2008), Carnot et al. (2003) and Chang et al. (2002). However, the danger exists of
struggling students being further encumbered by having to accommodate others’ knowledge
structures in the partially-constructed concept maps. It is hoped that the advantages of using
concept maps will outweigh such concerns. The use of pre-constructed concept maps is
discussed in more detail hereafter.
Concept mapping might also be useful in supporting another type of struggling student. Maas
and Leauby (2005:80) report on a study that described the support concept mapping offered
students who experience anxiety in learning. They comment that “concept mapping might be
effective not only in the more familiar cognitive domain … but also in the less often discussed
but equally important affective domain…” (Maas & Leauby, 2005:80), and that this further
supports meaningful learning (Novak, 2010: 226; Maas & Leauby, 2005:80).
Concept mapping supports metacognitive learning
Concept mapping develops meta-cognitive skills that have an ongoing effect on the quality of a
student’s learning. A student is able to apply the strategies inherent in concept mapping, such
as comprehension and critical thinking, to other fields and domains, even when concept
mapping is not being employed (Chang, Sung & Chen, 2002:18). Moreover, concept mapping
makes learning more efficient, as it helps one to make sense of the given information (Taber,
2000:65).
Concept mapping is thought to improve the comprehension required for reading and
summarising, because of the process that is foundational to concept mapping as well as to the
identification and organisation of key ideas (Chang et al., 2002:18). It could also be said that
concept mapping enhances comprehension because it causes the structure that underlies all
knowledge to be understood (Leauby et al., 2010:285). Furthermore, the constructing of
multiple interlinked concepts means knowledge is reinterpreted with each new construction.
Comprehension thus becomes a continuing process of layered understanding (Gablasova,
2012:33).
Critical thinking refers to the “ability a person has to rationally organize, interpret, and use
information – even when the information may be incomplete, or when the decision context or
the environment in which the information is to be used may be new or unfamiliar”
(Cunningham, 2014:403). Because concept mapping requires the creation of one’s own links
and crosslinks, critical thinking skills are inevitably developed (Greenberg & Wilner, 2015:18;

28
Leauby et al., 2010:285; Maas & Leauby, 2005:76; Carnot et al., 2003:7;). While constructing
knowledge of a particular subject, it also teaches cross-domain metacognitive skills that
enhance all learning (Novak, 2002:559), because problem-solving ability is incremental and
results from an accumulation of experiences and perspectives (Widmayer, 2005). Such cross-
domain knowledge-transfer is the hallmark of meaningful learning and critical thinking
(Widmayer, 2005). Maas and Leauby (2005:76) further consider concept mapping an “enabling”
skill because it facilitates greater complexity in thinking (see also Leauby et al., 2010:285).
Supporting a variety of learning tasks
The use of concept mapping is not limited to a particular type of task (Leauby et al., 2010:286).
For instance, it is useful for providing the framework of an upcoming theme (Leauby et al.,
2010:286; Novak & Gowin, 1984); when a certain theme has been taught, concept mapping can
be used to summarise the information; it can be used to plan the outline of an assignment
(Leauby et al., 2010:286; Novak & Gowin, 1984); and it lends itself well to brainstorming
(Leauby et al., 2010:286), especially when working in teams (Novak & Gowin, 1984).
Novak and Cañas (2008:8) refer also to a subsidiary aspect of concept mapping that might
further aid learning. Because of our ability to remember images, or what Novak and Cañas
(2008:8) call “iconic” learning, the visual structure of concept mapping might be a further
enhancement to memory. Utilising concept mapping software such as CmapTools makes it
possible to include a range of images (Novak & Cañas, 2008:8).
2.4.2.2 Putting concept mapping into practice
The format of concept maps
The appropriate starting point for a discussion of the concept mapping format is a clarification
of the term “concept”, as it is fundamental to the process. Concepts are defined by Novak
(2002:549) as “perceived regularities in events or objects, or records of events or objects
designated by a label (usually a word)” [author’s emphasis] (See also Novak, 2010:42; Novak &
Cañas, 2008:12). It is important for students to grasp that the term “concept” refers to the
understanding they have of “events or objects”, and that without such understanding there can
be no knowledge (Simon, 2007:275). The creation of a concept must start with a main theme
(Simon, 2007:196, 275) or a question (Novak & Cañas, 2008:12). In either case, a context is
provided which determines the hierarchical structure of the map (Novak, 2010; Novak & Cañas,

29
2008:11). For novice map builders, it is preferable that a familiar “domain of knowledge”, and
only a section thereof, is used to construct the map (Novak & Cañas, 2008:1).
Concepts that support the main theme must next be identified for inclusion in the concept map.
An in-depth study of the theme should clarify what the key concepts are, of which there are
normally a limited number (Novak, 2010; Simon, 2007:275; Novak & Gowin, 1984:15). For
instance, in Figure 2, “Focus Question(s)”, “Associated Feelings of Affect” and “Organised
Knowledge” are examples of key concepts. For those still unaccustomed to the process, a list of
familiar concepts could be provided (Novak, 2010:61).
Figure 2 A concept map with “Concept Maps” as its theme, taken from Novak and Cañas (2008:2)
Concepts are placed in boxes, although some practitioners prefer to place them in ovals (Novak
and Cañas, 2008:1; Simon, 2007:196). Whether a concept is represented by a word or a phrase,
a noun or gerund must be present (Carnot et al., 2003:13); however, a concept cannot consist
of an entire sentence as this would negate the functionality of concept mapping (Novak &
Cañas, 2008:12).
Concepts are linked to each other by means of lines to denote existing relationships; the lines
are labelled using either symbols, words or phrases (Novak, 2010; Novak and Cañas, 2008:1;

30
Simon, 2007:196; Safayeni et al., 2005:2; Carnot et al., 2003:5;). The relationship represented
by the linking line is expressed by means of a linking word or phrase (Novak & Cañas, 2008:1),
which must indicate an action (Leauby et al., 2010:281). In Figure 2 (above), “help to answer”,
“represent” and “includes” indicate the relationship between concepts. This unit of concept-
relationship(s)-concept(s) is called a proposition and constitutes a meaningful statement, a
semantic unit, or a basic unit of knowledge (Leauby et al., 2010:281; Novak & Cañas, 2008:1;
Simon, 2007:276; Maas & Leauby, 2005:77;)Carnot et al., 2003:13; Novak & Gowin, 1984:15).
Novak and Cañas (2008:13,20) comment that students, and sometimes even experienced
mappers, may experience difficulty with labeling the linking lines, which indicates a lack of
understanding of the relationship between concepts. In fact, Leauby et al. (2010:281) suggest
that it may be more useful for novices to concentrate initially on the identification of the core
concepts only. Propositions are nevertheless of great importance because this is where learning
either takes place or is shown to have taken place (Simon, 2007:276). Examples of the concept
under discussion may be added as a final level for further illumination (Novak & Cañas, 2008:1;
Simon, 2007:196).
Once students become adept at correctly identifying relationships, they begin to perceive the
interrelatedness of all concepts (Leauby et al., 2010:281; Novak & Cañas, 2008:12). A crosslink is
used to indicate these perceived relationships among concepts in different semantic units or
domains of knowledge (Novak & Cañas, 2008:1; Simon, 2007:277) that result in a concept map
thus becoming “richly interconnected” (Carnot et al., 2003:14). Knowledge is constructed when
new propositions are perceived and created (Novak, 2002:550). Such cross-links should
therefore be sought once the basic map has been constructed (Novak & Cañas, 2008:12; Simon,
2007:277) as they show insight and understanding of the material (Carnot et al., 2003:5) as well
as “creative leaps” by the map creator (Novak & Cañas, 2008:12) and thus give evidence of
higher-order thinking (Novak & Cañas, 2008:13).
The hierarchical nature of concept mapping
Concepts are arranged in a hierarchical order, with the most inclusive and therefore most
general at the top and the least inclusive and most specific at the bottom (Greenberg & Wilner,
2015:18; Novak, 2010:4; Novak & Cañas, 2008:12; Simon, 2007:276), as illustrated in Figure 2
(above), where the main, inclusive theme is at the top of the diagram, and progressively more
specific concepts are ranked below it. Novak and Gowin (1984:15) give as a reason for this the
fact that meaningful learning takes place more successfully when presented in this top-down
order, or what Ausubel would call “subsumption” (Carnot et al., 2003:15; Ausubel, 1962). Top-

31
down processing is also useful “to resolve ambiguities or to select between alternative possible
interpretations of the incoming data” (Carrell & Eisterhold, 1983:557). The use of cross-links
suggests, however, that the hierarchical nature of the concept map is not strict, but is rather
what Carnot et al. (2003:1) call “semi-hierarchical”. For this reason, the direction of the linking
lines indicating the flow of the relationships is understood to be downwards unless otherwise
indicated by an arrow (Simon, 2007:276), although the use of arrows throughout might at times
also be useful (Novak & Gowin, 1984:35). It is this aspect of hierarchical order, along with the
cross-linking of concepts, that makes concept mapping such a useful tool for enhancing critical
thinking (Novak and Cañas, 2008:1).
The use of pre-constructed concept maps
Creating a concept map “from scratch” might not always be possible or even desirable. The
primary constraint is time, as both lecturers and students will need time to familiarise
themselves with the technique for constructing concept maps. The problem is worsened
because time must necessarily be taken from an already overburdened timetable to teach both
the course materials and the concept mapping technique (Greenberg & Wilner, 2015:19; Maas
& Leauby, 2005:93; Chang et al. 2002:6). Space must also be made for reflection and continued
reinforcement of the process (Maas & Leauby, 2005:93; Chang et al, 2002:20). Novak and Cañas
(2008:9), on the other hand, maintain that only students who have been caught in the rote
learning trap struggle to grasp the concept mapping technique. They consequently suggest that
“students also need to be taught something about brain mechanisms and knowledge
organization, and [that] this instruction should accompany the use of concept maps” (Novak &
Cañas, 2008:9). Nevertheless, whatever the reason for the time constraint, the time required
for instruction must still be found. In addition, it can be argued that adding more information to
what needs to be learnt, i.e. the workings of the brain, might very well aggravate the situation
rather than ease it. Accordingly, as Greenberg and Wilner (2015:19) maintain, following the
entire process from the start might only be possible when concept mapping is incorporated into
the curriculum. The question is whether the full value of concept mapping can only be obtained
from participating in the entire process (Greenberg & Wilner, 2015:19). Indeed, Chang et al.,
(2002:6) warns that using an alternative to a self-completed concept map (see the following
paragraph) may lead to rote learning – the very issue that concept mapping was designed to
counteract. On the other hand, they also report that constructing a concept map ab initio has
been known to be so stressful to students that it has had a negative effect on learning and even

32
an eventual negativity towards the technique itself. An alternative solution to constructing a
complete concept map consequently seems warranted.
For many who are experiencing these predicaments, the answer appears to lie in using some
form of pre-constructed concept map (Greenberg & Wilner, 2015:19), such as Figure 3 below.
By using alternative scaffolded ways of interacting with concept maps, it is still possible to
experience many of the advantages of concept mapping (Carnot et al., 2003:9), because the
very act of “organizing the information into an integrated, hierarchal system” is in line with
Ausubel’s Assimilation Theory (Greenberg & Wilner, 2015:19). Tackling a complicated topic
might be a further reason for using a pre-constructed map, as an “expert skeleton” map,
produced by someone who is an expert on that particular theme, may serve as a useful scaffold
for both teachers and students (Novak & Cañas, 2008:20). This has the added benefit of
providing a “macrostructure” of the theme that serves as an outline of what is to be learnt
(Chang et al., 2002:6). If concept mapping is to be used for assessment (see below for a further
discussion on assessment), a pre-constructed map has the advantage of allowing for
quantifiable measurement, which the wholly constructed concept map does not, being
individual expressions of knowledge (Maas & Leauby, 2005:93).
Figure 3 An example of a pre-constructed or partially constructed concept map

33
A number of different methods has been suggested for using a pre-constructed concept map.
This might consist of filling in the blank content nodes of a concept map already containing the
labelled relationships of a completed concept map (Greenberg & Wilner, 2015:19), or vice
versa. However, a concept map that is too skeletal might create as much cognitive overload as
creating an entire concept map (Chang et al., 2002:19). Chang et al. (2002:7) suggests two ways
in which pre-constructed maps may effectively be used for meaningful learning. One proposed
method is to use scaffolding principles by progressively lessening the degree of help given per
map as a student’s understanding and proficiency improves, a method Chang et al. (2002:7) call
“scaffold-fading”. This suggests that the initial maps will be uniform, becoming gradually more
personalised as students’ proficiency increases. This process is in keeping with Constructivist
principles (Chang et al., 2002:7). A second method proposed by Chang et al. (2002:8) is “map
correction”, where about 40% of the pre-constructed map contains incorrect concepts or
relationships. The advantage of this method is that it avoids rote learning because the student,
instead of simply regurgitating learnt definitions, is forced to think critically about the
propositions expressed in the concept map. Of the two methods proposed by Chang et al.
(2000), “map correction” appears to have had the most favourable outcome. This result is
ascribed to the relative ease with which students were able to adapt to the method, compared
to the instruction time required for the “scaffold-fading” method. Chang et al. (2002:20) found
that it took as long as fourteen weeks before a pre-constructed concept map method showed
results, and that, in fact, an entire year might be required to internalise the process fully. This
observation yet again highlights the time-consuming nature of implementing concept mapping,
even in assisted form.
The use of concept maps in assessment
The use of concept maps in assessment is encouraged by Novak (2010:231). Indeed, he
considers concept mapping as “the most powerful evaluation tool available to educators”.
Standard tests, especially those that require short answers, do not always sufficiently indicate
whether a student has understood the material being tested, as only a small section of
knowledge can be covered this way (Novak, 2010:231). When concept maps are used as
assessment instruments, a much better insight is gained of a student’s understanding (Novak,
2010:232; Novak & Gowin, 1984:94). Nonetheless, not all researchers consider concept
mapping a reliable assessment tool because of the idiosyncratic expressions of knowledge it
engenders. Novak (2010:232), on the other hand, sees this as a strong point in favour of using
concept maps for assessment, as it precludes rote-learned responses. He further argues that

34
concept mapping as assessment tool complies with both issues of validity and reliability
because it aligns with Constructivist theories (Greenberg & Wilner, 2015:16-18; Novak & Gowin,
1984). There are provisions, however. Firstly, students will need to be familiar with concept
mapping (Novak, 2010:231). Secondly, objectivity of the marking will have to be ensured. This
restraint will only be an issue where the students are required to construct the complete map,
because of the resultant variation in the individual map solutions. Novak (2010:232) is of the
opinion that such subjectivity in marking will be minimal and easily negated by the advantage
that concept mapping assessment offers over assessment that requires rote-learning (Novak,
2010:232). Nevertheless, for large classes this would become a time-consuming matter, apart
from the difficulty of remaining objective. A solution might yet again be offered by the use of
partially completed concept maps.
The use of technology in creating concept maps
The use of technology might greatly facilitate the concept mapping technique. Novak and Cañas
(2008:12) favour the use of CmapTools (Cañas et al., 2004; available at http://cmap.ihmc.us),
created by the Florida Institute for Human and Machine Cognition (Novak, 2010:122), although
other concept mapping software also exists and is available online. Figure 4 shows an example
of the use of CmapTools. A software program eases the process of initially setting up a map and
rearranging the positions of concepts and links, and offers the added benefit of the inclusion of
images and online links (Novak & Cañas 2008:12-14). A concept map will need several revisions
to improve its clarity and structure before it can be considered complete (Novak, 2010; Novak &
Cañas, 2008:12; Simon, 2007:277), a necessity which is also greatly facilitated by using software
(Novak, 2010). Finally, it enables team participation and collaboration, even across distances
(Novak & Cañas, 2008:12). A word of caution is necessary here, however. When considering
using computer generated concept maps, it is important to take students’ computer literacy
into consideration so as to avoid an additional cognitive load.

35
Figure 4 An example of a concept map being created using CmapTools
2.4.2.3 Limitations of concept mapping
Concept mapping is not without restrictions. For instance, while the purpose of concept maps is
to represent knowledge, Safayeni et al. (2005:2) contend that concept maps cannot represent
complicated or “higher” forms of knowledge, such as the mathematical equations needed for
Physics. They further maintain that concept maps are only suitable for “static” concept
relationships. Indeed, Novak (2002:553) declares that concept mapping is principally useful for
declarative knowledge, in accordance with Assimilation Theory principles. Nevertheless,
concept maps can be used to clarify confusing or complex concepts and have been used
successfully in many subjects, including Mathematics, Bioengineering, Biology (Kinchin, 2000;
Novak, 2010), Accounting (Simon, 2007; Maas & Leauby, 2005), Health Sciences (Brennan et al.,
2012), Nursing (Clarke, 2015) and Religion (Pui-lan, 2010).
There are other constraints, however, that are arguably more problematic. The concern of the
time required for both lecturers and students to master concept mapping has been discussed in
detail (see Section 2.4.2.2). Some researchers further question students’ ability to identify all
the intricate relationships that exist between concepts (Simon, 2007:284).

36
2.5 Conclusion
In this chapter, an overview was given of different approaches to Constructivism – the learning
theory in which the pedagogy of the present research is embedded. One of the important
concepts within constructivist approaches to teaching and learning is scaffolding. The chapter
provided an in-depth exposition of a particular technique for scaffolding content and language
learning, namely concept mapping. Concept mapping, based on Ausubel’s Assimilation Theory,
was shown to function as a scaffolding tool on many levels, as it visually scaffolds knowledge,
encourages student participation and supports metacognitive learning in a variety of learning
tasks. It can thus be expected to support the acquisition of concept literacy. In a discussion of
the formatting of the concept mapping technique, the visual and hierarchical nature of concept
mapping was demonstrated, and the use of partially completed concept maps supported.
Finally, the possibility of its use in assessment was discussed.
37
Chapter 3: Methodology
3.1 Introduction
This chapter describes the methodology that will drive the research for this study.
Postpositivism was chosen as the research paradigm as it was regarded to be the most suited to
answer the main research question, namely "Is concept mapping an effective technique for
scaffolding concept literacy among first-year Accounting students in an extended curriculum
programme?" Both qualitative and quantitative research will be used to measure the
effectiveness of concept mapping. While a mixed-methods approach is not normally used with
Postpositivism, it was deemed the most useful strategy here. For various reasons that will be
explained in more detail hereafter, it was convenient to conduct the research with the
Accounting students of an extended programme at a South African university. Of the
approximately 700 students that make up the entire population of students who attend the
extended programme, about 180 take Accounting as a subject. These students are divided into
two groups according to their choice of degree, the BCom group forming the test group and the
BSc Mathematical Sciences group forming the control group. The materials used for the
intervention as well as the methods of data gathering and data analysis will be discussed in
detail.
3.2 Research paradigm
Karl Popper (2002:18) was the first to declare that theories can never be verified empirically,
which was in contrast to the inductive reasoning practised by Positivism. At present, many
researchers therefore take the position that it is not possible to claim an absolute truth about
the knowledge acquired through research (Floden, 2009:488; Trochim, 2001:20), especially
when doing research in which humans are participants (Creswell, 2014:7; Somekh & Lewin,
2011:327). Popper proposed that research should thus not aim at verifying a theory or
hypothesis, but at attempting to falsify it (Crook & Garratt, 2011:213; Popper, 2002:18;
Mouton, 1996:15). With every failed attempt to prove a theory false, the theory emerges
stronger and finally becomes part of the body of knowledge. Yet even this endorsement is
tenuous, as the theory might still be proved false at some future date (Crook & Garratt,
2011:213; Mouton, 1996:15). However, this does not prevent a researcher from “making
credible claims based on rigorous inquiry” (Floden, 2009:488).

38
This outlook describes the Postpositivist worldview, embedded in a Realist ontology (Willis,
2012a:9), which will inform the methodology used in this study. Some expressions of
Postpositivism hold extreme views of “falsification”, and insist that no amount of research will
prove a theory right. This position has been attenuated somewhat so that, currently, knowledge
claims may be made after many studies have been conducted on the same theme (Willis,
2012b:8). In fact, in working “publicly within the context of a broader contentious community of
truth-seekers (including other scientists) who criticize each other’s work”, true objectivity may
be approached (Trochim, 2001:20). Underlying the Postpositivist worldview, then, is the desire
to look for truth (Willis, 2012b:8), although this remains a goal that is not easily attainable.
The Postpositivist paradigm is deterministic in nature, which means that outcomes are
presumed to have causes, and that these causes may be identified and investigated (Creswell,
2014:7). For example, extenuating circumstances may be sought to explain the failure of a
theory (Willis, 2012b:7). This worldview is also reductionist, as it is the basic elements that
make up the proposed theory that are tested in the research (Creswell, 2014:7). The key
features of Postpositivism may be expressed as follows (extracted from Creswell, 2014:7 and
Willis, 2012b):
At the start of the research, a theory must be put forward on which the research will
be conducted. The theory (or hypothesis) must be clearly and unambiguously stated
(see Sections 1.5 and 1.6).
Data are then collected by means of appropriate instruments and the process strictly
controlled (see Section 3.6).
After analysis of the data, an attempt is made to explain the causes of the observed
outcomes (see Chapter 4).
Objectivity and validity of the conclusions must be assured. Willis (2012b:12) cautions
that, to avoid bias, “[y]ou must step out of the professional practitioner role in order to
take on the role of researcher” (see Section 3.4).
3.3 Research design and strategy
The most appropriate research methodology for the Postpositivist worldview is a quantitative
strategy. However, the sequential mixed-methods strategy was selected for this study, as the
aim was to obtain a wide range of data, and using both quantitative and qualitative data

39
collection methods have the desired outcome of obtaining knowledge through investigation,
with the aim of understanding the world around us (Sale, Lohfeld & Brazil, 2002:46).
With the sequential mixed-methods strategy, one type of data collection is used to expand on
the other (Creswell, 2014:14). In this case, the qualitative data made up a small part of the
collected data, as they were drawn from four open-ended survey questions and the
observations of the research intervention; nevertheless, the fact that both qualitative and
quantitative methods were used had an impact on the research design. Therefore, despite the
research design for Postpositivism normally being a quantitative approach, a mixed-method
approach was followed here.
Using a mixed-methods design has advantages as it prevents the possible biases that may arise
from a single-focus lens, and the different foci are useful in providing additional triangulation of
results (Creswell, 2014:15; Lewin, 2011:220). Yet, mixed-methods approaches can move beyond
these initial advantages to merged strategies that forge new paths of research, so that,
according to Creswell (2014:10), “the overall strength of a study is greater than either
qualitative or quantitative research”.
3.4 Population and sampling
There are approximately 700 extended programme students per year at the Mamelodi campus
of the University of Pretoria. These students are grouped according to the course they wish to
pursue, being either BSc (Biological, Mathematical and Physical Sciences) or BCom. The annual
intake of the BCom Extended Programme is approximately 150 students, and that of the BSc
Extended Programme approximately 550 students. Concept mapping aims at improving concept
literacy and is therefore best housed in a content subject rather than a non-content subject,
such as Academic Literacy. Selecting a content subject depended largely on the willing
cooperation of the content subject lecturer. The Accounting lecturer showed an interest in
concept mapping and Accounting was consequently chosen for the research. To house the
research in Accounting was merited since research shows that the use of concept mapping is
suited to this content subject (Leauby et al., 2010:284). A further positive aspect of using the
Accounting course as the content subject is that students were conveniently grouped into two
groups, which facilitated the formation of a test and control group.
40
According to Faculty regulations, students may apply to do the BCom (Extended Programme) if
they have achieved an Admission Point Score (APS)1 of at least 26, an NSC Mathematics level of
at least 3 (40-49%) and an NSC English level of at least 4 (50-59%, either at English Home
Language level or First Additional Language level) (Faculty of Economic and Management
Sciences, 2017). The BCom Extended Programme has a fixed structure and content, except for
certain variations in the Mathematics and Statistics offerings, which are determined by whether
the students will be pursuing a numerical or non-numerical BCom degree. Students wanting to
pursue a numerical BCom degree must obtain an NSC Mathematics level of at least 4 (50-59%)
(University of Pretoria Yearbook, 2017). For the non-numerical degree, only one semester of
Mathematics is included in the curriculum. All the BCom students have Accounting as a subject
in the extended programme.
Students may apply to the BSc Mathematical Sciences (Extended Programme) if they achieved
an APS of at least 26 and an NSC English rating of at least 4, as with the BCom (Extended
Programme). However, for BSc Mathematical Sciences (Extended Programme) students, an NSC
Mathematics rating of at least 5 (60-69%) is required. Students may select Accounting as
elective and students choosing this elective are then grouped together (Faculty of Natural and
Agricultural Sciences, 2017).
Accounting as a school subject is not a pre-requisite for either programme; in other words,
some of the students may be doing Accounting for the first time. As both the BCom (Extended
Programme) and the BSc Mathematical Sciences (Extended Programme) require English at level
4 (50% – 59%, either as Home Language or First Additional Language), a certain level of
proficiency in English may be presumed.
The Accounting students have four hours of lectures per week, during which new Accounting
concepts are introduced by the lecturer. This is followed by four hours of tutorials, facilitated by
tutors, during which the concepts are embedded through practice. For the tutorials, the large
lecture groups are broken up into smaller groups that can be accommodated in the
laboratories. It was deemed appropriate that the concept maps be introduced by the
Accounting lecturer in the lecture periods. It would not have been suitable to use the tutors
(senior students), for whom concept mapping was unfamiliar, whereas the Accounting lecturer
had been instrumental in the construction of the concept maps and he was therefore
1 The Admission Point Score (APS) is calculated using the NSC seven-point rating scale of achievement for six of
a student’s recognised NSC 20-credit subjects.
41
conversant with their function. This is a suitable environment for the effective use of concept
mapping as the Postpositivism paradigm requires the researcher to be distanced from his or her
normal role as practitioner, for the sake of validity (Willis, 2012b:12).
The BCom group was chosen as the test group and the BSc Mathematical Sciences group with
Accounting as elective as the control group. The BCom group was chosen as the test group
because it was the larger of the two groups and it was felt that the concept mapping
intervention would therefore be more thoroughly tested. Because these two groups were
chosen for their accessibility, convenience sampling, a type of non-probability sampling often
used when there is a time constraint, was used (Lewin, 2011:224). The sampling could also have
been called “purposive”, as the participants were specially selected to test something new. As
the participants of the two groups are not randomly selected, the study can be called quasi-
experimental (Lewin, 2011:221). This raises concerns about validity because the groups might
differ in significant ways, based on the criteria used to divide the students into these groups.
Validity of data is of primary concern in the Postpositivist paradigm (Creswell, 2014:7).
Consequently, the two groups were tested for equality of ability (see Section 4.2.2). For the
same reason, confounding variables, such as previous exposure to visual aids, high school
attended, Maths and English marks in Grade 12, and previous experience of Accounting, needed
to be carefully accounted for (see Leauby et al., 2010:288, for a review of issues that invalidated
concept mapping research results).
3.5 Setting
The setting was the first semester Accounting module (FRK 133). The syllabus comprises the
following main themes: The nature and function of Accounting; the development of Accounting;
financial position; financial performance; flow of documents; the recording process; processing
of Accounting data; treatment of VAT; elementary statement of comprehensive income (income
statement) and statement of financial position (balance sheet) (University of Pretoria, 2017).
The intervention, which revised previously addressed material, was integrated into the standard
curriculum. Because of the pedagogic importance of authenticity and validity in assessment, the
additional research and assessment instruments were aligned to the outcomes of the
curriculum and the purpose of the task at hand (Herrington & Herrington, 2006:149; see also
Cumming & Maxwell, 1999:179).
42
3.6 Methods of data gathering
With the Postpositivist research paradigm, it is important that suitable instruments be used to
collect the necessary data. The following research instruments were deemed most appropriate
for this research study:
A pre-intervention questionnaire survey of students' experience in using visualisation
techniques for learning and memorisation
Pre- and post-intervention expository paragraphs
Observation of concept mapping class discussion
A post-intervention opinion survey (questionnaire)
Below, each of these instruments will be discussed in terms of how they were constructed, how
they were used to gather data and how the data were analysed.
3.6.1 Pre-intervention questionnaire survey of students' experience in using visualisation techniques for learning and memorisation
To obtain a holistic view of the factors that influence student performance (Koh, 2014:456) and
to prevent a skewed result, it was considered necessary to identify confounding variables, such
as students’ educational history, learning styles and other relevant background factors. A pre-
intervention questionnaire, designed to elicit this information, was therefore completed in class
by the test and control groups (See Appendix A). As it was expected that a large number of
students were to be surveyed, questionnaires were deemed more useful than other survey
methods, such as interviews and focus groups (Lewin, 2011:224; Novak, 2010:116). Novak
(2010:116) also makes the point that questionnaires have an advantage over focus groups and
interviews in that quantitative data can be extracted from questionnaires. However, he also
warns of misinterpretation of student responses in a questionnaire, in contrast to an interview
where a response can be investigated by means of further questions. Furthermore,
questionnaires have a notoriously poor response rate (Michaelidou & Dibb, 2006). It was
therefore thought advisable that the questionnaires be done in class time. Descriptive and
inferential statistics were used to analyse the data, and contributed to answering the main
research question: “Is concept mapping an effective technique for scaffolding concept literacy
among first-year Accounting students in an extended curriculum programme?”
43
The first four questions of the pre-intervention questionnaire were aimed at establishing the
learning styles of the students: verbal (“I learn through reading a printed or written text”), aural
(“I learn through listening, e.g. to a lecture”), physical (“I learn when I am active, e.g. when I
highlight, underline, summarise”) or visual (“I learn by using visual elements, e.g. maps, graphs,
pictures”). This was done to determine whether a visual learner would be advantaged in the use
of concept mapping, which is a highly visual technique. A Likert scale of one to four was used,
ranging from “strongly agree”, “agree” and “disagree” to “strongly disagree”. Students were
therefore forced to give an opinion, as the traditional neutral point in a Likert scale was
removed.
The next three questions probed students’ experience of visual aids, such as mind maps. The
first question attempted to establish whether students had used such learning aids previously,
with a straightforward “yes” or “no” response to the question “I have used visual aids, such as
the one shown here, before”. In retrospect, an additional question could have been added to
determine the degree of such exposure as a brief introduction to visual aids would have had a
very different result from an immersion in the use of such aids. Students were then prompted
to assess the extent to which visual aids had been useful for memorisation (“The visual aid that I
used helped me to memorise the work”) and for understanding (“The visual aid I used helped
me to understand the work”), again with a “yes” or “no” response. Here, however, students
were given the option of providing a third, “not applicable” response if they had no previous
experience of visual aids for learning.
One qualitative question was included to allow for further information regarding visual aids that
students might wish to add. The question read as follows, “Is there any further comment you
would like to make about the advantages and disadvantages of using visual elements in
academic work?”
The next twelve questions were used to gather demographic information about students, in
particular to determine the factors that might have had an impact on the students’ pre- and
post-intervention paragraph results (Koh, 2014:453). Such demographic information, if placed
at the beginning of a questionnaire, may seem intrusive to students and prevent their further
participation (Lewin, 2011:224). For this reason, these questions were asked at the end of the
questionnaire. Even though the anonymity of each student was guaranteed, it was necessary to
obtain their names and student numbers to be able to match the pre- and post-intervention
paragraphs results. According to Lewin (2011:224), the questionnaire could therefore not truly
be called anonymous. Students were then asked whether they belonged to the BCom (test) or
44
BSc (control) group, and, even though the two groups operated separately and their identity
was known beforehand, this was added confirmation that students were in the correct group.
Students’ gender was established, as it was originally thought that this might be a factor that
could have an impact on results.
Students were asked to provide the name of the school they had attended, as well as where the
school was situated, as it was thought that the level at which the school operated might have an
impact on results. Currently, the South African government funds basic education according to a
“pro-poor funding model”, where schools are categorised according to the level of poverty in
the surrounding area. There are five categories or “quintiles”, with quintiles 1 to 3 receiving
most funding and charging no schools fees; schools falling within quintiles 4 and 5 receive the
least funding and are consequently allowed to charge school fees (Dass & Rinquest, 2017:143).
There is also a further category of schools, namely independent or private schools. These
schools do not fall within the quintile system and are commonly funded entirely by parents.
Since students were not expected to know in which quintile the schools fell that they had
attended, the school names and locations were used to find information on the schools and
then to categorise them as non fee-paying schools (quintiles 1 to 3 = 1), fee-paying schools
(quintiles 4 and 5 = 2), or private schools (= 3). Categorisation facilitated better statistical
analysis and provided information that was more useful. However, a few problems were
encountered during this process. Some schools could not be traced, possibly because of
respondents’ spelling mistakes, and the information in such cases unfortunately needed to be
discarded. Furthermore, it became clear that there are private schools run by charitable
organisations attempting to uplift a community. The category of “private school” is therefore
somewhat blurred and may affect the drawing of conclusions about the effect the level of a
school has on results.
Four questions in the questionnaire dealt with students’ matric results. They were asked what
their final symbol for English had been (“Symbol received for English in final exams”), and
whether the level of the paper had been English Home Language or English First Additional
Language (“Level of English in Grade 12”). For the first of these two questions, a range of
symbols (A [7] to F [2]) was provided for selection, to ensure that all reasonable possibilities
were catered for. Even though students needed a level 4 to gain entry to either the BCom or
BSc Mathematical Sciences extended programme, a level 2 response was made available in case
students who had only achieved this level had slipped through the system. The question on the
level of English in Grade 12 required a choice between “English Home Language” and “English

45
First Additional Language”. These two questions were linked to the question on home language
(“Home Language”) which offered the following range of responses: English, Afrikaans, Sepedi,
Other South African, Other African and Other. The current interest in the impact that not being
taught in one’s home language has on student success (Carstens, 2015; Gablasova, 2012;
Mckenna, 2012; Nkomo & Madiba, 2011) elicited these questions. Nevertheless, the data on
home language were discarded because of the sparse distribution of cases, which meant that
the model was not estimable. As a result, the impact that language might have had on student
results rested upon the level of English they took in Grade 12 and their matric results for
English.
The symbol students received for Maths was also obtained (“Symbol received for Maths in final
exams”), as well as the APS with which they applied to the University (“Final AP score gained”).
It was thought that this information could affect the student results. As far as the question
regarding symbols was concerned, a range of symbols (A [7] to F [2]) was provided for selection,
to ensure that all reasonable possibilities were catered for. Even though students needed a
level 3 (BCom) or 5 (BSc Mathematical Sciences) in Maths to gain entry to the extended
programme, a level 2 response was made available in case students who had only achieved this
level had slipped through the system. The APS required a number to be filled in (for more
information on the APS, see Section 3.5). A further school-related question dealt with whether
the students had previous experience of Accounting (“Had Accounting as a school subject”),
which required a “yes” or “no” answer.
3.6.2 Pre- and post-intervention expository paragraph
Prior to the concept mapping intervention, both the test and control groups were asked to
write a paragraph based on a previously introduced Accounting theme that required the
understanding of specific Accounting terms. A similar task was conducted after the concept
mapping intervention, based on the theme that had been addressed during the concept
mapping intervention. To assist students in the formulation of their answers, a list of
Accounting terms was provided, which needed to be incorporated into their answers. Lined
paper accompanied the questions on which the solutions were to be written.
The pre- and post-intervention paragraph questions (see Sections 3.6.2.1 and 3.6.2.2 below)
were drawn up by the Accounting lecturer during whose lectures the concept mapping
intervention would take place. This was necessary, as it was essential that the assessment
represented an environment that was familiar to the Accounting students. The questions were
46
moderated by a senior lecturer in Accounting to ensure their validity, as well as by me, to
ensure that the results would be measurable according to the requirements of the present
research.
For both paragraphs, two real-life scenarios were sketched to which students had to apply
relevant Accounting principles. The use of real-life scenarios in assessment is familiar to
Accounting students, and complies with the third level of Bloom’s Taxonomy in that the
cognitive skill, application of knowledge, is required (Needles, 2014:38). However, whereas
answers are typically required in numerical or bookkeeping form in assessments, students were
in this case required to respond by writing the answers in a paragraph form. In other words,
they needed to verbalise their responses.
There is justification for this departure from the normal Accounting assessment format.
Pearson, Hiebert and Kamil (2012:2) state that a true test for effective terminology acquisition
would be the spontaneous use of terminology in students’ speaking and writing. However, they
also point out that tracing such use would entail both time- and effort-intensive moderation
that would be unmanageable on a large scale. It is for these same reasons, they contend, that
terminology assessment has most often been directed towards receptive (listening and reading)
rather than productive (speaking and writing) methods.
Nevertheless, it was considered of importance that the “spontaneous use of vocabulary words”
was evaluated for this study, as this would provide valuable feedback on the effectiveness of
the intervention that had conceptual understanding as its focus. It is worthwhile here to refer
again to the statement made by Gablasova (2012:13) that “part of mastering the subject-matter
is the learning of the appropriate way of communicating it”. Many researchers see conceptual
learning as taking place through the medium of language (Vygotsky, 1986:108; Novak, 2010:80;
Novak & Cañas, 2008:15). A further motivating factor for requiring students to write paragraphs
was the possibility that the typical numerical solutions might have been memorised, a situation
that would be revealed by means of the setting of unfamiliar problems (Novak & Gowin,
1984:94; see also Vygotsky, 1986:150). Furthermore, in her study, Jonker (2016) reports that
students’ written assignments showed a lack of conceptual understanding of the concepts that
an improved pass rate had suggested.
Cloze tests and vocabulary levels tests were not used, as these tests focus on English language
proficiency rather than on concept knowledge attainment. It is my belief that conceptual
understanding is better tested through productive terminology usage than through receptive

47
terminology usage. The idea of spontaneous use of terminology was therefore adapted to be of
value for this assessment, as students needed to be informed of the assessment criteria for the
exercise beforehand. “Spontaneous” must in this case therefore be interpreted as
“unprompted”.
The use of subject-specific terms in the pre- and post-intervention paragraphs were assessed
for occurrence (unprompted use) and correct usage (conceptual understanding). These tasks
comply with two of the “levels of complexity” that Alcina (2009:5) uses to measure the degree
of cognitive development that has occurred, in that students had to recall the meaning of the
words from memory (first level of complexity) and apply them to a new situation (second level
of complexity). The verbalisation of their responses also creates the “professional context” that
Maas and Leauby (2005:78) advocate, in which “Accounting graduates must be capable of
applying conceptual and technical business knowledge and skills to structured, unstructured, or
ill-defined business scenarios”. Needles (2014:39) names communication skills, which include
writing skills, as one of the five basic skills areas essential to the Accounting profession. He
further maintains that such skills need to be “developed through particular tasks and
assignments”.
In the writing of the post-intervention paragraph, the most comparable environment needed to
be created for both the test and control group. For this reason, the topic covered in the concept
mapping intervention for the test group (“The Accrual Concept”) was also revised for the
control group by means of PowerPoint notes, a revision format with which they were well
acquainted. Furthermore, the same timespan of three days was allowed to elapse between the
revision and the writing of the post-intervention paragraph for both groups. There was no
prescribed reason for deciding on that particular interval; it was solely determined by timetable
constraints. However, once the interval became necessary for the test group, it was similarly
required for the control group.
The pre- and post-intervention paragraphs were evaluated for conceptual understanding using
the extensive guidelines provided by the Accounting Department (see Sections 3.6.2.1 and
3.6.2.2 below). Marks were thus awarded for the correct application of the terms provided. The
grammar, spelling and punctuation usage was also assessed and the impact on the marks of
infringements captured separately. The marks that included the grammar infringements were
eventually not used, as such infringements in some cases had too great an impact on the
Accounting marks, and took the focus away from what the research was actually testing. The
marking was done by me and moderated by the subject specialist.

48
The pre- and post-intervention paragraph scores of the students from the test and control
groups were compared to see if there had been any improvement, and to establish whether
such improvement had been greater for the test group than for the control group. The results
of the statistical tests based on this data contributed to answering the sub-question: “How does
concept mapping affect students’ comprehension of subject-specific concepts and their
associated terms?”
3.6.2.1 The pre-intervention paragraphs
The following scenarios were given for the pre-intervention paragraphs.
Mrs Mohamed owns a fast food business (At-Your-Service). The following transactions occurred
during the financial year ending 28 February 2016:
27 February 2016 At-Your-Service received a water and electricity bill of R 5 000 from its
municipality relating to the month of February 2016. Mrs Mohamed indicated that the bill will be
settled in March 2016.
28 February 2016 At-Your-Service made a 3 year loan of R100 000 to Bisho enterprises on 01
March 2014. The interest on the loan amounts to R 7 000 per annum. Bisho has not yet paid the
interest due for the year ended 28 February 2016.
Required:
Discuss, with reasons, how you will account for both of the above transactions in:
• The Statement of Profit or Loss and Other Comprehensive Income of At-Your-Service
for the year ended 28 February 2016 AND
• The Statement of Financial Position of At-Your-Service as at 28 February 2016.
Note:
• You are required to use the format provided
• The following terms should be included in your discussion:
• Interest income or income
• liability
• expense
• accrued expense
• accrued income
• asset
• current financial year
• following financial year
• earned
• incurred
Students were expected to apply these terms to the correct scenario and in the correct way.
Thus, seven correct statements could be made for each scenario, as illustrated in the suggested

49
solution below. The final mark was out of fourteen, a mark being awarded for the correct
application of each of the terms provided.
Transaction on 27 February 2016:
The water and electricity bill of R5 000 represents an expense incurred but not yet paid (accrued
expense). The water and electricity expense account will be debited while an accrued expense account
will be credited. The water and electricity expense of R5 000 will be recognised in the Statement of
profit or loss and other comprehensive income as it was incurred in the current financial year ending
28 February 2016. An accrued expense will be recognised in the Statement of Financial Position as a
current liability as it was not yet paid as at 28 February 2016 (or is payable in the following financial
year).
Transaction on 28 February 2016:
The interest receivable from Bisho of R7 000 represents interest income earned but not yet received
(accrued income). The interest income account will be credited while an accrued income account will
be debited. The interest income of R5 000 will be recognised in the Statement of profit or loss and
other comprehensive income as it was earned in the current financial year ending 28 February 2016.
An accrued income will be recognised in the Statement of Financial Position as a current asset as it was
not yet received as at 28 February 2016 (or is receivable in the following financial year).
3.6.2.2 The post-intervention paragraphs
The following scenarios were provided for the post-intervention paragraphs.
Mrs Lee owns a soft drink making business (Softie Beverages). The following transactions occurred
during the financial year ending 28 February 2016:
1 January
2016
Softie Beverages paid R20 000 for business insurance cover. The policy commences on
1 January 2016 and costs R2 000 per month.
1 February
2016
After tasting Softie Beverage’s soft drink, Mr Moloko placed two orders, the first worth
R5 000 which was delivered to him on the same day and the second worth R7 000 which
will be delivered to him on 3 March 2016. Mr Moloko paid the full R12 000 on
1 February 2016.
Required:
Discuss, with reasons, how you will account for both of the above transactions in:
The Statement of Profit or Loss and Other Comprehensive Income of Softie Beverages
for the year ended 28 February 2016 AND
The Statement of Financial Position of Softie Beverages as at 28 February 2016.
Note:
You are required to use the format provided
The following terms should be included in your discussion:

50
Sales (or income)
Income received in advance
liability
expense
prepaid expense
asset
current financial year
following financial year
earned
incurred
Students were again expected to apply these terms to the correct scenario and in the correct
way. In this case, eight correct statements could be made for each scenario, as illustrated in the
suggested solution below. The final mark was out of sixteen, a mark being awarded for the
correct application of each of the terms provided. The difference in the marks was catered for
in the statistical analysis.
Transaction on 1 January 2016:
The total amount paid to the insurer of R20 000 will be credited to the business bank account. However,
only R4 000 (R2 000 x 2 months) will be recognised as an expense in the Statement of profit or loss and
other comprehensive income for the year ended 28 February 2016, as it was an expense incurred in
the current financial year. The R16 000 (R20 000 - R4 000) represents prepaid expenses as it relates to
the following financial year. The prepaid expense of R16 000 is a current asset which will be recognised
in the Statement of financial position at 28 February 2016. Softie Beverages has not yet incurred the
R16 000 insurance expense even though the cash was paid.
Transaction on 1 February 2016:
The total amount received from Mr Moloko of R12 000 will be debited to the business bank account.
However, only the R5 000 amount will be recognised as sales (or income) in the Statement of profit or
loss and other comprehensive income for the year ended 28 February 2016, as the soft drinks were
delivered in the current financial year, therefore the income was earned. The R7 000 represents income
received in advance as the soft drinks will only be delivered in the following year. The income received
in advance represents a current liability which will be recognised in the Statement of financial position
as at 28 February 2016. Softie Beverages has not yet earned the R7 000 income even though the cash
was received.

51
3.6.3 The concept maps
It was decided to familiarise the students in the test group with concept mapping prior to the
intervention, by presenting them with two concept maps on work that they had already
covered. This was felt to be an essential course of action because, on the one hand, the
concept mapping strategy was most likely entirely new to students. On the other hand, the time
available to acquaint students with concept mapping was limited, and, as discussed before, a
substantial period is needed to become familiar with the technique. Moreover, since the
intensive participation required from students in the concept mapping exercises might have
created anxiety in participants or might even have precluded their participation, partially
completed concept maps were created (Carnot et al., 2003:9). As Novak (2010:13) maintains,
students need “explicit guidance in the use of tools and strategies”. The novelty of the strategy
of concept mapping necessitated guidance by the lecturer and the support of peers, and
consequently the concept map tasks were done in teams of two or three where possible, which
had the added benefit of facilitating peer scaffolding (Herrington, Oliver & Reeves, 2002).
The concept maps were drawn up by the Accounting Department and then created online by
me, using CmapTools software (Novak & Cañas, 2008:14). The concept maps were therefore
conceived by experts in the field of Accounting, who understand the relationships between
concepts, as advised by Novak and Cañas (2008:14). The pre-intervention concept maps
covered “Revenue (Sales)” and the “Accounting Cycle”, both themes that had already been
addressed during the semester. The maps were only presented once the pre-intervention
paragraphs had been written, to prevent the paragraph marks from being influenced. Firstly, a
completed concept map on “Revenue (Sales)” (Figure 5), depicting the relationship between
revenue and cash flows, was presented to the test group in class.

52
Figure 5 The Revenue (Sales) concept map
Thereafter, the students were given a concept map representing the Accounting Cycle (Figure
6). In this instance, the map was only partially completed. As mentioned previously, requiring
students to complete the map was considered a further step in illuminating the idea of concept
mapping. The completed map was then presented by the Accounting lecturer, and the
Accounting cycle discussed.

53
Figure 6 The Accounting Cycle concept map
After this preparatory work, the main intervention took place, for which the topic was the
“Accrual Concept” (Figure 7). Once again, a partially completed concept map was supplied to
students that they had to complete. Once again, they were asked to work in teams, although
each student was expected to complete a map. They were allowed to refer to their textbooks.
After a time period that was considered adequate for the completion of the concept map had
elapsed, the Accounting lecturer discussed the correct version of the map by filling in the gaps
and talking students through the process. Students were allowed to correct their maps and ask
questions.

54
Figure 7 The Accrual Concept concept map
Each student’s completed map was then collected so that a record could be kept of
participants, as only the data of students who had participated in the entire process, from pre-
intervention questionnaire, pre- and post-intervention paragraph and concept mapping
intervention, to post-intervention questionnaire, would be useable for research purposes.
There was also a secondary reason for collecting the maps: if the maps were allowed to
circulate amongst students (as the sharing of knowledge is a common, and encouraged, practice
amongst students), the non-intervention status of the control group could have been
compromised.
55
3.6.4 Observation of concept mapping intervention
Three lecturers took part in the observation of the concept mapping intervention: the
Accounting lecturer, an academic literacy colleague and I. While the Accounting lecturer and I
were involved in the research and therefore had particular, though unspoken, aspects in mind
while observing the students, the third observer was not guided beforehand as to the aspects
worthy of comment. The reason for this was to obtain an entirely objective view, with, possibly,
fresh insights. The observers moved amongst the students while they, individually or in groups
of two or three, completed the partially-constructed concept map on the Accrual Concept (see
Figure 7). After the completion of the concept map, the correct version was presented to the
class so that the teams could correct their maps and become aware of their misconceptions.
The further discussions were again observed, and recorded. These observations were useful in
determining the level and type of interaction that concept mapping stimulates. This form of
observation was decided on as the most efficacious, as an audio-visual specialist attached to the
university where the research was conducted advised that recording the student conversations
would not have been possible in the venue in which the intervention took place. The
observation notes of the lecturers were analysed and the results informed the findings of the
quantitative research.
3.6.5 Post-intervention opinion survey (questionnaire)
Finally, the students in the test group were requested to complete a post-intervention
questionnaire so that an attitudinal measurement of their concept mapping experience might
be obtained (See Appendix B). Both quantitative and qualitative methodologies may be used to
investigate the experiences of the research subjects, but the methods should be in keeping with
their respective theoretical paradigms. For example, questionnaires with controlled responses,
such as those using a Likert scale, are in keeping with a quantitative perspective (Sale et al.,
2002:45), while open-ended questions follow a qualitative perspective.
In the questionnaire, Likert-scale questions pertinently solicited students’ experiences of the
concept mapping intervention. The Likert scale does not test answers for correctness but rather
tries to obtain the opinion of students (Novak, 2010:226). In order to obtain a broader,
unconstrained view of the students’ experiences of, and attitudes to, concept mapping, a
number of open-ended questions were added to the questionnaire (Sale et al., 2002:45). The
questionnaire was largely an operationalisation of the benefits of concept maps mentioned in

56
the literature, as well as issues that may have arisen during the intervention and the relevant
assessments.
The post-intervention questionnaire primarily focused on the experiences of concept mapping
of the test group students. As with the pre-intervention questionnaire, a Likert scale of one to
four was used for the quantitative questions, ranging from “strongly agree”, “agree” and
“disagree”, to “strongly disagree”, forcing students to provide a definite response.
The quantitative questions probed the students’ experiences of concept mapping from several
angles to ensure that responses were not misinterpreted. For instance, a positive response to
the question “I find concept mapping easy to use” does not necessarily mean that students are
positively disposed to using the strategy. On the other hand, if students did not find concept
mapping easy to use, they might display a negative attitude towards every other aspect of
concept mapping. Furthermore, if students liked concept mapping (“I liked using concept
mapping”), it would be useful to establish whether particular aspects of concept mapping
influenced this opinion. Therefore, the questions “Concept mapping helped me to better
understand the Accounting concepts”, “Concept mapping made it easier to remember
information” and “Concept mapping helped to identify misconceptions I had about a topic”
were included to measure which of the acknowledged strengths of concept mapping students
had experienced as useful. The question “I would be able to use concept mapping in my other
subjects” was asked because it was necessary to see whether students would recognise the
cross-domain applicability of concept mapping. Two of the nine quantitative questions in this
questionnaire seem unrelated to concept mapping, yet had a particular purpose. The first of
these, “I like Accounting”, was deemed necessary as a negative association with Accounting
could likewise negatively affect a student’s experience of concept mapping. For example, Lucas
and Mladenovic (2014:132) report that Australian “students’ performance is negatively affected
by the negative perceptions of Accounting that students bring to the subject”. The second
question, “I like being at the Mamelodi campus”, was similarly intended to account for the
influence of negativity towards an extrinsic factor.
Three qualitative questions were also asked, to elicit responses that were not covered by the
quantitative questions. Two of the questions with qualitative responses were specific (“Which
two aspects did you like most about concept mapping?” and “Which two aspects did you like
least about concept mapping?”). The third question was an “open” question (“Is there anything
further you would like to add about concept mapping?”) to allow students an opportunity to
express an opinion or describe an experience not catered for in the rest of the questionnaire.
57
Finally, students needed to supply their identification details (names, surnames and student
numbers) so that pre- and post-intervention experiences could be matched. As with the pre-
intervention questionnaire, anonymity was assured.
3.7 Ethical considerations
Several conditions are required in the practice of ethical research. Connelly (2014) lists the
following:
Permission must be given by the participants.
No coercion may take place, through either undue pressure or bribery.
Participants must be clearly informed of the implications and extent of the research.
Participants must be competent to consent.
Participants must be allowed to remove themselves from the research should they so
wish.
For the present research, the test and control groups were informed of the proposed
investigation and they were asked to sign a consent form indicating their willingness to
participate (Appendix C). It was also made clear that should students choose to abstain from
signing, they would nevertheless need to participate in all research activities, as the research
was integrated into the normal curriculum. However, the task results of non-participating
students would not be included in the investigation. Students were also informed that they
were allowed to withdraw from the research at any stage. By the very fact of their being
enrolled at a tertiary institution, it was presumed that all participating students were
competent to make their own decisions. In the event, all students chose to participate in the
research and no students requested that their responses be withdrawn from the research.
Regarding the qualitative dimensions of the research, Clarke (2009) warns of the possibility that
the social scientists’ “embedded position” might lead them to “shape the social environment”
[author’s emphasis]. Though there is distance between the interviewer and the respondent in
the case of a questionnaire, the answers to open questions may be misinterpreted for the sake
of a previously held conviction on the part of the interviewer (Nielsen, 1980). The qualitative
analyses were consequently checked by an independent third party to ensure inter-rater
reliability.

58
Finally, formal approval to conduct the research with students from the Mamelodi campus was
obtained from the Director of the Four-year Programme. After the completion of the research,
the concept mapping intervention was repeated for the control group.
3.8 Conclusion
In this chapter, the methodology that was employed in the research was described. The reasons
for conducting the research with Accounting students were given, as well as the procedure for
the concept mapping intervention. The methods of data gathering, namely the pre- and post-
intervention questionnaires and paragraphs, along with the observations of the intervention,
were explained in detail.

59
Chapter 4: Research findings and discussion
4.1 Introduction
In this chapter, the descriptive statistics emanating from the research are reported and
analysed using applicable statistical procedures. The qualitative data collected from the pre-
and post-intervention questionnaires are also analysed to establish whether and in what way
they support the quantitative data. In keeping with the Postpositivist research paradigm, causes
of the observed outcomes will be sought and discussed as far as possible (Creswell, 2014:7). The
research questions will be addressed in the light of these findings. Finally, based on the data,
the research hypotheses will be accepted or rejected.
4.2 Findings
4.2.1 Comparison of pre-intervention questionnaire responses of test and control groups
As discussed in the methodology chapter, it is necessary to ensure the objectivity and validity of
any conclusions that might be drawn. Therefore, in order to establish similarities and
differences between the two groups before conducting the experiment, students’ responses to
the pre-intervention questionnaire were analysed. A comparison was made of the ordinal (see
Table 1 below) and of the tabulating variables (see Table 2 below) of the pre-intervention
questionnaire responses of test and control groups. The results are discussed hereafter.
Table 1 Table of comparison of ordinal pre-intervention questionnaire responses of test and control groups
No Question
(Scaling = strongly agree=1, agree=2, disagree=3,
strongly disagree)
Test group (BCom)
n=70
Control group (BSc)
n=35 p-
value M Med SD M Med SD
Q1 I learn through reading a printed or written text 1.61 2.00 .708 1.66 2.00 .639 0.590
Q2 I learn through listening (e.g. to a lecture). 2.13 2.00 .779 1.97 2.00 .133 0.326
Q3 I learn when I am active (e.g. when I highlight, underline,
summarise. 1.57 1.00 .693 1.77 2.00 .154 0.386
Q4 I learn by using visual elements (e.g. maps, graphs,
pictures). 2.19 2.00 .937 2.34 2.00 .998 0.480

60
The responses to the first four questions of the questionnaire were based on a Likert scale,
which means they are ordinal variables. Moreover, the two groups are independent, and there
is independence of observations, as the participants in each group are unique. It was
consequently suitable to conduct the non-parametric Mann-Whitney U-test in order to
determine whether the test and control groups had the same distribution as far as the
responses to the Likert-scale questions were concerned. The results are shown in Table 1
above. The medians of the different variables for the two groups are closely grouped, which
suggests that there is no significant difference between the responses of the groups. This is
confirmed, as the p-values are all greater than 0.05, which indicates that there is no significant
difference in the way that students from the two groups responded to these particular
questions. This observation suggests that the students from both groups share a similar
environment in terms of learning styles.
Table 2 Table of comparison of tabulating variables of pre-intervention questionnaire responses of test and control groups
No Question Test group (BCom) Control group (BSc) p-
value n % n %
Q5 I have used visual aids, such as the one shown here,
before (yes=1, no=2).
Y=46
N=24
Y=65.7
N=34.3
Y=15
N=20
Y=42.9
N=57.1 .025*
Q6 The visual aid that I used helped me to MEMORISE the
work (yes=1, no=2, not applicable=3).
Y=40
N=10
NA=20
Y=57.1
N=14.3
NA=28.6
Y=9
N=7
NA=19
Y=25.7
N=20.0
NA=54.3
.008**
Q7 The visual aid that I used helped me to UNDERSTAND
the work (yes=1, no=2, not applicable=3).
Y=37
N=13
NA=20
Y=52.9
N=18.6
NA=28.6
Y=14
N=2
NA=19
Y=40.0
N=5.7
NA=54.3
.022*
Q13
+ 14
Name of high school attended/ Town/city where school
is situated (No fee school=1, Fee-paying school=2,
Private school=3)
1=17
2=35
3=17
1=24.6
2=50.7
3=24.6
1=21
2=9
3=5
1=60
2=25.7
3=14.3
.002**
Q15 Had Accounting as a school subject (yes=1, no=2)
Y=49
N=20
Y=71.0
N=29.0
Y=8
N=27
Y=22.9
N=77.1 .000**
Q17 Level of English in Grade 12 (English Home
Language=1, English First Additional Language=2)
HL=41
Al=29
HL=58.6
AL=41.4
HL=10
AL=25
HL=28.6
AL=71.4 .004**
Q18 Symbol received for English in final exams (A=7, B=6,
C=5, D=4, E=3, F=2)
AB=24
C=33
DEF=12
AB=34.8
C=47.8
DEF=17.4
AB=11
C=10
DEF=14
AB=31.4
C=28.6
DEF=40.0
.031*
Q19
Symbol received for Maths in final exams (A=7, B=6,
C=5, D=4, E=3, F=2)
AB=8
C=8
D=26
F=27
AB=11.6
C=11.6
D=37.7
F=39.1
AB=19
C=14
D=2
F=0
AB=54.3
C=40.0
D=5.7
F=0
.000*
Q20 Final AP Score gained (Mean scores provided) n=70 Mean=
28.20
n=35 Mean=
27.09 .555
**Significant at 1% level *Significant at 5% level
The remaining variables of the pre-intervention questionnaire have categorical type values and
cross-tabulation was therefore used to plot the distribution of the responses between the two
categorised variables. Pearson’s Chi-square tests, designed to determine the likelihood that the
observed distribution in categorical data is attributable to chance, were then run to measure
the association between the categories and p-values were obtained. From the results shown in

61
Table 2 above, we can observe that the p-values are all significant, except for the APS: the test
group students were more likely to have used visual aids in the past, and therefore to have a
positive experience of visual aids helping them to memorise and understand their work. Only
25% of the test group students came from no fee government schools, compared to 60% of the
control group students who came from these schools. Accounting was taken as a school subject
by 71% of test group students and only 23% of the control group students. The test group
students were more likely to have taken English as a home language at school, which ties into
the fact that they also tended to come from more advantaged schools. The Grade 12 English
results of the test group students were also higher than those of the control group students.
However, the control group students had far higher Grade 12 Maths results than the test group
students did. There was no significant difference between the APS of the two groups. From the
association between the covariates of the test and control groups, it is therefore clear that the
students come from different backgrounds.
4.2.2 Pre- and post-intervention paragraph marks
The crux of the research were the results of the pre- and post-intervention paragraphs that
were written by the test and control groups. These marks were therefore analysed in several
ways. Firstly, the pre-intervention paragraph marks of the two groups were compared for
similarity of ability. Secondly, the pre- and post-intervention paragraph marks for each group
were assessed for improvement. Finally, the difference between the pre- and post-intervention
paragraph marks of the two groups were compared to see whether the difference was
significant. The results are shown in Table 3 (below), and are analysed in the following
paragraphs.
Table 3 Results of comparison of pre- and post-intervention paragraph marks for test and control group
*Significant at 5% level
Pre-intervention paragraph marks
(compared between groups)
Post-intervention paragraph
marks (compared to pre-
intervention marks)
Comparison of difference
between pre- and post-
intervention marks of groups
M SD n
p-
value M SD n
p-
value
M SD n p-value
Test
group
52.09% 25.87% 70 0.013* 46.88% 22.81% 70 0.960 -5.22% 25.90% 70 0.989
Control
group
38.78% 24.79% 35 33.48% 25.66% 35 0.277 -5.29% 28.36% 35

62
4.2.2.1 Comparison of pre-intervention paragraph marks between groups
The pre-intervention paragraph marks for the test group and the control group were compared
by means of a two-sample t-test to establish similarity of ability. Testing for similarity of ability
is necessary to ensure the validity of the research, and neglecting to conduct this test could
undermine the rigour of a study, as pointed out by Leauby et al. (2010:288). The two-sample t-
test is a parametric test that is used when a variable (the pre-intervention paragraph marks) is
compared for two independent samples (the test and control groups). In this case, the
Comparison of Means t-test was used because it was necessary to compare the means of two
groups of unequal size and equal variances. The results, given in Table 3 (above), show that the
mean score for the test group was 52.09%, which was considerably higher than the mean score
for the control group, which was 38.78%. The comparison between the two groups delivered a
p-value of 0.013, which indicates a statistically significant difference. The conclusion we must
draw from this result is that the two groups were not, as presupposed at the start of the
research, comparable in Accounting ability.
4.2.2.2 Comparison of pre- and post-intervention paragraph marks for each
group
Leauby et al. (2010:288), in their summation of research into concept mapping, question the
conclusions drawn from a study in which student marks were not assessed for improvement.
Therefore, in line with the rigour required in a Postpositivist research paradigm, the pre- and
post-intervention paragraph marks for each group were compared by means of paired t-tests.
Paired t-tests are used when the samples are dependent and normal distribution is assumed,
such as in this case, where pre- and post-intervention marks are compared. It was necessary to
see whether the concept mapping intervention had resulted in an improvement in the marks of
the test group, as this was the basis of the research. On the other hand, even if there had been
an improvement in the marks of the test group, a similar positive result for the control group
would negate the supposed influence of the intervention. It was therefore likewise necessary to
check for possible improvement in the marks of the control group.
Table 3 shows the results of the test, and indicates a lower mean post-intervention paragraph
mark for the test group (46.88%) as well as a lower mean post-intervention paragraph mark for
the control group (33.48%). However, with p-values > 0.05, the drop in the marks of both the
test and control groups was not statistically significant. While the drop in marks might not be
significant, the result for the test group is disappointing, given the aim of this research. In their

63
comprehensive study on the effectiveness of concept mapping, Leauby et al. (2010:289)
recorded a similar result: the quantitative data did not support that study’s hypothesis that
concept mapping enhances learning.
4.2.2.3 Comparison of difference between pre- and post-intervention paragraph
marks of groups
In order to determine whether the difference between the pre- and post-intervention
paragraph marks for the test and control groups was significant, a paired t-test was used, and
Levene’s test was run to check for equality of variances. Levene’s test is used when a variable
has been calculated for two or more groups, in this case the difference in the pre- and post-
intervention paragraph marks of the test and control groups, and the equality of variances for
the variable needs to be assessed. The results are also given in Table 3 (above). With a p-value >
0.05, we can conclude that there is no significant difference in the decrease between the test
results of the two groups.
4.2.3 Comparisons between the quantitative pre-intervention questionnaire results and the results of the two groups
It was furthermore deemed necessary to test for collinearity between the different pre-
intervention questionnaire co-variates and the pre- and post-intervention paragraph results
using the Spearman-rho correlation test2. Table 4 (below) shows the following significant
relationships between the pre- and post-intervention paragraph marks and the variables per
group:
The pre-intervention questionnaire factors that had a significant impact on the pre-
intervention paragraph marks for the test group
The pre-intervention questionnaire factors that had a significant impact on the pre-
intervention paragraph marks for the control group
Pre-intervention questionnaire factors that had a significant impact on the post-
intervention paragraph marks of the test group
Pre-intervention questionnaire factors that had a significant impact on the post-
intervention paragraph marks of the control group
2 The Spearman-rho correlation test is a non-parametric test used for ordinal and ranked variables.
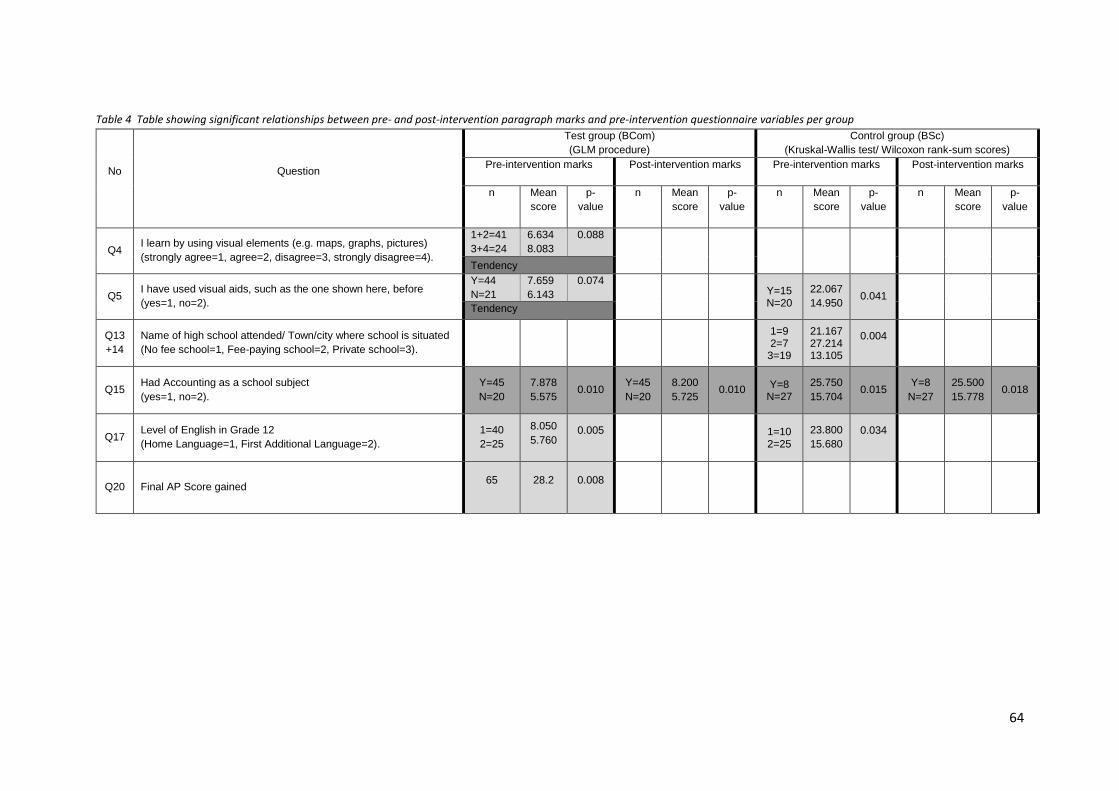
64
Table 4 Table showing significant relationships between pre- and post-intervention paragraph marks and pre-intervention questionnaire variables per group
No Question
Test group (BCom)
(GLM procedure)
Control group (BSc)
(Kruskal-Wallis test/ Wilcoxon rank-sum scores)
Pre-intervention marks Post-intervention marks Pre-intervention marks Post-intervention marks
n Mean
score
p-
value
n Mean
score
p-
value
n Mean
score
p-
value
n Mean
score
p-
value
Q4 I learn by using visual elements (e.g. maps, graphs, pictures)
(strongly agree=1, agree=2, disagree=3, strongly disagree=4).
1+2=41
3+4=24
6.634
8.083
0.088
Tendency
Q5 I have used visual aids, such as the one shown here, before
(yes=1, no=2).
Y=44
N=21
7.659
6.143
0.074 Y=15 N=20
22.067
14.950 0.041
Tendency
Q13
+14
Name of high school attended/ Town/city where school is situated
(No fee school=1, Fee-paying school=2, Private school=3).
1=9 2=7
3=19
21.167 27.214 13.105
0.004
Q15 Had Accounting as a school subject
(yes=1, no=2).
Y=45
N=20
7.878
5.575 0.010
Y=45
N=20
8.200
5.725 0.010
Y=8 N=27
25.750
15.704 0.015
Y=8
N=27
25.500
15.778 0.018
Q17 Level of English in Grade 12
(Home Language=1, First Additional Language=2).
1=40
2=25
8.050
5.760 0.005 1=10
2=25
23.800
15.680
0.034
Q20 Final AP Score gained 65 28.2 0.008

65
4.2.3.1 Pre-intervention questionnaire factors that had a significant impact on the
pre-intervention paragraph marks for the test group
It was of importance to see which of the factors referred to in the pre-intervention
questionnaire had an impact on, and could therefore explain the results of, the pre-intervention
paragraph mark. To obtain this information, a General Linear Model (GLM) procedure was run,
with the pre-intervention paragraph marks as the dependent variable. The GLM procedure is a
type of multiple regression analysis where one dependent variable is involved. The procedure
was initially run to establish whether the model could be reported. Table 5 (below) indicates
that, as the p-value < 0.05, the model is significant and can be reported. Sixty-four observations
were found to be valid and useable.
Table 5 Table showing result of GLM procedure that tests validity of model
Source DF
Sum of
Squares Mean Square F Value Pr > F
Model 5 284.2921955 56.8584391 6.16 0.0001
Error 59 544.8462660 9.2346825
Corrected Total 64 829.1384615
A box and whisker plot, or boxplot, is a graph that displays quantitative data patterns and
shows the distribution of the data, by providing the range of all the data (from whisker to
whisker), or the interquartile range (IQR), which refers to the range of the “box” part of the
graph. The boxplot also indicates the median by means of the line running through the box.
Boxplots will be used to illustrate the distribution of data.
Two of the pre-intervention questions, while not statistically significant, showed tendencies
that were worth reporting (See Table 4 above). The first of these was whether the student saw
him- or herself as a visual learner (Q4). This information was self-reported. With a p-value of
0.088, being > 0.05 (significance level), the result is not statistically significant but indicates a
tendency for non-visual learners to perform better in the pre-intervention paragraph. The
boxplot below (see Figure 8) illustrates that the distributions for the responses are not the same
(“agree” = answers 1 and 2, and “disagree” = answers 3 and 4).
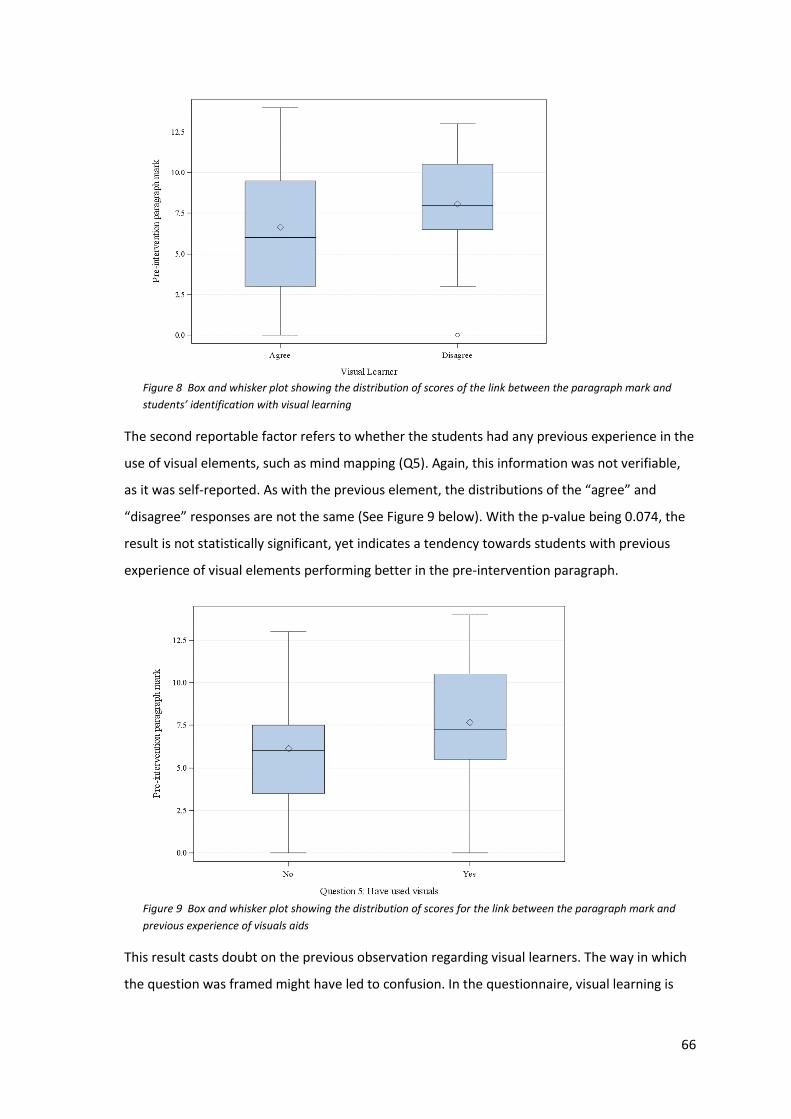
66
Figure 8 Box and whisker plot showing the distribution of scores of the link between the paragraph mark and
students’ identification with visual learning
The second reportable factor refers to whether the students had any previous experience in the
use of visual elements, such as mind mapping (Q5). Again, this information was not verifiable,
as it was self-reported. As with the previous element, the distributions of the “agree” and
“disagree” responses are not the same (See Figure 9 below). With the p-value being 0.074, the
result is not statistically significant, yet indicates a tendency towards students with previous
experience of visual elements performing better in the pre-intervention paragraph.
Figure 9 Box and whisker plot showing the distribution of scores for the link between the paragraph mark and
previous experience of visuals aids
This result casts doubt on the previous observation regarding visual learners. The way in which
the question was framed might have led to confusion. In the questionnaire, visual learning is

67
associated with maps, graphs and pictures, which might not be the terms with which students
associate visual learning.
Three of the factors probed in the pre-intervention questions proved to be significant. The first
of the significant factors, with a p-value of 0.010 (See Table 4 above), was whether the student
had had Accounting as a school subject (Q15), which was verifiable information. It is to be
expected that previous knowledge of Accounting should have advantaged students. The box
and whisker plot confirms the result (See Figure 10 below). The marks for the students with
previous experience of Accounting appear to be skewed upwards, which shows that most of
these students performed well.
Figure 10 Box and whisker plot showing the distribution of scores for the link between the paragraph mark and
previous student experience of Accounting
The second factor that showed significance was whether the student had followed the English
Home Language stream in Grade 12, or the English First Additional Language stream (Q17). This
was also verifiable information, although it was self-reported. The p-value in this case is 0.005,
indicating that this variable had a significant effect on students’ pre-intervention paragraph
results. Figure 11 below indicates that having taken English as a home language led to higher
marks. This is in keeping with current research regarding the influence of language on learning
(Carstens, 2015; Mckenna, 2012; Nkomo & Madiba, 2011).

68
Figure 11 Box and whisker plot showing the distribution of scores for the link between the paragraph mark and
the level of English in Grade 12
Finally, a student’s APS (Q20) shows statistical significance, with a p-value of 0.008. It is possible
to deduce from this that the higher performing school students will likewise perform well at
university. However, the data collected for the APS are not considered reliable, as it was
apparent from the questionnaire responses that many students could not clearly remember
their APS, and either guessed the score or gave no response. In retrospect, the validity of the
data should have been assured by referring to the University database. This constraint is
acknowledged and will be discussed further under the section addressing the limitations of the
study.
The factors that showed no significance were:
whether students were verbal learners
whether students were aural learners
whether students were physical learners
the types of school students attended
the Grade 12 marks for Maths
their Grade 12 mark for English
The data on students’ home language was not included in the GLM procedure because of the
sparse distribution of cases, resulting in the model not being estimable. The home language
distribution is therefore given here: English = 10, Afrikaans = 3, Sepedi = 17, other South African
languages = 38 and other African languages = 3. The question about students’ home language

69
was posed as an adjunct to the question about the level of English in Grade 12, both relating to
the issue of the effect of language in learning (see Section 1.3.2).
4.2.3.2 Pre-intervention questionnaire factors that had a significant impact on the
pre-intervention paragraph mark for the control group
It was similarly necessary to see which of the factors referred to in the pre-intervention
questionnaire might have had an impact on the pre-intervention paragraph mark for the control
group. Because of the small number of respondents (35), the GLM model was not used, but
rather the NPAR1WAY procedure that consists of the Wilcoxon rank-sum test (equivalent to the
Mann-Whitney U-test), which is preferred to the independent t-test when normal distribution is
not expected, and the Kruskal-Wallis test, which is a non-parametric test that is suitable when
the independent variables consist of three or more categories, but normal distribution of data is
not expected. The Wilcoxon rank-sum test, used here, is applicable when the two groups of
data are independent.
The first factor that showed significance was students’ previous experience of visual aids (Q5),
with a p-value < 0.05. This suggests that, as with the test group, students with previous
experience of using visual aids performed better in the pre-intervention paragraph than those
who had not. Figure 12 (below) shows the distribution of the Wilcoxon scores in a boxplot and
confirms that the distribution is not the same. The results, however, are not borne out by the
outcome of the post-intervention paragraph, as there is no statistical significance between the
post-intervention paragraph marks and previous experience of visual aids for the control group.
Figure 12 Box and whisker plot showing the distribution of the Wilcoxon scores of the link between the pre-
intervention paragraph results and previous experience of visual aids for the control group

70
A second factor that showed statistical significance, with a p-value < 0.01, dealt with the type of
school students had attended (derived from Q13). As previously discussed, schools were
categorised as “no fee school”, “fee-paying school” and “private school”. The Wilcoxon scores
show that the students from fee-paying schools fared the best in their pre-intervention
paragraph, compared to the other groups. Of the other two groups, students from no fee
schools achieved better results than students from private schools did. Previous comments
about the different types of private schools might cast some light on this unexpected result. The
boxplot (Figure 13) shows the distribution of the results for each category.
Figure 13 Box and whisker plot showing the distribution of the Wilcoxon scores of the link between the pre-
intervention paragraph mark and type of school for the control group
The link between the pre-intervention paragraph mark and students with experience of
Accounting at school had a significant p-value of 0.015. The result coincides with the result for
the test group. This suggests that those students - whether in the test or control group - who
took Accounting at school were at an advantage when writing the pre-intervention paragraph.
The boxplot illustrates the uneven distribution of the results (see Figure 14 below).

71
Figure 14 Box and whisker plot showing the distribution of the Wilcoxon scores of the link between the pre-
intervention paragraph results and Accounting experience for the control group
The third and last variable that showed significance was the level of English in Grade 12, with
students in the Home Language stream scoring better than those in the English First Additional
Language stream. The p-value is < 0.05. The boxplot shows the distribution of the scores (see
Figure 15 below) and the uneven distribution of the data. This result likewise echoes the result
of the test group and, as mentioned before, supports the importance of language in learning.
Nevertheless, no similar link is found with the post-intervention paragraph marks, which
indicates that the impact of students’ school language level disappeared by the time the
students wrote the post-intervention paragraph.
Figure 15 Box and whisker plot showing the distribution of the Wilcoxon scores of the link between the pre-
intervention paragraph results and Grade 12 English for the control group
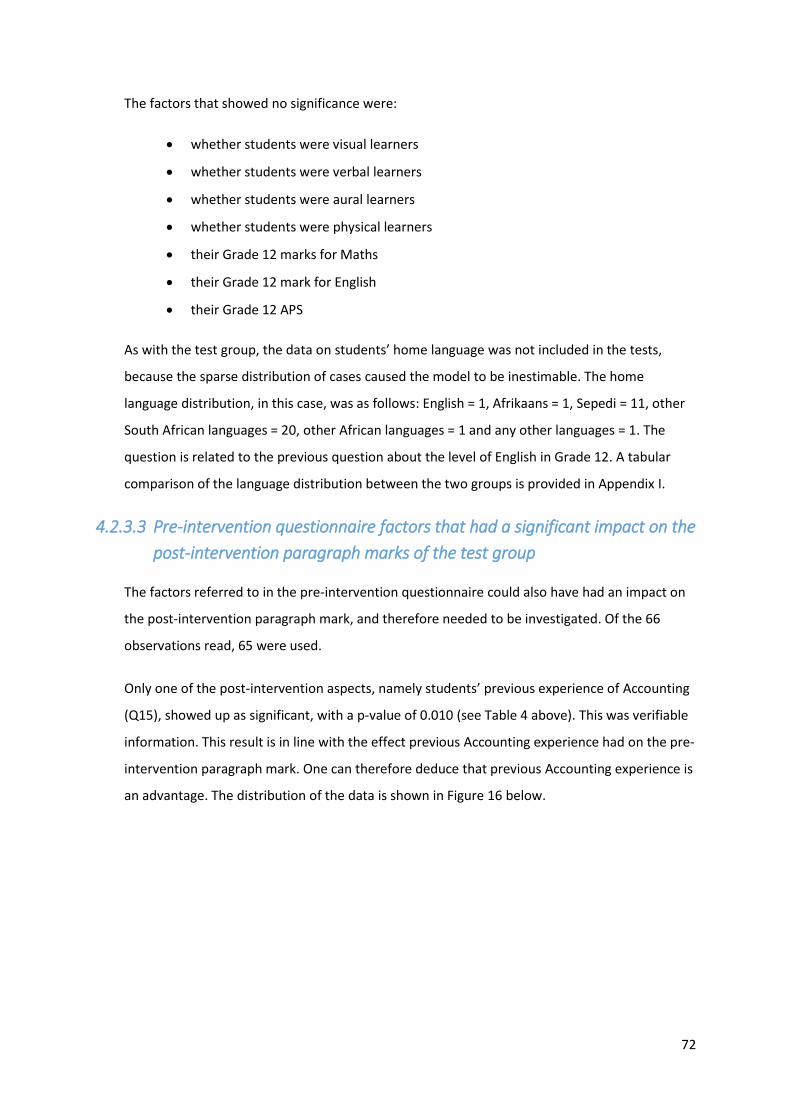
72
The factors that showed no significance were:
whether students were visual learners
whether students were verbal learners
whether students were aural learners
whether students were physical learners
their Grade 12 marks for Maths
their Grade 12 mark for English
their Grade 12 APS
As with the test group, the data on students’ home language was not included in the tests,
because the sparse distribution of cases caused the model to be inestimable. The home
language distribution, in this case, was as follows: English = 1, Afrikaans = 1, Sepedi = 11, other
South African languages = 20, other African languages = 1 and any other languages = 1. The
question is related to the previous question about the level of English in Grade 12. A tabular
comparison of the language distribution between the two groups is provided in Appendix I.
4.2.3.3 Pre-intervention questionnaire factors that had a significant impact on the
post-intervention paragraph marks of the test group
The factors referred to in the pre-intervention questionnaire could also have had an impact on
the post-intervention paragraph mark, and therefore needed to be investigated. Of the 66
observations read, 65 were used.
Only one of the post-intervention aspects, namely students’ previous experience of Accounting
(Q15), showed up as significant, with a p-value of 0.010 (see Table 4 above). This was verifiable
information. This result is in line with the effect previous Accounting experience had on the pre-
intervention paragraph mark. One can therefore deduce that previous Accounting experience is
an advantage. The distribution of the data is shown in Figure 16 below.
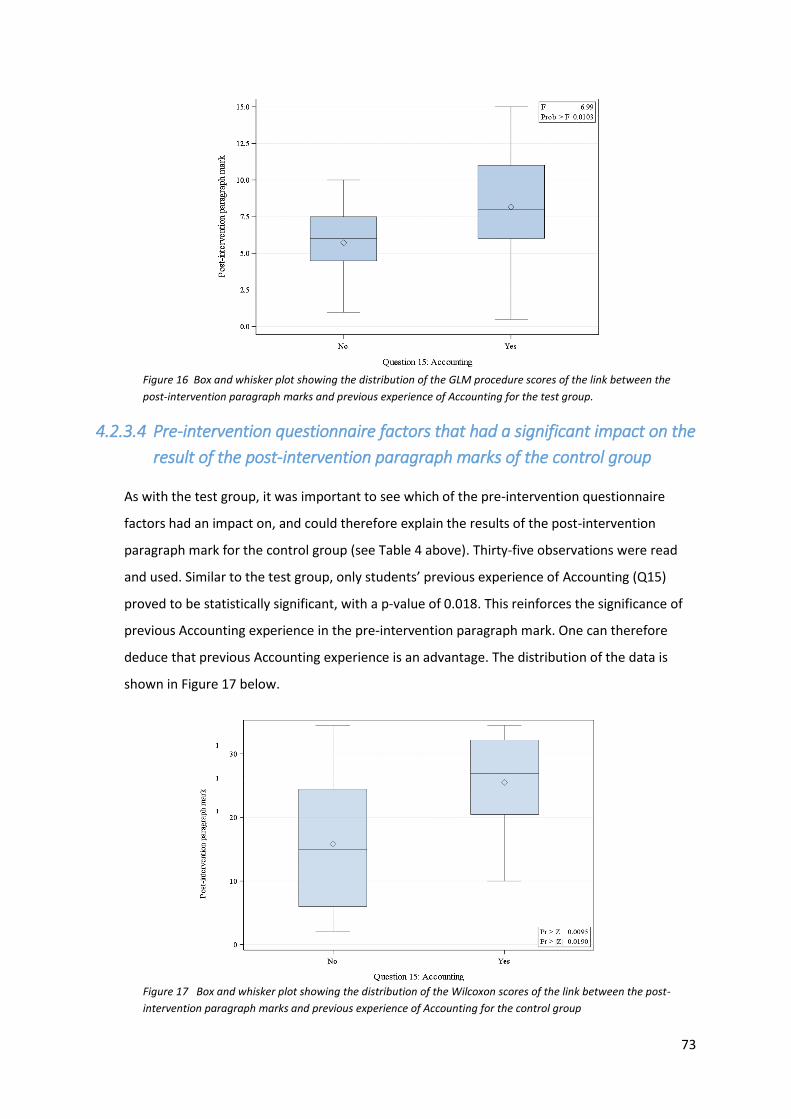
73
Figure 16 Box and whisker plot showing the distribution of the GLM procedure scores of the link between the
post-intervention paragraph marks and previous experience of Accounting for the test group.
4.2.3.4 Pre-intervention questionnaire factors that had a significant impact on the
result of the post-intervention paragraph marks of the control group
As with the test group, it was important to see which of the pre-intervention questionnaire
factors had an impact on, and could therefore explain the results of the post-intervention
paragraph mark for the control group (see Table 4 above). Thirty-five observations were read
and used. Similar to the test group, only students’ previous experience of Accounting (Q15)
proved to be statistically significant, with a p-value of 0.018. This reinforces the significance of
previous Accounting experience in the pre-intervention paragraph mark. One can therefore
deduce that previous Accounting experience is an advantage. The distribution of the data is
shown in Figure 17 below.
Figure 17 Box and whisker plot showing the distribution of the Wilcoxon scores of the link between the post-
intervention paragraph marks and previous experience of Accounting for the control group

74
4.2.4 The quantitative results of the post-intervention questionnaire
The post-intervention questionnaire was designed to capture students’ experiences of the
concept mapping intervention. A simple one-way frequency table was required here, for which
the FREQ (frequency) procedure was run. The results are summarised in Table 6 below, and will
be discussed individually. The responses to Q3 and Q4 in the post-intervention questionnaire
will be discussed separately in Section 4.2.5.
Table 6 Table showing frequency of post-intervention questionnaire responses for test group
Five of the seven remaining questions addressed experiential aspects of concept mapping (Q2,
Q5, Q6, Q7 and Q8). With these responses, the following patterns were observed: the majority
of the students reported that they had found concept mapping easy to use (73.91%), that
concept mapping helped them to identify misconceptions they held about the topic covered in
the intervention (71.01%), that they would use concept mapping again (68.12%), that they liked
using concept mapping (65.22%) and that they would use concept mapping in other subjects
(69.57%).
The following parameters should be considered when these responses are reflected upon.
Firstly, they are based on the perceptions of the students and are therefore not verifiable. Some
students’ positive attitude towards the subject and/or the participating lecturers could also
have disposed them towards a favourable but biased response. This is referred to as the “halo”
effect. Furthermore, the responses were measured after a relatively short exposure to concept
Nbr Question
(Scaling = strongly agree=1, agree=2, disagree=3, strongly
disagree)
n %
Q1 I like Accounting. Agree (1+2)=59
Disagree(3+4)=10
Agree=85.51%
Disagree=14.49%
Q2 I find concept mapping easy to use. Agree(1+2)=51
Disagree(3+4)=18
Agree=73.91%
Disagree=26.09%
Q3 Concept mapping helped me to better UNDERSTAND the
Accounting concepts.
Agree(1+2)=52
Disagree(3+4)=17
Agree=75.36%
Disagree=24.64%
Q4 Concept mapping made it easier to REMEMBER information. Agree(1+2)=52
Disagree(3+4)=17
Agree=75.36%
Disagree=24.64%
Q5 Concept mapping helped to identify MISCONCEPTIONS I had
about a topic.
Agree(1+2)=49
Disagree(3+4)=20
Agree=71.01%
Disagree=28.99%
Q6 I will use concept mapping again. Agree(1+2)=47
Disagree(3+4)=22
Agree=68.12%
Disagree=31.88%
Q7 I liked using concept mapping. Agree(1+2)=45
Disagree(3+4)=24
Agree=65.22%
Disagree=34.78%
Q8 I would be able to use concept mapping in my other subjects. Agree(1+2)=48
Disagree(3+4)=21
Agree=69.57%
Disagree=30.43%
Q9 I like being at the Mamelodi campus. Agree(1+2)=51
Disagree(3+4)=18
Agree=73.91%
Disagree=26.09%

75
mapping. Even when considering these parameters, it is nevertheless interesting to note that
students were positive overall about the concept mapping experience. In addition, it seems
significant that such a high percentage of students felt that concept mapping had helped to
point out misconceptions, a very important function of this strategy. Considering these
parameters, it is surprising that a relatively high percentage of students said that they would
use concept mapping again (68.12%) and would apply the strategy to other subjects (69.57%),
indicating that, even in a short period, they had realised the cross-domain application of the
strategy.
The two questions in this questionnaire that did not refer to concept mapping were aimed at
garnering the general attitude of students (see Table 6 above). Students were questioned on
their attitude to Accounting, to measure whether this attitude could have been an underlying
factor in the concept mapping responses. Certainly, the high percentage of students who
responded positively to this question (85.51%) seems to relate to the generally positive
response towards concept mapping. However, far more students were positive about
Accounting than about, for example, liking concept mapping, the difference being 20.29%. This
suggests that the two responses were not necessarily linked.
The second general question probed students’ attitude towards being at the Mamelodi campus.
This was deemed necessary, as anecdotal evidence suggests that students have been known to
harbour resentment about being placed on the Extended Programme, especially as they are
accommodated at a campus that separates them from their friends and the activities that they
associate with student life. Such a negative attitude could sub-consciously have had a similarly
negative effect on their attitudes towards concept mapping. Nonetheless, the vast majority of
students responded positively about being on the Mamelodi campus (73.91%). Interestingly,
this is exactly the same response for the question about finding concept mapping easy.
Although the two questions are unrelated, a positive attitude about being on the Mamelodi
campus might have translated into a generally positive approach to learning.
The positive responses of the post-intervention questionnaire suggest that students found the
concept mapping intervention useful, and would consider implementing this strategy. These
responses, however, must be aligned with the qualitative data before the deduction can be
confirmed.

76
4.2.5 Possible link between pre- and post-intervention questionnaire responses for memorisation and understanding
The post-intervention questionnaire was filled in by only the test group, as the information
referred to the concept mapping intervention. Two of the questions in the pre- and post-
intervention questionnaires were designed to link to each other. These questions referred to
the use of visual aids to support memorisation and understanding, the pre-intervention
questionnaire referring to visual elements generally and the post-intervention questionnaire
referring to concept mapping in particular. The pre-intervention questionnaire question on
memorisation (Q6) read: “The visual aid that I used helped me to MEMORISE the work” and the
matching post-intervention questionnaire question (Q4) read: “Concept mapping made it easier
to REMEMBER information”. The pre-intervention questionnaire question on understanding
(Q7) read: “The visual aid that I used helped me to UNDERSTAND the work” and the matching
post-intervention questionnaire question (Q3) read: “Concept mapping helped me to better
UNDERSTAND the Accounting concepts”. The words “memorise”, “remember” and
“understand” were capitalised to indicate the focus of the question for the students.
We are thus dealing here with two variables relating to visual aids in general and concept
mapping in particular (Pre-intervention questionnaire Q7 and post-intervention questionnaire
Q3 in the first instance, and pre-intervention questionnaire Q6 and post-intervention
questionnaire Q4 in the second instance), each with two categories (the questionnaire response
options of “strongly agree” and “agree” were grouped as “agree”, while “disagree” and
“strongly disagree” were grouped as “disagree” for ease of statistical analysis). The Frequency
procedure, which is able to produce the required cross-tabulation table, was therefore
appropriate, along with McNemar’s test, which is able to analyse the matched pairs of
categorical data under discussion here.
Forty-nine students responded positively to Q7 in the pre-intervention paragraph, compared to
the 52 who responded positively to Q3 in the post-intervention questionnaire (see Table 7
below). This indicates that more students found concept mapping useful for understanding than
those who found visual aids in general useful for understanding. The difference, however, is not
noteworthy. Students’ total responses were the same for the question about memorisation (Q6
in the pre-intervention paragraph and Q4 in the post-intervention paragraph) (see Table 9
below). Initially, these responses suggest that students had a predominantly favourable
experience of concept mapping regarding the aspects of understanding and memorisation.

77
However, Table 7 shows that, as far as improving understanding is concerned, only 16 (23.19%)
students found concept mapping more useful than other visual aids, and that 13 students
(18.84%) who found other visual aids useful, did not find concept mapping useful at all.
Similarly, Table 9 shows that, as far as memorisation is concerned, only 13 (18.84%) students
found concept mapping more useful than other visual aids, and that ten students (14.49%) did
not find concept mapping useful, while they had found other visual aids to be so. In summary,
concept mapping does not appear to have been experienced as being significantly more helpful
for understanding and memorisation than visual aids in general.
When the Frequency procedure was run to look for a link between these two aspects,
McNemar’s test delivered a p-value of 0.578 for the questions on memorisation (see Table 8
below), and a p-value of 0.532 for the questions on understanding (see Table 10 below), neither
showed significance. This suggests that students were not necessarily influenced by their
experience of visual aids in general when responding to the questions on concept mapping.
Table 7 Table showing the result of the Frequency procedure run to establish a link between the pre-intervention
paragraph (Q7) and post-intervention paragraph (Q3), which refers to “understanding”
Table of Q7 by Q3
Q7 (Question 7: Helped understand) Q3 (Question 3: Understand)
Agree Disagree Total
Agree Frequency
Percent
Row Pct
Col Pct
36
52.17
73.47
69.23
13
18.84
26.53
76.47
49
71.01
Disagree Frequency
Percent
Row Pct
Col Pct
16
23.19
80.00
30.77
4
5.80
20.00
23.53
20
28.99
Total 52
75.36
17
24.64
69
100.00
Frequency Missing = 1
Table 8 Table showing statistical result of Frequency procedure checking link with “understanding”
McNemar's Test
Statistic (S) 0.3103
DF 1
Pr > S 0.5775

78
Table 9 Table showing the result of the Frequency procedure run to establish a link between the pre-intervention
paragraph (Q6) and post-intervention paragraph (Q4), which refers to “memorisation”
Table of Q6 by Q4
Q6 (Question 6: Helped memorise) Q4 (Question 4: Remember)
Agree Disagree Total
Agree Frequency
Percent
Row Pct
Col Pct
39
56.52
79.59
75.00
10
14.49
20.41
58.82
49
71.01
Disagree Frequency
Percent
Row Pct
Col Pct
13
18.84
65.00
25.00
7
10.14
35.00
41.18
20
28.99
Total 52
75.36
17
24.64
69
100.00
Frequency Missing = 1
Table 10 Table showing statistical result of Frequency procedure checking link with “memorisation”
McNemar's Test
Statistic (S) 0.391
DF 1
Pr > S 0.532
4.3 Research findings and analysis of the qualitative data
The qualitative data were gathered from both the pre- and post-intervention questionnaires in
the case of the test group, and from the pre-intervention questionnaire in the case of the
control group. The pre-intervention questionnaire included a general question regarding the
use of visual aids, whereas the post-intervention questionnaire included general questions that
focused on the concept mapping intervention to which students had been exposed for a short
period of time. In contrast to the rest of the questionnaire, students were not required to
answer the open questions, and the number of responses is therefore limited. They are,
nevertheless, important because of what they highlight about students’ perspectives.
For the analysis of the qualitative data, content analysis was used. According to Krippendorff
(2013:89):
Content analysts support their interpretations by weaving quotes from the analysed texts and
literature about the context of these texts into their conclusions, by constructing parallelisms, by
engaging in triangulations, and by elaborating on any metaphors they can identify.

79
Content analysis is based on the Naturalistic paradigm (Hsieh & Shannon, 2005), which
attempts to access meaning from the point of view of the respondent. In this paradigm, in
contrast to the paradigm used for the analysis of quantitative data, confounding variables are
not accounted for, but are described, as they form part of the context in which the results are
reported (de Valenzuela, 2017).
The categories used for sorting responses were not pre-determined. The flexible nature of
content analysis allows for the identification of categories to be both concept-driven (the
literature on the research questions guides identification) and data-driven (categories emerge
from the data) (Schreier, 2014:3). The emerging keywords were counted and comparisons were
made between them, in line with the summative content analysis procedure (Hsieh & Shannon,
2005). Qualitative content analysis restricts data in that the researcher searches only for
aspects that refer to the research in question (Schreier, 2014:2). Where the point made by a
response was unclear, the response was not tallied, to prevent invalid inferences being made. If
a certain advantage or disadvantage was recorded by only one student and appeared random in
nature, it was recorded but not included in the analysis. On the other hand, a single response
might address several useful aspects, and each of the aspects was then categorised. This
procedure is confirmed by Schreier (2014:2), who further states that “ultimately the number of
aspects is limited by the number of categories a researcher can handle”. Content analysis also
allows for some abstraction in identifying aspects if an overarching keyword is found to be more
effective in conveying meaning than specific keywords (Schreier, 2014:2). The systematic nature
of content analysis requires that the data be searched in detail for the presence of relevant
aspects, which should prevent researcher’s bias.
The qualitative data for the two groups garnered from the pre-intervention questionnaire will
be compared first, and thereafter the qualitative data from the post-intervention questionnaire
will be discussed. Summaries of the results are given in table format below, and the responses
are given in full in Appendices E, F and G.
4.3.1 The qualitative data from the pre-intervention questionnaire
The pre-intervention questionnaire had only one open question: “Is there any further comment
you would like to make about the advantages and disadvantages of using visual elements in
academic work?” For the test group, 39 students responded, and, using the system explained in
the previous section, 30 of the points made were found to be useful (see Table 11 below). The
salient advantages identified by the test group, as shown in Table 11, were that visual elements
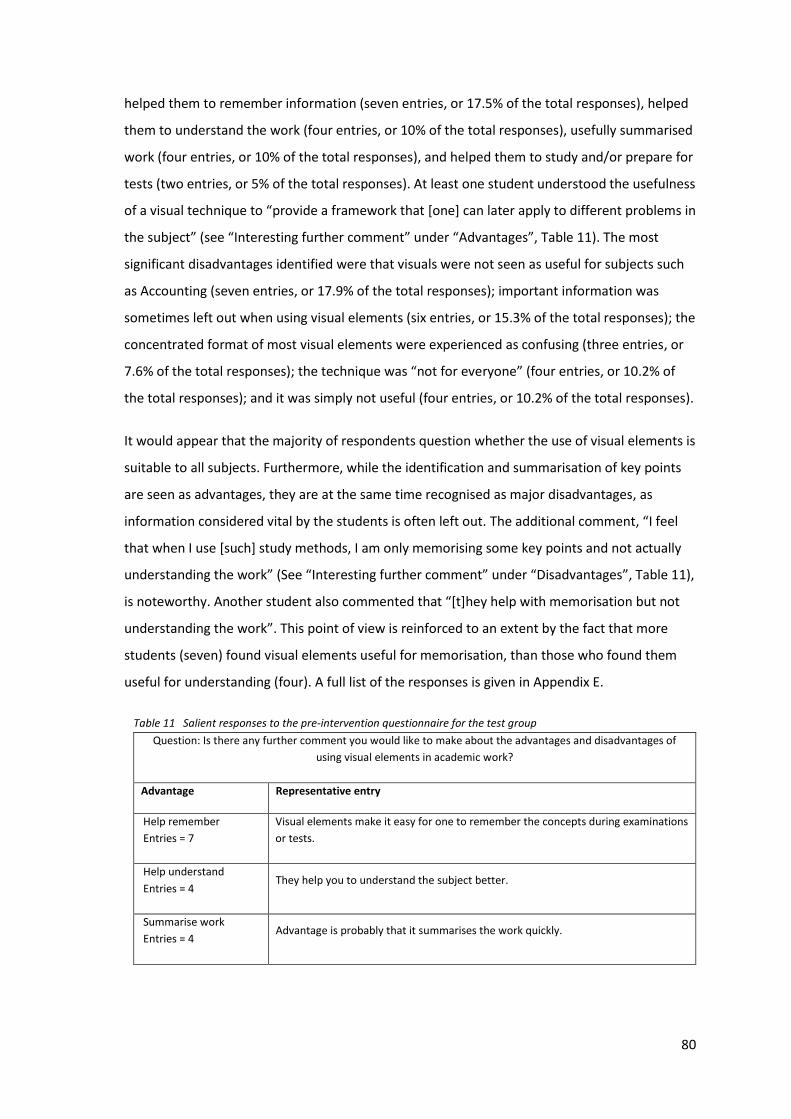
80
helped them to remember information (seven entries, or 17.5% of the total responses), helped
them to understand the work (four entries, or 10% of the total responses), usefully summarised
work (four entries, or 10% of the total responses), and helped them to study and/or prepare for
tests (two entries, or 5% of the total responses). At least one student understood the usefulness
of a visual technique to “provide a framework that [one] can later apply to different problems in
the subject” (see “Interesting further comment” under “Advantages”, Table 11). The most
significant disadvantages identified were that visuals were not seen as useful for subjects such
as Accounting (seven entries, or 17.9% of the total responses); important information was
sometimes left out when using visual elements (six entries, or 15.3% of the total responses); the
concentrated format of most visual elements were experienced as confusing (three entries, or
7.6% of the total responses); the technique was “not for everyone” (four entries, or 10.2% of
the total responses); and it was simply not useful (four entries, or 10.2% of the total responses).
It would appear that the majority of respondents question whether the use of visual elements is
suitable to all subjects. Furthermore, while the identification and summarisation of key points
are seen as advantages, they are at the same time recognised as major disadvantages, as
information considered vital by the students is often left out. The additional comment, “I feel
that when I use [such] study methods, I am only memorising some key points and not actually
understanding the work” (See “Interesting further comment” under “Disadvantages”, Table 11),
is noteworthy. Another student also commented that “[t]hey help with memorisation but not
understanding the work”. This point of view is reinforced to an extent by the fact that more
students (seven) found visual elements useful for memorisation, than those who found them
useful for understanding (four). A full list of the responses is given in Appendix E.
Table 11 Salient responses to the pre-intervention questionnaire for the test group Question: Is there any further comment you would like to make about the advantages and disadvantages of
using visual elements in academic work?
Advantage Representative entry
Help remember
Entries = 7
Visual elements make it easy for one to remember the concepts during examinations
or tests.
Help understand
Entries = 4 They help you to understand the subject better.
Summarise work
Entries = 4 Advantage is probably that it summarises the work quickly.

81
Help study/ prepare for
tests
Entries = 2
If used effectively it is a great way to study and prepare for tests.
Interesting further
comment
Visual aids provide a framework that I can later apply to different problems in the
subject.
Disadvantage Typical entry
Not for Accounting/
number subjects
Entries = 7
Visual aids can only be used to a certain extent. With respect to FRK visual aids are
applicable in some learning areas, but others cannot be learned using visual aids,
such as learning fundamental concepts
Not all information
captured
Entries = 6
Sometimes not all the work that is required to study is in the visual aid.
Too busy/ confusing
Entries = 3
It can be confusing to other students because there will be a lot going on in the
visual aid.
Not for everyone
Entries = 4
I think using visual elements should be someone's own choice since we all have a
different way of learning and understanding things.
Not helpful
Entries = 4 I don't find visual aids helpful.
Interesting further
comment
I feel that when I use study methods, I am only memorising some key points and not
actually understanding the work.
The same procedure was used for the analysis of the responses of the control group, except
that the categories identified for the test group were also used as input for the analysis of the
control group data. However, where a further point, not identified by the test group, appeared
to be of significance, it was added as a category. Twenty-six students responded and 34 useful
points made were made (see Table 12 below). The advantages the students identified were that
visual elements helped memorisation (seven entries, or 20.5% of the total responses) and
understanding (four entries, or 11.4% of the total responses), usefully summarised the work
(seven entries, or 20.5% of the total responses) and helped in preparing and/or studying for
tests (four entries, or 11.4% of the total responses) (See Table 12). Three students (or 8.8% of
the total responses) identified the visual nature of the technique as important, which was
additional to the aspects identified by the test group. The other aspects identified were similar
for both groups except that more students from the control group saw the summarising and
test preparation functions of visual elements as important. An interesting additional comment
read as follows: “I find visual elements to be quite useful. They help me in understanding
abstract academic ideas and understanding work means you have to memorise less” (See
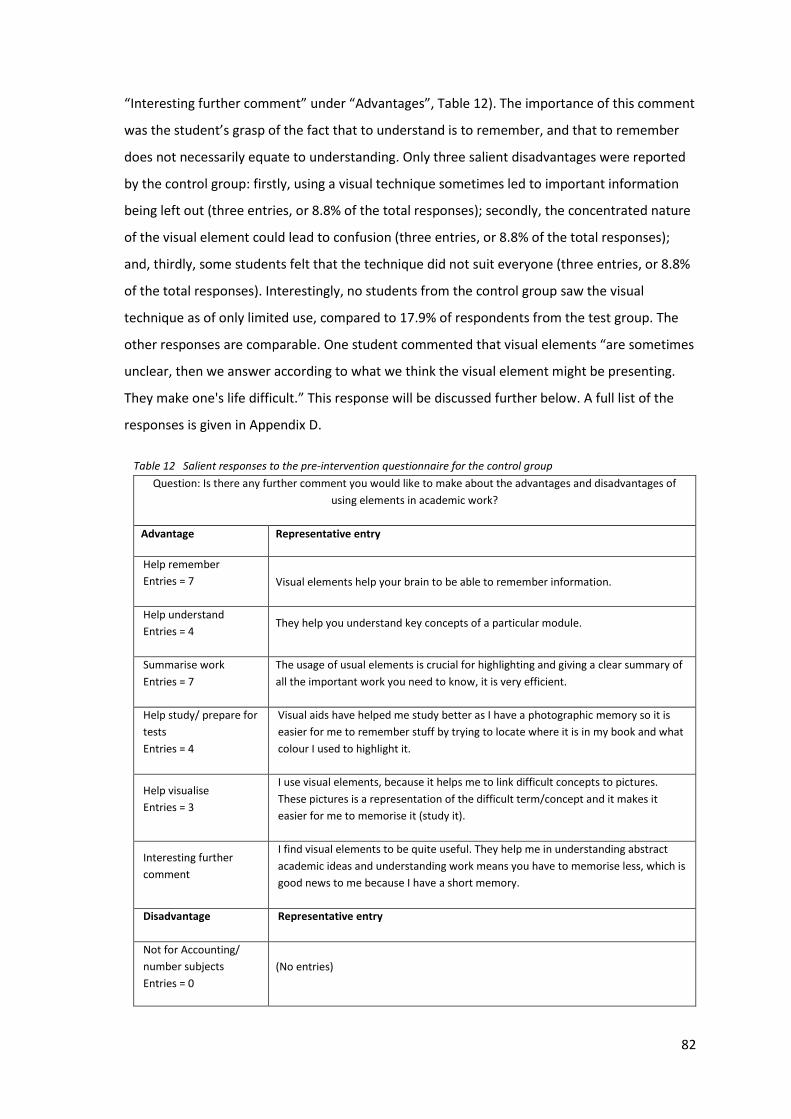
82
“Interesting further comment” under “Advantages”, Table 12). The importance of this comment
was the student’s grasp of the fact that to understand is to remember, and that to remember
does not necessarily equate to understanding. Only three salient disadvantages were reported
by the control group: firstly, using a visual technique sometimes led to important information
being left out (three entries, or 8.8% of the total responses); secondly, the concentrated nature
of the visual element could lead to confusion (three entries, or 8.8% of the total responses);
and, thirdly, some students felt that the technique did not suit everyone (three entries, or 8.8%
of the total responses). Interestingly, no students from the control group saw the visual
technique as of only limited use, compared to 17.9% of respondents from the test group. The
other responses are comparable. One student commented that visual elements “are sometimes
unclear, then we answer according to what we think the visual element might be presenting.
They make one's life difficult.” This response will be discussed further below. A full list of the
responses is given in Appendix D.
Table 12 Salient responses to the pre-intervention questionnaire for the control group Question: Is there any further comment you would like to make about the advantages and disadvantages of
using elements in academic work?
Advantage Representative entry
Help remember
Entries = 7 Visual elements help your brain to be able to remember information.
Help understand
Entries = 4 They help you understand key concepts of a particular module.
Summarise work
Entries = 7
The usage of usual elements is crucial for highlighting and giving a clear summary of
all the important work you need to know, it is very efficient.
Help study/ prepare for
tests
Entries = 4
Visual aids have helped me study better as I have a photographic memory so it is
easier for me to remember stuff by trying to locate where it is in my book and what
colour I used to highlight it.
Help visualise
Entries = 3
I use visual elements, because it helps me to link difficult concepts to pictures.
These pictures is a representation of the difficult term/concept and it makes it
easier for me to memorise it (study it).
Interesting further
comment
I find visual elements to be quite useful. They help me in understanding abstract
academic ideas and understanding work means you have to memorise less, which is
good news to me because I have a short memory.
Disadvantage Representative entry
Not for Accounting/
number subjects
Entries = 0
(No entries)

83
Not all information
captured
Entries = 3
The downside to it is that they tend to leave out valuable information.
Too busy/ confusing
Entries = 3 Visual aids can be confusing.
Not for everyone
Entries = 3
It all depends on the type of person. But I personally failed to use them correctly or
did not know how to use it correctly.
Interesting further
comment
They are sometimes unclear, then we answer according to what we think the visual
element might be presenting. They make one's life difficult.
What emerges from student responses in both groups is that visual elements are used primarily
to memorise information, with a far lower number experiencing them as useful for
understanding. The fact that some students also pointedly referred to the discrepancy between
memorisation and understanding in the use of visual elements further underlines this aspect. As
mentioned earlier, the ability of visual elements to summarise information is regarded by
students in either group as both a strength and a weakness. It is regarded by some as a strength
because it creates a good overview and summary; on the other hand, it is regarded by some as
a weakness because it appears cluttered, not all information is included, and the flow of
information is unclear. These negative experiences could be related to the type of visual
technique the students had been exposed to previously, or to insufficient instruction in the use
of the technique. However, the very nature of a familiar visual technique, such as a mind map,
could very well have resulted in these negative responses. The image below (see Figure 18)
serves to illustrate that a mind map may be perceived as “cluttered” at times, and that,
furthermore, the lack of linking words indicating the connection between concepts could
account for the comment about visual aids being “sometimes unclear” so that students “answer
according to what [they] think the visual element might be presenting” (see “Interesting further
comment” under “Disadvantages”, Table 12).
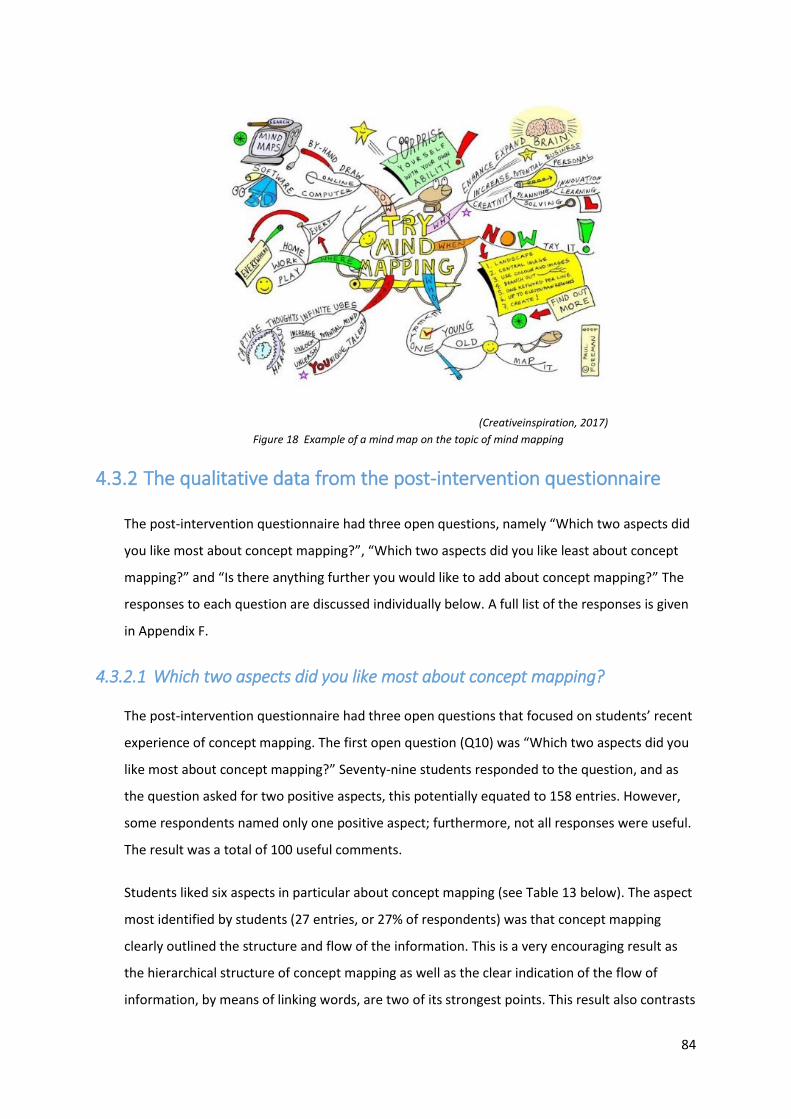
84
(Creativeinspiration, 2017)
Figure 18 Example of a mind map on the topic of mind mapping
4.3.2 The qualitative data from the post-intervention questionnaire
The post-intervention questionnaire had three open questions, namely “Which two aspects did
you like most about concept mapping?”, “Which two aspects did you like least about concept
mapping?” and “Is there anything further you would like to add about concept mapping?” The
responses to each question are discussed individually below. A full list of the responses is given
in Appendix F.
4.3.2.1 Which two aspects did you like most about concept mapping?
The post-intervention questionnaire had three open questions that focused on students’ recent
experience of concept mapping. The first open question (Q10) was “Which two aspects did you
like most about concept mapping?” Seventy-nine students responded to the question, and as
the question asked for two positive aspects, this potentially equated to 158 entries. However,
some respondents named only one positive aspect; furthermore, not all responses were useful.
The result was a total of 100 useful comments.
Students liked six aspects in particular about concept mapping (see Table 13 below). The aspect
most identified by students (27 entries, or 27% of respondents) was that concept mapping
clearly outlined the structure and flow of the information. This is a very encouraging result as
the hierarchical structure of concept mapping as well as the clear indication of the flow of
information, by means of linking words, are two of its strongest points. This result also contrasts
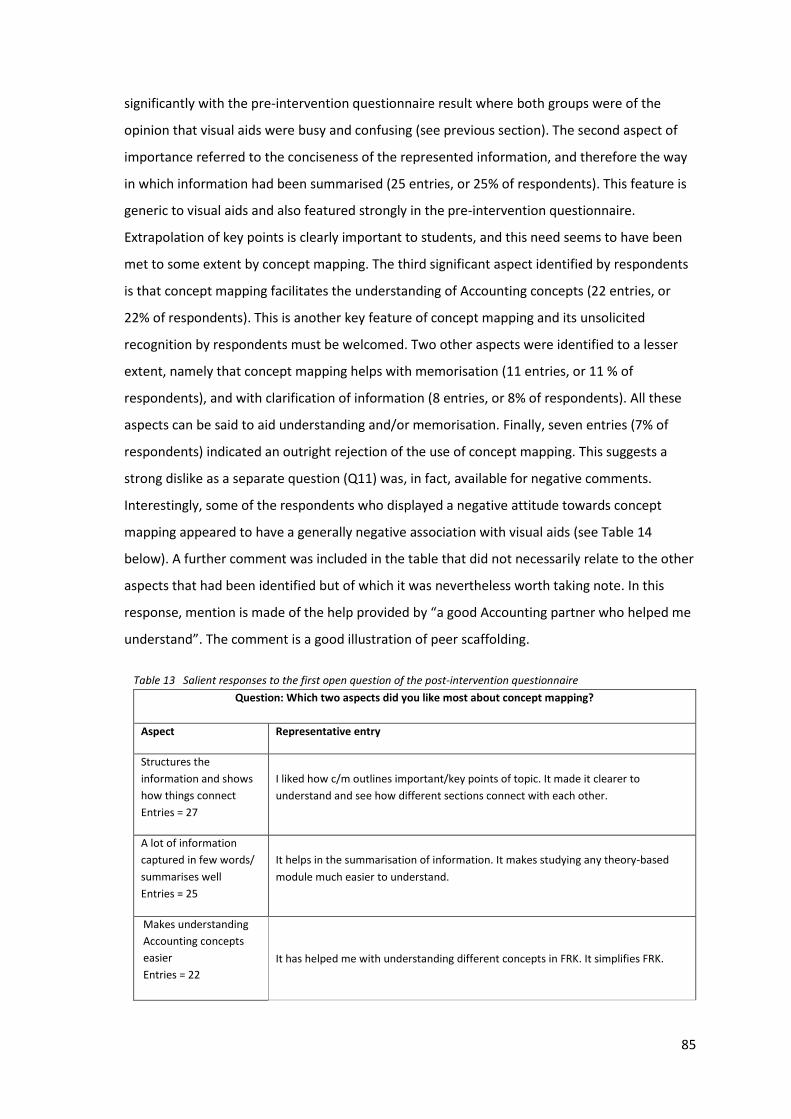
85
significantly with the pre-intervention questionnaire result where both groups were of the
opinion that visual aids were busy and confusing (see previous section). The second aspect of
importance referred to the conciseness of the represented information, and therefore the way
in which information had been summarised (25 entries, or 25% of respondents). This feature is
generic to visual aids and also featured strongly in the pre-intervention questionnaire.
Extrapolation of key points is clearly important to students, and this need seems to have been
met to some extent by concept mapping. The third significant aspect identified by respondents
is that concept mapping facilitates the understanding of Accounting concepts (22 entries, or
22% of respondents). This is another key feature of concept mapping and its unsolicited
recognition by respondents must be welcomed. Two other aspects were identified to a lesser
extent, namely that concept mapping helps with memorisation (11 entries, or 11 % of
respondents), and with clarification of information (8 entries, or 8% of respondents). All these
aspects can be said to aid understanding and/or memorisation. Finally, seven entries (7% of
respondents) indicated an outright rejection of the use of concept mapping. This suggests a
strong dislike as a separate question (Q11) was, in fact, available for negative comments.
Interestingly, some of the respondents who displayed a negative attitude towards concept
mapping appeared to have a generally negative association with visual aids (see Table 14
below). A further comment was included in the table that did not necessarily relate to the other
aspects that had been identified but of which it was nevertheless worth taking note. In this
response, mention is made of the help provided by “a good Accounting partner who helped me
understand”. The comment is a good illustration of peer scaffolding.
Table 13 Salient responses to the first open question of the post-intervention questionnaire Question: Which two aspects did you like most about concept mapping?
Aspect Representative entry
Structures the
information and shows
how things connect
Entries = 27
I liked how c/m outlines important/key points of topic. It made it clearer to
understand and see how different sections connect with each other.
A lot of information
captured in few words/
summarises well
Entries = 25
It helps in the summarisation of information. It makes studying any theory-based
module much easier to understand.
Makes understanding
Accounting concepts
easier
Entries = 22
It has helped me with understanding different concepts in FRK. It simplifies FRK.
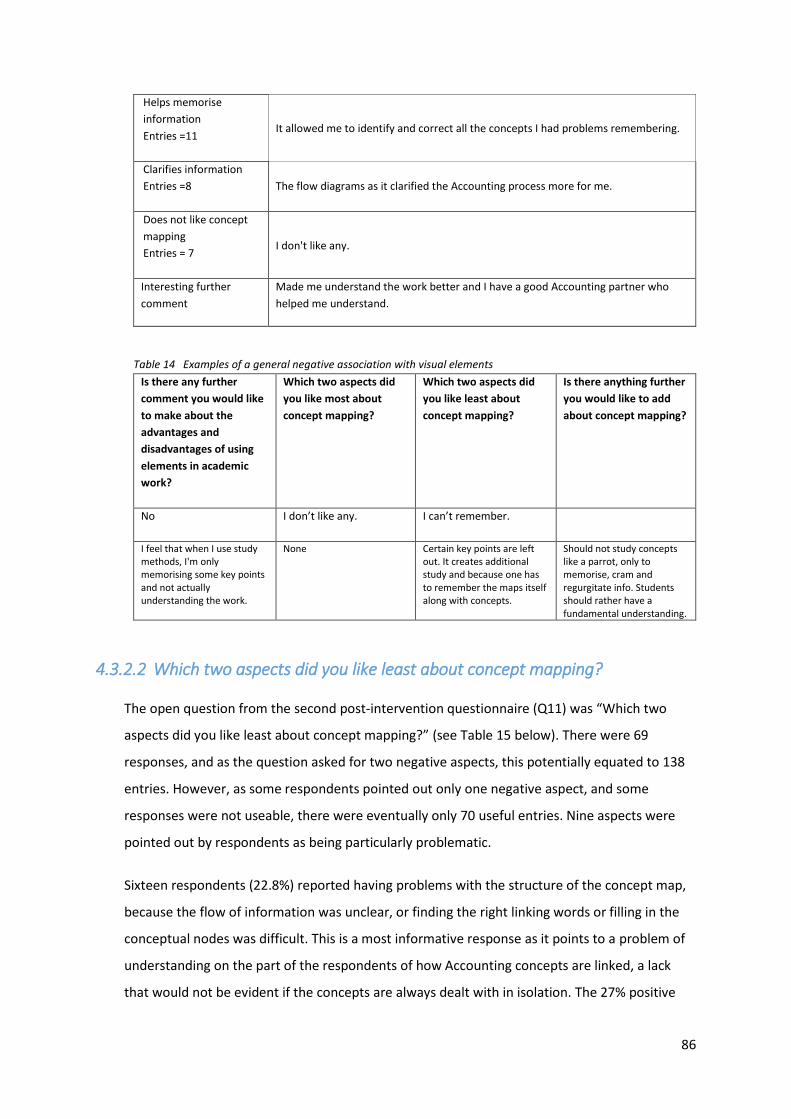
86
Helps memorise
information
Entries =11 It allowed me to identify and correct all the concepts I had problems remembering.
Clarifies information
Entries =8 The flow diagrams as it clarified the Accounting process more for me.
Does not like concept
mapping
Entries = 7 I don't like any.
Interesting further
comment
Made me understand the work better and I have a good Accounting partner who
helped me understand.
Table 14 Examples of a general negative association with visual elements Is there any further
comment you would like
to make about the
advantages and
disadvantages of using
elements in academic
work?
Which two aspects did
you like most about
concept mapping?
Which two aspects did
you like least about
concept mapping?
Is there anything further
you would like to add
about concept mapping?
No I don’t like any. I can’t remember.
I feel that when I use study methods, I'm only memorising some key points and not actually understanding the work.
None Certain key points are left out. It creates additional study and because one has to remember the maps itself along with concepts.
Should not study concepts like a parrot, only to memorise, cram and regurgitate info. Students should rather have a fundamental understanding.
4.3.2.2 Which two aspects did you like least about concept mapping?
The open question from the second post-intervention questionnaire (Q11) was “Which two
aspects did you like least about concept mapping?” (see Table 15 below). There were 69
responses, and as the question asked for two negative aspects, this potentially equated to 138
entries. However, as some respondents pointed out only one negative aspect, and some
responses were not useable, there were eventually only 70 useful entries. Nine aspects were
pointed out by respondents as being particularly problematic.
Sixteen respondents (22.8%) reported having problems with the structure of the concept map,
because the flow of information was unclear, or finding the right linking words or filling in the
conceptual nodes was difficult. This is a most informative response as it points to a problem of
understanding on the part of the respondents of how Accounting concepts are linked, a lack
that would not be evident if the concepts are always dealt with in isolation. The 27% positive

87
responses for the concept mapping structure in the first question (“Which two aspects did you
like most about concept mapping?”) form an interesting comparison with the 22.8% here. This
suggests that understanding was improved for some students because of the clarification of the
structure of the topic, while for others a failure to grasp the approach prevented effective use
of the structure that the concept map provided.
A high proportion of the replies also indicated that respondents found concept mapping
confusing (14 entries, or 20% of respondents). In these cases, the actual words “confusing” or
“complicated” were used. The high percentage here also compares unfavourably to the low
percentage of respondents who identified visual aids in general as confusing (7.5%). Six
respondents (8.5%) found that there was “too much going on” in concept mapping. This echoes
the previous aspect that saw concept mapping as confusing. In fact, the three aspects
mentioned so far (problems with the structuring of the maps, finding the technique confusing
or too busy) could be grouped as they refer to the concept mapping format. This issue may
point to problems with understanding the information, as discussed in the previous paragraph.
It may also be argued that the collectively high proportion of negative responses here is the
result of students’ short exposure to the concept mapping technique, which did not allow
students enough time to practice and become familiar with its use. A further comment was
included in the table (see Table 15 below), though not grouped with specific problematic
aspects, as this respondent seems to capture the problem discussed here so precisely: concept
mapping is “[n]ot easy to use when the concept is not understood entirely”.
The following aspects were of lesser significance but still worth noting. The first of these is that
students found the technique time consuming (six entries, or 8.5% of respondents). Only one
respondent mentioned the problem of the time involved in creating visual aids (this was not
reported because of the low number of entries). This is a legitimate concern, especially until
students are familiar with the technique; it is somewhat surprising that this aspect had such a
relatively low occurrence, under the circumstances. A further aspect that was of equal concern
(six entries, or 8.5% of the respondents) was that some respondents had wanted to add more
information than there was space for. This reflects one of the disadvantages of visual aids
identified by three respondents (7.5%), namely that important information was usually left out,
as far as they were concerned. This suggests that some students need more clarification
regarding the concepts under discussion, perhaps because of a lack of understanding. Five
respondents (7%) were negative about concept mapping without giving particular reasons.
Three respondents (4%) stated that they had problems with the drawing of the concept map,

88
which is odd as they were given a pre-created map and no drawing was required. Perhaps these
comments reflect a general concern. The same number of students (three respondents or 4%)
seemed to have experienced the concept mapping intervention as threatening. From their
responses, it appears that they might have thought that they were being tested on the work.
Nine respondents (12.8%) chose to make a positive statement about concept mapping, even
though they had had a previous opportunity to do so. This indicates a distinctly positive
experience of concept mapping. A final aspect that is worth mentioning is that some
respondents expressed disappointment at not being allowed to keep the completed maps. This
is important, not because of the number of entries (only two, or 2.8%), but because it indicates
further that some respondents had seen the value of the technique.
Table 15 Salient responses to the second open question of the post-intervention questionnaire Question: Which two aspects did you like least about concept mapping?
Aspect Representative entry
Having to structure
information
Entries =16
Natural flow of map can be difficult to comprehend if concept wasn't initially
understood fully.
Confusing
Entries = 14
If you do not know your work, it can get very confusing. Some concepts are not
explained in detail. A lot of information (irrelevant information).
Wanted to add more
info
Entries =6
Not every information can be covered in c/m.
Too much going on
Entries = 6 Don't think I learn best this way (too much going on).
Time consuming
Entries = 6 It takes my time and effort.
Generally negative
Entries = 5 I have tried this and it did not work.
Drawing the map
Entries = 3 Drawing the actual map.
Felt threatened
Entries = 3 They are given to us unexpectedly. Made me feel stupid.
Could not keep maps
Entries = 2 We can't keep the maps. I feel it doesn't help because I can't go over it.
Found nothing negative
Entries = 9 There was nothing I didn't like. The concept of mapping assists me in studying so I find it effective.

89
Interesting further
comment Not easy for use when the concept is not understood entirely.
4.3.2.3 Is there anything further you would like to add about concept mapping?
The third open question from the post-intervention questionnaire (Q11) was “Is there anything
further you would like to add about concept mapping?” (see Table 16 below). The 14 responses
were diverse, which made categorisation difficult. However, the six positive responses (42 % of
respondents) are similar in nature and can therefore be grouped together. Nevertheless, the
separate negative comments, taken together, add up to seven (50%) and are therefore also
worth reporting. Respondents’ individual concerns were that the technique would need getting
used to, that one would not be able to do it oneself, that concept mapping cannot be applied to
Accounting and that the technique was not understood. These concerns are all connected to
the need for greater familiarity with concept mapping, which can be addressed. One
respondent’s comment was that it encourages rote learning. This respondent made a similar
comment when naming an advantage of visual aids (“I feel that when I use study methods, I am
only memorising some key points and not actually understanding the work”) and this might
thus indicate a general attitude rather than a reaction to concept mapping itself.
Table 16 Salient responses to the third open question of the post-intervention questionnaire Question: Is there anything further you would like to add about concept mapping?
Aspect Representative entry
Covers everything
Entries = 1
For me everything is perfect the way it is because it covers everything I've learned so
far.
Positive
Entries = 6
C/m is really good for understanding of the relationship of concepts and how
different concepts are connected in graphical sense, because people learn and
remember fast with imaging.
Wrong application
Entries = 2
I feel the concept maps only work for memorising modules or theory-based
modules. They are difficult to implement for "understanding" modules.
Will take getting used to
Entries = 1 It's very good and will take some getting used to.
Must make what is
expected clear
Entries = 1
Make the questions clear so I know what is expected of me.
Would not be able to do
oneself
Entries = 1
I do not think I would work with concept mapping because I would find it hard to
start it from scratch myself.

90
Don’t understand
Entries = 1 I don't understand it.
Encourages rote
learning
Entries = 1
Should not study concepts like a parrot, only to memorise, cram and regurgitate info. Students should rather have a fundamental understanding.
Interesting further
comment
How can it be applied to number or amounts, whether it will be recorded in this
journal and be posted under which account on general journal.
4.3.3 Observations of the concept mapping intervention
As discussed in Section 3.6.4, three lecturers observed the concept mapping intervention. Their
observations were subsequently recorded and are described here. The Accounting lecturer, Mr
Amogelang Nawa, observed the following:
The incomplete concept maps engaged all the students, I saw students discussing
concepts, some asked questions (such as why income received in advance is regarded as
a liability) which means they have never made that connection before. Students were
also referring to their textbooks. Some students completed the map very quickly while
for others it took a while. Some students immediately started discussing the map while
the others firstly took some time (individually) to read their textbook. One of the
students wanted me to tell them the answer (which I didn't) while the others were just
confirming their answers.
Ms Nandi Weder (academic literacy) gave the following feedback of the observations:
The BCom students seemed quite capable of completing the accrual concept map,
worked on it individually and in pairs, and made the necessary corrections afterwards,
while marking with their lecturer. The students appeared to be comfortable with the
format of the task and did not seem particularly intimidated or confused by what they
were expected to do, as they were able to carry on without much assistance. Most
students managed to complete the task, often well before the time was up. I think it is
likely that many of them will be able to construct their own concept map after having
completed this task. Although some students completed the task individually, most
paired up. Since the lecture hall only had long rows of seats, and since the class was
quite noisy, discussing the task with more than one person at a time was not tenable.
Typically, the students would start by filling in those gaps they could complete easily

91
and then discussing the sections they were uncertain of with a friend, often consulting a
textbook together. They generally worked quite diligently on the task, despite the fact
that it was a late class and many seemed quite eager to get home, although knowing
that they were being observed might have had something to do with this. Once they
were done with the task, many students added notes and corrections during the
marking session, which also suggests that the task was not so easy that no mistakes
were made.
As the researcher, I made the following observations:
Whereas students seemed uninterested when the normal lecture was in progress, they
responded with alacrity to the task of completing the concept maps. Some worked
individually but most seemed to work in pairs or groups. However, everyone
participated. Many referred to different sections in their textbooks. Students pointed
out certain aspects on the concept maps to each other in support of their proposed
answers. There was some lively discussion. One pair of students was so delighted with
having successfully completed the concept map that they high-fived each other. Even
those who seemingly worked on their own checked certain answers with their peers. I
also noticed some of the groups of students asking questions of the Accounting
lecturer, Mr Amogelang Nawa.
Once the students had completed their maps, Mr Nawa discussed the solution. They
were interested in seeing the solution and in correcting their own maps where
necessary. When asked to return the maps, several seemed disappointed and one
student asked to keep the map for studying purposes.
The three observers had the following similar comments:
Students participated in the concept mapping exercise. A comment was also made that
some had not shown much interest in the lecture before the concept map was
introduced, so student participation could be linked to the concept mapping activity
itself.
Students used several scaffolding strategies in completing the concept map, such as
teaming up with another student or asking other students for help, consulting their
textbooks, and correcting misunderstandings when the Accounting lecturer discussed

92
the solution afterwards. Vygotsky’s theory that learning takes place through socially
mediated activity may be observed to be in action here (Vygotsky, 1986).
Students appeared capable of doing the concept maps, as nobody seemed at a loss
during the activity, although some needed more time than others did.
The Accounting lecturer remarked that some of the students saw links between
concepts that they had not been aware of before.
In summary, the observations of the lecturers indicate that students eagerly participated in the
concept mapping intervention overall, and that they found the activity of value.
4.4 Relating the data to the first research sub-question
The first research sub-question was:
How does concept mapping affect students’ comprehension of subject-specific concepts
and their associated terms?
The aim of the research was to find out whether concept mapping could be used to improve
students’ subject-specific concept literacy. For the purposes of this research, the discipline that
was used was Accounting. To investigate the effect concept mapping could have on students’
comprehension of subject-specific concepts and their associated terms, Accounting terms were
presented to the test group in the form of a concept map, and thereafter they were tested on
their understanding of the terms. In the test, students were required to produce a paragraph in
which they applied the terms to a real-life Accounting scenario. The post-intervention
paragraph marks did not show an improvement on the pre-intervention paragraph marks.
Similarly, the marks of the control group showed a decline. The decline in the marks of both the
test group and the control group was not statistically insignificant, which means that no
categorical conclusion, either positive or negative, can be drawn regarding the results of the
intervention. Concept mapping can therefore not be said to have had a measurable effect on
students’ comprehension of subject-specific concepts and their associated terms.
Several questions in the pre-intervention questionnaire were aimed at investigating the
influence of outside factors on results. Firstly, factors that might have influenced the pre-
intervention paragraph marks were identified. For the test group, these aspects were as
follows: whether or not a student had had English at Home Language level in Grade 12, the final
matric marks and previous experience of Accounting. For the control group, the aspects were as

93
follows: previous use of visual aids, the type of school attended, whether or not a student had
had English at Home Language level in Grade 12 and previous experience of Accounting.
Secondly, factors that might have influenced the post-intervention paragraph marks were
identified. The only aspect that appeared to be influential here was previous experience of
Accounting. As none of the other previously identified aspects appeared to have any influence
on the post-intervention marks, they may be dismissed. In conclusion, for both the test and
control groups, students who had had Accounting at school were more likely to perform well in
the pre- and post-intervention paragraphs.
4.5 Relating the data to the second research sub-question
Having analysed the qualitative data in the questionnaires, we are in a position to address the
second research sub-question. The question reads:
What are the opinions of students about concept mapping as a technique for
scaffolding comprehension and memory of subject-specific concepts and their
associated terms?
From the discussion in Section 4.2.5, it is clear that concept mapping was not experienced as
significantly superior to other visual aids for understanding and memorisation. On the other
hand, the 75% (52 out of 69) positive response rate for both understanding and memorisation
indicates that students nevertheless found these aspects helpful. The qualitative data drawn
from the post-intervention questionnaire support this observation (see Section 4.3.2), in that
the positive aspects all identify concept mapping as useful for understanding, and, to a lesser
extent, memorisation. This overwhelmingly positive response is significant, given the short
exposure the students had to the technique. The same observation was made when the
quantitative data from the post-intervention questionnaire were analysed (see Section 4.2.4),
showing that the majority of students found the concept mapping intervention useful and were
positively inclined towards implementing the strategy. Finally, lecturer observations of the
concept mapping intervention appear to confirm that students found value in the activity. It can
therefore be stated that students are predominantly in favour of concept mapping as a
technique for scaffolding comprehension and memory of subject-specific concepts and their
associated terms.

94
4.6 Relating the results to the research question
Having considered the data and interpreted its significance, the main research question may be
addressed:
Is concept mapping an effective technique for scaffolding concept literacy among first-
year Accounting students in an extended curriculum programme?
The analysis of the quantitative data does not conclusively establish that concept mapping
advances students’ concept literacy, given the statistically insignificant result of the comparison
between the pre- and post-intervention paragraph marks of the test and control groups. The
analysis of the qualitative data more positively substantiated the value of concept mapping as a
useful technique for improving concept literacy.
4.7 Accepting or rejecting the hypothesis
Three hypotheses were put forward at the start of the research. The first hypothesis was:
The performance of students in the test group will improve from the pre-intervention
test to the post-intervention test, based on their individual test scores.
As there was no improvement in scores from the pre-intervention test to the post-intervention
test for the test group, this hypothesis is rejected.
The second hypothesis was:
There will be very little improvement in the performance of students in the control
group from the pre-intervention test to the post-intervention test, based on their
individual test scores.
As there was a decline in the performance of students in the control group from the pre-
intervention test to the post-intervention test, this hypothesis cannot be rejected directly.
The third hypothesis was:
The performance of students in the test group will improve more than the students in
the control group did, based on the difference between their pre- and post-intervention
test scores.

95
The performance of students in the test group did not improve more than the performance of
students in the control group did, based on the difference between their pre- and post-
intervention test scores. Therefore, this hypothesis is rejected.
4.8 Factors influencing the results
Postpositivism allows for extenuating circumstances to have an influence on the failure of a
theory (Willis, 2012b). It is also deterministic in nature, and it is thus appropriate to look for the
possible causes of reported results (Creswell, 2014:7). Therefore, now that the research has
been concluded, I would like to reflect on my observations and experience of the process, as
this might provide a perspective on the results presented above. These do not include the
recognised limitations of the study, which will be discussed in the next chapter, but rather refer
to unforeseen issues that only became apparent during the course of the research. The factor
causing most concern was student participation and the impact this had had on the research.
In the discussion on Ausubel’s Theory of Assimilation (see Section 2.3.5), the importance of
student participation in the process of meaningful learning is given as one of the three essential
factors of the theory (Novak, 2010:59; Novak & Cañas, 2008:3-4; Carnot et al., 2003:6-7). For
example, if a student is unwilling to cooperate in the assimilation of new knowledge (Novak,
2010: 60) and refuses to forego the habit of rote learning, there is little that the instructor can
do to force the issue (Novak & Gowin, 2010:159; Novak & Cañas, 2008:3). This is of course true
for any learning strategy or any curriculum that might be proposed, as well as students’ general
attitude towards their studies. Furthermore, while assisting in the Accounting lecture, I
observed that many students paid no attention to the lecturer, but rather occupied their time in
personal pursuits. Indeed, it seems that the issue of accountability is now being recognised in
many quarters. Recently, the FLY@UP campaign was launched at the University of Pretoria to
encourage students to “take responsibility for their own finish lines and to [graduate on time]”
[author’s emphasis] (Byles, 2017). A practical implication of some students’ poor attitude
towards their learning is discussed in the next paragraph.
A major factor that influenced the current research was the number of students in the test and
control groups. The test group consisted of 127 students and yet, as a result of poor class
attendance, the information of only 65 students, on average, was usable. Similarly, the control
group consisted of 53 students, and yet the information of only 35 students could be used. Class
attendance is not compulsory for the relevant extended programme, although it is encouraged,
as it has been shown to be influential in good academic performance (Koh, 2014:457). Thus,

96
while it is surely not an unreasonable assumption that students who have been granted this
“grace” year would approach it with a greater sense of purpose, the reality proved that many
did not.
4.9 Conclusion
In this chapter, the quantitative data gathered by means of the pre- and post-intervention
questionnaires and the pre- and post-intervention paragraph marks were analysed and
discussed, to assess the validity of the three hypotheses put forward at the start of this study.
The qualitative data collected by means of the pre- and post-intervention questionnaires, as
well as from the observations that had been made of the intervention, were analysed to see
whether they supported the results of the quantitative data. The research questions were then
addressed, and two of the research hypotheses rejected. Finally, unforeseen factors that might
have influenced the results were reflected upon.

97
Chapter 5: Conclusion
5.1 Introduction
In this concluding chapter, an overview will be given of the motivation for this study, the
methodology used for the research, and the collection and analysis of the data. Thereafter, I
shall reflect on the relevance of the results, and conclude by stating the limitations of the study
and mentioning possibilities for future research.
5.2 Overview of the study
Since 1994, the aim in higher education in South Africa has been accessibility and excellence,
not only to correct injustices of the past, but also to boost the economy of the country by
providing effective graduates (Volbrecht & Boughey, 2004:58). While great strides have been
made as far as accessibility is concerned (CHE, 2013; Paxton, 2009; Badsha & Harper, 2000), we
still experience problematic throughput that is indicative of an education system that is
wanting, despite the establishment of various policies in this regard (Department of Higher
Education and Training, 2011; Department of Higher Education and Training, 2010; Ministry of
Education, 2001; Department of Education, 1997). In response, various academic development
programmes were established (Mckenna, 2012; Boughey, 2010; Volbrecht & Boughey, 2004)
but as yet these programmes have not been able to address the problem of throughput
adequately (CHE, 2015), which forces us to look more widely for solutions. Underdeveloped
cognitive skills and insufficient concept literacy, which are typical outcomes of rote learning,
have been identified as problematic areas at the heart of underpreparedness (Wilson et al.,
2014; Maas & Leauby, 2005; Joseph & Ramani, 2004; Norris & Phillips, 2003; Novak, 2002).
Concept literacy refers to a deep understanding of the terms that make up the vocabulary of a
certain discipline, without which the subject remains inaccessible (Gablasova, 2012) and ways
and means must therefore be found to improve students’ understanding of the concepts
integral to their chosen subjects in order to grant access to the epistemologies of those
subjects. The present study set out to find an answer to the particular issues facing the South
African educational environment.
A Postpositivist paradigm was followed, as this study was meant to produce “credible claims
based on rigorous enquiry” (Floden, 2009:488). Even though this research paradigm claims that
the conclusions drawn from a research study are never decisive (Creswell, 2014), a conclusion

98
may be reached from the collective results of various studies on the same theme (Willis,
2007b:8). A research claim can therefore only be verified after a lengthy process. This illustrates
an important aspect of Postpositivism, namely the desire for truth. While a Postpositivist
paradigm is generally synonymous with a quantitative methodology, this study used mixed
methods to ensure a balanced interpretation of results (Creswell, 2014:15) and to enhance the
overall strength of the research (Creswell, 2014:10).
The research leans upon educational theories that may be subsumed under the denominator of
cognitive Constructivism, which maintains that the construction of meaning is an individual
process and that newly acquired knowledge is merged with previously assembled knowledge
structures (Byrne & Willis, 2014; Lucas & Mladenovic, 2014; Taber, 2000). In Constructivism, the
construction of meaning is more important than simply a regurgitation of information (Lutz &
Huitt, 2004), and the process of aiding the construction of new knowledge is called scaffolding
(Fennema-Bloom, 2009:33; see also Walqui, 2006:170). Constructivism further emphasises the
need for student engagement in learning, as individual construction of meaning cannot take
place without such engagement (Lutz & Huitt, 2004).
Ausubel’s Assimilation Theory (1962) is a variation of Constructivism and in particular seeks to
promote meaningful learning that emphasises relevant and valuable prior knowledge
(Greenberg & Wilner, 2015; Novak, 2010; Simon, 2007:278; Safayeni et al., 2005:2). Knowledge
must be clearly expressed (Novak & Cañas, 2008:3) and, furthermore, the student must
cooperate in the learning process (Novak, 2010:59; Novak & Cañas, 2008:3-4; Carnot et al.,
2003:6-7). This is also emphasised in Constructivism, as mentioned in the previous paragraph.
Assimilation Theory is of particular use to the current research as it is specifically aimed at the
educational environment.
Novak used the ideas advocated in Asubel’s theory to design and develop concept mapping.
Concept mapping is a hierarchical representation of knowledge (Greenberg & Wilner, 2015:18;
Novak, 2010:4; Novak & Cañas, 2008:12; Simon, 2007:276) and as such functions as a useful
scaffolding tool (Novak & Cañas, 2008; Chang et al., 2002). Concepts and the relationships
between them are depicted, and it is in the identification of such relationships that meaningful
learning takes place (Novak & Cañas, 2008; Carnot et al., 2003; Novak, 2002). Many researchers
have commented on the useful application of concept mapping in a variety of subjects, among
which Accounting features strongly, but the reports have for the most part been anecdotal
rather than backed by results from rigurous studies (Leauby et al., 2010: 287:289).

99
This study was aimed at investigating whether concept mapping could conclusively be proved to
enhance meaningful learning, and, in particular, conceptual understanding. The setting was an
extended programme for BSc and BCom students at a South African university. The research
was accommodated in the Accounting course, as previous studies had shown Accounting to be
well suited to the strategy (Leauby et al., 2010; Simon, 2007; Maas & Leauby, 2005), and the
Accounting lecturer was also interested in using concept mapping. The Accounting students fall
into two groups, the BCom group and the BSc Mathematical Sciences group, and as initial
information suggested that these groups were similar in ability, it seemed feasible to use the
one group as the test (BCom) and the other as the control (BSc Mathematical Sciences) group in
a quasi-experimental design. The groups were not equal in size; nevertheless, the initial
numbers – 127 students in the test group and 53 students in the control group – were
sufficient for statistical purposes. The research was merged with the normal extended
programme Accounting curriculum to replicate the standard teaching environment as much as
possible. The Accounting curriculum is very full; consequently, a limited amount of time was
available to conduct the research.
The Postpositivist paradigm requires strict control of the data collection process, as described
hereafter (Creswell, 2014). Both the test and control groups completed a pre-intervention
questionnaire to identify factors that might influence the outcome of the research. Both groups
then wrote a pre-intervention paragraph based on a previously covered Accounting topic.
Examples of the pre-intervention paragraph are available in Appendix G. While it is not standard
for Accounting assessment to take the form of a written paragraph, the rationale for its use was
well supported (see Section 3.6.2). One of the primary reasons for this format being deemed a
more appropriate test for conceptual understanding was that current research indicates how
important language is in expressing content knowledge (Madiba, 2014:68; Gablasova, 2012:13).
The pre-intervention paragraph marks were not only compared to the results of the post-
intervention paragraph marks, but were also used to establish comparability between the test
and control groups. At this stage, the concept mapping intervention took place for the test
group. Students were firstly familiarised with concept mapping and were then given a partially
completed concept map to complete. This concept map covered a previously discussed
Accounting topic, which served as a form of revision. The same topic was also revised for the
control group, but using conventional means. Both groups then wrote the post-intervention
paragraph, based on the revised topic, and, finally, the test group was given a post-intervention
questionnaire to complete to determine their experience of the concept mapping intervention.
Examples of the post-intervention paragraph are available in Appendix H.

100
It is necessary that the objectivity and validity of the conclusions be assured (Creswell, 2014;
Willis, 2012). For instance, if students’ marks are not tested for improvement after the use of
concept mapping, one cannot make any claims about the effectiveness of concept mapping
(Leauby et al., 2010:288). Hence, a comparison of the post-intervention paragraph marks to the
pre-intervention marks was conducted, which delivered the following results: the marks of the
test group showed a slight decline, as did those of the control group, although the decline was
marginal in both cases. Furthermore, the initial assumption regarding the equality of the two
groups proved to be invalid when the pre-intervention paragraph marks of the two groups were
compared; the test group scored lower than the control group. This test was required to ensure
the validity of one’s data, which is essential with Postpositivism (Creswell, 2014). For the same
reason, all extraneous variables need to be accounted for in the results. The data drawn from
the pre-intervention questionnaire indicated only one extraneous variable that might have had
an influence on results, namely previous experience of Accounting. Indeed, prior experience of
Accounting is also the likely explanation for the discrepancy in ability between the two groups,
as substantially fewer BSc Mathematical Sciences students had had Accounting at school. When
seen within the Constructivist framework, one could contribute the poorer results of those who
did not have a background in the Accounting discipline to a lack of the prior knowledge that is
essential for the interpretation of new knowledge (Byrne & Willis, 2014:146; Lucas &
Mladenovic, 2014; Taber, 2000:64). Alternatively, Schema Theory would say that students
without prior experience of Accounting do not have the appropriate schemata upon which to
build newly acquired knowledge (Brewer & Nakamura, 1984; Carrell & Eisterhold, 1983). We are
also reminded of a further requirement posited by Constructivists, Dewey in particular, that
students need to have the necessary expertise to complete a task (Lutz & Huitt, 2004:8). Based
on the results of the quantitative data discussed above, no definite conclusion can thus be
drawn regarding the value of concept mapping as an effective technique for scaffolding concept
literacy. This conclusion corroborates the result of the research undertaken by Leauby et al.
(2010), which was the most comprehensive of the studies referred to in Section 1.4.2.
A consideration of the qualitative data, on the other hand, indicates general enthusiasm for the
concept mapping technique. This again reflects the outcome of the Leauby et al. (2010) study
referred to previously, where, while there was no conclusive proof of concept mapping having
an impact on conceptual understanding, the general response to the technique was positive.
The aspects of concept mapping that most impressed participants in this study was that it
clearly outlines the structure and flow of information, as well as the key points, all of which
assisted in the understanding of Accounting concepts. That students should have spontaneously

101
identified so many of the particular strengths of concept mapping is encouraging. Negative
responses were fewer and in almost direct contrast to the positive comments: the structure of
the concept maps was found to be unclear, confusing, complicated and busy, all of which might
be ascribed to a lack of familiarity with the technique. A small number of respondents also
found the technique time-consuming and too concise.
5.3 Limitations of the study
There were factors that limited the study, and these must be acknowledged and discussed. The
first factor is the time required to gain familiarity with concept mapping. The time-consuming
nature of concept mapping has been discussed previously (see Section 2.4.2.2), and only the
main issues will be summarised here. Time must be found in an already busy schedule for both
lecturers and students to acquaint themselves with the technique – this might include
overcoming students’ negative attitudes (Novak & Gowin, 1984:159) – and also to reinforce it
through continued practice (Leauby et al., 2010:296; Maas & Leauby, 2005; Chang et al. 2002).
Maas and Leauby (2005:80), for example, report on a study in which “statistically significant
increases in perceived accuracy of introductory statistical concepts” were found “by continually
using mapping techniques” [author’s emphasis]. In fact, Chang et al. (2002:20) report that it
took fourteen weeks for even a pre-constructed map to deliver results, and that it is unlikely
that the technique of concept mapping will be mastered properly in under a year. Novak
(2010:9) furthermore informs us that the implementation of concept mapping at a particular
school brought about a drop in marks in the first year, and that positive results were only
reported in the following year. Indeed, a drop in marks might be generally expected, according
to Novak and Gowin (1984:159), as students transition from rote learning to meaningful
learning. While the period allowed for this study was all that could be spared in the Accounting
timetable, the reality of the time required to master concept mapping suggests that more time
is needed to investigate adequately the effectiveness of concept mapping.
Another aspect that needs to be mentioned, although it has been discussed in some detail
previously (see Section 3.6.2), is the effect the unfamiliar assessment format might have had on
student performance. In summary, while Accounting students were normally exposed to
assessment that took a numerical form, for this study, they were expected to explain their
solution to the given Accounting problems in paragraph form. There is substantial evidence
from the literature to support the use of language in assessing whether conceptual
understanding has been achieved (Jonker, 2016; Pearson et al., 2012:2; Gablasova, 2012:13;
102
Novak, 2010:80; Novak & Cañas, 2008:15; Vygotsky, 1986:108). Furthermore, although this
serves as anecdotal evidence only, during the marking of the pre- and post-intervention
paragraphs, it was apparent that students with previous experience of Accounting were able to
explain the use of Accounting terms more clearly than those who did not have such experience.
Despite the ample justification for the written format, however, its possible effect on student
performance must be acknowledged. It should be noted that the same format was used for
both the pre- and post-intervention paragraphs, and that the format therefore could not have
been a vital factor in the drop in marks for the post-intervention paragraph.
Finally, an issue that became apparent to me during the research process was the impact a lack
of a pilot study had on the overall investigation into the effectiveness of concept mapping.
However well the data collection might be planned during the design phase of a research study,
potential weaknesses often only show up once the plan is executed. In retrospect, ways may
have been found to counteract the poor class attendance if it could have been anticipated. It is
also possible that the rewording of some of the questions in the pre-intervention paragraph
could have resulted in a different response. For example, it is possible that the description of
the different learning styles, which were added to clarify the question, could have led to a
misconception. For the question on visual learning (“I learn by using visual elements”), the
explanation was given as “e.g. maps, graphs, pictures”, which might have confused students.
Furthermore, it only became clear during the transcribing of the questionnaire responses that
students were not reliable sources of personal information, such as their matric marks for
English and Maths, and their APS. A pilot study would have made it clear that such information
should rather have been collected from the University database. There are thus many ways in
which a pilot study would have been an advantage; a few instances have been given here.
5.4 Suggestions for further research
In their study of the feasibility of concept mapping, Leauby et al. (2010:287-289) urge rigorous
empirical research, to which body of knowledge I hope this study has added. Even though it has
not produced the desired result, it nevertheless should further our understanding, not only of
concept mapping applicability, but also of the role of conceptual understanding in student
success.
Research into concept mapping has by no means been exhausted. Even though this study has
endeavoured to produce rigorous research, it might have provided more substantial results if it
had been preceded by a pilot study and the participant numbers had been higher. Many smaller
103
studies have been conducted on the use of concept mapping. What is required now is a
substantial study that will address the limitations discussed previously. Such a study will require
a time commitment of several years, as indicated by the comments in the previous section.
Higher education in South Africa is in dire need of practical and effective solutions to the
problem of inadequate throughput, which is merely an outward manifestation of the far greater
issue of superficial learning. Education is, as Novak (2010:19) declares, an “enormously complex
human endeavour” and proposed changes must be carefully considered so that they help rather
than harm. While this study does not offer conclusive proof of the advantages offered by
concept mapping in aiding meaningful learning, I nevertheless continue to believe in its value.
As Leauby et al. (2010:296) declare, “While not statistically supported, the benefits of concept
mapping seem evident to us, but do not come without cost or constraints to consider.”
104
Bibliography
Alberts, M. 2001. Lexicography versus Terminography. Lexikos, 11(1):71-84.
Alcina, A. (ed.). 2009. Teaching and learning terminology: new strategies and methods. International
Journal of Theoretical and Applied Issues in Specialized Communication, 15(1):1-9.
Ausubel, D.P. 1962. A subsumption theory of meaningful verbal learning and retention. The Journal
of General Psychology, 66(2): 213-224.
Badsha, N. & Harper, A. 2000. South African higher education: Diversity overview. Diversity,
Democracy, and Higher Education: A View from Three Nations–India, South Africa, the
United States. Washington: Association of American Colleges and Universities .
Beckham, E.F. 2000. Introduction. Diversity, Democracy, and Higher Education: A View from Three
Nations--India, South Africa, the United States. Washington: Association of American
Colleges and Universities .
Boughey, C. 2005. Epistemological access to the university: An alternative perspective. South African
Journal of Higher Education, 19(3): 230-242.
Boughey, C. 2010. Academic development for improved efficiency in the higher education and
training system in South Africa. Southern Africa: Development Bank, Pretoria.
Boughey, C. 2012. Social inclusion & exclusion in a changing higher education environment. REMIE
Multidisciplinary Journal of Educational Research, 2(2):133.
Brennan, L.K., Brownson, R.C., Kelly, C., Ivey, M.K. & Leviton, L.C. 2012. Concept Mapping: priority
community strategies to create changes to support active living. American Journal of
Preventive Medicine, 43 (5 Supplement 4): S337-S350.
Brewer, W.F. & Nakamura, G.V. 1984. The nature and functions of schemas. Center for the Study of
Reading: Technical report no. 325. University of Illinois at Urbana-Champaign.
Brownfield, K.S. 2016. Scaffolding in literacy learning and teaching: the impact of teacher
responsiveness during writing on first grade students’ literacy learning. PhD dissertation.
The Ohio State University.
Bureau: Institutional Research & Planning. 2016. UP by numbers [Online]. Available:
http://www.universityofpretoria.co.za/en/bureau-for-institutional-research-
planning/article/1970929/up-by-numbers [Accessed 23 November 2016].
Byles, H. 2017. FLY@UP. [Online]. Available: http://www.up.ac.za/en/teaching-and-
learning/article/2314706/flyup-minimum-time-to-completion [Accessed 6 November 2017].
Byrne, M. & Willis, P. 2014. The role of prior accounting education and work experience. In: Wilson,
R.M.S. (ed.). The Routledge companion to Accounting education. Abingdon: Routledge, 145-
162.

105
Carnot, M.J., Feltovich, P., Hoffman, R.R., Feltovich, J. & Novak, J.D. 2003. A summary of literature
pertaining to the use of concept mapping techniques and technologies for education and
performance support. The Chief of Naval Education and Training. Pensacola, Florida IHMC.
Carrell, P.L. & Eisterhold, J.C. 1983. Schema theory and ESL reading pedagogy. TESOL Quarterly,
17(4):553-573.
Carstens, A. 2015. Inaugural address: Developing strongest languages and empowering them in
English as the academic lingua franca. Unit of Academic Literacy, Faculty of Humanities,
University of Pretoria. 10 September.
Carstens, A. 2016. Designing linguistically flexible scaffolding for subject-specific academic literacy
interventions. Per Linguam, 32(3):1-12.
Chabeli, M.M. 2010. Concept-mapping as a teaching method to facilitate critical thinking in nursing
education: a review of the literature: original research. Health SA Gesondheid, 15(1):1-7.
Chang, K., Sung, Y. & Chen, I. 2002. The effect of concept mapping to enhance text comprehension
and summarization. The Journal of Experimental Education, 71(1):5-23.
CHE. 2013. A proposal for undergraduate curriculum reform in South Africa: the case for a flexible
curriculum structure: report of the task team on undergraduate curriculum structure.
Pretoria: Council on Higher Education.
CHE. 2015. VitalStats public higher education 2013. Pretoria: Council on Higher Education.
Clarke, C. 2009. Paths between positivism and interpretivism: An appraisal of Hay's via media.
Politics, 29(1):28-36.
Clarke, S. 2015. Concept mapping. Nursing Standard, 30(5):61-62.
Connelly, L.M. 2014. Ethical considerations in research studies. Medsurg Nursing, 23(1):54.
Creativeinspiration. 2017. Try mind mapping. [Online]. Available: https://creativeinspiration.deviantart.com/art/Try-Mind-Mapping-190366184 [Accessed 4 October 2017].
Creswell, J.W. 2014. Research design: qualitative, quantitative, and mixed methods approaches, 4th
ed. London: Sage Publications, Inc.
Croft, W. & Cruse, D.A. 2004. Cognitive linguistics. Cambridge: Cambridge University Press.
Crook, C & Garratt, D. 2011. The Positivist paradigm in contemporary social research: The interface
of psychology, method and sociocultural theory. In: Somekh, B. & Lewin, C. (eds.). Theory
and methods in social research, 2nd ed. London: Sage Publications Ltd., 212-219.
Cumming, J. & Maxwell, G.S. 1999. Contextualising authentic assessment. Assessment in Education:
Principles, Policy & Practice, 6(2):177-194.
Cummins, J. 1979. Linguistic interdependence and the educational development of bilingual
children. Review of Educational Research, 49(2):222-251.

106
Cunningham, B.M. 2014. Critical thinking in Accounting education. In: Wilson, R.M.S. (ed.). The
Routledge companion to Accounting education. Abingdon: Routledge, 399-419.
Dalton-Puffer, C. 2011. Content-and-language integrated learning: from practice to principles?
Annual Review of Applied Linguistics, 31:182-204.
Dass, S. & Rinquest, A. 2017. Chapter 7: School fees. In: Basic Education Rights Handbook.
Braamfontein, Johannesburg: Section27, 141-159.
Department of Education. 1997. Education White Paper 3: A programme for the transformation of
higher education. General Notice 1196 of 1997. Pretoria.
Department of Higher Education and Training. 2010. Strategic Plan 2011-2015. Pretoria: Department
of Higher Education and Training.
Department of Higher Education and Training. 2011. Revised Strategic Plan 2010/11-2014/15.
Pretoria: Department of Higher Education and Training.
Eppler, M.J. 2006. A comparison between concept maps, mind maps, conceptual diagrams, and
visual metaphors as complementary tools for knowledge construction and sharing.
Information Visualization, 5(3):202-210.
de Valenzuela, J. S. 2017. Comparing positivist (or objectivist) and naturalist (or interpretivist)
approaches to research. [Online]. Available: www.unm.edu/~devalenz/505/compare.doc
[Accessed 3 January 2018].
Faculty of Economic and Management Sciences. 2017. BCom (Extended programme). [Online].
Available: http://www.up.ac.za/en/faculty-of-economic-and-management-
sciences/article/30233/bcom-extended-programme [Accessed 8 December 2017].
Faculty of Natural and Agricultural Sciences. 2017. BSc – Extended programmes. [Online]. Available:
http://www.up.ac.za/en/faculty-of-natural-agricultural-sciences/article/2001123/bsc-four-
year-programmes [Accessed 8 December 2017].
Fennema-Bloom, J.R. 2009. Code-scaffolding: a pedagogic code-switching technique for bilingual
content instruction. Journal of Education, 190(3):27-35.
Floden, R.E. 2009. Empirical research without certainty. Educational Theory, 59(4):485-498.
Flood, B. 2014. The case for change in Accounting education. In: Wilson, R.M.S. (ed.). The Routledge
companion to Accounting education. Abingdon: Routledge, 81-101.
Gablasova, D. 2012. Learning and expressing technical vocabulary through the medium of L1 and L2
by Slovak-English bilingual high-school students. Master’s dissertation. University of
Auckland.
Gajo, L. 2007. Linguistic knowledge and subject knowledge: How does bilingualism contribute to
subject development? International Journal of Bilingual Education and Bilingualism,
10(5):563-581.

107
Greenberg, R.K. & Wilner, N.A. 2015. Using concept maps to provide an integrative framework for
teaching the cost or managerial Accounting course. Journal of Accounting Education,
33(1):16-35.
Hassall, T. & Joyce, J. 2014 The use of experiential learning in accounting education. In: Wilson,
R.M.S. (ed.). The Routledge companion to Accounting education. Abingdon: Routledge, 376-
398.
Herrington, J., Oliver, R. & Reeves, T.C. 2002. Patterns of engagement in authentic online learning
environments. Winds of change in a sea of learning: Proceedings of the 19th Annual ASCILITE
conference. Auckland, New Zealand.
Herrington, J.A. & Herrington, A.J. 2006. Authentic conditions for authentic assessment: aligning task
and assessment. Critical Visions: Thinking, Learning and Researching in Higher Education:
Research and Development in Higher Education. Milperra, NSW.
Hsieh, H.F. & Shannon, S.E. 2005. Three approaches to qualitative content analysis. Qualitative
Health Research, 15(9):1277-1288.
Huitt, W. & Hummel, J. 2003. Piaget's theory of cognitive development. [Online]. Available:
http://www.edpsycinteractive.org/topics/cognition/piaget.html [Accessed 16 June 2017].
Jonker, A. 2016. The use of multilingual glossaries in enhancing the academic achievement of
Extended Degree Programme students in a mainstream subject. Doctoral dissertation.
Stellenbosch University.
Joseph, M. & Ramani, E. 2004. Academic excellence through language equity: A new bilingual BA
degree. In: Griesel, H. (ed.). Curriculum responsiveness: Case studies in higher education.
Pretoria: South African Universities Vice-Chancellors Association.
Kinchin, I.M. 2000. Concept mapping in Biology. Journal of Biological Education, 34(2):61-68.
Kirschner, P.A., Sweller, J. & Clark, R.E. 2006. Why minimal guidance during instruction does not work: An analysis of the failure of constructivist, discovery, problem-based, experiential, and inquiry-based teaching. Educational Psychologist, 41(2): 75-86.
Koh, H.C. 2014. Determinants of students’ performance. In: Wilson, R.M.S. (ed.). The Routledge companion to Accounting education. Abingdon: Routledge, 449-469.
Knight, B., Callaghan, D.P., Baldock, T.E. & Meyer, J.H.F. 2014. Identifying threshold concepts: case
study of an open catchment hydraulics course. European Journal of Engineering Education,
39(2):125-142.
Krippendorff, K. 2013. Content analysis: an introduction to its methodology, 3rd ed. Sage Publications.
Leauby, B.A., Szabat, K.A. & Maas, J.D. 2010. Concept mapping — An empirical study in introductory
financial Accounting. Accounting Education, 19(3):279-300.
Lessard-Clouston, M. 2008. Strategies and success in technical vocabulary learning: Students'
approaches in one academic context. Indian Journal of Applied Linguistics, 34(1/2):31.
108
Lewin, C. 2011. Understanding and describing quatitative data. In: Somekh, B. & Lewin, C. (eds.). Theory and methods in social research, 2nd ed. London: Sage Publications Ltd, 220-230.
Lourenço, O. & Machado, A. 1996. In defense of Piaget's theory: A reply to 10 common criticisms.
Psychological review, 103(1):143.
Lucas, U. & Mladenovic, R. 2014. Perceptions of Accounting. In: Wilson, R.M.S. (ed.). The Routledge
companion to Accounting education. Abingdon: Routledge, 125-144.
Lutz, S. & Huitt, W. 2004. Connecting cognitive development and constructivism: Implications from
theory for instruction and assessment. Constructivism in the Human Sciences, 9(1):67-90.
Maas, J.D. & Leauby, B.A. 2005. Concept mapping-exploring its value as a meaningful learning tool in
Accounting education. Global Perspectives on Accounting Education, 2:75.
Madiba, M. 2014. Promoting concept literacy through multilingual glossaries: A translanguaging
approach. In: Hibbert, L. & van der Walt, C. (eds.). Multilingual Universities in South Africa:
Reflecting Society in Higher Education. Bristol: Multilingual Matters, 68-87.
Mckenna, S. 2012. The context of access and foundation provisioning in South Africa. In: Dhunpath,
R. & Vithal, R. (eds.). Alternative access to higher education: Underprepared students or
underprepared institutions? London: Pearsons, 50-60.
Meyer, J.H. & Land, R. 2005. Threshold concepts and troublesome knowledge (2): Epistemological
considerations and a conceptual framework for teaching and learning. Higher Education,
49(3):373-388.
Michaelidou, N. & Dibb, S. 2006. Using email questionnaires for research: Good practice in tackling
non-response. Journal of Targeting, Measurement and analysis for Marketing, 14(4):289-
296.
Ministry of Education. 2001. National plan for higher education in South Africa. Pretoria.
Mouton, J. 1996. Understanding social research. Hatfield: J.L. van Schaik Publishers.
Needles Jr, B.E. 2014. Modeling Accounting education. In: Wilson, R.M.S. (ed.). The Routledge
companion to Accounting education. Abingdon: Routledge, 26-49.
Nielsen, L.A. 1980. Comparative evaluation of the cognitive theories of Piaget and Ausubel. Paper
presented at the Annual Meeting of the American Reading Conference, Sarasota, Florida, 4-6
December.
Nkomo, D. & Madiba, M. 2011. The compilation of multilingual concept literacy glossaries at the
University of Cape Town: A lexicographical function theoretical approach. Lexikos, 21
[Online]. Available: http://www.ajol.info/index.php/lex/article/view/72834 [Accessed 3
September 2016].
Norris, S.P. & Phillips, L.M. 2003. How literacy in its fundamental sense is central to scientific literacy.
Science Education, 87(2):224-240.

109
Novak, J.D. 2002. Meaningful learning: The essential factor for conceptual change in limited or
inappropriate propositional hierarchies leading to empowerment of learners. Science
Education, 86(4):548-571.
Novak, J.D. 2010. Learning, creating, and using knowledge: Concept maps as facilitative tools in
schools and corporations, 2nd ed. New York: Routledge.
Novak, J.D. & Cañas, A.J. 2008. The theory underlying concept maps and how to construct and use
them. Technical Report IHMC CmapTools. Florida Institute for Human and Machine
Cognition. [Online]. Available:
http://cmap.ihmc.us/Publications/ResearchPapers/TheoryUnderlyingConceptMaps.pdf
[Accessed 4 July 2017].
Novak, J.D. & Gowin, D.B. 1984. Learning how to learn. Cambridge: Cambridge University Press.
O'Donnell, R. 2010. A critique of the Threshold Concept Hypothesis and an application in Economics.
University of Technology Sydney: School of Finance and Economics.
Paxton, M.I.J. 2009. ‘It's easy to learn when you using your home language but with English you need
to start learning language before you get to the concept’: bilingual concept development in
an English medium university in South Africa. Journal of Multilingual and Multicultural
Development, 30(4):345-359.
Pearson, P.D., Hiebert, E.H. & Kamil, M.L. 2012. Vocabulary assessment: making do with what we
have while we create the tools we need. Vocabulary Instruction: Research to Practice: 231-
255.
Piaget, J. 1971. Biology and knowledge. Edinburgh: Edinburgh University Press.
Piaget, J. 1980. Six psychological studies. Brighton: The Harvester Press.
Popper, K. 2002. The logic of scientific discovery. London: Routledge.
Pui-lan, K. 2010. Concept mapping. Teaching Theology & Religion, 13(3):263-265.
Rumelhart, D.E. 1980. Schemata: The building blocks of cognition. In: Spiro, R.J., Bruce, B.C. &
Brewer, W.F. (eds.). Theoretical issues in reading comprehension: Perspectives from cognitive
psychology, linguistics, artificial intelligence and education. New York: Routledge, 33-58.
Safayeni, F., Derbentseva, N. & Cañas, A.J. 2005. A theoretical note on concepts and the need for
cyclic concept maps. Journal of Research in Science Teaching, 42(7):741-766.
Sale, J.E., Lohfeld, L.H. & Brazil, K. 2002. Revisiting the quantitative-qualitative debate: Implications
for mixed-methods research. Quality and Quantity, 36(1):43-53.
Schreier, M. 2014. Qualitative content analysis. In: Flick, U. (ed.). The SAGE handbook of qualitative
data analysis. London: Sage Publications Ltd, 170-183.
Simon, J. 2007. Concept Mapping in a Financial Accounting Theory Course. Accounting Education, 16(3):273-308.
110
Somekh, B. & Lewin, C. (eds.). 2011. Theory and methods in social research, 2nd ed. London: Sage Publications Ltd.
Taber, K.S. 2000. Chemistry lessons for universities?: A review of constructivist ideas. University
Chemistry Education, 4(2).
Trochim, W.M.K. 2001. The research methods knowledge base, 2nd ed. Cincinnati: Atomic Dog
Publishing.
University of Cape Town. 2017. Introduction. [Online]. Available:
http://www.uct.ac.za/main/about/history [Accessed 27 November 2017].
University of Pretoria. 2017. Yearbooks 2017. [Online]. Available:
http://www.up.ac.za/yearbooks/modules/view/FRK%20133 [Accessed 3 March 2017].
University of the Free State. [n.d.]. Transformation report 2004 – 2014. [Online]. Available:
https://www.ufs.ac.za/docs/librariesprovider39/reports-documents/transformation-report-
74-eng.pdf?sfvrsn=1eebf321_0 [Accessed 27 November 2017].
University of Pretoria Yearbook. 2017. University of Pretoria. [Online]. Available:
http://www.up.ac.za/en/yearbooks/2017/pdf/programme/07139923 [Accessed 8 December
2017].
University of the Witwatersrand. 2015. Wits matters. [Online]. Available:
https://www.wits.ac.za/media/wits-university/footer/about-
wits/documents/Wits%20Matters%20%C3%A2%C2%80%C2%93%20Building%20lives%20%C
3%A2%C2%80%C2%93%20Transforming%20a%20nation%20-
%20Advancing%20a%20continent..pdf [Accessed 27 November 2017].
Volbrecht, T. & Boughey, C. 2004. Curriculum responsiveness from the margins? A reappraisal of
academic development in South Africa. Curriculum Responsiveness: Case Studies in Higher
Education: 57-80.
Vygotsky, L. 1986. Thought and language. Cambridge, Massachusetts: The MIT Press.
Walqui, A. 2006. Scaffolding instruction for English language learners: A conceptual framework.
International Journal of Bilingual Education and Bilingualism, 9(2):159-180.
Widmayer, S.A. 2005. Schema theory: an introduction. [Online]. Available:
http://www.saber2.net/Archivos/Schema-Theory-Intro.pdf [Accessed 23 November 2016].
Willis, J.W. 2012a. Chapter 1: World views, paradigms, and the practice of social science research. In:
Willis, J.W. Foundations of qualitative research: Interpretive and critical approaches. Sage, 1-
26. [Online]. Available: http://methods.sagepub.com.uplib.idm.oclc.org/book/foundations-
of-qualitative-research/n1.xml [Accessed 4 January 2018].
Willis, J.W. 2012b. Chapter 3: Foundational issues: Postpositivist and critical perspectives. In: Willis,
J.W. Foundations of qualitative research: Interpretive and critical approaches. Sage, 1-26.
111
[Online]. Available: http://methods.sagepub.com.uplib.idm.oclc.org/book/foundations-of-
qualitative-research/n3.xml [Accessed 4 January 2018].
Wilson, R.M.S., Abraham, A. & Mason, C.L.J. 2014. The nature of financial literacy. In: Wilson, R.M.S.
(ed.). The Routledge companion to Accounting education. Abingdon: Routledge, 50-80.
Young, D., Van der Vlugt, J. & Qanya, S. 2005. Understanding concepts in Mathematics and Science: A
multilingual learning and teaching resource book in English, Xhosa, Afrikaans and Zulu. Cape
Town: Maskew Miller.
Zarotiadou, E. & Tsaparlis, G. 2000. Teaching lower-secondary chemistry with a Piagetian
constructivist and an Ausbelian meaningful-receptive method: A longitudinal comparison.
Chemistry Education Research and Practice, 1(1):37-50.

112
Appendices
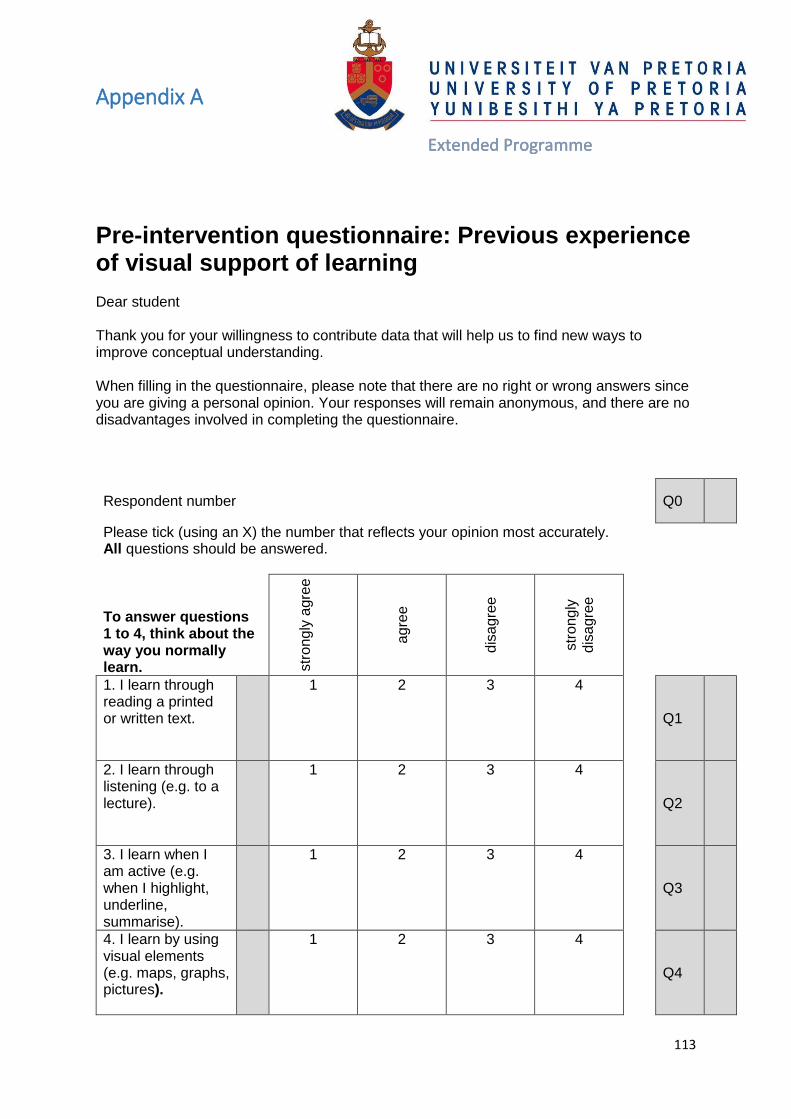
113
Appendix A
Pre-intervention questionnaire: Previous experience of visual support of learning Dear student Thank you for your willingness to contribute data that will help us to find new ways to improve conceptual understanding. When filling in the questionnaire, please note that there are no right or wrong answers since you are giving a personal opinion. Your responses will remain anonymous, and there are no disadvantages involved in completing the questionnaire.
Respondent number Q0
Please tick (using an X) the number that reflects your opinion most accurately. All questions should be answered.
To answer questions 1 to 4, think about the way you normally learn. s
tro
ng
ly a
gre
e
agre
e
dis
agre
e
str
ong
ly
dis
agre
e
1. I learn through reading a printed or written text.
1 2 3 4
Q1
2. I learn through listening (e.g. to a lecture).
1 2 3 4
Q2
3. I learn when I am active (e.g. when I highlight, underline, summarise).
1 2 3 4
Q3
4. I learn by using visual elements (e.g. maps, graphs, pictures).
1 2 3 4
Q4
Extended Programme Extended Programme Extended Programme

114
5. I have used visual aids, such as the one shown here, before.
yes 1
no 2
Q5
6. The visual aid that I used helped me to MEMORISE the work.
yes (if you used
visual aids and they helped you
to memorise work)
1
no (if you used
visual aids but they did NOT help you to memorise
work) 2
not applicable (if you have never used visual aids)
3
Q6
7. The visual aid I used helped me to UNDERSTAND the work.
yes (if you used
visual aids and they helped you to understand
the work)
1
no (if you used
visual aids but they did NOT help you to
understand the work)
2
not applicable (if you have never used visual aids)
3
Q7
8. Is there any further comment you would like to make about the advantages and disadvantages of using visual elements in academic work? ________________________________________________________________________________________________________________________________________________________________________________________________________________________________________________________________________________________________________________

115
Personal information
9. Name and surname
Q9
10. Student number
Q10
11. Group
BCom 1
BSc 2
Q11
12. Gender
male 1
female 2
Q12
13. Name of the high school attended
Q13
14. Town/ city where school is situated
Q14
15. Had Accounting as a school subject
Yes 1
No 2
Q15
16. Home Language 1
En
glis
h
2 A
frik
aan
s
3 S
epe
di
4 O
ther
So
uth
Afr
ica
n
5 O
ther
Afr
ica
n
6 O
ther
Q16
17. Level of English in Grade 12
English Home Language
1
English First Additional Language
2
Q17
18. Symbol received for English in final exams A (7)
B (6)
C (5)
D (4)
E (3) F (2) Q18
19. Symbol received for Maths in final exams A (7)
B (6)
C (5)
D (4)
E (3) F (2) Q19
20. Final AP score gained Q20
Thank you for filling in the questionnaire.

116
Appendix B
Post-intervention questionnaire: Experience of concept mapping
Dear student Thank you for your willingness to contribute data that will help us to find new ways to improve conceptual understanding. When filling in the questionnaire, please note that there are no right or wrong answers since you are giving a personal opinion. Your responses will remain anonymous, and there are no disadvantages involved in completing the questionnaire.
Respondent number Q0
Please tick (using an X) the number that reflects your opinion most accurately. All questions must be answered.
str
ongly
agre
e
agre
e
dis
agre
e
str
ongly
dis
agre
e
1. I like Accounting.
1 2 3 4
Q1
2. I find concept mapping easy to use.
1 2 3 4
Q2
3. Concept mapping helped me to better UNDERSTAND the Accounting concepts.
1 2 3 4
Q3
4. Concept mapping made it easier to REMEMBER information.
1 2 3 4
Q4
5. Concept mapping
helped to identify MISCONCEPTIONS I had about a topic.
1 2 3 4
Q5
6. I will use concept mapping again.
1 2 3 4
Q6
Extended Programme

117
7. I liked using concept mapping.
1 2 3 4
Q7
8. I would be able to use concept mapping in my other subjects.
1 2 3 4
Q8
9. I like being at the Mamelodi campus.
1 2 3 4
Q9
10. Which two aspects did you like most about concept mapping? _______________________________________________________________________________
_______________________________________________________________________________
_______________________________________________________________________________
___________________________________________________________________
11. Which two aspects did you like least about concept mapping? _______________________________________________________________________________
_______________________________________________________________________________
_______________________________________________________________________________
___________________________________________________________________
12. Is there anything further you would like to add about concept mapping? _______________________________________________________________________________
_______________________________________________________________________________
_______________________________________________________________________________
___________________________________________________________________
Personal information
13. Name and surname
Q13
14. Student number
Q14
15. Group
BCom BSc Q15
Thank you for filling in the questionnaire.
118
Appendix C
Dear student participant INFORMATION AND CONSENT
The University of Pretoria is constantly endeavouring to find innovative ways of enhancing the learning experience for students and of improving student success. In this regard, research indicates that concept literacy, which refers to the meaning of words used in specific subjects, is of vital importance in obtaining success in a subject. A solution to the problem of concept literacy attainment might be the use of a technique, known as concept mapping, which was specifically designed to address this issue. The purpose of the research in which we would like you to participate is to investigate whether concept mapping does indeed support concept literacy. The research will consist of two paragraphs written in class. Furthermore, the test group will complete concept maps in class. You will not be disadvantaged in any way by participating in this research. The data will be reported anonymously in a Master’s degree, and possible in academic articles and papers at academic conferences. The data gathered will be kept confidential and only the researchers involved in this project will have access to it. You may decline to participate in or withdraw at any time from this study, without any consequences. By signing this form, you declare that you are fully informed of the purpose of the research and give permission that: 1. data obtained from this study may be reported in a Master’s thesis, academic articles and papers at academic conferences without identifying you as an individual; and 2. your academic record (including your performance at school), as well as any other relevant data, may be made available for this study. Please show your willingness to participate by signing and dating this consent form. I agree to participate in the study on condition that my name is not used. My responses may be used anonymously in academic publications, provided that ethical clearance is obtained from the Ethics Committee of the Faculty of Humanities. Participant __________________________________ ____________________________________ (name) (signature) Date _________________________
Extended Programme

119
Appendix D
Maths students' pre-intervention questionnaire qualitative responses
Question 8: Is there any further comment you would like to make about the advantages and disadvantages of using visual elements in academic work?
The visual aid helps us to grab information much quicker.
No, because I have never used visual aids.
I do not have an idea, because I have never used it before.
The usage of usual elements is crucial for highlighting and giving a clear summary of all the important work you need to know, it is very efficient.
I find visual elements to be quite useful. They help me in understanding abstract academic ideas and understanding work means you have to memorise less, which is good news to me cause I have a short memory.
They help you understand key concepts of a particular module.
I will start using visual aids and see whether it can help me to memorise.
Visual aids help to summarise and visualise the work which is good for anyone.
No comment.
One of the advantages of using elements is that they are efficient and less time consuming when studying since notes are summarised and makes it easier to grasp. (Though I have not yet used them). No Disadvantage.
Visual aids are very important for summarising and easy to read; however, the downside to it is that they tend to leave out valuable information.
The advantages for me is the fact that I get a clear picture of what am learning about in a way that it makes sense. I mostly prefer learning through videos because sometimes lecturers don't cover all the work. For me I don't see any disadvantage in learning with visual elements.
It all depends on the type of person. But I personally failed to use them correctly or did not know how to use it correctly.
I think visual elements should be mostly used as well, since some of us learn better with visuals. Actual visual element should be used in same way as lecturing since communicates in different ways.
They help very much.
The advantage is that the diagram has the summarised information about the certain chapter or theory. Disadvantage is that the diagram or visual aid has not enough information, this means one must refer back to notes for theory.
Visual elements help me grasp work faster since I am a visual learner.
Disadvantage. They are sometimes unclear, then we answer according to what we think the visual element might be presenting. They make one's life difficult.
Visual elements help your brain to be able to remember information and summarises information. They help you understand how different information relate with each other. You might have a problem when writing an essay in constructing sentences or paragraph, this will take time to do since you are used to writing keywords/phrases instead of complete sentences.
Visual aids have helped me study better as I have a photographic memory so it is easier for me to remember stuff by trying to locate where it is in my book and what colour I used to highlight it.
Never used visual aids.
People are different hence have different study methods. For me visual elements does not benefit me much in memorising the work; however, it does help me to understand the work better.

120
I use visual elements, because it helps me to link difficult concepts to pictures. These pictures is a representation of the difficult term/concept and it makes it easier for me to memorise it (study it).
The advantage is that it makes it easier to learn and study it hence making it more memorable.
I think visual elements help us to learn things/work easier as it attracts interests our minds.
No.
No comment.
No.
Not sure, since I have not tried it before.
I would like to find visual aids that help me to understand things in subjects like business studies rather than just helping me memorise.
The advantage of using a visual element in academic work is that it helps you know more about what you are learning and gives you more information and in some instances it helps you to remember valuable info.
Advantage: It is much simpler to construct a visual aid. Disadvantage: Visual aids can be confusing.
I don't use visual aids because they disadvantage me when it comes knowing recalling the words I come across in the book.
Sometimes they are complicated and you have less information available.
Visual elements also give you a guideline on how to approach the work.
121
Appendix E
BCom students' pre-intervention questionnaire qualitative responses
Question 8: Is there any further comment you would like to make about the advantages and disadvantages of using visual elements in academic work?
No
I feel that visual elements cannot sometimes be used for other modules like FRK. I haven't used it because I do not think I need to summarise numbers in order to understand but would love to try it might help.
I don't find visual aids helpful.
Sometimes not all the work that is required to study is in the visual aid,
Visual aids can be confusing sometimes. It does not always include all the important points.
No.
When I write everything down I learn much more than just reading the work.
Using colour and visual aids helps me remember and understand my work thoroughly.
No comment.
Visual aids tend to be a cluster of information.
I think using visual elements should be someone's own choice since we all have a different way of learning and understanding things.
If used effectively it is a great way to study and prepare for tests.
Advantages is probably that it summarises the work quickly. But, the disadvantage is that it leaves out some facts and some subjects like maths, you cannot apply it.
If the visual aid is too summarised, then you end up not understanding. The keywords used are sometimes irrelevant.
I find learning on paper and listening to a lecturer more effective and helpful.
The advantage is that you take information visual, therefore you will remember. The disadvantage is that you may mix up elements.
No
No
No.
They are not useful to me.
The advantages of visual aids are that they are easy to interpret but hard to understand. Visual aids only display important elements. Disadvantages are that it doesn't show all important information.
As a student, I prefer to make ………….study methods, that don't contain visual aids.
Advantages: you can put everything under one paragraph. I use v/a for images and sub-headings of images which is effective. However, I prefer bullets which is more detailed than v/e.
When using v/a sometimes if you're photographic memory person it works very well as you remember the picture of the v/a when writing a test. The only disadvantage is that you cannot learn from someone else's v/a eg. mindmap because you will not understand what is going on
No
V/a and their impact depends on the type of module I am working in. For example, it would not help in WTW as just looking at the work will not make you understand. It is useful for study or memorising work. For example, OBS where facts must be studied.
No comment.
Disadvantage is that is time-confusing.

122
No
Using visual aids makes me understand, grasp the work quicker as they summarise the work.
The advantage of a v/a to me was that info I would put to paper would stay for quite a long time unlike just writing whole story and the disadvantage I encountered was that if I forget one element from that particular v/a, it means everything will go wrong and this will mess up all my answers.
No
Advantage - Makes academic information accessible. Disadvantage - We be lazy.
Conceptual learning is needed more regularly for subjects such as OBS133, LST133, AIM111 & various other subjects with more written content. Although FRK, WTW & WST do require conceptual learning, repetition and practice is what's mainly required to master various concepts.
None
I feel that when I use study methods, I'm only memorising some key points and not actually understanding the work.
Adding colour to visual elements, also helps me remember the work.
Advantages = easy summarised. Disadvantages = need to be explained how it flows.
Visual elements makes it easy for one to remember the concepts during examinations or tests.
No.
I would suggest that during lectures we do questions that are tricky, because some of us is for the first time doing accounting.
Visual aids actually help us as students to see what exactly is the topic talking about and what is required for us to know and learn effectively.
The advantages of using visual elements is that in the process of writing an exam or test you can visualise what it is that you studied.
They help with memorisation but not understanding the work..
No. I think they help me understand everything better.
Visual aids provide a framework that I can later apply to different problems in the subject.
It depends on what subject/ module you use it for.
They help you to understand the subject better.
Advantage - it helps other students to interpret information easily while on the other hand it can be confusing to other students because there will be a lot going on the visual aid.
The advantages of using visual elements is that you would get to understand the work more than using paragraphs.
Visual aids can only be used to a certain extent. With respect to FRK visual aids are applicable in some learning areas, but others cannot be earned using visual aids, such as learning fundamental concepts.
No
By using v/a combined with power studying which is a method of studying formally developed by Darren Penheim. This includes journeys, abbreviations and visual elements to memorise a lot more work in a shorter period of time and with a much longer retention span.

123
Appendix F
Test group (BCom) students' post-intervention questionnaire qualitative responses
Question 10: Which two aspects did you like most about concept mapping?
Question 11: Which two aspects did you like least about concept mapping?
Question 12: Is there anything further you would like to add about concept mapping?
It helped me to remember concepts quicker. It made it easy for me to understand.
I don't like any. I can't remember.
Working with a classmate to figure out the answers. It joins the dots is I were to fill one out after studying a topic.
We can't keep the maps. I feel it doesn't help because I can't over it. Don't think I learn best this way (too much going on).
It makes the concepts about accounting easy and it makes it more simple to understand accounting.
For me everything is perfect the way it is because it covers everything I've learned so far
Easy to use. A lot of info in fewer words.
It is very easy to read and understand since everything is structured accurately and helps to remember some of it if you constantly practice or look at it.
Nothing unless is it's a chapter that I do not understand it becomes hard for me to know what which is.
It's very good and will take some getting used to.
This is how it tells me that the information is derived from this manner.
Drawing the actual map.
I liked how c/m outlines important/key points of topic. It made it clearer to understand and see how different sections connect with each other.
Made me understand the work better and I have a good accounting partner who helped me understand
I enjoyed filling in missing words which helped me to realise that I do remember things that I have studied. It was easy to use & clear as well.
Nothing.
It shows how ideas are linked; I summarised the w+AQ17:AR17ork on one page
Personally, I felt there was too much information on one page; I couldn't concentrate on one idea; It takes me a while to understand and why the ideas are linked
Makes things clear. Is easy to understand.
Save time. Make student happy if they doing accounting.
Nothing.
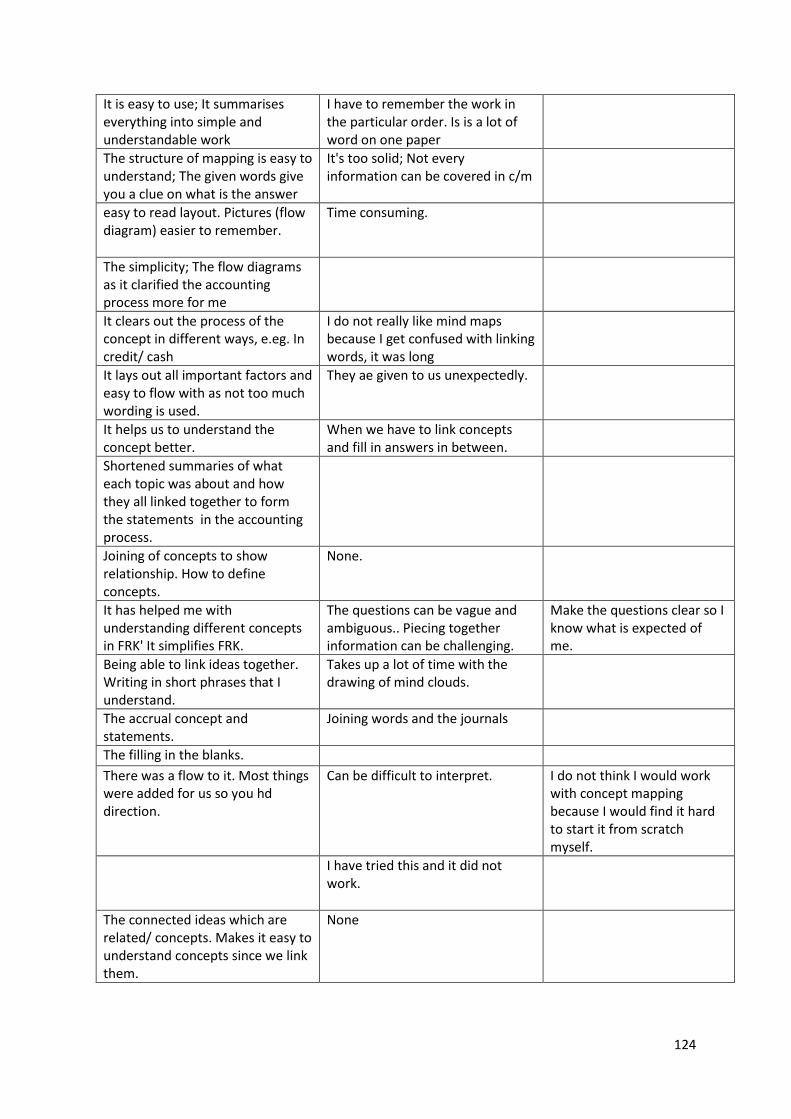
124
It is easy to use; It summarises everything into simple and understandable work
I have to remember the work in the particular order. Is is a lot of word on one paper
The structure of mapping is easy to understand; The given words give you a clue on what is the answer
It's too solid; Not every information can be covered in c/m
easy to read layout. Pictures (flow diagram) easier to remember.
Time consuming.
The simplicity; The flow diagrams as it clarified the accounting process more for me
It clears out the process of the concept in different ways, e.eg. In credit/ cash
I do not really like mind maps because I get confused with linking words, it was long
It lays out all important factors and easy to flow with as not too much wording is used.
They ae given to us unexpectedly.
It helps us to understand the concept better.
When we have to link concepts and fill in answers in between.
Shortened summaries of what each topic was about and how they all linked together to form the statements in the accounting process.
Joining of concepts to show relationship. How to define concepts.
None.
It has helped me with understanding different concepts in FRK' It simplifies FRK.
The questions can be vague and ambiguous.. Piecing together information can be challenging.
Make the questions clear so I know what is expected of me.
Being able to link ideas together. Writing in short phrases that I understand.
Takes up a lot of time with the drawing of mind clouds.
The accrual concept and statements.
Joining words and the journals
The filling in the blanks.
There was a flow to it. Most things were added for us so you hd direction.
Can be difficult to interpret. I do not think I would work with concept mapping because I would find it hard to start it from scratch myself.
I have tried this and it did not work.
The connected ideas which are related/ concepts. Makes it easy to understand concepts since we link them.
None

125
One is able to make connections about the different concepts. It makes it easier to understand accounting.
It is too much administration. It takes my time and effort.
It is easier to understand. One is able to remember facts.
If you missing one word the whole kind of loses meaning. It may sometimes be time consuming.
It gets straight to the point. Sum up everything on one page - leaves room for mental stimulation.
It is summarised easily; It is easy to follow.
At times there is not enough information; May be ambiguous.
The part where you fill in the blocks.
When we had to fill in the empty spaces.
The diagram only I don't understand it.
It is clear. It can be interpreted. A lot of information (unrelevant information).
It helped me understand the accounting procedures in that topic. It helped me remember the information easier
C/m did not help me to identify misconceptions I had about the topic
Helps to reinforce information. Concept mapping is too spread out for me, the information is everywhere.
The easy about which makes it better to read and understand. It summarises the work very coherently.
That everything is grouped under categories and the subheadings, information flows down, in the right category which makes it easier to understand.
That everything is clear and much shorter than reading it out from the text book.
If you do not know your work, it can get very confusing. Some concepts are not explained in detail.
The fact that concept of work is laid out in detail but in a way it is summarised so you are able to identify and remember concepts better.
There was nothing I didn't like. The concept of mapping assists me in studying so I find it effective.
No there is nothing I would like to add.
It has a lot of clues, so it makes it easier to fill out missing information.
It is just not how I prefer learning my school work. It takes up a lot of space.
None
The drawing of the concept mapping.
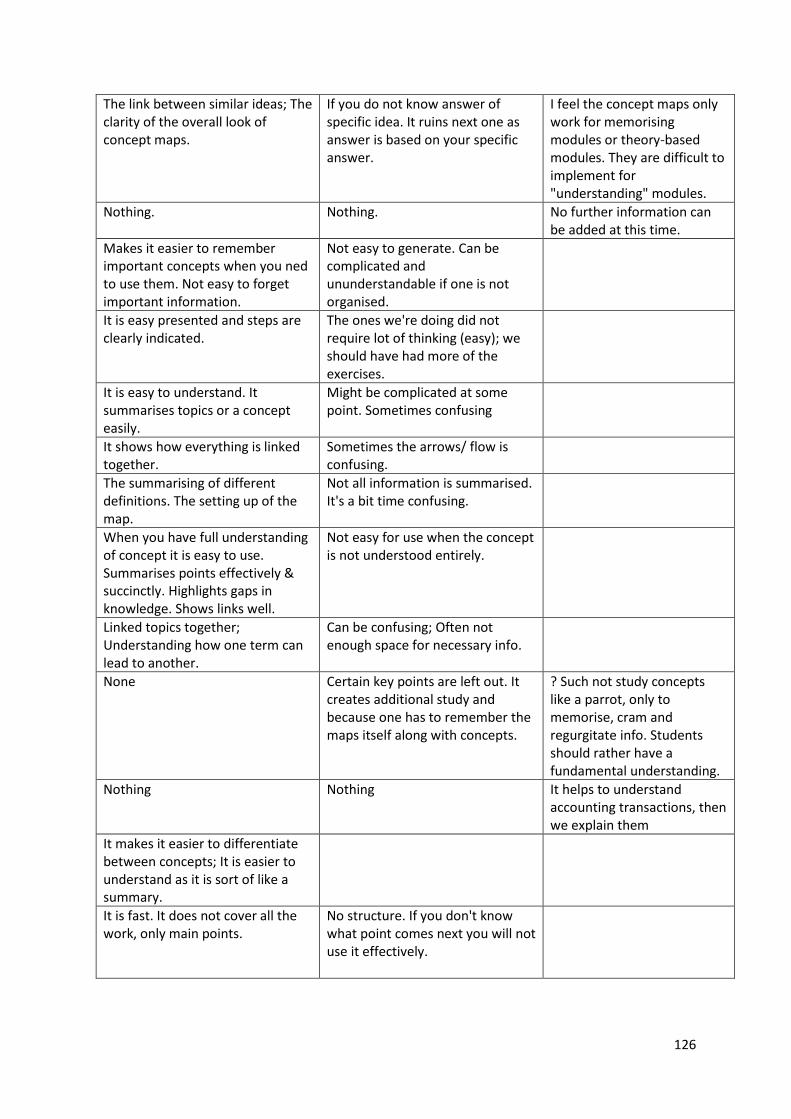
126
The link between similar ideas; The clarity of the overall look of concept maps.
If you do not know answer of specific idea. It ruins next one as answer is based on your specific answer.
I feel the concept maps only work for memorising modules or theory-based modules. They are difficult to implement for "understanding" modules.
Nothing. Nothing. No further information can be added at this time.
Makes it easier to remember important concepts when you ned to use them. Not easy to forget important information.
Not easy to generate. Can be complicated and ununderstandable if one is not organised.
It is easy presented and steps are clearly indicated.
The ones we're doing did not require lot of thinking (easy); we should have had more of the exercises.
It is easy to understand. It summarises topics or a concept easily.
Might be complicated at some point. Sometimes confusing
It shows how everything is linked together.
Sometimes the arrows/ flow is confusing.
The summarising of different definitions. The setting up of the map.
Not all information is summarised. It's a bit time confusing.
When you have full understanding of concept it is easy to use. Summarises points effectively & succinctly. Highlights gaps in knowledge. Shows links well.
Not easy for use when the concept is not understood entirely.
Linked topics together; Understanding how one term can lead to another.
Can be confusing; Often not enough space for necessary info.
None Certain key points are left out. It creates additional study and because one has to remember the maps itself along with concepts.
? Such not study concepts like a parrot, only to memorise, cram and regurgitate info. Students should rather have a fundamental understanding.
Nothing Nothing It helps to understand accounting transactions, then we explain them
It makes it easier to differentiate between concepts; It is easier to understand as it is sort of like a summary.
It is fast. It does not cover all the work, only main points.
No structure. If you don't know what point comes next you will not use it effectively.

127
The linking of the topics; Everything is summarised effectively.
Can be tricky to understand; Needs to be explained first before understand.
How can it be applied to number or amounts, whether it will be recorded in this journal and be posted under which account on general journal.
It is easy to memorise; it can be understood
Time wasting; require drawing
Orderly fashion it is done in. Enabled you to follow better.
It summarises the work in a way that is easy to understand. It is a fast way to learn when you need to.
I do not always know what I need to put where. To do your own concept map is harder that to get one from someone.
Could we get the concept maps back to study from.
None as there are many things going on in the mapping.
Concept mapping is not for me.
They summarise the whole work. It is easy to interpreted and understand work.
Filling in empty spaces
It shows me how difficult concepts connect and come together, it also reveales some of the things I did noy understand.
Sometimes finding it difficult what exactly is needed for me to fill in.
Keywords are used meaning it is easy to grasp and remember the specific topic being addressed
The fact that it was in black and white the use of colour would be great
Visual representation would be quite helpful and much more easier to remember. Use of colour
I could learn from it when it was completely filled.
Some things sounded similar so it was confusing. Natural flow of map can be difficult to comprehend if concept wasn't initially understood fully
It allowed me to identify and correct all the concepts I had problems remembering.
It was very confusing at first.
Explanation of connection of different concepts of topic. Brief and to the point points that were easy to remember.
None. Colour codes to show steps for answering questions for example: green: step 1 for definition, yellow for analysis.
It helps one remember when the work follows. It is helpful tool for accounting concepts.
If you don't understand the first part of the mapping it will be harder to understand the rest of it.
It is a great tool for understanding.
Less information. It is in stages/steps.
It seems complicated. Not so accurate.
Firstly c/m shows you relationship between concepts; Secondly, c/m shows you how different concepts yields one or more other concepts.
C/m had lot of concepts in it. It was busy.
C/m is really good for understanding of the relationship of concepts and how different concepts are connected in graphical sense, because people learn and

128
remembers fast with imaging.
It mostly deals with key words. The diagram is easy to remember.
None.
I liked how you could visually see how certain concepts here linked and how they are broken down. I also liked looking at the bigger picture.
Some parts of map are not appealing to eye, so already I'm not interested. The c/m doesn't consist of practical examples to illustrate each concept.
The fact that it shows you essence of topic. The fact that it is easy to understand and it shows the complete picture of topic.
Sometimes misses critical concepts or info that you cannot add because of space.
It puts information into visual diagrams which makes it easier to understand. Links different concepts and you are able to see exactly how they are linked and how they fir together.
We are not allowed to keep the maps and study from them at home.
It summarises information. Makes it easier to read
It is a little bit confusing. It is not clear enough.
Having to think of words I don't have in my head is hard (challenging). It's interesting to look at.
Made me feel stupid. Some terms I couldn't find.
Visual representation of information and simplified information.
I like all aspects.
It helps in the summarisation of information. It makes studying any theory-based module much easier to understand.
It simplifies the theory. I do not learn well using flowcharts.
I found it confusing and hard to understand so I did not the map

129
Appendix G

130

131

132
Appendix H

133
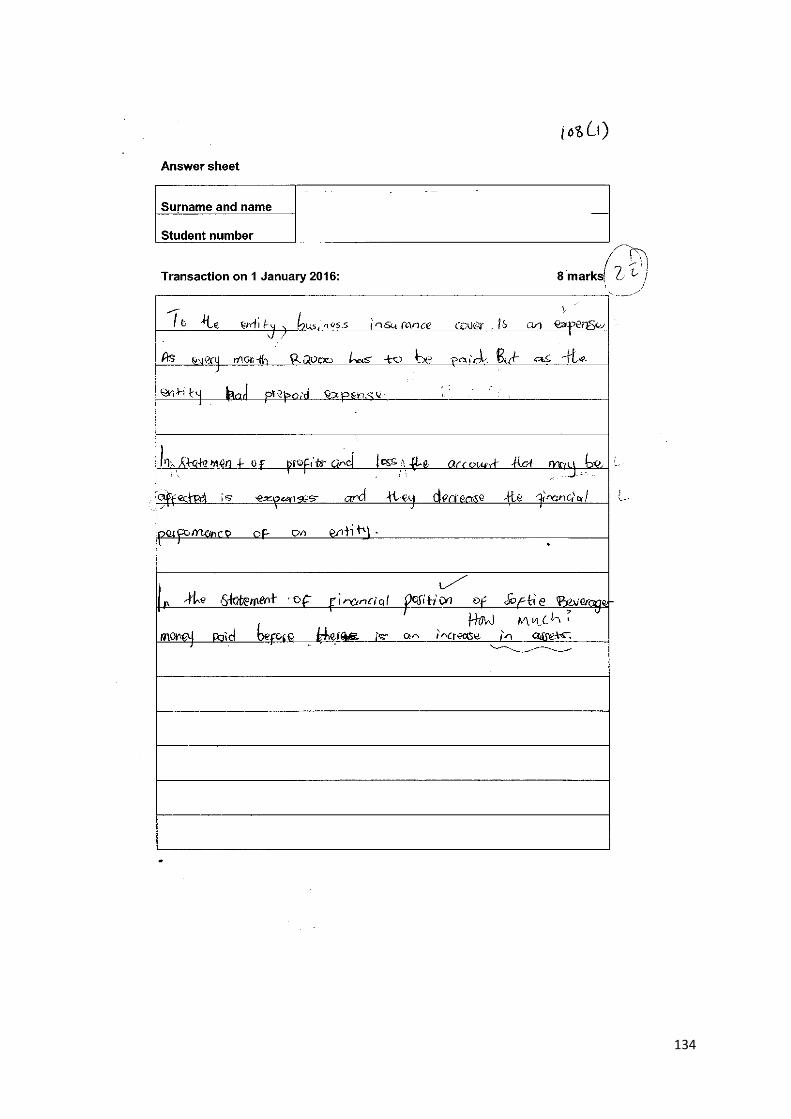
134
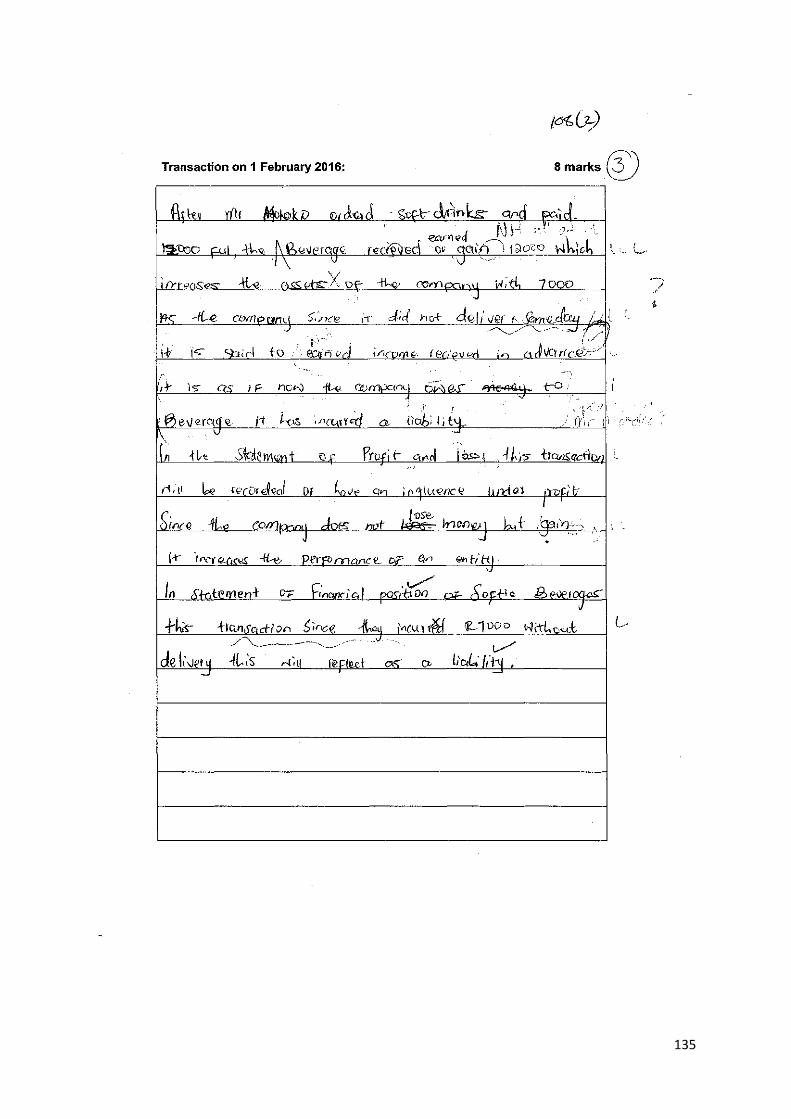
135

136
Appendix I
Table showing comparison of language distribution between test and control group
English Afrikaans Sepedi
Other
South African
Other
African
Test 10 3 17 38 3
Control 1 1 11 20 1
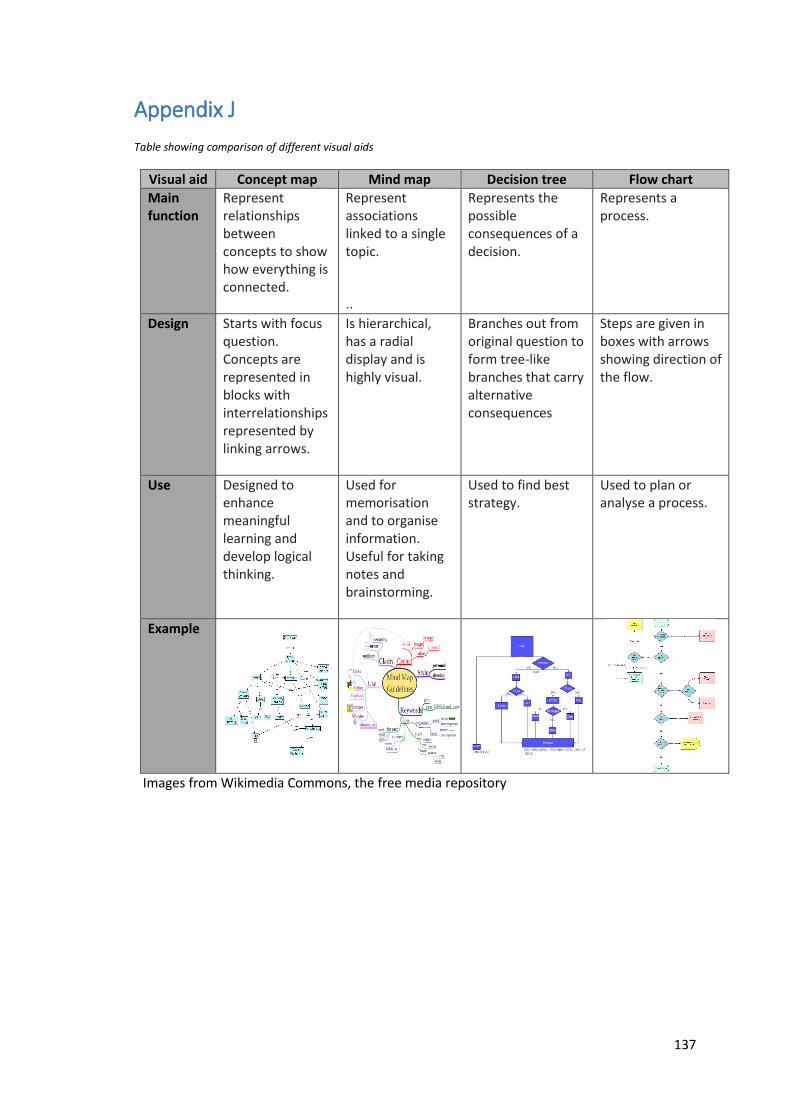
137
Appendix J
Table showing comparison of different visual aids
Visual aid Concept map Mind map Decision tree Flow chart
Main function
Represent relationships between concepts to show how everything is connected.
Represent associations linked to a single topic. ..
Represents the possible consequences of a decision.
Represents a process.
Design Starts with focus question. Concepts are represented in blocks with interrelationships represented by linking arrows.
Is hierarchical, has a radial display and is highly visual.
Branches out from original question to form tree-like branches that carry alternative consequences
Steps are given in boxes with arrows showing direction of the flow.
Use Designed to enhance meaningful learning and develop logical thinking.
Used for memorisation and to organise information. Useful for taking notes and brainstorming.
Used to find best strategy.
Used to plan or analyse a process.
Example
Images from Wikimedia Commons, the free media repository