concept of bio-mapping of rivers - cpcb enviscpcbenvis.nic.in/cpcb_newsletter/bio mapping of...
TRANSCRIPT

Central Pollution Control Board
http://cpcbenvis.nic.in/newsletter/bio-mapping-march1999/march1999.htm[11/29/2013 3:11:09 PM]
Concept of Bio-Mapping of RiversBio-Mapping of RiversInclusion of Biological Parameters for Bio-MappingCPCB Initiative for Bio-Mapping of River Basins in IndiaMethodology for Bio-MappingWater Quality Criteria (WQC) for Evaluation of Water BodiesBiological Water Quality Criteria (BWQC)River BasinsBio-Mapping of River Basin - A Case Study on River Yamuna

Central Pollution Control Board
http://cpcbenvis.nic.in/newsletter/bio-mapping-march1999/mar99edi.htm[11/29/2013 3:11:26 PM]
Contents
Archives
Home
Water quality mapping of rivers in India is a measure to identify the reaches where the gapbetween the desired and the existing water quality is significant, to warrant pollution controlmeasures. However, the existing management system is not enough to link the desiredquality level to the water quality level for various designated-best-use. In western countries,such as Federal Republic of Germany, the maps based on bio-monitoring have proved as apowerful tool for preparation of action plan for control of pollution and for improvement ofwater quality of rivers. The Central Pollution Control Board has taken up a project to utilizethe bio-monitoring data of rivers to evolve a bio-map of entire stretches of river basins inIndia.
In this issue of PARIVESH Newsletter the methodology of biological classification ofvarious stretches of river basins has been presented. The information for the issue has beencollected, compiled and collated by Dr.(Mrs.) Pratima Akolkar, Sh. G. K. Ahuja, Dr. C. S.Sharma and Ms. Chetna Kohli under supervision of Dr. S. D. Makhijani.
Dilip Biswas
Chairman,CPCB

Central Pollution Control Board
http://cpcbenvis.nic.in/newsletter/bio-mapping-march1999/march1999bio.htm[11/29/2013 3:11:35 PM]
Bio-Mapping of Rivers, March 1999
CONCEPT OF BIO-MAPPING OF RIVERS
Rivers have got very important place in Indian culture and tradition. They are the lifeline of majority of population incities, towns and villages and most of these are considered sacred. During festivals people take holy dip in rivers. Everyriver stretch has a distinct water use like bathing, drinking, municipal supply, navigation, irrigation and fishing.Simultaneously, it is also used as a receptacle for discharge of industrial effluent, municipal sewage and dumping of solidwastes. The Water (Prevention and Control of Pollution) Act, 1974 is aimed to support the water quality of variousdesignated best-uses of water bodies. The Water Quality Atlas of the Indian River System was prepared on the basis offive major uses of river water such as;
(a) Drinking water source without conventional treatment but after disinfection;
(b) Outdoor bathing organized;
(c) Drinking water source with conventional treatment followed by disinfection;
(d) Propagation of wild life, fisheries;
(e) Irrigation, industrial cooling, controlled waste disposal.
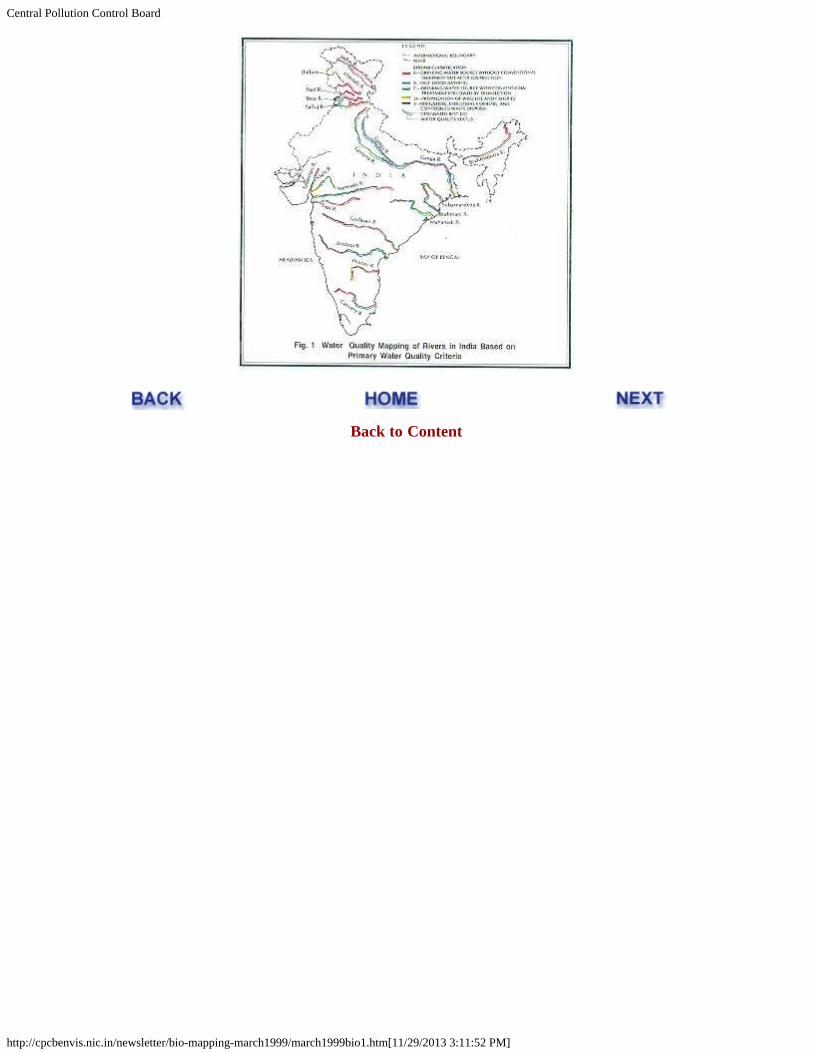
Thus, the concept of water quality mapping in India, has been initiated with the identification of beneficial uses of waterin terms of primary water quality criteria. For maintaining the quality of river water, the pollution levels in rivers havebeen detected by monitoring limited number of the physico-chemical parameters, which could only determine thechanges in chemical characteristics of water bodies. Deterioration in water quality, over the past several years hasgradually rendered the river water quality unsuitable for various beneficial purposes. Moreover, the objective of TheWater Act, 1974 is maintain and restore the wholesomeness of river water in terms of their ecological sustainability isincreasingly realized. The concept of bio-mapping originated from use of biological system as a biological water qualitycriteria. The concept of biomapping has been introduced by CPCB for the prediction and detection of ecological effectsand to protect rare and endangered biotic species surviving in surface water from evergrowing pollution problem.
Back to Content
Central Pollution Control Board
http://cpcbenvis.nic.in/newsletter/bio-mapping-march1999/march1999bio1.htm[11/29/2013 3:11:52 PM]
Bio-Mapping of Rivers, March 1999
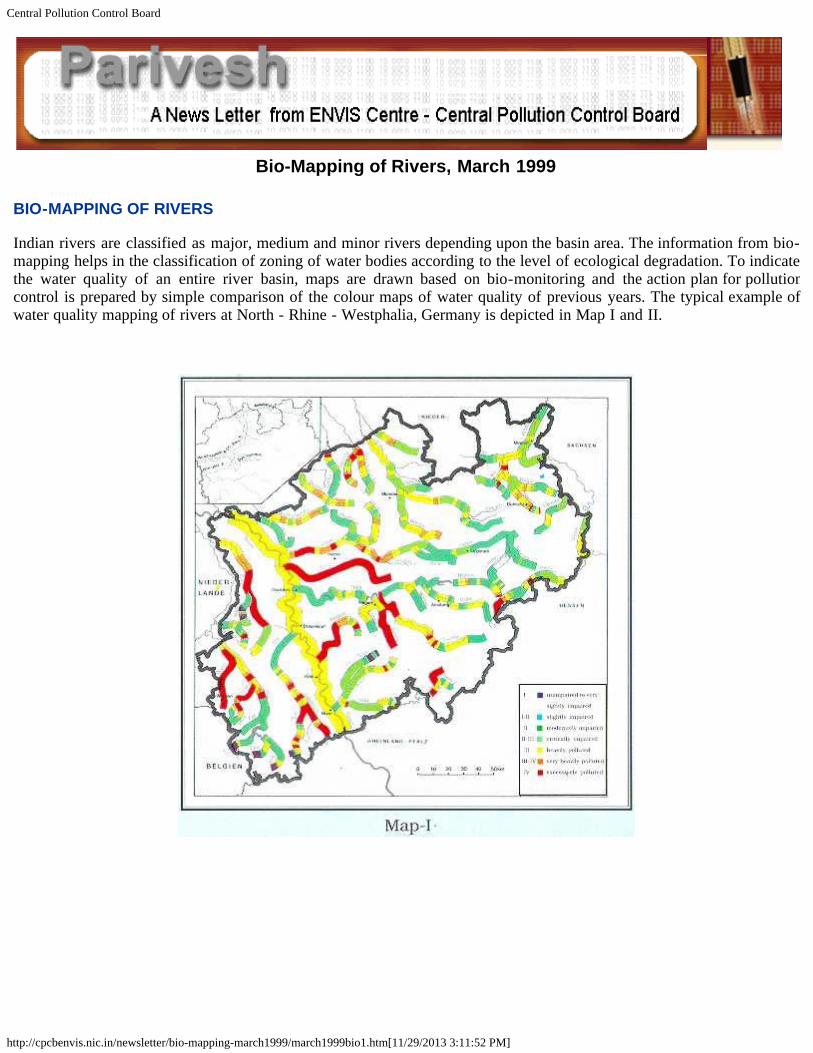
BIO-MAPPING OF RIVERS
Indian rivers are classified as major, medium and minor rivers depending upon the basin area. The information from bio-mapping helps in the classification of zoning of water bodies according to the level of ecological degradation. To indicatethe water quality of an entire river basin, maps are drawn based on bio-monitoring and the action plan for pollutioncontrol is prepared by simple comparison of the colour maps of water quality of previous years. The typical example ofwater quality mapping of rivers at North - Rhine - Westphalia, Germany is depicted in Map I and II.

Central Pollution Control Board
http://cpcbenvis.nic.in/newsletter/bio-mapping-march1999/march1999bio1.htm[11/29/2013 3:11:52 PM]
Bio-mapping is the technique of transformation of biological water quality information of a river basin in the form of acolour map. Different colours on a river basin map, such as blue, light blue, green, orange and red, indicate various waterquality classes in terms of clean, slight pollution, moderate pollution, heavy pollution and severe pollution of a waterbody respectively.
Monitoring of Rivers
The river water quality monitoring is most essential aspect of restoring the water quality. The Central Pollution ControlBoard (CPCB) has a nation-wide responsibility of water quality monitoring and management of rivers. The existingwater quality monitoring network in India includes 495 monitoring stations located in various water bodies all over thecountry. The water quality at these stations is monitored through three major schemes such as;
i) Global Environmental Monitoring System (GEMS) - 50 monitoring stations are operated.
ii) Monitoring of Indian National Aquatic Resources (MINARS) - 480 monitoring stations are operated.
iii) Yamuna Action Plan (YAP) - 15 monitoring stations are operated.
All these monitoring stations are distributed on various natural aquatic resources. In all 165 stations are located on major,medium and small rivers, 185 stations on tributaries and 71 stations are located on independent rivers. Other than rivers,the water quality network also covers the water quality monitoring of lakes on 35 locations, ground water sources at 24monitoring locations and 16 monitoring locations on other sources. The entire water quality monitoring is performedthrough State Pollution Control Boards, and CPCB zonal offices. At present the water quality monitoring is undertakenfor 23 physico-chemical parameters at monthly/quarterly interval.
Central Pollution Control Board
http://cpcbenvis.nic.in/newsletter/bio-mapping-march1999/march1999bio1.htm[11/29/2013 3:11:52 PM]
Back to Content
Central Pollution Control Board
http://cpcbenvis.nic.in/newsletter/bio-mapping-march1999/march1999bio2.htm[11/29/2013 3:12:04 PM]
Bio-Mapping of Rivers, March 1999
INCLUSION OF BIOLOGICAL PARAMETERS FOR BIO-MAPPING
The Central Pollution Control Board (CPCB) during the development and testing of bio-monitoring methodology incollaboration with Dutch experts has established that the inclusion of bio-monitoring parameters, apart from physico-chemical parameters, in water quality monitoring network will enhance the quality evaluation in a cost-effective manner.Among all the biotic components of river, the benthic macro-invertebrates have been considered as the most suitablebiological parameter for water quality evaluation due to the following facts:
The benthic macro-invertebrates are visible to unaided eye and are retained on a seive with a mesh size of 0.6 mmdiameter
Macro-invertebrates are inhabiting the different substratum of rivers, streams, lakes and other water bodies
Water bodies having different quality, support diverse macro-invertebrate communities
Their taxonomy is well developed
Demonstrate an integrated effect of pollution
Provide good experimental possibilities
Useful in assessing the impact of municipal, industrial and agricultural wastes
Community response is sensitive to organic loading, thermal impacts, substrate alterations and toxic pollution.
Back to Content
Central Pollution Control Board
http://cpcbenvis.nic.in/newsletter/bio-mapping-march1999/march1999bio3.htm[11/29/2013 3:12:25 PM]
Bio-Mapping of Rivers, March 1999
CPCBs INITIATIVE FOR BIO-MAPPING OF RIVER BASINS IN INDIA
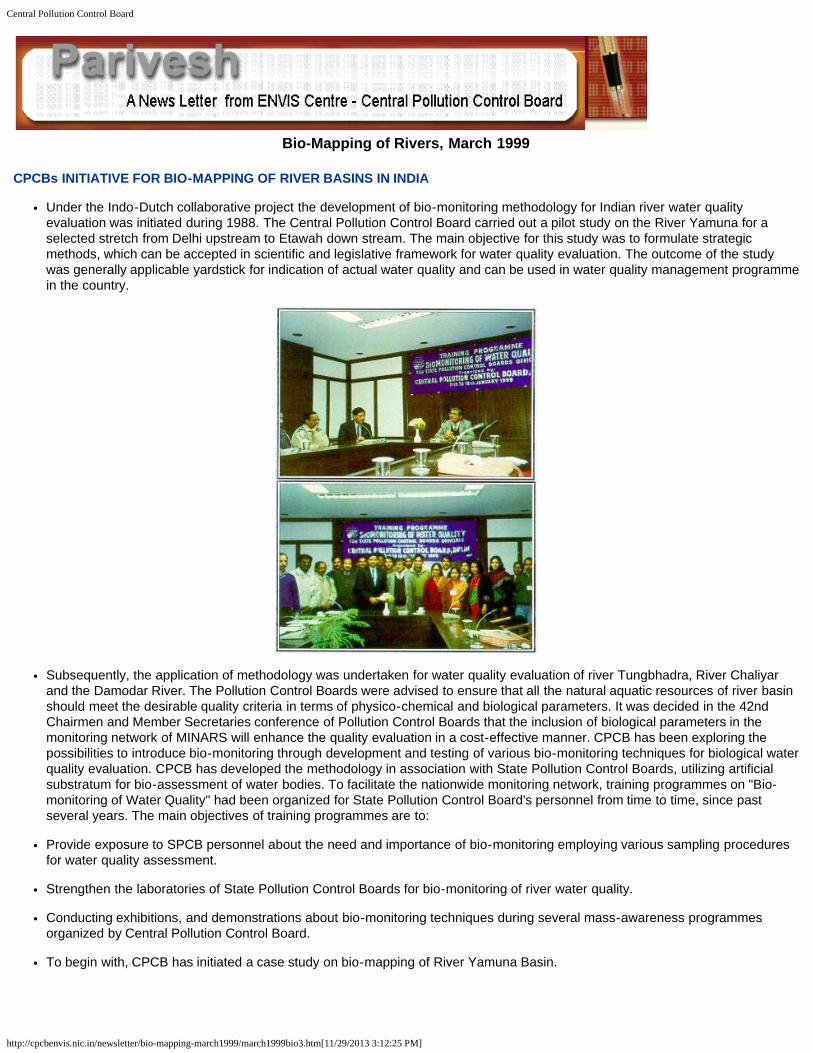
Under the Indo-Dutch collaborative project the development of bio-monitoring methodology for Indian river water qualityevaluation was initiated during 1988. The Central Pollution Control Board carried out a pilot study on the River Yamuna for aselected stretch from Delhi upstream to Etawah down stream. The main objective for this study was to formulate strategicmethods, which can be accepted in scientific and legislative framework for water quality evaluation. The outcome of the studywas generally applicable yardstick for indication of actual water quality and can be used in water quality management programmein the country.
Subsequently, the application of methodology was undertaken for water quality evaluation of river Tungbhadra, River Chaliyarand the Damodar River. The Pollution Control Boards were advised to ensure that all the natural aquatic resources of river basinshould meet the desirable quality criteria in terms of physico-chemical and biological parameters. It was decided in the 42ndChairmen and Member Secretaries conference of Pollution Control Boards that the inclusion of biological parameters in themonitoring network of MINARS will enhance the quality evaluation in a cost-effective manner. CPCB has been exploring thepossibilities to introduce bio-monitoring through development and testing of various bio-monitoring techniques for biological waterquality evaluation. CPCB has developed the methodology in association with State Pollution Control Boards, utilizing artificialsubstratum for bio-assessment of water bodies. To facilitate the nationwide monitoring network, training programmes on "Bio-monitoring of Water Quality" had been organized for State Pollution Control Board's personnel from time to time, since pastseveral years. The main objectives of training programmes are to:
Provide exposure to SPCB personnel about the need and importance of bio-monitoring employing various sampling proceduresfor water quality assessment.
Strengthen the laboratories of State Pollution Control Boards for bio-monitoring of river water quality.
Conducting exhibitions, and demonstrations about bio-monitoring techniques during several mass-awareness programmesorganized by Central Pollution Control Board.
To begin with, CPCB has initiated a case study on bio-mapping of River Yamuna Basin.
Central Pollution Control Board
http://cpcbenvis.nic.in/newsletter/bio-mapping-march1999/march1999bio3.htm[11/29/2013 3:12:25 PM]
Back to Content
Central Pollution Control Board
http://cpcbenvis.nic.in/newsletter/bio-mapping-march1999/march1999bio4.htm[11/29/2013 3:12:44 PM]
Bio-Mapping of Rivers, March 1999
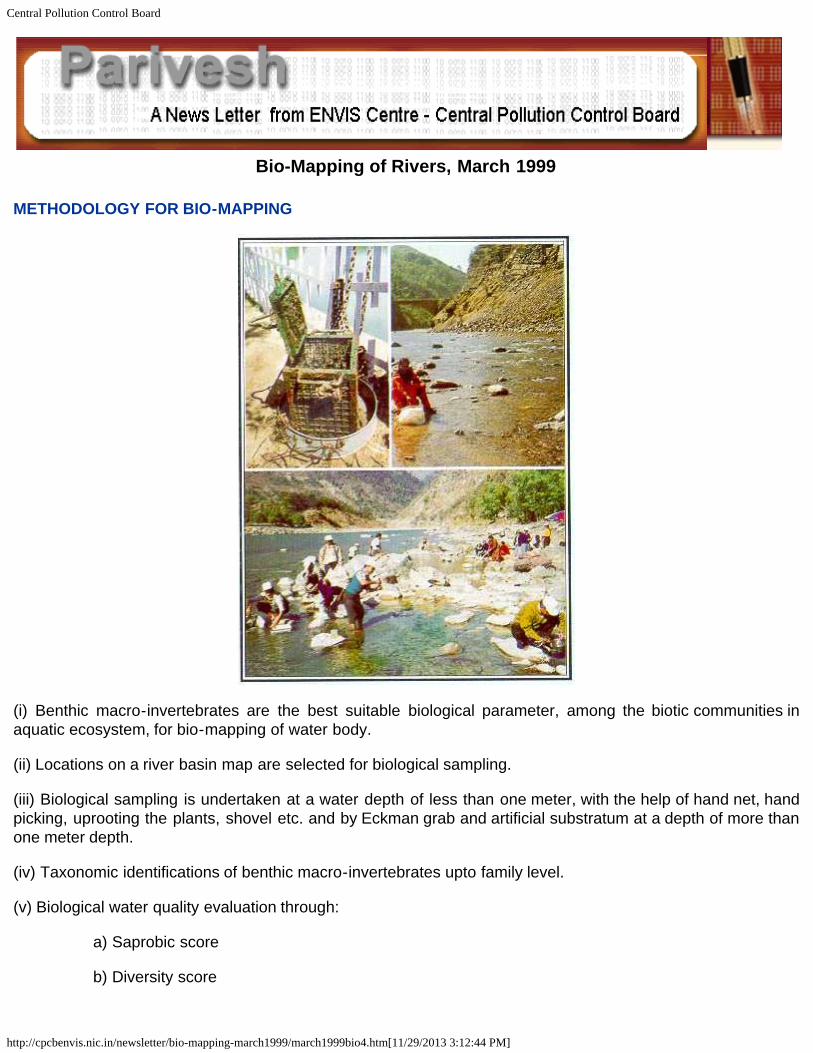
METHODOLOGY FOR BIO-MAPPING
(i) Benthic macro-invertebrates are the best suitable biological parameter, among the biotic communities inaquatic ecosystem, for bio-mapping of water body.
(ii) Locations on a river basin map are selected for biological sampling.
(iii) Biological sampling is undertaken at a water depth of less than one meter, with the help of hand net, handpicking, uprooting the plants, shovel etc. and by Eckman grab and artificial substratum at a depth of more thanone meter depth.
(iv) Taxonomic identifications of benthic macro-invertebrates upto family level.
(v) Biological water quality evaluation through:
a) Saprobic score
b) Diversity score

Central Pollution Control Board
http://cpcbenvis.nic.in/newsletter/bio-mapping-march1999/march1999bio4.htm[11/29/2013 3:12:44 PM]
(vi) Assigning the water quality class, to each sampling locations, with respect to combinations of saprobity anddiversity score of the biological sample using Biological Water Quality Criteria (BWQC).
(vii) Translating the biological water quality class of each location on river basin map into respective coloursassigned in Biological Water Quality Criteria (BWQC).
(viii) Preparation of the coloured Bio-map of entire river basin for identification of pollution control strategiesrationally.
Biological Water Quality Evaluation
Under the Indo-Dutch project on development of Bio-monitoring methodology, emphasis has been laid for adoption offollowing methods for biological water quality evaluation. These methods are complementary to each other for biologicalwater quality evaluation.
Saprobic score (BMWP)
This methodology the involves inventory of the presence of benthic macro-invertebrate fauna up to the family level withtaxonomic precision. All possible families having saprobic indicator value are classified on a score-scale of 1 to 10according to their preference for saprobic water quality. The saprobic scores of all the families are registered andaveraged to produce BMWP score.
Diversity Score (Sequential comparison)
The methodology involves pairwise comparison of sequentially encountered individuals and the difference of two benthicanimals can be observed up to the species level, where no taxonomic skill is required. The diversity is the ratio of thetotal number of different animals (runs) and the total number of organisms encountered. The ratio of diversity has a valuebetween 0 and 1.
Normally, high diversity of benthic animals always support a good quality of water. However, diversity alone can notindicate the overall health of water body. High and low diversity could be of tolerant, or sensitive animals to pollution.For biological water quality evaluation the diversity of benthic animals is compared with the saprobic score with the helpof Biological Water Quality Criteria (BWQC).
Back to Content

Central Pollution Control Board
http://cpcbenvis.nic.in/newsletter/bio-mapping-march1999/march1999bio5.htm[11/29/2013 3:12:52 PM]
Bio-Mapping of Rivers, March 1999
WATER QUALITY CRITERIA (WQC) FOR EVALUATION OF WATER BODIES
Primary Water Quality Criteria (PWQC)
Central Pollution Control Board has derived Primary Water Quality Criteria as required in the designated bestuses of river stretches (Table 1.a). Based on the long term water quality data generated over the years, 13heavily polluted and 26 medium polluted river stretches has been identified. The critical pollutants identified forthe polluted river stretches are dissolved oxygen, bio-chemical oxygen demand and total coliforms. In most ofthe rivers these parameters are not adequate to indicate the overall health of a water body. The bio-mapsbased on bio-assessment clearly depicts, the stretches where the deterioration of water quality has occurred,which envisage actions for improvement.
Outcome of primary water quality criteria
The Ganga Action Plan (GAP) was formulated and launched primarily to arrest degradation of river water qualityby a programme of interception, diversion and treatment of domestic sewage and prevention of toxic and industrialchemical wastes from identified grossly polluting industrial units/stations entering into the river.
The National River Action Plan (NRAP) has been conceived as larger plan to undertake pollution abatement in allthe polluted river stretches. Industrial units are being persuaded to adopt clean technologies, to install and operatethe treatment plants. 17 categories of major polluting industries were identified and targets were fixed to adoptpollution control measures.
Table 1.a Primary water quality criteria for various uses of fresh waters, as laid down by the Central Pollution Control Board
S.No.
Characteristics A* B* C* D* E*
1. Dissolved oxygen (DO), mg/l, Min. 6 5 4 4 -
2. Biochemical oxygen demand (BOD)mg/l, Max.
2 3 3 - -
3. Total coliform organism** MPN/100ml, Max.
50 500 5,000 - -
4. pH value 6.5-8.5 6.5-8.5 6-9 6.5-8.5
6.5-8.5
5. Free ammonia (as N), mg/l, Max - - - 1.2 -
6. Electrical conductivity, micromhos/cm,Max.
- - - - 2,250
Central Pollution Control Board
http://cpcbenvis.nic.in/newsletter/bio-mapping-march1999/march1999bio5.htm[11/29/2013 3:12:52 PM]
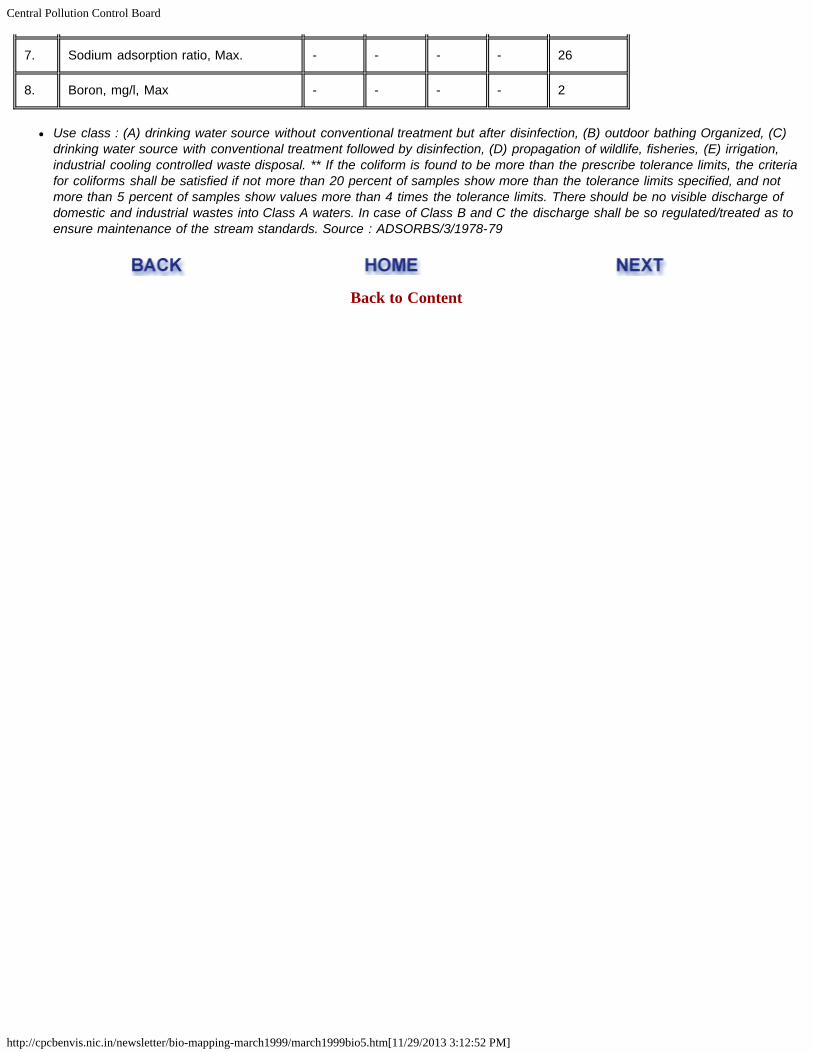
7. Sodium adsorption ratio, Max. - - - - 26
8. Boron, mg/l, Max - - - - 2
Use class : (A) drinking water source without conventional treatment but after disinfection, (B) outdoor bathing Organized, (C)drinking water source with conventional treatment followed by disinfection, (D) propagation of wildlife, fisheries, (E) irrigation,industrial cooling controlled waste disposal. ** If the coliform is found to be more than the prescribe tolerance limits, the criteriafor coliforms shall be satisfied if not more than 20 percent of samples show more than the tolerance limits specified, and notmore than 5 percent of samples show values more than 4 times the tolerance limits. There should be no visible discharge ofdomestic and industrial wastes into Class A waters. In case of Class B and C the discharge shall be so regulated/treated as toensure maintenance of the stream standards. Source : ADSORBS/3/1978-79
Back to Content

Central Pollution Control Board
http://cpcbenvis.nic.in/newsletter/bio-mapping-march1999/march1999bio6.htm[11/29/2013 3:12:59 PM]
Bio-Mapping of Rivers, March 1999
BIOLOGICAL WATER QUALITY CRITERIA (BWQC)
To assess the actual health of water bodies, CPCB has derived a Biological Water Quality Criteria (BWQC) for waterquality evaluation. This system is based on the range of saprobic values and diversity of the benthic macro-invertebratefamilies with respect to water quality. The system has been developed after extensive field trials and calibration on thesaprobity and diversity information of different taxonomic groups of benthic animals collected from artificial substratumand natural substratum of various water bodies. To indicate changes in water quality to different grades of pollutionlevel, the entire taxonomic groups, with their range of saprobic score from 1 to 10, in combination with the range ofdiversity score from 0 to 1 has been classified into five different classes of water quality (Table 1.b). The abnormalcombination of saprobic score and diversity score indicates sudden change in environmental conditions.
Table 1.b : Biological Water Quality Criteria (BWQC)
S.No
Taxonomic groups
Range ofsaprobicscore(BMWP)
Rangeofdiversity
score
Waterquality
characteristic
Waterqualityclass
Indicatorcolour
1. Ephemeroptera,Plecoptera,Trichoptera,Hemiptera, Diptera
7 andmore
0.2 - 1 Clean A Blue
2. Ephemeroptera,Plecoptera,Trichoptera,Hemiptera, Odonata,Diptera
6 - 7 0.5 - 1 Slightpollution
B Lightblue
3. Ephemeroptera,Plecoptera,Trichoptera,Hemiptera, Odonata,Crustacea, Mollusca,Polychaeta, Hemiptera,Coleoptera, Diptera,Hirudinea, Oligochaeta
3 - 6 0.3 - 0.9 Moderatepollution
C Green
4. Mollusca, Hemiptera,Coleoptera, Diptera,Oligochaeta
2 - 5 0.4 &less
Heavypollution
D Orange
5. Diptera, Oligochaeta 0 - 2 0 - 0.2 Severe E Red

Central Pollution Control Board
http://cpcbenvis.nic.in/newsletter/bio-mapping-march1999/march1999bio6.htm[11/29/2013 3:12:59 PM]
No animalsPollution
Application of Biological Water Quality Criteria (BWQC)
Bio-assessment of raw water at drinking water sources (clean water bodies)
Under this study, three water bodies were selected for Bio-assessment, which are the main raw water sources for drinkingwater supply in Delhi namely; Western Yamuna Canal (WJC), River Yamuna and Gang Canal. Water quality of GangCanal also represents the bathing water quality of River Ganga at Haridwar in U.P.

Central Pollution Control Board
http://cpcbenvis.nic.in/newsletter/bio-mapping-march1999/march1999bio6.htm[11/29/2013 3:12:59 PM]
The Western Yamuna Canal originates from Tajewalla head works in Haryana state and terminates in River Yamuna inDelhi state through Najafgarh Drain. There are two major sources of pollution of Western Yamuna Canal i.e. thedomestic and industrial waste water of Yamuna Nagar and Panipat in Haryana state.
Bio-assessment of water quality for irrigation, industrial cooling and controlled waste disposal (Polluted waterbodies)
Under this study River Yamuna and Agra Canal in Delhi stretch was selected for biological water quality assessment.
The polluted stretch of River Yamuna lies within city limits of Delhi downstream of Wazirabad barrage. After traversingabout 22 km, the river leaves Delhi at Okhla. There are 16 major drains, which discharge treated and untreated wastewater/sewage of Delhi and Haryana and from Uttar Pradesh through Hindon Canal into Yamuna between Wazirabad andOkhla. As a result, the river water quality between Wazirabad and Okhla lies in `E' class of Designated-best-use criteria(Table 2). The Agra canal originates from Okhla barrage down stream of Nizamuddin bridge. Agra canal is an irrigationcanal, and also receives the thermal discharges of Badarpur Thermal Power Plant. The Bio-assessment of water qualityindicate severe pollution in canal water.
Table 2 Physico-chemical and biological water quality of polluted stretch of river Yamuna and Agra canal
S.No.
Location
Water quality class Water quality(Biological)
Physico-chemical(PWQC)
Biological(BWQC)
1. Okhla barrage (River Yamuna) E E Severe Pollution
2. Inlet of BTPP at Agra Canal E E Severe Pollution
3. Mixing of BTPP outlet at AgraCanal
E E Severe Pollution
BTPP = Badarpur Thermal Power Plant
Back to Content
Central Pollution Control Board
http://cpcbenvis.nic.in/newsletter/bio-mapping-march1999/march1999bio7.htm[11/29/2013 3:13:09 PM]
Bio-Mapping of Rivers, March 1999
RIVER BASINS
A river during its course of flow has definite basin area. The basin area is the geographical extent in thee catchment ofthe river from where precipitator water joins the river. It includes tributaries and the drains. Indian rivers have beendivided into three categories depending upon basin area. Major rivers are those rivers which have basin area - 20,000 sqkm or more. The rivers having basin area between 2000 and 20000 sq km are grouped as medium rivers and rest riversare minor rivers. There are 13 major river basins and as a group, these basins cover 80% population and 85% of totalriver discharge. Among the 45 medium river basins, four are international and eleven are interstate river basins. A total of17 rivers having a combined basin area of 63500 sq km join, the Arabian sea, while remaining 24 rivers having acombined basin area of 210596 sq km, joins Bay of Bengal. The four rivers are originated in India but cross the nationalboundry, thus incorporate international river basin. Medium river basins occupy 8% of total basin area and about 119940million cubic meter water flows through these.
There are fifty five minor river basins having a combined basin area of about 2 lakh sq km. Most of these originate fromEastern and Western Ghats. The total area of minor basins is about 9% of total basin area of Indian rivers.
River Basin Pollution
With increasing population pressure and associated activities, the rivers are affected both in terms of water quality andquantity. The flowing water have significant self-purification capacity which self purify and diluted during course oftravel of river water to some distance. After the construction of a barrage or dam or development of irrigation canalnetwork on a river, downstream stretches of river does not get enough water. As a result the pollutants dischargedthrough several drains, sewage streams and effluents joining the rivers are not diluted. It affect the self purificationcapacity of the rivers and thus river stretches are polluted.
Back to Content

Central Pollution Control Board
http://cpcbenvis.nic.in/newsletter/bio-mapping-march1999/march1999bio8.htm[11/29/2013 3:13:31 PM]
Bio-Mapping of Rivers, March 1999
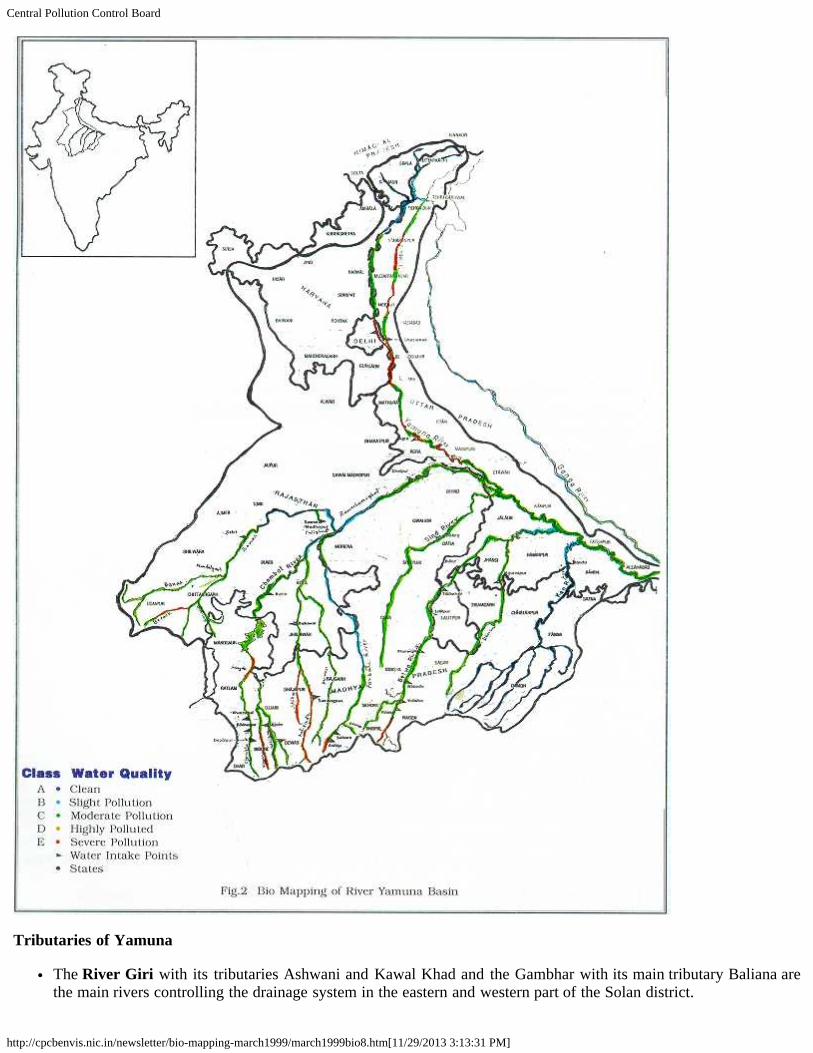
BIO-MAPPING OF RIVER BASIN - A CASE STUDY ON RIVER YAMUNA
River Yamuna is the largest tributary of River Ganga, which is considered sacred as per Hindon mythology among all therivers. Central Pollution Control Board has undertaken a case study on bio-mapping of entire River Yamuna basin basedyear long biological data.
River Yamuna
The main stream of the river Yamuna originated from the Yamunotri glacier near Bandar Punch in the Mussorie range oflower Himalayas in the district of Uttar Kashi in Uttar Pradesh. The Tons and Giri rivers are the important tributaries ofYamuna and principal source of water in mountaineous range. The river Yamuna traverse a route length of about 1200km in the plain from Saharanpur district of Uttar Pradesh to the confluence with river Ganga at Allahabad. The maintributaries joining in this reach include the Hindon from eastern bank and the Chambal, the Sind, Betwa and the Kenfrom south-western bank.
The catchment of the Yamuna river system covers parts of the states of Uttar Pradesh, Himachal Pradesh, Haryana,Rajasthan, Madhya Pradesh and the entire state of Delhi. Each one of these major tributaries in turn have its owntributary system.
Central Pollution Control Board
http://cpcbenvis.nic.in/newsletter/bio-mapping-march1999/march1999bio8.htm[11/29/2013 3:13:31 PM]
Tributaries of Yamuna
The River Giri with its tributaries Ashwani and Kawal Khad and the Gambhar with its main tributary Baliana arethe main rivers controlling the drainage system in the eastern and western part of the Solan district.

Central Pollution Control Board
http://cpcbenvis.nic.in/newsletter/bio-mapping-march1999/march1999bio8.htm[11/29/2013 3:13:31 PM]
The River Tons meets river Yamuna at Dakpathar in U.P.
River Hindon originates from Upstream of Saharanpur in U.P. and meets River Yamuna downstream Delhi atMazawali, Haryana.
River Chambal is most important occupying nearly half of the basin area of Yamuna. The Chambal contributes 5to 10 times more water to the Yamuna than its own flow in dry weather.
River Chambal originates from Bar Nagar (M.P.) and joins River Yamuna after Udi (U.P.) at Juhikha (U.P.). Fromits origin onwards tributaries, Khan and Kshipra join river Chambal before Nagada (M.P.).
Another main tributary of River Chambal is Kalisindh which gets additional water from tributary Parwan at Kota(Rajasthan). Subsequently, tributary Kalisindh joins river Chambal at down stream of Sawai Madhopur inRajasthan. Parbati is yet another important tributary of river Chambal which is fed by tributary Seven beforejoining of river Chambal at Datra (Palighat). Ultimately, tributary Banas joins River Chambal at Rameshwarghat(Rajasthan). Banas collects water from the sub-tributaries Bearch and Gambhiri before Chittaurgarh in Rajasthan.River Sindh is major tributary of river Chambal which originates from Vidisha (M.P.) and joins River Chambal atdownstream of Datia in U.P. very close to the confluence of Chambal river and river Yamuna.
River Betwa originates from the upstream of Mandideep (Bhopal, M.P.) and joins River Yamuna at the downstream of Hamirpur (M.P.).On its way from origin, river Dhasan from Sagar (M.P.) joins river Betwa atdownstream of Jhansi (U.P.)
River Mandakini and Ken are the last tributaries of river Yamuna before it joins river Ganga. Many smallstreams join river Ken at Panna (M.P.) from Panna onwards, River Ken flows up to the place of confluence withRiver Yamuna at Banda in Uttar Pradesh.
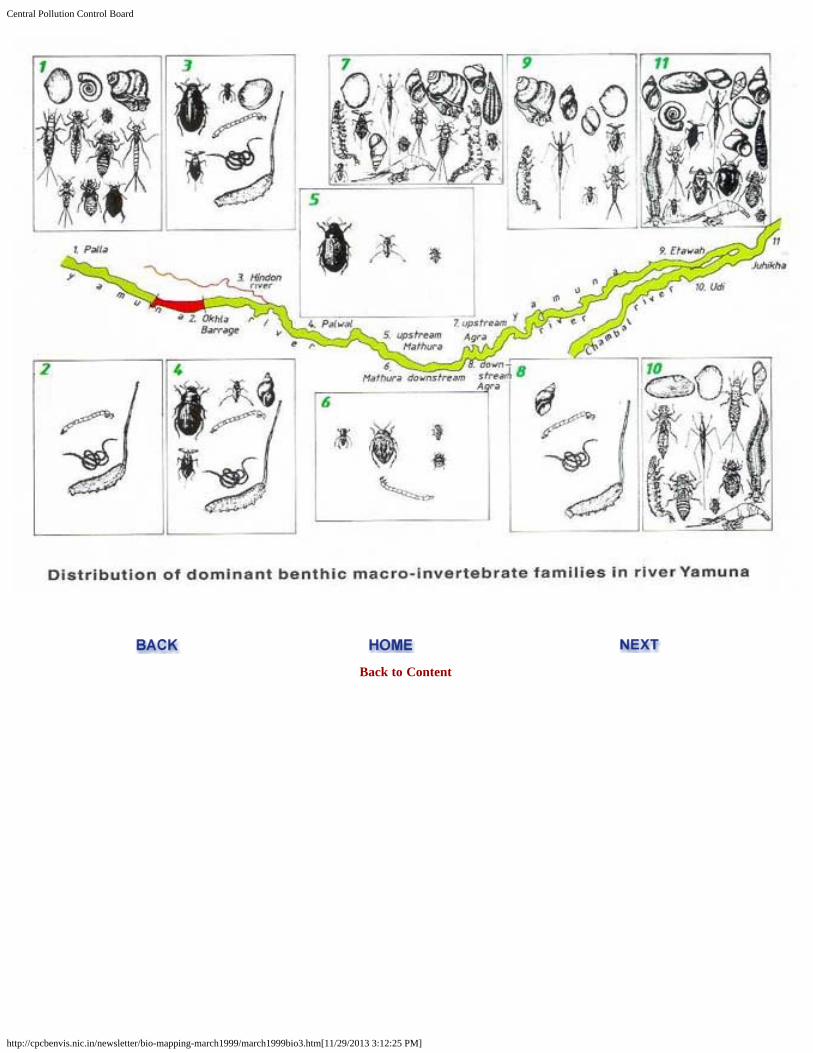
The biological data collected on the saprobity and diversity score of benthic macro-invertebrate families, the waterquality class of the river stretches have been assigned with the help of Biological Water Quality Criteria (BWQC).On the basis of water quality class a unscaled coloured bio-map of river Yamuna basin has been prepared (Fig.1)for water quality assessment of tributaries and rivers in their respective states. Table 5 to 9 indicate theclassification of river stretches in River Yamuna Basin in to five classes with respect to biological water quality.
Out of 39 rivers and tributaries of River Yamuna Basin four river stretches of river Yamuna, Tons, Banas and Kenare clean water (Class `A') (Table 3). 11 river stretches are slightly polluted (Class `B') (Table 4), 72 stretches aremoderately polluted (Class `C') (Table 5), 9 river stretches on heavily polluted (Class `D') (Table 6) and 4 riverstretches are severely polluted (Class `E') in Yamuna basin (Table 7).
Table 3 Clean water stretches (Class `A') of rivers and tributaries of Yamuna Basin (Indicator colour - blue)
S. No. River/Tributaries*
Location of riverstretches
TAXA/families of Benthic macro-invertebratescommonly collected from water bodies
1. Yamuna Yamunotri to Kalsi(U.P.)
EPHEMEROPTERA : Heptageniedae,Leptophlebiidae, Ephemerellidae, Ephemeriidae
Pothaminthidae, Siphonuridae, Caenidae, Baetidae
PLECOPTERA : Leuctridae, Perlodidae, Perlidae,Taeniopterygidae
TRICHOPTERA : leptoceridae, Glossosomitdae,Sericostomatidae, Brachycentridae, Goeridae,Beracidae, Hydroptilidae, Rhyacophilidae,Polycentropodidae,
2. Tons Haripur at KothiMinas (U.P.)
3. Banas*(Chambal)
Rameshwarghat B/cto Chambal river(Rajasthan)
4. Ken Panna (M.P.)
Central Pollution Control Board
http://cpcbenvis.nic.in/newsletter/bio-mapping-march1999/march1999bio8.htm[11/29/2013 3:13:31 PM]
Hydropsychiidae
HEMIPTERA : Aphelocheiridae
DIPTERA : simulidae, Tipulidae
*( ) = Tributaries of the river A/c = After confluence
( ) = States U/s = Upstream
B/c = Before confluence D/s = Down stream
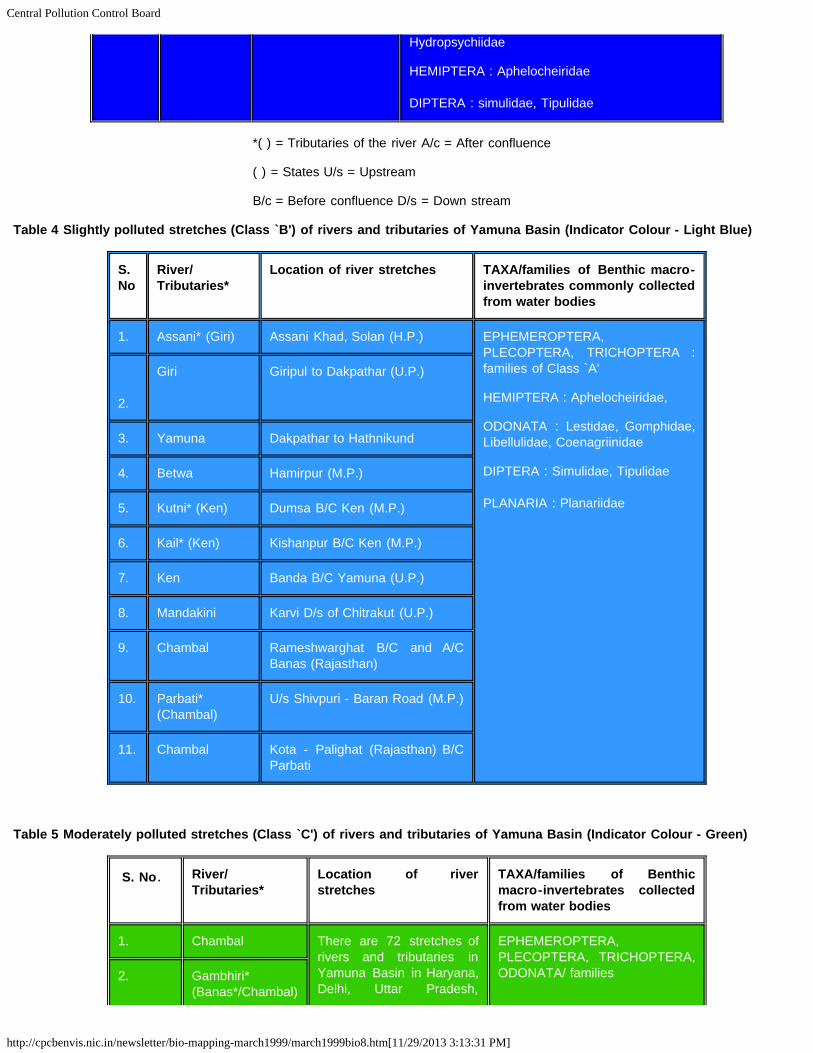
Table 4 Slightly polluted stretches (Class `B') of rivers and tributaries of Yamuna Basin (Indicator Colour - Light Blue)
S.No
River/Tributaries*
Location of river stretches TAXA/families of Benthic macro-invertebrates commonly collectedfrom water bodies
1. Assani* (Giri) Assani Khad, Solan (H.P.) EPHEMEROPTERA,PLECOPTERA, TRICHOPTERA :families of Class `A'
HEMIPTERA : Aphelocheiridae,
ODONATA : Lestidae, Gomphidae,Libellulidae, Coenagriinidae
DIPTERA : Simulidae, Tipulidae
PLANARIA : Planariidae
2.
Giri Giripul to Dakpathar (U.P.)
3. Yamuna Dakpathar to Hathnikund
4. Betwa Hamirpur (M.P.)
5. Kutni* (Ken) Dumsa B/C Ken (M.P.)
6. Kail* (Ken) Kishanpur B/C Ken (M.P.)
7. Ken Banda B/C Yamuna (U.P.)
8. Mandakini Karvi D/s of Chitrakut (U.P.)
9. Chambal Rameshwarghat B/C and A/CBanas (Rajasthan)
10. Parbati*(Chambal)
U/s Shivpuri - Baran Road (M.P.)
11. Chambal Kota - Palighat (Rajasthan) B/CParbati
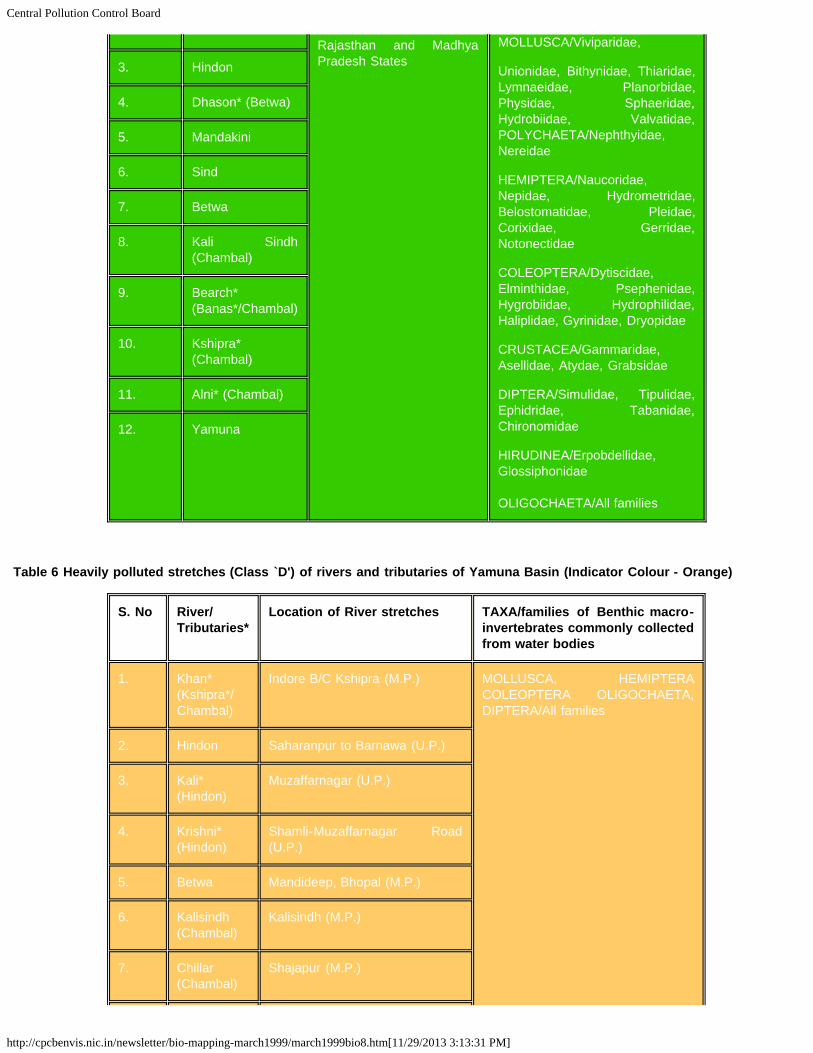
Table 5 Moderately polluted stretches (Class `C') of rivers and tributaries of Yamuna Basin (Indicator Colour - Green)
S. No. River/Tributaries*
Location of riverstretches
TAXA/families of Benthicmacro-invertebrates collectedfrom water bodies
1. Chambal There are 72 stretches ofrivers and tributaries inYamuna Basin in Haryana,Delhi, Uttar Pradesh,
EPHEMEROPTERA,PLECOPTERA, TRICHOPTERA,ODONATA/ families2. Gambhiri*
(Banas*/Chambal)
Central Pollution Control Board
http://cpcbenvis.nic.in/newsletter/bio-mapping-march1999/march1999bio8.htm[11/29/2013 3:13:31 PM]
Rajasthan and MadhyaPradesh States
MOLLUSCA/Viviparidae,
Unionidae, Bithynidae, Thiaridae,Lymnaeidae, Planorbidae,Physidae, Sphaeridae,Hydrobiidae, Valvatidae,POLYCHAETA/Nephthyidae,Nereidae
HEMIPTERA/Naucoridae,Nepidae, Hydrometridae,Belostomatidae, Pleidae,Corixidae, Gerridae,Notonectidae
COLEOPTERA/Dytiscidae,Elminthidae, Psephenidae,Hygrobiidae, Hydrophilidae,Haliplidae, Gyrinidae, Dryopidae
CRUSTACEA/Gammaridae,Asellidae, Atydae, Grabsidae
DIPTERA/Simulidae, Tipulidae,Ephidridae, Tabanidae,Chironomidae
HIRUDINEA/Erpobdellidae,Glossiphonidae
OLIGOCHAETA/All families
3. Hindon
4. Dhason* (Betwa)
5. Mandakini
6. Sind
7. Betwa
8. Kali Sindh(Chambal)
9. Bearch*(Banas*/Chambal)
10. Kshipra*(Chambal)
11. Alni* (Chambal)
12. Yamuna
Table 6 Heavily polluted stretches (Class `D') of rivers and tributaries of Yamuna Basin (Indicator Colour - Orange)
S. No River/Tributaries*
Location of River stretches TAXA/families of Benthic macro-invertebrates commonly collectedfrom water bodies
1. Khan*(Kshipra*/Chambal)
Indore B/C Kshipra (M.P.) MOLLUSCA, HEMIPTERACOLEOPTERA OLIGOCHAETA,DIPTERA/All families
2. Hindon Saharanpur to Barnawa (U.P.)
3. Kali*(Hindon)
Muzaffarnagar (U.P.)
4. Krishni*(Hindon)
Shamli-Muzaffarnagar Road(U.P.)
5. Betwa Mandideep, Bhopal (M.P.)
6. Kalisindh(Chambal)
Kalisindh (M.P.)
7. Chillar(Chambal)
Shajapur (M.P.)
Central Pollution Control Board
http://cpcbenvis.nic.in/newsletter/bio-mapping-march1999/march1999bio8.htm[11/29/2013 3:13:31 PM]
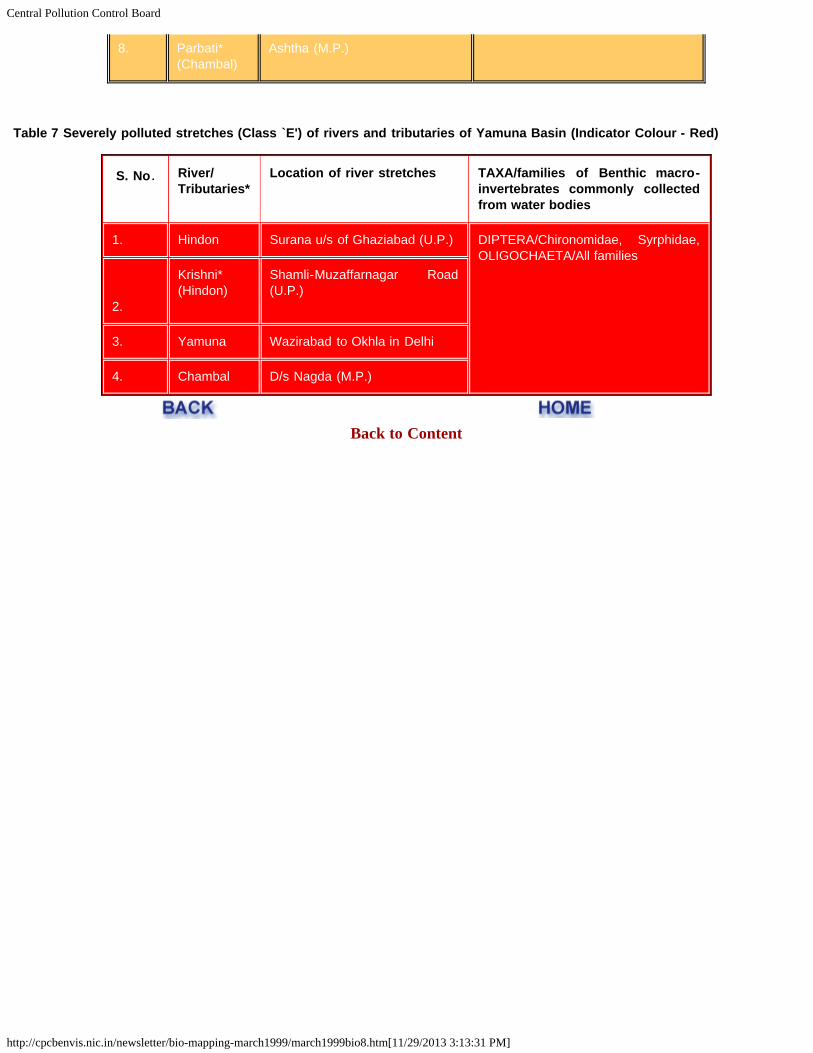
8. Parbati*(Chambal)
Ashtha (M.P.)
Table 7 Severely polluted stretches (Class `E') of rivers and tributaries of Yamuna Basin (Indicator Colour - Red)
S. No. River/Tributaries*
Location of river stretches TAXA/families of Benthic macro-invertebrates commonly collectedfrom water bodies
1. Hindon Surana u/s of Ghaziabad (U.P.) DIPTERA/Chironomidae, Syrphidae,OLIGOCHAETA/All families
2.
Krishni*(Hindon)
Shamli-Muzaffarnagar Road(U.P.)
3. Yamuna Wazirabad to Okhla in Delhi
4. Chambal D/s Nagda (M.P.)
Back to Content