conceptual framework design for the
TRANSCRIPT

CONCEPTUAL FRAMEWORK DESIGN FOR THE
DEVELOPMENT OF AN ENTERPRISE RESOURCE PLANNING
SYSTEM FOR SMALL AND MEDIUM ENTERPRISES IN
SOUTHEAST ASIA
A Thesis
Submitted to the Faculty of Graduate Studies and Research
In Partial Fulfillment of the Requirements
For the Degree of
Master of Applied Science
In Industrial Systems Engineering
University of Regina
By
Punnamee Sachakamol
Regina, Saskatchewan, Canada
November, 2005
Copyright 2005: Punnamee Sachakamol
Reproduced with permission of the copyright owner. Further reproduction prohibited without permission.

1+1 Library and Bibliotheque et Archives Canada Archives Canada
Published Heritage Direction du Branch Patrimoine de redition
395 Wellington Street Ottawa ON KlA ON4 Canada
395, rue Wellington Ottawa ON KlA ON4 Canada
NOTICE: The author has granted a non-exclusive license allowing Library and Archives Canada to reproduce, publish, archive, preserve, conserve, communicate to the public by telecommunication or on the Internet, loan, distribute and sell theses worldwide, for commercial or non-commercial purposes, in microform, paper, electronic and/or any other formats.
The author retains copyright ownership and moral rights in this thesis. Neither the thesis nor substantial extracts from it may be printed or otherwise reproduced without the author's permission.
Your file Votre reference ISBN: 978-0-494-18910-8 Our file Notre reference ISBN: 978-0-494-18910-8
AVIS: L'auteur a accord& une licence non exclusive permettant a la Bibliotheque et Archives Canada de reproduire, publier, archiver, sauvegarder, conserver, transmettre au public par telecommunication ou par ('Internet, preter, distribuer et vendre des theses partout dans le monde, a des fins commerciales ou autres, sur support microforme, papier, electronique et/ou autres formats.
L'auteur conserve la propriete du droit d'auteur et des droits moraux qui protege cette these. Ni la these ni des extraits substantiels de celle-ci ne doivent etre imprimes ou autrement reproduits sans son autorisation.
In compliance with the Canadian Privacy Act some supporting forms may have been removed from this thesis.
While these forms may be included in the document page count, their removal does not represent any loss of content from the thesis.
1*1
Canada
Conformement a la loi canadienne sur la protection de la vie privee, quelques formulaires secondaires ont ete enleves de cette these.
Bien que ces formulaires aient inclus dans la pagination, it n'y aura aucun contenu manquant.
Reproduced with permission of the copyright owner. Further reproduction prohibited without permission.
Library and Archives Canada
Bibliotheque et Archives Canada
Published Heritage Branch
395 Wellington Street Ottawa ON K1A 0N4 Canada
Your file Votre reference ISBN: 978-0-494-18910-8 Our file Notre reference ISBN: 978-0-494-18910-8
Direction du Patrimoine de I'edition
395, rue Wellington Ottawa ON K1A 0N4 Canada
NOTICE:The author has granted a nonexclusive license allowing Library and Archives Canada to reproduce, publish, archive, preserve, conserve, communicate to the public by telecommunication or on the Internet, loan, distribute and sell theses worldwide, for commercial or noncommercial purposes, in microform, paper, electronic and/or any other formats.
AVIS:L'auteur a accorde une licence non exclusive permettant a la Bibliotheque et Archives Canada de reproduire, publier, archiver, sauvegarder, conserver, transmettre au public par telecommunication ou par I'lnternet, preter, distribuer et vendre des theses partout dans le monde, a des fins commerciales ou autres, sur support microforme, papier, electronique et/ou autres formats.
The author retains copyright ownership and moral rights in this thesis. Neither the thesis nor substantial extracts from it may be printed or otherwise reproduced without the author's permission.
L'auteur conserve la propriete du droit d'auteur et des droits moraux qui protege cette these.Ni la these ni des extraits substantiels de celle-ci ne doivent etre imprimes ou autrement reproduits sans son autorisation.
In compliance with the Canadian Privacy Act some supporting forms may have been removed from this thesis.
While these forms may be included in the document page count, their removal does not represent any loss of content from the thesis.
Conformement a la loi canadienne sur la protection de la vie privee, quelques formulaires secondaires ont ete enleves de cette these.
Bien que ces formulaires aient inclus dans la pagination, il n'y aura aucun contenu manquant.
i * i
CanadaReproduced with permission of the copyright owner. Further reproduction prohibited without permission.
UNIVERSITY OF REGINA
FACULTY OF GRADUATE STUDIES AND RESEARCH
SUPERVISORY AND EXAMINING COMMITTEE
Punnamee Sachakamol, candidate for the degree of Master of Applied Science, has presented
a thesis titled, Conceptual Framework Design for the Development of an Enterprise
Resource Planning System for Small and Medium Enterprises in Southeast Asia, in an oral
examination held on November 24, 2005. The following committee members have found the
thesis acceptable in form and content, and that the candidate demonstrated satisfactory
knowledge of the subject material.
External Examiner: Dr. Lisa Fan, Department of Computer Science
Supervisor: Dr. Liming Dai, Faculty of Engineering
Committee Member: Dr. Amr Henni, Faculty of Engineering
Committee Member: Dr. Muhammad Ayub, Faculty of Engineering
Chair of Defense: Dr. Andrei Volodin, Department of Mathematics and Statistics
Reproduced with permission of the copyright owner. Further reproduction prohibited without permission.
UNIVERSITY OF REGINA
FACULTY OF GRADUATE STUDIES AND RESEARCH
SUPERVISORY AND EXAMINING COMMITTEE
Punnamee Sachakamol, candidate for the degree of Master of Applied Science, has presented
a thesis titled, Conceptual Framework Design for the Development o f an Enterprise
Resource Planning System for Small and Medium Enterprises in Southeast Asia, in an oral
examination held on November 24, 2005. The following committee members have found the
thesis acceptable in form and content, and that the candidate demonstrated satisfactory
knowledge of the subject material.
External Examiner: Dr. Lisa Fan, Department of Computer Science
Supervisor: Dr. Liming Dai, Faculty of Engineering
Committee Member: Dr. Amr Henni, Faculty of Engineering
Committee Member: Dr. Muhammad Ayub, Faculty of Engineering
Chair of Defense: Dr. Andrei Volodin, Department of Mathematics and Statistics
Reproduced with permission of the copyright owner. Further reproduction prohibited without permission.

Abstract
The Enterprise Resource Planning (ERP) system is one of the most widely
accepted systems in the management of manufacturing enterprises. Despite the
advantages of ERP systems, the existing ERP systems do not as of yet provide a clear and
successful management tool for small and medium sized enterprises (SMEs), especially
for SMEs in Southeast Asian countries. Also, the ERP systems do not provide convenient
and easy implementation for these SMEs. This research aims at identifying the strategic
and operational requirements of SMEs in the Southeast Asia region on the basis of the
existing quantitative and qualitative research, which have been shown to influence
Information System and Information Technology adoption in SMEs. The weaknesses of
the existing ERP systems in relation to their implementation in Southeast Asian SMEs
are evaluated and analyzed. The characteristics of the SMEs in this region are
investigated with the SMEs' specific requirements for higher flexibility, lower
hierarchical management, modular structure, and comprehension of the SMEs' short- and
long-term plans. A strategic change framework that emphasizes the proper
implementation of an ERP system in Southeast Asian SMEs and meets the requirements
of the SMEs is developed, including the establishment of a Novel ERP system (NERP)
for Southeast Asian SMEs. A comparison of NERP with the existing ERP systems is
performed. The application of the research results in the ERPs in SMEs in Southeast Asia
is also included in the present research.
I
Reproduced with permission of the copyright owner. Further reproduction prohibited without permission.
Abstract
The Enterprise Resource Planning (ERP) system is one of the most widely
accepted systems in the management of manufacturing enterprises. Despite the
advantages of ERP systems, the existing ERP systems do not as of yet provide a clear and
successful management tool for small and medium sized enterprises (SMEs), especially
for SMEs in Southeast Asian countries. Also, the ERP systems do not provide convenient
and easy implementation for these SMEs. This research aims at identifying the strategic
and operational requirements of SMEs in the Southeast Asia region on the basis of the
existing quantitative and qualitative research, which have been shown to influence
Information System and Information Technology adoption in SMEs. The weaknesses of
the existing ERP systems in relation to their implementation in Southeast Asian SMEs
are evaluated and analyzed. The characteristics of the SMEs in this region are
investigated with the SMEs’ specific requirements for higher flexibility, lower
hierarchical management, modular structure, and comprehension of the SMEs’ short- and
long-term plans. A strategic change framework that emphasizes the proper
implementation of an ERP system in Southeast Asian SMEs and meets the requirements
of the SMEs is developed, including the establishment of a Novel ERP system (NERP)
for Southeast Asian SMEs. A comparison of NERP with the existing ERP systems is
performed. The application of the research results in the ERPs in SMEs in Southeast Asia
is also included in the present research.
I
Reproduced with permission of the copyright owner. Further reproduction prohibited without permission.

Acknowledgements
First and above all, I am extremely appreciative of Dr. Liming Dai, my
supervisor, and his excellent supervision during the course of this research. Without his
inspiration, this research could not have been successfully completed.
Thanks to Dr. P. Piamsomboon for providing knowledge about Enterprise
Resource Planning development and programming.
I am grateful to the Faculty of Graduate Studies and Research and the Faculty of
Engineering at the University of Regina for providing the financial support and facilities
for my study.
Finally, I would like to thank my mother, father, brother, S. Lisawadi, and my
friends. Without their help, encouragement, and emotional support, this work could never
have been accomplished.
II
Reproduced with permission of the copyright owner. Further reproduction prohibited without permission.
Post Defence Acknowledgements
I would like to also profoundly thank the external examiner Dr. L. Fan for her
diligence and highly valued comments on the thesis. In addition I am thankful to the chair
of the defence Dr. A. Volodin for agreeing to be present at my defence on such short
notice. He was perfectly in command of the defence process and his insightful
contribution is greatly treasured. I would also like to express my gratitude to my
committee members, including Dr. A. Henni and Dr. M. Ayub, for their insightful
suggestions, which were helpful for improving the thesis work.
III
Reproduced with permission of the copyright owner. Further reproduction prohibited without permission.
Post Defence Acknowledgements
I would like to also profoundly thank the external examiner Dr. L. Fan for her
diligence and highly valued comments on the thesis. In addition I am thankful to the chair
of the defence Dr. A. Volodin for agreeing to be present at my defence on such short
notice. He was perfectly in command of the defence process and his insightful
contribution is greatly treasured. I would also like to express my gratitude to my
committee members, including Dr. A. Henni and Dr. M. Ayub, for their insightful
suggestions, which were helpful for improving the thesis work.
Ill
Reproduced with permission of the copyright owner. Further reproduction prohibited without permission.

Table of Contents
Page
Abstract
Acknowledgements II
Post Defence Acknowledgements III
Table of Contents IV
List of Tables VIII
List of Figures IX
List of Acronyms XI
Chapter 1 Introduction 1
1.1 Background 1
1.2 Research issue 2
1.3 Research objectives 3
1.4 Scope and limitations 5
1.5 Outline of the thesis 5
Chapter 2 Research Background 7
2.1 Definition of the Enterprise Resource Planning system 7
2.2 The evolution of ERP Systems 8
2.3 Advantages, disadvantages, and the implementation of an ERP system 9
2.3.1 Advantages of an ERP System 9
2.3.2 Disadvantages of an ERP System 11
2.3.3 The Implementation of an ERP system 12
IV
Reproduced with permission of the copyright owner. Further reproduction prohibited without permission.
Table of Contents
Page
Abstract I
Acknowledgements II
Post Defence Acknowledgements III
Table of Contents IV
List of Tables VIII
List of Figures IX
List of Acronyms XI
Chapter 1 Introduction 1
1.1 Background 1
1.2 Research issue 2
1.3 Research objectives 3
1.4 Scope and limitations 5
1.5 Outline of the thesis 5
Chapter 2 Research Background 7
2.1 Definition of the Enterprise Resource Planning system 7
2.2 The evolution of ERP Systems 8
2.3 Advantages, disadvantages, and the implementation of an ERP system 9
2.3.1 Advantages of an ERP System 9
2.3.2 Disadvantages of an ERP System 11
2.3.3 The Implementation of an ERP system 12
IV
Reproduced with permission of the copyright owner. Further reproduction prohibited without permission.

2.4 Criteria of ERP framework development 15
2.4.1 Integration of the System 15
2.4.2 Data Integration 16
2.5 ERP System development and implementation decision framework 16
2.5.1 Replacement of the existing system 17
2.5.2 Will the ERP system support the reengineering effort? 17
2.5.3 Utilizing the benefits of technology 18
2.5.4 Enterprise database integration 19
2.6 Enterprise Resource Planning architectural design 21
Chapter 3 Methodology 24
3.1 SMEs in Southeast Asian countries 24
3.1.1 Overview of SMEs in the region of Southeast Asia 25
3.1.2 Characteristics of SMEs in Southeast Asia 26
3.1.3 Benefits of an ERP system for SMEs in Southeast Asia 27
3.1.4 Practice Differences between North America's system and the system in Southeast Asia 29
3.2 Research design approach 31
3.3 Data collection techniques 32
3.4 Sources of data 33
3.5 Demographic profile of the representative companies 33
3.6 Data gathering tools 36
3.6.1 Surveys 37
3.6.2 Interviews 37
3.7 Research evaluation 37
V
Reproduced with permission of the copyright owner. Further reproduction prohibited without permission.
2.4 Criteria of ERP framework development 15
2.4.1 Integration of the System 15
2.4.2 Data Integration 16
2.5 ERP System development and implementation decision framework 16
2.5.1 Replacement of the existing system 17
2.5.2 Will the ERP System support the reengineering effort? 17
2.5.3 Utilizing the benefits of technology 18
2.5.4 Enterprise database integration 19
2.6 Enterprise Resource Planning architectural design 21
Chapter 3 Methodology 24
3.1 SMEs in Southeast Asian countries 24
3.1.1 Overview of SMEs in the region of Southeast Asia 25
3.1.2 Characteristics of SMEs in Southeast Asia 26
3.1.3 Benefits of an ERP system for SMEs in Southeast Asia 27
3.1.4 Practice Differences between North America’s systemand the system in Southeast Asia 29
3.2 Research design approach 31
3.3 Data collection techniques 3 2
3.4 Sources of data 33
3.5 Demographic profile of the representative companies 33
3.6 Data gathering tools 36
3.6.1 Surveys 37
3.6.2 Interviews 37
3.7 Research evaluation 37
V
Reproduced with permission of the copyright owner. Further reproduction prohibited without permission.
3.8 Analysis methodology 38
3.9 Transfer technology 40
Chapter 4 Conceptual Framework 41
4.1 The nature of ERP development and implementation processes 42
4.2 Enterprise Resource Planning development foundation 43
4.2.1 Fundamental business process 44
4.2.2 Consistency 46
4.2.3 Economics of Scale 47
4.2.4 Integration 47
4.3 Conceptual framework development 48
4.3.1 User specification 51
4.3.2 Organization specification 53
4.3.3 System specification 55
4.4 Discussion 58
4.4.1 Southeast Asian SME features 58
4.4.2 ERP Systems in Southeast Asian SMEs 60
4.4.3 Implications for business practitioners 60
4.5 Customized Novel ERP System for Southeast Asian SMEs 62
4.5.1 User specification 62
4.5.2 Main components and modules 68
4.5.3 Novel ERP system and conceptual framework design 73
4.5.4 Inventory and relevant cost policy decisions 84
4.5.5 Achieved functionality and features in NERP 88
VI
Reproduced with permission of the copyright owner. Further reproduction prohibited without permission.
3.8 Analysis methodology 3 8
3.9 Transfer technology 40
Chapter 4 Conceptual Framework 41
4.1 The nature of ERP development and implementation processes 42
4.2 Enterprise Resource Planning development foundation 43
4.2.1 Fundamental business process 44
4.2.2 Consistency 46
4.2.3 Economics of Scale 47
4.2.4 Integration 47
4.3 Conceptual framework development 48
4.3.1 User specification 51
4.3.2 Organization specification 53
4.3.3 System specification 55
4.4 Discussion 58
4.4.1 Southeast Asian SME features 58
4.4.2 ERP Systems in Southeast Asian SMEs 60
4.4.3 Implications for business practitioners 60
4.5 Customized Novel ERP System for Southeast Asian SMEs 62
4.5.1 User specification 62
4.5.2 Main components and modules 68
4.5.3 Novel ERP system and conceptual framework design 73
4.5.4 Inventory and relevant cost policy decisions 84
4.5.5 Achieved functionality and features in NERP 88
VI
Reproduced with permission of the copyright owner. Further reproduction prohibited without permission.
Chapter 5 Presentation, Interpretation and Analysis of data 95
5.1 Comparison of existing ERP systems and NERP 95
5.2 Data analysis 102
5.3 Comparison of estimation and practice 109
5.4 Respondents' perspectives on Enterprise Resource Planning and what is expected in the future 110
Chapter 6 Conclusion and future work 117
6.1 Conclusions 117
6.2 Recommendations for Future Work 120
References 123
Appendices A: Questionnaires 132
Appendices B: Statistical calculation 137
Appendices C: Management decision air in the system management 142
VII
Reproduced with permission of the copyright owner. Further reproduction prohibited without permission.
Chapter 5 Presentation, Interpretation and Analysis of data 95
5.1 Comparison of existing ERP systems and NERP 95
5.2 Data analysis 102
5.3 Comparison of estimation and practice 109
5.4 Respondents’ perspectives on Enterprise Resource Planningand what is expected in the future 110
Chapter 6 Conclusion and future work 117
6.1 Conclusions 117
6.2 Recommendations for Future Work 120
References 123
Appendices A: Questionnaires 132
Appendices B: Statistical calculation 137
Appendices C: Management decision air in the system management 142
VII
Reproduced with permission of the copyright owner. Further reproduction prohibited without permission.
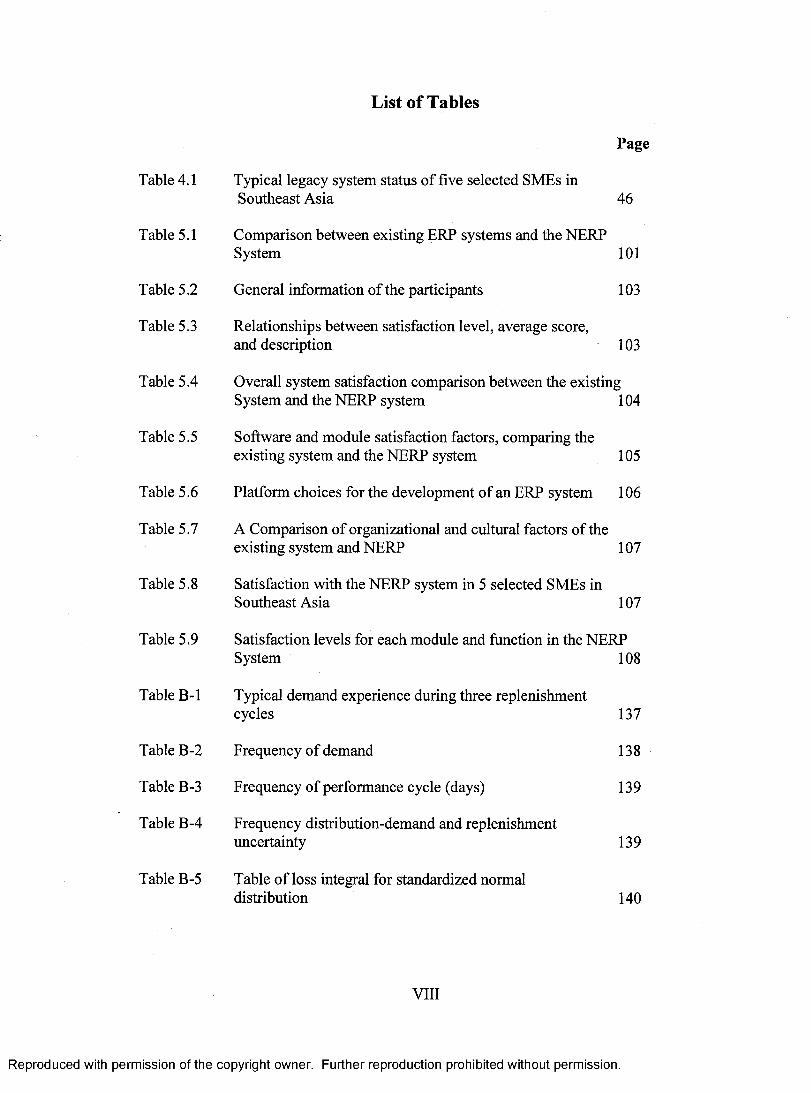
List of Tables
Page
Table 4.1 Typical legacy system status of five selected SMEs in Southeast Asia 46
Table 5.1 Comparison between existing ERP systems and the NERP System 101
Table 5.2 General information of the participants 103
Table 5.3
Table 5.4
Table 5.5
Table 5.6
Relationships between satisfaction level, average score, and description 103
Overall system satisfaction comparison between the existing System and the NERP system 104
Software and module satisfaction factors, comparing the existing system and the NERP system 105
Platform choices for the development of an ERP system 106
Table 5.7 A Comparison of organizational and cultural factors of the existing system and NERP 107
Table 5.8 Satisfaction with the NERP system in 5 selected SMEs in Southeast Asia 107
Table 5.9 Satisfaction levels for each module and function in the NERP System 108
Table B-1 Typical demand experience during three replenishment cycles 137
Table B-2 Frequency of demand 138
Table B-3 Frequency of performance cycle (days) 139
Table B-4 Frequency distribution-demand and replenishment uncertainty 139
Table B-5 Table of loss integral for standardized normal distribution 140
VIII
Reproduced with permission of the copyright owner. Further reproduction prohibited without permission.
List of Tables
Table 4.1 Typical legacy system status of five selected SMEs in Southeast Asia
Table 5.1
Table 5.2
Table 5.3
Table 5.4
Table 5.5
Table 5.6
Table 5.7
Table 5.8
Page
46
Comparison between existing ERP systems and the NERP System 101
General information of the participants 103
Relationships between satisfaction level, average score, and description 103
Overall system satisfaction comparison between the existing System and the NERP system 104
Software and module satisfaction factors, comparing the existing system and the NERP system 105
Platform choices for the development of an ERP system 106
A Comparison of organizational and cultural factors of the existing system and NERP 107
Satisfaction with the NERP system in 5 selected SMEs in Southeast Asia 107
Table 5.9 Satisfaction levels for each module and function in the NERP System 108
Table B-l Typical demand experience during three replenishmentcycles 137
Table B-2 Frequency of demand 138
Table B-3 Frequency of performance cycle (days) 139
Table B-4 Frequency distribution-demand and replenishmentuncertainty 139
Table B-5 Table of loss integral for standardized normaldistribution 140
VIII
with permission of the copyright owner. Further reproduction prohibited without permission.

List of Figures
Figure 4.1
Figure 4.2
Figure 4.3
Figure 4.4
Figure 4.5
Figure 4.6
Figure 4.7
Figure 4.8
Figure 4.9
Figure 4.10
Figure 4.11
Figure 4.12
Figure 4.13
Figure 4.14
Figure 4.15
Figure 4.16
Figure 4.17
Figure 4.18
Figure 4.19
Page
ERP lifecycle model (Markus & Tanis, 2000) 42
DeLone and McLean's Information System success model. 49
Ives, Hamilton, and Davis's Information System research model 50
Conceptual success framework for ERP implementation in Southeast Asia 52
Relationships within the Revenue Cycle 65
Relationships within the Expenditure Cycle 66
Relationships within the Production Cycle 67
ERP for SMEs' framework 69
Relationship between the five main modules and the information in the database 70
Relationship between main modules and sub-modules 72
Supplier common database interface 75
Sales Quotations with product information interface 76
Sales Order with cost and profit information interface 77
Material Purchase Request interface 78
Supplier Quotation interface 78
Product Issue and Raw Material Issue interface 80
Current Inventory interface 80
Production Scheduling interface 81
Process flow diagram 83
IX
Reproduced with permission of the copyright owner. Further reproduction prohibited without permission.
List of Figures
Page
Figure 4.1 ERP lifecycle model (Markus & Tanis, 2000) 42
Figure 4.2 DeLone and McLean’s Information System success model. 49
Figure 4.3 Ives, Hamilton, and Davis’s Information System researchmodel 50
Figure 4.4 Conceptual success framework for ERP implementationin Southeast Asia 52
Figure 4.5 Relationships within the Revenue Cycle 65
Figure 4.6 Relationships within the Expenditure Cycle 66
Figure 4.7 Relationships within the Production Cycle 67
Figure 4.8 ERP for SMEs’ framework 69
Figure 4.9 Relationship between the five main modules andthe information in the database 70
Figure 4.10 Relationship between main modules and sub-modules 72
Figure 4.11 Supplier common database interface 75
Figure 4.12 Sales Quotations with product information interface 76
Figure 4.13 Sales Order with cost and profit information interface 77
Figure 4.14 Material Purchase Request interface 78
Figure 4.15 Supplier Quotation interface 78
Figure 4.16 Product Issue and Raw Material Issue interface 80
Figure 4.17 Current Inventory interface 80
Figure 4.18 Production Scheduling interface 81
Figure 4.19 Process flow diagram 83
IX
Reproduced with permission of the copyright owner. Further reproduction prohibited without permission.

Figure 4.20
Figure 4.21
Figure B-1
Figure C-1
Figure C-2
Figure C-3
Figure C-4
Figure C-5
Architectural differences between thick and thin platform (Gartner, 2004) 92
Web-based and work station based system diagram and connection to NERP system
Normal distribution
Cost management module
Expected completion and delivery date
Production Scheduling and Scheduling Adjustment
Pending reminder
Inventory status, ROP and Q*
X
94
138
143
144
145
146
146
Reproduced with permission of the copyright owner. Further reproduction prohibited without permission.
Figure 4.20 Architectural differences between thick and thin platform(Gartner, 2004) 92
Figure 4.21 Web-based and work station based system diagram andconnection to NERP system 94
Figure B-l Normal distribution 138
Figure C-l Cost management module 143
Figure C-2 Expected completion and delivery date 144
Figure C-3 Production Scheduling and Scheduling Adjustment 145
Figure C-4 Pending reminder 146
Figure C-5 Inventory status, ROP and Q* 146
X
Reproduced with permission of the copyright owner. Further reproduction prohibited without permission.

List of Acronyms
ASP Adjunct Service Point
BPM Business Process Management
CAD Computer Aided Design
CASE Computer Aided Software Engineering
CRM Customer Relationship Management
DBMS Database Management System
ERP Enterprise Resource Planning
FTEs Full-Time Equivalents
GDP Gross Domestic Product
HR Human Resource
IDC Internet Data Centre
IS Information System
ISO International Organization for Standardization
IT Information Technology
J2EE Java 2 Enterprise Edition
LAN Local Area Network
LOB Line of Business
MRP Material Requirement Planning
MRPII Material Resource Planning
NERP Novel Enterprise Resource Planning
OLAP On-Line Analytical Processing
OS Operation System
XI
Reproduced with permission of the copyright owner. Further reproduction prohibited without permission.

OC Personal Computer
Q* Replenishment Quantity
ROP Reorder Point or Reorder Quantity Point
SMES Small and Medium Enterprises
SQL Structured Query Language
XML Extensive Mark-up Language
XII
Reproduced with permission of the copyright owner. Further reproduction prohibited without permission.
OC Personal Computer
Q* Replenishment Quantity
ROP Reorder Point or Reorder Quantity Point
SMES Small and Medium Enterprises
SQL Structured Query Language
XML Extensive Mark-up Language
XII
Reproduced with permission of the copyright owner. Further reproduction prohibited without permission.
Chapter 1
Introduction
1.1 Background
The Enterprise Resource Planning system (ERP) is simply the management
information system that incorporates and automates many of the business practices
related to the process and assembly features of a company. ERP systems are
characteristically comprised of manufacturing, logistics, distribution, inventory, shipping,
invoicing, and accounting. Many business activities can be aided by this system, such as
marketing, delivery, billing, production, inventory management, and Human Resource
management. ERPs are often called back office systems, which indicate that the
customers and the general public are not directly involved, as opposed to frontline office
systems such as customer relationship management systems that deal directly with the
customer. While ERP systems have been implemented in large corporations globally,
application of the ERP systems is still not a natural option for most small and medium
enterprises (SMEs) in Southeast Asia.
In most developing economies in Southeast Asia, manufacturing has been pointed
to as a major pillar of economic growth. For example, 25% and 35% of Singapore's and
Malaysia's GDP, respectively, are attributed to manufacturing (Department of Statistics
Report, 2000). Moreover, there are over 100,000 and 500,000 SMEs in Singapore and
Malaysia, respectively. Despite the thriving numbers of SMES in Southeast Asia, ERP
system implementation in SMEs in the region is still fairly low, with less than 50%
1
Reproduced with permission of the copyright owner. Further reproduction prohibited without permission.
Chapter 1
Introduction
1.1 Background
The Enterprise Resource Planning system (ERP) is simply the management
information system that incorporates and automates many of the business practices
related to the process and assembly features of a company. ERP systems are
characteristically comprised of manufacturing, logistics, distribution, inventory, shipping,
invoicing, and accounting. Many business activities can be aided by this system, such as
marketing, delivery, billing, production, inventory management, and Human Resource
management. ERPs are often called back office systems, which indicate that the
customers and the general public are not directly involved, as opposed to frontline office
systems such as customer relationship management systems that deal directly with the
customer. While ERP systems have been implemented in large corporations globally,
application of the ERP systems is still not a natural option for most small and medium
enterprises (SMEs) in Southeast Asia.
In most developing economies in Southeast Asia, manufacturing has been pointed
to as a major pillar of economic growth. For example, 25% and 35% of Singapore’s and
Malaysia’s GDP, respectively, are attributed to manufacturing (Department of Statistics
Report, 2000). Moreover, there are over 100,000 and 500,000 SMEs in Singapore and
Malaysia, respectively. Despite the thriving numbers of SMES in Southeast Asia, ERP
system implementation in SMEs in the region is still fairly low, with less than 50%
1
Reproduced with permission of the copyright owner. Further reproduction prohibited without permission.

acceptance (Gartner Group, 2000). According to Huin (2004), this low acceptance can be
attributed to the inadequate project management methodologies of the existing ERP
systems.
An ERP system is regarded by most SMEs in Southeast Asia as an expensive
management system. The prohibitive price of the ERP systems actually prevents SMEs
from using such systems in their companies. Another major concern of these companies
is the difficulty involved in integrating and implementing the ERP systems in the
companies' operations, a process in which vagueness and uncertainties are commonly
involved. A new system with an affordable price and the ability to meet the special needs
of these companies is therefore needed.
1.2 Research issue
There are numerous research studies in the current literature dealing with the
subject of ERP systems. A large amount of literature in this field advocates the benefits
of these systems. Anecdotal success stories are frequently presented. What is interesting
is that there is a lack of empirical study of the application and implementation of ERP
systems for SMEs, particularly for smaller businesses in Southeast Asian countries.
Therefore, it is not clear whether or not these companies have achieved the management
level promised by the ERP system developers. The main problem facing researchers is
identifying the unique characteristic requirements of ERP systems for SMEs in Southeast
Asian countries, in terms of business processes, integrated information technologies, and
reengineering processes. Linked to this is the problem of how relevant variables and
factors can be identified in order to build a framework that integrates the strengths as well
as improves the weak areas of the ERP systems customized for the specific region.
2
Reproduced with permission of the copyright owner. Further reproduction prohibited without permission.
acceptance (Gartner Group, 2000). According to Huin (2004), this low acceptance can be
attributed to the inadequate project management methodologies of the existing ERP
systems.
An ERP system is regarded by most SMEs in Southeast Asia as an expensive
management system. The prohibitive price of the ERP systems actually prevents SMEs
from using such systems in their companies. Another major concern of these companies
is the difficulty involved in integrating and implementing the ERP systems in the
companies’ operations, a process in which vagueness and uncertainties are commonly
involved. A new system with an affordable price and the ability to meet the special needs
of these companies is therefore needed.
1.2 Research issue
There are numerous research studies in the current literature dealing with the
subject of ERP systems. A large amount of literature in this field advocates the benefits
of these systems. Anecdotal success stories are frequently presented. What is interesting
is that there is a lack of empirical study of the application and implementation of ERP
systems for SMEs, particularly for smaller businesses in Southeast Asian countries.
Therefore, it is not clear whether or not these companies have achieved the management
level promised by the ERP system developers. The main problem facing researchers is
identifying the unique characteristic requirements of ERP systems for SMEs in Southeast
Asian countries, in terms of business processes, integrated information technologies, and
reengineering processes. Linked to this is the problem of how relevant variables and
factors can be identified in order to build a framework that integrates the strengths as well
as improves the weak areas of the ERP systems customized for the specific region.
2
Reproduced with permission of the copyright owner. Further reproduction prohibited without permission.

1.3 Research objectives
In an increasingly competitive business environment, SMEs are compelled to find
business solutions in order to enhance their information systems. The need for Enterprise
Resource Planning stems from the fact that it is the backbone of an integrated information
system. Thus, in order to compete with large and multinational enterprises, SMEs require
resource planning systems such as the ERP systems. However, it has been proven in
research that most of the time, small and medium enterprises cannot afford the price of a
packaged ERP system (Zhang et al., 2004).
Furthermore, it has been noted that the complexity of using existing ERP systems
has caused some firms to fail to implement the program properly. Most of the packaged
ERP systems do not include their source code; therefore customization and development
of the software corresponding to the needs of each enterprise are complicated for SMEs
with relatively limited resources. Also with the "One size fits all" ERP package, some
features are more than what is required for SMEs that may have just a few employees,
and would be satisfied with only the fundamental business framework software. These
problems posit a challenging research area for scholars in ERP systems: working to
provide an architectural design for an ERP system that is affordable, simple, and
corresponds to the problems presented by SMEs, especially SMEs in Southeast Asia. One
of the problems with the existing ERP system is its standardized design. Because of this,
it lacks the particularities that could resolve the problems in SMEs in Southeast Asia that
are just developing or are underdeveloped. An ERP software package suitable for SMEs
in Southeast Asia still needs to be properly developed.
3
Reproduced with permission of the copyright owner. Further reproduction prohibited without permission.
1.3 Research objectives
In an increasingly competitive business environment, SMEs are compelled to find
business solutions in order to enhance their information systems. The need for Enterprise
Resource Planning stems from the fact that it is the backbone of an integrated information
system. Thus, in order to compete with large and multinational enterprises, SMEs require
resource planning systems such as the ERP systems. However, it has been proven in
research that most of the time, small and medium enterprises cannot afford the price of a
packaged ERP system (Zhang et al., 2004).
Furthermore, it has been noted that the complexity of using existing ERP systems
has caused some firms to fail to implement the program properly. Most of the packaged
ERP systems do not include their source code; therefore customization and development
of the software corresponding to the needs of each enterprise are complicated for SMEs
with relatively limited resources. Also with the “One size fits all” ERP package, some
features are more than what is required for SMEs that may have just a few employees,
and would be satisfied with only the fundamental business framework software. These
problems posit a challenging research area for scholars in ERP systems: working to
provide an architectural design for an ERP system that is affordable, simple, and
corresponds to the problems presented by SMEs, especially SMEs in Southeast Asia. One
of the problems with the existing ERP system is its standardized design. Because of this,
it lacks the particularities that could resolve the problems in SMEs in Southeast Asia that
are just developing or are underdeveloped. An ERP software package suitable for SMEs
in Southeast Asia still needs to be properly developed.
3
Reproduced with permission of the copyright owner. Further reproduction prohibited without permission.

The general objective of this thesis is to study the distinctive characteristics and
requirements of ERP systems in SMEs in Southeast Asian countries. The specific goals
of this research are as follows:
1. To identify the differences and similarities of the typical companies representing
SMEs in Southeast Asia, including different information system software
requirements, assessment, system evaluation and the selection of software among
companies in Southeast Asia.
2. To perform a comprehensive systematic survey and detailed summary of the
companies in the area; typical SMEs in Southeast Asia are identified and selected
for the research.
3. From the analysis of the data collected in the survey, the principle requirements
needed by SMEs are identified for further development of a new ERP system.
4. To establish a new ERP system called the Novel ERP System (NERP), based on
the analysis of the survey and questionnaires, and to develop a new software
package which shows high flexibility and adaptability to the companies' original
software, and reflects the use of the software in these companies.
5. To compare the new and old systems in terms of cost, flexibility and suitability.
A prototype system is implemented on "Java," which is an open source computer
programming language. Java, a product of Sun Microsystems, is a computer
programming tool that allows programmers to run applications called "applets," which
offer scripting capabilities and server-side connectivity for creating interactive elements
and Web applications.
4
Reproduced with permission of the copyright owner. Further reproduction prohibited without permission.
The general objective of this thesis is to study the distinctive characteristics and
requirements of ERP systems in SMEs in Southeast Asian countries. The specific goals
of this research are as follows:
1. To identify the differences and similarities of the typical companies representing
SMEs in Southeast Asia, including different information system software
requirements, assessment, system evaluation and the selection of software among
companies in Southeast Asia.
2. To perform a comprehensive systematic survey and detailed summary of the
companies in the area; typical SMEs in Southeast Asia are identified and selected
for the research.
3. From the analysis of the data collected in the survey, the principle requirements
needed by SMEs are identified for further development of a new ERP system.
4. To establish a new ERP system called the Novel ERP System (NERP), based on
the analysis of the survey and questionnaires, and to develop a new software
package which shows high flexibility and adaptability to the companies’ original
software, and reflects the use of the software in these companies.
5. To compare the new and old systems in terms of cost, flexibility and suitability.
A prototype system is implemented on “Java,” which is an open source computer
programming language. Java, a product of Sun Microsystems, is a computer
programming tool that allows programmers to run applications called “applets,” which
offer scripting capabilities and server-side connectivity for creating interactive elements
and Web applications.
Reproduced with permission of the copyright owner. Further reproduction prohibited without permission.
1.4 Scope and limitations
In the methodology chapter, the methods used to collect both quantitative and
qualitative data will be explained. This will provide an insight into the source of the data.
The evaluation, validity and reliability of the data will also be described.
The conceptual framework part of the thesis will focus on methods that can be
used for the development of an ERP system for SMEs in Southeast Asia. The research
will be focused on the five selected companies, which can be further divided into three
types of companies, namely companies that have engaged in any kind of Information
System software (ERP, MRP), companies that have many individual legacy types of
software in their management system, and companies that mostly rely on paper based
documentation and business processes. Finally, this research will also provide application
oriented information for researchers and engineers who need to further their knowledge
in the area of Operation Management and Information Technology development in
general. The research will provide a design of a customized ERP system for specific
companies, taking into account various sizes, capital investment, human resources, the
location and contextual environment.
1.5 Outline of the thesis
This thesis consists of the following chapters. Chapter 2 provides the research
background of ERP system implementation. The relevant criteria that can be used to
guide the development of ERP systems in Southeast Asian SMEs are also described.
Chapter 3 explains the data collection methodology, including data evaluation and
validity. Chapter 4 gives a brief overview of the fundamentals of a conceptual model, and
5
Reproduced with permission of the copyright owner. Further reproduction prohibited without permission.
outlines the suitability of the ERP system components in order to support the decision of
ERP systems implementation in Southeast Asian SMEs. Chapter 5 contains the analysis
resulting from the implementation of the Novel ERP system developed for SMEs in
Southeast Asia as integrated information and manufacturing system. Chapter 6 provides
conclusions of the thesis and gives recommendations for further research work.
6
Reproduced with permission of the copyright owner. Further reproduction prohibited without permission.
Chapter 2
Research Background
2.1 Definition of the Enterprise Resource Planning system (ERP)
The ERP system is an integrated software package composed of a set of standard
functional modules (production, sales, human resources, finance, etc.) developed or
integrated by the vendor, that can be adapted to the specific needs of each customer
(Esteves-Sousa & Pastor-Collado, 2000).
Aside from the ERP system, standardized software such as Integrated Vendor
Solutions, Integrated Standard Software and Enterprise Application Systems, which aim
to provide a solution that links and automates all aspects of business through the
incorporation of core processes and administrative functions into one central system. This
system is popular in large, medium and small enterprises (Klaus, et al., 2000).
Companies and enterprises invest enormous sums of money into this software (Li,
1999). Businesses around the world invested around US$300 billion into ERP software
alone in the 1990s (James & Wollf, 2000). However, reports showed the companies to be
disappointed in the ERP systems. Companies such as FoxMeyer, Unisource worldwide,
Dell computers, Hershey Food Cooperation, Whirlpool and Gore-text cast serious doubts
on the credibility of ERP systems because of massive financial losses and lost business
opportunities (Calogero, 2000). According to AMR Research, the total revenue of the
ERP software and services market in 1999 was US$18.3 billion (Gilbert, 2000). ERP
systems implementation costs are often reported to be five to ten times the cost of
software licenses (Davenport, 2000).
7
Reproduced with permission of the copyright owner. Further reproduction prohibited without permission.

Turban, et al. (1999) criticized one of the faults of earlier software applications in
their focus on one area or dimension of the organization (i.e. horizontal or vertical
functions only). This, according to the author, led to disintegration, due mainly to the lack
of coordinating information systems. Accordingly, a good decision can only be made if
there is an integration of the information system.
The need for the development of new ERP software is exemplified in the White
Paper of Exact Software (2004), which articulated that ERP systems currently run only
15-20% of the organization, and have never provided a solution for the entire enterprise
process. According to White Paper of Exact Software (2004), this failure is attributed to
the lack of philosophy behind ERP. It is seen as a technology that just addresses business
problems instead of being a process in which Business Process Management (BPM) is
necessary. It is thus postulated by Exact Software (2004) that technological solutions
should not occur simply by using the ERP systems, but rather an organizational shift
must also accompany the institution of ERP systems.
2.2 The evolution of ERP Systems
Most manufacturing systems in the 1960s were focused on inventory control.
Several software packages were designed at this time to handle inventory based on
traditional inventory concepts. In the 1970s inventory control was replaced by Material
Requirement Planning (MRP) systems, which translated the Master Schedule. MRP was
built for the end items into time-phased net requirements for sub-assemblies, components
and raw materials planning and procurement. In the following decade, MRP was
extended to shop floor and distribution management activities (MRP-II). In the early
8
Reproduced with permission of the copyright owner. Further reproduction prohibited without permission.
1990s, Manufacturing Resource Planning (MRP-II) was further extended to cover areas
such as engineering, finance, purchasing, sales, human resources, and distribution. It was
during this time that enterprise resource planning (ERP) was first used.
A new generation of ERP systems is evolving to provide additional integration,
particularly with customers. These systems, identified as ERP II, integrate traditional
ERP with a Customer Relationship Management (CRM) system in order to better
integrate the requirements of key customers with the firm's supply chain plans (Bowers
ox at el, 2003).
2.3 Advantages, disadvantages, and the implementation of an ERP system
ERP systems aim to integrate all corporate information into one central database,
allowing information to be retrieved from many different organizational positions. In
principle, ERP systems allow any organizational object to be made visible. The major
question is: integration is surely at stake here. Is it possible to integrate the firm's
activities using information systems? Existing literatures on ERP systems have attempted
to address this question.
2.3.1 Advantages of an ERP System
The advantages of ERP systems have been well noted in the literature. Bancroft,
Seip, and Sprengel (1998) and Markus and Tanis (2000) share three advantages of ERP
systems: the ability to better meet various competitive goals, the desire to reengineer
business processes, and the ability to access integrated data. Following the completion of
these changes, researchers expected changes and improvements in terms of increased
9
Reproduced with permission of the copyright owner. Further reproduction prohibited without permission.
1990s, Manufacturing Resource Planning (MRP-II) was further extended to cover areas
such as engineering, finance, purchasing, sales, human resources, and distribution. It was
during this time that enterprise resource planning (ERP) was first used.
A new generation of ERP systems is evolving to provide additional integration,
particularly with customers. These systems, identified as ERP II, integrate traditional
ERP with a Customer Relationship Management (CRM) system in order to better
integrate the requirements of key customers with the firm’s supply chain plans (Bowers
ox at el, 2003).
2.3 Advantages, disadvantages, and the implementation of an ERP system
ERP systems aim to integrate all corporate information into one central database,
allowing information to be retrieved from many different organizational positions. In
principle, ERP systems allow any organizational object to be made visible. The major
question is: integration is surely at stake here. Is it possible to integrate the firm’s
activities using information systems? Existing literatures on ERP systems have attempted
to address this question.
2.3.1 Advantages of an ERP System
The advantages of ERP systems have been well noted in the literature. Bancroft,
Seip, and Sprengel (1998) and Markus and Tanis (2000) share three advantages of ERP
systems: the ability to better meet various competitive goals, the desire to reengineer
business processes, and the ability to access integrated data. Following the completion of
these changes, researchers expected changes and improvements in terms of increased
9
Reproduced with permission of the copyright owner. Further reproduction prohibited without permission.

business flexibility (Bancroft et al., 1998), the ability to make faster responses to business
changes (Bancroft et al., 1998), reduced cycle times and consolidated ordering, improved
marketplace agility, and workforce empowerment (Markus & Tanis, 2000).
In an article emphasizing some advantages and disadvantages of ERP, Yi (2002)
notes that ERP can streamline and modernize business processes, provide accurate real-
time information on how a government is performing from a number of perspectives,
improve services to citizens, and improve internal operations. Companies also use ERP
software to facilitate the exchange of information throughout an organization (Pitturo,
1999). In addition, Yi (2002) notes that an ERP system is beneficial because it links
stand-alone systems into an integrated whole; they also link traditionally stand-alone
departments.
One of the major strengths of the ERP software is its wide availability in the
market. Indeed, many leading firms have adopted SAP or other ERP software
implementations. For many firms, these software packages have allowed them to do
many things that were impossible with earlier, non-integrated software. On-Line
Analytical Processing (OLAP) software (Callaway, 1997) has also enabled managers to
compile and analyze their planned and actual results in a variety of ways.
Asbaugh and Miranda (2002) reported that the major difference between ERP
systems and their predecessors is the ERP system's linkage of financial and human
resource applications through a single database in a software application that is both rigid
and flexible. The authors explained that the rigidity comes from the need to standardize
processes and deter customers from modifying the underlying software source code (i.e.,
10
Reproduced with permission of the copyright owner. Further reproduction prohibited without permission.
business flexibility (Bancroft et al., 1998), the ability to make faster responses to business
changes (Bancroft et al., 1998), reduced cycle times and consolidated ordering, improved
marketplace agility, and workforce empowerment (Markus & Tanis, 2000).
In an article emphasizing some advantages and disadvantages of ERP, Yi (2002)
notes that ERP can streamline and modernize business processes, provide accurate real
time information on how a government is performing from a number of perspectives,
improve services to citizens, and improve internal operations. Companies also use ERP
software to facilitate the exchange of information throughout an organization (Pitturo,
1999). In addition, Yi (2002) notes that an ERP system is beneficial because it links
stand-alone systems into an integrated whole; they also link traditionally stand-alone
departments.
One of the major strengths of the ERP software is its wide availability in the
market. Indeed, many leading firms have adopted SAP or other ERP software
implementations. For many firms, these software packages have allowed them to do
many things that were impossible with earlier, non-integrated software. On-Line
Analytical Processing (OLAP) software (Callaway, 1997) has also enabled managers to
compile and analyze their planned and actual results in a variety of ways.
Asbaugh and Miranda (2002) reported that the major difference between ERP
systems and their predecessors is the ERP system’s linkage of financial and human
resource applications through a single database in a software application that is both rigid
and flexible. The authors explained that the rigidity comes from the need to standardize
processes and deter customers from modifying the underlying software source code (i.e.,
10
Reproduced with permission of the copyright owner. Further reproduction prohibited without permission.

customization), whereas flexibility relates to a customer's ability to "configure" the
software to collect specific data and achieve other business goals.
The primary function of the ERP system is that of integrating information from
diverse applications into a common database (Miranda, 1999). This wide-ranging scope
of the ERP system solved the dilemma of companies who could not afford to develop
their own software solutions for their particular problems. Due to its current popularity in
business circles, Gupta (2000) asserts that ERP is a trend for large and medium
enterprises. However, the author warns that while the short-term effects of the ERP
system can be beneficial, misuse of the software could contribute to the erosion of a
business.
2.3.2 Disadvantages of an ERP System
Despite its advantages, ERP implementation carries with it some risks. Pitturo
(1999) and Yi (2002) both suggest that instituting an ERP system in a company's system
is not as simple as putting software in the heart of the company's operations. Updating
the obsolete system and human resource department, providing an IT team that can
competently handle the ERP system and putting in trustworthy people to manage the
operations are critical for the company.
The failure of ERP systems to meet the expectations of companies and users has
been attributed by researchers to: the inability of the companies and enterprises to
implement the software well (Pitturo, 1999; Yi, 2002); the system's ability to carry out
only 15-20% of an enterprise's operation (White Paper of Exact Software, 2004);
intangible results of the investment (James and Wolf, 2000); a lack of analytic features
11
Reproduced with permission of the copyright owner. Further reproduction prohibited without permission.
customization), whereas flexibility relates to a customer’s ability to "configure" the
software to collect specific data and achieve other business goals.
The primary function of the ERP system is that of integrating information from
diverse applications into a common database (Miranda, 1999). This wide-ranging scope
of the ERP system solved the dilemma of companies who could not afford to develop
their own software solutions for their particular problems. Due to its current popularity in
business circles, Gupta (2000) asserts that ERP is a trend for large and medium
enterprises. However, the author warns that while the short-term effects of the ERP
system can be beneficial, misuse of the software could contribute to the erosion of a
business.
2.3.2 Disadvantages of an ERP System
Despite its advantages, ERP implementation carries with it some risks. Pitturo
(1999) and Yi (2002) both suggest that instituting an ERP system in a company’s system
is not as simple as putting software in the heart of the company’s operations. Updating
the obsolete system and human resource department, providing an IT team that can
competently handle the ERP system and putting in trustworthy people to manage the
operations are critical for the company.
The failure of ERP systems to meet the expectations of companies and users has
been attributed by researchers to: the inability of the companies and enterprises to
implement the software well (Pitturo, 1999; Yi, 2002); the system’s ability to carry out
only 15-20% of an enterprise’s operation (White Paper of Exact Software, 2004);
intangible results of the investment (James and Wolf, 2000); a lack of analytic features
11
Reproduced with permission of the copyright owner. Further reproduction prohibited without permission.
(Castro, 2000); a failure of technology to meet specifications (Barki et al., 1993);
application complexity (Barki et al., 1993); customization and integration complications
(Marinos et al., 2001); user-unfriendly applications (Markus & Tanis, 2000); the
misunderstanding of user requirements (Keil et al., 1998); and the inability to cope with
the changing business environment (White, 2002). The highest probability of successful
implementation of ERP software occurs when there is only a minimal need to change the
business processes and ERP software (O'Leary, 2000).
Moreover, Yi (2002) states that the current success rate of ERP system
implementation is less than 50 percent. This is due to the high cost of the implementation.
In addition to security and cost problems, another issue which confronts the effective
implementation of the ERP system stems from the fact that it determines how the entire
business should be managed (James & Wolf, 2000). This is usually the reason behind the
failure of many program operators to implement ERP, in that they attempt to modify the
software to suit ill-fitting business processes. Many revert from fully embracing the
benefits that ERP offers merely because of the inability of the software to support one of
their many crucial business processes (Piturro, 1999).
2.3.3 The Implementation of an ERP system
While the stream of research in ERP systems did increase, most of the focus of
these studies was on the implementation process and the implementation guidelines of
ERP (Kirchmer, 1999; Scott, 1999; Sumner, 1999). Overall, there are three strands of
literature on ERP systems implementation. The first strand of literature says that firms
implementing ERP systems must go through a learning curve and then benefit from their
12
Reproduced with permission of the copyright owner. Further reproduction prohibited without permission.
(Castro, 2000); a failure of technology to meet specifications (Barki et al., 1993);
application complexity (Barki et al., 1993); customization and integration complications
(Marinos et al., 2001); user-unfriendly applications (Markus & Tanis, 2000); the
misunderstanding of user requirements (Keil et al., 1998); and the inability to cope with
the changing business environment (White, 2002). The highest probability of successful
implementation of ERP software occurs when there is only a minimal need to change the
business processes and ERP software (O’Leary, 2000).
Moreover, Yi (2002) states that the current success rate of ERP system
implementation is less than 50 percent. This is due to the high cost of the implementation.
In addition to security and cost problems, another issue which confronts the effective
implementation of the ERP system stems from the fact that it determines how the entire
business should be managed (James & Wolf, 2000). This is usually the reason behind the
failure of many program operators to implement ERP, in that they attempt to modify the
software to suit ill-fitting business processes. Many revert from fully embracing the
benefits that ERP offers merely because of the inability of the software to support one of
their many crucial business processes (Piturro, 1999).
2.3.3 The Implementation of an ERP system
While the stream of research in ERP systems did increase, most of the focus of
these studies was on the implementation process and the implementation guidelines of
ERP (Kirchmer, 1999; Scott, 1999; Sumner, 1999). Overall, there are three strands of
literature on ERP systems implementation. The first strand of literature says that firms
implementing ERP systems must go through a learning curve and then benefit from their
12
Reproduced with permission of the copyright owner. Further reproduction prohibited without permission.

investment (e.g. Ross & Vitale, 2000). This strand of literature builds on the 'stage-
maturity model' (Nolan, 1979; Hirschheim et al., 1988), which in spite of its criticisms
(e.g. Benbassat et al., 1984; Holland and Light, 2001; King and Kraemer, 1984)
continues to have a lot of appeal, and is often used as a basis for consultants' advice on
ERP systems implementation (Deloitte Consulting, 1998; KPMG Consulting, 1997; PA
Consulting Group, 1999).
A second strand of literature on ERP systems is concerned with performance and
whether or not ERP systems work. Cautious tales suggesting that ERP systems will have
positive financial and productivity effects only if installed correctly (e.g. Davenport,
1995; Davenport, 1998; Davenport, 2000; Koch, 1997) often dominate this strand of
literature. Some find that ERP systems may drive general financial effects, divisional
performance, and even capital market reactions (e.g. Hayes et al., 2001; Hunton et al.,
2002; O'Leary, 2002). Others, however, remain sceptical (e.g. Poston & Grabski, 2001).
There are those who argue that the new ERP system technology illustrates the
potential to become complete calculation machines governing all activities and affairs of
the firm. Cooper and Kaplan (1998), for example, envision profound effects on
management control. Such effects, however, have as of yet been difficult to sustain with
the available empirical evidence. Surveys (Booth et al., 2000; Granlund and Malmi,
2002; Spathis & Constatinides, 2002) suggest that the impact of ERP systems remains
`very moderate,' partly because the systems are not typically designed with change in
mind. They replicate the structure of the existing systems. Others therefore suggest that
ERP systems are enormously powerful juggernauts that may not only become difficult to
control, but that also may eventually strike back (Ciborra, 2000; Hanseth et al., 2001).
13
Reproduced with permission of the copyright owner. Further reproduction prohibited without permission.
investment (e.g. Ross & Vitale, 2000). This strand of literature builds on the ‘stage-
maturity model’ (Nolan, 1979; Hirschheim et al., 1988), which in spite of its criticisms
(e.g. Benbassat et al., 1984; Holland and Light, 2001; King and Kraemer, 1984)
continues to have a lot of appeal, and is often used as a basis for consultants’ advice on
ERP systems implementation (Deloitte Consulting, 1998; KPMG Consulting, 1997; PA
Consulting Group, 1999).
A second strand of literature on ERP systems is concerned with performance and
whether or not ERP systems work. Cautious tales suggesting that ERP systems will have
positive financial and productivity effects only if installed correctly (e.g. Davenport,
1995; Davenport, 1998; Davenport, 2000; Koch, 1997) often dominate this strand of
literature. Some find that ERP systems may drive general financial effects, divisional
performance, and even capital market reactions (e.g. Hayes et al., 2001; Hunton et al.,
2002; O’Leary, 2002). Others, however, remain sceptical (e.g. Poston & Grabski, 2001).
There are those who argue that the new ERP system technology illustrates the
potential to become complete calculation machines governing all activities and affairs of
the firm. Cooper and Kaplan (1998), for example, envision profound effects on
management control. Such effects, however, have as of yet been difficult to sustain with
the available empirical evidence. Surveys (Booth et al., 2000; Granlund and Malmi,
2002; Spathis & Constatinides, 2002) suggest that the impact of ERP systems remains
‘very moderate,’ partly because the systems are not typically designed with change in
mind. They replicate the structure of the existing systems. Others therefore suggest that
ERP systems are enormously powerful juggernauts that may not only become difficult to
control, but that also may eventually strike back (Ciborra, 2000; Hanseth et al., 2001).
13
Reproduced with permission of the copyright owner. Further reproduction prohibited without permission.

The possibly disruptive effects of integrated information, which could cause
disintegration, frighten this set of authors.
In contrast, a third strand of literature is now emerging that is concerned with how
ERP technologies are made to work as 'systems'. Here the system is seen in the context
of numerous organizational concerns and conditions that play themselves out in complex
ways. Quattrone and Hopper (2001), for example, argue that the ERP system never
stabilizes and that change is constant. Caglio (2003) and Scapens and Jazayeri (2003)
relate the impact of the ERP system to the transformation of the roles of management
accountants, while Lodh and Gaffikin (2003) and Newell, Huang, Galliers, and Pan
(2003) follow the implementation of ERP through social and technical networks.
Unlike the first two strands of literature, authors in the third strand identify
noteworthy and sometimes huge effects of ERP systems both in the process of design and
in the process of use. They also begin to explain why the surveys are limited and thus
unable to capture the ERP systems' effects. To understand the impact of ERP systems
requires a heightened attention to controlling the practices across the firm. This strand of
literature suggests that clerical accounting work is shifted out of the accounting function
(Caglio, 2003; Quattrone and Hopper, 2001; Scapens and Jazayeri, 2003). The members
of the organization are said to become 'hybrid-accountants' (Burns & Baldvinsdottir,
1999), and they take on control-work that provides availability and accuracy, and shares
the ability of data (Koch, 1997). The accounting function is possibly unnecessary for
information production.
While an ERP system can prove a large advantage to an enterprise, strong
leadership, a clear implementation plan, a constant watch on the budget, and an explicit
14
Reproduced with permission of the copyright owner. Further reproduction prohibited without permission.
The possibly disruptive effects of integrated information, which could cause
disintegration, frighten this set of authors.
In contrast, a third strand of literature is now emerging that is concerned with how
ERP technologies are made to work as ‘systems’. Here the system is seen in the context
of numerous organizational concerns and conditions that play themselves out in complex
ways. Quattrone and Hopper (2001), for example, argue that the ERP system never
stabilizes and that change is constant. Caglio (2003) and Scapens and Jazayeri (2003)
relate the impact of the ERP system to the transformation of the roles of management
accountants, while Lodh and Gaffikin (2003) and Newell, Huang, Galliers, and Pan
(2003) follow the implementation of ERP through social and technical networks.
Unlike the first two strands of literature, authors in the third strand identify
noteworthy and sometimes huge effects of ERP systems both in the process of design and
in the process of use. They also begin to explain why the surveys are limited and thus
unable to capture the ERP systems’ effects. To understand the impact of ERP systems
requires a heightened attention to controlling the practices across the firm. This strand of
literature suggests that clerical accounting work is shifted out of the accounting function
(Caglio, 2003; Quattrone and Hopper, 2001; Scapens and Jazayeri, 2003). The members
of the organization are said to become ‘hybrid-accountants’ (Bums & Baldvinsdottir,
1999), and they take on control-work that provides availability and accuracy, and shares
the ability of data (Koch, 1997). The accounting function is possibly unnecessary for
information production.
While an ERP system can prove a large advantage to an enterprise, strong
leadership, a clear implementation plan, a constant watch on the budget, and an explicit
14
Reproduced with permission of the copyright owner. Further reproduction prohibited without permission.

stake in the project for business units are needed (Wagle, 1998). Ensuring from the outset
that a company has a strong business case and recognizes the most common pitfalls will
go a long way toward reducing these risks (Dempsey, et. al., 1998).
2.4 Criteria of ERP framework development
In order to promptly develop an ERP system framework suitable for SMEs in
Southeast Asian countries, a decision framework should be considered. Learning to
follow this framework provides assistance to organizations, in identifying common
challenges encountered by project teams when developing enterprise information
systems. By choosing the right team and partners, and by choosing the right system and
data design, companies can substantially increase the performance of their enterprise
system. The provisions that are the main criteria of ERP systems framework development
are as follows;
2.4.1 Integration of the System
All business procedures in an enterprise must be viewed from the market
perspective and optimized throughout all functional areas. To meet the challenges facing
large enterprises in today's constantly changing market, SMEs need an effective system
for all lines of business. Seldom do SMEs have the opportunity to implement a corporate-
wide integration strategy, particularly one that relates competitive systems to corporate
systems. SMEs typically make uniform decisions within a functional area, such as
corporate financial systems, and migrate to a standard solution for all functional areas,
provided that the benefits of dealing with one vendor or one solution outweigh any loss in
15
Reproduced with permission of the copyright owner. Further reproduction prohibited without permission.

functionality. SMEs are looking for complete and integrated solutions from one type of
software. In addition, SMEs have identified the fact that linking business (e.g., financial)
systems with an overall organizational system simplifies and accelerates tasks, improves
the flow of information, and facilitates scheduling and planning decisions based on
consistent data (Khurana, 2000).
2.4.2 Data Integration
Many SMEs recognize the importance of developing an effective enterprise data
strategy with their enterprise information system strategy. SMEs are interested in systems
that offer more sophisticated capabilities with a tighter integration of key business areas,
for example, supply-chain and sales-force automation. ERP system developers recognize
this, and now are adding data warehousing capabilities to their software tools. ERP
system developers are striving to achieve even tighter integration with data mining and
data warehousing. Enterprises are looking for new technological solutions to provide
them with the ability to stay ahead of their competitors. Vendors have begun offering free
extraction and data analysis tools to companies purchasing data warehouses (Kumar,
2000).
2.5 ERP System development and implementation decision framework
An enterprise wide strategy provides an organization with a more process-
oriented, streamlined information system. Consequently, this allows an enterprise to
expand its internal information processing and communication capabilities.
16
Reproduced with permission of the copyright owner. Further reproduction prohibited without permission.
2.5.1 Replacement of the existing system
There are a number of key considerations facing SMEs when deciding whether or
not to replace their current systems. Consider cost savings; a typical driving factor behind
the selection of an enterprise wide solution is the cost savings associated with the
reduction of redundant manual tasks. Enterprises that utilize integrated or best-of-breed
solutions reduce manual tasks significantly, and also reduce the cost of operation and
maintenance (Lee, 2000).
There are a number of other factors that SMEs consider when selecting an
enterprise solution. These include resource allocation, resource requirements, application
development costs, and the payback period. Enterprises have a significant reduction in
resources when making the transition into the new systems environment. SMEs that
decide to implement a new system require support from cross-functional areas. The
number of people required to implement a new application varies widely, depending on
the organization's needs. The number of full-time equivalents (FTEs) who participate in a
migration to the new application can range from as few as six people on a local site to
over one hundred on a worldwide scale.
2.5.2 Will the ERP System support the reengineering effort?
It is not technology that drives the decision to implement an enterprise-integrated
approach. Rather, it is the change of the ways in which many SMEs were conducting the
way they did business. In other words, change is important to supporting the reengineered
business. Reengineering and enterprise application implementation should occur
simultaneously for the organization to maximize the value of the implementation. Many
17
Reproduced with permission of the copyright owner. Further reproduction prohibited without permission.
SMEs are focused on technology-enabled reengineering. In these types of projects,
reengineering processes are constantly identifying how enterprise application packages
add value and the ability of these packages to be implemented. In most situations, the
business case replacing individual lines of business (LOB) systems is a component of an
overall business case to reengineer the organization. Most small firms transform their
existing stove-pipe systems to process-centric organizations (Khurana, 2000).
Other factors that are equally important in the decision to migrate to a new
environment include the elimination of redundant tasks, reduction of duplicate
information and reconciliation tasks, an overall new technology strategy, and the removal
of departmental functions. To identify the need for information access, another key
consideration for many enterprises is deciding whether or not to replace their current
systems. This is a difficulty for them in accessing their operational data. Many enterprises
never capitalize on the wealth of data amidst the maze of multiple legacy systems due to
poor data integrity and quality. Many SMEs replace their existing legacy systems because
they do not provide easy access to information. Enterprises are moving away from
isolated systems toward systems that can share data across different business units and
geographic regions (Huff, 1999).
2.5.3 Utilizing the benefits of technology
In the past, SMEs prolonged their existing systems until more mature client/server
products were available. Only during the past few years has there been any significant
consideration by enterprises of utilizing client/server technology on a large scale. An
increased focus of enterprises during the last few years on purchasing off-the-shelf
18
Reproduced with permission of the copyright owner. Further reproduction prohibited without permission.
client/server packages or developing in-house software is a factor in the selection of an
enterprise-wide solution.
Many of these SMEs in Southeast Asia are interested in taking advantage of the
benefits of their client/server architecture. Some of these enterprises are looking to
change the way they do business in order to reap the benefits of client/server applications.
An important factor in making the transition to an integrated package is to exploit the
client/server capabilities. The graphical user interfaces and distributed computing
resources offer benefits and functional capabilities that are not available in the existing
legacy systems (i.e., having the same look and feel across the organization). Another
reason to make the transition to an integrated package is the potential for tight integration
between the vendor's packaged solution and its data warehouse capabilities. Some
enterprises indicated that they would prefer to have a wait-and-see attitude toward
standardizing one vendor's solution (Huff, 1999).
2.5.4 Enterprise database integration
Ideally, SMEs are striving to achieve a single enterprise database management
system (DBMS) standard. Realistically, most SMEs are supporting multiple legacy and
new databases, due to business requirements. Consequently, SMEs are striving to
simplify their DBMS environment by reducing the number of products they support,
rather than trying to set a single enterprise DBMS standard.
Before selecting data integration technologies, an organization should map out its
current and future data environment/topology. This will provide the SMEs with the
location of key corporate data and user performance requirements for each DBMS. As a
19
Reproduced with permission of the copyright owner. Further reproduction prohibited without permission.

result of documenting the enterprise data landscape, a sound data integration architecture
and data strategy can be completed. Data Conversion Strategy Enterprises develop data
conversion strategies in order to understand some of the challenges and differences in
technology between legacy systems and integrated enterprise systems when converting
data. Many enterprises have old legacy systems based on a database design and system
design that have characteristics including the following: the system operations are
primarily hard coded; data integrity is difficult to maintain; data redundancy is high; and
data integration is low. Also, legacy data usually does not come from just one system. It
can come from many sources that are not all under one business area's control.
Conversion to the new enterprise application is a very complex activity that requires
significant time and resources (Hayes, 2001).
There are many options for data migration (Reck, 2000). Choosing which option
is best depends on how much effort an enterprise is willing to put into data migration, as
well as what type of programming expertise is available in-house. Possible solutions for
transferring legacy data over to the new system include manual loading of the data into
the new system, writing programs/codes to extract and load the data, utilizing target
system vendors' integration solutions for specific application areas (CAD, MRP, data
management), and using computer-aided software engineering (CASE) tools that will
handle one or more data sources when mapping from legacy systems to new systems
(Reck, 2000).
20
Reproduced with permission of the copyright owner. Further reproduction prohibited without permission.

2.6 Enterprise Resource Planning architectural design
The capability of ERP systems is largely dependent on the information
technology, as well as the architectural design and options that are available in the
implementation process. This is because the architectural design for every company may
differ, depending on the industry and the size of the company. Several ERP system
architectural designs have been proposed for use. For instance, Sprott (2000) and Mustafa
and Mejabi (1999) proposed the combination of the best module class from different
vendors, such as the combination of the BAAN production module and the SAP R/3
finance module. On the other hand, Fellner and Turowski (1999) suggested the use of
extensible mark-up language (XML) an architectural design with interface definition
languages that have more powerful technologies to build application systems.
From the controversies plaguing the credibility of the ERP system as a tool in
improving enterprises, there is a need for ERP system developers to prove that the
contention that ERP systems are ineffective is incorrect. This can only be done by
improving the features of the ERP systems and providing other avenues for improvement.
This study contends that ERP system solutions for small and large enterprises should be
separated. Instead of the "one size fits all" approach, the researcher suggests that ERP
systems should start customizing their features to fit certain company sizes and
industries. In this way, the ERP software might prove to be more effective.
For instance, according to Avai (1998), several market trends influence the
architecture of the leading ERP systems, including integrated databases, Client/server
architecture, Three-tier thin client/server architecture, Web Client/server, Web
enablement and Electronic Commerce technologies, and Open systems environment.
21
Reproduced with permission of the copyright owner. Further reproduction prohibited without permission.
2.6 Enterprise Resource Planning architectural design
The capability of ERP systems is largely dependent on the information
technology, as well as the architectural design and options that are available in the
implementation process. This is because the architectural design for every company may
differ, depending on the industry and the size of the company. Several ERP system
architectural designs have been proposed for use. For instance, Sprott (2000) and Mustafa
and Mejabi (1999) proposed the combination of the best module class from different
vendors, such as the combination of the BAAN production module and the SAP R/3
finance module. On the other hand, Fellner and Turowski (1999) suggested the use of
extensible mark-up language (XML) an architectural design with interface definition
languages that have more powerful technologies to build application systems.
From the controversies plaguing the credibility of the ERP system as a tool in
improving enterprises, there is a need for ERP system developers to prove that the
contention that ERP systems are ineffective is incorrect. This can only be done by
improving the features of the ERP systems and providing other avenues for improvement.
This study contends that ERP system solutions for small and large enterprises should be
separated. Instead of the “one size fits all” approach, the researcher suggests that ERP
systems should start customizing their features to fit certain company sizes and
industries. In this way, the ERP software might prove to be more effective.
For instance, according to Avai (1998), several market trends influence the
architecture of the leading ERP systems, including integrated databases, Client/server
architecture, Three-tier thin client/server architecture, Web Client/server, Web
enablement and Electronic Commerce technologies, and Open systems environment.
21
Reproduced with permission of the copyright owner. Further reproduction prohibited without permission.

From these specifications, several factors need to be taken into consideration, according
to Weill (1996). This process involves the search for a framework that assesses the gaps
between architecture requirements and current IT environments to develop
implementation strategies. Avai (1998) and Weill (1996) propose that in providing an
architectural design for ERP systems, the following considerations must be incorporated:
(1) network infrastructure; (2) server platform; (3) database management system; (4) data
ownership; (5) client platform; (6) Web technology; (7) prerequisite user skills; and (8)
IT capacity. This is in accordance with the researchers' observation that many enterprise
architecture efforts have failed because management often views ERP system
implementation as a stand-alone project, unwilling to invest in enterprise infrastructure.
Thus, while successful ERP system implementation is often determined by business and
organizational changes, architectural choices deserve thorough consideration during the
system procurement phase, because the selection of ERP systems have technical and non-
technical impacts on the enterprise as well as the success of the ERP implementation.
Moreover, for companies to maximize the potential of ERP systems, customized
ERP systems are needed for each company (Pitturo, 1999). For instance, a company that
distributes specialty coffees to chains such as Starbucks would probably need inventory
management, sales management and distribution, but could live without manufacturing
and bill of materials modules. Buying from a vendor with customized ERP systems gives
a company a boost up the learning curve and cuts down on customization costs.
An important observation is made by Champy (1997), who notes that companies
should design their package first, implying that the business should be matched to the
software rather than vice versa. While other companies resorted to the building of their
22
Reproduced with permission of the copyright owner. Further reproduction prohibited without permission.
From these specifications, several factors need to be taken into consideration, according
to Weill (1996). This process involves the search for a framework that assesses the gaps
between architecture requirements and current IT environments to develop
implementation strategies. Avai (1998) and Weill (1996) propose that in providing an
architectural design for ERP systems, the following considerations must be incorporated:
(1) network infrastructure; (2) server platform; (3) database management system; (4) data
ownership; (5) client platform; (6) Web technology; (7) prerequisite user skills; and (8)
IT capacity. This is in accordance with the researchers’ observation that many enterprise
architecture efforts have failed because management often views ERP system
implementation as a stand-alone project, unwilling to invest in enterprise infrastructure.
Thus, while successful ERP system implementation is often determined by business and
organizational changes, architectural choices deserve thorough consideration during the
system procurement phase, because the selection of ERP systems have technical and non
technical impacts on the enterprise as well as the success of the ERP implementation.
Moreover, for companies to maximize the potential of ERP systems, customized
ERP systems are needed for each company (Pitturo, 1999). For instance, a company that
distributes specialty coffees to chains such as Starbucks would probably need inventory
management, sales management and distribution, but could live without manufacturing
and bill of materials modules. Buying from a vendor with customized ERP systems gives
a company a boost up the learning curve and cuts down on customization costs.
An important observation is made by Champy (1997), who notes that companies
should design their package first, implying that the business should be matched to the
software rather than vice versa. While other companies resorted to the building of their
22
Reproduced with permission of the copyright owner. Further reproduction prohibited without permission.

own software in order to fit their business, the literature suggests that this largely depends
on the design of the software. According to Waggle (1999), the development of ERP
systems resulted in three IT capabilities in ERP system purchases: the desire to replace
aging mainframe systems with more modem, enterprise-wide client-server architectures,
the replacement of legacy systems that no longer meet the firm's needs, and the desire to
reduce information system costs by buying rather than building software. Thus, the
evolution of the ERP system architecture evolved from a centralized (mainframe-based)
architecture to client server architecture (Levis and von Schilling, 1994). Accordingly,
client-server architectures have been touted as a "modern" enterprise-wide infrastructure
(Levis and Von, 1994) that results in a more flexible, scalable infrastructure (Duane,
1997).
23
Reproduced with permission of the copyright owner. Further reproduction prohibited without permission.
own software in order to fit their business, the literature suggests that this largely depends
on the design of the software. According to Waggle (1999), the development of ERP
systems resulted in three IT capabilities in ERP system purchases: the desire to replace
aging mainframe systems with more modem, enterprise-wide client-server architectures,
the replacement of legacy systems that no longer meet the firm’s needs, and the desire to
reduce information system costs by buying rather than building software. Thus, the
evolution of the ERP system architecture evolved from a centralized (mainframe-based)
architecture to client server architecture (Levis and von Schilling, 1994). Accordingly,
client-server architectures have been touted as a "modem" enterprise-wide infrastructure
(Levis and Von, 1994) that results in a more flexible, scalable infrastructure (Duane,
1997).
23
Reproduced with permission of the copyright owner. Further reproduction prohibited without permission.

Chapter 3
Methodology
This research is primarily focused on the representative Small-and Medium-sized
Enterprises (SMEs) selected from the region of Southeast Asia. The unique
characteristics and requirements of the companies in this region have been studied and
summarized. The surveys and questionnaires were sent to the representative companies in
this region, and then the feedback and data were collected and analyzed for the research
to develop an ERP system framework. The validation and evaluation of the data were
input into the software created, and tested by the representative companies in the region.
3.1 SMEs in Southeast Asian countries
Small and medium enterprises or small-and medium-sized enterprises are
companies whose headcount or turnover falls below certain limits. SMEs, in contrast to
big businesses, have a reputation for innovation. For this reason, and because of their
difficulties in attracting capital, national and regional fostering of SMEs commonly
occurs. Intense competition in the marketplace is forcing SMEs to examine the different
methods by which they could enhance or retain their competitive advantage. Several
SMEs have generated sustained competitive advantages through a continuous stream of
incremental, overarching, and discontinuous innovations. Central to the notion of
technology as a competitive advantage for nations, firms, and industries is the significant
24
Reproduced with permission of the copyright owner. Further reproduction prohibited without permission.
role of small-to medium-sized companies as a source of innovation during the early
stages of new and emerging technologies (Abernathy and Utterback 1978).
3.1.1 Overview of SMEs in the region of Southeast Asia
The apparent failure of ERP Systems to meet the expectations of companies and
observers in enhancing their internal and external operations has led to a refocusing of an
ERP system framework design that is customized for SMEs and the specific industry and
country in which it will be used. In the research of Pitturo (1999) and Yi (2002), they
suggest that the inability of companies and enterprises to implement the system
effectively attributed to the failure of ERP systems in working to meet the expectations of
companies and users. James and Wolf (2000) assert that its failure is its ability to run
only 15-20% of the enterprise's processes, while Castro (2000) attributes it to the lack of
analytical features of the designs. White (2002) suggests that it is in its inability to cope
with the changing business environment.
In SMEs, an ERP system has been regarded as expensive, as well as an
investment that is a big gamble. First, the price of an ERP system is simply too much to
bear for many SMEs, particularly in Southeast Asia. The prohibitive price of the ERP
system prevents other SMEs from making use of such an information system in their
companies. Second, the difficulty in integrating and implementing the ERP in their
company's operations is rigorous and involves many uncertainties. These problems are
just some of the difficulties that enterprises have encountered in the process of integrating
ERP into their company's operations.
25
Reproduced with permission of the copyright owner. Further reproduction prohibited without permission.
role of small-to medium-sized companies as a source of innovation during the early
stages of new and emerging technologies (Abernathy and Utterback 1978).
3.1.1 Overview of SMEs in the region of Southeast Asia
The apparent failure of ERP Systems to meet the expectations of companies and
observers in enhancing their internal and external operations has led to a refocusing of an
ERP system framework design that is customized for SMEs and the specific industry and
country in which it will be used. In the research of Pitturo (1999) and Yi (2002), they
suggest that the inability of companies and enterprises to implement the system
effectively attributed to the failure of ERP systems in working to meet the expectations of
companies and users. James and Wolf (2000) assert that its failure is its ability to run
only 15-20% of the enterprise’s processes, while Castro (2000) attributes it to the lack of
analytical features of the designs. White (2002) suggests that it is in its inability to cope
with the changing business environment.
In SMEs, an ERP system has been regarded as expensive, as well as an
investment that is a big gamble. First, the price of an ERP system is simply too much to
bear for many SMEs, particularly in Southeast Asia. The prohibitive price of the ERP
system prevents other SMEs from making use of such an information system in their
companies. Second, the difficulty in integrating and implementing the ERP in their
company’s operations is rigorous and involves many uncertainties. These problems are
just some of the difficulties that enterprises have encountered in the process of integrating
ERP into their company’s operations.
25
Reproduced with permission of the copyright owner. Further reproduction prohibited without permission.

3.1.2 Characteristics of SMEs in Southeast Asia
According to Carson (1995), SMEs have different characteristics from those of
larger companies. In addition to size, there are a number of qualitative characteristics
which serve to underline the difference. These characteristics may lead to disadvantages
and advantages in the process of globalization. These attributes are summarized as
follows:
o Scope of operations; SMEs serve predominantly a local or regional market rather
than a national or international market.
o Ownership; there is a dependence on a limited number of people, and the
enterprise is generally owned by one person, or at most, a very few people. This
makes the advantages of long term thinking, both stable and risky. Regarding
their advantages, the drawbacks are static thinking, which limits the experience
and knowledge of the owner(s), difficulties to adapt corporate culture to new
situations and challenges, and potential conflicts between corporate objectives and
the personal objectives of the owner. (Recklies 2001)
o Independence, in the sense that they are not part of a large enterprise system, such
as a small division of any metro company. It also means that the firm's owner has
authority and effective control over the business.
o Management style; small firms are generally managed in a personalized fashion.
Managers of small firms tend to know all of the employees personally, they
participate in all aspects of managing the business, and there is no general sharing
of the decision-making process. (Wu, 2003)
26
Reproduced with permission of the copyright owner. Further reproduction prohibited without permission.
3.1.2 Characteristics of SMEs in Southeast Asia
According to Carson (1995), SMEs have different characteristics from those of
larger companies. In addition to size, there are a number of qualitative characteristics
which serve to underline the difference. These characteristics may lead to disadvantages
and advantages in the process of globalization. These attributes are summarized as
follows:
o Scope of operations; SMEs serve predominantly a local or regional market rather
than a national or international market,
o Ownership; there is a dependence on a limited number of people, and the
enterprise is generally owned by one person, or at most, a very few people. This
makes the advantages of long term thinking, both stable and risky. Regarding
their advantages, the drawbacks are static thinking, which limits the experience
and knowledge of the owner(s), difficulties to adapt corporate culture to new
situations and challenges, and potential conflicts between corporate objectives and
the personal objectives of the owner. (Recklies 2001)
o Independence, in the sense that they are not part of a large enterprise system, such
as a small division of any metro company. It also means that the firm’s owner has
authority and effective control over the business,
o Management style; small firms are generally managed in a personalized fashion.
Managers of small firms tend to know all of the employees personally, they
participate in all aspects of managing the business, and there is no general sharing
of the decision-making process. (Wu, 2003)
26
Reproduced with permission of the copyright owner. Further reproduction prohibited without permission.

o Small companies tend to have close relationships with customers and business
partners, and they seem to have the ability to cooperate successfully to the mutual
advantage of these partnerships.
o These firms appear to have simple structures which benefit them in high
flexibility, high adaptability, short reaction times, and cross-functional
communication and cooperation within the organization.
3.1.3 Benefits of an ERP system for SMEs in Southeast Asia
The distinguishing characteristics of SMEs represent both advantages and
disadvantages to SMEs' competitiveness and growth. For instance, compared with large
firms, a relatively small customer base makes it possible for small firms to react more
quickly to customer needs, while a lack of resources and technical experts will prevent
them from entering into the international market. However, ERP systems prefer to
conduct business with the assistance of a computer, database integration, and information
technologies, which can effectively develop the SMEs' advantages and reduce the
drawbacks. In general, small enterprises in Southeast Asia can benefit from an ERP
system in the following ways:
• Organizational and managerial efficiency
• Continuous monitoring of compliance
• Improvement of the enterprise's image
By implementing an ERP system, SMEs are able to improve the management and
organizational efficiency of the whole company. First, they can improve their ability to
manage and control their informational performance by continuously monitoring their
27
Reproduced with permission of the copyright owner. Further reproduction prohibited without permission.
o Small companies tend to have close relationships with customers and business
partners, and they seem to have the ability to cooperate successfully to the mutual
advantage of these partnerships,
o These firms appear to have simple structures which benefit them in high
flexibility, high adaptability, short reaction times, and cross-functional
communication and cooperation within the organization.
3.1.3 Benefits of an ERP system for SMEs in Southeast Asia
The distinguishing characteristics of SMEs represent both advantages and
disadvantages to SMEs’ competitiveness and growth. For instance, compared with large
firms, a relatively small customer base makes it possible for small firms to react more
quickly to customer needs, while a lack of resources and technical experts will prevent
them from entering into the international market. However, ERP systems prefer to
conduct business with the assistance of a computer, database integration, and information
technologies, which can effectively develop the SMEs’ advantages and reduce the
drawbacks. In general, small enterprises in Southeast Asia can benefit from an ERP
system in the following ways:
• Organizational and managerial efficiency
• Continuous monitoring of compliance
• Improvement of the enterprise's image
By implementing an ERP system, SMEs are able to improve the management and
organizational efficiency of the whole company. First, they can improve their ability to
manage and control their informational performance by continuously monitoring their
27
Reproduced with permission of the copyright owner. Further reproduction prohibited without permission.
activities, systematically registering and evaluating informational effects, and
periodically verifying the effectiveness of the whole system. Most of them were not
familiar with systematic and planned management; for these enterprises, the adoption of a
virtuous management cycle aimed at the continuous improvement of their performance
has been a significant step forward, and not only with respect to informational issues. The
management cycle suggested by ISO 14001 has taught some SMEs how to improve their
overall management approach; being able to plan improvement strategies, implement the
necessary actions and verify them by means of a thorough assessment has been a positive
result for many SMEs (Hillary, 1995).
A second benefit emerged from an improved definition of responsibilities and
tasks, achieved via the drafting of formal documents (charts, job descriptions, etc.); this
enabled employees to identify responsible personnel to whom they could refer in relation
to informational aspects and problems. This led SMEs to more effective management of
informational risks. Where it was drafted according to a 'slim line' and 'tailored-to-size'
approach, documentation also represented a significant benefit, by the very act of
formalizing procedures; SMEs could rationalize their activities and improve efficiency
and quality. In many of these small firms, staffs has begun to perform their jobs more
efficiently, simply by following procedures and instructions that they previously ignored
because they were not written and formalized.
Training and informing personnel also accrued benefits in terms of efficiency. By
improving skills and raising employee awareness, SMEs obtained positive management
results. Innovative ways of informing and training employees on informational issues
other than the traditional approach were tested in some pilot projects. Examples of these
28
Reproduced with permission of the copyright owner. Further reproduction prohibited without permission.

new methods are 'co-training' among different small enterprises operating in the same
area or sector and training 'on the job,' by directly testing informational procedures with
the relevant personnel working on the process. A clear example of the benefits achieved
from personnel training is demonstrated by some SMEs that decided to implement a
waste management program. Even where these small enterprises had been previously
separating their waste for collection before ERP systems implementation, they made
positive improvements (and related economic benefits) only when they adopted correct
procedures and appointed adequately trained personnel to implement them (Hillary,
1995).
3.1.4 Practice Differences between North America's system and the system in
Southeast Asia
The large difference between the ERP systems implementation success rate in
North American and Southeast Asian countries produces a need for research examining
generic and unique factors that affect ERP system implementation in Southeast Asia,
since foreign ERP vendors have an ERP system market share of more than 90% (IDC,
1998) in Southeast Asia. Furthermore, Southeast Asian culture is quite different from that
of North America, which can be seen in terms of the four dimensions of national culture
developed by Hofstede (2001), and the unique characteristics of SMEs in Southeast Asia
mentioned in the previous two sections. The dimension of uncertainty avoidance is also
highly relevant to information systems implementation.
In the existing research, the emphasis attached to specific practice varies from
place to place, reflecting different cultures, the differences between high and low GDP
29
Reproduced with permission of the copyright owner. Further reproduction prohibited without permission.
new methods are 'co-training' among different small enterprises operating in the same
area or sector and training 'on the job,’ by directly testing informational procedures with
the relevant personnel working on the process. A clear example of the benefits achieved
from personnel training is demonstrated by some SMEs that decided to implement a
waste management program. Even where these small enterprises had been previously
separating their waste for collection before ERP systems implementation, they made
positive improvements (and related economic benefits) only when they adopted correct
procedures and appointed adequately trained personnel to implement them (Hillary,
1995).
3.1.4 Practice Differences between North America’s system and the system in
Southeast Asia
The large difference between the ERP systems implementation success rate in
North American and Southeast Asian countries produces a need for research examining
generic and unique factors that affect ERP system implementation in Southeast Asia,
since foreign ERP vendors have an ERP system market share of more than 90% (IDC,
1998) in Southeast Asia. Furthermore, Southeast Asian culture is quite different from that
of North America, which can be seen in terms of the four dimensions of national culture
developed by Hofstede (2001), and the unique characteristics of SMEs in Southeast Asia
mentioned in the previous two sections. The dimension of uncertainty avoidance is also
highly relevant to information systems implementation.
In the existing research, the emphasis attached to specific practice varies from
place to place, reflecting different cultures, the differences between high and low GDP
29
Reproduced with permission of the copyright owner. Further reproduction prohibited without permission.
per capita countries, different reward programs, work environment, and work
performances between countries in Southeast Asia and North America, as reported by
Doug Ross at el. (2003).
More important than designing individual reward programs is getting the overall
reward design right and providing the appropriate flexibility needed to fit the employee.
In North America, linking pay to performance is a basis for any reward strategy. In
Southeast Asia, where there is a lower payroll, a competitive guaranteed reward package
appears to be more important. Effective total rewards and performance accountability are
the dimensions with the strongest links to a positive value contribution in both North
America and Southeast Asia.
Maintaining a mutually respectful, flexible workplace environment is naturally
important (Zhang et al., 2004). The questionnaire results indicate that it is a good
concept, but that it is also linked to many more key practices, including trust in
leadership, leadership support, avoiding perquisites based on status, flexibility in work
schedule, and feedback to the employee. The creation of a flexible workplace culture
appears to be more important in North American enterprises than enterprises in Southeast
Asia. In addition, the most successful firms in Southeast Asia are those that adjust their
employees' practices to create a focused workplace, where management and workforce
focuses are on customers and where employees are strongly advocated in the firm's
products and services.
In developed countries, practices such as excessive job security have been
consistently identified as contributing to an overly paternalistic environment where
employees become dependent on the company and cannot afford to move on. The
30
Reproduced with permission of the copyright owner. Further reproduction prohibited without permission.
per capita countries, different reward programs, work environment, and work
performances between countries in Southeast Asia and North America, as reported by
Doug Ross at el. (2003).
More important than designing individual reward programs is getting the overall
reward design right and providing the appropriate flexibility needed to fit the employee.
In North America, linking pay to performance is a basis for any reward strategy. In
Southeast Asia, where there is a lower payroll, a competitive guaranteed reward package
appears to be more important. Effective total rewards and performance accountability are
the dimensions with the strongest links to a positive value contribution in both North
America and Southeast Asia.
Maintaining a mutually respectful, flexible workplace environment is naturally
important (Zhang et al., 2004). The questionnaire results indicate that it is a good
concept, but that it is also linked to many more key practices, including trust in
leadership, leadership support, avoiding perquisites based on status, flexibility in work
schedule, and feedback to the employee. The creation of a flexible workplace culture
appears to be more important in North American enterprises than enterprises in Southeast
Asia. In addition, the most successful firms in Southeast Asia are those that adjust their
employees’ practices to create a focused workplace, where management and workforce
focuses are on customers and where employees are strongly advocated in the firm’s
products and services.
In developed countries, practices such as excessive job security have been
consistently identified as contributing to an overly paternalistic environment where
employees become dependent on the company and cannot afford to move on. The
30
Reproduced with permission of the copyright owner. Further reproduction prohibited without permission.
research identified that providing a secure working environment, coupled with effective
performance management, can be effective both in North American and Southeast Asian
countries.
In countries where the GDP per capita is low, including most countries in
Southeast Asia, enterprises are normally less developed in their application of business
processes and information technology management practices. Their major concern is to
get the fundamentals right, ensuring, for example, that accurate payroll and effective
recruitment and performance management practices are in place. In contrast, enterprises
in North America, with a high GDP per capita, tend to purchase and implement the
system developed by a vendor in this region and are more strategically focused.
3.2 Research design approach
Five case studies are conducted in the present research using a descriptive
approach and a structure focused comparison. The researcher collected current and
contemporary data on the strengths, weaknesses, threats and opportunities of ERP
software on SMEs in Southeast Asian SMEs.
The case study methodology of Yin (1994) is used for this research, in order to
provide a holistic and in-depth investigation of the strengths, weaknesses, and threats of
the ERP software needed by SMEs in Southeast Asia. This is because the case study
methodology uses multiple sources of data for verifying the results of the study. This
research is focused on the following three methods of data gathering: (1) official records
of the financial and technical documents of the five selected SMEs in Southeast Asia; (2)
information collected in the survey and questionnaires completed by the employees and
31
Reproduced with permission of the copyright owner. Further reproduction prohibited without permission.

management of the companies; and (3) personal interviews with the employees and
management of the companies.
3.3 Data collection techniques
Current research gathers ERP systems-related information through surveys and
interviews. Critical financial, IT, and administrative analysis of the statistical data and
documents collected from the five enterprises selected are consequently performed. Both
qualitative and quantitative techniques are used in collecting and analyzing the data.
Thus, the study is both qualitative (interviews and critical analysis of statistics and
documents) and quantitative (survey) in nature.
The researcher treats the five companies as separate cases. Each company is
evaluated comprehensively and thoroughly. The case study methodology proposed by
Yin (1994) is used. The four stages of the process include: (1) Designing the case studies;
(2) Conducting the case studies; (3) Analyzing the case study evidence; and (4)
Developing conclusions, recommendations and implications. From the analysis of these
cases, a Structured Focused Comparison is conducted, as proposed by Benett and George
(1979, 1997). The case studies are first conducted individually, using the same variables
and factors in all five companies. After the case studies are completed, a comparative
approach is conducted in order to create a generalized pattern and conclusion for the
companies in general. The results of the case studies are then employed for the proposed
blueprint of the architectural design.
32
Reproduced with permission of the copyright owner. Further reproduction prohibited without permission.

3.4 Sources of data
The primary sources of data will come from the survey, questionnaires, and
interviews of both managers and employees of the five selected SMEs in Southeast Asia.
The secondary sources shall come from the financial, IT and administrative documents of
the five corresponding companies. Moreover, published articles in ERP systems and IT
journals, articles, magazines, news articles, and books relating to ERP systems shall also
be used. This will serve as the basis for the researcher's assumptions and comparative
data for the results of the survey and the interviews. Furthermore, the researcher shall use
the information from the published literature to clarify whether the results of the research
support or reject assumptions and arguments provided by earlier researchers.
3.5 Demographic profile of the representative companies
The respondents consist of managers and employees of the five representatives
SMEs in Southeast Asian countries. In this section they will be assigned alphabetical
letters, and they will be presented with a brief description in order to provide basic
information about the distinctive features of each company. Additionally the majority of
the respondents have been working for years, and the majority of the respondents are
college graduate. 53% of the respondents have less than two years of service, while the
remaining 47% are those who have been in service for three to five years.
The intended respondents shall be given an alphabetical letter in place of their
name, in order to respect the confidentiality of their identity and any information that
they do not wish to disclose. The respondents' cooperation was eagerly sought, and they
were assured that the data gathered would be treated in the strictest confidence, so that
33
Reproduced with permission of the copyright owner. Further reproduction prohibited without permission.
3.4 Sources of data
The primary sources of data will come from the survey, questionnaires, and
interviews of both managers and employees of the five selected SMEs in Southeast Asia.
The secondary sources shall come from the financial, IT and administrative documents of
the five corresponding companies. Moreover, published articles in ERP systems and IT
journals, articles, magazines, news articles, and books relating to ERP systems shall also
be used. This will serve as the basis for the researcher’s assumptions and comparative
data for the results of the survey and the interviews. Furthermore, the researcher shall use
the information from the published literature to clarify whether the results of the research
support or reject assumptions and arguments provided by earlier researchers.
3.5 Demographic profile of the representative companies
The respondents consist of managers and employees of the five representatives
SMEs in Southeast Asian countries. In this section they will be assigned alphabetical
letters, and they will be presented with a brief description in order to provide basic
information about the distinctive features of each company. Additionally the majority of
the respondents have been working for years, and the majority of the respondents are
college graduate. 53% of the respondents have less than two years of service, while the
remaining 47% are those who have been in service for three to five years.
The intended respondents shall be given an alphabetical letter in place of their
name, in order to respect the confidentiality of their identity and any information that
they do not wish to disclose. The respondents’ cooperation was eagerly sought, and they
were assured that the data gathered would be treated in the strictest confidence, so that
33
Reproduced with permission of the copyright owner. Further reproduction prohibited without permission.

they could be more open. This was done in the hopes that it would promote trust between
the researcher and the respondents. This part of the study is important because only the
respondents can supply the most important data needed to fulfil the objectives of this
study.
Company A
Company A was established in 1968, and is a distributor of electronic components
and devices through offices in Singapore, Japan, Shanghai, and Hong Kong. The
company has a total workforce of 50 employees. In 1998, this firm started operating in
Singapore, and since then, the company's business volume has grown by leaps and
bounds. In order to keep up with this growth and development, Company A began in
2003 to seek a system that could meet its customers' increasing demands, while at the
same time remaining productive as the business expands. According to the Director of
the company, "Company A aims to be the global distribution player in the region, and the
company interest in implementing an integrated ERP system made good sense. Since the
customer demands were varying constantly, the company needed a flexible system that
could be scaled as the business develops and yet is resilient to meet the changing needs of
users at different times."
Company B
Company B's products might be every audiophile's dream, but its software was
far from being ideal, hindering operational effectiveness and threatening to disrupt the
company's expansion and development plans. The Company has US$0.9 million yearly
34
Reproduced with permission of the copyright owner. Further reproduction prohibited without permission.
they could be more open. This was done in the hopes that it would promote trust between
the researcher and the respondents. This part of the study is important because only the
respondents can supply the most important data needed to fulfil the objectives of this
study.
Company A
Company A was established in 1968, and is a distributor of electronic components
and devices through offices in Singapore, Japan, Shanghai, and Hong Kong. The
company has a total workforce of 50 employees. In 1998, this firm started operating in
Singapore, and since then, the company’s business volume has grown by leaps and
bounds. In order to keep up with this growth and development, Company A began in
2003 to seek a system that could meet its customers’ increasing demands, while at the
same time remaining productive as the business expands. According to the Director of
the company, “Company A aims to be the global distribution player in the region, and the
company interest in implementing an integrated ERP system made good sense. Since the
customer demands were varying constantly, the company needed a flexible system that
could be scaled as the business develops and yet is resilient to meet the changing needs of
users at different times.”
Company B
Company B’s products might be every audiophile’s dream, but its software was
far from being ideal, hindering operational effectiveness and threatening to disrupt the
company’s expansion and development plans. The Company has US$0.9 million yearly
34
Reproduced with permission of the copyright owner. Further reproduction prohibited without permission.

in revenue. Company B is employs 25 staff members in Indonesia, and 15 in Malaysia.
Indonesia is the headquarters of the company, and there are offices and service centres in
six Malaysian states. The company implements SAP, which provides accurate and real-
time information on the company's stock level.
Company C
Company C is a business media company which established itself in less than
favourable circumstances, as a push of disparate legacy systems threatened to damage the
business's future plans for development and growth. The Group Finance Director of
Company C asserted that "the company's IT systems were failing in order to keep pace
with the company rapid growth, and putting lots of pressure on the internal resources.
One of the company's core business aims is to "exceed customer expectations". It was
clear that if the company didn't move rapidly, it would soon start to fall short of the
company's expectations." With 45 staff members and global revenues of US$2.0 million,
Company C operates from its two regional bases in Bangkok and Malaysia, and is a
regional leader in business conferences and trade exhibitions. Company C is also known
for its training solutions and as a publisher of specialized print and online magazines.
Company C has a strong corporate culture based on creativity, innovation, quality,
integrity and fun. Each year, it organizes over 100 conferences, 7 major exhibitions and
conducts more than 80 training seminars around the world.
35
Reproduced with permission of the copyright owner. Further reproduction prohibited without permission.
in revenue. Company B is employs 25 staff members in Indonesia, and 15 in Malaysia.
Indonesia is the headquarters of the company, and there are offices and service centres in
six Malaysian states. The company implements SAP, which provides accurate and real
time information on the company’s stock level.
Company C
Company C is a business media company which established itself in less than
favourable circumstances, as a push of disparate legacy systems threatened to damage the
business’s future plans for development and growth. The Group Finance Director of
Company C asserted that “the company’s IT systems were failing in order to keep pace
with the company rapid growth, and putting lots of pressure on the internal resources.
One of the company’s core business aims is to “exceed customer expectations”. It was
clear that if the company didn’t move rapidly, it would soon start to fall short of the
company’s expectations.” With 45 staff members and global revenues of US$2.0 million,
Company C operates from its two regional bases in Bangkok and Malaysia, and is a
regional leader in business conferences and trade exhibitions. Company C is also known
for its training solutions and as a publisher of specialized print and online magazines.
Company C has a strong corporate culture based on creativity, innovation, quality,
integrity and fun. Each year, it organizes over 100 conferences, 7 major exhibitions and
conducts more than 80 training seminars around the world.
35
Reproduced with permission of the copyright owner. Further reproduction prohibited without permission.
Company D
Company D has experienced steady growth with US$ 500,000 annual income and
49 employees. Since 1985, when it was founded in Thailand, it has had the objective of
conceiving, designing and producing special oil-dynamic components for power
transmissions on farm tractors and similar machines. Now Company D is facing
challenges that require expertise that can only sometimes be provided by their foreign
consultants. This poses problems for the clients since consultants are hesitant to interact
with the Asian clients. Thus Company D has had to implement training and measures to
lessen the vulnerability and dependence of the business on its foreign consultants.
Company E
The fifth SME for the study is Company E, which was established in 1976 as a
provider of quality products in the marine industry. Heavy market competition forced
Company E to make organizational changes geared towards improving efficiency. They
installed Material Resource Planning (MRP) software. Following this, they also merged
two separate departments to form a new operations division.
All five of these SMEs in Southeast Asia are aiming for continued development
and growth plans, and three of the companies believe that through the implementation of
an ERP System they can reach this goal and improve even further.
3.6 Data gathering tools
From the case study plan, two instruments are created, reflecting the multi-
method approach: (1) a survey, and (2) semi-structured interviews.
36
Reproduced with permission of the copyright owner. Further reproduction prohibited without permission.
Company D
Company D has experienced steady growth with US$ 500,000 annual income and
49 employees. Since 1985, when it was founded in Thailand, it has had the objective of
conceiving, designing and producing special oil-dynamic components for power
transmissions on farm tractors and similar machines. Now Company D is facing
challenges that require expertise that can only sometimes be provided by their foreign
consultants. This poses problems for the clients since consultants are hesitant to interact
with the Asian clients. Thus Company D has had to implement training and measures to
lessen the vulnerability and dependence of the business on its foreign consultants.
Company E
The fifth SME for the study is Company E, which was established in 1976 as a
provider of quality products in the marine industry. Heavy market competition forced
Company E to make organizational changes geared towards improving efficiency. They
installed Material Resource Planning (MRP) software. Following this, they also merged
two separate departments to form a new operations division.
All five of these SMEs in Southeast Asia are aiming for continued development
and growth plans, and three of the companies believe that through the implementation of
an ERP System they can reach this goal and improve even further.
3.6 Data gathering tools
From the case study plan, two instruments are created, reflecting the multi
method approach: (1) a survey, and (2) semi-structured interviews.
36
Reproduced with permission of the copyright owner. Further reproduction prohibited without permission.
3.6.1 Surveys
A survey illustrating the strengths, weaknesses, threats and opportunities of the
five SMEs in Southeast Asian countries was conducted. A purposive sampling design
was made where the researcher selected only those who were knowledgeable and
involved in the use and implementation of ERP in the enterprise. The general sample size
utilized in the study consisted of fifty (50) respondents, ten (10) for each enterprise. To
evaluate the information gathered, a percentile system is used.
3.6.2 Interviews
Interviews provided an in-depth illustration of the extent of the success or failure
of the enterprise in using ERP systems. They also supplied the information that was
missing in the survey and the statistical and document analysis. Moreover, the interviews
were the primary tool in providing clarifications and verification of the results of the
survey conducted, and in evaluating the suggested features of the ERP software.
Primarily, the researcher utilized the semi-structured interview process to allow the
researcher to probe deeper into issues and ideas that could be crucial for the study.
3.7 Research evaluation
To be able to achieve a high level of credibility for the conclusions presented in
this thesis, it is important to demonstrate that the research was designed and conducted in
such a way that the phenomenon investigated is accurately identified and described.
(Ryan et al, 1992).
37
Reproduced with permission of the copyright owner. Further reproduction prohibited without permission.
For validation purposes, the researcher initially selected five respondents
companies. After the questions were answered, the researcher would ask the respondents
for any suggestions or necessary corrections to ensure further improvement and validity
of the instrument. The researcher examined the content of the interview questions to
determine the reliability of the instrument. The researchers excluded irrelevant questions
and changed words that would be deemed difficult by the respondents to much simpler
terms. The researcher also tallied, scored and tabulated all of the responses in the
provided interview questions.
Concerning the reliability of the thesis, there are a number of potential sources of
errors. The research project is executed using five different companies and
interpretations, and the analysis is based on personal interviews in conjunction with
survey questionnaires. However, by using clear and well-structured questions, the
research has taken the steps necessary to improve the research project's reliability.
3.8 Analysis methodology
The documentary or content analysis technique is used to analyze all of the
necessary and pertinent data gathered during the study. Content analysis is a research tool
used to determine the presence of certain words or concepts within texts or a set of texts,
wherein researchers measure and analyze the meanings and relationships of such words
and concepts. Inferences can then be made about the messages within the texts, the writer
of the text, the audience, as well as the culture and time of which the text is a part.
Content analysis is the objective, systematic and quantitative description of the manifest
content of communication (Berelson, 1952). Accordingly, content analysis is currently in
38
Reproduced with permission of the copyright owner. Further reproduction prohibited without permission.
For validation purposes, the researcher initially selected five respondents
companies. After the questions were answered, the researcher would ask the respondents
for any suggestions or necessary corrections to ensure further improvement and validity
of the instrument. The researcher examined the content of the interview questions to
determine the reliability of the instrument. The researchers excluded irrelevant questions
and changed words that would be deemed difficult by the respondents to much simpler
terms. The researcher also tallied, scored and tabulated all of the responses in the
provided interview questions.
Concerning the reliability of the thesis, there are a number of potential sources of
errors. The research project is executed using five different companies and
interpretations, and the analysis is based on personal interviews in conjunction with
survey questionnaires. However, by using clear and well-structured questions, the
research has taken the steps necessary to improve the research project’s reliability.
3.8 Analysis methodology
The documentary or content analysis technique is used to analyze all of the
necessary and pertinent data gathered during the study. Content analysis is a research tool
used to determine the presence of certain words or concepts within texts or a set of texts,
wherein researchers measure and analyze the meanings and relationships of such words
and concepts. Inferences can then be made about the messages within the texts, the writer
of the text, the audience, as well as the culture and time of which the text is a part.
Content analysis is the objective, systematic and quantitative description of the manifest
content of communication (Berelson, 1952). Accordingly, content analysis is currently in
38
Reproduced with permission of the copyright owner. Further reproduction prohibited without permission.

wide use in diverse fields, ranging from marketing and media studies, to literature and
rhetoric, ethnography and cultural studies, gender and age issues, sociology and political
science, psychology and cognitive science.
Like other research techniques, content analysis must be objective. There should
be no bias involved in the selection and classification of content to be analyzed, in its
sampling design, or in its interpretation of results. To be objective, as much as possible,
all items and aspects in the content to be analyzed were placed in appropriate categories.
In this way, the perception of the researcher was not influenced by factors other than the
true outcome or true frequency counts of the variables involved.
The content analysis that was carried out was systematic, and follows steps in the
scientific method such as recognizing and determining the problem, forming a hypothesis
or hypotheses, doing library work, designing the study, developing the instruments,
collecting the data, analyzing the data and making conclusions and recommendations.
In line with this, the data is analyzed based on the descriptive statistics performed
in data processing. What is more, the content analysis of the documentary materials in
this study was quantitative because the interpretations and conclusions of the findings
depended almost entirely on the output in processing the frequency counts of the
perceptions of the respondents. The occurrences of the perception of the respondents
were tallied one by one; the analysis and interpretation depended upon the frequency of
the occurrences. To further enhance the perception of the respondents, they were also
given time for an interview that was carried out in order to hear their respective insights
into the topic. The interview results were then used to justify their answers.
39
Reproduced with permission of the copyright owner. Further reproduction prohibited without permission.

3.9 Transfer technology
After the survey and questionnaires have been sent out to the representative
companies, the data collected from them will be evaluated, validated and analyzed. Then
with a combination of results and content analysis, the ERP system implementation will
be developed. Once the conceptual framework has been constructed, the Novel ERP
(NERP) system based on the results of the empirical research and framework design
which will be further discussed in the next chapters, will be programmed using Java.
Furthermore, NERP is tested and evaluated by all five selected SMEs in Southeast Asia,
after which another survey and questionnaires will be given out. Once the NERP system
is tested and verified to be the best system for each of the companies (i.e. once they fill in
the required database), the system can move into the operational environment for a short
period of time (with testing taking place at the companies). However, the system
structure and usability may have to be modified in order to run parallel with the existing
system, or integrated with the company's current software.
40
Reproduced with permission of the copyright owner. Further reproduction prohibited without permission.
3.9 Transfer technology
After the survey and questionnaires have been sent out to the representative
companies, the data collected from them will be evaluated, validated and analyzed. Then
with a combination of results and content analysis, the ERP system implementation will
be developed. Once the conceptual framework has been constructed, the Novel ERP
(NERP) system based on the results of the empirical research and framework design
which will be further discussed in the next chapters, will be programmed using Java.
Furthermore, NERP is tested and evaluated by all five selected SMEs in Southeast Asia,
after which another survey and questionnaires will be given out. Once the NERP system
is tested and verified to be the best system for each of the companies (i.e. once they fill in
the required database), the system can move into the operational environment for a short
period of time (with testing taking place at the companies). However, the system
structure and usability may have to be modified in order to run parallel with the existing
system, or integrated with the company’s current software.
40
Reproduced with permission of the copyright owner. Further reproduction prohibited without permission.
Chapter 4
Conceptual Framework
Maintaining the "legacy" of an obsolete system is often costly and problematic.
Vendors stop supporting older versions of their software once the new version is put on
the market. If the software is home-grown, the company must have the staff to support it.
Installing a new system seems like a better alternative, but purchasing software raises
completely different questions. Improvements are likely, but new software without proper
planning and thought about related process improvements and training has only a limited
impact on an organization. Enterprise resource planning systems (ERPs) offer a
comprehensive solution to an organization's system needs (Wah, 2000).
This chapter focuses on designing a framework for the development of an ERP
system for Southeast Asian SMEs and eventually a monitoring and decision-making
support system for companies in Southeast Asia. Conventionally, the framework of an
ERP system follows a specific life cycle in its development. The present research follows
such a life cycle in order to develop a conceptual framework for Novel software. The
framework's life cycle has the following phases: feasibility study, knowledge acquisition,
implementation, testing and validation, and technology transfer (Turban, 1992). The
feasibility study has been mentioned in the previous chapters while knowledge
acquisition and implementation will be introduced in this chapter. Testing and validation
of the system will be presented in the next chapter.
41
Reproduced with permission of the copyright owner. Further reproduction prohibited without permission.
Chapter 4
Conceptual Framework
Maintaining the "legacy” of an obsolete system is often costly and problematic.
Vendors stop supporting older versions of their software once the new version is put on
the market. If the software is home-grown, the company must have the staff to support it.
Installing a new system seems like a better alternative, but purchasing software raises
completely different questions. Improvements are likely, but new software without proper
planning and thought about related process improvements and training has only a limited
impact on an organization. Enterprise resource planning systems (ERPs) offer a
comprehensive solution to an organization's system needs (Wah, 2000).
This chapter focuses on designing a framework for the development of an ERP
system for Southeast Asian SMEs and eventually a monitoring and decision-making
support system for companies in Southeast Asia. Conventionally, the framework of an
ERP system follows a specific life cycle in its development. The present research follows
such a life cycle in order to develop a conceptual framework for Novel software. The
framework’s life cycle has the following phases: feasibility study, knowledge acquisition,
implementation, testing and validation, and technology transfer (Turban, 1992). The
feasibility study has been mentioned in the previous chapters while knowledge
acquisition and implementation will be introduced in this chapter. Testing and validation
of the system will be presented in the next chapter.
41
Reproduced with permission of the copyright owner. Further reproduction prohibited without permission.
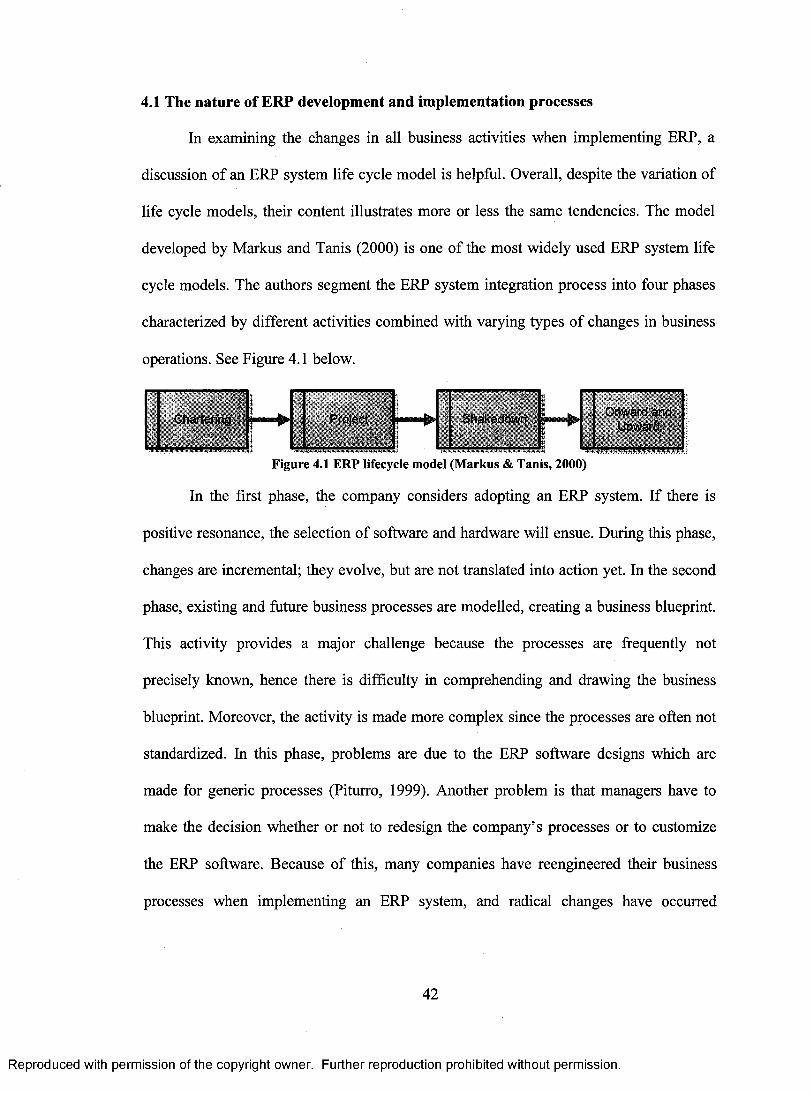
4.1 The nature of ERP development and implementation processes
In examining the changes in all business activities when implementing ERP, a
discussion of an ERP system life cycle model is helpful. Overall, despite the variation of
life cycle models, their content illustrates more or less the same tendencies. The model
developed by Markus and Tanis (2000) is one of the most widely used ERP system life
cycle models. The authors segment the ERP system integration process into four phases
characterized by different activities combined with varying types of changes in business
operations. See Figure 4.1 below.
Shakedown Onward and Upward
Figure 4.1 ERP lifecycle model (Markus & Tanis, 2000)
In the first phase, the company considers adopting an ERP system. If there is
positive resonance, the selection of software and hardware will ensue. During this phase,
changes are incremental; they evolve, but are not translated into action yet. In the second
phase, existing and future business processes are modelled, creating a business blueprint.
This activity provides a major challenge because the processes are frequently not
precisely known, hence there is difficulty in comprehending and drawing the business
blueprint. Moreover, the activity is made more complex since the processes are often not
standardized. In this phase, problems are due to the ERP software designs which are
made for generic processes (Piturro, 1999). Another problem is that managers have to
make the decision whether or not to redesign the company's processes or to customize
the ERP software. Because of this, many companies have reengineered their business
processes when implementing an ERP system, and radical changes have occurred
42
Reproduced with permission of the copyright owner. Further reproduction prohibited without permission.
4.1 The nature of ERP development and implementation processes
In examining the changes in all business activities when implementing ERP, a
discussion of an ERP system life cycle model is helpful. Overall, despite the variation of
life cycle models, their content illustrates more or less the same tendencies. The model
developed by Markus and Tanis (2000) is one of the most widely used ERP system life
cycle models. The authors segment the ERP system integration process into four phases
characterized by different activities combined with varying types of changes in business
operations. See Figure 4.1 below.
Onward and UpwardChartering Shakedown!Project
Figure 4.1 ERP lifecycle model (Markus & Tanis, 2000)
In the first phase, the company considers adopting an ERP system. If there is
positive resonance, the selection of software and hardware will ensue. During this phase,
changes are incremental; they evolve, but are not translated into action yet. In the second
phase, existing and future business processes are modelled, creating a business blueprint.
This activity provides a major challenge because the processes are frequently not
precisely known, hence there is difficulty in comprehending and drawing the business
blueprint. Moreover, the activity is made more complex since the processes are often not
standardized. In this phase, problems are due to the ERP software designs which are
made for generic processes (Piturro, 1999). Another problem is that managers have to
make the decision whether or not to redesign the company’s processes or to customize
the ERP software. Because of this, many companies have reengineered their business
processes when implementing an ERP system, and radical changes have occurred
42
Reproduced with permission of the copyright owner. Further reproduction prohibited without permission.
(Macvittie, 2001). Toward the end of this phase, the ERP system is activated and used in
daily business operations.
The third phase describes the period from 'going live' until 'normal operation' or
`routine use' has been reached. In this phase, the project team fine tunes the performance
of the system and realizes changes in processes and procedures. This can either occur in a
radical manner or in an incremental one, depending on the decisions of the project stage
and other factors, such as inertia to change, company culture, and organizational
structure, to name but a few (Mennel, 2002).
Lastly, in the onward and upward phase, the organization seeks to achieve
continuous business improvement, which incorporates incremental changes. According to
Markus and Tanis (2000) the implementation of an ERP system is a never-ending
procedure of change with no specific outcome. After the fourth stage and the beginning
of the upgrade to the existing system, the ERP life cycle process starts all over again.
However, this time, the changes might be less radical (Mennel, 2002). In this research,
the primary focus is on stage two of the life cycle, which concentrates on the
development and design of an ERP software framework that is customized and suitable
for Southeast Asian SMEs.
4.2 Enterprise Resource Planning development foundation
When the firms introduced extensive computing in order to control and monitor
operations, many of the modules and functions worked fine until time passed and they
needed additional modules or more sophisticated features because the current version was
obsolete. When additional functionality was needed, other applications were developed or
43
Reproduced with permission of the copyright owner. Further reproduction prohibited without permission.
(Macvittie, 2001). Toward the end of this phase, the ERP system is activated and used in
daily business operations.
The third phase describes the period from ‘going live’ until ‘normal operation’ or
‘routine use’ has been reached. In this phase, the project team fine tunes the performance
of the system and realizes changes in processes and procedures. This can either occur in a
radical manner or in an incremental one, depending on the decisions of the project stage
and other factors, such as inertia to change, company culture, and organizational
structure, to name but a few (Mennel, 2002).
Lastly, in the onward and upward phase, the organization seeks to achieve
continuous business improvement, which incorporates incremental changes. According to
Markus and Tanis (2000) the implementation of an ERP system is a never-ending
procedure of change with no specific outcome. After the fourth stage and the beginning
of the upgrade to the existing system, the ERP life cycle process starts all over again.
However, this time, the changes might be less radical (Mennel, 2002). In this research,
the primary focus is on stage two of the life cycle, which concentrates on the
development and design of an ERP software framework that is customized and suitable
for Southeast Asian SMEs.
4.2 Enterprise Resource Planning development foundation
When the firms introduced extensive computing in order to control and monitor
operations, many of the modules and functions worked fine until time passed and they
needed additional modules or more sophisticated features because the current version was
obsolete. When additional functionality was needed, other applications were developed or
43
Reproduced with permission of the copyright owner. Further reproduction prohibited without permission.

purchased. These added modules frequently used inconsistent processes, conflicting
assumptions, and redundant data. In some cases, functional systems were developed
internally by the firms to fit the internal work processes. For SMEs, this investment in an
ERP system is typically rationalized through four factors: business processes,
consistency, economics of scale and integration. These are the four main areas that this
thesis has used as guidance throughout the development of a framework of an ERP
system for SMEs in Southeast Asia.
4.2.1 Fundamental business process
The fundamental necessity of value creation in an organization is having a
process. A business process is a group of logically related tasks that takes input and
transforms it to create output that delivers customer value. A business process is
composed of serial and parallel activities that are needed to deliver value to an
organization's customers. Business processes involve the flow of materials, information,
and business commitments within and outside of process boundaries, and are typically:
o Very dynamic, and must respond to changing customer demands and market
conditions
o Widely distributed, and span across boundaries within and between businesses.
o Long running, with a single process instance running for months or even years.
o Dependent on the judgment of humans. People perform tasks that are too difficult to
delegate to a computer for automation, or tasks that require personal interaction with
customers.
44
Reproduced with permission of the copyright owner. Further reproduction prohibited without permission.
purchased. These added modules frequently used inconsistent processes, conflicting
assumptions, and redundant data. In some cases, functional systems were developed
internally by the firms to fit the internal work processes. For SMEs, this investment in an
ERP system is typically rationalized through four factors: business processes,
consistency, economics of scale and integration. These are the four main areas that this
thesis has used as guidance throughout the development of a framework of an ERP
system for SMEs in Southeast Asia.
4.2.1 Fundamental business process
The fundamental necessity of value creation in an organization is having a
process. A business process is a group of logically related tasks that takes input and
transforms it to create output that delivers customer value. A business process is
composed of serial and parallel activities that are needed to deliver value to an
organization’s customers. Business processes involve the flow of materials, information,
and business commitments within and outside of process boundaries, and are typically:
o Very dynamic, and must respond to changing customer demands and market
conditions
o Widely distributed, and span across boundaries within and between businesses,
o Long running, with a single process instance running for months or even years,
o Dependent on the judgment of humans. People perform tasks that are too difficult to
delegate to a computer for automation, or tasks that require personal interaction with
customers.
44
Reproduced with permission of the copyright owner. Further reproduction prohibited without permission.
There are many ways to categorize a business process. This research will only
focus on standardized business processes, which represent a single way of doing an
activity, in which all employees do the activity the same way all of the time, across
multiple strategic business units. The advantages of standardization are lower process
overhead, less complicated information systems, and more transparency among business
units. In addition, a standardized process can be extended to represent a consistent way of
doing things that can span organizational boundaries (Momentum Software, 2003).
In an ERP system, the basics of business processes are applied to the core or
internal design of the system in many areas, such as the sales department, purchasing
department, inventory control department, and manufacturing department. In the sales
and purchasing departments, it may be necessary for employees to obtain a sales
quotation from a customer, and a supplier quotation from the vendors before issuing the
sales order and purchase order. In the inventory department, employees should fill out a
form to request any components, raw materials or products they withdraw from the
warehouse, so that the company can record any inventory motion in their stock. Last of
all, in the manufacturing department, an employee should inform the system or the
company when they inspect infected products or when products are available to ship to
customers. If the ERP system includes processing paperwork for a new employee or
payroll processing for the company, it is difficult to make these business processes visible
or descriptive; therefore defining them in a documented and logical manner is important.
45
Reproduced with permission of the copyright owner. Further reproduction prohibited without permission.

4.2.2 Consistency
Many firms or divisions of firms involved in the research either developed legacy
systems or purchased software packages to meet their own specific requirements and
processes. Similarly, many acquisitions and mergers that have occurred when SMEs have
grown globally have brought together firms with incompatible legacy systems. The result
was many different systems that providing different and, in many cases, inconsistent
processing. Table 4.1 illustrates a situation in which each firm has different Financial
(FS), Human Resource (HR), Inventory (IV), Production (PD), and Stock Management
(SM) software (modules). The table illustrates the situation in many firms, where some
system components are common across companies while others, such as the financial
component, are unique for each company. The result is that there is inconsistent and
conflicting information and multiple systems that are difficult to maintain and complex to
interpret, since the timing and processes may be different for each.
Company Company Company Company Company A
Financial FS 1 FS2 FS3 FS4 FS5 Human Resource HR1 HR2 HR3 HR4 HR5 Inventory IV 1 IV2 IV2 IV3 IV 1 Production PD 1 PD2 PD3 PD4 PD5 Stock SM1 SM2 SM3 SM2 SM4 Management
Table 4.1 Typical legacy system status of five selected small companies in Southeast Asia
Thus, the second major task of an ERP system for SMEs in Southeast Asia is to
create a system that utilizes consistent data and processes for firms. In the typical
application, the data can be modified with appropriate security and controls using the
transactions available. Likewise, consistent processes allow global customers, employees,
and suppliers to use the same order entry procedure, regardless of where they enter the
46
Reproduced with permission of the copyright owner. Further reproduction prohibited without permission.
4.2.2 Consistency
Many firms or divisions of firms involved in the research either developed legacy
systems or purchased software packages to meet their own specific requirements and
processes. Similarly, many acquisitions and mergers that have occurred when SMEs have
grown globally have brought together firms with incompatible legacy systems. The result
was many different systems that providing different and, in many cases, inconsistent
processing. Table 4.1 illustrates a situation in which each firm has different Financial
(FS), Fluman Resource (HR), Inventory (IV), Production (PD), and Stock Management
(SM) software (modules). The table illustrates the situation in many firms, where some
system components are common across companies while others, such as the financial
component, are unique for each company. The result is that there is inconsistent and
conflicting information and multiple systems that are difficult to maintain and complex to
interpret, since the timing and processes may be different for each.
CompanyA
CompanyB
CompanyC
CompanyD
CompanyE
Financial FS1 FS2 FS3 FS4 FS5Human Resource HR1 HR2 HR3 HR4 HR5Inventory IV1 IV2 IV2 IV3 IV1Production PD1 PD2 PD3 PD4 PD5StockManagement SMI SM2 SM3 SM2 SM4
Table 4.1 Typical legacy system status of five selected small companies in Southeast Asia
Thus, the second major task of an ERP system for SMEs in Southeast Asia is to
create a system that utilizes consistent data and processes for firms. In the typical
application, the data can be modified with appropriate security and controls using the
transactions available. Likewise, consistent processes allow global customers, employees,
and suppliers to use the same order entry procedure, regardless of where they enter the
46
Reproduced with permission of the copyright owner. Further reproduction prohibited without permission.

order. Such a unified perspective offers senior management a consistent and integrated
view of the firm.
4.2.3 Economics of Scale
Bowersox et al., (2003) states that as firms merge and expand globally,
management makes increasing demands to take advantage of global scale economies
through resource validation. An ERP system for SMEs in Southeast Asia should offer
firms potential economies of scale in several ways. First, a single centralized processor or
network of decentralized processors with common configured hardware offers the
potential for substantial procurement and maintenance scale economies. Second, the
centralized ERP systems approach offers significant software scale economy benefits
since only a limited number of software licenses are necessary, with all divisions and
regions using the same application. Another beneficial result is that of the reduced
personnel required to implement and maintain a common ERP system. Finally, the
centralized ERP systems approach increases the potential for a multidivisional firm to
implement shared resources and services across divisions. The ability to review the
production, storage, and transportation resource requirement of multiple divisions in the
common system increases the potential for the sharing of critical resources.
4.2.4 Integration
Enhancing system integration both within the firms and enterprises and between
suppliers and customers is surely another "must have" for ERP development for SMEs in
Southeast Asia. Internal integration results from a common integrated database and the
47
Reproduced with permission of the copyright owner. Further reproduction prohibited without permission.
order. Such a unified perspective offers senior management a consistent and integrated
view of the firm.
4.2.3 Economics of Scale
Bowersox et al., (2003) states that as firms merge and expand globally,
management makes increasing demands to take advantage of global scale economies
through resource validation. An ERP system for SMEs in Southeast Asia should offer
firms potential economies of scale in several ways. First, a single centralized processor or
network of decentralized processors with common configured hardware offers the
potential for substantial procurement and maintenance scale economies. Second, the
centralized ERP systems approach offers significant software scale economy benefits
since only a limited number of software licenses are necessary, with all divisions and
regions using the same application. Another beneficial result is that of the reduced
personnel required to implement and maintain a common ERP system. Finally, the
centralized ERP systems approach increases the potential for a multidivisional firm to
implement shared resources and services across divisions. The ability to review the
production, storage, and transportation resource requirement of multiple divisions in the
common system increases the potential for the sharing of critical resources.
4.2.4 Integration
Enhancing system integration both within the firms and enterprises and between
suppliers and customers is surely another “must have” for ERP development for SMEs in
Southeast Asia. Internal integration results from a common integrated database and the
47
Reproduced with permission of the copyright owner. Further reproduction prohibited without permission.

implementation of common processes across divisions and regions. Typical common
processes included in ERP systems are order entry, order processing, and warehouse
management. Such commonality offers the capability to merge processes and provide
major customers with a common and consistent interface with the firm.
4.3 Conceptual framework development
DeLone and McLean (1992) conducted an extensive literature review on hundreds
of empirical studies published in a number of top Information System journals. One of
the most important of these classifies the dimensions of an Information System success
into six categories, as shown in Figure 4.2. In this figure, system quality and information
quality singularly and jointly affect both use and user satisfaction, while use and user
satisfaction have a positive or negative impact on the other. Use and user satisfaction are
direct antecedents of individual impact. Lastly, this impact on individual performances
should eventually affect the organization's performance.
Moreover, in an involuntary situation of using an integrated manufacturing
system, user satisfaction leads to use, rather than use stimulating user satisfaction
(Baroudi and Davis 1986). Thus, DeLone and McLean's model has a causal and temporal
relationship between each stage. They claim that the causal relationships that exist
between the stages of communication also pertain to the categories of measurement.
Furthermore, ERP research now accepts that technical system quality is necessary, but
not sufficient to ensure its success; however, the DeLone and McLean model might be
seen as suggesting that technical system quality is sufficient.
48
Reproduced with permission of the copyright owner. Further reproduction prohibited without permission.
implementation of common processes across divisions and regions. Typical common
processes included in ERP systems are order entry, order processing, and warehouse
management. Such commonality offers the capability to merge processes and provide
major customers with a common and consistent interface with the firm.
4.3 Conceptual framework development
DeLone and McLean (1992) conducted an extensive literature review on hundreds
of empirical studies published in a number of top Information System journals. One of
the most important of these classifies the dimensions of an Information System success
into six categories, as shown in Figure 4.2. In this figure, system quality and information
quality singularly and jointly affect both use and user satisfaction, while use and user
satisfaction have a positive or negative impact on the other. Use and user satisfaction are
direct antecedents of individual impact. Lastly, this impact on individual performances
should eventually affect the organization’s performance.
Moreover, in an involuntary situation of using an integrated manufacturing
system, user satisfaction leads to use, rather than use stimulating user satisfaction
(Baroudi and Davis 1986). Thus, DeLone and McLean’s model has a causal and temporal
relationship between each stage. They claim that the causal relationships that exist
between the stages of communication also pertain to the categories of measurement.
Furthermore, ERP research now accepts that technical system quality is necessary, but
not sufficient to ensure its success; however, the DeLone and McLean model might be
seen as suggesting that technical system quality is sufficient.
48
Reproduced with permission of the copyright owner. Further reproduction prohibited without permission.

Organizational Impact
Information Quality
Figure 4.2 DeLone and McLean's Information System success model.
User satisfaction is defined as "the extent to which users believe the information
system available to them meets their information requirements" (Ives et al., 1980). Based
on descriptions and evaluations of five existing management information research
frameworks, Ives et al. (1980) proposed inserting a more comprehensive research model
into the framework. There are three information system environments: (1) user
environment, which is described by the characteristics of the user, user's organization,
and user's task; (2) information system development environment, which includes the
development methods and techniques, design personnel and their characteristics, and the
organization and management of the information system; and (3) information system
operation environment, which incorporates the resources necessary for its operations.
The information subsystem is the output of the development process. This process
is comprised of the interactions between the information system and the environments.
The classes of process variables are: (1) the use process, which focuses on the usage of
the system by the primary user, and is usually measured by the task accomplishment
leading to an effect on the productivity and decision making quality; (2) the development
process, which yields the information system by selecting and applying organizational
resources within environmental constraints; and (3) the operation process, which is the
physical operation of the information system and is primarily a function of the operations
49
Reproduced with permission of the copyright owner. Further reproduction prohibited without permission.
InformationQuality
IndividualImpact
UserSatisfaction.<■.... i . a n a a . - w i a .M
SystemQuality Use
OrganizationalImpact
Figure 4.2 DeLone and McLean’s Information System success model.
User satisfaction is defined as “the extent to which users believe the information
system available to them meets their information requirements” (Ives et al., 1980). Based
on descriptions and evaluations of five existing management information research
frameworks, Ives et al. (1980) proposed inserting a more comprehensive research model
into the framework. There are three information system environments: (1) user
environment, which is described by the characteristics of the user, user’s organization,
and user’s task; (2) information system development environment, which includes the
development methods and techniques, design personnel and their characteristics, and the
organization and management of the information system; and (3) information system
operation environment, which incorporates the resources necessary for its operations.
The information subsystem is the output of the development process. This process
is comprised of the interactions between the information system and the environments.
The classes of process variables are: (1) the use process, which focuses on the usage of
the system by the primary user, and is usually measured by the task accomplishment
leading to an effect on the productivity and decision making quality; (2) the development
process, which yields the information system by selecting and applying organizational
resources within environmental constraints; and (3) the operation process, which is the
physical operation of the information system and is primarily a function of the operations
49
Reproduced with permission of the copyright owner. Further reproduction prohibited without permission.

resource, with interfaces at the boundaries of other environments in the form of personal
interactions.
All three of the environments, the three processes and the information subsystem
exist within an organizational environment and an external environment. In their model
(Figure 4.3), Ives et al. claim that the environmental characteristics define the resources
and constraints, which dictate the scope and form of each information subsystem (Ives et
al., 1980).
The External Environment
The Organizational Environment
User Environment
IS Development Environment
IS Operations Environment
The User ( Process
The Operation Process
The Information Subsystem
(ISS)
Figure 4.3 Ives, Hamilton, and Davis's Information System research model
50
Reproduced with permission of the copyright owner. Further reproduction prohibited without permission.
resource, with interfaces at the boundaries of other environments in the form of personal
interactions.
All three of the environments, the three processes and the information subsystem
exist within an organizational environment and an external environment. In their model
(Figure 4.3), Ives et al. claim that the environmental characteristics define the resources
and constraints, which dictate the scope and form of each information subsystem (Ives et
al., 1980).
The External Environment
The Organizational Environment
UserEnvironment
The \ Information V Subsystem i
(ISS) /
DevelopmentEnvironment
The Operation Process
IS Operations Environment
Figure 4.3 Ives, Hamilton, and Davis’s Information System research model
50
Reproduced with permission of the copyright owner. Further reproduction prohibited without permission.

From DeLone and McLean' IS success model, the dependent variables that
measure ERP system implementation success is defined. The theoretical bases for this
study include Ives et al.'s information system research model combined with prior ERP
literature to serve as the basis for independent variable identification, and the McLean
and DeLone's information success model to serve as the basis for dependent variable
definition.
Through combining and adapting constraints, benefits, and characteristics of
SMEs with the existing literature, the strategic change framework is developed and
depicted in Figure 4.4. This framework emphasizes the proper implementation of an ERP
system in Southeast Asian SMEs, and can be categorized into three main parts: user
specification, system specification and organizational specification.
4.3.1 User specification
According to Zhang et al. (2004), the people element greatly impacts
organizational information system implementation and deployment. They reminded that a
lack of care about stakeholders within organizations will result in disaster. As such, a lack
of user education and training and user involvement in the processes of ERP system
implementation can also lead to failure. There are three main factors to consider when
developing an effective ERP system framework for SMEs in Southeast Asia: education
and training, user involvement, and user characteristics.
51
Reproduced with permission of the copyright owner. Further reproduction prohibited without permission.
From DeLone and McLean’ IS success model, the dependent variables that
measure ERP system implementation success is defined. The theoretical bases for this
study include Ives et al.’s information system research model combined with prior ERP
literature to serve as the basis for independent variable identification, and the McLean
and DeLone’s information success model to serve as the basis for dependent variable
definition.
Through combining and adapting constraints, benefits, and characteristics of
SMEs with the existing literature, the strategic change framework is developed and
depicted in Figure 4.4. This framework emphasizes the proper implementation of an ERP
system in Southeast Asian SMEs, and can be categorized into three main parts: user
specification, system specification and organizational specification.
4.3.1 User specification
According to Zhang et al. (2004), the people element greatly impacts
organizational information system implementation and deployment. They reminded that a
lack of care about stakeholders within organizations will result in disaster. As such, a lack
of user education and training and user involvement in the processes of ERP system
implementation can also lead to failure. There are three main factors to consider when
developing an effective ERP system framework for SMEs in Southeast Asia: education
and training, user involvement, and user characteristics.
51
Reproduced with permission of the copyright owner. Further reproduction prohibited without permission.
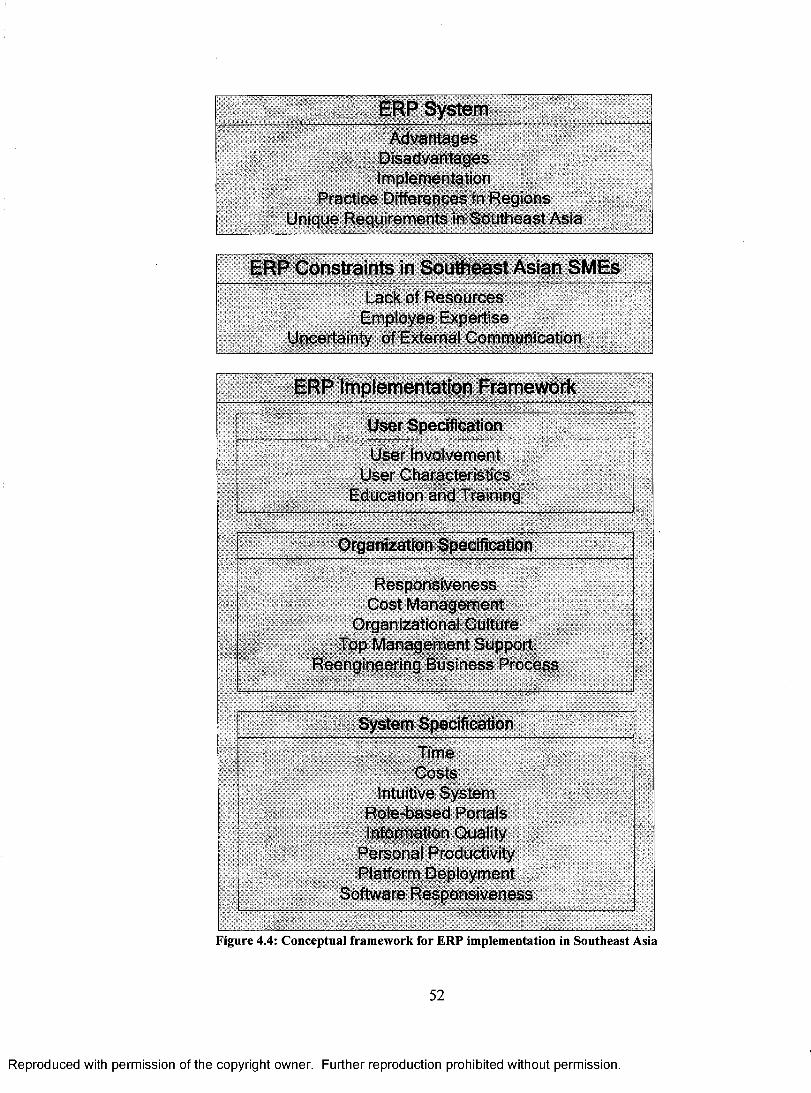
ERP System Advantages
Disadvantages Implementation
Practice Differences in Regions Unique Requirements in Southeast Asia
ERP Constraints in Southeast Asian SMEs Lack of Resources
Employee Expertise Uncertainty of External Communication
ERP Implementation Framework
User Specification
User Involvement User Characteristics
Education and Training
Organization Specification
Responsiveness Cost Management
Organizational Culture Top Management Support
Reengineering Business Process
System Specification
TimeCosts
Intuitive System Role-based Portals Information Quality
Personal Productivity Platform Deployment
Software Responsiveness
Figure 4.4: Conventual framework for ERP imnlementation in Southeast Ash
52
Reproduced with permission of the copyright owner. Further reproduction prohibited without permission.
ERP SystemAdvantages
D isadvantagesImplementation
Practice Differences in Regions Unique Requirements in Southeast Asia
ERP Constraints in Southeast Asian SMEsLack of R esources
Employee Expertise Uncertainty of External Communication
ERP Implementation Framework
User Specification
User Involvement User Characteristics
Education and Training
Organization Specification
R esponsiveness Cost M anagem ent
Organizational Culture Top M anagem ent Support
Reengineering Business Process
System Specification
Time Costs
Intuitive System Role-based Portals Information Quality
Personal Productivity Platform Deployment
Software R esponsiveness
Figure 4.4: Conceptual framework for ERP implementation in Southeast Asia
52
Reproduced with permission of the copyright owner. Further reproduction prohibited without permission.
Education and training refers to the process of providing management and
employees with the logic and overall concepts of the ERP system (Mandal and
Gunasekaran, 2002). With a good knowledge of the system flow, business processes in
the company and good training on software usage, users can make the system perform to
meet expectations.
User involvement refers to the participation in the system development and
implementation processes by representatives of the target user groups (Zhang et al.,
2004). People need to use systems that work the way they do, so if the user is involved in
the design and development stages of the ERP system, it will greatly increase the
familiarity and effectiveness of the system.
According to the Ives et al (1980) research model, the characteristics of different
users may also affect the ERP system design and development, including education level,
sexes, and age, as well as technical-oriented or business-oriented users. Therefore, the
ERP system developer should consider these factors when designing a successful ERP
system for Southeast Asian countries.
4.3.2 Organization specification
Five dimensions of organizational initiative propositions are identified as follows,
and include reengineering business processes, top management support, organizational
culture, cost management and responsiveness:
(1) Reengineering focuses on changing existing business practices. Strategic
reengineering addresses this situation by focusing on designing the organization to
compete. This is accomplished by undertaking strategic initiatives at the start of the
53
Reproduced with permission of the copyright owner. Further reproduction prohibited without permission.

reengineering process. These initiatives seek to provide an understanding of the markets,
competitors, and the position of the organization within the industry.
(2) The CEO of each participating company is involved in most strategic decisions and
major operational decision-making processes in the SMEs. ERP system implementation
needs top management commitment and support, starting with the initiation of the idea
and continuing until its successful implementation (Bingi, Sharma, &Godla, 1999; T.H.
Davenport, 1998; Xu, Nord, Brown, &Nord, 2002).
(3) Living and operating in different cultures will definitely lead to differences in
organizational culture, which varies between the Southeast Asian and North America
regions, and large enterprises and small enterprises.
(4) A full cost management model must be supported by an ERP system to provide a
comprehensive visibility of all costs in the business at the organizational level.
(5) A business needs to be in a position to respond to new requirements, and the
organizational system needs to be ready for it. This has two significant implications on
organizational systems: the first is flexibility, in that changes to Southeast Asian SMEs
are easy to apply as the business adapts to new requirements; the second is that the
enterprises are in a position to promptly accept enhancements that may be necessary to
support local rule or policy changes.
Smaller organizations tend to be more flexible than larger ones, because their
organizational structures are less rigid and can be changed more easily. This also applies
to their business processes. Because of this, and also because they face greater
environmental uncertainty due to lesser influence (Gable & Stewart, 1999), smaller
organizations have the need, and also the means, to be more flexible. As the information
54
Reproduced with permission of the copyright owner. Further reproduction prohibited without permission.

systems in use must be aligned with the business strategy and the current business
processes, they must also offer more flexibility in order to fulfil this requirement.
SMEs are usually much more informal and unstructured in their management
style or definition of strategy than larger companies. This allows them to compete in a
very dynamic and competitive environment through high flexibility and responsiveness.
This is a major reason for SMEs to be always close to their markets and customers.
4.3.3 System specification
In this section eight key areas of influence in the evolution of business practices
are considered, including changes based on a survey of these areas. It then looks at the
methods through which ERP systems support these areas. The requirements of the ERP
system are different from company to company, but the following eight areas seem to
highlight the areas of ERP system specification for SMEs in Southeast Asia, from which
a specific and detailed requirement checklist can be created (Neville, 2004).
1. Time. Almost every aspect of business is under time pressure. Customers are
demanding, and time is money. Efficiency is measured in time, and
manufacturing operations have to operate faster and cheaper then ever before.
SMEs', manufacturers have to work within ever shortening order lead times. This
means an ERP system for SMEs has to support de-coupled manufacturing and
delivery date forecasting, as well as demand management.
2. Costs. Costs are always under pressure; they always were, and always will be.
Most companies are now faced with the more difficult task of achieving more
with the same or less, and that will involve rethinking the ways in which things
55
Reproduced with permission of the copyright owner. Further reproduction prohibited without permission.
systems in use must be aligned with the business strategy and the current business
processes, they must also offer more flexibility in order to fulfil this requirement.
SMEs are usually much more informal and unstructured in their management
style or definition of strategy than larger companies. This allows them to compete in a
very dynamic and competitive environment through high flexibility and responsiveness.
This is a major reason for SMEs to be always close to their markets and customers.
4.3.3 System specification
In this section eight key areas of influence in the evolution of business practices
are considered, including changes based on a survey of these areas. It then looks at the
methods through which ERP systems support these areas. The requirements of the ERP
system are different from company to company, but the following eight areas seem to
highlight the areas of ERP system specification for SMEs in Southeast Asia, from which
a specific and detailed requirement checklist can be created (Neville, 2004).
1. Time. Almost every aspect of business is under time pressure. Customers are
demanding, and time is money. Efficiency is measured in time, and
manufacturing operations have to operate faster and cheaper then ever before.
SMEs’,manufacturers have to work within ever shortening order lead times. This
means an ERP system for SMEs has to support de-coupled manufacturing and
delivery date forecasting, as well as demand management.
2. Costs. Costs are always under pressure; they always were, and always will be.
Most companies are now faced with the more difficult task of achieving more
with the same or less, and that will involve rethinking the ways in which things
55
Reproduced with permission of the copyright owner. Further reproduction prohibited without permission.

are done. An ERP system for SMEs must never be a constraint; it must provide
positive support to process optimization and cost management. A full cost model
should be supported by an ERP system to provide the comprehensive visibility of
all costs in the business, for example, initial costs, production cost, setup cost,
profit, and utilities cost. Another aspect of cost is the ERP cost itself. Packaged
ERP software is always too expensive for SMEs, especially SMEs in Southeast
Asian countries. The developer of the ERP system should bear in mind that
programming the software with free programming languages, free database
programming languages and open-source codes is very important and essential for
the development of an ERP system for Southeast Asian SMEs.
3. Responsiveness. A business in Southeast Asia needs to be in a position to respond
to new requirements, and the ERP system needs to be ready for it. This has two
significant implications for ERP systems: the first is flexibility, in that changes to
the ERP must be easy to apply as the business adapts to new requirements; the
second is that the ERP software must be in a position to promptly provide the
ERP enhancement that may be necessary in order to support local rule changes.
4. Personal Productivity. People need to use systems that work the way they do, so
an ERP system must be configurable to support business processes and individual
roles. Ease of use is more than user-friendly screens, it is about minimizing the
cost of doing a job, through the automation of data collection, minimizing
keystrokes and providing the information where and when it is needed.
5. Platform deployment. Browser-based (web-based or thin client) applications are
assumed to provide low-footprint clients with centralized support. On the other
56
Reproduced with permission of the copyright owner. Further reproduction prohibited without permission.
hand, the thick client or so-called old fashioned Server/client platform is more
reliable, and it is easier to maintain for companies with local centralized support.
Fortunately, the technology exists in a realistic new hybrid platform; a slim
platform offers advantages from both thick and thin platforms, while reducing
their disadvantages. SMEs should take into account the performance, cost,
technology, and implementation limitations of running transactional systems on
different platforms.
6. Intuitive Systems. The new ERP environment means there is more data captured
at the source, and there is a wider direct use of systems to improve operational
efficiency. SMEs should no longer expect all system users to be IT experts,
particularly if they may not be with them for long, may not be direct employees or
may not even speak the local language, which are unique requirements, especially
for countries in Southeast Asia. An ERP system for SMEs in this region should be
intuitive for use in the context of the job to be done, as every company, every job
and every individual has differences.
7. Role-based portals. Once an individual performs one repetitive clerical task, a
menu-driven ERP system is acceptable. A good ERP for SMEs should allow
tasks, transactions and supporting applications, whether internal or external, to be
readily accessible from a single portal with a minimal number of keystrokes.
8. Information Quality. Since ERP system modules are intricately linked to one
another, inaccurate data input into one module will adversely affect the
functioning of the other modules. The quality of data input should equal the
quality of data output.
57
Reproduced with permission of the copyright owner. Further reproduction prohibited without permission.
4.4 Discussion
As proposed in the previous section, organizational specification, user
specification, and ERP system specification, as well as the characteristics of SMEs and
ERP systems themselves impact the development of an ERP system conceptual
framework among SMEs in Southeast Asia. This section includes further discussion on
the previous section of this chapter.
4.4.1 Southeast Asian SME features
SME features can be specified as follows: low levels of organizational hierarchy,
CEO involvement in operational decisions, "blurred" departmental walls, short lead-time
in manufacturing, and high staff turnover. In his study of Southeast Asian SMEs, Huin
(2004) found that the average number of structural hierarchies found in SMEs is
relatively low. The CEO is involved in most strategic decisions and major operational
decision-making processes in the SME. At the middle level are two distinct groups of
direct operational managers: the professionals and the "up-graders." The former have
professional education and rich experience, while most members of the latter group are
managers with years of related work experience and an intimate knowledge of the
operational tasks. At the execution level are the professionals. With globalization and
increasing competition, more professionals are hired for these line execution jobs. This
group is usually made up of IT experts, and spearheads the ERP project adoption.
SMEs also have "blurred" department walls, a fact which often results in a
conflict of interests. The overlap of departmental boundaries can, indeed, result in some
58
Reproduced with permission of the copyright owner. Further reproduction prohibited without permission.
4.4 Discussion
As proposed in the previous section, organizational specification, user
specification, and ERP system specification, as well as the characteristics of SMEs and
ERP systems themselves impact the development of an ERP system conceptual
framework among SMEs in Southeast Asia. This section includes further discussion on
the previous section of this chapter.
4.4.1 Southeast Asian SME features
SME features can be specified as follows: low levels of organizational hierarchy,
CEO involvement in operational decisions, “blurred" departmental walls, short lead-time
in manufacturing, and high staff turnover. In his study of Southeast Asian SMEs, Huin
(2004) found that the average number of structural hierarchies found in SMEs is
relatively low. The CEO is involved in most strategic decisions and major operational
decision-making processes in the SME. At the middle level are two distinct groups of
direct operational managers: the professionals and the “up-graders.” The former have
professional education and rich experience, while most members of the latter group are
managers with years of related work experience and an intimate knowledge of the
operational tasks. At the execution level are the professionals. With globalization and
increasing competition, more professionals are hired for these line execution jobs. This
group is usually made up of IT experts, and spearheads the ERP project adoption.
SMEs also have “blurred” department walls, a fact which often results in a
conflict of interests. The overlap of departmental boundaries can, indeed, result in some
58
Reproduced with permission of the copyright owner. Further reproduction prohibited without permission.
benefits for the SMEs. However, managers must contain the "blurred" department wall
issue when managing a more formal and structured system such as ERP.
Production modes in Southeast Asian SMEs can also affect the adoption and
implementation of an ERP system. The interdependency between US- and Europe-based
first- and second-tier companies and Southeast Asian-based third-tier companies impacts
how the SME's internal and external supply chain network is designed. To maintain a
competitive advantage, the operational characteristics of SMEs often differ from those
found in larger corporations, which have better control over their sales and production
forecasts. All of this has strong implications on how and whether generic ERP systems
can be adopted and implemented by Southeast Asian SMEs.
Planning and forecasting in SMEs have a direct effect on the decision to adopt
and employ ERP systems. Because Southeast Asian SMEs often operate as third-tier
supporting manufacturers, the finished items produced largely depend on what the larger
manufacturers are selling. As a result, the yearly planning forecast only serves as a rough
guide to the direction of sales and production rather than the true production plans of the
enterprise. Consequently, this could disrupt the entire project implementation, since the
master production scheduling process is the primary driver in ERP.
In many Southeast Asian countries, the industrial sector has exhibited tremendous
growth in the last decade. According to the Singapore Economic Development Board, the
region had the highest foreign direct investment worldwide prior to 1997/1998. In
countries with a relatively small population, such as Singapore and Malaysia, labour has
become a crucial input. However, there has been an increasing labour turnover rate in
SMEs in the region. This partly reflects how Southeast Asian SMEs manage their labour
59
Reproduced with permission of the copyright owner. Further reproduction prohibited without permission.
benefits for the SMEs. However, managers must contain the “blurred” department wall
issue when managing a more formal and structured system such as ERP.
Production modes in Southeast Asian SMEs can also affect the adoption and
implementation of an ERP system. The interdependency between US- and Europe-based
first- and second-tier companies and Southeast Asian-based third-tier companies impacts
how the SME’s internal and external supply chain network is designed. To maintain a
competitive advantage, the operational characteristics of SMEs often differ from those
found in larger corporations, which have better control over their sales and production
forecasts. All of this has strong implications on how and whether generic ERP systems
can be adopted and implemented by Southeast Asian SMEs.
Planning and forecasting in SMEs have a direct effect on the decision to adopt
and employ ERP systems. Because Southeast Asian SMEs often operate as third-tier
supporting manufacturers, the finished items produced largely depend on what the larger
manufacturers are selling. As a result, the yearly planning forecast only serves as a rough
guide to the direction of sales and production rather than the true production plans of the
enterprise. Consequently, this could disrupt the entire project implementation, since the
master production scheduling process is the primary driver in ERP.
In many Southeast Asian countries, the industrial sector has exhibited tremendous
growth in the last decade. According to the Singapore Economic Development Board, the
region had the highest foreign direct investment worldwide prior to 1997/1998. In
countries with a relatively small population, such as Singapore and Malaysia, labour has
become a crucial input. However, there has been an increasing labour turnover rate in
SMEs in the region. This partly reflects how Southeast Asian SMEs manage their labour
59
Reproduced with permission of the copyright owner. Further reproduction prohibited without permission.
resources. Also, as labour is considered a principal input in ERP projects, high labour
turnover rates could negatively impact ERP implementation in SMEs.
4.4.2 ERP Systems in Southeast Asian SMEs
Despite the fact that ERP software has been around for years, and is set as a
standard in operating equipment in most companies in the US and Europe, the
applications of ERP systems are not popular among business organizations in Southeast
Asia. ERP is barely heard of among the scores of financial managers of SMEs in the
region, let alone implemented. A delay in ERP's use comes from the million-dollar price
tags and lengthy installation periods, even when consideration is given to the benefits of
an ERP system. There are many instances where these financial managers have turned to
less expensive, function-specific software more willingly than to a full-blown ERP
system implementation.
4.4.3 Implications for business practitioners
Enterprise resource planning is just an instrument, a resource with a very high
potential at best. Usually, as indicated in this thesis, ERP systems can also be an
obstruction. Therefore, SME managers should strive to acquire knowledge sufficient to
understanding the business improvement opportunities that an ERP system can provide.
This involves ensuring that managers consult with and are surrounded by knowledgeable
experts and to secure that ERP system ventures have a strategic fit and purpose.
Managers should also be prepared to be involved in large investments, with a relatively
60
Reproduced with permission of the copyright owner. Further reproduction prohibited without permission.
resources. Also, as labour is considered a principal input in ERP projects, high labour
turnover rates could negatively impact ERP implementation in SMEs.
4.4.2 ERP Systems in Southeast Asian SMEs
Despite the fact that ERP software has been around for years, and is set as a
standard in operating equipment in most companies in the US and Europe, the
applications of ERP systems are not popular among business organizations in Southeast
Asia. ERP is barely heard of among the scores of financial managers of SMEs in the
region, let alone implemented. A delay in ERP’s use comes from the million-dollar price
tags and lengthy installation periods, even when consideration is given to the benefits of
an ERP system. There are many instances where these financial managers have turned to
less expensive, function-specific software more willingly than to a full-blown ERP
system implementation.
4.4.3 Implications for business practitioners
Enterprise resource planning is just an instrument, a resource with a very high
potential at best. Usually, as indicated in this thesis, ERP systems can also be an
obstruction. Therefore, SME managers should strive to acquire knowledge sufficient to
understanding the business improvement opportunities that an ERP system can provide.
This involves ensuring that managers consult with and are surrounded by knowledgeable
experts and to secure that ERP system ventures have a strategic fit and purpose.
Managers should also be prepared to be involved in large investments, with a relatively
60
Reproduced with permission of the copyright owner. Further reproduction prohibited without permission.

obscure pay-back and pay-back period. However, this does not mean committing to ERP
systems investments without scrutiny.
Southeast Asian SMEs managers also consider the value of uniqueness.
Uniqueness can come from the system and/or the use of the system, but uniqueness is
always in relation to competitors' cost, regardless of the protection strategy. Managers
must understand what system uniqueness is worth to them, and asks themselves: is the
ERP system a strategic resource? Or is it something needed simply to stay in the game?
Furthermore, ERP system investments challenge not just the finances of the firm, but also
the existing knowledge bases and culture. Managers must make sure they are prepared to
pursue the potential improvements in the face of these challenges.
In selecting an ERP system for an organization, it is important that SME
managers consider that there are also steps and enterprise evaluations that should be
made. Davenport (1996) recommends the consideration of two important factors in
selecting ERP software: (1) given the organizational, technological and behavioral impact
of ERP systems, a broad perspective of the ERP systems adoption implementation
process is needed; and (2) certain issues specific to these systems have to be taken into
account, such as the unsuitability, most of the time, of ERP system software
modifications in meeting institutionalized business operations and the extent of business
processes requiring re-engineering prior to the implementation of the software.
Included in the first consideration is a clear enterprise vision that this choice will
clarify the goals of the organization (Holland & Light, 1999). This is particularly
important for SMEs who need to maximize their resources and invest wisely. This is the
reason why Stefanou (1999) suggests that organizational constraints should first be
61
Reproduced with permission of the copyright owner. Further reproduction prohibited without permission.

evaluated and addressed. Managers should also address internal problems, such as
resistance to change, prestige, job security feelings and departmental politics that may
hinder the success of the change.
4.5 Customized Novel ERP System for Southeast Asian SMEs
In developing a Novel ERP system (NERP) for the SMEs in the region discussed
previously, a unified view of data, streamlined processes, improved data integrity,
common application architecture, and the complexity of implementing an ERP system
must all be taken into consideration. It should be noted that the challenge of system
development may be overlooked by keeping the existing systems running during the
phased transition process. The system should therefore be constructed to ensure a smooth
transition during the implementation and testing processes. Based on the framework
proposed in previous sections, a Novel ERP system that satisfies the requirements and
meets the needs of SMEs in Southeast Asia has been created.
4.5.1 User specification
After the data has been gathered and the surveys and questionnaires received,
studies of the data and survey results need to be performed in order to explore the
common needs and identify the common problems of the chosen enterprises. Three
common processes required for the ERP systems are summarized in the detailed analysis
of collected data from the representative SMEs in Southeast Asia. These three common
processes are the revenue process, expenditure process, and production process. All three
62
Reproduced with permission of the copyright owner. Further reproduction prohibited without permission.

seem to have a causal relationship with each other, and they appear to have complex
interior relationships with the sub-processes.
The revenue process starts with two ways of communication and information
gathering between sales agents and customers. After the negotiation or sales quotation are
completed, the sales invoice is issued, and the decision of whether to purchase the raw
material or start production is made. Once the companies have the required amount of
products/raw material, it will be shipped to the customer with a shipping invoice and
sales invoice. The sales receipt and sales report will be obtainable once the products are
paid for by the customer, and the sales commission transaction will be sent to the human
resources department for their record.
The expenditure process is casually related to the revenue process at the time
when companies run short of products or raw materials. If the inventory shortage report
or internal order has been created from the purchase order transaction, the purchase
quotation is sent to the suppliers. When the negotiation is completed, the purchase order
is sent to the original department that placed the order. Once the purchase invoice is paid,
the purchase receipt and shipping invoice are sent out from the supplier. The received
products/raw materials are then recorded in the inventory or used in the production
process.
The production process varies from company to company, and therefore only
common tasks and processes will be covered in this research. Every product starts with
the design process, followed by the initial cost estimation. After that comes a decision
from management. If the product design is approved, the cost estimation, including the
raw material cost, production cost, initial cost, utilities cost, and labour cost are
63
Reproduced with permission of the copyright owner. Further reproduction prohibited without permission.

calculated as an expense. Afterwards, production planning, production scheduling, raw
material requirement, and labour management are determined for the preparation of the
production process. Once the products are introduced into the market, demand forecasts
are calculated based on customer demand. After all of this, the cost estimation process,
planning and scheduling process, and labour scheduling will be repeated again to
optimize the profit.
These processes can then be summarized in three cycles for easier demonstration,
namely the revenue cycle, expenditure cycle, and production cycle.
64
Reproduced with permission of the copyright owner. Further reproduction prohibited without permission.

Commission
1.0
Sales
Information Gathered
Answer all 1 Questions
(Information)
Purchase
Payment Documents
4.0
Sales Receipt
Purchasing Production Needed? Needed?
Expenditure Cycle
Shipping Invoice
Sales Receipt-
Products Information
30
Sales invoice
Figure 4.5 Relationships within the Revenue Cycle
The revenue cycle covers all of the sales activities that are under the four main
cycles. This includes the sale process, which is divided into Sale Quotation and Sale
Order. It also includes the shipping process, which is in the Picking List and Delivery
Order. Net is the payment process consisting of the sales invoice and payment
confirmation. Finally, there is the sales receipt which gives the customer receipts. Figure
4.5 shows how this cycle operates.
65
Reproduced with permission of the copyright owner. Further reproduction prohibited without permission.
Com m ission
InformationG athered
ProductionN eeded?
PurchasingN eeded?
A nsw er all Q uestions
(Information)
ProductsInformationP u rch ase
Shipping Invoice
S a le s R eceiptS a le s ti
Paym ent D ocum ents
S a le s Ri
CycleCycle
Shipping
2 0
Figure 4.5 Relationships within the Revenue Cycle
The revenue cycle covers all of the sales activities that are under the four main
cycles. This includes the sale process, which is divided into Sale Quotation and Sale
Order. It also includes the shipping process, which is in the Picking List and Delivery
Order. Net is the payment process consisting of the sales invoice and payment
confirmation. Finally, there is the sales receipt which gives the customer receipts. Figure
4.5 shows how this cycle operates.
65
Reproduced with permission of the copyright owner. Further reproduction prohibited without permission.
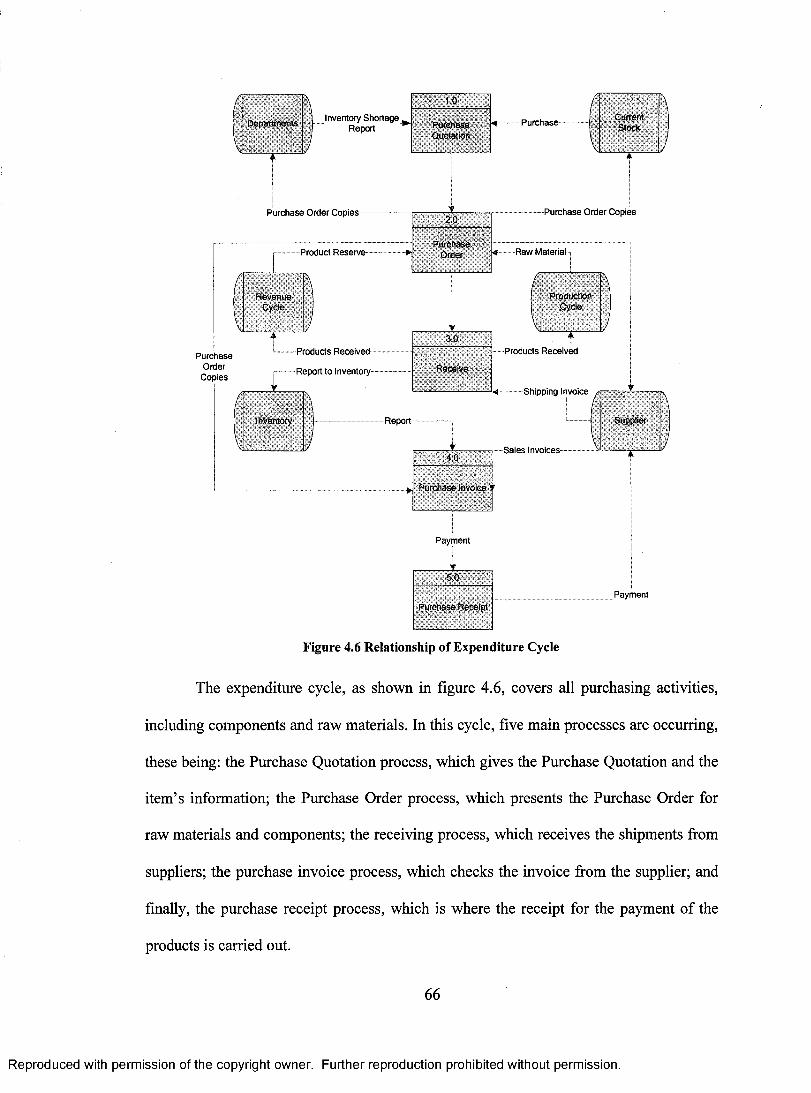
Purchase Order Copies
Departments
A
Inventory Shortage Report
Purchase Order Copies
Product Reserve
Revenue Cycle
1.
Products Received
Report to Inventory
1.0
Purchase Quotation
2.0
Purchase., •..: Order
10
ReceiVe
Purchase Current ''Stock
Purchase Order Copies
Raw Materiah
RI:eduction Cycle
Products Received
Shipping Invoice
Report
_Y Sales Invoices 4.0
Purchase Invoice.
Payment
5.0
::.purchase Receipt
Supplier
Payment
Figure 4.6 Relationship of Expenditure Cycle
The expenditure cycle, as shown in figure 4.6, covers all purchasing activities,
including components and raw materials. In this cycle, five main processes are occurring,
these being: the Purchase Quotation process, which gives the Purchase Quotation and the
item's information; the Purchase Order process, which presents the Purchase Order for
raw materials and components; the receiving process, which receives the shipments from
suppliers; the purchase invoice process, which checks the invoice from the supplier; and
finally, the purchase receipt process, which is where the receipt for the payment of the
products is carried out.
66
Reproduced with permission of the copyright owner. Further reproduction prohibited without permission.
1.0
Departments Inventory ShortageReport *■ Puri
«* Purchase
Purchase Order Copies2.0
Product Reserve
— r \
Order
RevenueCycle
vis
Purchase Order Copies
Raw Material
PurchaseOrder
Copies
Products Received
Report to Inventory
3.0
Receive
Products Received
Inventory
Shipping Invoice
-R eport-
.4.0
Sales Invoices
Purchase Invoice1
Payment
▼. . 50
Purchase ReceiptPayment
Figure 4.6 Relationship of Expenditure Cycle
The expenditure cycle, as shown in figure 4.6, covers all purchasing activities,
including components and raw materials. In this cycle, five main processes are occurring,
these being: the Purchase Quotation process, which gives the Purchase Quotation and the
item’s information; the Purchase Order process, which presents the Purchase Order for
raw materials and components; the receiving process, which receives the shipments from
suppliers; the purchase invoice process, which checks the invoice from the supplier; and
finally, the purchase receipt process, which is where the receipt for the payment of the
products is carried out.
66
Reproduced with permission of the copyright owner. Further reproduction prohibited without permission.
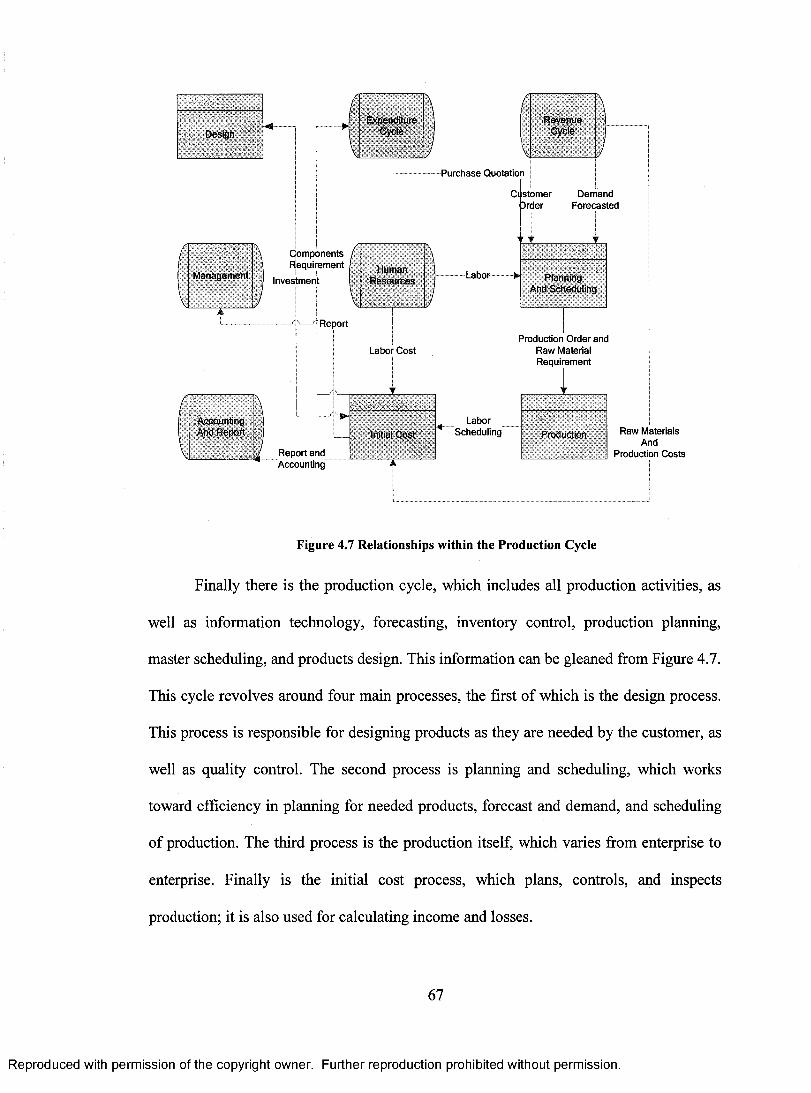
Accounting And Report
Revenue Cycle
Purchase Quotation
C stomeri ..) Demand rder Forecasted
Components Requirement
Investment
I
Human Resources Labor Planning
And Scheduling
Report
Production Order and Labor Cost Raw Material
Requirement
Report and Accounting
Initial Cost Labor
Scheduling Production Raw Materials And
Production Costs
Figure 4.7 Relationships within the Production Cycle
Finally there is the production cycle, which includes all production activities, as
well as information technology, forecasting, inventory control, production planning,
master scheduling, and products design. This information can be gleaned from Figure 4.7.
This cycle revolves around four main processes, the first of which is the design process.
This process is responsible for designing products as they are needed by the customer, as
well as quality control. The second process is planning and scheduling, which works
toward efficiency in planning for needed products, forecast and demand, and scheduling
of production. The third process is the production itself, which varies from enterprise to
enterprise. Finally is the initial cost process, which plans, controls, and inspects
production; it is also used for calculating income and losses.
67
Reproduced with permission of the copyright owner. Further reproduction prohibited without permission.
R evenueCycleCycle
Purchase Quotation
CustomerOrder
DemandForecasted
omponents / equipment : ■ Human
Labor Planning And Scheduling
Investment
Report
Production Order and Raw Material Requirement
Labor Cost
LaborScheduling
, Accounting I And Report Raw Materials
AndProduction Costs
Initial Cost Production
Report and Accounting
Figure 4.7 Relationships within the Production Cycle
Finally there is the production cycle, which includes all production activities, as
well as information technology, forecasting, inventory control, production planning,
master scheduling, and products design. This information can be gleaned from Figure 4.7.
This cycle revolves around four main processes, the first of which is the design process.
This process is responsible for designing products as they are needed by the customer, as
well as quality control. The second process is planning and scheduling, which works
toward efficiency in planning for needed products, forecast and demand, and scheduling
of production. The third process is the production itself, which varies from enterprise to
enterprise. Finally is the initial cost process, which plans, controls, and inspects
production; it is also used for calculating income and losses.
67
Reproduced with permission of the copyright owner. Further reproduction prohibited without permission.
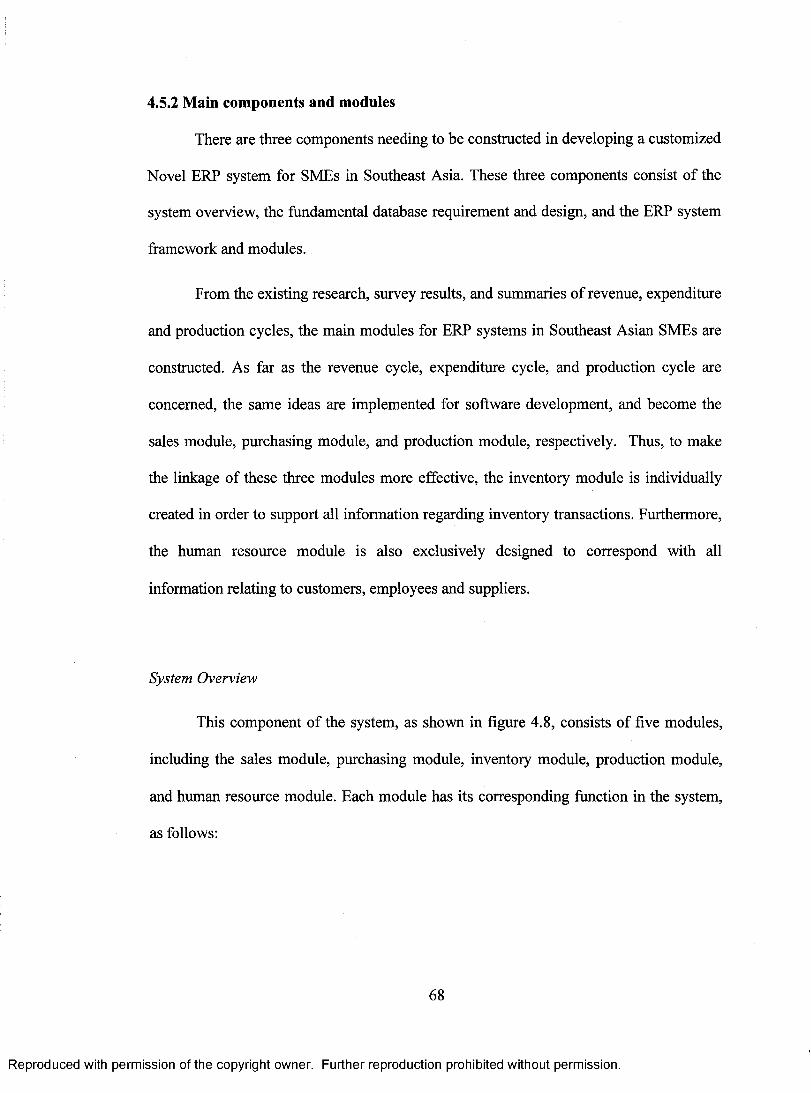
4.5.2 Main components and modules
There are three components needing to be constructed in developing a customized
Novel ERP system for SMEs in Southeast Asia. These three components consist of the
system overview, the fundamental database requirement and design, and the ERP system
framework and modules.
From the existing research, survey results, and summaries of revenue, expenditure
and production cycles, the main modules for ERP systems in Southeast Asian SMEs are
constructed. As far as the revenue cycle, expenditure cycle, and production cycle are
concerned, the same ideas are implemented for software development, and become the
sales module, purchasing module, and production module, respectively. Thus, to make
the linkage of these three modules more effective, the inventory module is individually
created in order to support all information regarding inventory transactions. Furthermore,
the human resource module is also exclusively designed to correspond with all
information relating to customers, employees and suppliers.
System Overview
This component of the system, as shown in figure 4.8, consists of five modules,
including the sales module, purchasing module, inventory module, production module,
and human resource module. Each module has its corresponding function in the system,
as follows:
68
Reproduced with permission of the copyright owner. Further reproduction prohibited without permission.
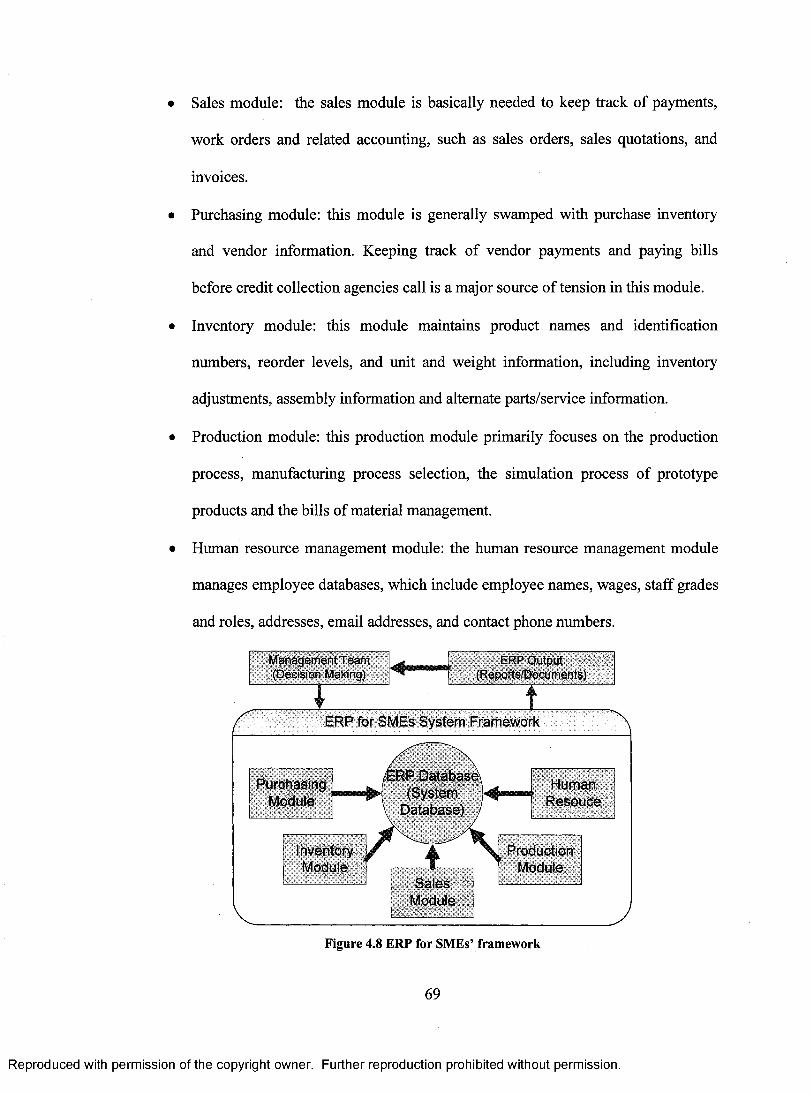
• Sales module: the sales module is basically needed to keep track of payments,
work orders and related accounting, such as sales orders, sales quotations, and
invoices.
• Purchasing module: this module is generally swamped with purchase inventory
and vendor information. Keeping track of vendor payments and paying bills
before credit collection agencies call is a major source of tension in this module.
• Inventory module: this module maintains product names and identification
numbers, reorder levels, and unit and weight information, including inventory
adjustments, assembly information and alternate parts/service information.
• Production module: this production module primarily focuses on the production
process, manufacturing process selection, the simulation process of prototype
products and the bills of material management.
• Human resource management module: the human resource management module
manages employee databases, which include employee names, wages, staff grades
and roles, addresses, email addresses, and contact phone numbers.
Management Team (Decision Making)
ERP Output (Reporis/Documents)
ERP for SMEs System Framework
ERP Database\ (System
Database)
Purchasing Module
Human Resoube
Inventory Production Module Module.
Sales Module
Figure 4.8 ERP for SMEs' framework
69
Reproduced with permission of the copyright owner. Further reproduction prohibited without permission.
• Sales module: the sales module is basically needed to keep track of payments,
work orders and related accounting, such as sales orders, sales quotations, and
invoices.
• Purchasing module: this module is generally swamped with purchase inventory
and vendor information. Keeping track of vendor payments and paying bills
before credit collection agencies call is a major source of tension in this module.
• Inventory module: this module maintains product names and identification
numbers, reorder levels, and unit and weight information, including inventory
adjustments, assembly information and alternate parts/service information.
• Production module: this production module primarily focuses on the production
process, manufacturing process selection, the simulation process of prototype
products and the bills of material management.
• Human resource management module: the human resource management module
manages employee databases, which include employee names, wages, staff grades
and roles, addresses, email addresses, and contact phone numbers.
Management Team (Decision Making)
jnt Team -TrjU>_. ERP OutputMaking) (Reports'Documents)
r IERP for SMEs System Framework
PurchasingModule
1 Inventory I Module ■
I ERP Databasew^-wrV; (System
Database)
— 1Production
Module
HumanResouce
SalesModule
Figure 4.8 ERP for SMEs’ framework
69
Reproduced with permission of the copyright owner. Further reproduction prohibited without permission.
Fundamental Database Requirements and Design
The database design was specially conducted sequentially to fulfil the information
and database requirements of Southeast Asian SMEs. For simplicity and reliability, the
basic information needed for SMEs will be stored. There will be 13 categories of
necessary information (data), as shown in Figure 4.9.
To increase the productivity and reengineering of the SME's system, the
information needed for each category has been designed and considered for the
enterprise's information and organization, employee information, customer information,
supplier information, raw material information, parts information, product information,
machine information, operation information, bill of material information, VAT
information, foreign exchange information, etc.
Suppplier
Purchasing Module
VAT
Employee
Distribution
Forex
Machine
VAT
Operation
Figure 4.9 Relationship between the five main modules and the information in the database
70
Reproduced with permission of the copyright owner. Further reproduction prohibited without permission.
Fundamental Database Requirements and Design
The database design was specially conducted sequentially to fulfil the information
and database requirements of Southeast Asian SMEs. For simplicity and reliability, the
basic information needed for SMEs will be stored. There will be 13 categories of
necessary information (data), as shown in Figure 4.9.
To increase the productivity and reengineering of the SME’s system, the
information needed for each category has been designed and considered for the
enterprise’s information and organization, employee information, customer information,
supplier information, raw material information, parts information, product information,
machine information, operation information, bill of material information, YAT
information, foreign exchange information, etc.
SaleVAT
Module
Inventory ProductionModuleModule
DistributionModule Module
Puichasing \
Suppplier
Machine
Routing BOM
Forex
Product
VAT
Part
Raw
Employee
Figure 4.9 Relationship between the five main modules and the information in the database
70
Reproduced with permission of the copyright owner. Further reproduction prohibited without permission.
ERP System's Framework and Modules
In a Novel ERP System's framework and modules, each module has a
relationship with its sub-modules. This relationship can be clearly seen in Figure 4.10.
Each module is divided again into sub-modules. The Sales module consists of the
sale quotation module, sale order module, and sale return requests module. The
Purchasing module, on the other hand, has the material purchase request module,
supplier's quotation module, purchase order module, and the purchase return request
module. Next is the Inventory module, with the raw material issues module, raw material
receipt module, raw material stock adjustment module, product issue module, product
receipt module, and the product stock adjustment module. Following this is the
production module, with the internal work order module, production scheduling module,
material requisition module, scheduling adjustment module, and the production run
module. Finally, we have the Delivery module, with its picking list module, delivery
order module, and delivery module.
71
Reproduced with permission of the copyright owner. Further reproduction prohibited without permission.
ERP System’s Framework and Modules
In a Novel ERP System’s framework and modules, each module has a
relationship with its sub-modules. This relationship can be clearly seen in Figure 4.10.
Each module is divided again into sub-modules. The Sales module consists of the
sale quotation module, sale order module, and sale return requests module. The
Purchasing module, on the other hand, has the material purchase request module,
supplier’s quotation module, purchase order module, and the purchase return request
module. Next is the Inventory module, with the raw material issues module, raw material
receipt module, raw material stock adjustment module, product issue module, product
receipt module, and the product stock adjustment module. Following this is the
production module, with the internal work order module, production scheduling module,
material requisition module, scheduling adjustment module, and the production run
module. Finally, we have the Delivery module, with its picking list module, delivery
order module, and delivery module.
71
Reproduced with permission of the copyright owner. Further reproduction prohibited without permission.

Inventory Module — Raw Material
Product Issue
Sates Module
Sale Quotation
Sale Order
Sale Return
Product Stock Adjustment
Raw Material Is‘s
Raw Material Requistion
Raw Material '4 , Receipt
Purchasing Module
Supplier's Quotation
Raw Material rchase Request
Purchase Return Request
Raw Material Stock Adjustment
Internal Work Order
Production Scheduling
Production Run
* Product Retei
Fig
ure
4.1
0 R
elat
ion
ship
bet
wee
n m
ain m
od
ule
s an
d s
ub
-mo
du
les
Inventory Module - Raw Material
Delivery Module
Picking List
Delivery Order
WmSm
Sales Module
Sale Quotation
Sale Order
Sale Return
Product Stock Adjustment
RawMatenal i *Raw Matenal Stock Adjustment
Production Module
Internal Work Order
Raw Matenal Requistion
Production r Scheduling h
SchedulingProduction Run
....... ........■■■■■I ~ ~ ----------------
Purchasing Module
Supplier’sQuotation
JE
Purchase Order i
-£------------
Raw Matenal Purchase Request
Purchase Return Request
s■oo
■os05s•a©S
e<u
£X
<Nr>
e.2.2"S£o
0)J-53©D
Rep
rodu
ced
with
pe
rmis
sion
of
the
copy
right
ow
ner.
Furth
er
repr
oduc
tion
proh
ibite
d w
ithou
t pe
rmis
sion
.

4.5.3 Novel ERP System and conceptual framework design
This section includes a brief explanation of how the Novel ERP system will work,
including its flow processes, graphical user interface, calculation, algorithm design and
the relationship between the design of the Novel software and the framework mentioned
in the previous section.
Novel ERP (NERP) for Southeast Asian SMEs
NERP facilitates inventory management, giving early warning of the parts and
work orders needed to complete customer orders on time. Thus, in using this system
inventory carrying costs can be decreased and a larger percentage of orders can be
delivered on time. NERP facilitates managing the real-time schedule and the cost of
custom sales orders. It offers a truly complete and integrated manufacturing management
system for SMEs in Southeast Asia. Designed using Java platforms, NERP is multi-user
and is easily installed into any computer and any network. In a small system, there is no
need to dedicate a PC to the server function. One PC can be both a client for one user and
the server for all other users. This reduces the start-up costs dramatically compared to
most other ERP systems.
Main features
NERP software allows SMEs to:
• track inventory; it counts and tracks serial/lot numbers both automatically and
manually.
• manage orders; this includes sales, production, purchasing, and requisitions.
73
Reproduced with permission of the copyright owner. Further reproduction prohibited without permission.

• calculate expected finishing dates and delivery dates for customers; this increases
customer satisfaction.
• get early shortage warnings.
• schedule production; this can be rearranged manually if needed.
• eliminate double data entry.
• display most of the products' related costs, initial cost, raw material cost, setup
cost, utilities cost, holding cost, and profit; this aids in the decision-making
process.
• lower start-up costs due to its ease of use and basic user interface design.
Access Levels
Each command on the tool bar on the main menu is considered a separate module
that directs the user to distinct functions and database information. Two levels of access
exist to control user rights to modules. The basic user level of access permits activities
such as data entry, order entry and production. The highest level is reserved for database
reviewers. In this access level, the database reviewer checks all database changes
proposed by the basic users for accuracy and correctness. The database reviewer has the
authority to change or delete entries made by other users and gives final approval for all
changes affecting the database. No special expertise in database management software or
programming is necessary for any user access level in NERP. The different access levels
exist primarily to manage the flow of data more efficiently.
74
Reproduced with permission of the copyright owner. Further reproduction prohibited without permission.
• calculate expected finishing dates and delivery dates for customers; this increases
customer satisfaction.
• get early shortage warnings.
• schedule production; this can be rearranged manually if needed.
• eliminate double data entry.
• display most of the products’ related costs, initial cost, raw material cost, setup
cost, utilities cost, holding cost, and profit; this aids in the decision-making
process.
• lower start-up costs due to its ease of use and basic user interface design.
Access LevelsEach command on the tool bar on the main menu is considered a separate module
that directs the user to distinct functions and database information. Two levels of access
exist to control user rights to modules. The basic user level of access permits activities
such as data entry, order entry and production. The highest level is reserved for database
reviewers. In this access level, the database reviewer checks all database changes
proposed by the basic users for accuracy and correctness. The database reviewer has the
authority to change or delete entries made by other users and gives final approval for all
changes affecting the database. No special expertise in database management software or
programming is necessary for any user access level in NERP. The different access levels
exist primarily to manage the flow of data more efficiently.
74
Reproduced with permission of the copyright owner. Further reproduction prohibited without permission.
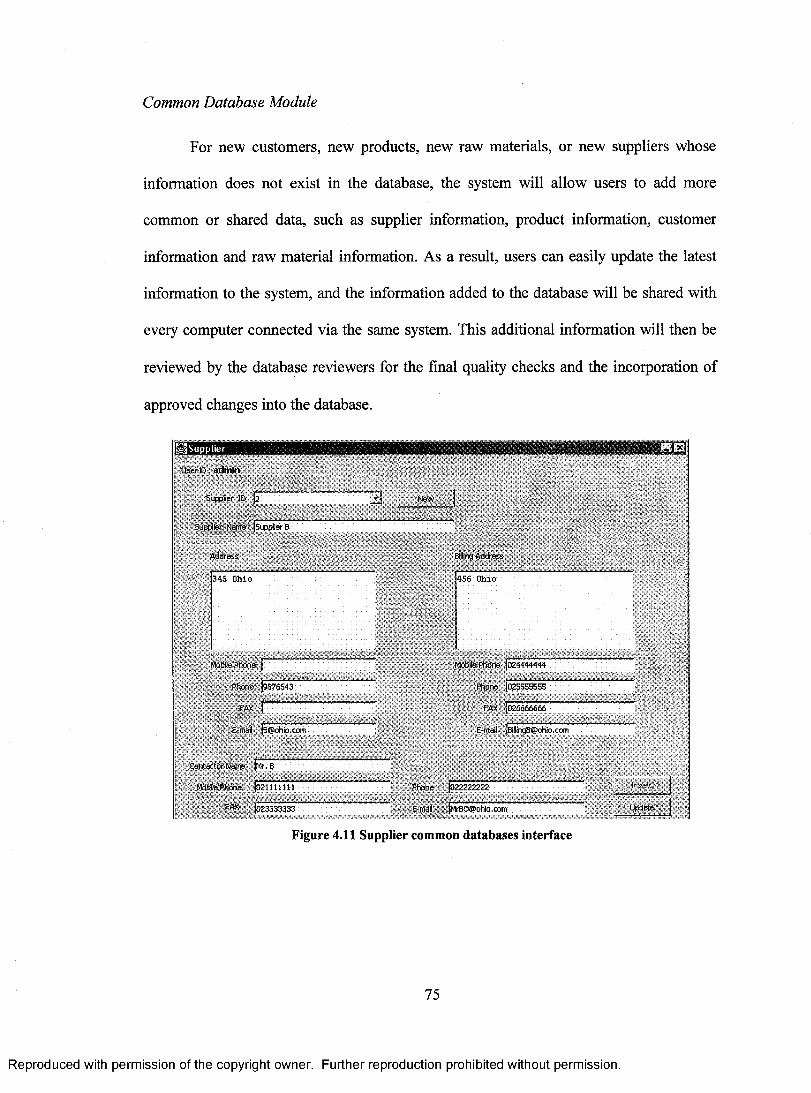
Common Database Module
For new customers, new products, new raw materials, or new suppliers whose
information does not exist in the database, the system will allow users to add more
common or shared data, such as supplier information, product information, customer
information and raw material information. As a result, users can easily update the latest
information to the system, and the information added to the database will be shared with
every computer connected via the same system. This additional information will then be
reviewed by the database reviewers for the final quality checks and the incorporation of
approved changes into the database.
User D • admin
5uppVer ID 12 New I
Supplier Name' 15uppller 13
Address
45 Ohio
MobilePhOne
Phorve 19876543
FAX 1
E-mail 1EVohio.com
Contactor Keine kr. B
Mobile Phone 1021111111
13Ing Address
456 Ohio
[labile Phone 1024444444
Phone 1025555555
FAX 1026666666
18illing136Polio.com
Phone 1022222222
FADS - - 1023333333 E-ma/1 1MrEI04ohto.corn
Figure 4.11 Supplier common databases interface
75
Irrf;E:rt
Uptlete . 1
Reproduced with permission of the copyright owner. Further reproduction prohibited without permission.
Common Database Module
For new customers, new products, new raw materials, or new suppliers whose
information does not exist in the database, the system will allow users to add more
common or shared data, such as supplier information, product information, customer
information and raw material information. As a result, users can easily update the latest
information to the system, and the information added to the database will be shared with
every computer connected via the same system. This additional information will then be
reviewed by the database reviewers for the final quality checks and the incorporation of
approved changes into the database.
n drimin
Supplier ID f T
Supplier Name- jSupplier B
Address
3 4 5 O h io
P hone [ ”
Phone j9376543~
FAX IE-mail js® ohio.c
Contactor Name fp'r. B
}021111111FAX jo23333333
nillin n A JJfc, —billing A ddress
4 5 6 O h io
Phone I02T 44444T
P hone jo25555555
FAX [026666666
E-mail jBillingB@ohio.(
022222222
Figure 4.11 Supplier common databases interface
75
Reproduced with permission of the copyright owner. Further reproduction prohibited without permission.

Sales Module
The Sales module is the starting point for every transaction, and users can either
start the process from Sales Quotation or Sales Order. For the regular customers who
normally purchase products from the company, their records will be stored in the
database and they can go straight to Sales Order. On the other hand, for new customers or
when a new product is being purchased, the transactions must go through Sales Quotation
in order to confirm the price and discount before proceeding to Sales Order. The top
portions of the Sales Order and Sales Quotation interfaces are different, due to the fact
that the Sales Order will automatically estimate the completion data and delivery date for
the customer. However, the bottom portion for both screens will be identical. Figure 4.12
shows the Sales Quotation interface with ordered products, the cost before tax and the
cost after tax. Figure 4.13 shows a Sales Order referred from previous sales quotations
(SaQ-00001) in Figure 4.12 including the comparison between the initial cost and profit,
estimated completion date, and expected delivery date.
saQ.xooi oet18/05
Figure 4.12 Sales Quotations with product information interface
76
Reproduced with permission of the copyright owner. Further reproduction prohibited without permission.
Sales Module
The Sales module is the starting point for every transaction, and users can either
start the process from Sales Quotation or Sales Order. For the regular customers who
normally purchase products from the company, their records will be stored in the
database and they can go straight to Sales Order. On the other hand, for new customers or
when a new product is being purchased, the transactions must go through Sales Quotation
in order to confirm the price and discount before proceeding to Sales Order. The top
portions of the Sales Order and Sales Quotation interfaces are different, due to the fact
that the Sales Order will automatically estimate the completion data and delivery date for
the customer. However, the bottom portion for both screens will be identical. Figure 4.12
shows the Sales Quotation interface with ordered products, the cost before tax and the
cost after tax. Figure 4.13 shows a Sales Order referred from previous sales quotations
(SaQ-00001) in Figure 4.12 including the comparison between the initial cost and profit,
estimated completion date, and expected delivery date.
13 *; . w. * '1L.! >c > '-1*1U ser ID: a d m in S a v e j
Q jO tabon ID j SaQ-OOOof b a te j 08/18/05
Customer Name ,v 5h 3
Sales Name — — j
Delivery D ate [08/24/05 “
Discount j i f %
T#* p 7 % ( G 5 T ) r 1 4 % (G S T + PST)
A ddress Product | c o s t and P rufl | Note ]
Product ID jp.D-00Q03 “ jLamp 3 Add
Unit UnitPrice quantit i*
OT Note Update
Jbox | 5 D C X , 8 | o [Sample Delete
Product ID Product Nemo Unit U rttPnce($) Ouerr-> OT I Note ■
PrD-00002 F i n e Cabinets Box 80 00 99 0; Sample
PrD-00001 TANK.10X 54,QH.Single Box 100.00 70 SO! Sample
Total Net $ ] 2932().t)() Total t | 31372.10
Figure 4.12 Sales Quotations with product information interface
76
Reproduced with permission of the copyright owner. Further reproduction prohibited without permission.
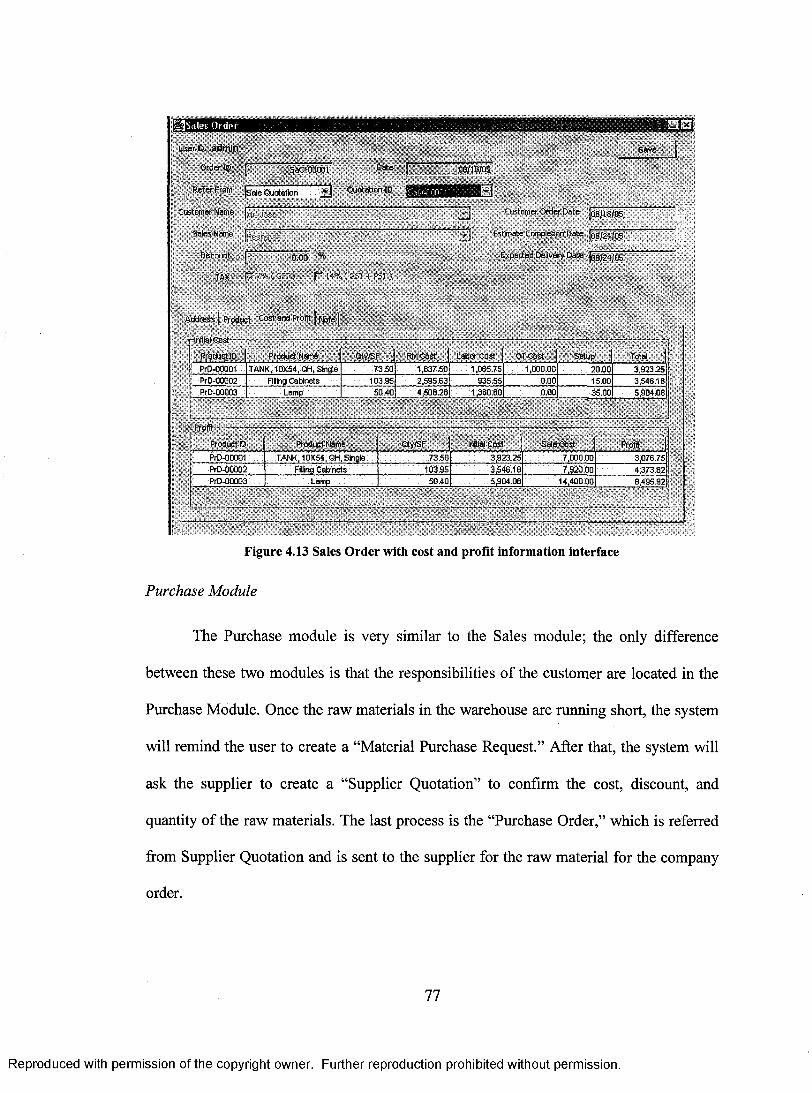
!:•-11Soles Order
user adrnin
Order ID
Refer From
Customer Name
Sales Name
5a0-00001
}Sale Quotation zi
Date
Quotation ID
08/18105
Discount., J 0.00 %
TAX p 7% GS ) 14NY, ( + PST
product Coif and' Profit I Note I
liter
Save
Customer Order Date 108/18/05
Estimate Completion Date 108124/05
Expected Delivery Date 108124/05
num l,OST .
PrOOlotcl ki., , Product Neale , Qty/SF ' . Cast Labor Cost OT Cost Setup Toth
PrD-00001 TANK, 10X54, Q1, Single 73.50 1,837.50 1,085.75 1,000.00 20.00 3,923.25 PrD-00002 Filing Cabinets 103.95 2,595.63 935.55 0.00 15.00 3 546.18 PrD-00003 Lamp 50.40 4,50828 1,360.80 0.00 35.00 5,904.08
'44-- , ,.. • L „,,:,.i..- " .
. rrOTI .
PrOclUPtio • Product Witte ' : I City/SF Initial Cost Sale cost I Profit
PrD-00001 TANK, 10X54, Gil, Single 73.50 3,92325 7,000.00 3,076.75 PrD-00002 Filling Cabinets 103.95 3,545.18 7,920.00 4,373.82 PrO-00003 Lamp 50.40 5,904.08 14,400.00 8,495.92
Figure 4.13 Sales Order with cost and profit information interface
Purchase Module
The Purchase module is very similar to the Sales module; the only difference
between these two modules is that the responsibilities of the customer are located in the
Purchase Module. Once the raw materials in the warehouse are running short, the system
will remind the user to create a "Material Purchase Request." After that, the system will
ask the supplier to create a "Supplier Quotation" to confirm the cost, discount, and
quantity of the raw materials. The last process is the "Purchase Order," which is referred
from Supplier Quotation and is sent to the supplier for the raw material for the company
order.
77
Reproduced with permission of the copyright owner. Further reproduction prohibited without permission.
Order >:iU ser ID a d m i n
O rder ID
S av e
SaO-OOOOl D ate
R efer From | s a le Quotation 3 Q uotatlon ID
Custom er Name |b , Jo sh
Sales Name
Discount f ^ 0 0 %
TAX f ? 7 % ( G S T ) p 14% ( GSr + PST )
A d d ress 1 Product Cost an d Profit I Note 1
08/18/05
Customer O rder D ate j o s / l i / o i f
T j Estim ate Completion D ate jog/24/o s
Expected Delivery D ate jcs/24/05
Hnitial C o st------
P roduct ID Product Name Qty/SF RM Cost Labor Cost QT Cost Setup Total
PrD-00001 TANK. 10X54, GH, Single 73.50 1,837.50 1.065.75 1,000 00 20.00 3,923.25PrD-00002 Filling Cabinets 103.95 2.595.63 935.55 0.00 15.00 3,546.18PrD-00003 .... L a m p......... 50.40 4,508.28 1,360 80 0.00 35.00 5,904.08
-“Profit.......... ...............
Product ID Product Name Qly/SF Initial Cost Sale Cost Profit
PrD-00001 TANK, 10X54, QH, Single 73.50 3,923.25 7,000.00 3,076.75PrD-00002 Filling Cabinets 103.95 3,546.18 7,920.00 4,373.82PrD-00003 L am p.................... 50 40 5,904 08 14,400 00 8,495.92
Figure 4.13 Sales Order with cost and profit information interface
Purchase Module
The Purchase module is very similar to the Sales module; the only difference
between these two modules is that the responsibilities of the customer are located in the
Purchase Module. Once the raw materials in the warehouse are running short, the system
will remind the user to create a “Material Purchase Request.” After that, the system will
ask the supplier to create a “Supplier Quotation” to confirm the cost, discount, and
quantity of the raw materials. The last process is the “Purchase Order,” which is referred
from Supplier Quotation and is sent to the supplier for the raw material for the company
order.
77
Reproduced with permission of the copyright owner. Further reproduction prohibited without permission.

RMaterial Purchase Request
User ID admit]
ID I PuM-00002
Estimate Date
, Raw Material 1 Note I
Date I 08,18705
RN ID 1RaM-00011 (File Folders
Quantity I 500
11117113
Save
Add
Update
Remove
km 6 RM Name Unit Quantity
ReM-00008 Plastic Drawer Labels EA 400 RaM-00009 Hanging Folder Bars EA 400 ReM-00010 Fie Folder Labels Box 500 RW-00011 File Folders Box 500
Figure 4.14 Material Purchase Request interface
4Suppliers Quotation
User ID: adman
Quotation ID 1PuS-000131 Date 08/18/05'
Supplier Name 'Supplier A
Delivery Date 108/25/05
Discount
TAX p 7% ( G5T ) r 14°? ( G5T + PST ) As'
Address Raw Material , Note]
IE
Material ID 'Rem-00009
.UnitPrice Unit
...
•
Hanging Folder Bars
1,48
Amount
1400 110% Discount
Note.
III El 13
Save
Update I
Delete .1
MateriatD MaterledName I Und 1-Initl IOe(9).,0 Amount Note
RaM-00008 Plastic Drawer Labels EA .38 400 10% Discount F.v_,.,,.11.,, ,•,, lien.-wi l F.-.'.1, r E : EA .. 41A1 1 J` Dc. int
RaM-00010 File Folder Labels Box .39 500 15% discount ReM-00011 File Folders Box .16 500 25% discount
Total Net $ 64.25 Total 496,75
Figure 4.15 Supplier Quotation interface
78
Reproduced with permission of the copyright owner. Further reproduction prohibited without permission.
id restimate Date f"
PuM-00002
, Raw Material ] Note) g-j: J: ?
RMID (RaM-00011 3 |F H e Folders
Quantity
Date 08/18105 Save
H Add
500Update
Remove
RM ID RM Name Unit Quantity
RaM-00008 Plastic Drawer Labels EA 400RaM-00009 Hanging Folder Bars EA 400RaM-00010 File Folder Labels Box 500RaM-00011 File Folders: : Box 500
Figure 4.14 Material Purchase Request interface
User ID Save
Quotation ID JpuS-00001
Supplier Name (supplier A
Delivery Date |08/25/05
Discount M %
• TAX ■ F 7% ( GST ) r 14% ( GST + PST)
Date |08 /18/05
"£3
Address Raw Material | Note |
Material ID (RaM-00009
Unit UnitPricettt
li l - .. u n .H.jnancjing roiaer bars
Amount
-
Note
Add
Update
EA (.48 jaoo ji0 % Discount Delete j
MateriallD MaterlalName Unit UnitPrlce($) I Amount j Note I
RaM-00008 Plastic Drawer Labels EA I .381 4001 10% Discount |■ H M H r n E S S m M H R H
RaM-00010 File Folder Labels:: Box ................ .39 500 15% discountRaM-00011 File Folders Box .16 500 25% discount
Total Net t (464.25 Total $ (496.75
Figure 4.15 Supplier Quotation interface
78
Reproduced with permission of the copyright owner. Further reproduction prohibited without permission.
Inventory Module
The inventory module has been categorized into 4 main parts: issuing, receiving,
stock adjustments, and current inventory. Product Issuing and Raw Material Issuing will
occur when the customer orders the products with the quantity existing in the warehouse,
and the production department requests raw material to produce the products as required
by Sales Order, respectively. The Product and Raw Material receipt modules will be
activated when the production department finishes producing the products and delivering
to the warehouse, and the supplier has delivered the requested raw material to the
company. Most of the company's inventory management will rely upon the computer
system; however manual stock adjustment should occur at least once over a certain
period of time, and therefore the product stock adjustment and raw material stock
adjustment will take place when the manual inventory count happens. Finally, Current
Inventory is the user interface that shows the current quantity of both the products and the
raw material that the company has in their warehouse. The current inventory interface
displays useful information for the company, including serial numbers, names, initial
costs, quantity on hand, quantity on order, dynamic reorder points, and order quantity.
79
Reproduced with permission of the copyright owner. Further reproduction prohibited without permission.
Inventory Module
The inventory module has been categorized into 4 main parts: issuing, receiving,
stock adjustments, and current inventory. Product Issuing and Raw Material Issuing will
occur when the customer orders the products with the quantity existing in the warehouse,
and the production department requests raw material to produce the products as required
by Sales Order, respectively. The Product and Raw Material receipt modules will be
activated when the production department finishes producing the products and delivering
to the warehouse, and the supplier has delivered the requested raw material to the
company. Most of the company’s inventory management will rely upon the computer
system; however manual stock adjustment should occur at least once over a certain
period of time, and therefore the product stock adjustment and raw material stock
adjustment will take place when the manual inventory count happens. Finally, Current
Inventory is the user interface that shows the current quantity of both the products and the
raw material that the company has in their warehouse. The current inventory interface
displays useful information for the company, including serial numbers, names, initial
costs, quantity on hand, quantity on order, dynamic reorder points, and order quantity.
79
Reproduced with permission of the copyright owner. Further reproduction prohibited without permission.
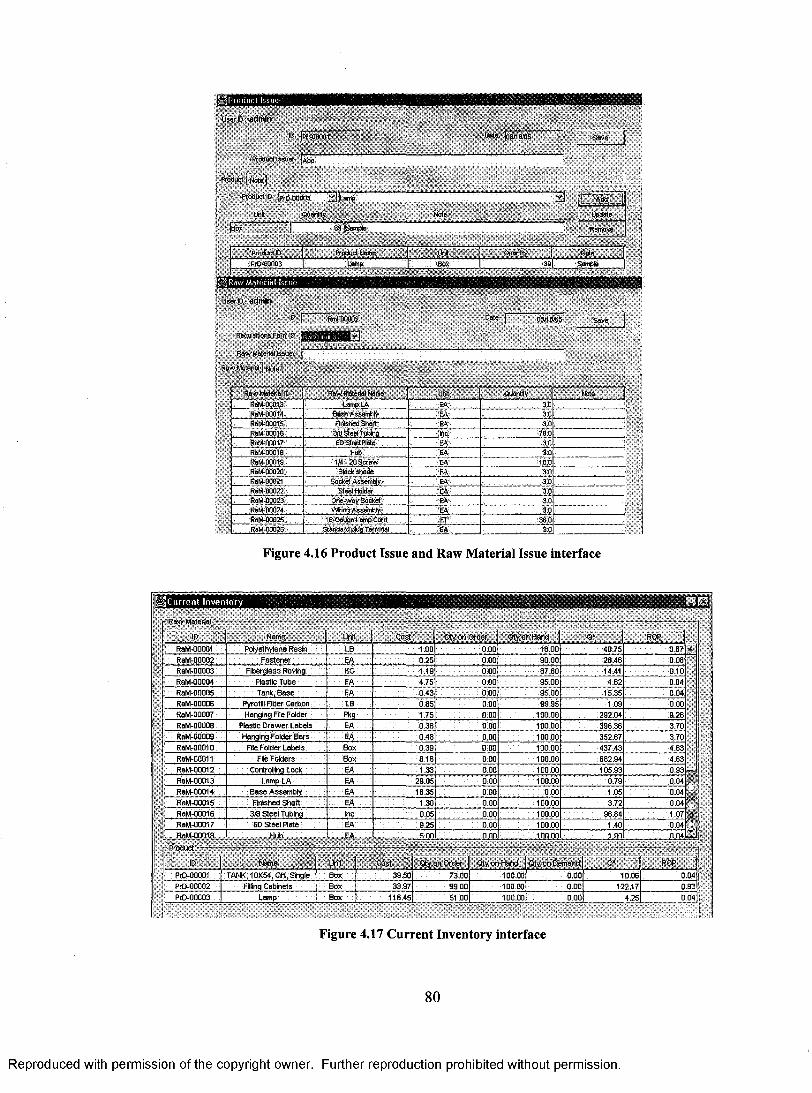
.14 P unl tir.t Issue
User 6 : -admin
Date )asst S Save
ProdUCUSsUer kc,
Product I Note I
Roloat IPr13-00003
Ottertly nerd 39 }striae
Prockict0.1340-00003
Mdteriel Issue
User p : min*
Product Name
Lamp
19 I
Requimtions Form
Raw Material Issuer I
Raw Material I Note 1
Rin-000132
Box U►nt entiGu y. Nola
391 Sva
08/113105 Save I
Raw Withal 0 Raw Materiel Name WA.* 1 Note ReA1-04013 Leap LA EA 3.0 Ralt ats••' EA 34I RaM•00131.5- ElitikArShoft 6A, 303 ReA4-00010 BIllieterrillie IIAC' RIO Reif-000W gertrad !MM.. EA V Reet41001e: 44 EA la 1444-0001,9 -1,4 -/05ciew EA :so 6elAboor20 Black'Oet 'EA. 3D R64013021 6444A44144y Ek 3.0
Veei CA: 3a 84144023 One=vieyjectoei, . Ek 30 64460024 . Wanti As seirialtf :LEA ftz (tgS400025: - lacOsiige Lem* Cilia FT" '661:1 •841420244 • Stbr6ard plug Tereidel ..70,C 31:1
Figure 4.16 Product Issue and Raw Material Issue interface
r-Lrjr:tirront Inventory PIM.
Raw Mater
11) None. Und Cost Oty on Order Oty on Hood Fr ROP
.4-ReM-00001 Polyethylene Resin LB 180 0.00 18.00 40/5 087 ReM-00002 Fastener EA 0.25 080 50.00 70.46 0.6
:
'
ReM-00003 Fbanglass Raring KG 1.19 0.00 87.80 14.41 0.10 RaM.00004 Pleetle Tube EA 4.75 000 95.00 4.82 0L4 Rak4-00005 Tar* ease EA 0.43 0.00 95.00 1535 0.04 ReM-00008 Pyroll Meg Carbon LB 085 0.00 99.95 109 0.00 Rail-00007 Hanging File Folder Pkg 1.75 0.00 100.00 292.04 926 ReM-00008 Plastic Drawer Labels EA 0.38 0.00 100.00 396.36 3.70 RaM-00009 Hanging Freely Bars EA 0.48 0.00 100.00 35287 3.70 ReM-00010 Fle Folder Labels Box 039 000 100.00 437.43 4.63 RAI-00011 Fie Folders Box 0.18 ODO 100.00 68284 4.83 RaM400012 Condoling Lock EA 1.33 0.00 100.00 105.93 0.93 RaM-00013 Lamp LA EA 2905 0.00 100.00 0.79 0.04
" Rail-00014 Base Assembly EA 1635 0.00 0.00 105 0.04 Rak1-00015 Firished Shell EA 1.30 0.00 100.00 3.72 004 Rei4-000115 =Steel Tubing he 0.05 000 100.00 9684 107 ReM-00017 60 Steel Male EA 9.25 0.00 100.00 1.40 0.04 R41-04111n Huh R m 1110 1 Rn 1
Product..
0 ,
Name ,. Uni bast , :,'Oty,on Order Qly um Hand Oly. on Oeinand R')°
Pr0-00001 TANK, 10)(54, OH, Single Box 39.50 73.00 100.03 0130 10.06 004 PrO-001302 Filing Cabinets Box 33.97 99.00 10080 ODO 122.17 023 ND-00003 Lamp Box 11645 51.00 100.00 0.00 4.25 0.04
Figure 4.17 Current Inventory interface
80
Reproduced with permission of the copyright owner. Further reproduction prohibited without permission.
product ID |prD-0Q0O3 ^jiLatrfp
Unit Quantity Note
J I e i m : : : ]■ Update
Box j 39'jSample..........a n . .
ProdUct ID Product Name .Untt Quantty- I Note J, PrD-00003 Lamp Box 39| Sample !
f ^ R a w M a t e r i a l fssin?
n-,t, ID ddniin
! I Raw Material Name Unit - entity Note____ RaM:goqi.3_____
RaM-00014 _ RaM-6o6i:5
Lamp LA <EA/- 3:0BaseAssembly EA 3:0flriished.Shaft; EA 3:0
RaM-000i6 3̂ 8 Sleel Tubing Inc, 78:0RaM-dD0l7:; 6b;:SteS Plate; •EA' 3.0RaM-00018 : Hub. EA '30Ral^-00019 '1#--20ScreW EA 18.0RaW-b0020: Bldcksbade EA. 3:0RaM-00021 Socket Aisembly^ EA 3:0RaM-00022 ;Ste^ Holder fEA:- 30RaNi-00023;- bhe-vvdy Socket; •'EA:- 3:0R afci® 24 VMdrig ;As^rnb.ly“ . EA 3:0iaW-00025; i e^Gal^e LampCOrd v p r 33:0,RaM-pd026;: Steuiidard plug Terminal ;;e a ; '30
Figure 4.16 Product Issue and Raw Material Issue interface
^ C u r r e n t I n v e n to r y 0 3
ID Name Unit Cost Qty on Order Qty on Hand | Q* ROP
1 RaM-00001 Polyethylene Resin LB 1.00 0.00 18.001 40.75 0.67; RaM-00002 Fastener EA 0.25 0,00 90.00 28.46 0.08
RaM-0Q0Q3 Fiberglass Roving KG 1.19 0 0 0 87.80 14.41 0.10: RaM-00004 Plastic Tube EA 4.75 0.00 95.00 4.62 0.04
RaM-00005 Tank, B ase EA 0.43 0.00 95.00 15.35 0.04RaM-00006 Pyrofill Fiber Carbon LB 0.85 0.00 99.95 1.09 0.00
; RaM-00007 Hanging File Folder Pkq 1.75 0.00 100.00 292.04 9,26RaM-00008 Plastic Drawer Labels EA 0.38 0.00 100.00 396.36 3.70RaM-00009 Hanging Folder Bars EA 0.48 0.00 100.00! 352.67 3.70RaM-00010 File Folder Labels Box 0.39 o:oo 100.00 437.43 4.63
; RaM-00011 File Folders Box 0.T6 0:00 100.00 682.94 4.63RaM-00012 Controlling Lock EA 1.33 0.00 100.00 105.93 0.93RaM-00013 Lamp LA EA : 29,05 0.00 100.00 0.79 0.04RaM-00014 B ase Assembly EA 16.35 0:00 0.00 1.05 0.04
;; RaM-00015 Finished Shaft EA 1.30 0:00 100.00 3.72 0.04RaM-00016 3/8 Steel Tubing Inc 0.05 0.00 100.00 96.84 1.07RaM-00017 6D Steel Plate EA 9.25 0.00 100.00 1.40 0.04
; .... RaM-nnnjB.... ........................Huh:...... ............... .........F A ......... ................. s n n n n n in n n n l 1 9n n n 4
P ro d u c t-----------
ID Name Unit Cost Qty Dn Order Qty or Hand Qty on Demand Q* ROP
Wl !
0.04 ;PrD-00001 TANK, 10X54, QH, Single 39.50 73.002.17 0.93
0.04116.45 51.00
Figure 4.17 Current Inventory interface
80
Reproduced with permission of the copyright owner. Further reproduction prohibited without permission.

Production Module
The Production module consists of 6 sub-modules: Internal order, Production
Scheduling, Scheduling Adjustment, Raw Material Requisition, Production Run, and
Production Completion. For an order from within the company or made-to-stock
products, the Internal Order module will be used, and afterwards every order will be
posted on the Production Scheduling Interface as the order is entered. The user can
change or modify this scheduling by using the Scheduling Adjustment interface. After the
production department has received the production scheduling, the system will ask the
user to request the required raw material from the warehouse. Then the Production Run
module can be started. Last of all, the completed products will be automatically sent to
Production Completion.
Production Scheduling
- Production Plan
Order ID Order Type Date Delivery
SaleOrder 081:4 ,1:15 1005/05
Customer Status
Mr. 1.....111311. 1
Samaria Run SaleOrder 08/20/05 Lulu Requesting Rawmaterial
Product Warne
TAW, 10X54, OH, %vie Hang Cabinets
Lamp
Order City Finish City. Inittal Cost 'tale Cost ' Prof 1
70.00 0.00 Box 13,92325 7,030.00 3,076.75 99.00 0.00 Box 3,546.18 7,920.00 4,373.82 48.00 0.00 Box 5,904.08 14,400.00 8,495.92
Close
Figure 4.18 Production Scheduling interface
81
Reproduced with permission of the copyright owner. Further reproduction prohibited without permission.
Production Module
The Production module consists of 6 sub-modules: Internal order, Production
Scheduling, Scheduling Adjustment, Raw Material Requisition, Production Run, and
Production Completion. For an order from within the company or made-to-stock
products, the Internal Order module will be used, and afterwards every order will be
posted on the Production Scheduling Interface as the order is entered. The user can
change or modify this scheduling by using the Scheduling Adjustment interface. After the
production department has received the production scheduling, the system will ask the
user to request the required raw material from the warehouse. Then the Production Run
module can be started. Last of all, the completed products will be automatically sent to
Production Completion.
i n t r o d u c t i o n S( l n - d i i l i n :
1Production P la n ------ —
O rder ID O rder Type D ate Delivery C ustom er S ta tu s |
S a 0 -0 0 0 0 2 S aleO rd e r 1 0/05/05 Mr. s a m a n ta Run
S aQ -00003 S aleO rder 08/20/05 Mr. Lulu R equesting Raw m aterial
~ Production Detail
P roduct ID Product Name O rder Qty Finish Qty Unit Initial C ost S a le C ost Profit
PrD-00001 TANK, 10X 54. QH, Single 70.00 0.00 Box 3,923 .25 7,000 .00 3 ,076.75
PrD-00002 Filling C abinets 99.00 0 .00 Box 3,546 .18 7,920.00 4,373.82
PrD-00003 Lamp 48.00 0 .00 Box 5 ,904.08 14,400.00 8,495.92
f
Figure 4.18 Production Scheduling interface
81
Reproduced with permission of the copyright owner. Further reproduction prohibited without permission.
Pending Remind Systems
The Pending Remind system in the NERP system alerts executives and users
when the system detects that the threshold value that has been set for a particular attribute
has been exceeded or else there is a transaction waiting to proceed. On the main screen,
the system will remind the user of the transactions pending processing, and once the user
creates the particular pending transaction, it will automatically be removed from the main
screen. The transactions that the system can remind the users of are:
• Sales Quotation Pending; there is (are) Sales quotations(s) that are waiting to be
created in Sales Order.
• Material Purchase Request Pending; there is a shortage of raw material waiting to be
entered into the Supplier Quotation
• Supplier Quotation Pending; there is (are) Supplier Quotation(s) that is (are) ready to
be entered into Purchase Order and sent to the suppliers.
• Purchase Order Pending; A Purchase Order has been created and is waiting for the
material from suppliers.
Process Flow Diagram
Figure 4.19 shows the summary of the process flow diagram in the NERP
software, including its common database and inventory database.
82
Reproduced with permission of the copyright owner. Further reproduction prohibited without permission.

COMMON DATABASE
Supplier Raw Material Product Customer
ales rder
4
Raw Material Requisition
(Raw Materials on hand are enough? /' Request
P 1 1 Sales Quotation 14
SUPPLIER
ena urchase
YES
Raw Material Issues
Produgtion Scheduling
Change Production Schedule?
NO
Production Run
:Production Completion
YES Sched-u-ling Adjustment
Product Issue
CUSTOMER
Supplier Quotation
..Purchaatitkdee
Raw Material i Receipt
PROCESS FLOW
DIAGRAM
i•-i( CUSTOMER
INVENTORY
Current Inventory Raw Material Stock Adjustment
Product Stock' Adjustment
Figure 4.19 Process flow diagram
83
Reproduced with permission of the copyright owner. Further reproduction prohibited without permission.
COMMON DATABASE
Supplier ; RawMaterial Product Customer
internalOrder
SalesOrder <-■- i Sales Quotation
I....
1 Raw Material Requisition SUPPLIER
Raw Materials on hand .‘ are enough? ’ NC>I
YES
Material Purchase Request
! Raw Material Issues
CUSTOMER
SupplierQuotation
Purchase Order
Raw Material Receipt
| Production Scheduling
PROCESS FLOW
DIAGRAM
i ̂ ___
j Production Completion ► Product Issue ; <- CUSTOMER
Change Production Schedule?
NO y ____
VYES-SchedulingAdjustment
Production Run
INVENTORY
Ti ITCurrent inventory Adjustment
Raw Material Stock j | | Product StockAdjustment
j [
Figure 4.19 Process flow diagram
83
Reproduced with permission of the copyright owner. Further reproduction prohibited without permission.

4.5.4 Inventory and relevant costs policy decision
Inventories are stockpiles of raw materials, supplies, components, works in
progress, and finished goods that appear at numerous points throughout a firm's
production and logistics channel. These inventories can cost a large amount of a
company's the production value per year. Therefore, carefully managing inventory levels
makes good economic sense. Inventory management involves balancing product
availability or customer service on the one hand, with the cost of providing a given level
of product availability on the other. Since there may be more than one way of meeting the
customer service target, this research seeks to minimize inventory-related costs at each
level of customer service.
In order to optimize the data output from the NERP system, give the most
accurate shortage warnings, estimate replenishment quantity, and calculate reordering
points, the equations for the calculation are identified. Taking into account the dynamic
demands from various customers, the statistical variables are added to the equations in
order to standardize the normal distribution of the demand and production rates. A
detailed illustration of the calculation and an example can be found in Appendix B.
Determining the Safety Stock with Uncertainty
Although it is useful to understand inventory relationships under conditions of
certainty, a formulation of inventory policy must realistically consider uncertainty. One
of the main functions of inventory management is to plan safety stock to protect against
out-of-stocks items. Two types of uncertainty have a direct impact upon inventory policy.
84
Reproduced with permission of the copyright owner. Further reproduction prohibited without permission.
4.5.4 Inventory and relevant costs policy decision
Inventories are stockpiles of raw materials, supplies, components, works in
progress, and finished goods that appear at numerous points throughout a firm’s
production and logistics channel. These inventories can cost a large amount of a
company’s the production value per year. Therefore, carefully managing inventory levels
makes good economic sense. Inventory management involves balancing product
availability or customer service on the one hand, with the cost of providing a given level
of product availability on the other. Since there may be more than one way of meeting the
customer service target, this research seeks to minimize inventory-related costs at each
level of customer service.
In order to optimize the data output from the NERP system, give the most
accurate shortage warnings, estimate replenishment quantity, and calculate reordering
points, the equations for the calculation are identified. Taking into account the dynamic
demands from various customers, the statistical variables are added to the equations in
order to standardize the normal distribution of the demand and production rates. A
detailed illustration of the calculation and an example can be found in Appendix B.
Determining the Safety Stock with Uncertainty
Although it is useful to understand inventory relationships under conditions of
certainty, a formulation of inventory policy must realistically consider uncertainty. One
of the main functions of inventory management is to plan safety stock to protect against
out-of-stocks items. Two types of uncertainty have a direct impact upon inventory policy.
84
Reproduced with permission of the copyright owner. Further reproduction prohibited without permission.

The first of these is demand uncertainty, which is the rate of sales during inventory
replenishment. The second of these, performance cycle uncertainty, is concerned with
inventory replenishment time variations. Dealing with both demand and performance
cycle uncertainty requires combining two independent variables. The exact compounding
of two independent variables involves multinomial expansion. This type of procedure
requires extensive calculation. A direct method of doing this is to determine the standard
deviations of demand and performance cycle uncertainty, and then to approximate the
combined standard deviation using the convolution formula (Bowersox et al., 2003):
a-, = AITSs2 + D2 St2 (1)
Where
a-, = Standard deviation of combined probabilities;
T = Average performance cycle time;
St = Standard deviation of the performance cycle;
D = Average daily sales;
Ss = Standard deviation of daily sales.
The fill rate represents the magnitude of a stock-out rather than the probability.
The case fill rate is the percentage of units that can be filled when requested from the
available inventory. The mathematical formulation of the relationship is:
Where
SL
f(k)
SL = 1 f (Oct
Q (2)
= The stock*out magnitude (the product availability level):
= A function of the normal loss curve which provides the area in a right tail of
a normal distribution;
85
Reproduced with permission of the copyright owner. Further reproduction prohibited without permission.
The first of these is demand uncertainty, which is the rate of sales during inventory
replenishment. The second of these, performance cycle uncertainty, is concerned with
inventory replenishment time variations. Dealing with both demand and performance
cycle uncertainty requires combining two independent variables. The exact compounding
of two independent variables involves multinomial expansion. This type of procedure
requires extensive calculation. A direct method of doing this is to determine the standard
deviations of demand and performance cycle uncertainty, and then to approximate the
combined standard deviation using the convolution formula (Bowersox et al., 2003):
Where
<7C = Standard deviation of combined probabilities;
T = Average performance cycle time;
St = Standard deviation of the performance cycle;D = Average daily sales;
Ss = Standard deviation of daily sales.
The fill rate represents the magnitude of a stock-out rather than the probability.
The case fill rate is the percentage of units that can be filled when requested from the
available inventory. The mathematical formulation of the relationship is:
WhereSL = The stock*out magnitude (the product availability level):
f(k) - A function of the normal loss curve which provides the area in a right tail of
(1)
a normal distribution;
85
Reproduced with permission of the copyright owner. Further reproduction prohibited without permission.

Q = The replenishment order quantity.
The calculated value of f(k) is then compared with the values in Appendix B in
order to find the one that most closely approximates the calculated value.
SS = k* a-,
Where
SS = Safety stock in units;
k = The k factor that corresponds with f(k).
Initial Production Cost and Profit
(3)
In the Sales Quotation and Sales Order modules, the system can easily display the
detailed initial cost and profit for users in order to determine the percentage of discount,
the amount of production, and overtime work, and then optimize the profit as they desire.
Since this system is only a framework, only major costs will be used in calculations.
Some minor costs such as the utilities cost and wasted material cost are excluded from
these models.
Initial Cost = RMC + LC + SC + OTC (4)
Where
RMC = Raw Material Cost * (Q+SS);
LC = Labour Cost/Hour * production hours * Q;
SC = Setup Cost;
OTC = Overtime cost/hour overtime required (hours).
Profit = Sales Cost — Initial Cost
86
(5)
Reproduced with permission of the copyright owner. Further reproduction prohibited without permission.
Q = The replenishment order quantity.
The calculated value of f(k) is then compared with the values in Appendix B in
order to find the one that most closely approximates the calculated value.
SS = k * a c (3)
WhereSS = Safety stock in units;
k = The k factor that corresponds with f(k).
Initial Production Cost and Profit
In the Sales Quotation and Sales Order modules, the system can easily display the
detailed initial cost and profit for users in order to determine the percentage of discount,
the amount of production, and overtime work, and then optimize the profit as they desire.
Since this system is only a framework, only major costs will be used in calculations.
Some minor costs such as the utilities cost and wasted material cost are excluded from
these models.
Initial Cost = RMC + LC + SC + OTC (4)
Where
RMC - Raw Material Cost * (Q+SS);LC = Labour Cost/Hour * production hours * Q;
SC = Setup Cost;
OTC = Overtime cost/hour * overtime required (hours).
Profit = Sales Cost - Initial Cost (5)
86
Reproduced with permission of the copyright owner. Further reproduction prohibited without permission.
Repetitive Order Quantities
The system will automatically calculate the dynamic optimal order quantity and
reorder point every time that the current stock changes. By updating these two values
with the most recent demands from customers and real-time order values from suppliers,
the result is a more accurate optimal order quantity and reorder point. It can be shown
mathematically that an optimal order quantity (Q*) exists where the procurement cost and
carrying cost are in balance. The formula for this economic order quantity (EOQ) is:
112 Q* =
DS
KT (6)
Where
D= Item's annual demand occurring at a certain and constant rate over time, units/year;
S = Procurement Cost, dollars/order;
I = Carrying costs as a percentage of item value, percent/year;
C= Item value carried in inventory, dollar/unit.
The reorder point is the quantity to which inventory is allowed to drop before a
replacement order is placed. Since there is generally a time lapse between when the order
is placed and when the items are available in inventory, the demand that occurs over this
lead time must be anticipated. The reorder point (ROP) is
ROP = d * LT'
Where
ROP = reorder point quantity, units;
d = demand rate, in time units;
LT = average lead time, in time units.
87
(7)
Reproduced with permission of the copyright owner. Further reproduction prohibited without permission.
Repetitive Order Quantities
The system will automatically calculate the dynamic optimal order quantity and
reorder point every time that the current stock changes. By updating these two values
with the most recent demands from customers and real-time order values from suppliers,
the result is a more accurate optimal order quantity and reorder point. It can be shown
mathematically that an optimal order quantity (Q*) exists where the procurement cost and
carrying cost are in balance. The formula for this economic order quantity (EOQ) is:
Where
D= Item’s annual demand occurring at a certain and constant rate over time, units/year;
.S' = Procurement Cost, dollars/order;
I = Carrying costs as a percentage of item value, percent/year;C= Item value carried in inventory, dollar/unit.
The reorder point is the quantity to which inventory is allowed to drop before a
replacement order is placed. Since there is generally a time lapse between when the order
is placed and when the items are available in inventory, the demand that occurs over this
lead time must be anticipated. The reorder point (ROP) is
(6)
ROP = d* LT' (7)
Where
ROP = reorder point quantity, units;
d = demand rate, in time units;
LT = average lead time, in time units.
87
Reproduced with permission of the copyright owner. Further reproduction prohibited without permission.

The demand occasionally depends positively on the amount of displayed stock,
especially in the case of novelty or impulse purchase items. Such inventory-level
dependence on the demand rate has been incorporated into some proposed continuous
review inventory control models. A time-phased procurement system such as NERP has
no specific safety stock; likewise, the safety stock will vary and change dynamically
depending on the demand. The basic notion of time phasing is that parts and
subassemblies need not be carried in inventory as long as they arrive when they are
needed.
Three basic approaches can be used to introduce safety stocks into a system coping
with dynamic demand. First, a common practice is to put safety time into the requirement
plan. A second approach is to increase the requisition by a quantity specified by some
estimate of expected forecasted error. The third method is to utilize the previously
introduced statistical techniques for setting safety stocks directly onto the components
rather than onto the items of top-level demand. To conclude, the statistically involved
safety stocks are identified and included in the calculation of replenishment quantity and
initial cost estimation for NERP in this research.
4.5.5 Achieved functionality and features in NERP
Supply Chain Management Integration
The NERP system has a nearly full supply chain management integration, which
means partnering with customers and suppliers with the intent to maximize
responsiveness and flexibility, while eliminating paperwork, waste and cost throughout
88
Reproduced with permission of the copyright owner. Further reproduction prohibited without permission.

the supply chain. The system allows users to communicate with both customers and
suppliers with a fast response, existing database, history of activities, and required
information.
Manually Entered Orders
By storing all of the common databases in the main data warehouse, the
information of both customers and suppliers can be easily restored to present on the
NERP system's screen. For example, when a customer calls to place an order, the NERP
system is sufficiently responsive to allow the customer service representative to quickly
and accurately enter the order by easily bringing up the customer's data and typical order
history onto the screen. The system will also provide a firm shipping date, completion
date, and a total price for the order with and without tax. The same method applies to
suppliers, also.
Sales force automation
Sales force automation normally refers to assisted selling outside of the company.
Langenwalter (2002) stated that MRP II (Manufacturing Resource Planning) systems
were extremely weak in supporting salespeople in the field. The NERP system permits a
field salesperson with a laptop with Internet access to have full access to all authorized
functionality in the software, no matter where he or she happens to be. This feature helps
the salesperson impress the customer.
89
Reproduced with permission of the copyright owner. Further reproduction prohibited without permission.
the supply chain. The system allows users to communicate with both customers and
suppliers with a fast response, existing database, history of activities, and required
information.
Manually Entered Orders
By storing all of the common databases in the main data warehouse, the
information of both customers and suppliers can be easily restored to present on the
NERP system’s screen. For example, when a customer calls to place an order, the NERP
system is sufficiently responsive to allow the customer service representative to quickly
and accurately enter the order by easily bringing up the customer’s data and typical order
history onto the screen. The system will also provide a firm shipping date, completion
date, and a total price for the order with and without tax. The same method applies to
suppliers, also.
Sales force automation
Sales force automation normally refers to assisted selling outside of the company.
Langenwalter (2002) stated that MRP II (Manufacturing Resource Planning) systems
were extremely weak in supporting salespeople in the field. The NERP system permits a
field salesperson with a laptop with Internet access to have full access to all authorized
functionality in the software, no matter where he or she happens to be. This feature helps
the salesperson impress the customer.
89
Reproduced with permission of the copyright owner. Further reproduction prohibited without permission.

Relational Database
Databases have been a staple of business computing since the beginning of the
digital era. In fact, the relational database was born in 1970 when E.F. Codd, a researcher
at IBM, wrote a paper outlining the process. Since then, relational databases have grown
in popularity and become a standard in business processes. Originally, databases were
flat, which means the information was stored in one long text file called a tab delimited
file.
A Relational Database has been applied to the NERP system. A relational
database is a database with relationships between its tables of records based on common
fields. Relational databases use tables to store information, and are created using a special
programming language, structured query language (SQL), which is the standard language
for database interoperability. SQL is the foundation for all popular database applications
available today, from Access to Oracle. For the NERP system, the database management
system is written in MySQL which claims to be the world's most popular open source
database. It is an extremely reliable, high performance and scalable database for cost-
effectively delivering business-critical applications. MySQL gives corporate developers
an array of enterprise features to make them more productive in developing, deploying
and maintaining the most demanding enterprise application, including high volume, Web
and data warehouses.
Platform choices
In the distributed PC, or thick, computing model, which is the predominant style
of network computing, the software is maintained at the PC level, giving individual users
90
Reproduced with permission of the copyright owner. Further reproduction prohibited without permission.
Relational Database
Databases have been a staple of business computing since the beginning of the
digital era. In fact, the relational database was born in 1970 when E.F. Codd, a researcher
at IBM, wrote a paper outlining the process. Since then, relational databases have grown
in popularity and become a standard in business processes. Originally, databases were
flat, which means the information was stored in one long text file called a tab delimited
file.
A Relational Database has been applied to the NERP system. A relational
database is a database with relationships between its tables of records based on common
fields. Relational databases use tables to store information, and are created using a special
programming language, structured query language (SQL), which is the standard language
for database interoperability. SQL is the foundation for all popular database applications
available today, from Access to Oracle. For the NERP system, the database management
system is written in MySQL which claims to be the world’s most popular open source
database. It is an extremely reliable, high performance and scalable database for cost-
effectively delivering business-critical applications. MySQL gives corporate developers
an array of enterprise features to make them more productive in developing, deploying
and maintaining the most demanding enterprise application, including high volume, Web
and data warehouses.
Platform choices
In the distributed PC, or thick, computing model, which is the predominant style
of network computing, the software is maintained at the PC level, giving individual users
90
Reproduced with permission of the copyright owner. Further reproduction prohibited without permission.
the freedom and flexibility to load their own software, customize applications and more
easily take those applications with them when on the move. However, by allowing this
freedom and flexibility to exist, organizations introduce a significant cost and level of
complexity if those systems go unmanaged. This is because PC computing models
involve indirect costs that most organizations do not account for in their total cost
estimates. For many small organizations, having unmanaged and fully configurable cost
management is not accounted for in their total cost estimates (Gartner, 2004).
From the research conducted by the Gartner group (2004), the "thin client" is a
logical, not physical, construct. Thin-client applications are executed on a server and do
not require client-resident installation: the graphical user interface is rendered to the
client. The prevailing myth is that client-side applications are moving to thin clients.
Most Web-based applications are HTML-only, which deliver a weak user interface with
poor performance over remote networks.
For our NERP system, neither thick nor thin server platforms may best suit the
requirements for SMEs, but features from each are used. The NERP system allows
operation both on the Web-based server and the server/clients server, depending on the
requirement and application of the companies with so-called "Slim Platforms." From the
results of Gartner's research, we can see that the slim platforms have the following
strengths: they are delivered as needed, have central management, client-side execution,
rich experience, and can support Java, Windows, WTS and .NET. Figure 4.20 represents
the architectural difference between Thin, Thick and Slim platforms (Gartner, 2004).
91
Reproduced with permission of the copyright owner. Further reproduction prohibited without permission.
the freedom and flexibility to load their own software, customize applications and more
easily take those applications with them when on the move. However, by allowing this
freedom and flexibility to exist, organizations introduce a significant cost and level of
complexity if those systems go unmanaged. This is because PC computing models
involve indirect costs that most organizations do not account for in their total cost
estimates. For many small organizations, having unmanaged and fully configurable cost
management is not accounted for in their total cost estimates (Gartner, 2004).
From the research conducted by the Gartner group (2004), the “thin client” is a
logical, not physical, construct. Thin-client applications are executed on a server and do
not require client-resident installation: the graphical user interface is rendered to the
client. The prevailing myth is that client-side applications are moving to thin clients.
Most Web-based applications are HTML-only, which deliver a weak user interface with
poor performance over remote networks.
For our NERP system, neither thick nor thin server platforms may best suit the
requirements for SMEs, but features from each are used. The NERP system allows
operation both on the Web-based server and the server/clients server, depending on the
requirement and application of the companies with so-called “Slim Platforms.” From the
results of Gartner’s research, we can see that the slim platforms have the following
strengths: they are delivered as needed, have central management, client-side execution,
rich experience, and can support Java, Windows, WTS and .NET. Figure 4.20 represents
the architectural difference between Thin, Thick and Slim platforms (Gartner, 2004).
91
Reproduced with permission of the copyright owner. Further reproduction prohibited without permission.
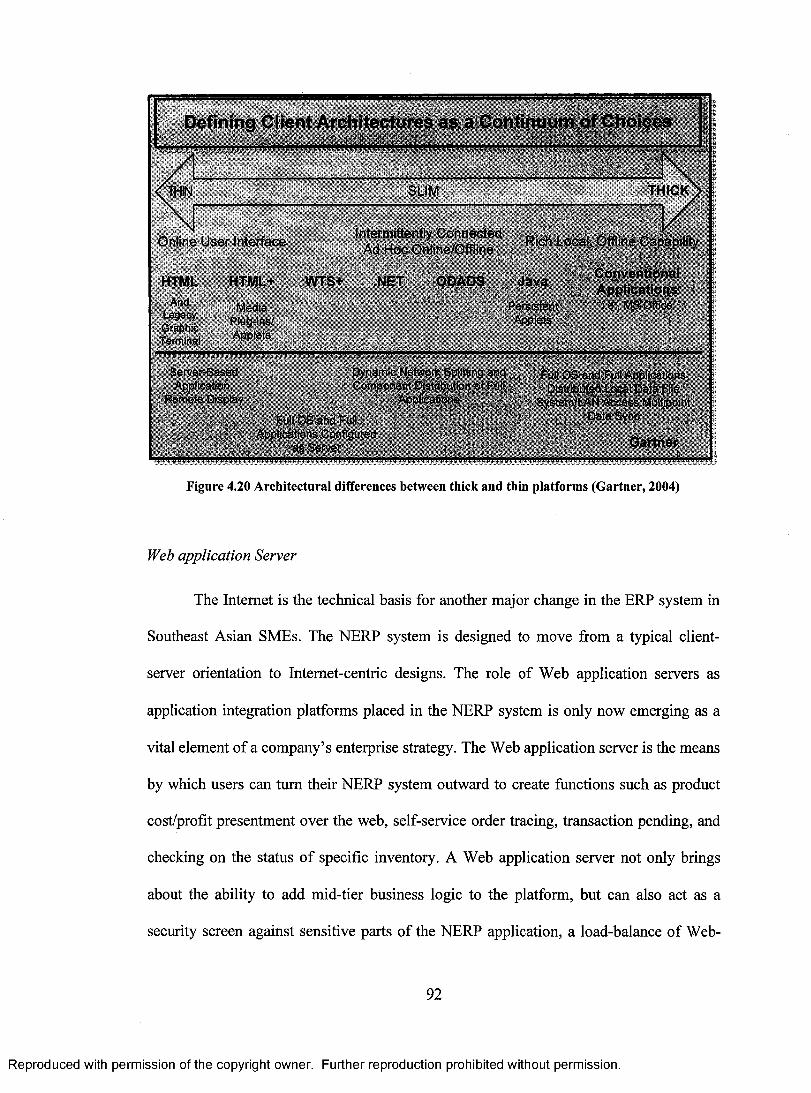
Defining Client Architectures as a Continuum of Choices
THIN SLIM THICK
Online User Interface Intermittently Connected
Rich Local, Offline Capability Ad Hoc Online/Offline
HTML HTML+ WTS+ .NET ODADS Java
And Media Persistent Legacy
Plug-ins/ Applets Graphic
Applets Terminal
Conventional Applications i.e. , MS Office
Server-Based Dynamic Network Splitting and Application, Component Distribution of Full
Remote Display Applications
Full OS and Full Applications Configured
as Server
Full OS and Full Applications Distributed Local Data File
System/LAN Access Multipoint Data Sync
Gartner
Figure 4.20 Architectural differences between thick and thin platforms (Gartner, 2004)
Web application Server
The Internet is the technical basis for another major change in the ERP system in
Southeast Asian SMEs. The NERP system is designed to move from a typical client-
server orientation to Internet-centric designs. The role of Web application servers as
application integration platforms placed in the NERP system is only now emerging as a
vital element of a company's enterprise strategy. The Web application server is the means
by which users can turn their NERP system outward to create functions such as product
cost/profit presentment over the web, self-service order tracing, transaction pending, and
checking on the status of specific inventory. A Web application server not only brings
about the ability to add mid-tier business logic to the platform, but can also act as a
security screen against sensitive parts of the NERP application, a load-balance of Web-
92
Reproduced with permission of the copyright owner. Further reproduction prohibited without permission.
Defining Client Architectures as a Continuum of Choices
Intelmittently Connected Ad Hoc Online/Offline
SLIM T1
Online User Interface Rich Local, Offline Capability
AndLegacyG raphicTerminal
MediaPlug-ins/Applets
HTML HTML+ WTS+ .NET ODADS Java
PersistentApplets
ConventionalApplicationsi.e., MS Office
Server-Based Application,
Remote Display
Dynamic Network Splitting and Component Distribution of Full
Applications
Full OS and Full Applications Distributed Local Data File
System/LAN Access Multipoint Data SyncFull OS and Full
Applications Configured as Server Gartner
Figure 4.20 Architectural differences between thick and thin platforms (Gartner, 2004)
Web application Server
The Internet is the technical basis for another major change in the ERP system in
Southeast Asian SMEs. The NERP system is designed to move from a typical client-
server orientation to Internet-centric designs. The role of Web application servers as
application integration platforms placed in the NERP system is only now emerging as a
vital element of a company’s enterprise strategy. The Web application server is the means
by which users can turn their NERP system outward to create functions such as product
cost/profit presentment over the web, self-service order tracing, transaction pending, and
checking on the status of specific inventory. A Web application server not only brings
about the ability to add mid-tier business logic to the platform, but can also act as a
security screen against sensitive parts of the NERP application, a load-balance of Web-
92
Reproduced with permission of the copyright owner. Further reproduction prohibited without permission.

request traffic, and an integration point of verification systems and databases outside of
the NERP system.
The NERP system is written in Java 2 Enterprise Edition (J2EE) by deploying the
web-based applications and Work Station applications with an interpreter tool offered via
the Internet. The Java application offers many advantages for the NERP system,
including a compact, consistent and portable directory structure, the ability to segregate
applications and provide a unique environment for each application, and the fact that
resources can be tied together with web-based and work station based components. By
programming the NERP system in Java, the software has become Web enabled, allowing
users to connect remotely to the Java virtual server.
Figure 4.21 shows two aspects of connection and platforms via the NERP system,
the web based application and the work station application. In the upper portion of the
model, the field salesperson's computer (laptop) and the supplier's computer are so
tightly linked to the NERP system that the sales agent's computer can compute and
promise future production and delivery on-line, using information from the supplier sent
to the server to determine material and capacity availability of any necessary items. The
users of the NERP system can also make a purchase order via the supplier's web
application, which will greatly eliminate all middlemen in the distribution channel.
The lower portion of the model shows the work station application or NERP
system in the server/client platform. The processing of work is divided between two types
of computers. The "Client" is the work station computer that contains the NERP system.
This computer performs display functions and often carries out computations as well. The
"server" is the more central computer that contains the database. Every transaction
93
Reproduced with permission of the copyright owner. Further reproduction prohibited without permission.
request traffic, and an integration point of verification systems and databases outside of
the NERP system.
The NERP system is written in Java 2 Enterprise Edition (J2EE) by deploying the
web-based applications and Work Station applications with an interpreter tool offered via
the Internet. The Java application offers many advantages for the NERP system,
including a compact, consistent and portable directory structure, the ability to segregate
applications and provide a unique environment for each application, and the fact that
resources can be tied together with web-based and work station based components. By
programming the NERP system in Java, the software has become Web enabled, allowing
users to connect remotely to the Java virtual server.
Figure 4.21 shows two aspects of connection and platforms via the NERP system,
the web based application and the work station application. In the upper portion of the
model, the field salesperson’s computer (laptop) and the supplier’s computer are so
tightly linked to the NERP system that the sales agent’s computer can compute and
promise future production and delivery on-line, using information from the supplier sent
to the server to determine material and capacity availability of any necessary items. The
users of the NERP system can also make a purchase order via the supplier’s web
application, which will greatly eliminate all middlemen in the distribution channel.
The lower portion of the model shows the work station application or NERP
system in the server/client platform. The processing of work is divided between two types
of computers. The “Client” is the work station computer that contains the NERP system.
This computer performs display functions and often carries out computations as well. The
“server” is the more central computer that contains the database. Every transaction
93
Reproduced with permission of the copyright owner. Further reproduction prohibited without permission.
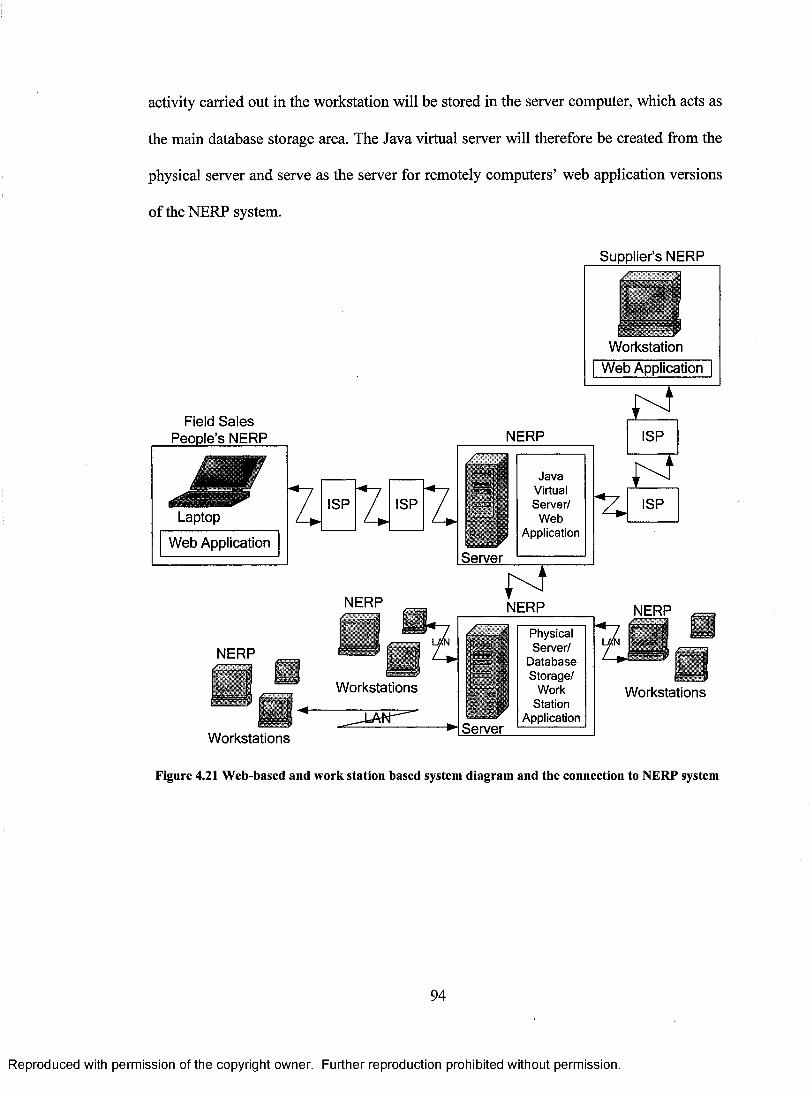
activity carried out in the workstation will be stored in the server computer, which acts as
the main database storage area. The Java virtual server will therefore be created from the
physical server and serve as the server for remotely computers' web application versions
of the NERP system.
Supplier's NERP
Workstation
Field Sales People's NERP
Laptop
Web Application
7.
NERP
Workstations
ISP
NERP
ISP
Workstations
Web Application
NERP ISP
• Java •
Virtual Server/
/ ISP
Web Application
Server •
V NERP NERP
I
Physical Server/
Database Storage/
Work Station
Application Server
Workstations
Figure 4.21 Web-based and work station based system diagram and the connection to NERP system
94
Reproduced with permission of the copyright owner. Further reproduction prohibited without permission.
activity carried out in the workstation will be stored in the server computer, which acts as
the main database storage area. The Java virtual server will therefore be created from the
physical server and serve as the server for remotely computers’ web application versions
of the NERP system.
Supplier’s NERP
Field Sales People’s NERP
Laptop
Web Application
NERP
NERP
ISP z ISP z i —*kServer
JavaVirtualServer/
WebApplication
NERP i -
NERP
Workstations
Workstations
jS '
IsWorkstation
Web Application
ISP
% ISP
NERP
. !Ill
Server
PhysicalServer/
DatabaseStorage/
WorkStation
Application
NtKr
L “ "tr
Workstations
Figure 4.21 Web-based and work station based system diagram and the connection to NERP system
94
Reproduced with permission of the copyright owner. Further reproduction prohibited without permission.
Chapter 5
Presentation, Interpretation and Analysis of data
This chapter presents the results of the survey and interviews, and the document
analysis of the design of a Novel ERP system for five Southeast Asian SMEs. It also
presents the effects of the requested requirements of the ERP system in terms of financial
management, manufacturing, sales and distribution, customer relations, human resources,
organization and culture, and hosted software studies. This chapter is divided into four
sections. The first section shows a comparison of the existing ERP system and NERP,
while the second section evaluates the major strengths and weaknesses of Novel ERP
software for SMEs in Southeast Asia. The third section evaluates the perception of the
potential needs of the Novel ERP system, and its effects on Southeast Asian SMEs,
looking in particular at a comparison between theory and practice. The forth and last
section presents the opinions of the respondents regarding the Enterprise Resource
Planning market and what they can anticipate from it in the future.
5.1 Comparison of existing ERP systems and NERP
Holland (2005) has conducted research on the most suitable solution for business
operations that have multiple platforms and software packages and want that want to run
financials, operations, and ecommerce transactions. At first he considered making custom
middleware to carry out the data transition between the disparate systems, but it appears
that a complete ERP solution was most suitable. The limited conditions, assumptions, and
objectives for suitable software are Supply Chain modules, Customer Relationship
95
Reproduced with permission of the copyright owner. Further reproduction prohibited without permission.

Management modules, Financial modules, as well as being remotely accessible and cost
effective for a small to medium sized business. Integrated with the results from Holland
(2005), five ERP packages have been chosen to be studied and compared with the NERP
system.
OpenPro ERP
One of the older web-based ERP systems, OpenPro ERP utilizes open-source
technologies to provide both software and hosted ERP solutions. OpenPro ERP has
various packages available to companies of varying sizes as well as a strong reselling
network, with over 72 companies nationwide.
Being a lover of open-source software, OpenPro ERP is a very viable product for
a complete ERP solution. The only concern lies with its unprofessional website and
unattractive user interface. However, these are only minor issues, and OpenPro ERP is a
great solution for a small-or medium sized ERP requirement, especially because of its
cost.
The primary Modules of OpenPro ERP are as follows:
o Financial - Complete reporting and analysis available.
o Supply Chain - Order Entry, Purchasing, Inventory Control, Point of Sale,
Sales Analysis, and Customer Service Management.
o Sales Force Automation — Salespeople can track leads, opportunities, and
manage their existing accounts.
o Time Clock / Payroll — Employees can clock in/out and accurately process
their payroll
96
Reproduced with permission of the copyright owner. Further reproduction prohibited without permission.
Management modules, Financial modules, as well as being remotely accessible and cost
effective for a small to medium sized business. Integrated with the results from Holland
(2005), five ERP packages have been chosen to be studied and compared with the NERP
system.
OpenPro ERP
One of the older web-based ERP systems, OpenPro ERP utilizes open-source
technologies to provide both software and hosted ERP solutions. OpenPro ERP has
various packages available to companies of varying sizes as well as a strong reselling
network, with over 72 companies nationwide.
Being a lover of open-source software, OpenPro ERP is a very viable product for
a complete ERP solution. The only concern lies with its unprofessional website and
unattractive user interface. However, these are only minor issues, and OpenPro ERP is a
great solution for a small-or medium sized ERP requirement, especially because of its
cost.
The primary Modules of OpenPro ERP are as follows:
o Financial - Complete reporting and analysis available,
o Supply Chain - Order Entry, Purchasing, Inventory Control, Point of Sale,
Sales Analysis, and Customer Service Management,
o Sales Force Automation - Salespeople can track leads, opportunities, and
manage their existing accounts,
o Time Clock / Payroll - Employees can clock in/out and accurately process
their payroll
96
Reproduced with permission of the copyright owner. Further reproduction prohibited without permission.

NetSuite Full Edition
A completely web-based ERP and CRM integrated system, NetSuite Full Edition
has most of the features of the Oracle product with a price that is more affordable. It has a
long list of clients and success stories, as well as a long and capable list of features and
modules.
NetSuite Full Edition's response is timely, their product offering is complete, and
their price is inexpensive compared to other services. The only negative side to NetSuite
Full Edition is their pricing for additional modules. Their website does not clearly explain
what is included and what is additional, so the price could rise rapidly. For example, the
Web Analytics module costs an additional $199/month, which translates to $7,200 over
three years.
The primary Modules of NetSuite Full Edition are as follows:
o Financial — Standard functions. Also includes multi-level companies and
fiscal budgeting.
o Inventory — Complete inventory management that is integrated with server
platforms so that changes are instantly reflected for customers and
salespeople. Also has advanced order fulfilment & integration with UPS.
o Purchasing & Vendor Management
o Sales Force Automations — Helps salespeople track leads, opportunities,
and dive deeper into existing accounts.
o Marketing Automation — Tracks the success of online, offline, and direct
marketing campaigns. It also uses promotion codes to apply limited time
pricing and referral offers.
97
Reproduced with permission of the copyright owner. Further reproduction prohibited without permission.
NetSuite Full Edition
A completely web-based ERP and CRM integrated system, NetSuite Full Edition
has most of the features of the Oracle product with a price that is more affordable. It has a
long list of clients and success stories, as well as a long and capable list of features and
modules.
NetSuite Full Edition’s response is timely, their product offering is complete, and
their price is inexpensive compared to other services. The only negative side to NetSuite
Full Edition is their pricing for additional modules. Their website does not clearly explain
what is included and what is additional, so the price could rise rapidly. For example, the
Web Analytics module costs an additional $ 199/month, which translates to $7,200 over
three years.
The primary Modules of NetSuite Full Edition are as follows:
o Financial - Standard functions. Also includes multi-level companies and
fiscal budgeting.
o Inventory - Complete inventory management that is integrated with server
platforms so that changes are instantly reflected for customers and
salespeople. Also has advanced order fulfilment & integration with UPS.
o Purchasing & Vendor Management
o Sales Force Automations - Helps salespeople track leads, opportunities,
and dive deeper into existing accounts,
o Marketing Automation - Tracks the success of online, offline, and direct
marketing campaigns. It also uses promotion codes to apply limited time
pricing and referral offers.
97
Reproduced with permission of the copyright owner. Further reproduction prohibited without permission.
Axis Accounting (Local ERP Integrator)
Axis Accounting is a reputable ERP consultancy firm with extensive experience
with multiple software platforms such as Epicor and Microsoft. Axis provides complete
financial and ERP solutions to clients on Windows networks.
Axis Accounting acts as a local vendor, often giving fast response and capable of
coming on-site for immediate expert support. However, the need for additional
infrastructure is a major deterrent for this project. There are additional costs for servers
and desktops, as well as additional fees associated with Citrix. This can quickly result in
increased expenses.
Suggested Software Solutions (Modules):
o Microsoft Great Plains — Financial Management, Supply Chain
Management, Customer Relationship Management, E-Business, and
Business Analytics
o Best Software, Platinum for Windows (PFW) — PFW is a comprehensive
ERP system for small-to medium-sized businesses. The package contains
modules for financials, distribution, payroll, human resource management,
project management, business intelligence, eCommerce, and customer
relationship management.
Intacct ERP OnDemand
As the 'best of breed' web-based ERP, Intacct focuses primarily on Financial and
Supply Chain management. The service is designed to integrate easily with other third
98
Reproduced with permission of the copyright owner. Further reproduction prohibited without permission.
Axis Accounting (Local ERP Integrator)
Axis Accounting is a reputable ERP consultancy firm with extensive experience
with multiple software platforms such as Epicor and Microsoft. Axis provides complete
financial and ERP solutions to clients on Windows networks.
Axis Accounting acts as a local vendor, often giving fast response and capable of
coming on-site for immediate expert support. However, the need for additional
infrastructure is a major deterrent for this project. There are additional costs for servers
and desktops, as well as additional fees associated with Citrix. This can quickly result in
increased expenses.
Suggested Software Solutions (Modules):
o Microsoft Great Plains - Financial Management, Supply Chain
Management, Customer Relationship Management, E-Business, and
Business Analytics
o Best Software, Platinum for Windows (PFW) - PFW is a comprehensive
ERP system for small-to medium-sized businesses. The package contains
modules for financials, distribution, payroll, human resource management,
project management, business intelligence, eCommerce, and customer
relationship management.
Intacct ERP OnDemand
As the ‘best of breed’ web-based ERP, Intacct focuses primarily on Financial and
Supply Chain management. The service is designed to integrate easily with other third
98
Reproduced with permission of the copyright owner. Further reproduction prohibited without permission.

party systems, and they have an extensive list of vendors they work with, including the
CRM leader Salesforce.com and payroll leaders such as ADP.
While a little slow on the original customer service inquiry, they surged back with
a clear goal of providing the 'best' system for financial and supply chain management.
Also, while they lack modules that other systems provide, their open approach to
integrating with any other third party system leads to maximum flexibility for future
expansion.
The primary Modules of Intacct are as follows:
o Financial — Powerful set of tools and Cash Management.
o Supply Chain — Consists of Inventory, Sales Order Management, Billing,
and Purchasing.
Oracle eBusiness Suite (Special Edition)
Despite being well-known as one of the largest software providers for large
companies, Oracle is trying to limit their software's functions and features to suit the
needs of smaller enterprises.
Oracle has the brand name and the history, but the price is extremely inflated
compared to similar offers on the market. Their ASP hosting price is very high and their
web-based platform is even higher. While they indicated that they would negotiate, they
also made it clear that they were not interested in many 'small' businesses. They do,
however, have many modules that help run the advanced parts of a business, including a
scorecard application that helps improve efficiency in the operations.
The primary Modules of Oracle eBusiness Suite are as follows:
99
Reproduced with permission of the copyright owner. Further reproduction prohibited without permission.
party systems, and they have an extensive list of vendors they work with, including the
CRM leader Salesforce.com and payroll leaders such as ADP.
While a little slow on the original customer service inquiry, they surged back with
a clear goal of providing the ‘best’ system for financial and supply chain management.
Also, while they lack modules that other systems provide, their open approach to
integrating with any other third party system leads to maximum flexibility for future
expansion.
The primary Modules of Intacct are as follows:
o Financial - Powerful set of tools and Cash Management,
o Supply Chain - Consists of Inventory, Sales Order Management, Billing,
and Purchasing.
Oracle eBusiness Suite (Special Edition)
Despite being well-known as one of the largest software providers for large
companies, Oracle is trying to limit their software’s functions and features to suit the
needs of smaller enterprises.
Oracle has the brand name and the history, but the price is extremely inflated
compared to similar offers on the market. Their ASP hosting price is very high and their
web-based platform is even higher. While they indicated that they would negotiate, they
also made it clear that they were not interested in many ‘small’ businesses. They do,
however, have many modules that help run the advanced parts of a business, including a
scorecard application that helps improve efficiency in the operations.
The primary Modules of Oracle eBusiness Suite are as follows:
99
Reproduced with permission of the copyright owner. Further reproduction prohibited without permission.
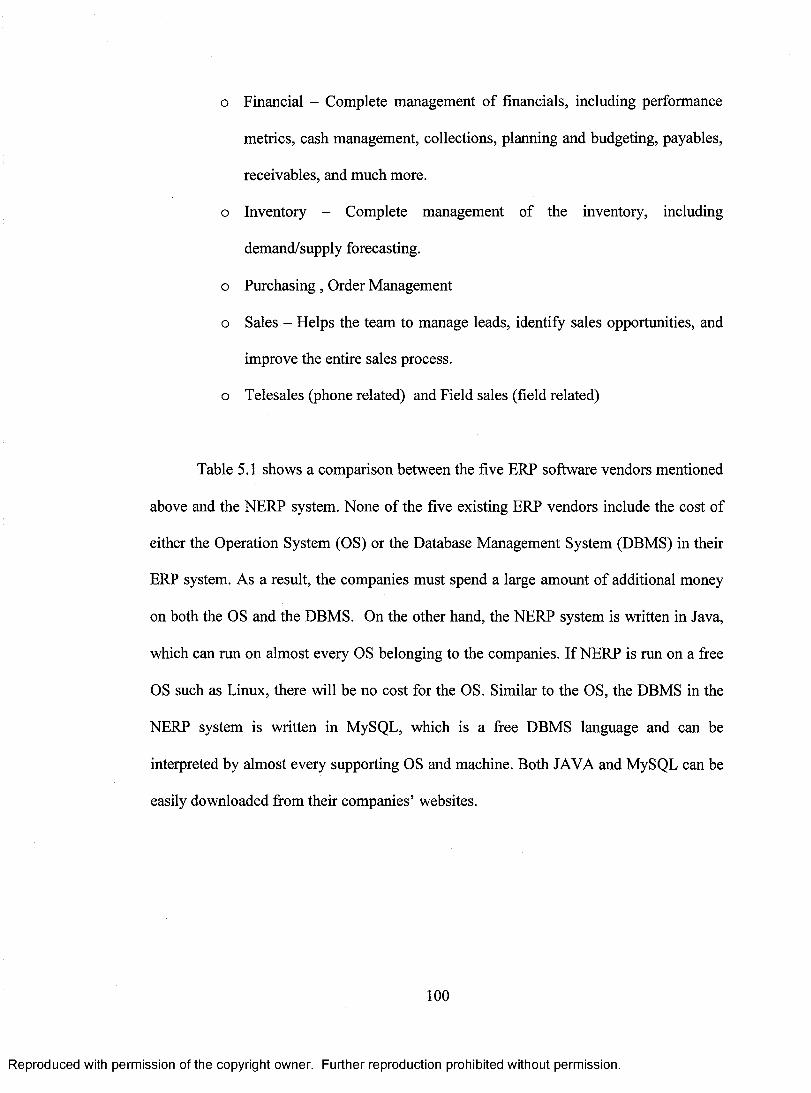
o Financial — Complete management of financials, including performance
metrics, cash management, collections, planning and budgeting, payables,
receivables, and much more.
o Inventory — Complete management of the inventory, including
demand/supply forecasting.
o Purchasing , Order Management
o Sales — Helps the team to manage leads, identify sales opportunities, and
improve the entire sales process.
o Telesales (phone related) and Field sales (field related)
Table 5.1 shows a comparison between the five ERP software vendors mentioned
above and the NERP system. None of the five existing ERP vendors include the cost of
either the Operation System (OS) or the Database Management System (DBMS) in their
ERP system. As a result, the companies must spend a large amount of additional money
on both the OS and the DBMS. On the other hand, the NERP system is written in Java,
which can run on almost every OS belonging to the companies. If NERP is run on a free
OS such as Linux, there will be no cost for the OS. Similar to the OS, the DBMS in the
NERP system is written in MySQL, which is a free DBMS language and can be
interpreted by almost every supporting OS and machine. Both JAVA and MySQL can be
easily downloaded from their companies' websites.
100
Reproduced with permission of the copyright owner. Further reproduction prohibited without permission.
o Financial - Complete management of financials, including performance
metrics, cash management, collections, planning and budgeting, payables,
receivables, and much more,
o Inventory - Complete management of the inventory, including
demand/supply forecasting,
o Purchasing , Order Management
o Sales - Helps the team to manage leads, identify sales opportunities, and
improve the entire sales process,
o Telesales (phone related) and Field sales (field related)
Table 5.1 shows a comparison between the five ERP software vendors mentioned
above and the NERP system. None of the five existing ERP vendors include the cost of
either the Operation System (OS) or the Database Management System (DBMS) in their
ERP system. As a result, the companies must spend a large amount of additional money
on both the OS and the DBMS. On the other hand, the NERP system is written in Java,
which can run on almost every OS belonging to the companies. If NERP is run on a free
OS such as Linux, there will be no cost for the OS. Similar to the OS, the DBMS in the
NERP system is written in MySQL, which is a free DBMS language and can be
interpreted by almost every supporting OS and machine. Both JAVA and MySQL can be
easily downloaded from their companies’ websites.
100
Reproduced with permission of the copyright owner. Further reproduction prohibited without permission.
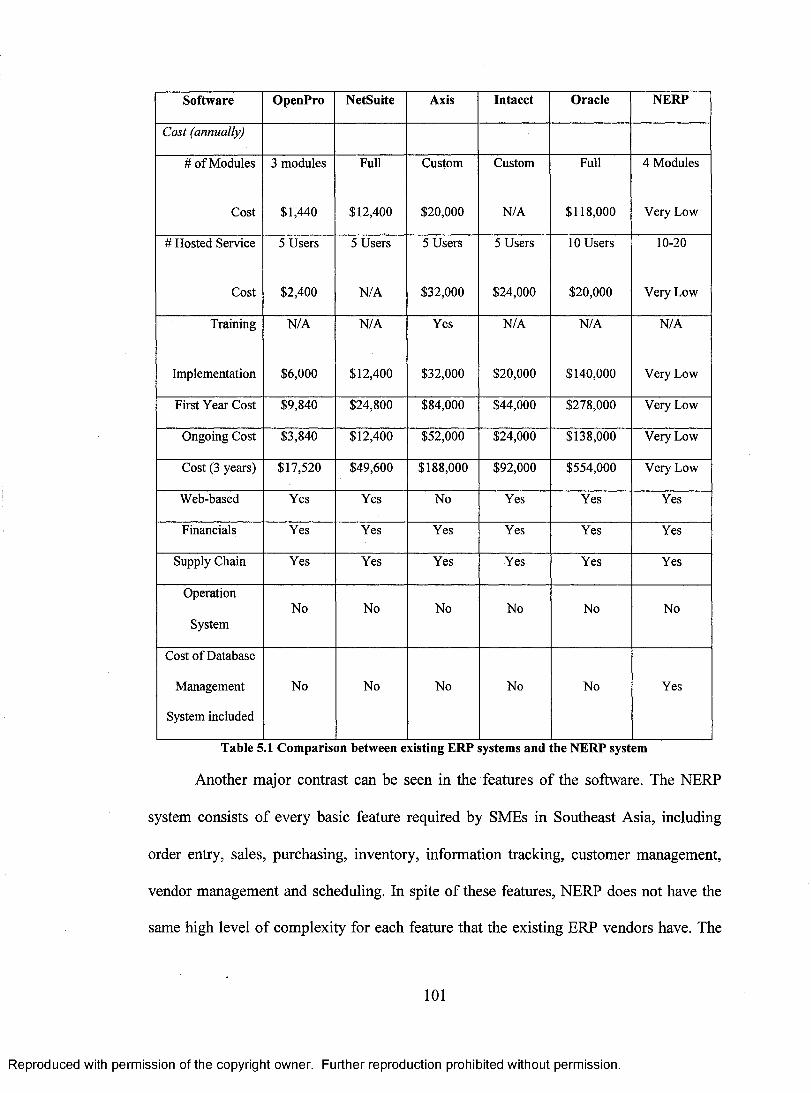
Software OpenPro NetSuite Axis Intacct Oracle NERP
Cost (annually)
# of Modules
Cost
3 modules
$1,440
Full
$12,400
Custom
$20,000
Custom
N/A
Full
$118,000
4 Modules
Very Low
# Hosted Service
Cost
5 Users
$2,400
5 Users
N/A
5 Users
$32,000
5 Users
$24,000
10 Users
$20,000
10-20
Very Low
Training
Implementation
N/A
$6,000
N/A
$12,400
Yes
$32,000
N/A
$20,000
N/A
$140,000
N/A
Very Low
First Year Cost $9,840 $24,800 $84,000 $44,000 $278,000 Very Low
Ongoing Cost $3,840 $12,400 $52,000 $24,000 $138,000 Very Low
Cost (3 years) $17,520 $49,600 $188,000 $92,000 $554,000 Very Low
Web-based Yes Yes No Yes Yes Yes
Financials Yes Yes Yes Yes Yes Yes
Supply Chain Yes Yes Yes Yes Yes Yes
Operation
System No No No No No No
Cost of Database
Management
System included
No No No No No Yes
Table 5.1 Comparison between existing ERP systems and the NERP system
Another major contrast can be seen in the features of the software. The NERP
system consists of every basic feature required by SMEs in Southeast Asia, including
order entry, sales, purchasing, inventory, information tracking, customer management,
vendor management and scheduling. In spite of these features, NERP does not have the
same high level of complexity for each feature that the existing ERP vendors have. The
101
Reproduced with permission of the copyright owner. Further reproduction prohibited without permission.
Software OpenPro NetSuite Axis Intacct Oracle NERP
Cost (annually)
# of Modules 3 modules Full Custom Custom Full 4 Modules
Cost $1,440 $12,400 $20,000 N/A $118,000 Very Low
# Hosted Service 5 Users 5 Users 5 Users 5 Users 10 Users 10-20
Cost $2,400 N/A $32,000 $24,000 $20,000 Very Low
Training N/A N/A Yes N/A N/A N/A
Implementation $6,000 $12,400 $32,000 $20,000 $140,000 Very Low
First Year Cost $9,840 $24,800 $84,000 $44,000 $278,000 Very Low
Ongoing Cost $3,840 $12,400 $52,000 $24,000 $138,000 Very Low
Cost (3 years) $17,520 $49,600 $188,000 $92,000 $554,000 Very Low
Web-based Yes Yes No Yes Yes Yes
Financials Yes Yes Yes Yes Yes Yes
Supply Chain Yes Yes Yes Yes Yes Yes
Operation
SystemNo No No No No No
Cost of Database
Management
System included
No No No No No Yes
Table 5.1 Comparison between existing ERP systems and the NERP system
Another major contrast can be seen in the features of the software. The NERP
system consists of every basic feature required by SMEs in Southeast Asia, including
order entry, sales, purchasing, inventory, information tracking, customer management,
vendor management and scheduling. In spite of these features, NERP does not have the
same high level of complexity for each feature that the existing ERP vendors have. The
101
Reproduced with permission of the copyright owner. Further reproduction prohibited without permission.
NERP system does not focus primarily on a few modules of the software, like Intacct,
which only focuses on financial and supply chain modules. Nor does it purchase software
packaged by other vendors and integrate it with its own software, like Axis. It also does
not consist of sophisticated modules, like Oracle. The NERP system is more similar to
OpenPro and NetSuite in terms of available modules; however, NERP is much cheaper
than NetSuite and has an easier graphical user interface than OpenPro.
The most important difference between these five types of ERP software and the
NERP system is found in the software's architectural design. These five existing ERP
systems have designs based on North American SMEs, which have different
characteristic requirements, software requirements, and user requirements than Southeast
Asian SMEs, as was stated in an earlier section of this research.
5.2 Data analysis
Using a survey and questionnaires, 50 people in five selected SMEs in Southeast
Asia, have been asked questions that are used to determine important factors in
developing and evaluating the integrated manufacturing computer system for SMEs.
These responses have been graded on a scale of 1 to 5, where 5 means that the function is
extremely important to the software, and the feature works incredibly well in the
software. 1, on the other hands, means it is not at all important to the software, or else
that the feature works very weakly in the software. Table 5.1 shows the results of the
survey.
From the results shown in Table 5.2, the number of males and females responding
to the survey is very similar, being 46% and 54%, respectively. As can be seen clearly in
102
Reproduced with permission of the copyright owner. Further reproduction prohibited without permission.
NERP system does not focus primarily on a few modules of the software, like Intacct,
which only focuses on financial and supply chain modules. Nor does it purchase software
packaged by other vendors and integrate it with its own software, like Axis. It also does
not consist of sophisticated modules, like Oracle. The NERP system is more similar to
OpenPro and NetSuite in terms of available modules; however, NERP is much cheaper
than NetSuite and has an easier graphical user interface than OpenPro.
The most important difference between these five types of ERP software and the
NERP system is found in the software’s architectural design. These five existing ERP
systems have designs based on North American SMEs, which have different
characteristic requirements, software requirements, and user requirements than Southeast
Asian SMEs, as was stated in an earlier section of this research.
5.2 Data analysis
Using a survey and questionnaires, 50 people in five selected SMEs in Southeast
Asia, have been asked questions that are used to determine important factors in
developing and evaluating the integrated manufacturing computer system for SMEs.
These responses have been graded on a scale of 1 to 5, where 5 means that the function is
extremely important to the software, and the feature works incredibly well in the
software. 1, on the other hands, means it is not at all important to the software, or else
that the feature works very weakly in the software. Table 5.1 shows the results of the
survey.
From the results shown in Table 5.2, the number of males and females responding
to the survey is very similar, being 46% and 54%, respectively. As can be seen clearly in
102
Reproduced with permission of the copyright owner. Further reproduction prohibited without permission.

the table, most of the companies participating in the survey are small- (1-10 employees)
and medium-sized (11-50 employees), and 80% of the companies have a turnover of less
than US $2.0 million. The major market area of these companies is local, occasionally
reaching the international level.
Factors Quantity Percentile Sex
Male 23 46 Female 27 54
Total 50 100.0 Number of Employees in Companies
1-10 20 40 11-50 30 60 51-250 0 0
Total 50 100.0 Company's Turnover (US$)
$0.1-0.5 M 10 20 $0.5-1.0 M 20 40 $1.0-2.0 M 10 20 Over $2.0 M 10 20
Total 50 100.0 Market Area
Local 20 40 Regional 10 20 National 10 20 International 10 20
Total 50 100.0 Table 5.2 General information of the participants
Satisfaction Level Averag Description 1 2 3 4 5
1.00-1.49 1.50-2.49 2.50-3.49 3.50-4.49 4.50-5.00
Much below average (MBA) Below average (BA)
Average (A) Above average (AA)
Much above average (MAA) Table 5.3 Relationships between satisfaction level, average score, and description
103
Reproduced with permission of the copyright owner. Further reproduction prohibited without permission.
the table, most of the companies participating in the survey are small- (1-10 employees)
and medium-sized (11-50 employees), and 80% of the companies have a turnover of less
than US $2.0 million. The major market area of these companies is local, occasionally
reaching the international level.
Factors Quantity PercentileSex
Male 23 46Female 27 54
Total 50 100.0Number of Employees in Companies
1-10 20 4011-50 30 6051-250 0 0
Total 50 100.0Company’s Turnover (US$)
$0.1-0.5 M 10 20$0.5-1.0 M 20 40$ 1.0-2.0 M 10 20Over $2.0 M 10 20
Total 50 100.0Market Area
Local 20 40Regional 10 20National 10 20International 10 20
Total 50 100.0Table 5.2 General information of the participants
Satisfaction Level Average Description1 1.00-1.49
1.50-2.492.50-3.493.50-4.494.50-5.00
Much below average (MBA)2 Below average (BA)3 Average (A)4 Above average (AA)5 Much above average (MAA)
Table 5.3 Relationships between satisfaction level, average score, and description
Reproduced with permission of the copyright owner. Further reproduction prohibited without permission.

System Overall Specification Factors Current NERP
Mean 3.63 4.56
Std. 0.89 0.51
Avg. AA MAA
P-value
0.01 1. Adaptability
2. Flexibility Current 3.38 0.96 A NERP 4.31 0.70 AA 0.01
3. Overall Cost Current 3.81 1.17 AA NERP 4.69 0.48 MAA 0.004
4. Efficiency of Internal Business Current 4.06 0.77 AA Processes NERP 4.69 0.48 MAA 0.000 5. Ease of use Current 3.69 0.79 AA
NERP 4.56 0.51 MAA 0.000
Total Current NERP
3.71 4.56
0.75 0.48
AA MAA 0.000
Table 5.4 Overall system satisfaction comparison between the existing system and NERP
As can be apprehended from the results in table 5.4, users have higher satisfaction
with the NERP system than with the existing system for every factor. The average
satisfaction level for the existing system is only just above average, while it is much
above average for the NERP system.
Table 5.5 illustrates the extent to which the different factors proposed have
affected the current software and Novel ERP software implementation and evaluation in
the five SMEs in Southeast Asia. For the current system column and the Novel ERP
system column the results represent how effectively these features can be used in the
software.
For the accounting module and function, the existing system can perform much
better than the NERP system, due to the fact that the NERP system does not focus much
on the financial and accounting methods of the companies. This is because that
information is very private and varies from company to company.
104
Reproduced with permission of the copyright owner. Further reproduction prohibited without permission.
S\stem Overall Specification Factors Mean Std. Avg. P-value1. Adaptability Current
NERP3.634.56
0.890.51
AAMAA 0.01
2. Flexibility CurrentNERP
3.384.31
0.960.70
AAA 0.01
3. Overall Cost Current 3.81 1.17 AANERP 4.69 0.48 MAA 0.004
4. Efficiency of Internal Business Current 4.06 0.77 AAProcesses NERP 4.69 0.48 MAA 0.0005. Ease of use Current 3.69 0.79 AA
NERP 4.56 0.51 MAA 0.000
Total Current 3.71 0.75 AANERP 4.56 0.48 MAA 0.000
Table 5.4 Overall system satisfaction comparison between the existing system and NERP
As can be apprehended from the results in table 5.4, users have higher satisfaction
with the NERP system than with the existing system for every factor. The average
satisfaction level for the existing system is only just above average, while it is much
above average for the NERP system.
Table 5.5 illustrates the extent to which the different factors proposed have
affected the current software and Novel ERP software implementation and evaluation in
the five SMEs in Southeast Asia. For the current system column and the Novel ERP
system column the results represent how effectively these features can be used in the
software.
For the accounting module and function, the existing system can perform much
better than the NERP system, due to the fact that the NERP system does not focus much
on the financial and accounting methods of the companies. This is because that
information is very private and varies from company to company.
104
Reproduced with permission of the copyright owner. Further reproduction prohibited without permission.

Software and Module Expectation Factors
N Min. Max. Mean Std. Avg.
1. Accounting Current NERP
50 50
3 3
5 5
4.29 3.85
0.69 0.62
AA AA
2. Customer and Supplier Current 50 3 5 3.87 0.61 AA Relations NERP 50 3 5 4.24 0.66 AA
3. Information Management Current NERP
50 50
3 3
5 5
3.99 4.24
0.75 0.66
AA AA
4. Intuitive System Current NERP
50 50
3 3
5 5
3.12 4.24
0.62 0.66
A AA
5. Inventory Management Current NERP
50 50
3 3
5 5
4.18 4.34
0.64 0.73
AA AA
6. Manufacturing and Logistics Current NERP
50 50
3 3
5 5
4.01 4.12
0.62 0.70
AA AA
7. Personal Productivity Current NERP
50 50
3 3
5 5
3.44 4.06
0.66 0.83
A AA
8. Openness Current NERP
50 50
3 3
5 5
3.26 4.06
0.62 0.43
A AA
9. Sales Current NERP
50 50
3 3
5 5
4.02 4.06
0.79 0.43
AA AA
10. Time Current NERP
50 50
3 3
5 5
3.82 3.78
0.73 0.58
AA AA
Total Current NERP
50 50
3 3
5 5
3.8 4.1
0.67 0.63
AA AA
Table 5.5 Software and module satisfaction factors, comparing the existing system and the NERP
system
The manufacturing module, sales module, and software response correspondence
time have the same satisfaction level for both systems. A possible reason behind this
similarity is that manufacturing varies in every company, and sales transactions occurring
in SMEs are mostly from regular customers with small orders. Given that SMEs may
have limited hardware, manpower, and financial capabilities, the software corresponding
time is mostly based on hardware performance and human expertise.
This comparison of the results of the current system and the Novel ERP system
prove that beginning with the conceptual framework design, these five SMEs in
105
Reproduced with permission of the copyright owner. Further reproduction prohibited without permission.
Software and Module Expectation Factors ' N Min. Max. Mean Std. Avg.
1. Accounting CurrentNERP
5050
33
55
4.293.85
0.690.62
AAAA
2. Customer and Supplier Current 50 3 5 3.87 0.61 AARelations NERP 50 3 5 4.24 0.66 AA
3. Information Management CurrentNERP
5050
33
55
3.994.24
0.750.66
AAAA
4. Intuitive System CurrentNERP
5050
33
55
3.124.24
0.620.66
AAA
5. Inventory Management CurrentNERP
5050
33
55
4.184.34
0.640.73
AAAA
6. Manufacturing and Logistics CurrentNERP
5050
33
55
4.014.12
0.620.70
AAAA
7. Personal Productivity CurrentNERP
5050
33
55
3.444.06
0.660.83
AAA
8. Openness Current 50 3 5 3.26 0.62 ANERP 50 3 5 4.06 0.43 AA
9. Sales Current 50 3 5 4.02 0.79 AANERP 50 3 5 4.06 0.43 AA
10. Time Current 50 3 5 3.82 0.73 AANERP 50 3 5 3.78 0.58 AA
Total Current 50 3 5 3.8 0.67 AANERP 50 3 5 4.1 0.63 AA
Table 5.5 Software and module satisfaction factors, comparing the existing system and the NERP
system
The manufacturing module, sales module, and software response correspondence
time have the same satisfaction level for both systems. A possible reason behind this
similarity is that manufacturing varies in every company, and sales transactions occurring
in SMEs are mostly from regular customers with small orders. Given that SMEs may
have limited hardware, manpower, and financial capabilities, the software corresponding
time is mostly based on hardware performance and human expertise.
This comparison of the results of the current system and the Novel ERP system
prove that beginning with the conceptual framework design, these five SMEs in
105
Reproduced with permission of the copyright owner. Further reproduction prohibited without permission.

Southeast Asia have found that the Novel ERP system is better than their existing system
in most ways. With a higher satisfaction mean of 4.1 for the NERP system over a mean
of only 3.8 for the existing system, there is at least one system that can satisfy the needs
and requirements of these SMEs in Southeast Asia
Platform Specification Factors
N Min. Max. Mean Std. Avg.
1. Local Area Network 50 3 5 4.38 0.62 AA 2. Web-based 50 3 5 4.31 0.79 AA 3. Mobile Device 50 2 5 3.02 0.83 A
Total 50 .2.67 5 3.90 0.75 AA Table 5.6 Platform choices for the development of an ERP system
As can be seen in Table 5.6, users agree that the Local Area Network (LAN)
connection and a Web-based server are very important for the manufacturing system.
However, if the application can be operated via a mobile device, the satisfaction level
increases to above average. Although there are currently limited resources, sizes, and
technology, the mobile device applications are slowly growing in Southeast Asian SMEs,
and will play an important role in the future development of the system.
Our Novel ERP system has been created using the Java programming language
combined with MySQL database programming. Both of these computer languages are
free of charge, open source and popular with expert software developers. Also, Java
applets-or the applications that are created in Java-can easily operate in a web-based
platform, server/clients platforms, single stand desktops and a combination of all three.
These features of Java and MySQL make the Novel ERP system capable of running in
most supported platforms free of charge.
Table 5.7 shows a comparison of the organizational and cultural factors of the
existing systems and the NERP system developed based on our framework. This
106
Reproduced with permission of the copyright owner. Further reproduction prohibited without permission.
Southeast Asia have found that the Novel ERP system is better than their existing system
in most ways. With a higher satisfaction mean of 4.1 for the NERP system over a mean
of only 3.8 for the existing system, there is at least one system that can satisfy the needs
and requirements of these SMEs in Southeast Asia
Platform Specification Factors N Min. Max. Mean Std. \vj».
1. Local Area Network 50 3 5 4.38 0.62 AA2. Web-based 50 3 5 4.31 0.79 AA3. Mobile Device 50 2 5 3.02 0.83 A
Total 50 2.67 5 3.90 0.75 AATable 5.6 Platform choices for the development of an ERP system
As can be seen in Table 5.6, users agree that the Local Area Network (LAN)
connection and a Web-based server are very important for the manufacturing system.
However, if the application can be operated via a mobile device, the satisfaction level
increases to above average. Although there are currently limited resources, sizes, and
technology, the mobile device applications are slowly growing in Southeast Asian SMEs,
and will play an important role in the future development of the system.
Our Novel ERP system has been created using the Java programming language
combined with MySQL database programming. Both of these computer languages are
free of charge, open source and popular with expert software developers. Also, Java
applets-or the applications that are created in Java-can easily operate in a web-based
platform, server/clients platforms, single stand desktops and a combination of all three.
These features of Java and MySQL make the Novel ERP system capable of running in
most supported platforms free of charge.
Table 5.7 shows a comparison of the organizational and cultural factors of the
existing systems and the NERP system developed based on our framework. This
106
Reproduced with permission of the copyright owner. Further reproduction prohibited without permission.
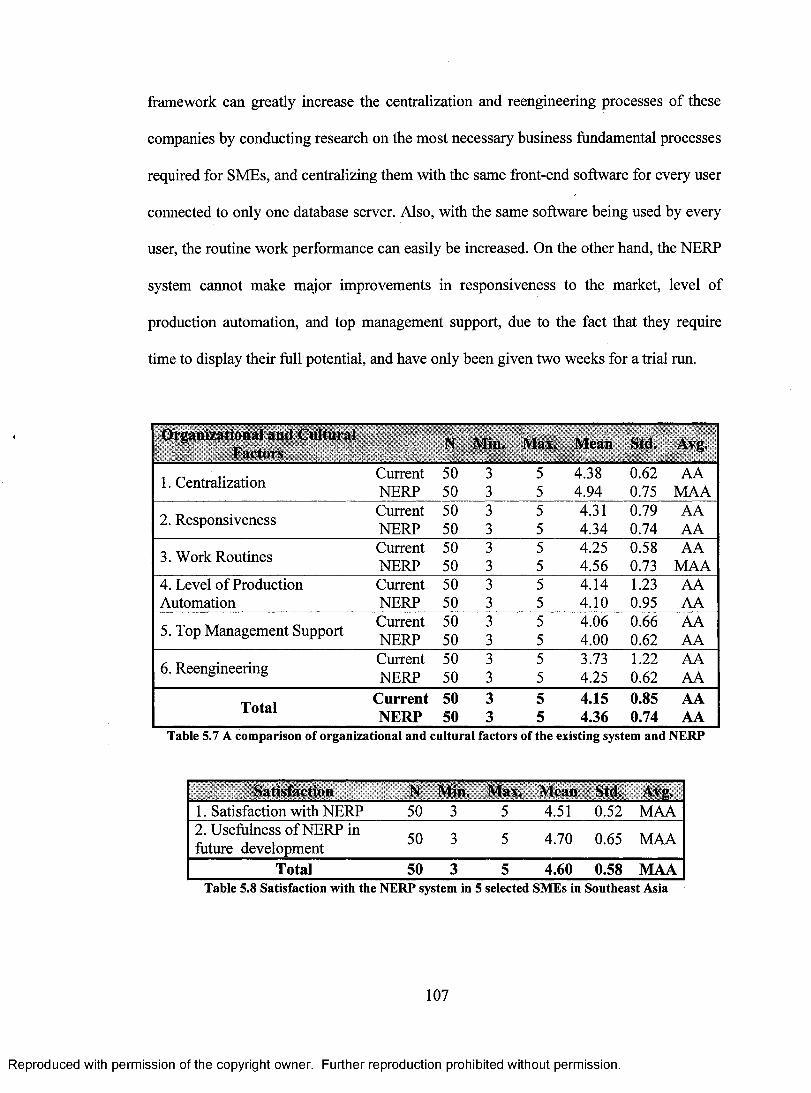
framework can greatly increase the centralization and reengineering processes of these
companies by conducting research on the most necessary business fundamental processes
required for SMEs, and centralizing them with the same front-end software for every user
connected to only one database server. Also, with the same software being used by every
user, the routine work performance can easily be increased. On the other hand, the NERP
system cannot make major improvements in responsiveness to the market, level of
production automation, and top management support, due to the fact that they require
time to display their full potential, and have only been given two weeks for a trial run.
Organizational and Cultural Factors
N Min. Nlay. Mean SW. AN g.
1. Centralization Current NERP
50 50
3 3
5 5
4.38 4.94
0.62 0.75
AA MAA
2. Responsiveness Current NERP
50 50
3 3
5 5
4.31 4.34
0.79 0.74
AA AA
3. Work Routines Current NERP
50 50
3 3
5 5
4.25 4.56
0.58 0.73
AA MAA
4. Level of Production Current 50 3 5 4.14 1.23 AA Automation NERP 50 3 5 4.10 0.95 AA
5. Top Management Support Current NERP
50 50
3 3
5 5
4.06 4.00
0.66 0.62
AA AA
6. Reengineering Current NERP
50 50
3 3
5 5
3.73 4.25
1.22 0.62
AA AA
Total Current NERP
50 50
3 3
5 5
4.15 4.36
0.85 0.74
AA AA
Table 5.7 A comparison of organizational and cultural factors of the existing system and NERP
Satisfaction N Min. Max. Mean Std. Avg. 1. Satisfaction with NERP 50 3 5 4.51 0.52 MAA 2. Usefulness of NERP in future development
50 3 5 4.70 0.65 MAA
Total 50 3 5 4.60 0.58 MAA Table 5.8 Satisfaction with the NERP system in 5 selected SMEs in Southeast Asia
107
Reproduced with permission of the copyright owner. Further reproduction prohibited without permission.
framework can greatly increase the centralization and reengineering processes of these
companies by conducting research on the most necessary business fundamental processes
required for SMEs, and centralizing them with the same front-end software for every user
connected to only one database server. Also, with the same software being used by every
user, the routine work performance can easily be increased. On the other hand, the NERP
system cannot make major improvements in responsiveness to the market, level of
production automation, and top management support, due to the fact that they require
time to display their full potential, and have only been given two weeks for a trial run.
Organizational and Cultural Factors N Min. Max. Mean Std. Avg.
1. Centralization CurrentNERP
5050
33
55
4.384.94
0.620.75
AAMAA
2. Responsiveness Current 50 3 5 4.31 0.79 AANERP 50 3 5 4.34 0.74 AA
3. Work Routines Current 50 3 5 4.25 0.58 AANERP 50 3 5 4.56 0.73 MAA
4. Level of Production Current 50 3 5 4.14 1.23 AAAutomation NERP 50 3 5 4.10 0.95 AA
5. Top Management Support Current 50 3 5 4.06 0.66 AANERP 50 3 5 4.00 0.62 AA
6. Reengineering Current 50 3 5 3.73 1.22 AANERP 50 3 5 4.25 0.62 AA
Total Current 50 3 5 4.15 0.85 AANERP 50 3 5 4.36 0.74 AA
Table 5.7 A comparison of organizational and cultural factors of the existing system and NERP
Satisfaction N Min. Max. Mean Std. Avg.1. Satisfaction with NERP 50 3 5 4.51 0.52 MAA2. Usefulness of NERP in future development 50 3 5 4.70 0.65 MAA
Total 50 3 5 4.60 0.58 MAATable 5.8 Satisfaction with the NERP system in 5 selected SMEs in Southeast Asia
107
Reproduced with permission of the copyright owner. Further reproduction prohibited without permission.
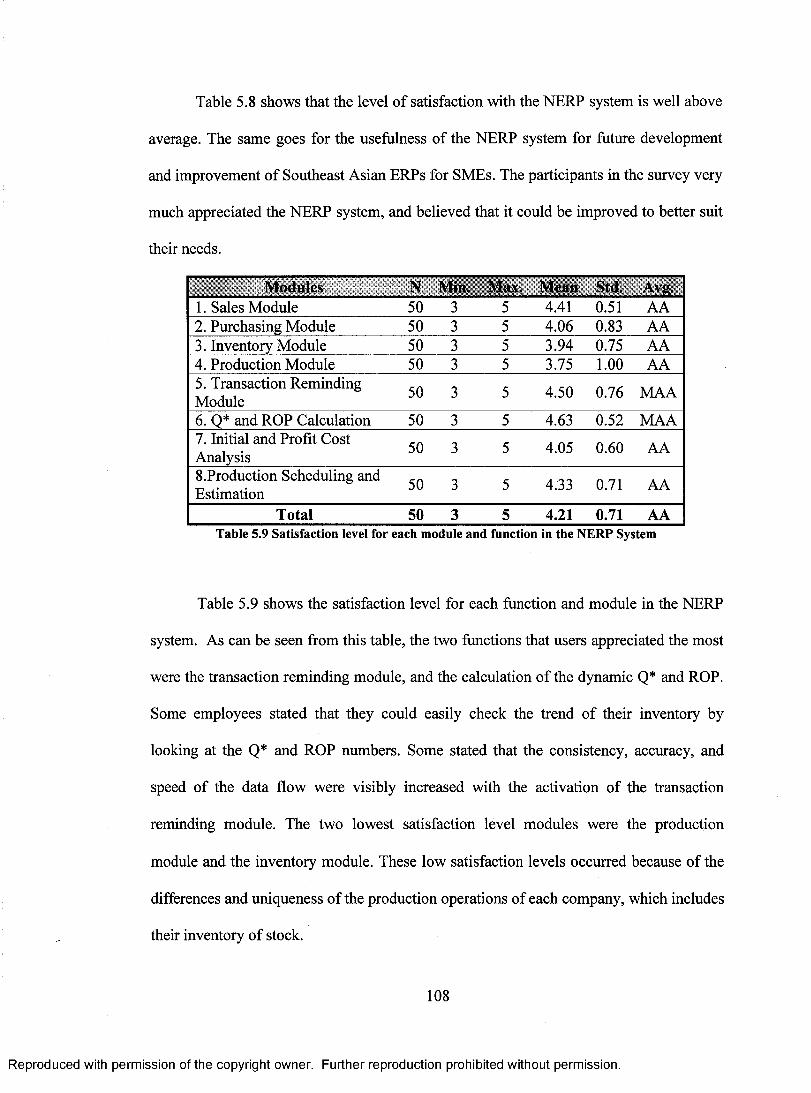
Table 5.8 shows that the level of satisfaction with the NERP system is well above
average. The same goes for the usefulness of the NERP system for future development
and improvement of Southeast Asian ERPs for SMEs. The participants in the survey very
much appreciated the NERP system, and believed that it could be improved to better suit
their needs.
Modules N Min. Max. Mean Std. Avg.
1. Sales Module 50 3 5 4.41 0.51 AA 2. Purchasing Module 50 3 5 4.06 0.83 AA 3. Inventory Module 50 3 5 3.94 0.75 AA 4. Production Module 50 3 5 3.75 1.00 AA 5. Transaction Reminding Module
50 3 5 4.50 0.76 MAA
6. Q* and ROP Calculation 50 3 5 4.63 0.52 MAA 7. Initial and Profit Cost Analysis
50 3 5 4.05 0.60 AA
8.Production Scheduling and Estimation
50 3 5 4.33 0.71 AA
Total 50 3 5 4.21 0.71 AA Table 5.9 Satisfaction level for each module and function in the NERP System
Table 5.9 shows the satisfaction level for each function and module in the NERP
system. As can be seen from this table, the two functions that users appreciated the most
were the transaction reminding module, and the calculation of the dynamic Q* and ROP.
Some employees stated that they could easily check the trend of their inventory by
looking at the Q* and ROP numbers. Some stated that the consistency, accuracy, and
speed of the data flow were visibly increased with the activation of the transaction
reminding module. The two lowest satisfaction level modules were the production
module and the inventory module. These low satisfaction levels occurred because of the
differences and uniqueness of the production operations of each company, which includes
their inventory of stock.
108
Reproduced with permission of the copyright owner. Further reproduction prohibited without permission.
Table 5.8 shows that the level of satisfaction with the NERP system is well above
average. The same goes for the usefulness of the NERP system for future development
and improvement of Southeast Asian ERPs for SMEs. The participants in the survey very
much appreciated the NERP system, and believed that it could be improved to better suit
their needs.
Modules N Min. Max. Mean Std. Avg,1. Sales Module 50 3 5 4.41 0.51 AA2. Purchasing Module 50 3 5 4.06 0.83 AA3. Inventory Module 50 3 5 3.94 0.75 AA4. Production Module 50 3 5 3.75 1.00 AA5. Transaction Reminding Module 50 3 5 4.50 0.76 MAA
6. Q* and ROP Calculation 50 3 5 4.63 0.52 MAA7. Initial and Profit Cost 50 3 £ 4.05 0.60 AAAnalysis8.Production Scheduling and Estimation 50 3 5 4.33 0.71 AA
Total 50 3 5 4.21 0.71 AATable 5.9 Satisfaction level for each module and function in the NERP System
Table 5.9 shows the satisfaction level for each function and module in the NERP
system. As can be seen from this table, the two functions that users appreciated the most
were the transaction reminding module, and the calculation of the dynamic Q* and ROP.
Some employees stated that they could easily check the trend of their inventory by
looking at the Q* and ROP numbers. Some stated that the consistency, accuracy, and
speed of the data flow were visibly increased with the activation of the transaction
reminding module. The two lowest satisfaction level modules were the production
module and the inventory module. These low satisfaction levels occurred because of the
differences and uniqueness of the production operations of each company, which includes
their inventory of stock.
108
Reproduced with permission of the copyright owner. Further reproduction prohibited without permission.

5.3 Comparison of estimation and practice
There are different categories that can be pointed out as being theoretically
influenced by a Novel ERP System. These categories are: Accounting, Costs,
Manufacturing and Logistics, Customer and Supplier Relations, Information
Management, and Organization and Culture. These are also the same areas in the study
through which five SME companies in Southeast Asia measured their expectations of the
ERP System. The expectations of the five companies vary between and within the
categories. Manufacturing and Logistics are the categories for which Company A and D
had great expectations. On the other hand, Company E was concerned with the effects in
the category of Costs.
The analysis shows that the significance of each of the six aspects differs between
the original estimation and actual practice. In the Accounting category, the empirical
data reveals that Financial Reports is the aspect of which a majority of the responding
SME companies in Southeast Asia had high expectations. This is principally due to the
integrated nature of the system, and the elimination of multiple and redundant data and
sources. SMEs also wanted to make it easier to receive reports from the system, and to
have the reports present more accurate figures. In the category of Costs, most SMEs in
Southeast Asia expected an effect on Administrative Costs. This is primarily due to the
expectations that administrative work would be more effective using a Novel ERP
system. For example, in the case of Company C, the company was struggling with the
problem of controlling the volume and timing of discounts given to customers of the
company. Also, the company had difficulty logging and monitoring the discounts given
to customers, which was a large administrative cost for the company. Upon the
109
Reproduced with permission of the copyright owner. Further reproduction prohibited without permission.

implementation of a Novel ERP system, Company C expected that the system would
streamline not only the administrative work of the company, but also their business
operations. It would also provide the company with tighter financial control.
In the Manufacturing and Logistics categories, Company A and Company B
expected effects on Purchasing Management, Warehouse Management, Production
Planning, Production Flexibility and Order Management. SMEs saw the possibility to
create a more efficient process within this category, due to the integrated approach of the
Novel ERP system. For example, for Company A, in the areas of purchasing and order
processing, the data entered is sorted by category and by department. The company
expected that such meticulous and thorough categorization would allow sales, purchasing
and orders to be tracked easily upon the implementation of the Novel ERP system. The
company also expected to have easy data access, which would be crucial in ensuring the
efficiency and transparency of the company.
SMEs in Southeast Asia had fewer expectations in the other categories, including
Customer and Suppliers Relations, Information Management and Organization, and
Culture.
5.4 Respondents' perspectives on Enterprise Resource Planning and what is
expected in the future
The researcher asked the respondents about their opinions regarding the
Enterprise Resource Planning market and what they could anticipate in the future.
Respondents expressed hopes that Enterprise resource planning would attempt to
integrate all departments and functions across a company into a single computer system
110
Reproduced with permission of the copyright owner. Further reproduction prohibited without permission.
implementation of a Novel ERP system, Company C expected that the system would
streamline not only the administrative work of the company, but also their business
operations. It would also provide the company with tighter financial control.
In the Manufacturing and Logistics categories, Company A and Company B
expected effects on Purchasing Management, Warehouse Management, Production
Planning, Production Flexibility and Order Management. SMEs saw the possibility to
create a more efficient process within this category, due to the integrated approach of the
Novel ERP system. For example, for Company A, in the areas of purchasing and order
processing, the data entered is sorted by category and by department. The company
expected that such meticulous and thorough categorization would allow sales, purchasing
and orders to be tracked easily upon the implementation of the Novel ERP system. The
company also expected to have easy data access, which would be crucial in ensuring the
efficiency and transparency of the company.
SMEs in Southeast Asia had fewer expectations in the other categories, including
Customer and Suppliers Relations, Information Management and Organization, and
Culture.
5.4 Respondents’ perspectives on Enterprise Resource Planning and what is
expected in the future
The researcher asked the respondents about their opinions regarding the
Enterprise Resource Planning market and what they could anticipate in the future.
Respondents expressed hopes that Enterprise resource planning would attempt to
integrate all departments and functions across a company into a single computer system
110
Reproduced with permission of the copyright owner. Further reproduction prohibited without permission.

that could serve all of the different departments' particular needs. Moreover, the ERP
system would automate the tasks involved in performing a business process, such as
order fulfilment, which involves taking an order from a customer, shipping it, and billing
it. Respondents also explained that with ERP, when a customer service representative
takes an order from a customer he or she would have all of the information necessary to
complete the order.
The most broadly deployed ERP systems worldwide, not just in Southeast Asia,
are those which track financial data. They include applications such as a general ledger,
accounts receivable, and several others. SMEs in Southeast Asia, including Companies
A, B, C, D, and E are trying to improve and streamline their finance and accounting
applications, attempting to make them more flexible, more tightly integrated, and more
functionally complete. The respondents were able to cite relevant points regarding the
relevance of ERP systems. Respondents explained that human resource applications such
as payroll, personnel and applicant tracking systems are extremely important in today's
ERP market in Southeast Asia. Moreover, SMEs in Southeast Asia are realizing that
their employees represent their most significant assets, and they are investing more than
ever into the systems in order to help them provide better service and more flexible
programs for these employees. As a result of this process, the study found that the
management reporting functions which focus on areas such as hiring trends and turnover
analysis are taking on greater importance in the process of managing small and medium
enterprises in Southeast Asia.
Most of the respondents explained that their company looked to Enterprise
Resource Planning software in order to streamline their business process, increase
111
Reproduced with permission of the copyright owner. Further reproduction prohibited without permission.
that could serve all of the different departments’ particular needs. Moreover, the ERP
system would automate the tasks involved in performing a business process, such as
order fulfilment, which involves taking an order from a customer, shipping it, and billing
it. Respondents also explained that with ERP, when a customer service representative
takes an order from a customer he or she would have all of the information necessary to
complete the order.
The most broadly deployed ERP systems worldwide, not just in Southeast Asia,
are those which track financial data. They include applications such as a general ledger,
accounts receivable, and several others. SMEs in Southeast Asia, including Companies
A, B, C, D, and E are trying to improve and streamline their finance and accounting
applications, attempting to make them more flexible, more tightly integrated, and more
functionally complete. The respondents were able to cite relevant points regarding the
relevance of ERP systems. Respondents explained that human resource applications such
as payroll, personnel and applicant tracking systems are extremely important in today’s
ERP market in Southeast Asia. Moreover, SMEs in Southeast Asia are realizing that
their employees represent their most significant assets, and they are investing more than
ever into the systems in order to help them provide better service and more flexible
programs for these employees. As a result of this process, the study found that the
management reporting functions which focus on areas such as hiring trends and turnover
analysis are taking on greater importance in the process of managing small and medium
enterprises in Southeast Asia.
Most of the respondents explained that their company looked to Enterprise
Resource Planning software in order to streamline their business process, increase
111
Reproduced with permission of the copyright owner. Further reproduction prohibited without permission.
productivity, reduce costs and distribute shared information across the enterprise. In
addition, the availability and reliability of the ERP environment has become critical to
business productivity and success in this new era. According to the respondent, the new
services that SMEs will have to deliver in order to be competitive and productive in the
future are management skills, specific business knowledge, e-business knowledge, and
outsourcing capabilities.
On the other hand, when the researcher asked some experts about the process of
the ERP system, they said that in order to understand the function of ERP, the ERP
developer must understand the problems they are designed to solve. Respondents
explained that every SME collects, generates, and stores vast quantities of data. In most
companies, however, that data is not kept in a single database. Instead, the information is
spread across a large number of computer systems. According to the respondents,
maintaining these different systems leads to large costs for storing and rationalizing
redundant data, as well as reformatting data from one system for use in another. The
respondents explained that if a company's sales and ordering systems cannot
communicate with its production system, then its productivity and customer
responsiveness will suffer. In addition, if its sales and marketing systems are
incompatible with its financial systems, then management is left to make significant
decisions based on character rather than a detailed understanding and recognition of
product and customer profitability.
All five of the SMEs in Southeast Asia that were interviewed and participated in
the study also saw their ERP acquisition and implementation from a technical point of
view. In most cases, the companies had old systems which they wanted to replace. The
112
Reproduced with permission of the copyright owner. Further reproduction prohibited without permission.
productivity, reduce costs and distribute shared information across the enterprise. In
addition, the availability and reliability of the ERP environment has become critical to
business productivity and success in this new era. According to the respondent, the new
services that SMEs will have to deliver in order to be competitive and productive in the
future are management skills, specific business knowledge, e-business knowledge, and
outsourcing capabilities.
On the other hand, when the researcher asked some experts about the process of
the ERP system, they said that in order to understand the function of ERP, the ERP
developer must understand the problems they are designed to solve. Respondents
explained that every SME collects, generates, and stores vast quantities of data. In most
companies, however, that data is not kept in a single database. Instead, the information is
spread across a large number of computer systems. According to the respondents,
maintaining these different systems leads to large costs for storing and rationalizing
redundant data, as well as reformatting data from one system for use in another. The
respondents explained that if a company’s sales and ordering systems cannot
communicate with its production system, then its productivity and customer
responsiveness will suffer. In addition, if its sales and marketing systems are
incompatible with its financial systems, then management is left to make significant
decisions based on character rather than a detailed understanding and recognition of
product and customer profitability.
All five of the SMEs in Southeast Asia that were interviewed and participated in
the study also saw their ERP acquisition and implementation from a technical point of
view. In most cases, the companies had old systems which they wanted to replace. The
112
Reproduced with permission of the copyright owner. Further reproduction prohibited without permission.
respondents explained some of the reasons for changing the system, particularly the wish
to acquire a completely integrated system like the ERP program. This was needed in
order to achieve quicker information flow, and to be able to develop the company's
processes and eliminate the capacity problem with the old system of ERP, the difficulty
in getting any meaningful and significant business information, a lack of functionality
and flexibility, and the difficulty in maintaining the older ERP system. These are only a
few of the factors which respondents shared regarding their reasons for changing
systems.
The researcher also thought that it would be interesting to know what kind of
advantages the companies expected to have with the ERP system. According to the
respondents, one of the many expected advantages is an integrated system that would
help the company avoid extra work. The company would only have to place the data into
the central ERP database rather than entering data first into the financial system and then
into the MRP system. Another point is that through an ERP system there would be a
faster flow of information, and it would also decrease inventory times. Interestingly, the
ERP system has the advantage of decreasing IT costs, because the vendors and not the
company itself offer systems development. In this situation, this decrease in IT costs
proves more effective and successful for the company in the long run. Respondents also
explained that ERP has the advantage of being better control of the company. This
means that by being able to monitor one of the company's information flows at a time,
the ERP system enables a general view of the company's information flow.
The respondents also illustrated some of the effects of implementing an ERP
system. According to the respondents from Southeast Asian SMEs, the implementation
113
Reproduced with permission of the copyright owner. Further reproduction prohibited without permission.
respondents explained some of the reasons for changing the system, particularly the wish
to acquire a completely integrated system like the ERP program. This was needed in
order to achieve quicker information flow, and to be able to develop the company’s
processes and eliminate the capacity problem with the old system of ERP, the difficulty
in getting any meaningful and significant business information, a lack of functionality
and flexibility, and the difficulty in maintaining the older ERP system. These are only a
few of the factors which respondents shared regarding their reasons for changing
systems.
The researcher also thought that it would be interesting to know what kind of
advantages the companies expected to have with the ERP system. According to the
respondents, one of the many expected advantages is an integrated system that would
help the company avoid extra work. The company would only have to place the data into
the central ERP database rather than entering data first into the financial system and then
into the MRP system. Another point is that through an ERP system there would be a
faster flow of information, and it would also decrease inventory times. Interestingly, the
ERP system has the advantage of decreasing IT costs, because the vendors and not the
company itself offer systems development. In this situation, this decrease in IT costs
proves more effective and successful for the company in the long run. Respondents also
explained that ERP has the advantage of being better control of the company. This
means that by being able to monitor one of the company’s information flows at a time,
the ERP system enables a general view of the company’s information flow.
The respondents also illustrated some of the effects of implementing an ERP
system. According to the respondents from Southeast Asian SMEs, the implementation
113
Reproduced with permission of the copyright owner. Further reproduction prohibited without permission.

of the ERP system has had positive and negative effects. With regards to the positive
effects, respondents explained that it is much easier to buy an existing system than to
develop the company's own system. Moreover, there have been a lot of complaints over
the years that ERPs take too long to implement. Some respondents, however, assert that
this depends upon the ERP system that the company wants to implement. In today's
modern world, the vendors have developed methods and other means by which to shorten
the time of implementation. The respondents also explained that the cheap development
cost is also a positive result of the implementation of an ERP. Before, the ERP vendors
put about 5-15 percent of their revenues into their Research and Development department
into order to develop a system that would be equally good, but very costly. Through the
implementation of an ERP system there would be safe cost estimations. In other words,
to invest in an existing system makes it easier to estimate the total cost of the system and
its implementation. If the company develops its own system, it is difficult to estimate
how much the company will spend or invest in the system.
The previous sections of this thesis suggest that ERP systems must be
harmoniously integrated with the firms' business functions. This means that building
ERP systems alone does not guarantee success. Users must be trained and supported
before the technology is accepted and implemented. According to some respondents in
the study, based on their experiences of maximizing benefits and minimizing the risks, it
is important to: (1) get senior support; (2) work with the staff to develop a detailed list of
requirements for what is needed in ERP; (3) train and re-train staff; and (4) know the
processes. Respondents also pointed out that not understanding the basic process
produced a less than effective set of performance measures. In addition, respondents also
114
Reproduced with permission of the copyright owner. Further reproduction prohibited without permission.
of the ERP system has had positive and negative effects. With regards to the positive
effects, respondents explained that it is much easier to buy an existing system than to
develop the company’s own system. Moreover, there have been a lot of complaints over
the years that ERPs take too long to implement. Some respondents, however, assert that
this depends upon the ERP system that the company wants to implement. In today’s
modern world, the vendors have developed methods and other means by which to shorten
the time of implementation. The respondents also explained that the cheap development
cost is also a positive result of the implementation of an ERP. Before, the ERP vendors
put about 5-15 percent of their revenues into their Research and Development department
into order to develop a system that would be equally good, but very costly. Through the
implementation of an ERP system there would be safe cost estimations. In other words,
to invest in an existing system makes it easier to estimate the total cost of the system and
its implementation. If the company develops its own system, it is difficult to estimate
how much the company will spend or invest in the system.
The previous sections of this thesis suggest that ERP systems must be
harmoniously integrated with the firms’ business functions. This means that building
ERP systems alone does not guarantee success. Users must be trained and supported
before the technology is accepted and implemented. According to some respondents in
the study, based on their experiences of maximizing benefits and minimizing the risks, it
is important to: (1) get senior support; (2) work with the staff to develop a detailed list of
requirements for what is needed in ERP; (3) train and re-train staff; and (4) know the
processes. Respondents also pointed out that not understanding the basic process
produced a less than effective set of performance measures. In addition, respondents also
114
Reproduced with permission of the copyright owner. Further reproduction prohibited without permission.

identified the fact that managing information about the processes was a key success
factor. Indeed, understanding business processes is crucial to organizational success.
From this analysis, understanding the conceptual fundamentals of a process or a system
can be accomplished through the integration of an ERP system and its concepts into a
business school curriculum, and, in turn, industry must adopt a more process-oriented
approach in its ERP training programs.
Companies should not lament the cost of their investment, as the skills and
capabilities they acquire during the ERP installation process will allow them to improve
their ERP applications incrementally.
According to the respondents, it is necessary to revisit the business' reasons for
needing an ERP system in order to see where further efficiencies and savings can be
realized. Initiatives include refining the system, searching for nice-to-have features,
analyzing captured data, and extending uniformity. James and Woods (2000) suggest four
initiatives for achieving competitive advantage: sell-side e-commerce, electronic
procurement, continuous-relationship marketing, and supply chain optimization.
Since the overall implementation and maintenance of ERP faces major obstacles,
it would indeed be helpful if SMEs would concentrate more on: (1) profiling the solid
business functional gains and methods to determine the success of their business; (2)
appointing accountability and authority for these goals and; (3) securing that the entire
management is dedicated together in reaching for the identified goals. Because the
successful implementation of ERP depends partly, if not wholly, on the level of skills of a
company's personnel, it is of utmost importance that companies allot time and money to
115
Reproduced with permission of the copyright owner. Further reproduction prohibited without permission.
identified the fact that managing information about the processes was a key success
factor. Indeed, understanding business processes is crucial to organizational success.
From this analysis, understanding the conceptual fundamentals of a process or a system
can be accomplished through the integration of an ERP system and its concepts into a
business school curriculum, and, in turn, industry must adopt a more process-oriented
approach in its ERP training programs.
Companies should not lament the cost of their investment, as the skills and
capabilities they acquire during the ERP installation process will allow them to improve
their ERP applications incrementally.
According to the respondents, it is necessary to revisit the business’ reasons for
needing an ERP system in order to see where further efficiencies and savings can be
realized. Initiatives include refining the system, searching for nice-to-have features,
analyzing captured data, and extending uniformity. James and Woods (2000) suggest four
initiatives for achieving competitive advantage: sell-side e-commerce, electronic
procurement, continuous-relationship marketing, and supply chain optimization.
Since the overall implementation and maintenance of ERP faces major obstacles,
it would indeed be helpful if SMEs would concentrate more on: (1) profiling the solid
business functional gains and methods to determine the success of their business; (2)
appointing accountability and authority for these goals and; (3) securing that the entire
management is dedicated together in reaching for the identified goals. Because the
successful implementation of ERP depends partly, if not wholly, on the level of skills of a
company’s personnel, it is of utmost importance that companies allot time and money to
115
Reproduced with permission of the copyright owner. Further reproduction prohibited without permission.
train them, in order to equip them with the technical capabilities needed to support the
ERP system.
116
Reproduced with permission of the copyright owner. Further reproduction prohibited without permission.
train them, in order to equip them with the technical capabilities needed to support the
ERP system.
116
Reproduced with permission of the copyright owner. Further reproduction prohibited without permission.
Chapter 6
Conclusion and Future work
6.1 Conclusions
This research contributes to the existing research on ERP systems and how they
can be improved so that they may be effectively implemented by Southeast Asian SMEs.
The quest for improved ERP software packages has been ongoing, which evidently
shows the need for more efforts towards enhancing the characteristics of the software
packages. This research attempts to discover the features that may make an ERP system
work better for SMEs in Southeast Asia. Moreover, the research seeks to contribute to the
literature by outlining the features of SMEs in Southeast Asia, as well as the strengths
and weaknesses of ERP characteristics used in existing ERP systems. The research posits
that it is time for ERP developers to take into consideration the peculiarities in company
size and uniqueness of operations and management in different cultural environments.
Based on the survey and analyses performed in the research, it is conclusive that
most of the time, small and medium enterprises cannot afford the cost of ERP software
packages available in the market. Furthermore, it has been noted in the survey feed-back
that the complexity of using the existing ERP software packages has caused many SMEs
to fail in implementing the program. All of these problems pose a challenging research
area for researchers and engineers in the areas of ERP system development: to provide an
architectural design for ERP software that is affordable, simple, and corresponds to the
problems presented by SMEs in Southeast Asia. With the data and information collected
in the research, the researcher deems that one of the problems with the existing ERP
117
Reproduced with permission of the copyright owner. Further reproduction prohibited without permission.

software is due to its standardized design, which lacks the particularities that could
resolve ERP adoption and implementation problems in SMEs in Southeast Asia.
A new ERP system called NERP is developed in the present research. The
development of the NERP system in this thesis is based on an extensive review of
existing literature, studies of unique characteristics of the companies, an investigation
into the companies' requirements, and the data collected through the surveys and
questionnaires. to develop a framework. The framework of a NERP system in this thesis
can serve as a guideline for ERP system development for management software, in this
case being applied to small- to medium-size companies in Southeast Asia. The statistical
technique involved in the calculation of the safety stock is used to optimize the initial
cost and replenishment quantity of the products, while the free programming languages
are used to optimize the cost of implementation. Evaluation of the NERP system that was
developed is performed on the basis of the surveys and feedbacks following actual
installation and usage of the system at the companies' sites. The responses of the SMEs
are positive towards the cost, framework, modules, and application of the Novel ERP
system developed.
Accomplishments of the present research can be concluded as follows:
o The main problems of implementing the existing management and manufacturing
software in SMEs in Southeast Asian countries as well as the specialty needs of
the SMEs for integrated manufacturing software (ERP), are identified through the
detailed analysis of a comprehensive systematic survey.
o An ERP conceptual framework is developed on the basis of in depth analysis of
the data collected from the survey. As well, the key implementation success
118
Reproduced with permission of the copyright owner. Further reproduction prohibited without permission.
software is due to its standardized design, which lacks the particularities that could
resolve ERP adoption and implementation problems in SMEs in Southeast Asia.
A new ERP system called NERP is developed in the present research. The
development of the NERP system in this thesis is based on an extensive review of
existing literature, studies of unique characteristics of the companies, an investigation
into the companies’ requirements, and the data collected through the surveys and
questionnaires, to develop a framework. The framework of a NERP system in this thesis
can serve as a guideline for ERP system development for management software, in this
case being applied to small- to medium-size companies in Southeast Asia. The statistical
technique involved in the calculation of the safety stock is used to optimize the initial
cost and replenishment quantity of the products, while the free programming languages
are used to optimize the cost of implementation. Evaluation of the NERP system that was
developed is performed on the basis of the surveys and feedbacks following actual
installation and usage of the system at the companies’ sites. The responses of the SMEs
are positive towards the cost, framework, modules, and application of the Novel ERP
system developed.
Accomplishments of the present research can be concluded as follows:
o The main problems of implementing the existing management and manufacturing
software in SMEs in Southeast Asian countries as well as the specialty needs of
the SMEs for integrated manufacturing software (ERP), are identified through the
detailed analysis of a comprehensive systematic survey,
o An ERP conceptual framework is developed on the basis of in depth analysis of
the data collected from the survey. As well, the key implementation success
118
Reproduced with permission of the copyright owner. Further reproduction prohibited without permission.
factors that can be used in evaluation and further development of an ERP system
for SMEs in Southeast Asia are specified. This provides a guideline for
framework design in developing a customized and suitable ERP system for
Southeast Asian SMEs.
o The new ERP system, NERP, which is based on a review of existing literature, a
revision of existing ERP system packages, and the survey's data analysis is
established. The NERP system shows high flexibility, suitability and satisfaction
according to the feedback from representatives of the Southeast Asian companies
that implemented the NERP system.
o The NERP system can be used as an integrating manufacturing software and
management software for inexperienced users, and can also be used for
monitoring and managing inventory and stocks. The system provides users with
appropriate recommendations for decision making based on the priority of the
tasks users have to perform before proceeding to next process.
o A Web application server and platform are introduced and implemented in the
NERP system. The NERP system can therefore be operated in both a web-based
environment and a workstation environment. This provides significant advantages
for the users of NERP since it equips the system with high flexibility and allows
the system to run without an Internet Service Provider. This reduces the cost of
operation. Nevertheless, the system can also be run via a Local Area Network
(LAN) connection, which is connected through a server for the storage of
databases. On the other hand, web application offers competitive advantages to
the customers and suppliers. With the web application, the users may perform
119
Reproduced with permission of the copyright owner. Further reproduction prohibited without permission.
factors that can be used in evaluation and further development of an ERP system
for SMEs in Southeast Asia are specified. This provides a guideline for
framework design in developing a customized and suitable ERP system for
Southeast Asian SMEs.
o The new ERP system, NERP, which is based on a review of existing literature, a
revision of existing ERP system packages, and the survey’s data analysis is
established. The NERP system shows high flexibility, suitability and satisfaction
according to the feedback from representatives of the Southeast Asian companies
that implemented the NERP system,
o The NERP system can be used as an integrating manufacturing software and
management software for inexperienced users, and can also be used for
monitoring and managing inventory and stocks. The system provides users with
appropriate recommendations for decision making based on the priority of the
tasks users have to perform before proceeding to next process,
o A Web application server and platform are introduced and implemented in the
NERP system. The NERP system can therefore be operated in both a web-based
environment and a workstation environment. This provides significant advantages
for the users of NERP since it equips the system with high flexibility and allows
the system to run without an Internet Service Provider. This reduces the cost of
operation. Nevertheless, the system can also be run via a Local Area Network
(LAN) connection, which is connected through a server for the storage of
databases. On the other hand, web application offers competitive advantages to
the customers and suppliers. With the web application, the users may perform
119
Reproduced with permission of the copyright owner. Further reproduction prohibited without permission.

paperless orders, access from off site, and stay in contact with remote suppliers.
The users are allowed to choose either workstation or web applications on the
basis of needs and budget.
o A comparison between NERP and the existing ERP system in the market, taking
into account the cost, implementation, operation system, database management
system, and modules is carried out. Even though the NERP system is small and
has less complex software than other ERP systems on the market, it has the
essential efficient and most needed modules for SMEs in Southeast Asia. This has
been well supported by the SMES who implemented NERP.
o As indicated in Chapter 4.6 and Appendix C, the user interface of the NERP
system is clear and user-friendly enough to guide the user through the whole
company's process. Also, it helps the users to carry out further development or
refinement of the system.
6.2 Recommendations for future work
In the future, it is essential to further validate the model for the Novel ERP system
for Southeast Asian SMEs which is presented in this research. There are many more
validation techniques that can be used to test and validate the framework. Furthermore,
additional case studies, company feedback, suggestions, and more companies cooperating
in the project are essential factors in obtaining stronger evidence and a more suitable ERP
system for SMEs in Southeast Asia.
There are an increasing number of developments in the field of Enterprise
Resource Planning using an internet-based technology, server/client technology and
120
Reproduced with permission of the copyright owner. Further reproduction prohibited without permission.
paperless orders, access from off site, and stay in contact with remote suppliers.
The users are allowed to choose either workstation or web applications on the
basis of needs and budget,
o A comparison between NERP and the existing ERP system in the market, taking
into account the cost, implementation, operation system, database management
system, and modules is carried out. Even though the NERP system is small and
has less complex software than other ERP systems on the market, it has the
essential efficient and most needed modules for SMEs in Southeast Asia. This has
been well supported by the SMES who implemented NERP.
o As indicated in Chapter 4.6 and Appendix C, the user interface of the NERP
system is clear and user-friendly enough to guide the user through the whole
company’s process. Also, it helps the users to carry out further development or
refinement of the system.
6.2 Recommendations for future work
In the future, it is essential to further validate the model for the Novel ERP system
for Southeast Asian SMEs which is presented in this research. There are many more
validation techniques that can be used to test and validate the framework. Furthermore,
additional case studies, company feedback, suggestions, and more companies cooperating
in the project are essential factors in obtaining stronger evidence and a more suitable ERP
system for SMEs in Southeast Asia.
There are an increasing number of developments in the field of Enterprise
Resource Planning using an internet-based technology, server/client technology and
120
Reproduced with permission of the copyright owner. Further reproduction prohibited without permission.

hybrid systems, and the effectiveness of the ERP system can be increased using such
technology. The system allows users to access available information quickly and share
their knowledge on the Internet. Also, the system helps users locate and obtain
information on the Web by taking commands from users. Several sources support hybrid
platform technology. Huuptmann (1999) introduces the integration of existing
manufacturing software with mixed-media databases using large databases of text,
images, videos, and audio files on the server to provide information to users.
The typical network dependent type of solution is to create one huge database
server at the main office, and share the data throughout all the regional and retail offices.
The advantage of this system is that it is possible to easily share information with other
"connected" users in an integrated fashion. However, there are many downfalls to this
type of solution; for example, it is expensive to create and maintain, and if the main
server were to go down, the entire division would be paralysed until the connection was
re-established. A new idea to be considered for future research is that all of the
information should be securely stored at each satellite office so that in the event of a
server disconnection, the work flow will not be affected. Each satellite office can
continue working efficiently while the affected office (or user) runs autonomously. This
is great for offices that are forced to connect via a slow Internet connection, or for outside
sales staff that have to leave the network to do their jobs. Once the disconnected office or
user reconnects, the broken link will then automatically synchronize and be updated.
Additional modules such as forecasting, scheduling, and job design should be
added to the system for more effective results. The forecasting module would enhance
inventory management, estimation of quantity replenishment, calculation of cost, and
121
Reproduced with permission of the copyright owner. Further reproduction prohibited without permission.
hybrid systems, and the effectiveness of the ERP system can be increased using such
technology. The system allows users to access available information quickly and share
their knowledge on the Internet. Also, the system helps users locate and obtain
information on the Web by taking commands from users. Several sources support hybrid
platform technology. Huuptmann (1999) introduces the integration of existing
manufacturing software with mixed-media databases using large databases of text,
images, videos, and audio files on the server to provide information to users.
The typical network dependent type of solution is to create one huge database
server at the main office, and share the data throughout all the regional and retail offices.
The advantage of this system is that it is possible to easily share information with other
“connected” users in an integrated fashion. However, there are many downfalls to this
type of solution; for example, it is expensive to create and maintain, and if the main
server were to go down, the entire division would be paralysed until the connection was
re-established. A new idea to be considered for future research is that all of the
information should be securely stored at each satellite office so that in the event of a
server disconnection, the work flow will not be affected. Each satellite office can
continue working efficiently while the affected office (or user) runs autonomously. This
is great for offices that are forced to connect via a slow Internet connection, or for outside
sales staff that have to leave the network to do their jobs. Once the disconnected office or
user reconnects, the broken link will then automatically synchronize and be updated.
Additional modules such as forecasting, scheduling, and job design should be
added to the system for more effective results. The forecasting module would enhance
inventory management, estimation of quantity replenishment, calculation of cost, and
121
Reproduced with permission of the copyright owner. Further reproduction prohibited without permission.
evaluation of demand. A job design module would evenly distribute the work force
throughout the entire production process. Also, better algorithm, logic, simulation and
calculation for the production scheduling would definitely help to increase the efficacy of
the production order arrangement.
Even in situations where everything follows a perfect plan and design, an element
of uncertainty is always present. Therefore, some uncertainty management tools should
be added to the design of this system, as well as to the calculation of the demand and
operation process. Fuzzy logic algorithm, roughly set algorithm, and genetic algorithm, to
name a few, are great examples of uncertainty tools whose addition could be considered
in further research.
122
Reproduced with permission of the copyright owner. Further reproduction prohibited without permission.
References
Abernathy, W. and Utterback, J. (1978). Patterns of Industrial Innovation. Technology Review 80(7), 41-47.
Avai, C.S.S. (1998). Technology Architecture Choices for Enterprise Financial Systems. Government Finance Review, 21-24.
Ballou, R.H. (2004). Business Logistics/Supply Chain Management. 5th ed. Pearson Prentice Hall Publications.
Bancroft, N., Seip, H., and Sprengel, A. (1998). Implementing SAP R/3: How to Introduce a Large System into a Large Organization. (2nd ed.) Manning Publications.
Barki, H., Rivard, S., and Talbot, J. (1993). A Keyword Classification Scheme for IS Research Literature: An Update. MIS Quarterly 6, 209-226.
Baroudi, J.J. and Davis, G.B. (1986). An empirical study of the impact of user involvement on system usage and information satisfaction. Communications of the ACM 29, 232-238.
Benbassat, I., Dexter, A.S., Drury, D.H., and Goldstein, R.C. (1984). A critique of the stage hypothesis: theory and empirical evidence. Communications of the Association for Computing Machinery 27(5), 476-485.
Bennett, A. and George, A. (1977). Research Design Tasks in Case Study Methods, Paper presented at the MacArthur Foundation Workshop on Case Study Methods. Belfer Center for Science and International Affairs (BCSIA), Harvard University, October 17-19, 1997.
Berelson, B. (1952). Content analysis in communication research. Glencoe, III.: Free Press.
Bingi, P., Sharma, M., and Godla, J. (1999). Critical factors affecting an ERP implementation. Information Systems Management 16(3), 7-15.
Booth, P., Matovsky, Z., and Wieder, B. (2000). Integrated information systems (ERP-systems) and accounting practice. The Australian Experience. Paper presented at the 3rd European Conference on Accounting and Information Systems. Munich, Germany: 27-28 March.
Bowersox, D.J., Closs, D.J., and Cooper, M.B. (2003). Supply Chain Logistics Management. McGraw-Hill Publications.
123
Reproduced with permission of the copyright owner. Further reproduction prohibited without permission.
References
Abernathy, W. and Utterback, J. (1978). Patterns of Industrial Innovation. Technology Review 80(7), 41-47.
Avai, C.S.S. (1998). Technology Architecture Choices for Enterprise Financial Systems. Government Finance Review, 21-24.
Ballou, R.H. (2004). Business Logistics/Supply Chain Management. 5th ed. Pearson Prentice Hall Publications.
Bancroft, N., Seip, H., and Sprengel, A. (1998). Implementing SAP R/3: How to Introduce a Large System into a Large Organization. (2nd ed.) Manning Publications.
Barki, H., Rivard, S., and Talbot, J. (1993). A Keyword Classification Scheme for IS Research Literature: An Update. MIS Quarterly 6, 209-226.
Baroudi, J.J. and Davis, G.B. (1986). An empirical study of the impact of user involvement on system usage and information satisfaction. Communications of the ACM 29,232-238.
Benbassat, I., Dexter, A.S., Drury, D.H., and Goldstein, R.C. (1984). A critique of the stage hypothesis: theory and empirical evidence. Communications of the Association for Computing Machinery 27(5), 476—485.
Bennett, A. and George, A. (1977). Research Design Tasks in Case Study Methods, Paper presented at the MacArthur Foundation Workshop on Case Study Methods. Belfer Center for Science and International Affairs (BCSIA), Harvard University, October 17-19,1997.
Berelson, B. (1952). Content analysis in communication research. Glencoe, III.: Free Press.
Bingi, P., Sharma, M., and Godla, J. (1999). Critical factors affecting an ERP implementation. Information Systems Management 16(3), 7-15.
Booth, P., Matovsky, Z., and Wieder, B. (2000). Integrated information systems (ERP- systems) and accounting practice. The Australian Experience. Paper presented at the 3rd European Conference on Accounting and Information Systems. Munich, Germany: 27-28 March.
Bowersox, D.J., Closs, D.J., and Cooper, M.B. (2003). Supply Chain Logistics Management. McGraw-Hill Publications.
123
Reproduced with permission of the copyright owner. Further reproduction prohibited without permission.

Burns, J. and Baldvinsdottir, G. (1999). Hybrid accountants: Where do they belong and what (are they expected) to do?. Paper presented at the Conference on management accounting change—a European perspective. Manchester: 14-17 April 1999.
Caglio, A. (2003). Enterprise resource planning systems and accountants: towards hybridization?, European Accounting Review 12(1), 123-153.
Callaway, E. (1997). ERP: test for success. PCWeek 14(53), 69-70.
Calogero, B. (2000). Who is to blame for ERP failure? Sunsaver, June.
Carson, D. (1995). Marketing and Entrepreneurship in SMEs: An Innovative Approach. Prentice Hall International (UK) Limited.
Castro, B. (2002). Integrating CRM with ERP. A Baseline Consulting Group White Paper. Retrieved 04 October 2004. Available at http://www.crm2day.com/library/EpuFpyFyAFCHowgKgW.php.
Champy, J. (1996). Packaged Systems: One Way to Force Change. Computerworld December 22,61.
Ciborra, C. (2000). From control to drift—the dynamics of corporate information structures. Oxford: Oxford University Press.
Cooper, R and Kaplan, R.S. (1998). The promise —and peril—of integrated cost systems. Harvard Business Review, 109-119.
Dan, 0. and Magnus, 0. (2000). ERP-More than just Ones and Zeros-Investigating the Costs and Benefits of Enterprise Resource Planning Systems. Accounting and Finance, Graduate Business School, School of Economics and Commercial Law, Goteborg Univerity.
Davenport, T. (1995). SAP: big change comes in big packages. In CIO Magazine. Retrieved March 14,2005 from www.cio.com/archive/101595 davenpor_content.html.
Davenport, T.H. (1996). Holistic Management of Megapackage Change: The Case of SAP. Proceedings of the Second Americas Conference on Information Systems, Phoenix, Arizona, 51a-51c.
Davenport, T.H. (1998). Putting the enterprise into the enterprise system—if you're not careful the dream of information integration can turn into a nightmare. Harvard Business Review, 121-131.
124
Reproduced with permission of the copyright owner. Further reproduction prohibited without permission.
Burns, J. and Baldvinsdottir, G. (1999). Hybrid accountants: Where do they belong and what (are they expected) to do?. Paper presented at the Conference on management accounting change—a European perspective. Manchester: 14-17 April 1999.
Caglio, A. (2003). Enterprise resource planning systems and accountants: towards hybridization?, European Accounting Review 12(1), 123-153.
Callaway, E. (1997). ERP: test for success. PCWeek 14(53), 69-70.
Calogero, B. (2000). Who is to blame for ERP failure? Sunsaver, June.
Carson, D. (1995). Marketing and Entrepreneurship in SMEs: An Innovative Approach. Prentice Hall International (UK) Limited.
Castro, B. (2002). Integrating CRM with ERP. A Baseline Consulting Group White Paper. Retrieved 04 October 2004. Available at http://www.crm2dav.com/librarv/EpuFpvFyAFCHowgKgW.php.
Champy, J. (1996). Packaged Systems: One Way to Force Change. Computerworld December 22, 61.
Ciborra, C. (2000). From control to drift—the dynamics of corporate information structures. Oxford: Oxford University Press.
Cooper, R and Kaplan, R.S. (1998). The promise —and peril—of integrated cost systems. Harvard Business Review, 109-119.
Dan, O. and Magnus, O. (2000). ERP-More than just Ones and Zeros-Investigating the Costs and Benefits of Enterprise Resource Planning Systems. Accounting and Finance, Graduate Business School, School of Economics and Commercial Law, Goteborg Univerity.
Davenport, T. (1995). SAP: big change comes in big packages. In CIO Magazine. Retrieved March 14, 2005 from www.cio.com/archive/101595_davenpor_content.html.
Davenport, T.H. (1996). Holistic Management of Megapackage Change: The Case of SAP. Proceedings of the Second Americas Conference on Information Systems, Phoenix, Arizona, 51a-51c.
Davenport, T.H. (1998). Putting the enterprise into the enterprise system—if you’re not careful the dream of information integration can turn into a nightmare. Harvard Business Review, 121-131.
124
Reproduced with permission of the copyright owner. Further reproduction prohibited without permission.
Davenport, T.H. (2000). Mission Critical-- Realizing the Promise of Enterprise Systems. Harvard Business School Press. Boston, Massachusetts.
Davenport, T.H. (2000). Long live ERP. In CIO Magazine. Retrieved March 14, 2005 from www2.cio.com/archive/0301000_davenport_content.html.
Davenport, T.H. (2000). In search of ERP paybacks. Computerworld 34(8), 42+.
Deloitte Consulting. (1998). ERP's second wave—maximizing the value of ERP-enabled processes. New York: Deloitte Consulting.
DeLone, W.H. and McLean, E.R. (1992). Information Systems success: The quest for the dependent variable. Information Systems Research 3, 60-95.
Dempsey, J., Dvorak, R., Holen, E., Mark, D., and Meehan III, W. (1998). A hard and soft look at IT investments. The McKinsey Quarterly 1, 126-137.
Department of Statistics Report. (2000). Ministry of Trade & Industry, Singapore.
Doane, M. (1997). In the Path of the Whirlwind. The Consulting Alliance, Sioux Falls, SD.
Doug, R. (2003). Linking Human Capital Management to Business Value — A World Wide View. HR insights 11. Watson Wyatt Worldwide.
Edward, W.N.B. and Nelson K.H.T. (2003). A Preliminary Empirical Study of the Diffusion of ERP Systems in Austrian and British SMEs. Working Papers on Information Processing and Information Management.
Esteves-Sousa, J. and Pastor-Collado, J. (2000). Towards the unification of critical success factors or ERP implementations. Published in 10th Annual Business Information Technology (BIT) 2000 Conference, Manchester, England.
Eskilsson, H., Nysstrom, C., and Windler, M. (2003). ERP System Effects — A Comparison of Theory and Practice. School of Economics and Commercial Law, Gotebork University.
Exact Software. (2004). Business Process Management: Taking ERP Beyond Departmental and Data-Centric Boundaries. CRM Today. Retrieved 04 October 2004. Available at http://www.crm2day.com/library/EplZ1kFkykpLUrvmGR.php.
Fellner, K. and Turowski, K. (1999). Component Framework Supporting Inter-company Cooperation. Proceedings of the Third International Enterprise Distributed Object Computing Conference (EDOC'99), Atkinson, C., et al. (eds.), Mannheim, Germany, 164-171.
125
Reproduced with permission of the copyright owner. Further reproduction prohibited without permission.
Davenport, T.H. (2000). Mission Critical— Realizing the Promise of Enterprise Systems. Harvard Business School Press. Boston, Massachusetts.
Davenport, T.H. (2000). Long live ERP. In CIO Magazine. Retrieved March 14, 2005 from www2.cio.com/archive/0301000_davenport_content.html.
Davenport, T.H. (2000). In search of ERP paybacks. Computerworld 34(8), 42+.
Deloitte Consulting. (1998). ERP’s second wave—maximizing the value of ERP-enabled processes. New York: Deloitte Consulting.
DeLone, W.H. and McLean, E.R. (1992). Information Systems success: The quest for the dependent variable. Information Systems Research 3, 60-95.
Dempsey, J., Dvorak, R., Holen, E., Mark, D., and Meehan III, W. (1998). A hard and soft look at IT investments. The McKinsey Quarterly 1,126-137.
Department of Statistics Report. (2000). Ministry of Trade & Industry, Singapore.
Doane, M. (1997). In the Path of the Whirlwind. The Consulting Alliance, Sioux Falls, SD.
Doug, R. (2003). Linking Human Capital Management to Business Value - A World Wide View. HR insights 11. Watson Wyatt Worldwide.
Edward, W.N.B. and Nelson K.H.T. (2003). A Preliminary Empirical Study of the Diffusion of ERP Systems in Austrian and British SMEs. Working Papers on Information Processing and Information Management.
Esteves-Sousa, J. and Pastor-Collado, J. (2000). Towards the unification of critical success factors or ERP implementations. Published in 10th Annual Business Information Technology (BIT) 2000 Conference, Manchester, England.
Eskilsson, H., Nysstrom, C., and Windier, M. (2003). ERP System Effects - A Comparison of Theory and Practice. School of Economics and Commercial Law, Gotebork University.
Exact Software. (2004). Business Process Management: Taking ERP BeyondDepartmental and Data-Centric Boundaries. CRM Today. Retrieved 04 October 2004. Available at http://www.crm2day.com/librarv/EplZlkFkykpLUrvmGR.php.
Fellner, K. and Turowski, K. (1999). Component Framework Supporting Inter-company Cooperation. Proceedings of the Third International Enterprise Distributed Object Computing Conference (EDOC'99), Atkinson, C., et al. (eds.), Mannheim, Germany, 164-171.
125
Reproduced with permission of the copyright owner. Further reproduction prohibited without permission.

Gable, G. and Stewart, G. (1999). SAP R/3 Implementation Issues for Small to Medium Enterprises. Paper presented at the Fifth Americas Conference on Information Systems, Milwaukee, Wisconsin.
Gartner Group. (2000). A Report on the ASEAN ERP Markets. Gartner Dataquest Group, Inc.
George, A. L. (1979). Case studies and theory development: The method of structured focused comparison. In P. G. Lauren (Ed.), Diplomatic history: New approaches, 42-68. New York: Free Press.
Gilbert, A. (2000). ERP Vendors Look For Rebound After Slowdown: Fourth-quarter revenue gains indicate possible resurgence in 2000," in Information Week, Feb. 14. Retrieved March 17,2005 from http://wvvw.informationweek.com/773/vaerp.htm.
Granlund, M. and Malmi, T. (2002). Moderate impact of ERPS on management accounting: a lag or permanent outcome?. Management Accounting Research 13, 299-321.
Gupta, A. (2000). Enterprise resource planning: The emerging organizational value systems. Industrial Management and Data Systems 100(3), 114-119.
Hanseth, 0., Ciborra, C.U., arid Braa, K. (2001). The control devolution: ERP and the side effects of globalization. Advances in Information Systems Fall 32(4), 34-46.
Hauptmann, G.A. (1999). Integrating and Using Large Databases of Text, Images, Video, and Audio. IEEE Intelligent Systems July/August, 34-35.
Hayes, D.C., Hunton, J., and Reck, J. (2001). Market reaction to ERP implementation announcements, Journal of Information Systems 15(1), 3-18.
Hillary, R. (1995). Small Firms and the ERP Birmingham, UK: The Groundwork Foundation.
Hillier, F.S. and Lieberman, G.J. (2001). Introduction to Operations Research. 7th ed. McGraw-Hill Publications.
Hofstede, G. (2001). Culture's Consequences: Comparing Values, Behaviours, Institutions, and Organizations across Nations, second ed. Sage, London, England.
Holland, C.P. and Light, B. (2001). A stage maturity model for enterprise resource planning systems use, The DATA BASE for Advances in Information Systems 32(2), 34-45.
126
Reproduced with permission of the copyright owner. Further reproduction prohibited without permission.
Gable, G. and Stewart, G. (1999). SAP R/3 Implementation Issues for Small to Medium Enterprises. Paper presented at the Fifth Americas Conference on Information Systems, Milwaukee, Wisconsin.
Gartner Group. (2000). A Report on the ASEAN ERP Markets. Gartner Dataquest Group, Inc.
George, A. L. (1979). Case studies and theory development: The method of structured focused comparison. In P. G. Lauren (Ed.), Diplomatic history: New approaches, 42-68. New York: Free Press.
Gilbert, A. (2000). ERP Vendors Look For Rebound After Slowdown: Fourth-quarter revenue gains indicate possible resurgence in 2000," in Information Week, Feb.14. Retrieved March 17,2005 from http://www.informationweek.com/773/vaerp.htm.
Granlund, M. and Malmi, T. (2002). Moderate impact of ERPS on management accounting: a lag or permanent outcome?. Management Accounting Research 13, 299-321.
Gupta, A. (2000). Enterprise resource planning: The emerging organizational value systems. Industrial Management and Data Systems 100(3), 114-119.
Hanseth, O., Ciborra, C.U., arid Braa, K. (2001). The control devolution: ERP and the side effects of globalization. Advances in Information Systems Fall 32(4), 34-46.
Hauptmann, G.A. (1999). Integrating and Using Large Databases of Text, Images, Video, and Audio. IEEE Intelligent Systems July/August, 34-35.
Hayes, D.C., Hunton, J., and Reck, J. (2001). Market reaction to ERP implementation announcements, Journal of Information Systems 15(1), 3-18.
Hillary, R. (1995). Small Firms and the ERP Birmingham, UK: The Groundwork Foundation.
Hillier, F.S. and Lieberman, G.J. (2001). Introduction to Operations Research. 7th ed. McGraw-Hill Publications.
Hofstede, G. (2001). Culture’s Consequences: Comparing Values, Behaviours, Institutions, and Organizations across Nations, second ed. Sage, London, England.
Holland, C.P. and Light, B. (2001). A stage maturity model for enterprise resource planning systems use, The DATA BASE for Advances in Information Systems 32(2), 34^15.
126
Reproduced with permission of the copyright owner. Further reproduction prohibited without permission.
Holland, N. (2005). ERP Software — Run your entire business. Centresource Technology and Business (RSS), 2005.
Huff, P. (1999). Are there differences in liquidity and solvency measures based on company size? American Business Review 17 (2), 96-106.
Huin, S. F. (2004). Managing deployment of ERP systems in SMEs using multi-agents. International Journal of Project Management 22(6), 511-517.
Hunton, J.E., McEwen, R.A., and Wier, B. (2002). The reaction of financial analysts to enterprise resource planning (ERP) implementation plans. Journal of Information systems 16(1), 31-41.
IDC (1998). Worldwide Software Forecast Summary (1998-2003). International Data Corporation, Framingham, MA.
Ives, B., Hamilton, S., and Davis, G.B. (1980). A framework for research in computer-based management information systems. Management Science 26, 910-934.
James, D. and Wolf, M. (2000). A Second Wind for ERP. The McKinsey Quarterly: 100-107.
Keil, M., Cule, P.E., Lyytinen, K., and Schmidt, R.C. (1998). A framework for identifying software project risks. Communications of the ACM 41(11), 76-83. ACM Press, New York, NY, USA.
Khurana, I. (2000). Restructuring and firm value: The effects of firm profitability and restructuring purpose. Journal of Business, Finance and Accounting (November/December): 1107-1130.
King, J.L. and Kraemer, K.L. (1984). Evolution and organizational information systems: an assessment of Nolan's stage model. Communications of the Association for Computing Machinery 27(5), 466-475.
Kirchmer, M. (1999). Business process oriented implementation of standard software: how to achieve competitive advantage efficiently and effectively. Berlin etc.: Springer.
Klaus, H., Rosemann, M., and Gable, G. (2000). What is ERP? Information Systems Frontiers 2(2), 141-162.
Koch, C. (1997). The big uneasy. In CIO Magazine. Retrieved March 14, 2005 from www.cio.com/archive/101597 uneasy_content.html.
KPMG Consulting. (1997). Profit-focused software package implementation. Research Report. London: KPMG Management Consulting.
127
Reproduced with permission of the copyright owner. Further reproduction prohibited without permission.
Holland, N. (2005). ERP Software - Run your entire business. Centresource Technology and Business (RSS), 2005.
Huff, P. (1999). Are there differences in liquidity and solvency measures based on company size? American Business Review 17 (2), 96-106.
Huin, S. F. (2004). Managing deployment of ERP systems in SMEs using multi-agents. International Journal of Project Management 22(6), 511-517.
Hunton, J.E., McEwen, R.A., and Wier, B. (2002). The reaction of financial analysts to enterprise resource planning (ERP) implementation plans. Journal of Information systems 16(1), 31-41.
IDC (1998). Worldwide Software Forecast Summary (1998-2003). International Data Corporation, Framingham, MA.
Ives, B., Hamilton, S., and Davis, G.B. (1980). A framework for research in computer- based management information systems. Management Science 26, 910-934.
James, D. and Wolf, M. (2000). A Second Wind for ERP. The McKinsey Quarterly: 100- 107.
Keil, M., Cule, P.E., Lyytinen, K., and Schmidt, R.C. (1998). A framework for identifying software project risks. Communications of the ACM 41(11), 76-83. ACM Press, New York, NY, USA.
Khurana, I. (2000). Restructuring and firm value: The effects of firm profitability and restructuring purpose. Journal of Business, Finance and Accounting (November/December): 1107-1130.
King, J.L. and Kraemer, K.L. (1984). Evolution and organizational information systems: an assessment of Nolan’s stage model. Communications of the Association for Computing Machinery 27(5), 466-475.
Kirchmer, M. (1999). Business process oriented implementation of standard software: how to achieve competitive advantage efficiently and effectively. Berlin etc.: Springer.
Klaus, H., Rosemann, M., and Gable, G. (2000). What is ERP? Information Systems Frontiers 2(2), 141-162.
Koch, C. (1997). The big uneasy. In CIO Magazine. Retrieved March 14, 2005 from www.cio.com/archive/101597_uneasy_content.html.
KPMG Consulting. (1997). Profit-focused software package implementation. Research Report. London: KPMG Management Consulting.
127
Reproduced with permission of the copyright owner. Further reproduction prohibited without permission.
Kumar K. and Van H.J. (2000). ERP Experiences and Evolution.
Kumar, V., Maheshwari, B., and Kumar, U. (2002). ERP Systems Implementation: Best Practices in Canadian Government Organizations. Government Information Quarterly 19(2), 147-172.
Langenwalter, G.A. (2000). Enterprise Resources Planning and Beyond; Integrating Your Entire Organization. The St.Lucie Press/APICS Series on Resource Management.
Lee, A. S. (2000). Researchable directions for ERP and other new information technologies. MIS Quarterly 24(1).
Levis, J. and Von, S.P. (1994). Lessons Learned from Three Implementations: Knocking Down Barriers to Client-Server." Information Systems Management 11(3), 15-22.
Li, C. (1999). ERP packages: what's next? Information Systems Management 16(3), 31-36.
Lodh, S.C. and Gaffikin, M.J.R. (2003). Implementation of an integrated accounting and cost management system using the SAP system: a field study. European Accounting Review 12(1), 85-121.
Marinos, T., Zahir, I., O'Keefe, R.M., and Ray, J.P. (2001). ERP Problems and Application Integration Issues: An Empirical survey. HICSS.
Markus, L. M. and Tanis, C. (2000). The Enterprise Systems Experience - From Adoption to Success. In R. Zmud (Ed.), Framing The Domains of IT Management Research: Glimpsing The Future through The Past 173-207. Cincinnati, Ohio: Pinnaflex Educational Resources.
McVittie, L. (2001). Buckle up: Implementing ERP takes time and Patience. March 2001. Available at www.networkcomputing.com.
Mennel, A. (2002). The Effect of Training on ERP Acceptance: an Empirical Study. Unpublished thesis, University of Maastricht.
Miranda, R. (1999). The Rise of ERP in the Public Sector. Government Finance Review 9-17.
Momentum Software. (2003). Process Driven Organization. ProcessDriven.org. Retrieved 08 January 2005. Available at http://www.processdriven.org/process driven organization.html
Mustafa, Y. and Mejabi, 0. (1999). An Approach for Developing Flexible MRP Systems. Information Systems Management 16(2), 58-63.
128
Reproduced with permission of the copyright owner. Further reproduction prohibited without permission.
Kumar K. and Van HJ. (2000). ERP Experiences and Evolution.
Kumar, V., Maheshwari, B., and Kumar, U. (2002). ERP Systems Implementation: Best Practices in Canadian Government Organizations. Government Information Quarterly 19(2), 147-172.
Langenwalter, G.A. (2000). Enterprise Resources Planning and Beyond; Integrating Your Entire Organization. The St.Lucie Press/APICS Series on Resource Management.
Lee, A. S. (2000). Researchable directions for ERP and other new information technologies. MIS Quarterly 24(1).
Levis, J. and Von, S.P. (1994). Lessons Learned from Three Implementations: Knocking Down Barriers to Client-Server.” Information Systems Management 11(3), 15-22.
Li, C. (1999). ERP packages: what's next? Information Systems Management 16(3), 31- 36.
Lodh, S.C. and Gaffikin, M.J.R. (2003). Implementation of an integrated accounting and cost management system using the SAP system: a field study. European Accounting Review 12(1), 85-121.
Marinos, T., Zahir, I., O’Keefe, R.M., and Ray, J.P. (2001). ERP Problems and Application Integration Issues: An Empirical survey. HICSS.
Markus, L. M. and Tanis, C. (2000). The Enterprise Systems Experience - From Adoption to Success. In R. Zmud (Ed.), Framing The Domains of IT Management Research: Glimpsing The Future through The Past 173-207. Cincinnati, Ohio: Pinnaflex Educational Resources.
McVittie, L. (2001). Buckle up: Implementing ERP takes time and Patience. March 2001. Available at www.networkcomputing.com.
Mennel, A. (2002). The Effect of Training on ERP Acceptance: an Empirical Study. Unpublished thesis, University of Maastricht.
Miranda, R. (1999). The Rise of ERP in the Public Sector. Government Finance Review 9-17.
Momentum Software. (2003). Process Driven Organization. ProcessDriven.org.Retrieved 08 January 2005. Available at http://www.processdriven.org/nrocess driven organization.html
Mustafa, Y. and Mejabi, O. (1999). An Approach for Developing Flexible MRP Systems. Information Systems Management 16(2), 58-63.
128
Reproduced with permission of the copyright owner. Further reproduction prohibited without permission.
Neville, M. (2004). ERP has moved on. Paper presented at eWorld Manufacturing and Supply Chain, June.
Newell, S., Huang, J.C., Galliers, R.D., and Pan, S.L. (2003). Implementing enterprise resource planning and knowledge management systems in tandem: fostering efficiency and innovation complementarily. Information and Organization 13,25-52.
Nolan, L.R. (1979). Managing the crisis in data processing, Harvard Business Review 57(2), 115-126.
O'Leary, D.E. (2002). Knowledge management across the enterprise resource planning life cycle, International Journal of Accounting Information Systems 3,99-110.
PA Consulting Group. (1999). PA Value Mining—What happened to the business value of the ERP-system? PA Consulting Group—Research Report.
Parr, A. and Shanks, G. (2000). A model of ERP project implementation. Journal of Information Technology 15(4), 289-304.
Pitturo, M. (1999). How Midsize Companies Are Buying ERP. Journal of Accountancy 188(3), 41-48.
Poston, R. and Grabski, S. (2000). The Impact of Enterprise Resource Planning Systems on Firm Performance. Paper presented at the 21st International Conference on Information Systems, Brisbane, Australia.
Quattrone, P. and Hopper, T. (2001). What does organizational change mean? Speculation on a taken for granted category, Management Accounting Research 12,403-435.
Reck, L. (2000). Information systems outsourcing announcements: Investigating the impact on the market value of contract granting firms. Journal of Information Systems 14(2), 22-35.
Recklies, D. (2001). Small Business: Size as a change or Handicap. Retrieved 20 May 2004. Available at http://www.themanager.org.
Ross, J. and Vitale, M.R. (2000). The ERP revolution: surviving vs thriving. Information Systems Frontiers 2(2), 233-240.
Ryan, B., Scapens, R.W., and Theobald, M. (1992), Research method and methodology in finance and accounting, Academic, London.
129
Reproduced with permission of the copyright owner. Further reproduction prohibited without permission.
Neville, M. (2004). ERP has moved on. Paper presented at eWorld Manufacturing and Supply Chain, June.
Newell, S., Huang, J.C., Galliers, R.D., and Pan, S.L. (2003). Implementing enterprise resource planning and knowledge management systems in tandem: fostering efficiency and innovation complementarily. Information and Organization 13, 25- 52.
Nolan, L.R. (1979). Managing the crisis in data processing, Harvard Business Review 57(2), 115-126.
O’Leary, D.E. (2002). Knowledge management across the enterprise resource planning life cycle, International Journal of Accounting Information Systems 3,99-110.
PA Consulting Group. (1999). PA Value Mining—What happened to the business value of the ERP-system? PA Consulting Group—Research Report.
Parr, A. and Shanks, G. (2000). A model of ERP project implementation. Journal of Information Technology 15(4), 289-304.
Pitturo, M. (1999). How Midsize Companies Are Buying ERP. Journal of Accountancy 188(3), 41-48.
Poston, R. and Grabski, S. (2000). The Impact of Enterprise Resource Planning Systems on Firm Performance. Paper presented at the 21st International Conference on Information Systems, Brisbane, Australia.
Quattrone, P. and Hopper, T. (2001). What does organizational change mean? Speculation on a taken for granted category, Management Accounting Research 12,403—435.
Reck, L. (2000). Information systems outsourcing announcements: Investigating the impact on the market value of contract granting firms. Journal of Information Systems 14(2), 22-35.
Recklies, D. (2001). Small Business: Size as a change or Handicap. Retrieved 20 May 2004. Available at http://www.themanager.org.
Ross, J. and Vitale, M.R. (2000). The ERP revolution: surviving vs thriving. Information Systems Frontiers 2(2), 233-240.
Ryan, B., Scapens, R.W., and Theobald, M. (1992), Research method and methodology in finance and accounting, Academic, London.
129
Reproduced with permission of the copyright owner. Further reproduction prohibited without permission.

Scapens, R.W. and Jazayeri, M. (2003). ERP systems and management accounting change: opportunities or impacts?—a research note. European Accounting Review 122(1), 201-233.
Scott, J. E. (1999). The FoxMeyer Drugs' Bankruptcy: Was it a Failure of ERP? AMCIS99 223-225.
Spathis, C. and Constatinides, S. (2002). ERP systems and management accounting practice. Paper presented at 3rd conference on new directions in management accounting: innovations in practice and research. Brussels: December 12-14.
Sprott, D. (April 2000). Componentizing the Enterprise Application Packages. Communications of the ACM 43(4), 63-69.
Stefanou, C.J. (1999). Supply Chain Management (SCM) and Organizational Key Factors for Successful Implementation of Enterprise Resource Planning (ERP) Systems. In Proceedings of the Fifth Americas Conference on Information Systems, W. D. Haseman and D. L. Nazareth (eds.), Milwaukee 800-802.
Sumner, M. (1999). Critical Success Factors in enterprise wide information management systems projects. AMCIS99 232 — 234.
Turban, M., MacLean, J. and Wetherbe, P. (1999). Information Technology for Management. J. Wiley.
Uraikul, V. (1999). An Architecture Framework for Develop of an Expert System for Optimizing Natural Gas Pipeline Operations. University of Regina.
Wagle, D. (1998). Making the Case for an ERP System. Corporate Finance. December 6-8.
Wagle, D. (1998). Case for ERP Systems. The McKinsey Quarterly (2), 130-135.
Wah, L. (2000). Give BRP a chance. Management Review (Mar) 20-24.
Weill, P., Broadbent, M., and St. Clair, D. (1996) I/T Value and the Role of IT Infrastructure Investments. Strategic Alignment. Oxford University Press.
White, J. (2002). Process. Integration. Usability. Making ERP work the way your business works: A New Approach Improves ERP Simplicity, Productivity and ROI. An ERP White Paper for Fuego.
Wu, Tie. (2003). Implementing CRM in SMEs: An Exploratory Study on the Viability of Using the ASP Model. Swedish School of Economics and Business Administration
130
Reproduced with permission of the copyright owner. Further reproduction prohibited without permission.
Scapens, R.W. and Jazayeri, M. (2003). ERP systems and management accounting change: opportunities or impacts?—a research note. European Accounting Review 122(1), 201-233.
Scott, J. E. (1999). The FoxMeyer Drugs’ Bankruptcy: Was it a Failure of ERP? AMCIS99 223-225.
Spathis, C. and Constatinides, S. (2002). ERP systems and management accounting practice. Paper presented at 3rd conference on new directions in management accounting: innovations in practice and research. Brussels: December 12-14.
Sprott, D. (April 2000). Componentizing the Enterprise Application Packages. Communications of the ACM 43(4), 63-69.
Stefanou, C.J. (1999). Supply Chain Management (SCM) and Organizational Key Factors for Successful Implementation of Enterprise Resource Planning (ERP) Systems. In Proceedings of the Fifth Americas Conference on Information Systems, W. D. Haseman and D. L. Nazareth (eds.), Milwaukee 800-802.
Sumner, M. (1999). Critical Success Factors in enterprise wide information management systems projects. AMCIS99 232 - 234.
Turban, M., MacLean, J. and Wetherbe, P. (1999). Information Technology for Management. J. Wiley.
Uraikul, V. (1999). An Architecture Framework for Develop of an Expert System for Optimizing Natural Gas Pipeline Operations. University of Regina.
Wagle, D. (1998). Making the Case for an ERP System. Corporate Finance. December 6- 8 .
Wagle, D. (1998). Case for ERP Systems. The McKinsey Quarterly (2), 130-135.
Wah, L. (2000). Give BRP a chance. Management Review (Mar) 20-24.
Weill, P., Broadbent, M., and St. Clair, D. (1996) I/T Value and the Role of IT Infrastructure Investments. Strategic Alignment. Oxford University Press.
White, J. (2002). Process. Integration. Usability. Making ERP work the way your business works: A New Approach Improves ERP Simplicity, Productivity and ROI. An ERP White Paper for Fuego.
Wu, Tie. (2003). Implementing CRM in SMEs: An Exploratory Study on the Viability of Using the ASP Model. Swedish School of Economics and Business Administration
130
Reproduced with permission of the copyright owner. Further reproduction prohibited without permission.

Xu, H., Nord, J. H., Brown, N., and Nord, G. D. (2002). Data Quality Issues in Implementing an ERP. Industrial Management & Data Systems,102(1), 47-58.
Yi, Hyong. (2002). ERPs: The Promise and the Peril. The Public Manager 31(4), 55-62.
Yin, R. (1994). Case study research: Design and methods (2nd ed.). Thousand Oaks, CA: Sage Publishing.
Zhang, Z. et al. (2004). A framework of ERP systems implementation success in China: An empirical study. International Journal of Production Economics 98(1), 56-80.
131
Reproduced with permission of the copyright owner. Further reproduction prohibited without permission.
Xu, H., Nord, J. H., Brown, N., and Nord, G. D. (2002). Data Quality Issues in Implementing an ERP. Industrial Management & Data Systems, 102(1), 47-58.
Yi, Hyong. (2002). ERPs: The Promise and the Peril. The Public Manager 31(4), 55-62.
Yin, R. (1994). Case study research: Design and methods (2nd ed.). Thousand Oaks, CA: Sage Publishing.
Zhang, Z. et al. (2004). A framework of ERP systems implementation success in China: An empirical study. International Journal of Production Economics 98(1), 56-80.
131
Reproduced with permission of the copyright owner. Further reproduction prohibited without permission.

Appendix A
Questionnaires
Questionnaire#
Questionnaire for the study of experience in Enterprise
Resource Planning System involvement and knowledge.
If you have experience with an ERP system please skip to question #7; otherwise, please answer questions #1-6.
1. What are the types of software currently employed in your company? 2. Are they integrated as a whole or individually? 3. What are their main features and functions? 4. What are the license fees for the software? 5. What is the implementation cost of the software? 6. How would you rate the ease of use of your software? 7. What Enterprise Resource Planning (ERP) System do you employ? 8. When did you decide to invest in an ERP? 9. What were the motives behind the ERP investment? 10. Who was involved in making this decision, and which organizational levels were
involved? 11. Did you consider alternative solutions? 12. Does your ERP system suit what your company needs? 13. Have company processes been changed in order to fit the ERP system? 14. Has the market position of the company been affected by the ERP
implementation? 15. Why did your company adopt an ERP system (or anything related)?
a. Process Integration b. Resolve order processing issues c. Hardware and software obsolescence d. Resolve data duplication and inconsistencies e. Reduce stock/inventory excess
16. Why has your firm not invested in an ERP system? a. High costs b. Unsecured transactions c. Uncomfortable to use and learn d. Friction with the supply chain network
132
Reproduced with permission of the copyright owner. Further reproduction prohibited without permission.
Appendix A
Questionnaire#,
Questionnaires
Questionnaire for the study of experience in Enterprise
Resource Planning System involvement and knowledge.
If you have experience with an ERP system please skip to question #7; otherwise, please answer questions #1-6.
1. What are the types of software currently employed in your company?2. Are they integrated as a whole or individually?3. What are their main features and functions?4. What are the license fees for the software?5. What is the implementation cost of the software?6. How would you rate the ease of use of your software?7. What Enterprise Resource Planning (ERP) System do you employ?8. When did you decide to invest in an ERP?9. What were the motives behind the ERP investment?10. Who was involved in making this decision, and which organizational levels were
involved?11. Did you consider alternative solutions?12. Does your ERP system suit what your company needs?13. Have company processes been changed in order to fit the ERP system?14. Has the market position of the company been affected by the ERP
implementation?15. Why did your company adopt an ERP system (or anything related)?
a. Process Integrationb. Resolve order processing issuesc. Hardware and software obsolescenced. Resolve data duplication and inconsistenciese. Reduce stock/inventory excess
16. Why has your firm not invested in an ERP system?a. High costsb. Unsecured transactionsc. Uncomfortable to use and learnd. Friction with the supply chain network
132
Reproduced with permission of the copyright owner. Further reproduction prohibited without permission.

e. Lack of internal resources f. There are other projects in progress g. Inadequacy of firm process/products h. Functions/features not suitable i. Lack of integration with existing software
17. What is your ERP's Operating System? a. Packaged OS (Windows) b. Free OS (Linux)
18. What are your ERP's Programming Languages? a. Packaged languages (C++, ASP) b. Free languages (JAVA, PHP)
19. What is your ERP's Database Management System? a. Packaged DBMS (MS SQL Server) b. Free DBMS (MySQL)
20. What is your ERP's Platform? a. Thick Platform (Server/Client) b. Thin Platform (Web based) c. Slim Platform (Hybrid)
21. What is the license fee for your ERP system? 22. What is the implementation cost of your ERP system? 23. What are the additional costs per module of your ERP system?
Suggestions:
133
Reproduced with permission of the copyright owner. Further reproduction prohibited without permission.
e. Lack of internal resourcesf. There are other projects in progressg. Inadequacy of firm process/productsh. Functions/features not suitablei. Lack of integration with existing software
17. What is your ERP’s Operating System?a. Packaged OS (Windows)b. Free OS (Linux)
18. What are your ERP’s Programming Languages?a. Packaged languages (C++, ASP)b. Free languages (JAVA, PHP)
19. What is your ERP’s Database Management System?a. Packaged DBMS (MS SQL Server)b. Free DBMS (MySQL)
20. What is your ERP’s Platform?a. Thick Platform (Server/Client)b. Thin Platform (Web based)c. Slim Platform (Hybrid)
21. What is the license fee for your ERP system?22. What is the implementation cost of your ERP system?23. What are the additional costs per module of your ERP system?
Suggestions:
133
Reproduced with permission of the copyright owner. Further reproduction prohibited without permission.

Survey #
Survey for research in
Framework Design for the development of an ERP system
for Small-to Medium-Sized Enterprises in Southeast Asia
The following questions will be used to determine the important factors in developing an integrated manufacturing computer system for small enterprises in the Southeast Asia Region. Please circle the score that you think is most appropriate for the specific questions, where the levels of satisfaction are: 5 =much above average, 4 = above average, 3 = fair/average, 2 = below average, 1 = much below average
Part 1 Satisfaction with the overall specification of the system for both the existing
system and the Novell ERP system for SMEs in Southeast Asia.
System Overall Specification Factors Current System NERP System 1. Adaptability 5 4 3 2 1 5 4 3 2 1 2. Flexibility 5 4 3 2 1 5 4 3 2 1 3. Overall Cost 5 4 3 2 1 5 4 3 2 1 4. Efficiency of Internal business processes 5 4 3 2 1 5 4 3 2 1 5. Ease of use 5 4 3 2 1 5 4 3 2 1
Part 2 Software and module expectations of the system for both the existing system and
the Novell ERP system for SMEs in Southeast Asia. Please score how necessary
the following modules are to the system.
Softu are and Modules Expe4...tation Factors Current System NEM' System 1. Accounting 5 4 3 2 1 5 4 3 2 1 2. Customer and Supplier relations 5 4 3 2 1 5 4 3 2 1 3. Information Management 5 4 3 2 1 5 4 3 2 1 4. Intuitive System 5 4 3 2 1 5 4 3 2 1 5. Inventory Management 5 4 3 2 1 5 4 3 2 1 6. Manufacturing and Logistics 5 4 3 2 1 5 4 3 2 1 7. Personal Productivity 5 4 3 2 1 5 4 3 2 1 8. Openness 5 4 3 2 1 5 4 3 2 1 9. Sales 5 4 3 2 1 5 4 3 2 1 10. Time 5 4 3 2 1 5 4 3 2 1
134
Reproduced with permission of the copyright owner. Further reproduction prohibited without permission.
Survey #.
Survey for research in
Framework Design for the development of an ERP system
for Small-to Medium-Sized Enterprises in Southeast Asia
The following questions will be used to determine the important factors in developing an integrated manufacturing computer system for small enterprises in the Southeast Asia Region. Please circle the score that you think is most appropriate for the specific questions, where the levels of satisfaction are: 5 =much above average, 4 = above average, 3 = fair/average, 2 = below average, 1 = much below average
Part 1 Satisfaction with the overall specification of the system for both the existing
system and the Novell ERP system for SMEs in Southeast Asia.
System Overall Specification Factors Current System NERP System1. Adaptability2. Flexibility3. Overall Cost4. Efficiency of Internal business processes5. Ease of use
5 4 3 2 1 5 4 3 2 1 5 4 3 2 1 5 4 3 2 1 5 4 3 2 1
5 4 3 2 1 5 4 3 2 1 5 4 3 2 1 5 4 3 2 1 5 4 3 2 1
Part 2 Software and module expectations of the system for both the existing system and
the Novell ERP system for SMEs in Southeast Asia. Please score how necessary
the following modules are to the system.
Software and Modules Expectation Factors Current System NERP System1. Accounting 5 4 3 2 1 5 4 3 2 12. Customer and Supplier relations 5 4 3 2 1 5 4 3 2 13. Information Management 5 4 3 2 1 5 4 3 2 14. Intuitive System 5 4 3 2 1 5 4 3 2 15. Inventory Management 5 4 3 2 1 5 4 3 2 16. Manufacturing and Logistics 5 4 3 2 1 5 4 3 2 17. Personal Productivity 5 4 3 2 1 5 4 3 2 18. Openness 5 4 3 2 1 5 4 3 2 19. Sales 5 4 3 2 1 5 4 3 2 110. Time 5 4 3 2 1 5 4 3 2 1
134
Reproduced with permission of the copyright owner. Further reproduction prohibited without permission.
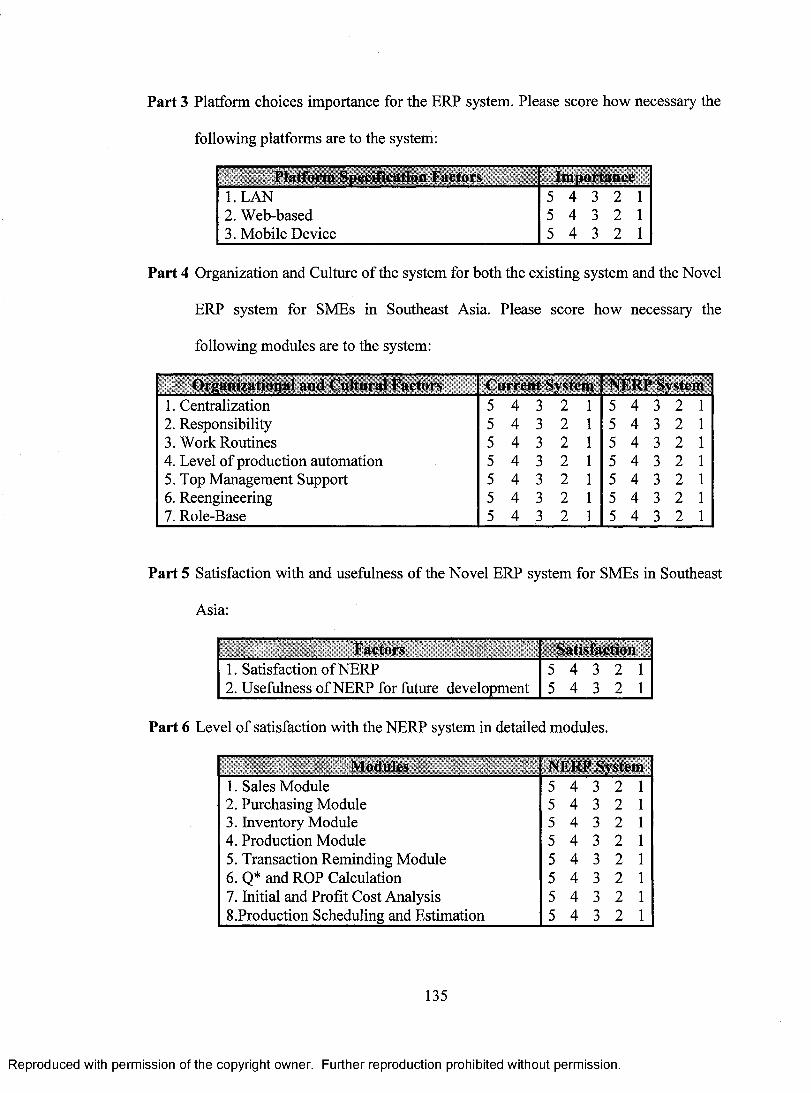
Part 3 Platform choices importance for the ERP system. Please score how necessary the
following platforms are to the system:
Platform Specification Factors Importance 1. LAN 5 4 3 2 1 2. Web-based 5 4 3 2 1 3. Mobile Device 5 4 3 2 1
Part 4 Organization and Culture of the system for both the existing system and the Novel
ERP system for SMEs in Southeast Asia. Please score how necessary the
following modules are to the system:
Organizational and Cultural Factors Current System NERP System 1. Centralization 5 4 3 2 1 5 4 3 2 1 2. Responsibility 5 4 3 2 1 5 4 3 2 1 3. Work Routines 5 4 3 2 1 5 4 3 2 1 4. Level of production automation 5 4 3 2 1 5 4 3 2 1 5. Top Management Support 5 4 3 2 1 5 4 3 2 1 6. Reengineering 5 4 3 2 1 5 4 3 2 1 7. Role-Base 5 4 3 2 1 5 4 3 2 1
Part 5 Satisfaction with and usefulness of the Novel ERP system for SMEs in Southeast
Asia:
Factors Satisfaction 1. Satisfaction of NERP 5 4 3 2 1 2. Usefulness of NERP for future development 5 4 3 2 1
Part 6 Level of satisfaction with the NERP system in detailed modules.
Modules NERP System 1. Sales Module 5 4 3 2 1 2. Purchasing Module 5 4 3 2 1 3. Inventory Module 5 4 3 2 1 4. Production Module 5 4 3 2 1 5. Transaction Reminding Module 5 4 3 2 1 6. Q* and ROP Calculation 5 4 3 2 1 7. Initial and Profit Cost Analysis 5 4 3 2 1 8.Production Scheduling and Estimation 5 4 3 2 1
135
Reproduced with permission of the copyright owner. Further reproduction prohibited without permission.
Part 3 Platform choices importance for the ERP system. Please score how necessary the
following platforms are to the system:
Platform Specification factors Importance1. LAN 5 4 3 2 12. Web-based 5 4 3 2 13. Mobile Device 5 4 3 2 1
Part 4 Organization and Culture of the system for both the existing system and the Novel
ERP system for SMEs in Southeast Asia. Please score how necessary the
following modules are to the system:
Orj’iivii/iitioniil anil C ultural Factors Current System NERP Svstcm1. Centralization2. Responsibility3. Work Routines4. Level of production automation5. Top Management Support6. Reengineering7. Role-Base
5 4 3 2 1 5 4 3 2 1 5 4 3 2 1 5 4 3 2 1 5 4 3 2 1 5 4 3 2 1 5 4 3 2 1
5 4 3 2 1 5 4 3 2 1 5 4 3 2 1 5 4 3 2 1 5 4 3 2 1 5 4 3 2 1 5 4 3 2 1
Part 5 Satisfaction with and usefulness of the Novel ERP system for SMEs in Southeast
Asia:
Factors Satisfaction1. Satisfaction of NERP2. Usefulness of NERP for future development
^ 4 3 2 1 5 4 3 2 1
Part 6 Level of satisfaction with the NERP system in detailed modules.
Modules NERP System1. Sales Module 5 4 3 2 12. Purchasing Module 5 4 3 2 13. Inventory Module 5 4 3 2 14. Production Module 5 4 3 2 15. Transaction Reminding Module 5 4 3 2 16. Q* and ROP Calculation 5 4 3 2 17. Initial and Profit Cost Analysis 5 4 3 2 18.Production Scheduling and Estimation 5 4 3 2 1
135
Reproduced with permission of the copyright owner. Further reproduction prohibited without permission.
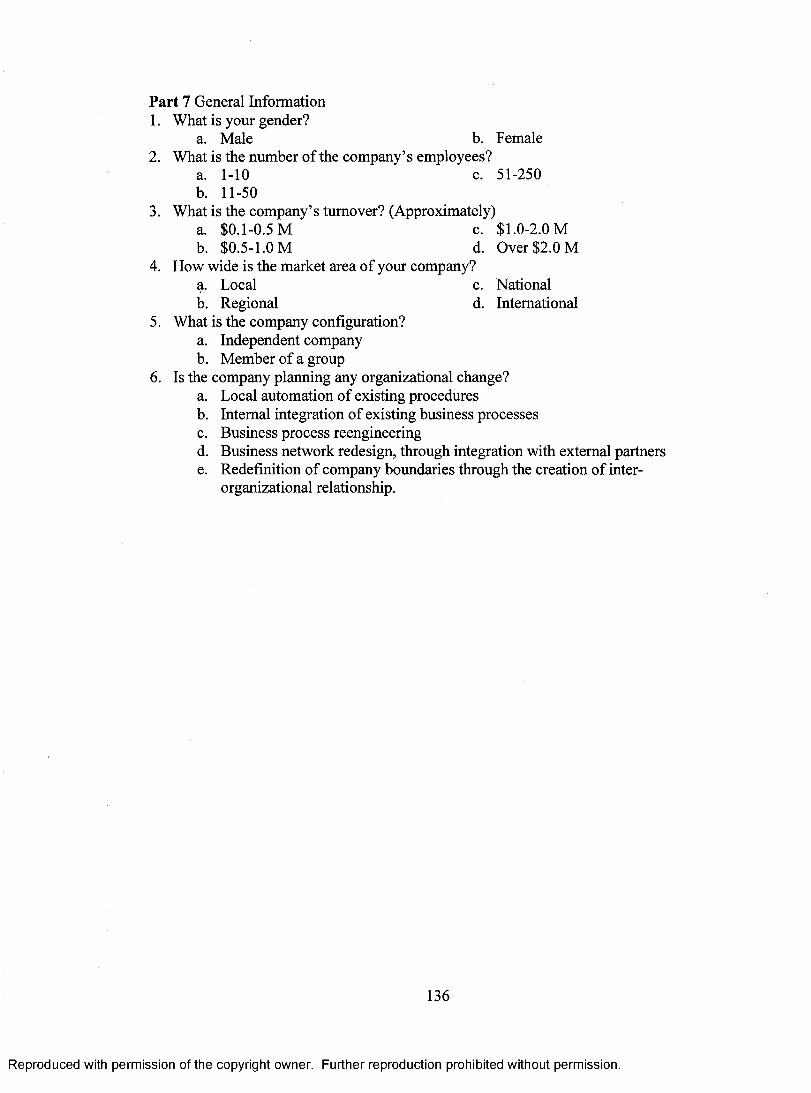
Part 7 General Information 1. What is your gender?
a. Male b. Female 2. What is the number of the company's employees?
a. 1-10 c. 51-250 b. 11-50
3. What is the company's turnover? (Approximately) a. $0.1-0.5 M c. $1.0-2.0 M b. $0.5-1.0 M d. Over $2.0 M
4. How wide is the market area of your company? a. Local c. National b. Regional d. International
5. What is the company configuration? a. Independent company b. Member of a group
6. Is the company planning any organizational change? a. Local automation of existing procedures b. Internal integration of existing business processes c. Business process reengineering d. Business network redesign, through integration with external partners e. Redefinition of company boundaries through the creation of inter-
organizational relationship.
136
Reproduced with permission of the copyright owner. Further reproduction prohibited without permission.
Part 7 General Information1. What is your gender?
a. Male b. Female2. What is the number of the company’s employees?
a. 1-10 c. 51-250b. 11-50
3. What is the company’s turnover? (Approximately)a. $0.1-0.5 Mb. $0.5-1.0 M
c. $1.0-2.0 Md. Over $2.0 M
4. How wide is the market area of your company?a. Localb. Regional
c. Nationald. International
5. What is the company configuration?a. Independent companyb. Member of a group
6. Is the company planning any organizational change?a. Local automation of existing proceduresb. Internal integration of existing business processesc. Business process reengineeringd. Business network redesign, through integration with external partnerse. Redefinition of company boundaries through the creation of inter-
organizational relationship.
136
Reproduced with permission of the copyright owner. Further reproduction prohibited without permission.

Appendix B
Statistical Calculations
This section is written to give an illustration of the uncertainty calculation showed in Chapter 4 of this thesis. All the numbers and data presenting in this appendix are the actual data used in calculation for one of the representative companies. Two types of uncertainty have a direct impact upon inventory policy: demand uncertainty and performance cycle uncertainty (Bowersox at el., 2003).
Demand uncertainty Sales forecasting estimates the units demand during the inventory replenishment
cycle. Even with good forecasting, demand during replenishment cycle often exceeds or falls short of what is anticipated. To protect against a stockout when demand exceeds forecast, a safety stock is added to the base inventory. Under conditions of demand uncertainty, the average inventory represents one-half of the order quantity plus the safety stock. Assume for purposes of illustration that the inventory performance cycle is 10 days. Historical evidence indicates that daily sales range from 5 to 15 units with average daily sales being 10 units.
From the history records in Table B-1, it is observed that stockouts occurred on 2 of 30 days. The sales history over the 30-day period has been arranged in Table B-2 in terms of a frequency distribution. The main purpose of a frequency distribution is to observe the variations of the average daily demand.
Forecast Cycle 1 Forecast Cycle 2 Forecast Cycle 3 Day Demand Accumulated Day Demand Accumulated Day Demand Accumulated
1 14 14 11 5 5 21 10 10 2 7 21 12 11 16 22 10 20 3 6 27 13 10 26 23 9 29 4 8 35 14 12 38 24 8 37 5 12 47 15 15 53 25 9 46 6 10 57 16 12 65 26 6 52 7 9 66 17 11 76 27 7 59 8 13 79 18 14 90 28 13 72 9 11 90 19 10 100 29 8 80
10 10 100 20 5 Stockout 30 9 89 Table B-1 Typical demand experience during three rep enishment cycles
137
Reproduced with permission of the copyright owner. Further reproduction prohibited without permission.
Appendix B
Statistical Calculations
This section is written to give an illustration of the uncertainty calculation showed in Chapter 4 of this thesis. All the numbers and data presenting in this appendix are the actual data used in calculation for one of the representative companies. Two types of uncertainty have a direct impact upon inventory policy: demand uncertainty and performance cycle uncertainty (Bowersox at el., 2003).
Demand uncertaintySales forecasting estimates the units demand during the inventory replenishment
cycle. Even with good forecasting, demand during replenishment cycle often exceeds or falls short of what is anticipated. To protect against a stockout when demand exceeds forecast, a safety stock is added to the base inventory. Under conditions of demand uncertainty, the average inventory represents one-half of the order quantity plus the safety stock. Assume for purposes of illustration that the inventory performance cycle is 10 days. Historical evidence indicates that daily sales range from 5 to 15 units with average daily sales being 10 units.
From the history records in Table B-l, it is observed that stockouts occurred on 2 of 30 days. The sales history over the 30-day period has been arranged in Table B-2 in terms of a frequency distribution. The main purpose of a frequency distribution is to observe the variations of the average daily demand.
Forecast Cycle 1 Forecast Cycle 2 Forecast Cycle 3Day Demand Accumulated Day Demand Accumulated Day Demand Accumulated
1 14 14 11 5 5 21 10 102 7 21 12 11 16 22 10 203 6 27 13 10 26 23 9 294 8 35 14 12 38 24 8 375 12 47 15 15 53 25 9 466 10 57 16 12 65 26 6 527 9 66 17 11 76 27 7 598 13 79 18 14 90 28 13 729 11 90 19 10 100 29 8 8010 10 100 20 5 Stockout 30 9 89
Table B-l Typical demand experience during three replenishment cycles
137
Reproduced with permission of the copyright owner. Further reproduction prohibited without permission.
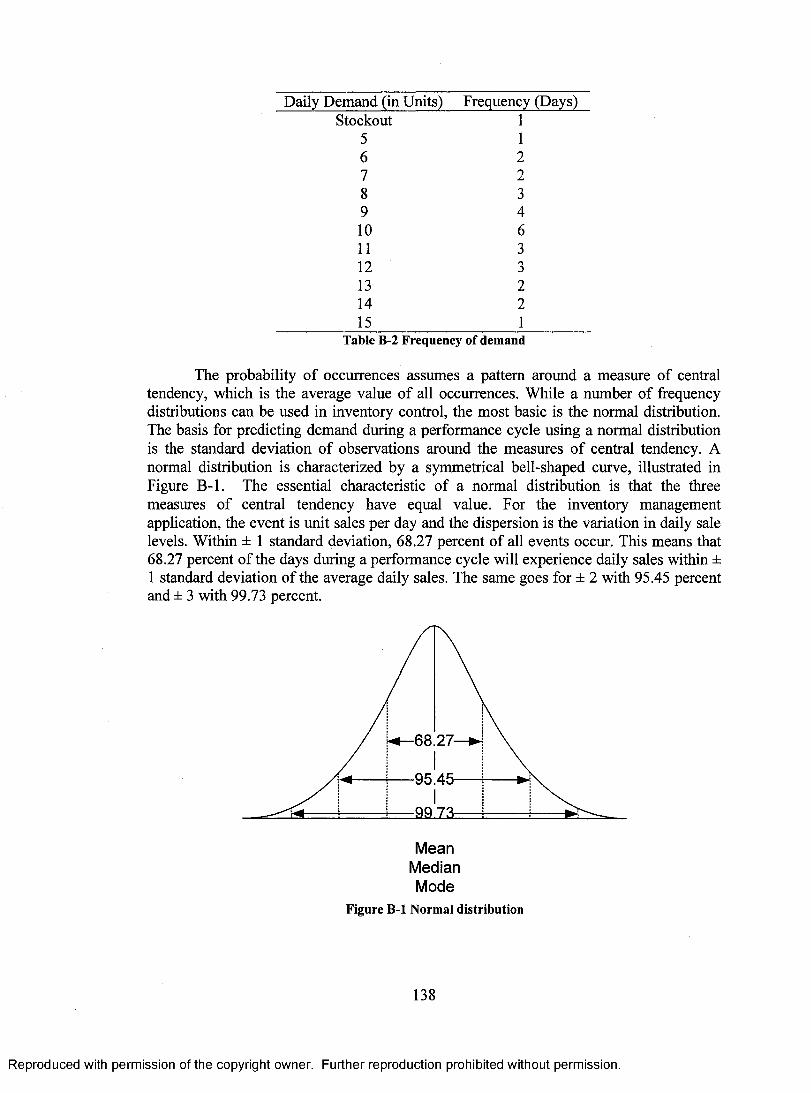
Daily Demand (in Units) Frequency (Days) Stockout 1
5 1 6 2 7 2 8 3 9 4 10 6 11 3 12 3 13 2 14 2 15 1
Table B-2 Frequency of demand
The probability of occurrences assumes a pattern around a measure of central tendency, which is the average value of all occurrences. While a number of frequency distributions can be used in inventory control, the most basic is the normal distribution. The basis for predicting demand during a performance cycle using a normal distribution is the standard deviation of observations around the measures of central tendency. A normal distribution is characterized by a symmetrical bell-shaped curve, illustrated in Figure B-1. The essential characteristic of a normal distribution is that the three measures of central tendency have equal value. For the inventory management application, the event is unit sales per day and the dispersion is the variation in daily sale levels. Within ± 1 standard deviation, 68.27 percent of all events occur. This means that 68.27 percent of the days during a performance cycle will experience daily sales within ± 1 standard deviation of the average daily sales. The same goes for ± 2 with 95.45 percent and ± 3 with 99.73 percent.
Mean Median Mode
Figure B-1 Normal distribution
138
Reproduced with permission of the copyright owner. Further reproduction prohibited without permission.
Daily Demand (in Units) Frequency (Days)Stockout 1
5 16 27 28 39 410 611 312 313 214 215 1
Table B-2 Frequency of demand
The probability of occurrences assumes a pattern around a measure of central tendency, which is the average value of all occurrences. While a number of frequency distributions can be used in inventory control, the most basic is the normal distribution. The basis for predicting demand during a performance cycle using a normal distribution is the standard deviation of observations around the measures of central tendency. A normal distribution is characterized by a symmetrical bell-shaped curve, illustrated in Figure B-l. The essential characteristic of a normal distribution is that the three measures of central tendency have equal value. For the inventory management application, the event is unit sales per day and the dispersion is the variation in daily sale levels. Within ± 1 standard deviation, 68.27 percent of all events occur. This means that 68.27 percent of the days during a performance cycle will experience daily sales within ± 1 standard deviation of the average daily sales. The same goes for ± 2 with 95.45 percent and ± 3 with 99.73 percent.
68.27-
95.46
99.73-
MeanMedianMode
Figure B-l Normal distribution
138
Reproduced with permission of the copyright owner. Further reproduction prohibited without permission.
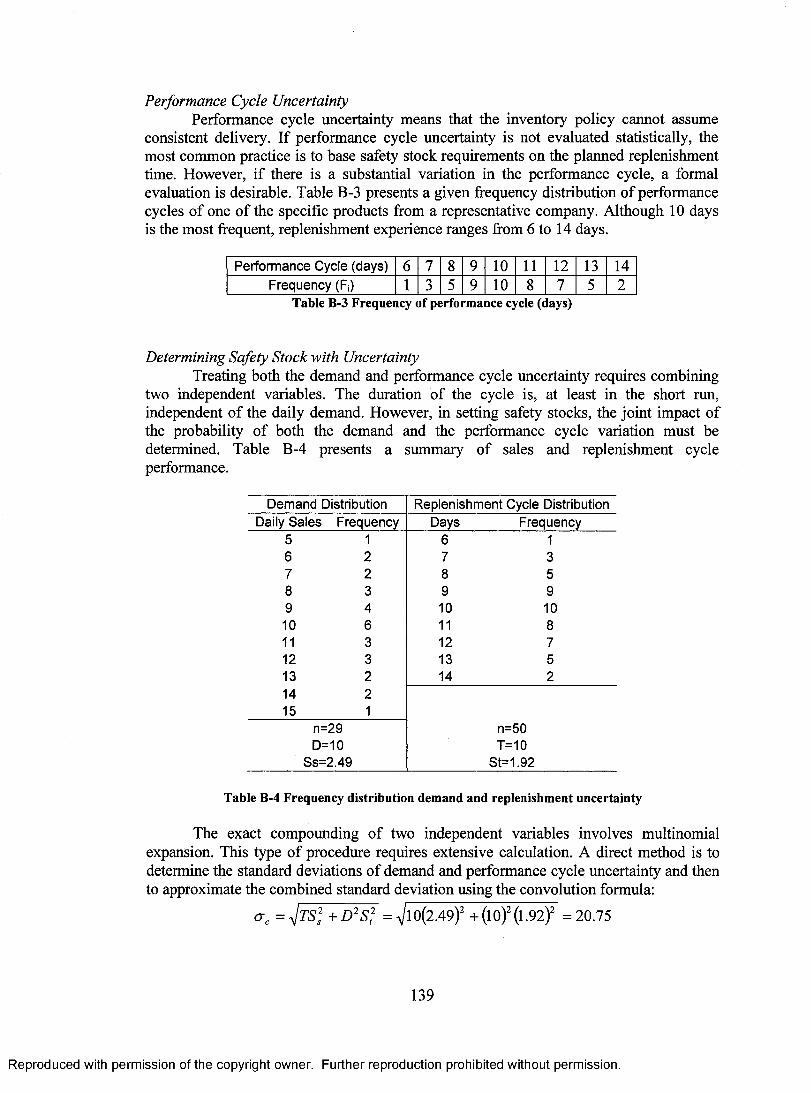
Performance Cycle Uncertainty Performance cycle uncertainty means that the inventory policy cannot assume
consistent delivery. If performance cycle uncertainty is not evaluated statistically, the most common practice is to base safety stock requirements on the planned replenishment time. However, if there is a substantial variation in the performance cycle, a formal evaluation is desirable. Table B-3 presents a given frequency distribution of performance cycles of one of the specific products from a representative company. Although 10 days is the most frequent, replenishment experience ranges from 6 to 14 days.
Performance Cycle (days) 6 7 8 9 10 11 12 13 14 Frequency (F1) 1 3 5 9 10 8 7 5 2
Table B-3 Frequency of performance cycle (days)
Determining Safety Stock with Uncertainty Treating both the demand and performance cycle uncertainty requires combining
two independent variables. The duration of the cycle is, at least in the short run, independent of the daily demand. However, in setting safety stocks, the joint impact of the probability of both the demand and the performance cycle variation must be determined. Table B-4 presents a summary of sales and replenishment cycle performance.
Demand Distribution Replenishment Cycle Distribution Daily Sales Frequency Days Frequency
5 1 6 1 6 2 7 3 7 2 8 5 8 3 9 9 9 4 10 10 10 6 11 8 11 3 12 7 12 3 13 5 13 2 14 2 14 2 15 1
n=29 D=10
Ss=2.49
n=50 T=10
St=1.92
Table B-4 Frequency distribution demand and replenishment uncertainty
The exact compounding of two independent variables involves multinomial expansion. This type of procedure requires extensive calculation. A direct method is to determine the standard deviations of demand and performance cycle uncertainty and then to approximate the combined standard deviation using the convolution formula:
= l bs s2 + D2 6,-,t2 = V10(2.49) 2 + 0. 0) 2 0.92) 2 = 20.75
139
Reproduced with permission of the copyright owner. Further reproduction prohibited without permission.
Performance Cycle UncertaintyPerformance cycle uncertainty means that the inventory policy cannot assume
consistent delivery. If performance cycle uncertainty is not evaluated statistically, the most common practice is to base safety stock requirements on the planned replenishment time. However, if there is a substantial variation in the performance cycle, a formal evaluation is desirable. Table B-3 presents a given frequency distribution of performance cycles of one of the specific products from a representative company. Although 10 days is the most frequent, replenishment experience ranges from 6 to 14 days.
Performance Cycle (days) 6 7 8 9 10 11 12 13 14Frequency (Fi) 1 3 5 9 10 8 7 5 2
Table B-3 Frequency of performance cycle (days)
Determining Safety Stock with UncertaintyTreating both the demand and performance cycle uncertainty requires combining
two independent variables. The duration of the cycle is, at least in the short run, independent of the daily demand. However, in setting safety stocks, the joint impact of the probability of both the demand and the performance cycle variation must be determined. Table B-4 presents a summary of sales and replenishment cycle performance.
Demand Distribution Replenishment Cycle DistributionDaily Sales Frequency Days Frequency
5 1 6 16 2 7 37 2 8 58 3 9 99 4 10 1010 6 11 811 3 12 712 3 13 513 2 14 214 215 1
n=29 n=50D=10 T=10
Ss=2.49 St=1.92
Table B-4 Frequency distribution demand and replenishment uncertainty
The exact compounding of two independent variables involves multinomial expansion. This type of procedure requires extensive calculation. A direct method is to determine the standard deviations of demand and performance cycle uncertainty and then to approximate the combined standard deviation using the convolution formula:
arc = -JtS* +D2Sf = ^/l0(2.49)2 +(l0)2(l.92)2 = 20.75
139
Reproduced with permission of the copyright owner. Further reproduction prohibited without permission.
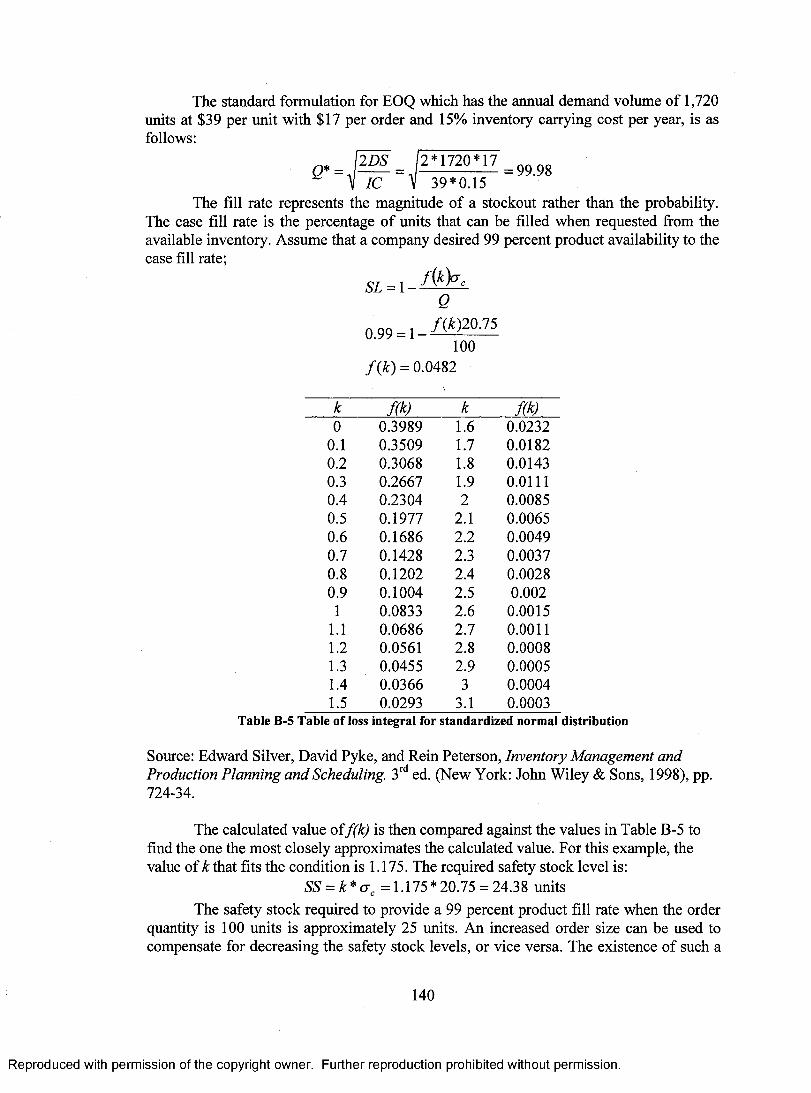
The standard formulation for EOQ which has the annual demand volume of 1,720 units at $39 per unit with $17 per order and 15% inventory carrying cost per year, is as follows:
Q* = 112Ds 112*1720*17 = 99.98
IC 39*0.15 The fill rate represents the magnitude of a stockout rather than the probability.
The case fill rate is the percentage of units that can be filled when requested from the available inventory. Assume that a company desired 99 percent product availability to the case fill rate;
SL =1 f (k)src Q
0.99 =1 f (k)20.75
100 f (k) = 0.0482
k f(k) k f(k) 0 0.3989 1.6 0.0232
0.1 0.3509 1.7 0.0182 0.2 0.3068 1.8 0.0143 0.3 0.2667 1.9 0.0111 0.4 0.2304 2 0.0085 0.5 0.1977 2.1 0.0065 0.6 0.1686 2.2 0.0049 0.7 0.1428 2.3 0.0037 0.8 0.1202 2.4 0.0028 0.9 0.1004 2.5 0.002 1 0.0833 2.6 0.0015
1.1 0.0686 2.7 0.0011 1.2 0.0561 2.8 0.0008 1.3 0.0455 2.9 0.0005 1.4 0.0366 3 0.0004 1.5 0.0293 3.1 0.0003
Table B-5 Table of loss integral for standardized normal distribution
Source: Edward Silver, David Pyke, and Rein Peterson, Inventory Management and Production Planning and Scheduling. 3rd ed. (New York: John Wiley & Sons, 1998), pp. 724-34.
The calculated value off(k) is then compared against the values in Table B-5 to find the one the most closely approximates the calculated value. For this example, the value of k that fits the condition is 1.175. The required safety stock level is:
SS = k* = 1.175* 20.75 = 24.38 units
The safety stock required to provide a 99 percent product fill rate when the order quantity is 100 units is approximately 25 units. An increased order size can be used to compensate for decreasing the safety stock levels, or vice versa. The existence of such a
140
Reproduced with permission of the copyright owner. Further reproduction prohibited without permission.
The standard formulation for EOQ which has the annual demand volume of 1,720 units at $39 per unit with $17 per order and 15% inventory carrying cost per year, is as follows:
W S l2'172D'17.m99MV 1C V 39*0.15
The fill rate represents the magnitude of a stockout rather than the probability. The case fill rate is the percentage of units that can be filled when requested from the available inventory. Assume that a company desired 99 percent product availability to the case fill rate;
SL = 1 -
0.99 = 1 -
Qf {k) 20.75
100f ( k ) = 0.0482
k m k m0 0.3989 1.6 0.0232
0.1 0.3509 1.7 0.01820.2 0.3068 1.8 0.01430.3 0.2667 1.9 0.01110.4 0.2304 2 0.00850.5 0.1977 2.1 0.00650.6 0.1686 2.2 0.00490.7 0.1428 2.3 0.00370.8 0.1202 2.4 0.00280.9 0.1004 2.5 0.0021 0.0833 2.6 0.0015
1.1 0.0686 2.7 0.00111.2 0.0561 2.8 0.00081.3 0.0455 2.9 0.00051.4 0.0366 3 0.00041.5 0.0293 3.1 0.0003
Table B-5 Table of loss integral for standardized normal distribution
Source: Edward Silver, David Pyke, and Rein Peterson, Inventory Management and Production Planning and Scheduling. 3rd ed. (New York: John Wiley & Sons, 1998), pp. 724-34.
The calculated value off(k) is then compared against the values in Table B-5 to find the one the most closely approximates the calculated value. For this example, the value of A: that fits the condition is 1.175. The required safety stock level is:
SS = k * a c =1.175*20.75 = 24.38 unitsThe safety stock required to provide a 99 percent product fill rate when the order
quantity is 100 units is approximately 25 units. An increased order size can be used to compensate for decreasing the safety stock levels, or vice versa. The existence of such a
140
Reproduced with permission of the copyright owner. Further reproduction prohibited without permission.
trade-off implies that there is a combination of replenishment order quantities that will result in desired customer service at the minimum cost.
141
Reproduced with permission of the copyright owner. Further reproduction prohibited without permission.
trade-off implies that there is a combination of replenishment order quantities that will result in desired customer service at the minimum cost.
141
Reproduced with permission of the copyright owner. Further reproduction prohibited without permission.
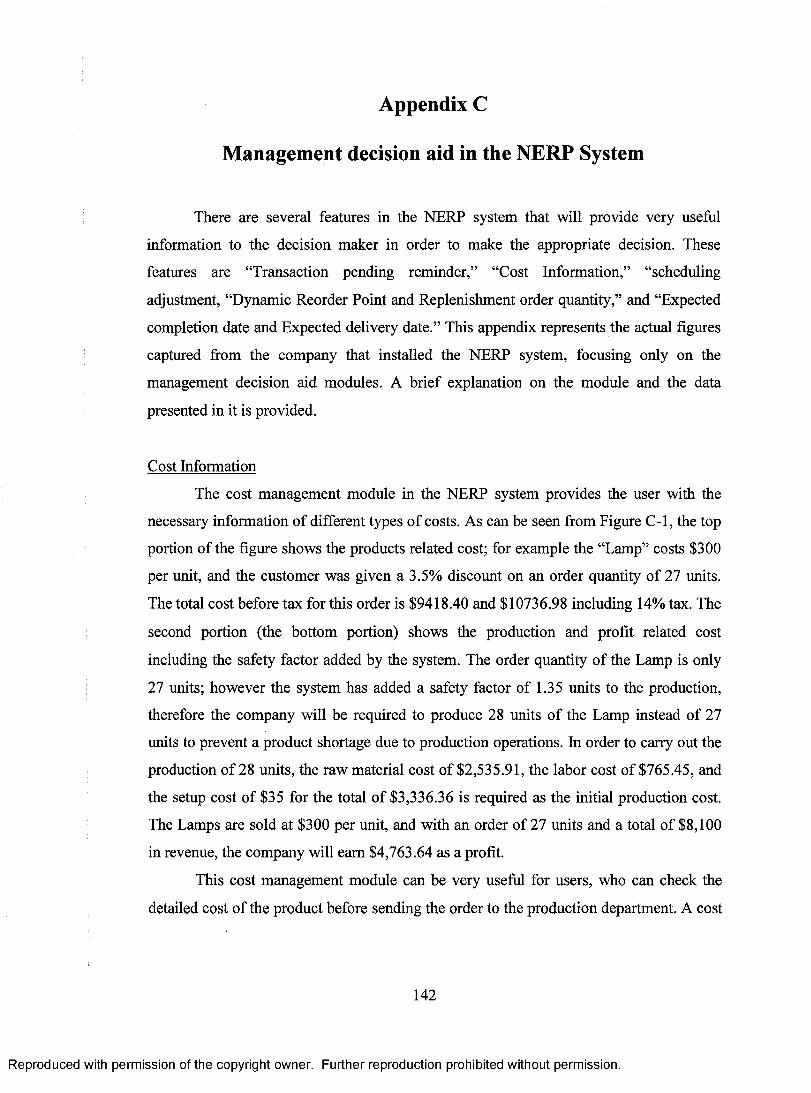
Appendix C
Management decision aid in the NERP System
There are several features in the NERP system that will provide very useful
information to the decision maker in order to make the appropriate decision. These
features are "Transaction pending reminder," "Cost Information," "scheduling
adjustment, "Dynamic Reorder Point and Replenishment order quantity," and "Expected
completion date and Expected delivery date." This appendix represents the actual figures
captured from the company that installed the NERP system, focusing only on the
management decision aid modules. A brief explanation on the module and the data
presented in it is provided.
Cost Information
The cost management module in the NERP system provides the user with the
necessary information of different types of costs. As can be seen from Figure C-1, the top
portion of the figure shows the products related cost; for example the "Lamp" costs $300
per unit, and the customer was given a 3.5% discount on an order quantity of 27 units.
The total cost before tax for this order is $9418.40 and $10736.98 including 14% tax. The
second portion (the bottom portion) shows the production and profit related cost
including the safety factor added by the system. The order quantity of the Lamp is only
27 units; however the system has added a safety factor of 1.35 units to the production,
therefore the company will be required to produce 28 units of the Lamp instead of 27
units to prevent a product shortage due to production operations. In order to carry out the
production of 28 units, the raw material cost of $2,535.91, the labor cost of $765.45, and
the setup cost of $35 for the total of $3,336.36 is required as the initial production cost.
The Lamps are sold at $300 per unit, and with an order of 27 units and a total of $8,100
in revenue, the company will earn $4,763.64 as a profit.
This cost management module can be very useful for users, who can check the
detailed cost of the product before sending the order to the production department. A cost
142
Reproduced with permission of the copyright owner. Further reproduction prohibited without permission.
Appendix C
Management decision aid in the NERP System
There are several features in the NERP system that will provide very useful
information to the decision maker in order to make the appropriate decision. These
features are “Transaction pending reminder,” “Cost Information,” “scheduling
adjustment, “Dynamic Reorder Point and Replenishment order quantity,” and “Expected
completion date and Expected delivery date.” This appendix represents the actual figures
captured from the company that installed the NERP system, focusing only on the
management decision aid modules. A brief explanation on the module and the data
presented in it is provided.
Cost Information
The cost management module in the NERP system provides the user with the
necessary information of different types of costs. As can be seen from Figure C-l, the top
portion of the figure shows the products related cost; for example the “Lamp” costs $300
per unit, and the customer was given a 3.5% discount on an order quantity of 27 units.
The total cost before tax for this order is $9418.40 and $10736.98 including 14% tax. The
second portion (the bottom portion) shows the production and profit related cost
including the safety factor added by the system. The order quantity of the Lamp is only
27 units; however the system has added a safety factor of 1.35 units to the production,
therefore the company will be required to produce 28 units of the Lamp instead of 27
units to prevent a product shortage due to production operations. In order to carry out the
production of 28 units, the raw material cost of $2,535.91, the labor cost of $765.45, and
the setup cost of $35 for the total of $3,336.36 is required as the initial production cost.
The Lamps are sold at $300 per unit, and with an order of 27 units and a total of $8,100
in revenue, the company will earn $4,763.64 as a profit.
This cost management module can be very useful for users, who can check the
detailed cost of the product before sending the order to the production department. A cost
142
Reproduced with permission of the copyright owner. Further reproduction prohibited without permission.

management module that supported by NERP system can provide the comprehensive
visibility of the cost necessary for the Southeast Asian SMEs.
.-'.11Sales Order
Us erlaadmin
Order ID SaQ-Og007
Refer F1'.°R) !Sale Order
Date 1
1QuotatIon ID
09/07105
Customer Kerne Josh
salesllathe !Valentino
Discount I 3.5 %
':TAX''" GST ) 14P4 (G5T + PST )
Address1 131,1:14utt'1 Cost 4001 Peofit I l‘lote I
Product ID Il7r1)01WCP.
UnitPrici3
Customer Order;Date
Save_
Estimate Completion Date 109/13/05
'Expected Dehrery Date:109/14105
!Lamp
QoantitY Note
27 013.5% Discount
Update
Delete
'.:ProdUttiD ProduCt ame 'Unit UnitPriCe($), Quantj4 QT' Note PrD-00001 TANK, 16(54', QH, Si... Box 100.00 7 0 PrD-00002 Filling Cabinets Box 80.00 12 0 2% Discount PrD-00003 Lamy Box 300.00 27 0 3.5% Disco...
Total Net "$ 1 9418.40 Total $' 1 10736.98
Address Product Cost and Profit Note
!Initial•Cost
Product IDJ Product Name j Qty/SF ! RM Cost Labor Cost! OT Cost 1 Setup 1 Total PrD-00001 TANK. 10X54, OH, . . . 1 7.35 183.75 106.58 0.00 20.00 310.32 PrD-00002 FillingCabinets I 12.601. 314.62 113.40 0.00 15.00- 443.02 PrD-00003 Lamp i 28.351 2,535.91 765.45 0.00 35.00 3,336.36
Profit-
Product ID
..,... , . •
Product. Name Qty/SF .-1
Initial Cost 1 Sale Cost Profit li PHD-00001 TANK, 10X54, QH, Single 7.35 310.32
443.02 700.00 389.68 960.00 516.98 PrD-00002 Filling Cabinets 12.60
PrD-00003 Lamp 28.35 3,336.36i 8,100.001 4,763.64
Figure C-1 Cost management module.
143
Reproduced with permission of the copyright owner. Further reproduction prohibited without permission.
management module that supported by NERP system can provide the comprehensive
visibility of the cost necessary for the Southeast Asian SMEs.
0 9 /0 7 /0 5
ZJz J
~3
C ustom er O rd e r D a te |P
Save
E stim ate Com pletion D a te |0 9 /1 3 /0 5
E x p ected Delivery D a te ; J09/14/OS
Iga S a le s O r t lu r
U s e ; ID admin
O rder ID f SaO -0Q 007 Da.te j“R efer From [sale Order 3 19uotationID f~
C ustom er N am e ]Mr. Josh
S alesN aitie { v a ie n t in o
D iscount I 3 .5 %
TAX r 7 % ( GST ) p 11% (-G5T + PST j
Address Product | Cost and Profit | Note j
Product ID jp rO -00003
Unitp . ---------------
UnitPrice»)
(Lamp
Q u an tity OT"3
N ote
Add
Update
3 0 0 ,0 0 27 Q (3 .5 % Discount Delete
Product ID Product Name Unit UnitPrice($) Quantity, O T ' j Note'PrD-00001 TANK, 10X54, QH, Si... Box 100.00r 7 0PrD-00002 Filling Cabinets Box 80.00 12 0 2% DiscountPrD-00003 Lamp Box 300.00 27 0!3.5% Disco...
Total N e t % ■9416.10 Total * r 10736.98
Address] Product Cost and Profit j Notej
1 Initial Cost
Product ID Product Name Qty/SF RM Cost Labor CostPrD-00001 TANK, 10X54, Q H ,... 7 35 183.75 106.58PrD-00002 Fillin^Cabinets 12.60 314.62 113 40PrD-00003 Lamp >6.35 2,535.91 765 45
m p u s n i ffltlllil iSilliliirm m
OT Cost Setup Total j 310.320.00 20 .00 !
443:020.00 15.0035.00I 3,336.360.00
Product ID Product Name Qty/SF I Initial Cost I Sale Cost 1 Profit |PrD-OOOOi TANK, 10X54, QH, Single 7.35! 310.32 700.00i 389.68!PrD-00002 Filling Cabinets 12.60] 443.02! 960.001 516.98PrD-00003 Lamp 28.35! 3,336.361 8,100.001 4,763.64!
Figure C -l Cost management module.
143
Reproduced with permission of the copyright owner. Further reproduction prohibited without permission.

Expected Completion Date and Expected Delivery Date
The NERP system can provide the user with expected completion date and
expected delivery date of the order, as shown in figure C-2. Both of the expected dates
are calculated automatically by the NERP system based on the current production, the
pending production, availability of workforce, and availability of the raw materials. In
figure C-2, the order has been placed on September 7th, 2005 and the NERP system has
estimated the completion date of the order to be on September 13th, and expects to deliver
to the customer on September 14th.
This feature provides the user and customer with the approximate date that the
products will be finished and delivered. The user then can easily add the extra workforce,
or overtime hours to the production if the order is needed.
EMSdles Order
User lbadmin
Order ID 5aff:130007
Refer From Sale Omer.
.Date
Quotation ID
119107105
Customer Name JMr. Josh
Sales Name iValentino
'Discount 3.
TAX 7% ( CST) P" 14% ( G5T + PST )
Customer Order Date
Esdiiiate CoMpletion Date.: 0.3/13/05
Exeetted,peliyerie.Dat
Figure C-2 Expected completion and delivery date
Production Scheduling and Scheduling Adjustment
Figure C-3 shows the Production Scheduling module and Scheduling Adjustment
module in the NERP system. The Production Scheduling module represents the status of
the transaction order created on the NERP system. It provides the users with an order
identification number, order type (sale order, sale quotation, or internal order), promised
delivery date, customer's name and the status of the production. There are three types of
status that can be shown on the module: "Finish," "Requesting Raw Material," and
"Waiting." The Requesting Raw Material status tells the user that the production
department is waiting for the raw material to arrive from the warehouse. The Waiting
status shows that the order is ready (with all required raw material), and waiting to be put
in the production order. Last, the Finish status tells the user that the production of the
144
Reproduced with permission of the copyright owner. Further reproduction prohibited without permission.
Expected Completion Date and Expected Delivery Date
The NERP system can provide the user with expected completion date and
expected delivery date of the order, as shown in figure C-2. Both of the expected dates
are calculated automatically by the NERP system based on the current production, the
pending production, availability of workforce, and availability of the raw materials. IntVifigure C-2, the order has been placed on September 7 , 2005 and the NERP system has
estimated the completion date of the order to be on September 13th, and expects to deliver
to the customer on September 14th.
This feature provides the user and customer with the approximate date that the
products will be finished and delivered. The user then can easily add the extra workforce,
or overtime hours to the production if the order is needed.
jSs| S a les O rd e r
User IDs
O rd er ID
R efer From
C ustom er Nam e
Discount f
S a v e |
f S a 0 -0 0 0 0 7 1 D a te f '0 9 /0 7 /0 5
[Sale Order V j Q u o ta tio n id
jfvlr. Josh . r JCustom er O rd e r D a te j
fValentino zl E stim ate Com pletion D a te [0 9 / 13/05
j 3 .5 %. E x p ec ted Delivery D a te [0 9 / 14/05
TAX r 7 % ( GST ) W 14% ( GST + PST )
Figure C-2 Expected completion and delivery date
Production Scheduling and Scheduling Adjustment
Figure C-3 shows the Production Scheduling module and Scheduling Adjustment
module in the NERP system. The Production Scheduling module represents the status of
the transaction order created on the NERP system. It provides the users with an order
identification number, order type (sale order, sale quotation, or internal order), promised
delivery date, customer’s name and the status of the production. There are three types of
status that can be shown on the module: “Finish,” “Requesting Raw Material,” and
“Waiting.” The Requesting Raw Material status tells the user that the production
department is waiting for the raw material to arrive from the warehouse. The Waiting
status shows that the order is ready (with all required raw material), and waiting to be put
in the production order. Last, the Finish status tells the user that the production of the
144
Reproduced with permission of the copyright owner. Further reproduction prohibited without permission.
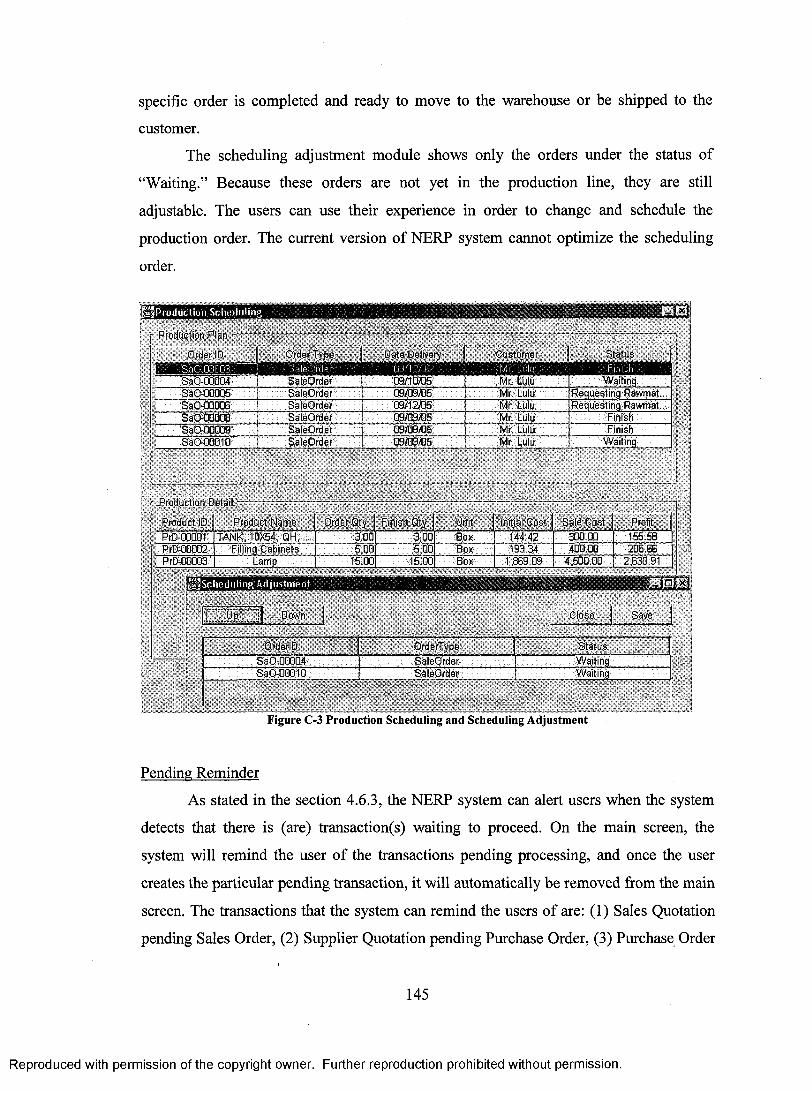
specific order is completed and ready to move to the warehouse or be shipped to the
customer.
The scheduling adjustment module shows only the orders under the status of
"Waiting." Because these orders are not yet in the production line, they are still
adjustable. The users can use their experience in order to change and schedule the
production order. The current version of NERP system cannot optimize the scheduling
order.
Pf 0 d tIC t itl 11SC 11 e d 11 I g
•."RaC1,00003 Sa0-00004 SSO-00005 Sa0-000106 Sa0-00008Sa0-00009 Sa0-00010
Production Detail -
FrodU41D.: PrdattO Name Order Qty J Finish Qty Unit : loitial'COst Sale Cost Profit PrD-00001 1TANK.10)(54, QH; ... •
Order Type leOriler
SaleOrder SaleOrder
SaleOrcier SaleOrder $alsOrder
Customer $latus .0911 Lulu ' 09/10/05 09/09/06 09/12/05 09/09/05 09109/05 09109/06
• Mr. .Li.ilu• Mr. Lulu Mr. Lulu Mr. Lulu Mr. Lulu Mr. Lulu
Waiting Requesting Rawmat... Requesting Rawmat...
Finigh Finish
Waiting.
PrD-00002 PrD-00003
Filling Cabinets . Lamp
Sc hedutingAdjustment
Down
OrderlD Sa0-00004 Sa0-00010
3.001 3.00 : 5.00 5.00 15110 •15:00
Box Box Box
OrderType SaleOrder SaleOrder
144.42 193.34
1,869.09
300.00 400.00
4,500.00
ClOe
Status Waiting Waiting
Figure C-3 Production Scheduling and Scheduling Adjustment
155 58 206.66
2,630.91
Pending Reminder
As stated in the section 4.6.3, the NERP system can alert users when the system
detects that there is (are) transaction(s) waiting to proceed. On the main screen, the
system will remind the user of the transactions pending processing, and once the user
creates the particular pending transaction, it will automatically be removed from the main
screen. The transactions that the system can remind the users of are: (1) Sales Quotation
pending Sales Order, (2) Supplier Quotation pending Purchase Order, (3) Purchase Order
145
Reproduced with permission of the copyright owner. Further reproduction prohibited without permission.
specific order is completed and ready to move to the warehouse or be shipped to the
customer.
The scheduling adjustment module shows only the orders under the status of
“Waiting.” Because these orders are not yet in the production line, they are still
adjustable. The users can use their experience in order to change and schedule the
production order. The current version of NERP system cannot optimize the scheduling
order.
Iff Production St lu'iluliii:'. Hi*!• ^roaucuon rian - -
Order .ID Order Type Date Delivery Customer Status [
Sa0-00004 SaleOrder 09/10/05 : Mr. Lulu Waiting iSa0-D0005 SaleOrder 09/09/05 Mr. Lulu Requesting Rawmat... .
SaleOrder 09/12/05 Mr. Lulu Requesting Rawmat...1 Sa0-00008 SaleOrder 09/09/05 : Mr. Lulu Finish I
Sa0-00009 SaleOrder 09/09/05 Mr. Lulu Finish 1I Sa0-00010 SaleOrder 09/09/05 Mr. Lulu Waiting
Production Detail -
Product ID Product Name Order Gty Finish Qty Unit Initial'Cost Sale Cost Profit
PrD-00001 TANK, 10X54, Q H ,... 3.00 3.00 Box 144.42 : 300.00 155.58PrD-00002 Filling Cabinets 5.00 5.0C Box 193.34 400.00 206.66PrD-00003 Lamp 15.00 15.00 Box 1,869.09 4,500.00 2,630.91 i
t i i H ' . h m ' j i i i f F i t
o o l Down Close Save
OrderlD. O.rderType Status
Sa0-00004 SaleOrder Waiting
-__SaO-_00010 __ SaleOrder Waiting
--------------
Figure C-3 Production Scheduling and Scheduling Adjustment
Pending Reminder
As stated in the section 4.6.3, the NERP system can alert users when the system
detects that there is (are) transaction(s) waiting to proceed. On the main screen, the
system will remind the user of the transactions pending processing, and once the user
creates the particular pending transaction, it will automatically be removed from the main
screen. The transactions that the system can remind the users of are: (1) Sales Quotation
pending Sales Order, (2) Supplier Quotation pending Purchase Order, (3) Purchase Order
145
Reproduced with permission of the copyright owner. Further reproduction prohibited without permission.

pending the arrival of the raw materials, (4) Raw Material Requisition pending the
issuing of the raw material to the production department. Figure C-4 shows four types of
pending reminders on the NERP system.
ERP for SME
File Common Sales Purchase Inventory Oroduction
Alert Detail Sales Quotation pending"afe SaQ-00004 Supplier Quotation pending are : PuS-00001 Purchase Order pending are : Pu0-00001 Raw Material Requisitign pencil-0 are,: 00Q-00005 OpQ-00006
Figure C-4 Pending reminder
Dynamic O. ROP and Inventory
1,4 NtA CUI1011, IIIVOIlt01 7 PI Ei
Raw Material
ID Name Unit Cost Qty on Order City on Hand ROP RaM-000131 Polyethylene Resin LB 1.013 0.00 354.00 18.00 4.03 RaM-00002 Fastener EA 0.25 12.00 270.00 12.00 3.00 RaM-00003 Fiberglass Roving KG 1.19 0.00 263.40 64.00 16.00 RaM-00004 Plastic Tube EA 4.75 0.00 295.00 26.00 8.00 RaM-00005 Tank, Base EA 0.43 0.00 285.00 66.00 16.00 RaM-00006 Pyrofill Fiber Carbon LB 0.85 0.00 299.85 49.00 12.00 RaM-00007 Hanging File Folder Pkg 1.75 0.00 370.00 149.00 35.00 RaM-00008 Plastic Drawer Labels EA 0.38 0.00 208.00 . 202.00 50.00 RaM-00009 Flanging Folder Bars EA 0.48 0.00 208.00 179.00 41.00
i RaM-0131310 File Folder Labels Box 0.39 0.00 185.00 223.00 54.00 RaM-00011 File Folders Box 0.16 0.00 105.00 348.00 82130 RaM-00012 Controlling Lock EA 1.33 0.00 277.00 54.00 13.00 1 RaM-00013 Lamp LA EA 29.05 0.00 268.00 45.00 10.00 RaM-00014 Base Assembly EA 16.35 0.00 268.00 61.00 15.00 RaM-00015 Finished Shaft EA 1.30 0.00 268.00 21.00 5 CO RaM-00016 3/8 Steel Tubing Inc 0.05 140.00 74.00 559.00 140.00 RaM-00017 6D Steel Plate EA 9.25 0.00 268.00 81.00 20.00 .„ I
.„-,..,,..u „ go,,,,,,,, -, .....nu move
tOlall 4 aillui ...,,, f '*• , ID 'Me cis Oty on Order Qty,ori Hand Oty on De... ?ROP 11
PrD-00001 TANK, 10X54, OH, S... Box 39.50 14.00 103.00 0.00 45.00 14.00 PrD-00002 Filling Cabinets Box 33.97 50.00 149.00 0.00 62.00 17.03 PrD-00C103 Lamp Box 116.45 48.00 41.00 0.00 24.00 7.00
II 111000000,1r 00001" pi 0„„ ull II
r„,,,,, _ 101.1011 1,0111„10140010 0 0 0 - 00,000001„0100000,00,004ir
----
_ .6.000,04 d 1 --- - tii T. 1
tx . Close
Figure C-5 Inventory status, ROP and Q*
Figure C-5 shows the information related to raw materials and products, including
the identification number, name, unit, initial cost, quantity on order, quantity on hand,
146
Reproduced with permission of the copyright owner. Further reproduction prohibited without permission.
pending the arrival of the raw materials, (4) Raw Material Requisition pending the
issuing of the raw material to the production department. Figure C-4 shows four types of
pending reminders on the NERP system.
ERP fo r SME
File Common Sales Purchase Inventory Production
Alert Detail jsiies Quotation ponding are : SaQ-00004 Supplier Quotation pending are : PuS-00001 Purchase Order pending ate : PuO-OOOOl
Material Requisition pending are : GpQ-00005 OpQ-OOOOd
Figure C-4 Pending reminder
Dynamic 0*. ROP and Inventory| .... . . ̂| ̂ - 1 [ | | |
- Raw Material
ID Name Unit Cost Qty on Order Qty on Hand Q* ROPI B ,
: RaM-00001 Polyethylene Resin LB 1.00 0.00 354.00 18.00 4.001 i -i RaM-00002 Fastener EA 0.25 12.00 270.00 12.00 3.00I RaM-00003 Fiberglass Roving KG 1.19 0.00 263.40 64:00 16.00! RaM-00004 Plastic Tube EA 4.75 0.00 295.00 26.00 8.00: RaM-00005 Tank, Base EA 0.43 0.00 285.00 66.00 16.00i RaM-00006 Pyrofill Fiber Carbon LB 0.85 0.00 299.85 49:00 12.00i RaM-00007 Hanqinq File Folder Pkg 1.7:5 : 0.00 370.00 149:00 35.00i RaM-00008 Plastic Drawer Labels EA : 0.38 0.00 208.00 202:00 50.00! RaM-00009 Hanging Folder Bars EA 0.48 0.00 208.00 179.00 41.00
RaM-Q001Q File Folder: Labels Box 0.39 0.00 185.00 223:00 54.00; RaM-00011 File Folders Box 0.16 0.00 185.00 348.00 82.00' RaM-00012 Controlling Lock EA 1.33 0.00 277.00 54,00 13.00s RaM-00013 Lamp LA EA 29.05 0'.00 268.00 45.00 10.00 *1 RaM-00014 B ase Assembly EA 16.35 0.00 268.00 61:00 15.00; RaM-00015 Finished Shaft EA 1.30 0.00 268.00 21.00 5.00I RaM-G0016 3/8 Steel Tubing Inc 0.05 140.00 74.00 559.00 140.00< RaM-00017 6D Steel Plate EA
..,,9.25 :: 0.00 268.00
.. ..........81.00 20.00
s ' " I
ID Name Unit Cost Qty on Order Qty on Hand Qty on De... Q* ROPi PrD-00001 TANK, 10X54, QH. S ... BOX: 39.50 14:00 103.00 0.00 45.00 14.00! PrD-00002 Filling Cabinets Box 33.97 50.00 149.00 ........... ;...0.00 62.00 17.00: PrD-00003 Lamp Box 116.45 48.00 41,00 0.00 24.00 7.00
Close |
Figure C-5 Inventory status, ROP and Q*
Figure C-5 shows the information related to raw materials and products, including
the identification number, name, unit, initial cost, quantity on order, quantity on hand,
146
Reproduced with permission of the copyright owner. Further reproduction prohibited without permission.
replenishment quantity (Q*), and reorder quantity point (ROP). The Q* and ROP have no
specific value, and the calculation is performed with the activities of the transactions. For
example, every time the raw materials are used for production, the Q* and ROP for those
raw materials will be recalculated. Then, an order of size Q* is placed when the available
inventory reaches the point ROP.
147
Reproduced with permission of the copyright owner. Further reproduction prohibited without permission.