conceptual hydrogeologic framework of the shallow aquifer
TRANSCRIPT

U.S. Department of the InteriorU.S. Geological Survey
Prepared in cooperation with
City of Virginia Beach, Department of Public Utilities
Conceptual Hydrogeologic Framework of the Shallow Aquifer System at Virginia Beach, VirginiaWater-Resources Investigations Report 01-4262

U.S. Department of the InteriorU.S. Geological Survey
Conceptual Hydrogeologic Framework of the Shallow Aquifer System at Virginia Beach, VirginiaBy Barry S. Smith and George E. Harlow, Jr.
Water-Resources Investigations Report 01-4262
Prepared in cooperation with
City of Virginia Beach, Department of Public Utilities
Richmond, Virginia2002
U.S. DEPARTMENT OF THE INTERIORGALE A. NORTON, Secretary
U.S. GEOLOGICAL SURVEYCharles G. Groat, Director
The use of trade or product names in this report is for identification purposes only and does not constitute endorsement by the U.S. Government.
For additional information write to: Copies of this report can be purchased from:
District Chief U.S. Geological SurveyU.S. Geological Survey Branch of Information Services1730 East Parham Road Box 25286, Federal CenterRichmond, VA 23228 Denver, CO [email protected]
Information about water resources in Virginia is available on the World Wide Web at http://va.water.usgs.gov

Abstract ................................................................................................................................................................................ 1Introduction .......................................................................................................................................................................... 1
Purpose and scope ...................................................................................................................................................... 2Description of the study area ...................................................................................................................................... 2Physiographic setting ................................................................................................................................................. 5Acknowledgments ...................................................................................................................................................... 5
Previous studies .................................................................................................................................................................... 5Methods of field investigation .............................................................................................................................................. 8
Collection of cores ..................................................................................................................................................... 10Construction of observation wells .............................................................................................................................. 10Collection of borehole geophysical logs .................................................................................................................... 10Geoprobes ................................................................................................................................................................... 10Collection and analyses of ground-water samples ..................................................................................................... 12
Analyses of cores, geophysical logs, and ground-water samples ......................................................................................... 12Oceana II .................................................................................................................................................................... 12Old Pungo Ferry Road ................................................................................................................................................ 13Blackwater Neighborhood Park ................................................................................................................................. 13Bellwood Estates Neighborhood Park ........................................................................................................................ 17Bayside High School .................................................................................................................................................. 17Lynnhaven Pump Station ............................................................................................................................................ 17Creeds Elementary School ......................................................................................................................................... 17Ground-water chemistry ............................................................................................................................................. 22
Conceptual hydrogeologic framework ................................................................................................................................. 23Columbia aquifer ........................................................................................................................................................ 23Yorktown confining unit ............................................................................................................................................. 26Yorktown-Eastover aquifer ......................................................................................................................................... 26
General conception of ground-water flow ............................................................................................................................ 27Future investigations of the shallow aquifer system ............................................................................................................ 28Summary and conclusions .................................................................................................................................................... 29References cited ................................................................................................................................................................... 31
FIGURES
1-3. Maps showing:1. Location and selected features of Virginia Beach, Virginia (study area) ......................................................... 32. Land use of Virginia Beach .............................................................................................................................. 43. Well, core hole, and geoprobe sites, Virginia Beach ........................................................................................ 9
4. Photograph showing core samples from Old Pungo Ferry Road site, Virginia Beach ............................................ 115-11. Diagrams showing core lithology and geophysical logs at:
5. Oceana II ........................................................................................................................................................... 146. Old Pungo Ferry Road ...................................................................................................................................... 157. Blackwater Neighborhood Park ........................................................................................................................ 168. Bellwood Estates Neighborhood Park .............................................................................................................. 189. Bayside High School ........................................................................................................................................ 19
10. Lynnhaven Pump Station .................................................................................................................................. 2011. Creeds Elementary School ................................................................................................................................ 21
12. Map showing surficial geology and geomorphic features at Virginia Beach .......................................................... 2513. Sketch showing conceptual model of the shallow aquifer system at Virginia Beach .............................................. 28
CONTENTS
Vertical datum: In this report, "sea level" refers to the National Geodetic Vertical Datum of 1929–a geodetic datum derived from a general adjustment of the first-order level nets of the United States and Canada, formerly called Sea Level Datum of 1929.
Abbreviated water-quality units: Chemical concentration is reported in milligrams per liter (mg/L) or micrograms per liter (µg/L). Milligrams per liter is a unit expressing the concentration of chemical constituents in solution as weight (milligrams) of solute per unit volume (liter) of water. One thousand micrograms per liter is equivalent to one milligram per liter. For concentrations less than 7,000 mg/L, the numerical value is the same as for concentrations in parts per million. Specific electrical conductance of water is reported in microsiemens per centimeter at 25 degrees Celsius (µS/cm).
Multiply By To obtain
Length
inch (in.) 25.4 millimeter
foot (ft) 0.3048 meter
mile (mi) 1.609 kilometer
Area
square foot (ft2) 0.09294 square meter
square mile (mi2) 2.590 square kilometer
Volume
gallon (gal) 3.785 liter
gallon (gal) 0.003785 cubic meter
million gallons per day (Mgal/d) 3,785 cubic meters per day
cubic foot (ft3) 0.028317 cubic meter
Flow
gallon per minute (gal/min) 0.06308 liter per second
gallon per day (gal/d) 0.003785 cubic meter per day
million gallons per day (Mgal/d) 0.04381 cubic meter per second
CONVERSION FACTORS, VERTICAL DATUM, AND ABBREVIATED WATER-QUALITY UNITS
TABLES
1. Land surface altitudes, well-screen depths, core-hole depths, and depths to water at core-hole sites in Virginia Beach, Virginia .......................................................................................................... 8
2. Land surface altitudes and geoprobe depths ............................................................................................................ 123. Concentrations of dissolved inorganic constituents in water from observation wells ............................................. 224. Age and geologic and hydrogeologic units of the shallow aquifer system .............................................................. 23
Conceptual Hydrogeologic Framework of the Shallow Aquifer System at Virginia Beach, VirginiaBy B. S. Smith and G. E. Harlow, Jr.
ABSTRACT
The hydrogeologic framework of the shal-low aquifer system at Virginia Beach was revised to provide a better understanding of the distri-bution of fresh ground water, its potential use, and its susceptibility to contamination. The revised conceptual framework is based primarily on analy-ses of continuous cores and downhole geophysical logs collected at 7 sites to depths of approximately 200 ft.
The shallow aquifer system at Virginia Beach is composed of the Columbia aquifer, the Yorktown confining unit, and the Yorktown-East-over aquifer. The shallow aquifer system is sepa-rated from deeper units by the continuous St. Marys confining unit.
The Columbia aquifer is defined as the pre-dominantly sandy surficial deposits above the Yorktown confining unit. The Yorktown confining unit is composed of a series of very fine sandy to silty clay units of various colors at or near the top of the Yorktown Formation. The Yorktown confin-ing unit varies in thickness and in composition, but on a regional scale is a leaky confining unit. The Yorktown-Eastover aquifer is defined as the pre-dominantly sandy deposits of the Yorktown For-mation and the upper part of the Eastover Formation above the confining clays of the St. Marys Formation. The limited areal extent of highly permeable deposits containing freshwater in the Yorktown-Eastover aquifer precludes the installation of highly productive freshwater wells over most of the city. Some deposits of biofrag-mental sand or shell hashes in the Yorktown-East-over aquifer can support high-capacity wells.
A water sample was collected from each of 10 wells installed at 5 of the 7 core sites to deter-mine the basic chemistry of the aquifer system. One shallow well and one deep well was installed
at each site. Concentrations of chloride were higher in the water from the deeper well at each site. Concentrations of dissolved iron in all of the water samples were higher than the U.S. Environ-mental Protection Agency Secondary Drinking Water Regulations. Concentrations of manganese and chloride were higher than the Secondary Drinking Water Regulations in samples from some wells.
In the humid climate of Virginia Beach, the periodic recharge of freshwater through the sand units of the shallow aquifer system occurs often enough to create a dynamic equilibrium whereby freshwater flows continually down and away from the center of the ridges to mix with and sweep brackish water and saltwater back toward the tidal rivers, bays, salt marshes, and the Atlantic Ocean.
The aquifers and confining units of the shal-low aquifer system at Virginia Beach are heteroge-neous, discontinuous, and without exact marker beds, which makes correlations in the study area difficult. Investigations using well cuttings, spot cores, or split-spoon samples with geophysical logs are not as definitive as continuous cores for determining or correlating hydrogeologic units. Future investigations of the shallow aquifer system would benefit by collecting continuous cores.
INTRODUCTION
The City of Virginia Beach has a growing popu-lation and a limited supply of freshwater. According to the 2000 U.S. census, the population of the city is about 425,000, reflecting an 8-percent growth rate since 1990. Most of the city’s drinking water, up to45 Mgal/d, is carried by pipelines from Lake Gaston more than 100 mi away through the Western Reservoir System, which is owned and operated by the City of Norfolk. Before the pipeline began supplying water in 1998, Virginia Beach purchased up to 30 Mgal/d from
6 Conceptual Hydrogeologic Framework of the Shallow Aquifer System at Virginia Beach, Virginia
the City of Norfolk (fig. 1). In fact, Virginia Beach has purchased drinking water from Norfolk since the early 1920’s.
The Lake Gaston pipeline supplies water to the northern half of Virginia Beach, but some northern neighborhoods still use ground water for lawn watering and the southern half of the city relies solely on ground water. Ground water is used at Virginia Beach for drinking water, irrigation, and heat pumps. Brackish water beneath Virginia Beach could also potentially be desalinated and used for such purposes. Because of concerns about the ground-water withdrawals and declining water levels in southeastern Virginia, the entire region, including Virginia Beach, was designated a Groundwater Management Area by the State in 1976 (Geraghty and Miller, 1979a, p. 32).
Domestic supplies of ground water are available from shallow depths at Virginia Beach, generally less than 200 ft deep. In some places, however, the taste of ground water is unpleasant to unpalatable because of naturally high concentrations of dissolved iron, manga-nese, and chloride. Contamination of the shallow aqui-fers is also possible from nitrates, pesticides, herbicides, fertilizers, heavy metals, and trace amounts of hydrocarbons or other toxic compounds (Betz-Con-verse-Murdoch, Inc., 1981, p. III-1). In some areas, thick and extensive sand deposits facilitate freshwater recharge to the shallow aquifers, but these deposits can also provide a pathway for contaminants.
The potential also exists for contamination of the shallow aquifers by upconing of brackish water or intrusion of saltwater. Most high production wells in and around Virginia Beach have a history of brackish-water upconing and increasing concentrations of chlo-ride with increased pumping rates (Geotrans, Inc., 1981, p. 13, and Leahy, 1986b, p. 3). Water from depths greater than approximately 200 ft is generally too saline to drink.
Virginia Beach has an interest in managing and protecting the limited supply of usable water in the shallow aquifers beneath the city. The U.S. Geological Survey (USGS), in cooperation with the City of Vir-ginia Beach, Department of Public Utilities, began an investigation of the shallow aquifer system in 1996. The objectives of the investigation are to characterize the shallow aquifer system beneath the city and to bet-ter understand the distribution of fresh ground water, its potential use, and its susceptibility to contamination (Johnson, 1999).
Purpose and scope
A revision of the conceptual hydrogeologic framework of the shallow aquifer system at Virginia Beach is presented in this report. This revised concep-tual framework is based primarily on analyses of con-tinuous cores and downhole geophysical logs collected at 7 sites to depths of approximately 200 ft. Ten obser-vation wells were installed at five of the seven sites. Samples of the water were collected from the observa-tion wells to determine ground-water chemistry. Rota-sonic drilling techniques were used to collect the core samples and to construct the wells. Geoprobe samples also were collected at 24 sites and used to select some of the sites for the deeper core holes. The revised hydrologic framework was also used along with infor-mation from previous investigations to describe a gen-eral conception of ground-water flow in the shallow aquifer system.
Description of the study area
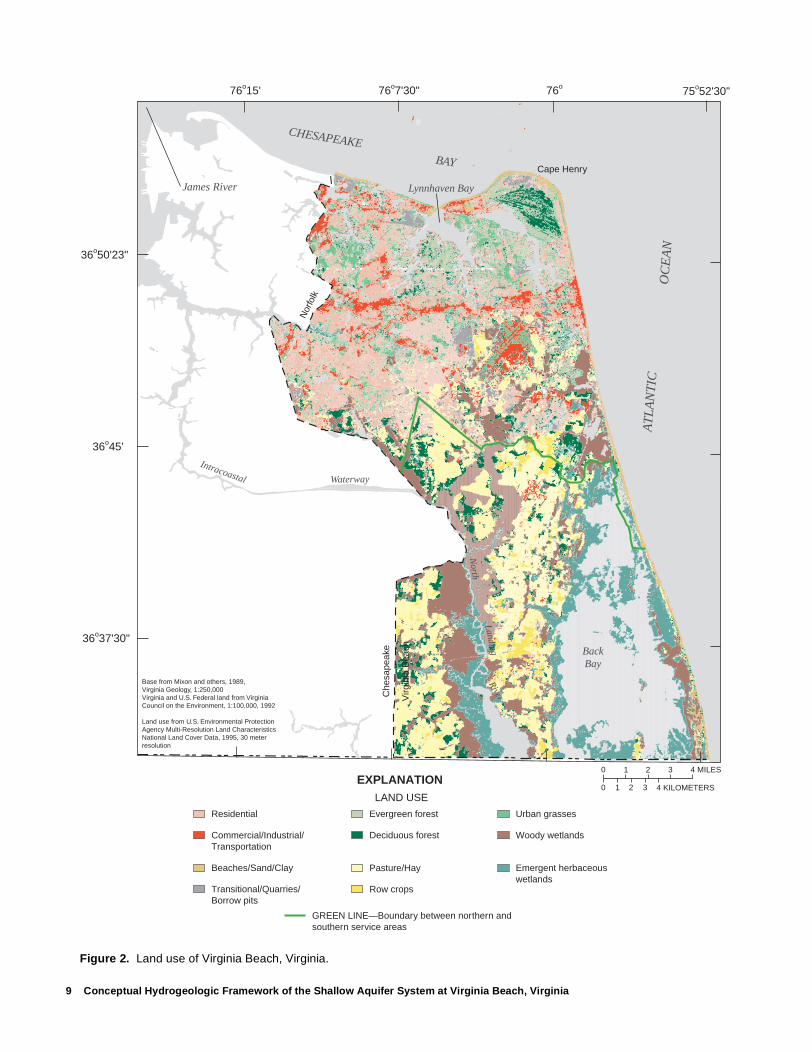
The City of Virginia Beach encompasses 312 mi2 of coastal lowlands and wetlands in southeastern Vir-ginia adjacent to the Atlantic Ocean and Chesapeake Bay (fig. 1). The city incorporated this area in 1963 when the resort community of Virginia Beach merged with the county of Princess Anne, Va. The cities of Norfolk and Chesapeake, Va. are immediately west of Virginia Beach, and Currituck County, N.C., is immediately south.
For planning purposes, Virginia Beach has been divided into northern and southern service areas. The “Green Line” marks the northern limit of the Transition Area between the northern and southern service areas. The Transition Area is intended for building of recre-ational sporting complexes, such as golf courses, lim-ited residential growth, and parks. The Green Line and the Transition Area were designated by the City Coun-cil and Planning Commission to manage growth in Vir-ginia Beach and to preserve the rural setting of the southern half of the city.
Land use in the northern service area of Virginia Beach is generally commercial, industrial, and residen-tial with a resident population of more than 430,000 (fig. 2). Virginia Beach also attracts more than 2 mil-lion tourists each year. Four major military bases and five major industrial and commercial centers are con-
Introduction 7

Introduction 8
CHESAPEAKE
BAY
AT
LA
NT
ICO
CE
AN
North
Intracoastal Waterway
LandingRiver
BackBay
0 1 2 3 4 MILES
0 1 2 3 4 KILOMETERS
Cape Henry
6
U.S. MILITARY INSTALLATIONTRANSITION AREA—Zoned for recreation, parks, and limited residential growth
EXPLANATION
VIRGINIA
5
7
8
Mackay Island National Wildlife Refuge
2
Lake Gaston
TRANSITION AREA
Che
sape
ake
Virg
inia
Bea
ch
3
4
1
1
Base from Mixon and others, 1989, Virginia Geology, 1:250,000Virginia and U.S. Federal land from Virginia Council on the Environment, 1:100,000, 1992
Seashore State Park
Back Bay National Wildlife Refuge
False Cape State Park
Naval Amphibious Base, Little Creek
Fort Story
Naval Air Station Oceana
Dam Neck Fleet Combat andTraining Center, Atlantic
1
2
3
4
VIRGINIA STATE PARK OR NATIONAL WILDLIFE REFUGE
5
6
7
8
GREEN LINE—Boundary between northern and southern service areas of Virginia Beach
NORTH CAROLINA
STUDYAREA
Western Reservoirs
Hampton Roads
Currituck County
Nor
folk
CO
AS
TAL
PLA
IN
36o37'30"
36o45'
36o50'23"
76o15' 76o7'30" 76o 75o52'30"
Trashmore II
Mount Trashmore
Lynnhaven BayJames River
60
64
64
13
60
264
Figure 1. Location and selected features of Virginia Beach, Virginia (study area).
9 Conceptual Hydrogeologic Framework of the Shallow Aquifer System at Virginia Beach, Virginia
Residential
Commercial/Industrial/Transportation
Beaches/Sand/Clay
Transitional/Quarries/Borrow pits
Evergreen forest
Deciduous forest
Pasture/Hay
Row crops
Urban grasses
Woody wetlands
Emergent herbaceouswetlands
0 1 2 3
0 1 2 3
4 MILES
4 KILOMETERSEXPLANATION
LAND USE
36o37'30"
36o45'
36o50'23"
76o15' 76o7'30" 76o 75o52'30"
CHESAPEAKE
BAY
AT
LA
NT
ICO
CE
AN
North
LandingRiverC
hesa
peak
e
Virg
inia
Bea
ch BackBay
Cape Henry
Base from Mixon and others, 1989, Virginia Geology, 1:250,000Virginia and U.S. Federal land from Virginia Council on the Environment, 1:100,000, 1992
Land use from U.S. Environmental ProtectionAgency Multi-Resolution Land Characteristics National Land Cover Data, 1995, 30 meter resolution
Lynnhaven Bay
GREEN LINE—Boundary between northern and southern service areas
Intracoastal Waterway
James River
Nor
folk
Figure 2. Land use of Virginia Beach, Virginia.
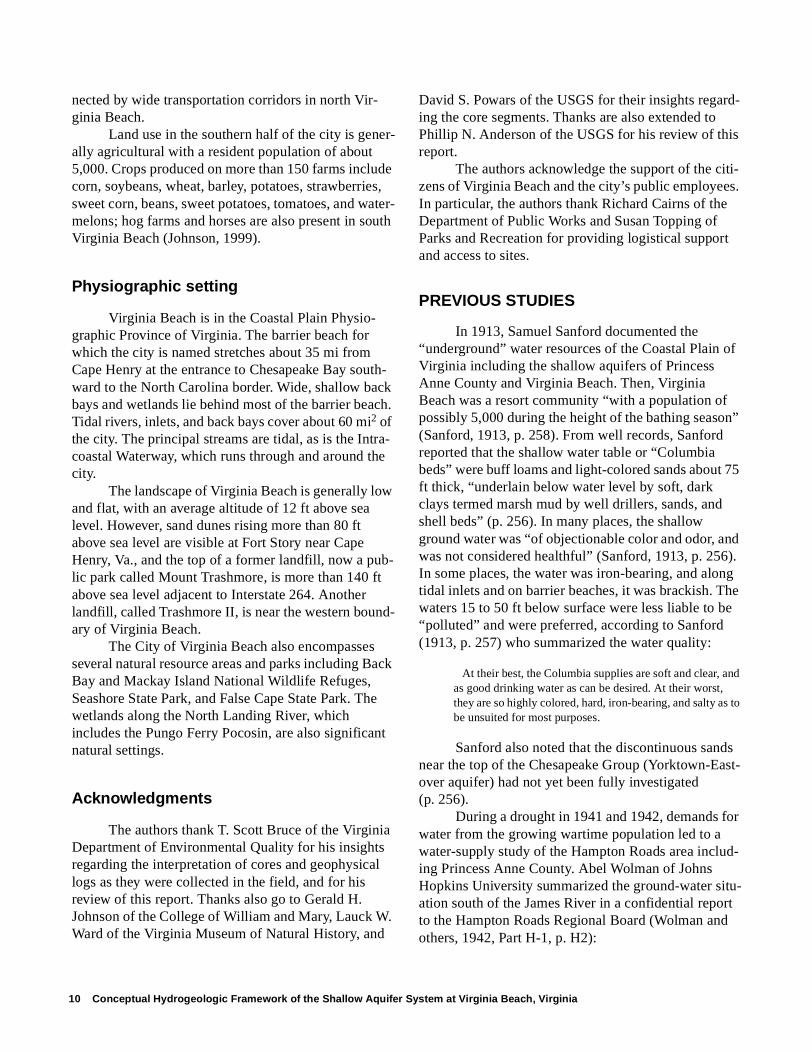
nected by wide transportation corridors in north Vir-ginia Beach.
Land use in the southern half of the city is gener-ally agricultural with a resident population of about 5,000. Crops produced on more than 150 farms include corn, soybeans, wheat, barley, potatoes, strawberries, sweet corn, beans, sweet potatoes, tomatoes, and water-melons; hog farms and horses are also present in south Virginia Beach (Johnson, 1999).
Physiographic setting
Virginia Beach is in the Coastal Plain Physio-graphic Province of Virginia. The barrier beach for which the city is named stretches about 35 mi from Cape Henry at the entrance to Chesapeake Bay south-ward to the North Carolina border. Wide, shallow back bays and wetlands lie behind most of the barrier beach. Tidal rivers, inlets, and back bays cover about 60 mi2 of the city. The principal streams are tidal, as is the Intra-coastal Waterway, which runs through and around the city.
The landscape of Virginia Beach is generally low and flat, with an average altitude of 12 ft above sea level. However, sand dunes rising more than 80 ft above sea level are visible at Fort Story near Cape Henry, Va., and the top of a former landfill, now a pub-lic park called Mount Trashmore, is more than 140 ft above sea level adjacent to Interstate 264. Another landfill, called Trashmore II, is near the western bound-ary of Virginia Beach.
The City of Virginia Beach also encompasses several natural resource areas and parks including Back Bay and Mackay Island National Wildlife Refuges, Seashore State Park, and False Cape State Park. The wetlands along the North Landing River, which includes the Pungo Ferry Pocosin, are also significant natural settings.
Acknowledgments
The authors thank T. Scott Bruce of the Virginia Department of Environmental Quality for his insights regarding the interpretation of cores and geophysical logs as they were collected in the field, and for his review of this report. Thanks also go to Gerald H. Johnson of the College of William and Mary, Lauck W. Ward of the Virginia Museum of Natural History, and
David S. Powars of the USGS for their insights regard-ing the core segments. Thanks are also extended to Phillip N. Anderson of the USGS for his review of this report.
The authors acknowledge the support of the citi-zens of Virginia Beach and the city’s public employees. In particular, the authors thank Richard Cairns of the Department of Public Works and Susan Topping of Parks and Recreation for providing logistical support and access to sites.
PREVIOUS STUDIES
In 1913, Samuel Sanford documented the “underground” water resources of the Coastal Plain of Virginia including the shallow aquifers of Princess Anne County and Virginia Beach. Then, Virginia Beach was a resort community “with a population of possibly 5,000 during the height of the bathing season” (Sanford, 1913, p. 258). From well records, Sanford reported that the shallow water table or “Columbia beds” were buff loams and light-colored sands about 75 ft thick, “underlain below water level by soft, dark clays termed marsh mud by well drillers, sands, and shell beds” (p. 256). In many places, the shallow ground water was “of objectionable color and odor, and was not considered healthful” (Sanford, 1913, p. 256). In some places, the water was iron-bearing, and along tidal inlets and on barrier beaches, it was brackish. The waters 15 to 50 ft below surface were less liable to be “polluted” and were preferred, according to Sanford (1913, p. 257) who summarized the water quality:
At their best, the Columbia supplies are soft and clear, and as good drinking water as can be desired. At their worst, they are so highly colored, hard, iron-bearing, and salty as to be unsuited for most purposes.
Sanford also noted that the discontinuous sands near the top of the Chesapeake Group (Yorktown-East-over aquifer) had not yet been fully investigated (p. 256).
During a drought in 1941 and 1942, demands for water from the growing wartime population led to a water-supply study of the Hampton Roads area includ-ing Princess Anne County. Abel Wolman of Johns Hopkins University summarized the ground-water situ-ation south of the James River in a confidential report to the Hampton Roads Regional Board (Wolman and others, 1942, Part H-1, p. H2):
10 Conceptual Hydrogeologic Framework of the Shallow Aquifer System at Virginia Beach, Virginia
The possibilities for developing shallow ground waters appear to be limited to relatively insignificant amounts by the nature of the soil and topography. Infiltration of water falling on the surface is hindered in many places by shallow layers of tight soils, and collection of ground water from extensive catchment surfaces is impossible because of the flatness of the terrain and limited depth of the permeable materials. In many places the shallow water is high in iron and sulphur.
Deep ground waters are more abundant but so highly mineralized in most localities that they are not as satisfactory as surface waters for municipal supplies.
In 1945, D.J. Cederstrom described the geology and ground-water resources of the Coastal Plain in southeastern Virginia including municipal water sup-plies of Princess Anne County (p. 357):
Lake Smith and other small lakes in northwestern Princess Anne County furnish 6,000,000 to 8,000,000 gallons of water a day to the city of Norfolk. The treatment plant which handles this water is also located in Princess Anne County, 3 miles southwest of Lake Smith.
Virginia Beach is furnished with surface water from the municipal supply of Norfolk, and several smaller communities between Norfolk and Virginia Beach, [such] as Oceana and Lynnhaven, also use this supply.
Cederstom (1945) described “batteries” of small-diameter wells tapping the shallow sand dunes and the terrace (Pleistocene) deposits at various places in the county. He also noted that very little was known about the strata at depths greater than 100 ft below the sur-face, but that a few wells in Princess Anne County obtained water from Miocene deposits. He reported that water-bearing deposits were present throughout the county, but that they were patchy in distribution and that it was frequently necessary to drill in two or more places before a successful well could be completed (p. 359-363).
Geraghty and Miller, Inc. (1978, p. 12) defined three principal water-bearing units for Virginia Beach on the basis of readily available data: the water-table aquifer (mostly Columbia group), the shallow confined Yorktown aquifer (Upper part of the Yorktown Form-ation), and the Lower Cretaceous (Potomac group) or deep confined aquifer. The aquifers were believed to be more or less hydraulically interconnected and to com-prise a leaky-aquifer system, with the Lower Creta-ceous aquifer exhibiting the most confinement (p. 11). Fresh ground water was reported to extend from near land surface to depths of about 100 to 150 ft in the
Yorktown aquifer (p. 28). Several private water compa-nies and the City of Virginia Beach supplied some ground water locally from small, scattered well fields (p. 1). Water quality in the Lower Cretaceous was reported to be brackish to salty, and only one active industrial well was reported to pump water from the Lower Cretaceous aquifer in the City of Virginia Beach, and that water was brackish (p. 12).
In 1978, Geraghty and Miller, Inc. investigated the availability of ground water in the Southeast Vir-ginia Groundwater Management Area, which includes Virginia Beach, for the Virginia State Water Study Commission. The “Water-Table Aquifer” (Columbia) and “Upper Artesian Aquifer System” (Yorktown-East-over aquifer) were not being used, except in the eastern part of the management area, according to Geraghty and Miller, Inc. (1979a, p. 41-42), where the aquifers were used mostly for individual domestic supplies and watering of lawns (p. A-14). Fresh ground water was reported in the western half of the management area, but a wedge of natural saltwater was indicated at shal-low depths beneath the cities of Chesapeake and Vir-ginia Beach (Geraghty and Miller, Inc., 1979a, p. A-9 and A-10).
Geraghty and Miller, Inc. (1979b, p. 1) evaluated the Yorktown (-Eastover) aquifer by testing the Pem-broke well field for the City of Virginia Beach. They concluded that the aquifer was semi-confined and leaky at Pembroke and that existing pump rates at the well field should not be altered because of the potential for upconing of brackish water (p. 5 and 35).
Following a drought in 1980 and 1981, Betz-Converse-Murdoch, Inc. (1981, p. III-1) indicated suit-able supplies of water from the “Upper Yorktown aqui-fer” at some locations in Virginia Beach. However, problems with finding supplies of ground water large enough to support the needs of the city were noted (p. IV-7):
Water bearing strata in the Yorktown can be correlated over distances of several miles on the basis of electric logs. The composition and water yielding capacity of the water bearing zones of the Yorktown, however, vary significantly from one site to another. Ten fold decreases in permeability of a water bearing zone within a horizontal distance of several hundred feet are common. The limited areal extent of highly permeable, water yielding beds of the Yorktown precludes the development of large, productive well fields over much of the City.
Salt water occurs at depths ranging from less than 100 feet in some areas to about 200 feet in other areas. This salt water is the chief limitation on the amount of water that can
Previous Studies 11
be withdrawn from wells tapping beds of sand in the Yorktown. The Yorktown formation can be developed as a long term source of fresh water if withdrawal rates are limited in a manner that prevents upconing of salt water from underlying strata or lateral intrusion of salt water from adjacent water bodies. Upconing as a result of excessive withdrawal rates from wells has occurred at several locations in the City.
Geotrans, Inc. (1981, p. 12 and 13) used solute-transport simulations to analyze four aquifer-test sites for the City of Virginia Beach. The sites had fair to poor potential for supplying water to individual wells because of the risk of upconing of brackish water, even at small pumping rates. Increases in chloride in some of the “deeper” wells that had been observed during the aquifer tests, however, probably were not the result of upconing but possibly were from clay deposits within the aquifer (p. 19).
In 1981, the Virginia Water Control Board pre-sented an overview of the ground-water resources of the Four Cities area (Norfolk, Portsmouth, Chesapeake, and Virginia Beach) on the basis of previous reports and data from research wells (Siudyla and others, 1981, p. 5). A water-table aquifer and three somewhat contin-uous sand and shell beds in the Yorktown-Eastover aquifer system were defined using geophysical and geologic logs (pls. 4-8). However, the thickness, per-meability, and coarseness of the three sand units were reported to vary considerably from one data point to another (p. 27).
Leahy (1986a, p. 9 and 10) reported the failure of a number of shallow private wells near Lynnhaven Bay following a particularly dry spring and summer in 1985. Leahy (1986b, p. 44) also summarized the poten-tial for desalting brackish water and seawater for the Hampton Roads area and the City of Virginia Beach. By analyzing projected average costs for finished water from 1990 to 2030, he showed that desalting brackish water and seawater would be more expensive in the long term for Virginia Beach than constructing a pipe-line to Lake Gaston (p. 43).
Meng and Harsh (1988, p. C52) defined the Columbia aquifer of the Virginia Coastal Plain as the sandy surficial deposits of mostly Pleistocene and Holocene age above the Yorktown confining unit. The Yorktown confining unit was defined as a series of coa-lescing clay layers at or near the top of the Yorktown Formation (p. C51). The Yorktown-Eastover aquifer was defined as the predominantly sandy deposits of the Yorktown Formation and the upper part of the Eastover
Formation above the confining clays of the St. Marys Formation (p. C50).
Hamilton and Larson (1988, p. 4) analyzed the aquifer systems of southeastern Virginia by use of a three-dimensional, digital ground-water flow model. They reported vertical recharge to the Yorktown-East-over aquifer beneath the higher ground of Virginia Beach, but upward discharge from the aquifer beneath the low areas, back bays, and off shore (fig. 74). They also showed some areas in and near Virginia Beach where ground-water discharge to the water-table aqui-fer was reduced because of local pumping (fig. 66) and noted that saline water probably began infiltrating the shallow confined aquifers offshore beneath the Atlantic Ocean, Chesapeake Bay, and the James River estuary in the 1950’s (p. 169).
Harsh and Laczniak (1990, p. F4) described the hydrogeologic units of the Coastal Plain of Virginia and analyzed ground-water flow in the region and adja-cent parts of North Carolina by use of a three-dimen-sional, digital ground-water flow model. They showed downward flow of ground water into the Yorktown-Eastover aquifer in the northern parts of Virginia Beach and upward flow from the Yorktown-Eastover in most of the southern parts prior to pumping (fig. 41). Pump-ing simulated for 1980 indicated downward flow into the Yorktown Eastover aquifer where it had been upward prior to pumping in a small area of the south-western part of Virginia Beach (fig. 63).
Poag and others (1994, p. 691) presented seismic profiles and core deposits indicating a buried, peak-ring impact crater beneath the Chesapeake Bay and sur-rounding area, which includes the northern limits of Virginia Beach. The buried crater is 50 to 55 mi in diameter and more than 1 mi deep. The impact of an asteroid or comet had penetrated upper Eocene sedi-ments, Cretaceous deposits, and the bedrock beneath what is now the mouth of the Chesapeake Bay.
Johnson and others (1998, p. 509) observed cross-bedded biofragmental sands in the Yorktown and Chowan River Formations dipping away from the edge of the Chesapeake Bay impact crater in southeastern Virginia. They surmised that such depositional struc-tures were the result of differential compaction during rotation of the underlying slump blocks.
As part of the National Water-Quality Assess-ment (NAWQA) Program, Spruill and others (1998, p. 24) analyzed the ground-water chemistry of the shal-low aquifers in the southern watersheds of Virginia Beach, which drain into the Albemarle-Pamlico Drain-
12 Conceptual Hydrogeologic Framework of the Shallow Aquifer System at Virginia Beach, Virginia
age Basin. They indicated that concentrations of dis-solved solids under the urban area of the southern watersheds of Virginia Beach were ranked greater than the 75th percentile of the national average (p. 24-25).
After the discovery of the Chesapeake Bay impact crater, Powars (2000, p. 4) refined the geologic framework of southeastern Virginia. He indicated that the Yorktown, Eastover, and St. Marys Formations were continuous across the region, but that the Chowan River Formation was not extensive in Virginia (p. 37). Powars also correlated the geologic units to the hydro-geology south of the James River in three core holes, which showed the need for further refinements of the hydrogeologic framework. He indicated that the Columbia aquifer of previous investigators was in the Tabb and Yorktown Formations in the core holes near Virginia Beach, and that the Calvert confining unit of Hamilton and Larson (1988) is predominantly within the St. Marys Formation (Powars, 2000, p. 42).
METHODS OF FIELD INVESTIGATION
Continuous cores and geophysical logs were col-lected from seven sites in Virginia Beach during April and May 2000 (fig. 3). These sites were selected to investigate the variable lithology and hydrology of the
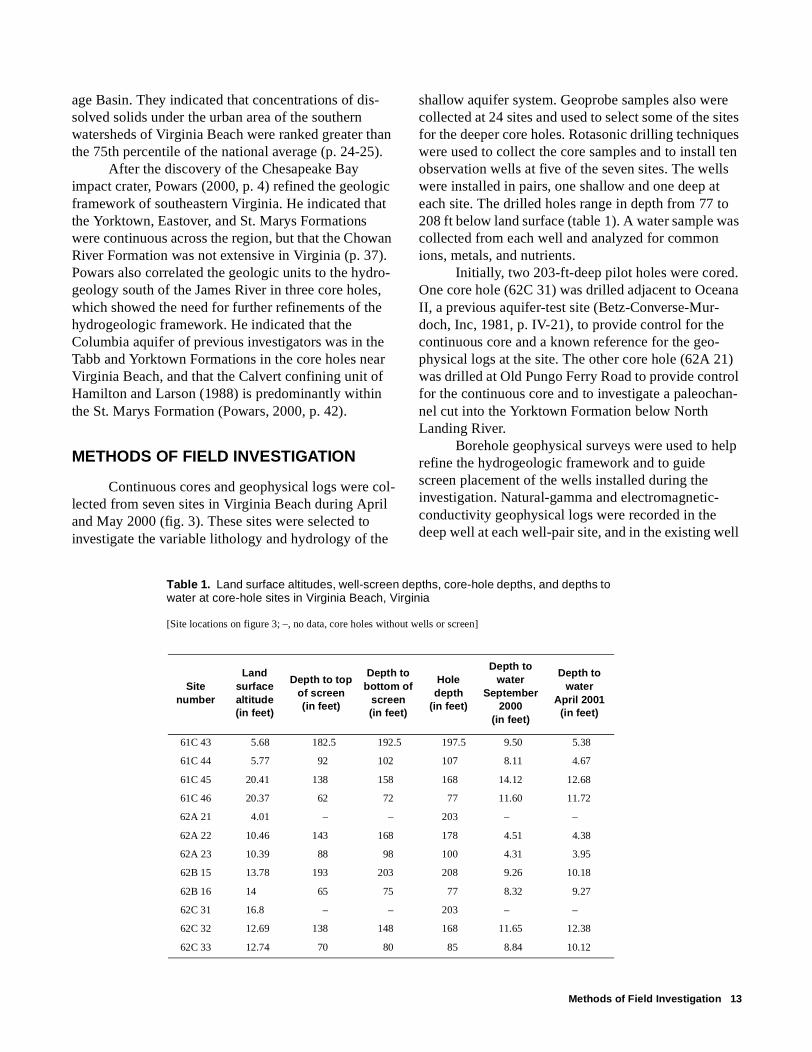
shallow aquifer system. Geoprobe samples also were collected at 24 sites and used to select some of the sites for the deeper core holes. Rotasonic drilling techniques were used to collect the core samples and to install ten observation wells at five of the seven sites. The wells were installed in pairs, one shallow and one deep at each site. The drilled holes range in depth from 77 to 208 ft below land surface (table 1). A water sample was collected from each well and analyzed for common ions, metals, and nutrients.
Initially, two 203-ft-deep pilot holes were cored. One core hole (62C 31) was drilled adjacent to Oceana II, a previous aquifer-test site (Betz-Converse-Mur-doch, Inc, 1981, p. IV-21), to provide control for the continuous core and a known reference for the geo-physical logs at the site. The other core hole (62A 21) was drilled at Old Pungo Ferry Road to provide control for the continuous core and to investigate a paleochan-nel cut into the Yorktown Formation below North Landing River.
Borehole geophysical surveys were used to help refine the hydrogeologic framework and to guide screen placement of the wells installed during the investigation. Natural-gamma and electromagnetic-conductivity geophysical logs were recorded in the deep well at each well-pair site, and in the existing well
Methods of Field Investigation 13
Sitenumber
Landsurfacealtitude(in feet)
Depth to topof screen(in feet)
Depth to bottom of
screen(in feet)
Holedepth
(in feet)
Depth to water
September 2000
(in feet)
Depth to water
April 2001(in feet)
61C 43 5.68 182.5 192.5 197.5 9.50 5.38
61C 44 5.77 92 102 107 8.11 4.67
61C 45 20.41 138 158 168 14.12 12.68
61C 46 20.37 62 72 77 11.60 11.72
62A 21 4.01 – – 203 – –
62A 22 10.46 143 168 178 4.51 4.38
62A 23 10.39 88 98 100 4.31 3.95
62B 15 13.78 193 203 208 9.26 10.18
62B 16 14 65 75 77 8.32 9.27
62C 31 16.8 – – 203 – –
62C 32 12.69 138 148 168 11.65 12.38
62C 33 12.74 70 80 85 8.84 10.12
Table 1. Land surface altitudes, well-screen depths, core-hole depths, and depths to water at core-hole sites in Virginia Beach, Virginia
[Site locations on figure 3; –, no data, core holes without wells or screen]

Methods of Field Investigation 14
EXPLANATION
CHESAPEAKE
BAY
AT
LA
NT
ICO
CE
AN
North
LandingRiver
BackBay
Lynnhaven Bay
61C4561C46
61C4361C44
62C3262C33
62B1562B16
62A2262A23
62A2262A23
62C31
GEOPROBE SITE AND NUMBER
WELL PAIR, CORE, AND GEOPHYSICALLOG SITE AND NUMBERS
CORE HOLE SITE AND NUMBER
0 1 2 3 4 MILES
0 1 2 3 4 KILOMETERS
62C31
62A21
61C37
61D761D8 62D11
62D12 62D13
61C36
62C16
61C35
62C19
62D16
62D14
62C1762D15
62C18
61C39
61C41
61C40
63B1
62B10
62A18
62A19
62A20
61C38
61D8
60
64
64
13
60
264
Intracoastal Waterway
36o37'30"
36o45'
36o50'23"
76o15' 76o7'30" 76o 75o52'30"
Che
sape
ake
Virg
inia
Bea
ch
Currituck County
Nor
folk
James River
Base from Mixon and others, 1989, Virginia Geology, 1:250,000
Figure 3. Well, core hole, and geoprobe sites, Virginia Beach, Virginia.

adjacent to the Oceana II core hole. A natural-gamma geophysical log was recorded through the drill stem at the Old Pungo Ferry Road corehole prior to abandon-ment of the hole.
Collection of cores
Rotary-vibratory (Rotasonic) drilling techniques were used to collect the continuous cores and to con-struct observation wells for this investigation. The Rotasonic technique employs simultaneous high-fre-quency vibrations and low speed rotational motion cou-pled with downward pressure to advance the bit of a circular drill string. This method produces a uniform borehole and relatively continuous, undisturbed core samples. The drill rig uses a dual wall system, advan-cing a 4-in core barrel for sampling and an 8-in outer casing for the construction of the wells.
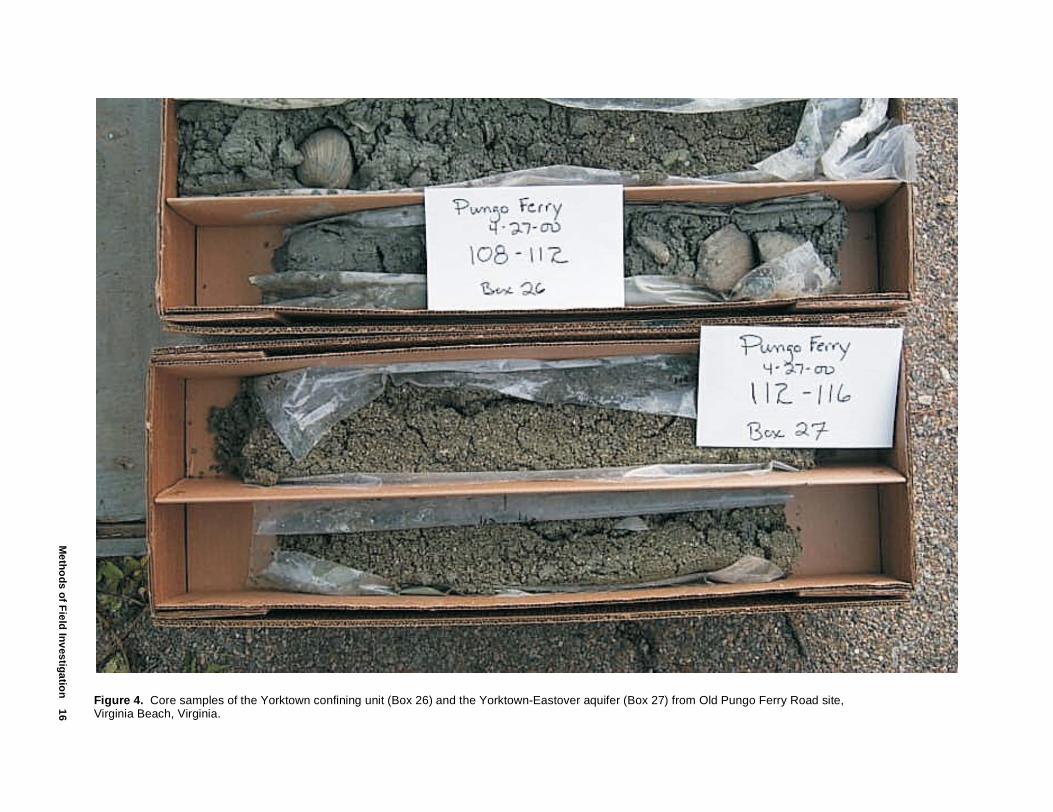
The core barrel was advanced ahead of the outer casing and the continuous core was collected in up to 20-ft segments. The core samples were taken directly from the core barrel attached to the end of the drill string and extruded into plastic sleeves. USGS person-nel used a hand lens, a Munsell color chart, and a grain-size comparison chart to make detailed lithologic descriptions of the cores at the site. The core samples were cut, placed in 2-ft-long core boxes, labeled, and photographed (fig. 4). The boxed cores were taken to the USGS office in Richmond, Va., for storage and sub-sequent mineralogical and stratigraphic analyses.
Construction of observation wells
The observation wells were constructed of 4-in inside diameter polyvinyl chloride (PVC) schedule 40 casings set to various depths (table 1). Well screens of 0.020-in slots were set and sand filter packs were installed in the annulus around the screens. The remainder of the annulus was then sealed with bento-nite pellets and bentonite grout to land surface. Cement pads and steel protector pipes were installed around the wells at ground level except at one site, where manhole covers were installed over the wells cut level to the ground. The altitude of each well was surveyed and water levels were measured and recorded.
Collection of borehole geophysical logs
Natural-gamma logs were recorded at seven sites and electromagnetic-conductivity logs were recorded at six of the sites. Natural-gamma logs measure the amount of gross radioactive decay associated with the radioisotopes (primarily potassium-40 and the daughter products of the uranium and thorium-decay series) found in sediments and rocks (Keys and MacCary, 1971, p. 64). Potassium is abundant in feldspars and micas, which decompose readily to clay. Clays can also concentrate the heavy radioactive elements through ion-exchange and absorption (p. 65). Natural-gamma radiation thus tends to be higher (log deflection to the right) in fine-grained sediments such as silt and clay than in quartz sands or carbonates. An increase in gamma radiation in the geophysical logs is commonly interpreted as a clayey or silty (possibly confining) unit.
Electromagnetic-conductivity logs measure the natural conductivity and the resistance to conductivity of the sediments and the fluid within the sediments (Keys and MacCary, 1971, p. 23). Permeable sediments with freshwater tend to have low conductivity (log deflection to the left) and high resistance (log deflec-tion to the right), whereas sediments with little water or with saline water tend to have high conductivity and low resistance. Apparent conductivity (AP) is an inte-gration of the “true” electromagnetic conductivities that are measured at a smaller scale. Where the “true” electromagnetic conductivities are uniform in the sub-surface, apparent conductivity is equal to the true con-ductivity.
Geoprobes
Soil and near-surface sediments were sampled by a 2-in-diameter geoprobe in June 1999. The geoprobe is a direct-push coring device that advances steel pipe into the subsurface to obtain samples. Geoprobe sam-ples were collected from numerous horizons at 24 sites (fig. 3). The samples were analyzed and described on site and then transported to the USGS office in Rich-mond for analysis and storage. The samples were used to select some sites for the deeper core holes but were generally not deep enough to penetrate the unit con-tacts of the shallow aquifer system. The depths pene-trated by the geoprobes varied from 36 to 94 ft below the ground surface (table 2).
Methods of Field Investigation 15
Meth
od
s of F
ield In
vestigatio
n16
Figure 4. Core samples of the Yorktown confining unit (Box 26) and the Yorktown-Eastover aquifer (Box 27) from Old Pungo Ferry Road site, Virginia Beach, Virginia.

Site number
Land surfacealtitude(in feet)
Depth below land surface
(in feet)
61C 35 12 84.0
61C 36 14 65.5
61C 37 22 70.0
61C 38 6 80.0
61C 39 7 94.0
61C 40 16 55.0
61C 41 17 84.2
61D 7 23 71.0
61D 8 6 63.0
62A 18 7 54.0
62A 19 3 50.0
62A 20 12 52.0
62B 10 2 48.0
62C 16 14 54.5
62C 17 10 52.5
62C 18 18 84.0
62C 19 7 64.0
62D 11 12 57.0
62D 12 15 75.0
62D 13 7 56.0
62D 14 12 68.5
62D 15 12 78.0
62D 16 14 61.0
63B 1 2 36.0
Table 2. Land surface altitudes and geoprobe depths at Virginia Beach, Virginia
[Site locations figure 3]
Collection and analyses of ground-water samples
Water samples were collected in August 2000 from 10 wells installed at 5 of the 7 sites to determine the basic chemical quality of ground water in the shal-low aquifer system. A replicate and a blank sample was collected at one site to provide quality-assurance and quality-control checks. Sample bottles were packed in ice and shipped to the National Water Quality Labora-tory of the USGS in Arvada, Colo., for the determina-tions. Standard methods of the USGS were used to construct the wells, collect the water-quality samples (Lapham and others, 1997, p. 18 and 33), and to deter-
17 Conceptual Hydrogeologic Framework of the Shallow Aquifer S
mine the basic chemical substances in the water (Fish-man and Freidman, eds., 1989).
ANALYSES OF CORES, GEOPHYSICAL LOGS, AND GROUND-WATER SAMPLES
Analyses of the cores, geophysical logs, and ground-water samples indicate that the shallow aquifer system is composed of the Columbia aquifer, the York-town confining unit, and the Yorktown-Eastover aqui-fer. This conceptual hydrogeologic framework is based primarily on analyses of continuous cores and down-hole geophysical logs.
Some previous investigations had delineated three somewhat continuous confined aquifers for the Yorktown-Eastover in southeastern Virginia including Virginia Beach. These units were called the upper, mid-dle, and lower Yorktown-Eastover aquifers. Several attempts were made to define similar continuous units in the present study, but the efforts failed. The continu-ous cores, in particular, showed that the composition of the aquifers and confining units change, in some places considerably, over short distances. A revised hydrogeo-logic framework was needed, and thus a revised con-ceptual hydrogeologic framework was devised for the shallow aquifer system. One confined Yorktown-Easto-ver aquifer was defined, and the sand units previously mapped as the upper and middle Yorktown-Eastover aquifers were considered local, discontinuous units within the more continuous but leaky Yorktown confin-ing unit.
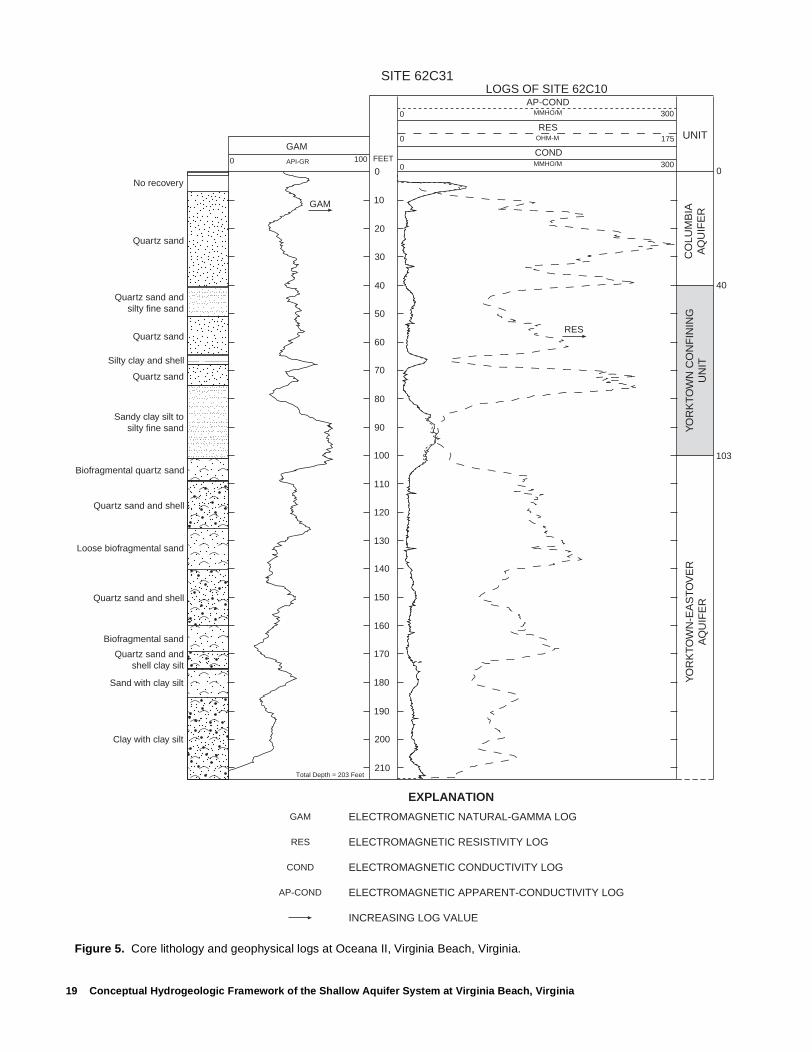
Oceana II
Core hole 62C 31 was drilled adjacent to Oceana II, a previous aquifer-test site (Betz-Converse-Mur-doch, Inc, 1981, p. IV-21), to provide control for the continuous core and a known reference for the geo-physical logs at the site. The geophysical logs and geol-ogists’ descriptions of units encountered at Oceana II were similar to previous descriptions with one excep-tion. The continuous core (62C 31) revealed that some of the sand deposits at depths from 101 to 170 ft were composed of fauna fragments (biofragmental sand), whereas silty fine to medium to coarse sand with some shells had been reported at those depths previously (62C 22). Another report described only sand and silt units at the Oceana II site (Geotrans, Inc. 1981, app. 1,
ystem at Virginia Beach, Virginia
p. 1-1). The biofragmental sands were the coarsest grained sediments encountered by the continuous cor-ing. Such medium- to coarse-grained biofragmental sands indicate the occurrence of more permeable units than previously described.
The hydrogeologic units interpreted from the continuous core and the geophysical logs at Oceana II were the Columbia aquifer, the Yorktown confining unit, and the Yorktown-Eastover aquifer (fig. 5). The Columbia, a very fine to very coarse grained quartz sand, is indicated in the core to a depth of 40 ft. High resistivity and low electrical conductivity also indicate an aquifer extending to a depth of 40 ft.
The Yorktown confining unit is indicated by gen-erally low resistivity and high gamma readings from a depth of 40 to 103 ft. Interbeds of very fine to fine grained silty sand were cored from 41 to 51 ft, silty clay to clay silt with shells from 64 to 68 ft, and a quartz sand horizon from 68 to 80 ft. A micaceous, sandy clay silt and silty fine sand containing 10 percent glauconite or phosphate produced the lowest resistivity and highest gamma readings in the hole from 80 to 103 ft.
The confined Yorktown-Eastover aquifer is indi-cated by generally high resistivity and low gamma readings from 103 to the bottom of the hole at 210 ft. The unit is composed of interbedded biofragmental sand and very fine to fine grained quartz sand with shells. Clay silt interbeds from 168 ft to the bottom of the hole may form a local confining unit. Generally, the upper part of the aquifer is coarser grained than the lower part.
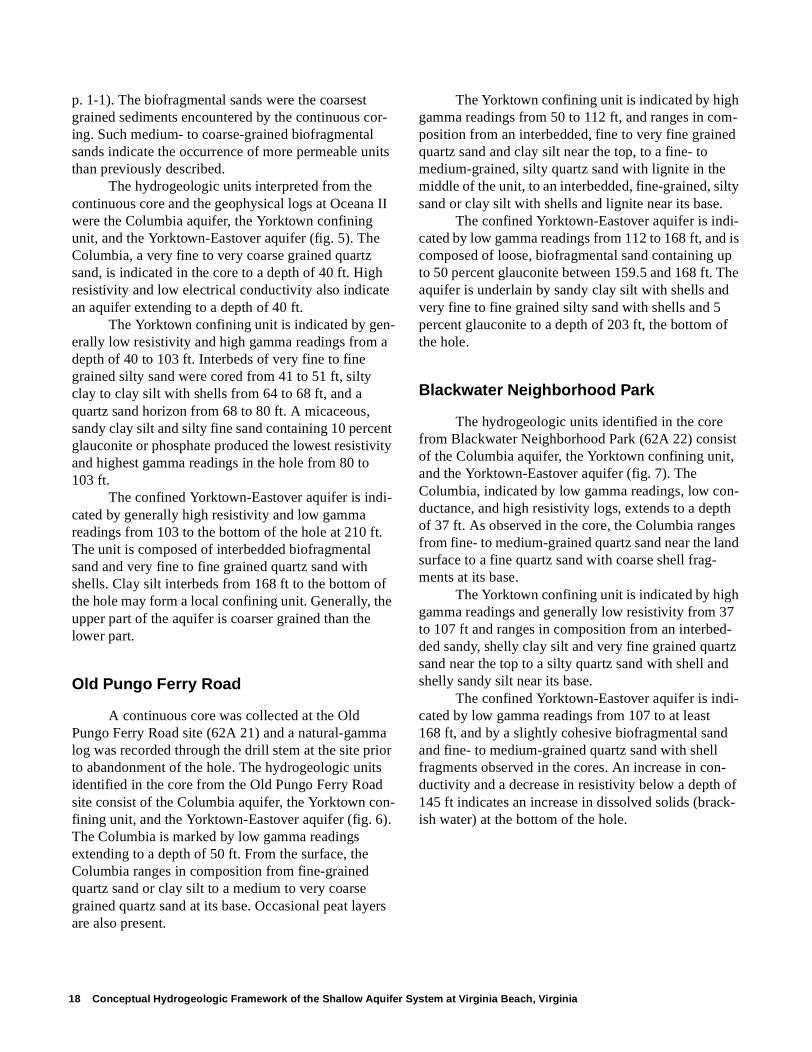
Old Pungo Ferry Road
A continuous core was collected at the Old Pungo Ferry Road site (62A 21) and a natural-gamma log was recorded through the drill stem at the site prior to abandonment of the hole. The hydrogeologic units identified in the core from the Old Pungo Ferry Road site consist of the Columbia aquifer, the Yorktown con-fining unit, and the Yorktown-Eastover aquifer (fig. 6). The Columbia is marked by low gamma readings extending to a depth of 50 ft. From the surface, the Columbia ranges in composition from fine-grained quartz sand or clay silt to a medium to very coarse grained quartz sand at its base. Occasional peat layers are also present.
The Yorktown confining unit is indicated by high gamma readings from 50 to 112 ft, and ranges in com-position from an interbedded, fine to very fine grained quartz sand and clay silt near the top, to a fine- to medium-grained, silty quartz sand with lignite in the middle of the unit, to an interbedded, fine-grained, silty sand or clay silt with shells and lignite near its base.
The confined Yorktown-Eastover aquifer is indi-cated by low gamma readings from 112 to 168 ft, and is composed of loose, biofragmental sand containing up to 50 percent glauconite between 159.5 and 168 ft. The aquifer is underlain by sandy clay silt with shells and very fine to fine grained silty sand with shells and 5 percent glauconite to a depth of 203 ft, the bottom of the hole.
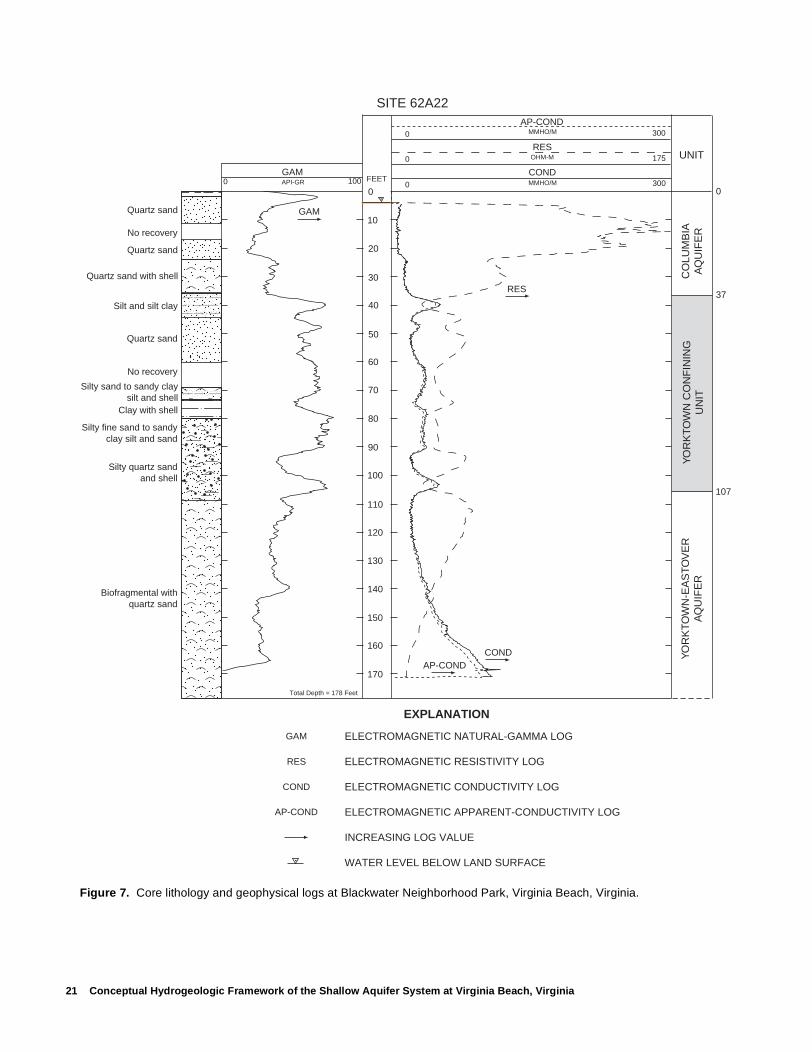
Blackwater Neighborhood Park
The hydrogeologic units identified in the core from Blackwater Neighborhood Park (62A 22) consist of the Columbia aquifer, the Yorktown confining unit, and the Yorktown-Eastover aquifer (fig. 7). The Columbia, indicated by low gamma readings, low con-ductance, and high resistivity logs, extends to a depth of 37 ft. As observed in the core, the Columbia ranges from fine- to medium-grained quartz sand near the land surface to a fine quartz sand with coarse shell frag-ments at its base.
The Yorktown confining unit is indicated by high gamma readings and generally low resistivity from 37 to 107 ft and ranges in composition from an interbed-ded sandy, shelly clay silt and very fine grained quartz sand near the top to a silty quartz sand with shell and shelly sandy silt near its base.
The confined Yorktown-Eastover aquifer is indi-cated by low gamma readings from 107 to at least 168 ft, and by a slightly cohesive biofragmental sand and fine- to medium-grained quartz sand with shell fragments observed in the cores. An increase in con-ductivity and a decrease in resistivity below a depth of 145 ft indicates an increase in dissolved solids (brack-ish water) at the bottom of the hole.
18 Conceptual Hydrogeologic Framework of the Shallow Aquifer System at Virginia Beach, Virginia
19 Conceptual Hydrogeologic Framework of the Shallow Aquifer System at Virginia Beach, Virginia
GAM
GAM
COND
RES
AP-COND
0 100
0
0
0
175
300
300
RES
GAM
COND
RES
AP-COND
ELECTROMAGNETIC NATURAL-GAMMA LOG
ELECTROMAGNETIC RESISTIVITY LOG
ELECTROMAGNETIC CONDUCTIVITY LOG
ELECTROMAGNETIC APPARENT-CONDUCTIVITY LOG
INCREASING LOG VALUE
EXPLANATION
Quartz sand
No recovery
Quartz sand
Quartz sand andsilty fine sand
Silty clay and shell
Quartz sand
Clay with clay silt
Sand with clay silt
Quartz sand andshell clay silt
Biofragmental sand
Quartz sand and shell
Loose biofragmental sand
Quartz sand and shell
Biofragmental quartz sand
Sandy clay silt tosilty fine sand
UNIT
CO
LUM
BIA
AQ
UIF
ER
YO
RK
TOW
N C
ON
FIN
ING
UN
ITY
OR
KTO
WN
-EA
STO
VE
RA
QU
IFE
R
103
40
0
LOGS OF SITE 62C10SITE 62C31
FEET
10
130
150
140
120
110
100
90
160
60
50
40
30
20
70
80
0
170
180
190
200
210Total Depth = 203 Feet
API-GR
MMHO/M
MMHO/M
OHM-M
Figure 5. Core lithology and geophysical logs at Oceana II, Virginia Beach, Virginia.

Analyses of Cores, Geophysical Logs, and Ground-Water Samples 20
GAM
GAM
0 100
GAM ELECTROMAGNETIC NATURAL-GAMMA LOG
INCREASING LOG VALUE
EXPLANATION
Road fill
Quartz sand
Quartz sand
Clay silt
Peat quartz sand
Quartz sand
Silty fine quartzsand and clay silt
Silty finequartz sand
Silty fine sandand shell
Silty fine sand,clay silt and shells
Loose biofragmental sand
Sandy clay silt and shell
SITE 62A21
UNIT
CO
LUM
BIA
AQ
UIF
ER
YO
RK
TOW
N C
ON
FIN
ING
UN
ITY
OR
KTO
WN
-EA
STO
VE
RA
QU
IFE
R
112
50
0FEET
10
130
150
140
120
110
100
90
160
170
180
60
50
40
30
20
70
80
0
Total Depth = 23 Feet
Figure 6. Core lithology and geophysical logs at Old Pungo Ferry Road, Virginia Beach, Virginia.
21 Conceptual Hydrogeologic Framework of the Shallow Aquifer System at Virginia Beach, Virginia
GAM
GAM
0 100COND
RES
AP-COND
0
0
0 175
300
300
AP-COND
RES
GAM
COND
RES
AP-COND
ELECTROMAGNETIC NATURAL-GAMMA LOG
ELECTROMAGNETIC RESISTIVITY LOG
ELECTROMAGNETIC CONDUCTIVITY LOG
ELECTROMAGNETIC APPARENT-CONDUCTIVITY LOG
INCREASING LOG VALUE
WATER LEVEL BELOW LAND SURFACE
EXPLANATION
COND
Silty fine sand to sandyclay silt and sand
Silty quartz sandand shell
Biofragmental withquartz sand
Quartz sand
No recovery
No recovery
Quartz sand
Quartz sand with shell
Silt and silt clay
Quartz sand
Silty sand to sandy claysilt and shell
Clay with shell
UNIT
CO
LUM
BIA
AQ
UIF
ER
YO
RK
TOW
N C
ON
FIN
ING
UN
ITY
OR
KTO
WN
-EA
STO
VE
RA
QU
IFE
R
107
37
0
SITE 62A22
FEET
10
130
150
140
120
110
100
90
160
170
60
50
40
30
20
70
80
0API-GR
MMHO/M
MMHO/M
OHM-M
Total Depth = 178 Feet
Figure 7. Core lithology and geophysical logs at Blackwater Neighborhood Park, Virginia Beach, Virginia.
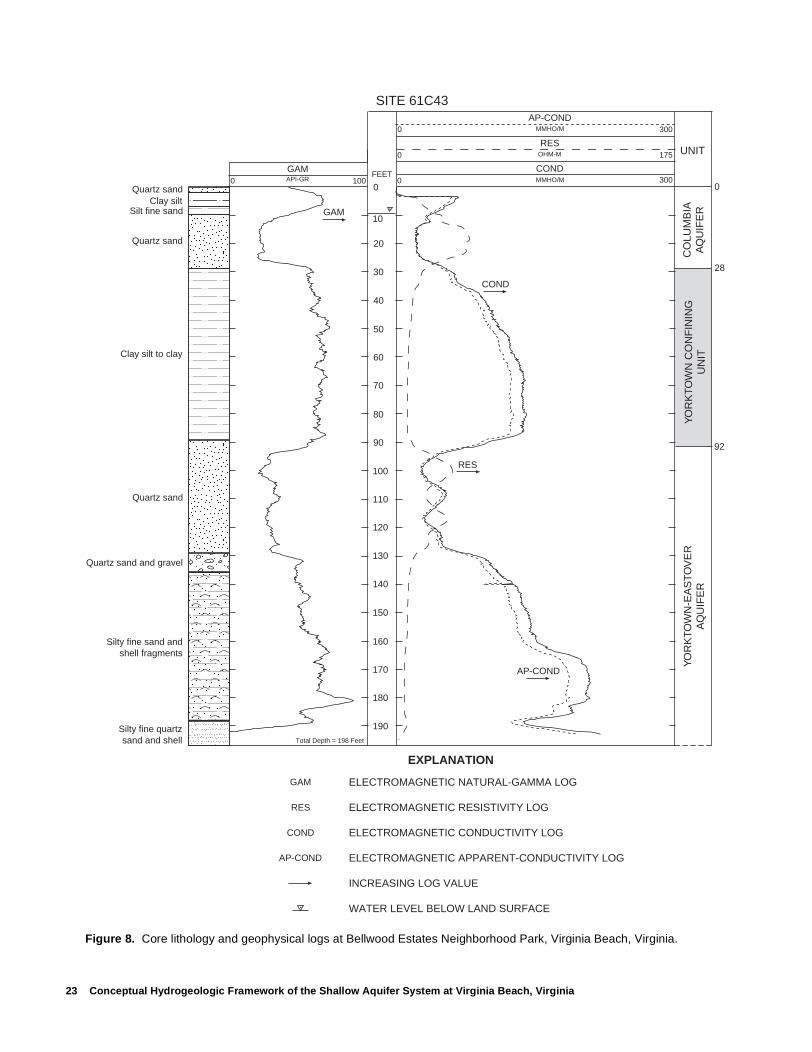
Bellwood Estates Neighborhood Park
The hydrogeologic units identified in the core from Bellwood Estates Neighborhood Park (61C 43) consist of the Columbia aquifer, the Yorktown confin-ing unit, and the Yorktown-Eastover aquifer (fig. 8). The Columbia is indicated by low gamma, low conduc-tance, and high resistivity readings from about 10 ft to 28 ft. Observation of the cores revealed a fine-grained quartz sand near the surface underlain by about 8 ft of clay silt and silty fine sand, and a fine- to coarse- grained, clean quartz sand with shell fragments at the base of the Columbia.
The Yorktown confining unit is indicated by high gamma, low conductance, and high resistivity readings from 28 to 92 ft. The cores revealed clay silt to clay near the top (28 to 65 ft), to predominantly clay at its base (65 to 89.5 ft). The unit is pyritic throughout, lig-nitic near its base, and is the tightest (least permeable) confining unit encountered during the investigation.
The confined Yorktown-Eastover aquifer is indi-cated by low gamma, high conductivity, and low resis-tivity logs from 92 to 135 ft, and is composed of fine- to medium-grained quartz sand and some gravel (128 to 135 ft). The aquifer is underlain by silty fine quartz sand with shells and sandy clay silt with high gamma, low resistivity, and generally increasing conductance to a depth of a little more than 190 ft.
Bayside High School
The hydrogeologic units identified in the core from Bayside High School (61C 45) consist of the Columbia aquifer, the Yorktown confining unit, and the Yorktown-Eastover aquifer (fig. 9). The Columbia is indicated by low gamma, low conductivity, and high resistivity readings extending to a depth of 40 ft and is composed of fine-grained, slightly silty to coarse-grained quartz sand. Trace heavy minerals are present in the upper 20 ft and limonite concretions are in the core from 16 to 19 ft.
The Yorktown confining unit at Bayside High School is not as well defined as at other core sites. The confining unit is interpreted as the sequence from 40 to 115 ft and ranges in composition from very fine to fine grained quartz sand, clay silt, and micaceous clay silt with lignite (40 to 70 ft), to very fine to fine grained silty sand with shells at the base of the unit (72 to 115 ft). Interbedded clay silt and wood occur between
40 and 46 ft and 57 to 62 ft. A sand bed composed of medium to coarse quartz sand within the confining unit was identified from a depth of approximately 62 to 72 ft.
The confined Yorktown-Eastover aquifer is indi-cated by the generally low gamma and high resistivity readings from 115 to 167 ft, and is predominantly com-posed of biofragmental sand and occasional shelly quartz sands. The aquifer is underlain by silty, shelly sand containing 10 to 15 percent botryoidal glauconite to a depth of 168 ft (the depth of the core hole).
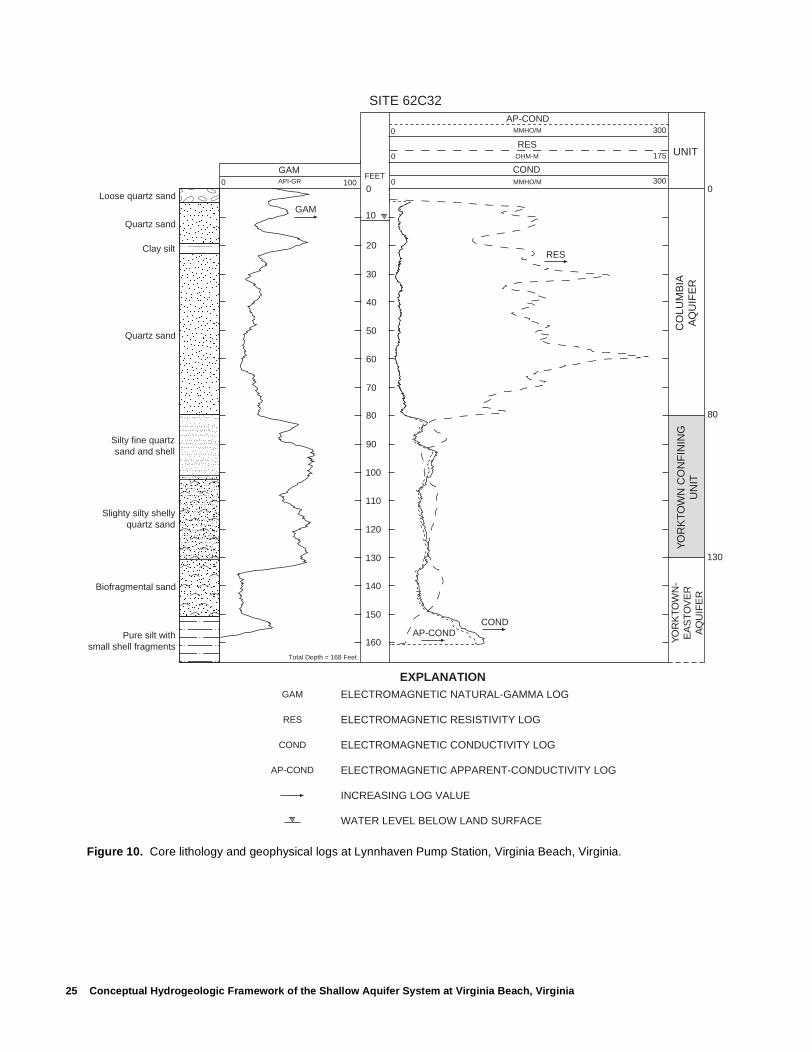
Lynnhaven Pump Station
The hydrogeologic units identified in the core from Lynnhaven Pump Station Site (62C32) consist of the Columbia aquifer, the Yorktown confining unit, and the Yorktown-Eastover aquifer (fig. 10). The Columbia is indicated by low gamma, low conductivity, and high resistivity readings to a depth of 80 ft. Fine- to coarse-grained quartz sand was revealed generally in the core. Trace heavy minerals are present in both the upper and lower parts of the unit.
The Yorktown confining unit was recorded as high gamma, high conductivity, and low resistivity from 80 to 130 ft, and the core revealed that the unit ranges in composition from fine-grained, silty quartz sand with shells and sandy clay silt with shells near the top of the unit (80 to 104 ft), to fine-grained shelly quartz sand and fine to very fine grained, silty, shelly quartz sand near the bottom of the unit (104 to 130 ft).
The confined Yorktown-Eastover aquifer is recorded as low gamma readings from 130 to 152 ft, and is predominantly composed of very coarse, bio-fragmental sand. The aquifer is underlain by pure silt containing very small shell fragments to the bottom of the core, a depth of 168 ft.
Creeds Elementary School
The hydrogeologic units identified in the core from Creeds Elementary School (62B 15) consist of the Columbia aquifer—indicated by low gamma, low con-ductance, and high resistivity readings to a depth of 53 ft (fig. 11)—and the underlying Yorktown confining unit. The Yorktown confining unit is indicated by gen-erally higher gamma, higher conductivity, and lower resistivity readings to a depth of at least 130 ft and pos-
22 Conceptual Hydrogeologic Framework of the Shallow Aquifer System at Virginia Beach, Virginia
23 Conceptual Hydrogeologic Framework of the Shallow Aquifer System at Virginia Beach, Virginia
GAM
GAM
COND
RES
AP-COND
0 100 0
0
0 175
300
300
COND
RES
GAM
COND
RES
AP-COND
ELECTROMAGNETIC NATURAL-GAMMA LOG
ELECTROMAGNETIC RESISTIVITY LOG
ELECTROMAGNETIC CONDUCTIVITY LOG
ELECTROMAGNETIC APPARENT-CONDUCTIVITY LOG
INCREASING LOG VALUE
WATER LEVEL BELOW LAND SURFACE
EXPLANATION
AP-COND
Quartz sandClay silt
Silt fine sand
Quartz sand
Clay silt to clay
Quartz sand
Quartz sand and gravel
Silty fine sand andshell fragments
Silty fine quartzsand and shell
SITE 61C43
UNIT
CO
LUM
BIA
AQ
UIF
ER
YO
RK
TOW
N C
ON
FIN
ING
UN
ITY
OR
KTO
WN
-EA
STO
VE
RA
QU
IFE
R
92
28
0FEET
10
130
150
140
120
110
100
90
160
60
50
40
30
20
70
80
0
170
180
190
Total Depth = 198 Feet
API-GR
MMHO/M
MMHO/M
OHM-M
Figure 8. Core lithology and geophysical logs at Bellwood Estates Neighborhood Park, Virginia Beach, Virginia.

Analyses of Cores, Geophysical Logs, and Ground-Water Samples 24
FEETGAM
GAM
COND
RES
AP-COND
0 100 0
0
0 175
300
300
COND
RES
Quartz sand
Slighty siltyquartz sand
No recovery
No recovery
No recovery
Quartz sand
Silt clay and wood
Quartz sand withsilt interbeds
Silty fine sand andshell fragments
Silty fine sandand shell
Biofragmental sand
Biofragmental sand
Biofragmental sand
Biofragmental sand
Shelly quartz sand
Slightly silty biofragmental
Quartz sand
SITE 61C45
GAM
COND
RES
AP-COND
ELECTROMAGNETIC NATURAL-GAMMA LOG
ELECTROMAGNETIC RESISTIVITY LOG
ELECTROMAGNETIC CONDUCTIVITY LOG
ELECTROMAGNETIC APPARENT-CONDUCTIVITY LOG
INCREASING LOG VALUE
WATER LEVEL BELOW LAND SURFACE
EXPLANATION
UNIT
CO
LUM
BIA
AQ
UIF
ER
YO
RK
TOW
N C
ON
FIN
ING
UN
ITY
OR
KTO
WN
-EA
STO
VE
RA
QU
IFE
R
115
40
0
10
130
150
140
120
110
100
90
160
60
50
40
30
20
70
80
0API-GR
MMHO/M
MMHO/M
OHM-M
Total Depth = 168 Feet
sand
Figure 9. Core lithology and geophysical logs at Bayside High School, Virginia Beach, Virginia.
25 Conceptual Hydrogeologic Framework of the Shallow Aquifer System at Virginia Beach, Virginia
GAM
GAM
COND
RES
AP-COND
0 100 0
0
0 175
300
300
COND
RES
GAM
COND
RES
AP-COND
ELECTROMAGNETIC NATURAL-GAMMA LOG
ELECTROMAGNETIC RESISTIVITY LOG
ELECTROMAGNETIC CONDUCTIVITY LOG
ELECTROMAGNETIC APPARENT-CONDUCTIVITY LOG
INCREASING LOG VALUE
WATER LEVEL BELOW LAND SURFACE
EXPLANATION
AP-COND
Slighty silty shellyquartz sand
Biofragmental sand
Pure silt withsmall shell fragments
SITE 62C32
Loose quartz sand
Quartz sand
Quartz sand
Clay silt
Silty fine quartzsand and shell
UNIT
CO
LUM
BIA
AQ
UIF
ER
YO
RK
TOW
N C
ON
FIN
ING
UN
IT
YO
RK
TOW
N-
EA
STO
VE
RA
QU
IFE
R
130
80
0API-GR
MMHO/M
MMHO/M
OHM-M
FEET
10
130
150
140
120
110
100
90
160
60
50
40
30
20
70
80
0
Total Depth = 168 Feet
Figure 10. Core lithology and geophysical logs at Lynnhaven Pump Station, Virginia Beach, Virginia.

Analyses of Cores, Geophysical Logs, and Ground-Water Samples 26
GAM
GAM
COND
RES
AP-COND
0 100 0
0
0 175
300
300
RES
COND
AP-COND
GAM
COND
RES
AP-COND
ELECTROMAGNETIC NATURAL-GAMMA LOG
ELECTROMAGNETIC RESISTIVITY LOG
ELECTROMAGNETIC CONDUCTIVITY LOG
ELECTROMAGNETIC APPARENT-CONDUCTIVITY LOG
INCREASING LOG VALUE
WATER LEVEL BELOW LAND SURFACE
EXPLANATION
Quartz sand
Coarse sand and shell
Slighty silty fine quartzsand and shell
Glauconitic clay siltto silty clay
Silty fine sandto clay silt and shell
Quartz sand and shell
Sandy clay silt and shell
Quartz sand
Quartz sand and clay silt
Quartz sand with shell
SITE 62B15
UNIT
CO
LUM
BIA
AQ
UIF
ER
YO
RK
TOW
N C
ON
FIN
ING
UN
IT
53
0API-GR
MMHO/M
MMHO/M
OHM-M
Total Depth = 208 Feet
FEET
10
130
150
140
120
110
100
90
160
60
50
40
30
20
70
80
0
170
180
190
200
Figure 11. Core lithology and geophysical logs at Creeds Elementary School, Virginia Beach, Virginia.
sibly continuing to the bottom of the core at 208 ft. The core revealed that the composition of the Columbia aquifer ranges from fine- to medium-grained sand with trace heavy minerals to coarse sand and shells with 10 percent heavy minerals at its base.
The Yorktown confining unit ranges in composi-tion from an interbedded, very fine grained quartz sand and sandy clay silt near the top, to a silty fine sand with shells in the middle of the unit, to a clayey silt to silty clay encountered at the bottom of the core hole. A bed of medium to coarse quartz sand within the confining unit was encountered from a depth of approximately 60 to 70 ft.
The biofragmental sand unit that distinctly marked the Yorktown-Eastover aquifer at some loca-tions in the study area was not encountered within a depth of 208 ft at this site. The biofragmental sand, however, was evident at the nearby sites of Old Pungo Ferry Road (62A 21) and Blackwater Park (62A 22). The sands that comprise the Yorktown-Eastover aquifer could be deeper at Creeds than elsewhere; or alterna-tively, a facies change has occurred and no aquifer of any significance is to be found in the immediate vicin-ity of Creeds. Increasing conductance and decreasing resistivity below 130 ft indicate the presence of saline water in the unit.
Ground-water chemistry
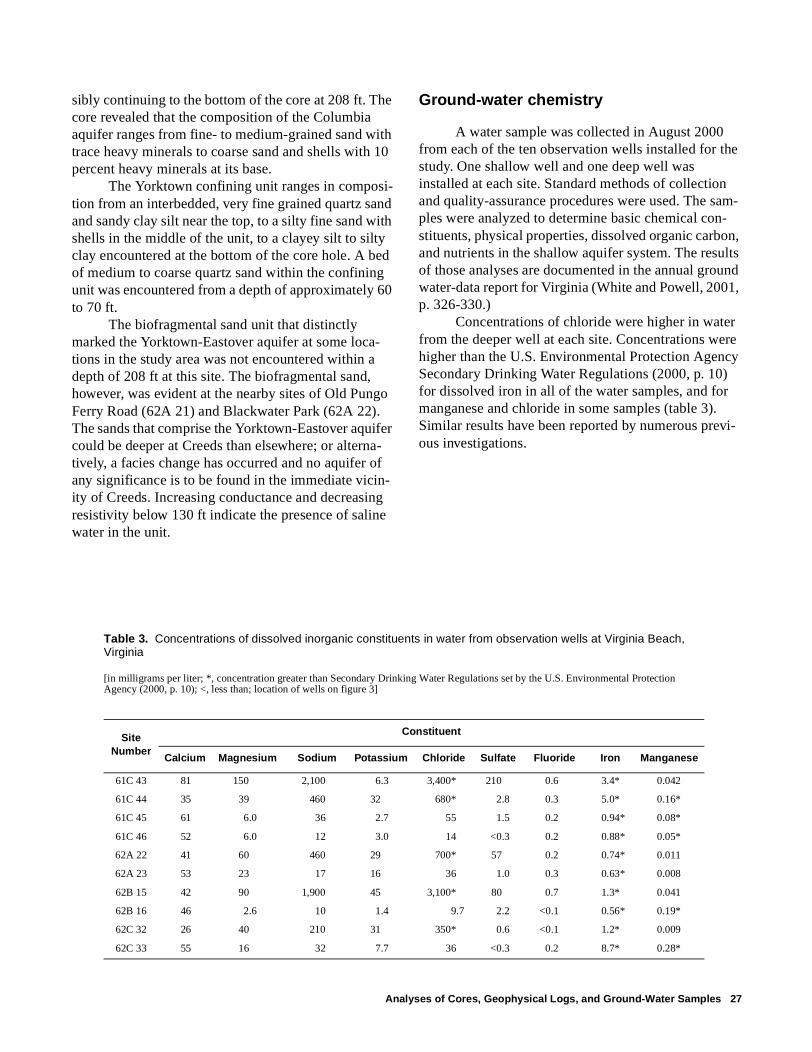
A water sample was collected in August 2000 from each of the ten observation wells installed for the study. One shallow well and one deep well was installed at each site. Standard methods of collection and quality-assurance procedures were used. The sam-ples were analyzed to determine basic chemical con-stituents, physical properties, dissolved organic carbon, and nutrients in the shallow aquifer system. The results of those analyses are documented in the annual ground water-data report for Virginia (White and Powell, 2001, p. 326-330.)
Concentrations of chloride were higher in water from the deeper well at each site. Concentrations were higher than the U.S. Environmental Protection Agency Secondary Drinking Water Regulations (2000, p. 10) for dissolved iron in all of the water samples, and for manganese and chloride in some samples (table 3). Similar results have been reported by numerous previ-ous investigations.
Analyses of Cores, Geophysical Logs, and Ground-Water Samples 27
SiteNumber
Constituent
Calcium Magnesium Sodium Potassium Chloride Sulfate Fluoride Iron Manganese
61C 43 81 150 2,100 6.3 3,400* 210 0.6 3.4* 0.042
61C 44 35 39 460 32 680* 2.8 0.3 5.0* 0.16*
61C 45 61 6.0 36 2.7 55 1.5 0.2 0.94* 0.08*
61C 46 52 6.0 12 3.0 14 <0.3 0.2 0.88* 0.05*
62A 22 41 60 460 29 700* 57 0.2 0.74* 0.011
62A 23 53 23 17 16 36 1.0 0.3 0.63* 0.008
62B 15 42 90 1,900 45 3,100* 80 0.7 1.3* 0.041
62B 16 46 2.6 10 1.4 9.7 2.2 <0.1 0.56* 0.19*
62C 32 26 40 210 31 350* 0.6 <0.1 1.2* 0.009
62C 33 55 16 32 7.7 36 <0.3 0.2 8.7* 0.28*
Table 3. Concentrations of dissolved inorganic constituents in water from observation wells at Virginia Beach, Virginia
[in milligrams per liter; *, concentration greater than Secondary Drinking Water Regulations set by the U.S. Environmental Protection Agency (2000, p. 10); <, less than; location of wells on figure 3]

CONCEPTUAL HYDROGEOLOGIC FRAMEWORK
The conceptual hydrogeologic framework of the shallow aquifer system at Virginia Beach was revised from previous interpretations. The shallow aquifer sys-tem is composed of the Columbia aquifer, the York-town confining unit, and the Yorktown-Eastover aquifer (table 4). These units are separated from deeper units by the relatively thick (up to 330 ft in places) and continuous St. Marys confining unit (Powars, 2000, p. 37). The St. Marys confining unit is defined predom-inantly by clays of the St. Marys Formation, but in places also includes clays of the overlying Eastover Formation (Meng and Harsh, 1988, p. C50). The St. Marys Formation is composed of mostly muddy, very
fine sand and sandy clay and silt deposits of marine ori-gin (Powars, 2000, p. 37).
Columbia aquifer
The Columbia aquifer of the Virginia Coastal Plain is defined as the predominantly sandy surficial deposits above the Yorktown confining unit (Meng and Harsh, 1988, p. C52). The Columbia sediments are, for the most part, Holocene (post-glacial) and Pleistocene (glacial and interglacial) in age but can also include sandy sediments of Pliocene age above the Yorktown confining unit.
The Holocene sediments have been deposited in the estuaries, swamps, marshes, rivers, and on the river-banks, stream banks, dunes, and shorelines since the
28 Conceptual Hydrogeologic Framework of the Shallow Aquifer System at Virginia Beach, Virginia
Series Geologic unit1
Hydrogeologic unit
Holocene
Pleistocene
Pliocene
Chowan River Formation
Tabb Formation
Post-glacial deposits
Miocene
Yorktown Formation
Eastover Formation
St. Marys Formation
Yorktown confining unit
Yorktown-Eastover aquifer
St. Marys confining unit
Columbia aquifer
1 From Powars (2000, p. 39-42)
Table 4. Age and geologic and hydrogeologic units of the shallow aquifer system at Virginia Beach, Virginia

end of the last major glacial advance about 11,500 years ago. Before then, Pleistocene sediments were deposited in similar coastal settings, primarily during marine transgressions as the continental ice sheets melted and during high stands of the ancient seas of the Late Pleistocene (Peebles and others, 1984, p. 20).
The Pleistocene deposits of the Tabb Formation form the landscape of Virginia Beach as well as the greater part of the water-table aquifers (fig. 12). The Tabb has been divided from youngest to oldest into the Poquoson, Lynnhaven, and Sedgefield Members (Johnson and Berquist, 1989, p. 16). The Poquoson Member forms the east side of Pungo Ridge just west of the Back Bay of Virginia Beach from sea level to about 11 ft above sea level (Mixon and others, 1989, sheet 1). It is a gray, medium to coarse, pebbly sand grading upward into a clayey, fine sand and silt.
The Lynnhaven Member underlies most of Vir-ginia Beach. The Lynnhaven stretches from the west side of Pungo Ridge to Hickory Scarp and from Lynnhaven Bay to the southern city limits along the North Carolina border. A broad swale (low flat lands and wetlands) less than 20 ft above sea level (Oaks and Coch, 1973, p. 13, fig. 6) has formed on the Lynnhaven Member. The Lynnhaven is a gray, pebbly and cobbly, fine to coarse sand, grading upward into clayey and silty fine sand and sandy silt. Channel fill and abundant plant material are found at the base of the unit in some places.
The Sedgefield Member of the Tabb Formation forms Oceana Ridge, which ranges from about 20 to 25 ft above sea level. The Sedgefield also forms much of the higher ground south of the Diamond Springs Scarp around Lynnhaven Bay as well as the higher ground west of Hickory Scarp. The Sedgefield is a pebbly to bouldered, clayey sand and fine to medium shelly sand grading upward to sandy and clayey silt. Locally, pale-ochannel fill of up to 50 ft is present beneath major tidal rivers. This fill is a fine to coarse, cross-bedded sand and clayey silty peat, interbedded with tree stumps and wood fragments of ancient forests. The fill has been identified at the base of the unit (the lower member of the Great Bridge Formation of Oaks and Coch, 1973, p. 67), which correlates to the base of the Sedgefield Member (Peebles and others, 1984, p. 14). A paleochannel, cut and filled to a depth of 160 ft below sea level, lies beneath the mouth of the James River (Powars, 2000, p. 38 and fig. 9B). The bottom of another paleochannel about 60 to 70 ft below sea level
lies beneath the North Landing River (Oaks and Coch, 1973, fig. 13, p. 50).
The Columbia is generally an unconfined (water-table) aquifer. Silt, clay, and peat deposits within the aquifer can, however, cause confined or semi-confined conditions locally. The water-table aquifer is vulnera-ble to contamination from various land uses and gener-ally is used for irrigation (lawn watering) or for heat pumps. The Columbia is used for domestic drinking water where no other sources of freshwater are avail-able.
Shallow wells in the Columbia aquifer can fail (go dry) during a drought when the water table drops below normal seasonal levels. In the summer of 1985, following nine months of extremely dry weather, a number of shallow private wells failed on the Great Neck Peninsula, and to a lesser extent, on the Little Neck Peninsula. Virtually all of the wells that failed had shallow penetration suction-lift pumps that were affected by declines in water levels (Leahy, 1986a, p. 9 and 10). Declines in water levels of 5 to 10 ft had been noted since 1980 by some well drillers. The declines followed urban growth and a rapid increase in the pop-ularity of small irrigation wells and ground-water heat pumps. Recharge to the water table probably decreased after the construction of improved drainage systems, parking lots, and the paving of streets. Those declines in the water table were amplified by the dry conditions (Leahy, 1986a, p. 10).
Freshwater has been pumped from shallow wells in the sand dunes along the Atlantic Ocean. Large num-bers of connected, small-diameter wells called “batter-ies” were used to pump water from the dunes during the Second World War. At Fort Story, 60 two-inch-diameter wells driven 15 ft deep supplied 6,726,000 gallons of water during the first six months of 1940, or about 37,000 gallons a day (Cederstrom, 1945, p. 360). Iron concentrations in the water from these wells and others in the dunes was “undesirable,” and saltwater intrusion was considered a possibility in the sand dunes near the shore (p. 361).
Betz-Converse-Murdoch, Inc. (1981, p. IV-7) noted that sand beds of the Columbia Group are exten-sive and, where present in sufficient thickness, com-monly are mined for sand. Large quantities of water have been and continue to be pumped from many of the sand pits of Virginia Beach, indicating that the water-table aquifer potentially could yield significant quanti-ties of water. Betz-Converse-Murdoch, Inc. noted, however, that ground water in many places would
Conceptual Hydrogeologic Framework 29
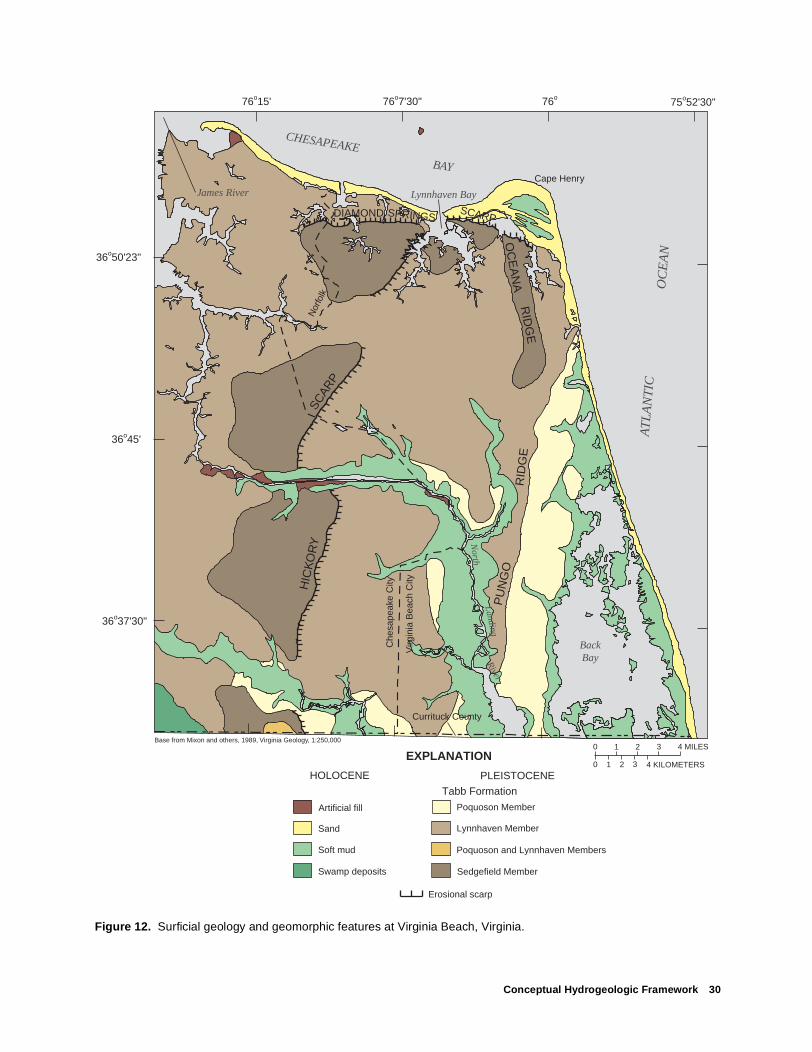
Conceptual Hydrogeologic Framework 30
Lynnhaven Member
Poquoson and Lynnhaven Members
Poquoson Member
Sedgefield Member
Soft mud
Sand
Swamp deposits
Artificial fill
HOLOCENE PLEISTOCENE
EXPLANATION
Erosional scarp
0 1 2 3 4 MILES
0 1 2 3 4 KILOMETERS
PU
NG
OR
IDG
E
RID
GE
OC
EA
NA
HIC
KO
RY
SCAR
P
DIAMOND SPRINGSSCARP
Che
sape
ake
City
Virg
inia
Bea
ch C
ity
Currituck County
Nor
folk
James River
Tabb Formation
36o37'30"
36o45'
36o50'23"
76o15' 76o7'30" 76o 75o52'30"
CHESAPEAKE
BAY
AT
LA
NT
ICO
CE
AN
North
LandingRiver
BackBay
Cape Henry
Lynnhaven Bay
Base from Mixon and others, 1989, Virginia Geology, 1:250,000
Figure 12. Surficial geology and geomorphic features at Virginia Beach, Virginia.

require treatment to remove iron and manganese (1981, p. III-1). The report also warned of the potential for contamination of the shallow aquifers resulting from upconing of brackish water and downward migration of nitrates, pesticides, herbicides, fertilizers, heavy met-als, and trace amounts of chlorinated hydrocarbons.
Continuous cores and ground-water levels from the sites analyzed by this investigation have confirmed previous findings about the Columbia aquifer. In some areas, the clayey fine sand and silt that form semi-con-fining beds in the Columbia are absent, and the aquifer is composed of dune sand nearly 80 ft thick. The Columbia reaches a maximum thickness where the sand dunes are large, along the shores of the Atlantic Ocean and in the older sand banks called Oceana Ridge and Pungo Ridge. The Columbia aquifer is recharged locally, and the porous sand dunes and ridges allow precipitation to readily infiltrate and percolate to the water table. The water table tends to mound beneath the dunes and the mound forces freshwater to flow downward and outward toward the nearest tidal stream or shore, where the freshwater flows into and mixes with brackish water or saltwater.
High concentrations of chloride, iron, and man-ganese were confirmed in some areas by water samples from wells installed for this investigation (table 3). In some areas of Virginia Beach, where no other sources of freshwater are available, the Columbia aquifer may be the most prolific aquifer available. Such readily recharged supplies would, however, need to be pro-tected from contamination and may need to be treated to meet drinking-water standards.
Yorktown confining unit
The Yorktown Formation was deposited during a succession of marine advances in the Early and Late Pliocene Epoch (Johnson and Berquist, 1989, p. 11). The top of the Yorktown Formation in southeastern Virginia was mapped by Oaks and Coch (1973, fig. 13, p. 50), who describe a fossiliferous clay facies with minor amounts of sand and coquina at the top of the Yorktown Formation south and east of Portsmouth and Norfolk. Ancient streams and estuaries cut valleys into the top of the Yorktown Formation and subsequently filled the channels with sediments forming paleochan-nels upon the surface. At Virginia Beach, the top of the Yorktown Formation ranges from about 15 to 80 ft below sea level.
The Yorktown confining unit is defined as a series of coalescing clay layers at or near the top of the Yorktown Formation (Meng and Harsh, 1988, p. C51). The Yorktown confining unit is not a single continuous layer but a series of very fine, sandy to silty clay units of various colors at the top of the Yorktown Formation (p. C51). The uppermost competent clays that form the Yorktown confining unit were deposited on a shallow marine shelf in broad lagoons and bays (Meng and Harsh, 1988, p. C52).
Locally, the finer grained sediments of the Pleis-tocene Tabb Formation and possibly the Pliocene Chowan River Formation (Powars, 2000, fig. 13, p. 42) may lie upon and in effect be a part of the Yorktown confining unit (table 3). The Chowan River Formation is difficult to distinguish from the Yorktown; it is an interbedded, silty fine sand, clayey silt, and bioclastic sand of limited extent in southeastern Virginia (Powars, 2000, p. 37).
Results from the present investigation of contin-uous cores and ground-water samples indicate that the Yorktown confining unit varies in thickness and in composition, but on a regional scale is a leaky confin-ing unit. Some sand layers within the confining unit that had been previously mapped as the upper and mid-dle Yorktown-Eastover aquifers are considered, in this report, to be local discontinuous sand units within the regional confining unit. These discontinuous sand deposits are capable of producing small to moderate amounts of freshwater in some areas. The supply of freshwater in the discontinuous sands of the Yorktown confining unit is limited by dissolved iron, manganese, and chloride, in places, and by the potential for upcon-ing or intrusion of brackish or saltwater.
Yorktown-Eastover aquifer
The Yorktown-Eastover aquifer is defined as the predominantly sandy deposits of the Yorktown Forma-tion and the upper part of the Eastover Formation above the confining clays of the St. Marys Formation (Meng and Harsh, 1988, p. C50). The Yorktown-Eastover aquifer was previously called the Yorktown aquifer by some investigators in Virginia (Geraghty & Miller, Inc. 1978, p. 12) and in North Carolina (Meng and Harsh, 1988, pl. 1). The Yorktown-Eastover aquifer as defined in this report is equivalent to the lower Yorktown aqui-fer of some previous investigators (Siudyla, 1981, p. 27).
Conceptual Hydrogeologic Framework 31
The Yorktown Formation is a bluish-gray, green-ish- and dark greenish-gray, very fine to coarse sand, in part glauconitic and phosphatic, commonly very shelly and interbedded with sandy and silty clay (Powars, 2000, p. 37). The Yorktown also includes abundant microfauna and cross-bedded, biofragmental lenticular sand bodies, which locally may be overlain by and dif-ficult to distinguish from the Chowan River Formation (Powars, 2000, p. 37).
The Eastover Formation is a dark gray, bluish- to greenish-gray, muddy fine sand interbedded with finer and coarser grained sand (Powars, 2000, p. 37). It can include shells, shell hash, and indurated beds. Locally, it may be glauconitic and micaceous. The Eastover was deposited in restricted to open shallow seas of the Miocene Epoch (Powars, 2000, p. 37).
The Yorktown-Eastover aquifer is wedge shaped, thickening towards the east. At Virginia Beach, it ranges from about 100 to 200 ft thick generally, but attains a maximum known thickness at the shoreline of Virginia Beach of about 240 ft (Meng and Harsh, 1988, p. C50) to 280 ft (Hamilton and Larson, 1988, p. 33). At Virginia Beach, the Yorktown-Eastover aquifer is generally confined.
Freshwater is limited to the upper part of the Yorktown-Eastover aquifer. Upconing of saline water as a result of excessive withdrawal rates from wells in the Yorktown (-Eastover) has occurred at several loca-tions in the city (Betz-Converse-Murdoch, Inc., 1981, p. IV-7). Most high production wells in and around Vir-ginia Beach have experienced increases in chloride or salinity because of upconing or saltwater intrusion (Leahy, 1986, p. 3).
Geraghty and Miller, Inc. (1979b, p. 1) evaluated the Yorktown (-Eastover) aquifer by a controlled aqui-fer test of the Pembroke well field for the City of Vir-ginia Beach. The well field had been in operation since 1963, but had been taken over by the city in 1978. The well field pumped about 300,000 gal/d (p. 3). It was concluded that the aquifer was semi-confined and leaky at Pembroke and that existing pumping rates at the well field should not be altered because of the potential for upconing of water containing higher total dissolved solids (p. 5 and 35). The Pembroke well field is no longer used by the city.
Geotrans, Inc. (1981, p. 12) analyzed four aqui-fer-test sites on and near Oceana and Pungo Ridges by solute-transport simulation. Two of the sites were in the “upper aquifer” (Columbia) and two were in the “lower confined aquifer” (Yorktown-Eastover) (Geotrans, Inc.,
1981, p. ii and iii). All of these sites had fair to poor potential for supplying water to individual wells, and all had a risk of increasing concentrations of chloride even at “small” pumping rates, which were simulated at 50 gal/min for individual wells and from 438,000 gal/d to 876,000 gal/d for well fields (p. 21 and 24). Changes in chloride concentrations observed in some of the deeper wells during the aquifer tests were not explained by the upconing simulations.The authors, however, thought that the increases in chloride measured during the tests probably came from “thin clay units in the aquifer itself” (Geotrans, Inc., 1981, p. 19).
Results from the present analysis of continuous cores and ground-water samples confirm or clarify pre-vious information about the Yorktown-Eastover aqui-fer. The composition of the Yorktown-Eastover can change considerably over short distances and the aqui-fer may not be continuous throughout the study area. The upper and middle Yorktown-Eastover aquifers, depicted as somewhat continuous aquifers in some pre-vious reports, are considered local sand aquifers of the upper confining unit in this report. The limited areal extent of highly permeable deposits containing fresh-water in the Yorktown-Eastover aquifer precludes the installation of highly productive freshwater well fields over much of the city. Some deposits of biofragmental sand or shell hashes in the Yorktown-Eastover aquifer could possibly supply water to high-capacity wells. Desalination of the water, however, would probably be necessary in most locations, and treatment to reduce concentrations of iron and manganese would also be needed. Areas where the biofragmental sands are thick, such as at the Old Pungo Ferry Road and the Black-water Neighborhood sites of the southern watersheds, warrant further study to determine the extent and hydraulic properties of the Yorktown-Eastover aquifer.
GENERAL CONCEPTION OF GROUND-WATER FLOW
The shallow aquifer system at Virginia Beach is recharged by local precipitation. Rainwater or snow-melt that soaks through the soil and that is not captured and transpired by plants can seep through the unsatur-ated zone to recharge the water table. Wherever enough recharge water infiltrates the soil and the unsaturated zone to build up a hydraulic head in the water table, ground water rises as a subsurface mound and begins flowing away from the center of the mound. The mound forces the ground water beneath to flow down-
32 Conceptual Hydrogeologic Framework of the Shallow Aquifer System at Virginia Beach, Virginia
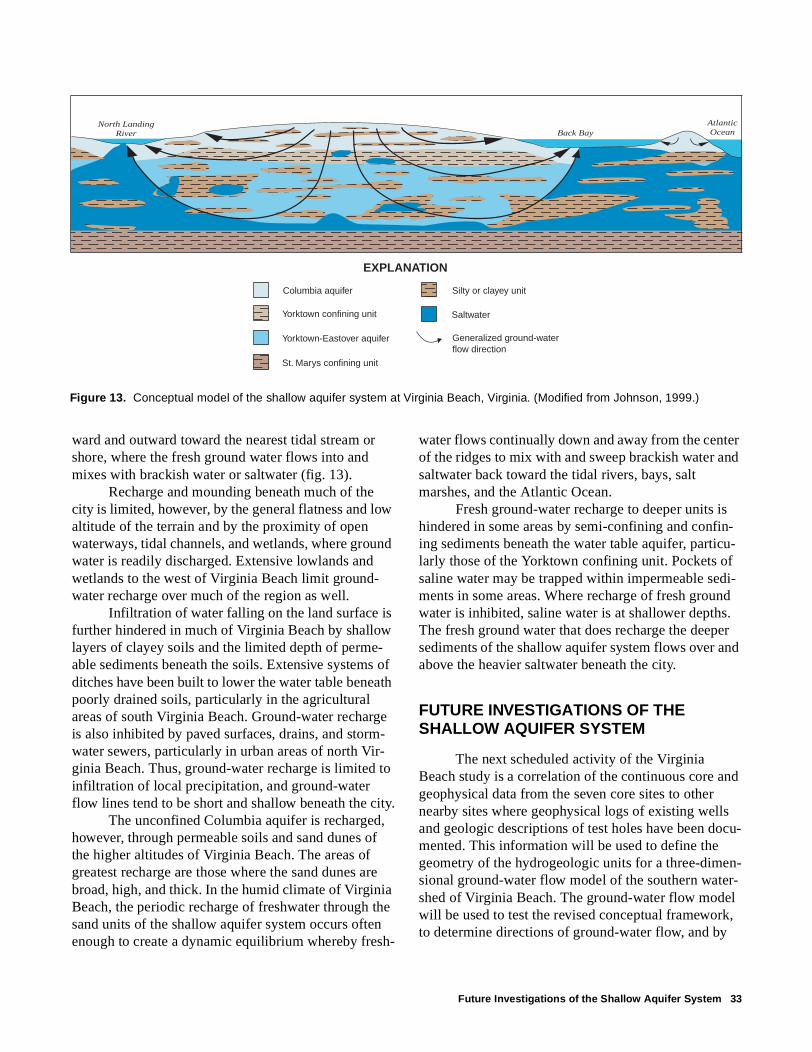
EXPLANATION
Columbia aquifer
Yorktown confining unit
Yorktown-Eastover aquifer
St. Marys confining unit
Silty or clayey unit
Saltwater
Generalized ground-water flow direction
North LandingRiver
AtlanticOceanBack Bay
Figure 13. Conceptual model of the shallow aquifer system at Virginia Beach, Virginia. (Modified from Johnson, 1999.)
ward and outward toward the nearest tidal stream or shore, where the fresh ground water flows into and mixes with brackish water or saltwater (fig. 13).
Recharge and mounding beneath much of the city is limited, however, by the general flatness and low altitude of the terrain and by the proximity of open waterways, tidal channels, and wetlands, where ground water is readily discharged. Extensive lowlands and wetlands to the west of Virginia Beach limit ground-water recharge over much of the region as well.
Infiltration of water falling on the land surface is further hindered in much of Virginia Beach by shallow layers of clayey soils and the limited depth of perme-able sediments beneath the soils. Extensive systems of ditches have been built to lower the water table beneath poorly drained soils, particularly in the agricultural areas of south Virginia Beach. Ground-water recharge is also inhibited by paved surfaces, drains, and storm-water sewers, particularly in urban areas of north Vir-ginia Beach. Thus, ground-water recharge is limited to infiltration of local precipitation, and ground-water flow lines tend to be short and shallow beneath the city.
The unconfined Columbia aquifer is recharged, however, through permeable soils and sand dunes of the higher altitudes of Virginia Beach. The areas of greatest recharge are those where the sand dunes are broad, high, and thick. In the humid climate of Virginia Beach, the periodic recharge of freshwater through the sand units of the shallow aquifer system occurs often enough to create a dynamic equilibrium whereby fresh-
water flows continually down and away from the center of the ridges to mix with and sweep brackish water and saltwater back toward the tidal rivers, bays, salt marshes, and the Atlantic Ocean.
Fresh ground-water recharge to deeper units is hindered in some areas by semi-confining and confin-ing sediments beneath the water table aquifer, particu-larly those of the Yorktown confining unit. Pockets of saline water may be trapped within impermeable sedi-ments in some areas. Where recharge of fresh ground water is inhibited, saline water is at shallower depths. The fresh ground water that does recharge the deeper sediments of the shallow aquifer system flows over and above the heavier saltwater beneath the city.
FUTURE INVESTIGATIONS OF THE SHALLOW AQUIFER SYSTEM
The next scheduled activity of the Virginia Beach study is a correlation of the continuous core and geophysical data from the seven core sites to other nearby sites where geophysical logs of existing wells and geologic descriptions of test holes have been docu-mented. This information will be used to define the geometry of the hydrogeologic units for a three-dimen-sional ground-water flow model of the southern water-shed of Virginia Beach. The ground-water flow model will be used to test the revised conceptual framework, to determine directions of ground-water flow, and by
Future Investigations of the Shallow Aquifer System 33

means of a particle-tracking routine, to indicate veloci-ties of ground-water flow from selected sites. The shal-low aquifer system will also be monitored at selected well sites to investigate any long-term fluctuations or potential changes in water levels or ground-water chemistry.
Future investigations of the shallow aquifer sys-tem could undertake coring at additional sites of inter-est to the City of Virginia Beach or at sites where data are sparse. Fossil and sediment samples from the con-tinuous cores collected for this investigation, which totalled more than 1400 ft, are still being studied by Coastal Plain geologists and paleontologists. The anal-yses of well cuttings, spot cores, or split spoon samples in concert with geophysical logs are not as definitive as continuous cores for determining or correlating hydro-geologic units. Future field investigations of the shal-low aquifer system would benefit by collecting continuous cores.
SUMMARY AND CONCLUSIONS
The hydrogeologic framework of the shallow aquifer system at Virginia Beach was revised to provide a better understanding of the distribution of fresh ground water, its potential use, and its susceptibility to contamination. The revised conceptual framework is based primarily on analyses of continuous cores and downhole geophysical logs collected at 7 sites to depths of approximately 200 ft.
The shallow aquifer system at Virginia Beach is composed of the Columbia aquifer, the Yorktown con-fining unit, and the Yorktown-Eastover aquifer. The composition of the aquifers and confining units change, in some places considerably, over short distances. The shallow aquifer system is separated from deeper units by the continuous St. Marys confining unit.
A water sample was collected from each of 10 wells installed at 5 of the 7 core sites to determine the basic chemistry of the aquifer system. One shallow well and one deep well was installed at each site. Con-centrations of chloride were higher in the water from the deeper well at each site. Concentrations of dis-solved iron were higher in all of the water samples than the U.S. Environmental Protection Agency Secondary Drinking Water Regulations. Concentrations of manga-nese and chloride were higher than the Secondary Drinking Water Regulations in samples from some wells.
The Columbia aquifer is defined as the predomi-nantly sandy surficial deposits above the Yorktown confining unit. The Columbia sediments are Holocene and Pleistocene in age; in places, the Columbia can also include sandy sediments of Pliocene age above the Yorktown confining unit. The Pleistocene deposits of the Tabb Formation form the landscape of Virginia Beach as well as the greater part of the Columbia aqui-fer.
The Columbia is an unconfined (water-table) aquifer; however, clayey fine sand, silt, clay, and peat deposits within the aquifer cause local confined to semi-confined conditions in some areas. In other areas, sand dunes predominate and the aquifer is nearly 80 ft thick.
The Columbia aquifer is used for small-scale irrigation (lawn watering), heat pumps, and domestic water at Virginia Beach. Some of the thicker sand beds of the Columbia are mined in open pits that require dewatering. In some areas of Virginia Beach, where no other sources of freshwater are available, the Columbia aquifer may be the most prolific aquifer available. Such readily recharged supplies would, however, need to be protected from land-use contamination. Treatment to reduce concentrations of dissolved iron, manganese, and chloride might also be necessary.
The Yorktown confining unit is defined as a series of coalescing clay layers at or near the top of the Yorktown Formation. The Yorktown confining unit is not a single continuous layer, but a series of very fine sandy to silty clay units of various colors at the top of the Yorktown Formation. Locally, the finer grained sed-iments of the Pleistocene Tabb Formation and possibly the Pliocene Chowan River Formation may lie upon and, in effect, be a part of the Yorktown confining unit.
The Yorktown confining unit varies in thickness and in composition, but on a regional scale is a leaky confining unit. Some sand layers within the confining unit are capable of producing small to moderate amounts of freshwater in some areas. The supply of freshwater in the discontinuous sands of the Yorktown confining unit is limited by concentrations of dissolved iron, manganese, and chloride, in places, and by the potential for upconing of brackish water or intrusion of saltwater.
The Yorktown-Eastover aquifer is defined as the predominantly sandy deposits of the Yorktown Forma-tion and the upper part of the Eastover Formation above the confining clays of the St. Marys Formation. The Yorktown Formation is a bluish-gray, greenish-gray,
34 Conceptual Hydrogeologic Framework of the Shallow Aquifer System at Virginia Beach, Virginia
and dark greenish-gray, very fine to coarse sand, in part glauconitic and phosphatic, commonly very shelly and interbedded with sandy and silty clay. The Yorktown also includes abundant microfauna and cross-bedded biofragmental lenticular sand bodies. The Eastover Formation is a dark gray, bluish-gray to greenish-gray, muddy fine sand interbedded with finer and coarser grained sand. It can include shells, shell hash, and indu-rated beds. Locally, it may be glauconitic and mica-ceous.
The limited areal extent of highly permeable deposits containing freshwater in the Yorktown-Easto-ver aquifer precludes the installation of highly produc-tive freshwater well fields over much of the city. Some deposits of biofragmental sand or shell hashes in the Yorktown-Eastover aquifer are capable of producing water from high-capacity wells. Further investigations of the hydraulic properties and distribution of the bio-fragmental sands are needed to define areas capable of producing water from high capacity wells. Desalination of the water, however, would probably be necessary in most locations, and treatment to remove iron and man-ganese would also be needed to meet the water-quality standards.
In the humid climate of Virginia Beach, the peri-odic recharge of freshwater through the sand units of the shallow aquifer system occurs often enough to cre-ate a dynamic equilibrium whereby freshwater flows continually down and away from the center of the ridges to mix with and sweep brackish water and salt-water back toward the tidal rivers, bays, salt marshes, and the Atlantic Ocean.
Because the aquifers and confining units of the shallow aquifer system are heterogeneous, discontinu-ous, and generally without exact marker beds, correla-tions are difficult. Investigations using well cuttings, spot cores, or split-spoon samples with geophysical logs are not as definitive as continuous cores for deter-mining or correlating hydrogeologic units. Future field investigations of the shallow aquifer system would benefit by collecting continuous cores.
Summary and Conclusions 35
REFERENCES CITED
Betz-Converse-Murdoch, Inc., 1981, Development of fresh 10 MGD ground water supply—Engineering report for the City of Virginia Beach: Vienna, Va., Betz-Converse-Murdoch, Inc., Potomac Group, variously paged.
Cederstom, D.J., 1943, Chloride in ground water in the Coastal Plain of Virginia: Virginia Geological Survey Bulletin 58, 36 p., 4 pls.
Cederstom, D.J.,1945, Geology and ground-water resources of the Coastal Plain in southeastern Virginia: Virginia Geological Survey Bulletin 63, 384 p., 38 pls.
Fishman, M.,J., and Friedman, L.C., eds., 1989, Methods for determination of inorganic substances in water and fluvial sediments: Techniques of Water-Resources Investigations of the U.S. Geological Survey, book 5, chap. 1, 545 p.
Geotrans, Inc., 1981, Final report on the quantitative evaluation of ground-water resources in the Virginia Beach area, Virginia-Attachment I to report Hydrogeologic investigation groundwater development phase Virginia Beach fresh groundwater project for City of Virginia Beach prepared for Converse, Ward, Davis, Dixon, Inc.: Caldwell, N.J., 107 p.
Geraghty & Miller, Inc., 1978, Availability of ground water for public supply in the City of Virginia Beach, Virginia-Prepared at the request of Wiley & Wilson, Inc., for the City of Virginia Beach: Tampa, Fl., Geraghty & Miller, Inc., 57 p.
Geraghty & Miller, Inc., 1979a, Availability of ground water in the southeastern Virginia groundwater management area-Prepared for the Virginia State Water Study Commission: Annapolis, Md., Geraghty & Miller, Inc., 106 p. (Reprinted 1979).
Geraghty & Miller, Inc., 1979b, Evaluation of pumping test on Yorktown Aquifer, City of Virginia Beach, Virginia- Prepared for Wiley & Wilson, Inc.: Annapolis, Md., Geraghty & Miller, Inc., 49 p.
Geraghty & Miller, Inc., 1982, Development of an emergency ground-water supply for the City of Virginia Beach, Virginia—Volume I-Well installation and testing-A report to the City of Virginia Beach Department of Public Utilities: Annapolis, Md., Geraghty & Miller, Inc., 96 p.
Hamilton, P.A., and Larson, J.D., 1988, Hydrogeology and analysis of the ground-water flow system in the Coastal Plain of southeastern Virginia: U.S. Geological Survey Water Resources Investigations Report 87-4240, 175 p.
Harsh, J.F. and Laczniak, R.J., 1990, Conceptualization and analysis of the ground-water flow system in the Coastal Plain of Virginia and adjacent parts of Maryland and North Carolina, Regional Aquifer-System Analysis- Northern Coastal Plain: U.S. Geological Survey Professional Paper 1404-F, 100 p.
Johnson, G. H. and Berquist, C.R., Jr., 1989, Geology and mineral resources of the Brandon and Norge quadrangles, Virginia: Virginia Division of Mineral Resources Publication 87, 28 p., 1 pl.
Johnson, G. H., Kruse, S.E., Vaughn, A.W., Lucey, J.K., Hobbs, C.H. III, and Powars, D.S., 1998, Postimpact deformation associated with late Eocene Chesapeake Bay impact structure in southeastern Virginia: Geology, v. 26, no. 6, p. 506-510.
Johnson, H.M., IV, 1999, The Virginia Beach shallow ground-water study: U.S. Geological Survey Fact Sheet 173-99, 2 p.
Keys, W.S. and MacCary, L.M., 1971, Application of borehole geophysics to water-resources investigations: Techniques of Water Resources Investigations of the U.S. Geological Survey, book 2, chap. E1, 126 p.
Lapham, W. W., Wilde, F.D., and Koterba, M.T., 1997, Guidelines and standard procedures for studies of ground-water quality—selection and installation of wells, and supporting documentation: U.S. Geological Survey Water-Resources Investigations Report 96-4233, 110 p.
Leahy, T. M., III, 1986a, Status Report-Shallow groundwater conditions in the Great Neck and Little Neck Peninsulas, City of Virginia Beach: City of Virginia Beach, Va., Great Neck and Little Neck Groundwater Task Force, 61 p.
Leahy, T. M., III, 1986b, The potential for desalting in Hampton Roads, Virginia: City of Virginia Beach, Va., 48 p.
Meng, A.A., III, and Harsh, J.F., 1988, Hydrogeologic framework of the Virginia Coastal Plain-Regional Aquifer-System Analysis: U.S. Geological Survey Professional Paper 1404-C, 82 p., 4 pls.
Mixon, R.B., Berquist, C.R., Jr., Newell, W.L., Johnson, G.H., Powars, D.S., Schindler, J.S., and Rader E.K., 1989, Geologic map and generalized cross sections of the Coastal Plain and adjacent parts of the Piedmont, Virginia, 1989: U.S. Geological Survey Miscellaneous Investigations Series Map I-2033, 2 sheets, scale 1:250,000.
Oaks, R.Q., Jr. and Coch, N.K., 1973, Post-Miocene stratigraphy and morphology, southeastern Virginia: Virginia Division of Mineral Resources Bulletin 82, 135 p., 2 pl.
Peebles, P.C., Johnson, G.H., and Berquist, C.R., 1984, The Middle and Late Pleistocene stratigraphy of the outer Coastal Plain, southeastern Virginia: Virginia Minerals, v. 30, no. 2, p. 13-22.
Poag, C.W., Powars, D.S., Poppe, L.J., and Mixon, R.B., 1994, Meteorite mayhem in Ole Virginny—source of the North American tektite strewn field: Geology, v. 22, p. 691-694.
36 Conceptual Hydrogeologic Framework of the Shallow Aquifer System at Virginia Beach, Virginia

Powars, D. S., 2000, The effects of the Chesapeake Bay impact crater on the geologic framework and the correlation of hydrogeologic units of southeastern Virginia, south of the James River: U.S. Geological Survey Professional Paper 1622, 54 p., 1 pl.
Sanford, Samuel, 1913, The underground water resources of the Coastal Plain Province of Virginia: Virginia Geological Survey Bulletin No. 5, 361 p., 1 pl.
Siudyla, E.A., May, A.E., and Hawthorne, D.W., 1981, Ground water resources of the Four Cities Area- Norfolk, Portsmouth, Virginia Beach, Chesapeake: Virginia State Water Control Board Planning Bulletin 331, 167 p., 25 pl.
Spruill, T.B., Harned, D.A., Ruhl, P.M. Eimers, J.L. McMahon, G., Smith, K.E., Galeone, D.R. and Woodside, M.D., 1998, Water quality in the Albemarle-Pamlico Drainage Basin, North Carolina and Virginia, 1992-95: U.S. Geological Survey Circular 1157, 36 p.
Teifke, R.H., 1973, Stratigraphic units of the Lower Cretaceous through Miocene Series, in Geologic Studies, Coastal Plain of Virginia: Virginia Division of Mineral Resources Bulletin 83, part 1, 78 p., 11 pl.
U.S. Environmental Protection Agency, 2000, Drinking water standards and health advisories: Washington, D.C., Office of Water, 12 p.
Virginia Council on the Environment, 1992, Virginia Beach West, 1:100,000.
Virginia State Water Control Board, 1974, Groundwater of southeastern Virginia: Planning Bulletin 261-A, Virginia State Water Control Board, Bureau of Water Control Management, 31 p., 13 pl.
White, R.K., and Powell, E.D., 2001, Water resources data, Virginia, water year 2000, v. 2, ground-water level and ground-water quality records: U.S. Geological Survey Water-Data Report VA-00-2, 337 p.
Wiley & Wilson, Inc., 1979, City of Virginia Beach Department of Public Utilities comprehensive potable groundwater report: Virginia Beach, Va., Wiley & Wilson, Inc., 109 p.
Wolman, Abel, Geyer, J.C., and Day, W. F., 1942, Hampton Roads regional water supply study:, Washington, D.C., Executive Office of the President, National Resources Planning Board, 15 p., 1 pl.
References Cited 37