concurrent observations of air pollutants at two sites in the pearl
TRANSCRIPT

Atmos. Chem. Phys., 9, 7343–7360, 2009www.atmos-chem-phys.net/9/7343/2009/© Author(s) 2009. This work is distributed underthe Creative Commons Attribution 3.0 License.
AtmosphericChemistry
and Physics
Concurrent observations of air pollutants at two sites in the PearlRiver Delta and the implication of regional transport
H. Guo1, F. Jiang1,2, H. R.Cheng1, I. J. Simpson3, X. M. Wang4, A. J. Ding1,2, T. J. Wang2, S. M. Saunders5, T. Wang1,S. H. M. Lam5, D. R. Blake3, Y. L. Zhang1,4, and M. Xie1,2
1Air Quality Studies, Department of Civil and Structural Engineering, the Hong Kong Polytechnic University, Hong Kong2School of Atmospheric Sciences, Nanjing University, Nanjing, China3Department of Chemistry, University of California at Irvine, California, USA4Guangzhou Institute of Geochemistry, Chinese Academy of Sciences, Guangzhou, China5School of Biomedical, Biomolecular and Chemical Sciences, University of Western Australia, Perth, Australia
Received: 12 March 2009 – Published in Atmos. Chem. Phys. Discuss.: 16 April 2009Revised: 5 August 2009 – Accepted: 18 September 2009 – Published: 2 October 2009
Abstract. An intensive field measurement study was con-ducted simultaneously at a site within the inland Pearl RiverDelta (PRD) region (WQS) and a site in Hong Kong (TC)between 22 October and 1 December 2007. Ambient air pol-lutants measured included O3, NOx, CO, SO2, NMHCs, andcarbonyls. The purpose is to improve our understanding ofthe interplay among local and regional air pollutants in theHong Kong area, and the influence of regional transport onlocal air pollutants. The results indicate that the mean levelsof air pollutants at the WQS site were much higher than thoseat the TC site, except NOx. Thirteen O3 episode days (dailyO3 peak in excess of 122 ppbv) were monitored at WQS dur-ing the study period, while only 2 days were recorded at TC.Diurnal variations of O3 showed higher nighttime levels ofO3 at TC than at WQS as well as more photochemical ac-tivity at WQS than TC. Remarkable differences in diurnalvariations were also found between high and low O3 pol-lution days at each site, implying that Hong Kong is moreacutely VOC-limited than the inland PRD region. Ratio anal-yses for trace gases and VOCs and back trajectory calculationrevealed that the air masses arriving at WQS were more ageddue to regional influence, whereas the air masses at TC weremainly affected by local emissions and/or regional transport.In addition, the influence of regional transport from EasternChina on the primary pollutants of Hong Kong was notice-able, whereas the air masses from the inland PRD region(e.g. Dongguan and Huizhou) had significant influence onthe air pollutants at WQS, and the anthropogenic emissions
Correspondence to:H. Guo([email protected])
in Eastern PRD (e.g. Shenzhen) played an important role onthe photochemical ozone pollution in Western Hong Kong.These results confirm that regional and sub-regional trans-port of air pollution has a complex and significant impact onlocal air pollutants in this region.
1 Introduction
One of the major problems facing the environmental so-ciety is photochemical smog. Photochemical smog is theresult of the interaction of sunlight with certain chemicalsin the atmosphere, which leads to ground-level ozone (O3)and airborne particles (NRC, 1991; Seinfeld and Pandis,2006). Photochemical smog is a concern in most major ur-ban centers but, because it travels with the wind, it can af-fect sparsely populated areas as well. Smog can be formedin almost any climate where industries or cities release largeamounts of air pollution. However, it is worse during peri-ods of warmer, sunnier weather when the upper air is warmenough to dampen or inhibit vertical circulation. Photochem-ical smog is especially prevalent in geologic basins encircledby hills or mountains. It often stays for an extended periodof time over densely populated cities, such as Hong Kong,and can build up to dangerous levels. The photochemicallyformed O3 at ground level can have adverse effects on humanhealth and also affects the oxidizing capacity of the atmo-sphere, while the secondary organic aerosols formed have di-rect effects on climate change through modification of radia-tive budgets (Warneck, 2000; Godish, 2004). Globally, thecarbon load is strongly influenced by anthropogenic activity,
Published by Copernicus Publications on behalf of the European Geosciences Union.

7344 H. Guo et al.: Concurrent observations of air pollutants
29
844
Figure 1. Location of the sampling sites, Pearl River Delta of Southern China. 845
846
Figure 2. Mean sea level pressure and wind field on 1000 hPa between 22 October and 1 847
December 2007. 848
C H I N A
Fig. 1. Location of the sampling sites, Pearl River Delta of Southern China.
and future changes in emissions will continue to be a centralconsideration in air quality policy and climate change.
In recent years, the Pearl River Delta (PRD) region onthe coast of Southern China has become one of the world’sfastest growing industrial areas. The PRD region consists ofnine cities within Guangdong Province, namely Guangzhou,Shenzhen, Zhuhai, Dongguan, Zhongshan, Foshan, Jiang-men, Huizhou and Zhaoqing (usually these nine cities areconsidered to comprise the inland PRD region), plus HongKong and Macau Special Administrative Regions (Fig. 1).A consequence of the rapid development is the sacrifice ofenvironmental quality. Photochemical O3 has been studiedin Southern China for over a decade. Lam et al. (1998) an-alyzed the behavior of background surface O3 measured ata coastal site in Hong Kong. Chan et al. (1998a, b) com-pared background and urban O3 in Hong Kong. They fo-cused on seasonal variations of O3 and related the observedtrends to the large-scale Asian monsoon circulation. Low O3during summer was attributed to the inflow of maritime air,whereas abundant O3 in autumn-winter was due to the out-flow of polluted continental air. Wang et al. (1998) foundthat the local-scale re-circulation was an important mech-anism in transporting O3 to a rural/coastal monitoring site(Hok Tsui) near Hong Kong. The temporal variability andemission patterns related to photochemical smog episodes inHong Kong were also reported by Wang et al. (2003) andWang and Kwok (2003). So and Wang (2003) studied theground-level O3 concentrations at four sites in Hong Kong.
In addition, many O3 episodes were analyzed in combi-nation with the meteorological conditions in Hong Kong us-ing numerical simulations (e.g. Lee et al., 2002; Wang andKwok, 2003; Ding et al., 2004; Lam et al., 2005; Wang et al.,2006; Huang et al., 2006). These studies suggested the im-portance of regional transport from the inland PRD region.Lee and Savtchenko (2006) found that air pollution in HongKong was correlated with that in the inland PRD region in2003 and 2004. Huang et al. (2006) surveyed 54 O3 episodesthat occurred over Hong Kong during 2000–2004 and foundthat O3 episodes were dominated by regional transport whena tropical cyclone/typhoon was located over the Northwest-ern Pacific or the South China Sea to the east or southeastand when an anticyclone appeared over mainland China tothe north. Sensitivity studies even revealed that, in some O3episodes, 40–90% of the ambient O3 at urban and rural areasof Hong Kong was attributed to horizontal transport (Lam etal., 2005; Wang et al., 2006). However, all of these studieswere carried out within Hong Kong. The relative contribu-tions of local photochemical formation and regional trans-port to O3 episodes in Hong Kong are not fully understood.Furthermore, the causes of O3 episodes in the inland PRD,which was considered as a major reason for O3 episodes inHong Kong, remain unclear, though some studies have beenundertaken inside the inland PRD region (e.g. Zhang, 1999,2008). Therefore, in order to improve our understanding ofthe correlation between air pollution in Hong Kong and theinland PRD region, simultaneous measurements of O3 and
Atmos. Chem. Phys., 9, 7343–7360, 2009 www.atmos-chem-phys.net/9/7343/2009/

H. Guo et al.: Concurrent observations of air pollutants 7345
its precursors (i.e. volatile organic compounds and nitrogenoxides) were conducted at both sites in October–December,2007 (autumn is the period that O3 episodes are often ob-served).
Volatile organic compounds (VOCs) and nitrogen oxides(NOx) are important precursors of tropospheric O3. Studieshave shown that the formation of O3 in the PRD region islimited by VOCs (So and Wang, 2004; Zhang et al., 2007;Zhang et al., 2008). A number of studies have been con-ducted to understand the spatial and temporal characteristicsof VOCs in the inland PRD region (e.g. Chan et al., 2006;Tang et al., 2007; Barletta et al., 2008; Liu et al. 2008) andin the Hong Kong area (e.g. Sin et al., 2000; Lee et al., 2002;Guo et al., 2004, 2007; So and Wang, 2004; Zhang et al.,2007). The regional and local source contributions to ambi-ent VOCs in Hong Kong have been studied by measurementsat a rural/coastal site near Hong Kong (Wang, T. et al., 2005;Guo et al., 2006). These previous studies mainly focused onthe speciation, spatial and temporal variations, source char-acterization and identification of VOCs either in Hong Kongor in the inland PRD. To better understand the relationshipof VOCs between inland PRD and Hong Kong during O3episodes, and the photochemistry of VOCs in the formationof O3, it is necessary to undertake concurrent field measure-ments in these two different areas.
In this study, we present the measurement data of the mainair pollutants simultaneously collected between 22 Octoberand 1 December 2007 at two sampling sites which are locatedin the inland PRD region and in Hong Kong, respectively.The levels of individual trace gases, total non-methane hy-drocarbons (NMHCs), and total carbonyls in both areas arereported here, and the differences and relationships of the airpollutant concentrations at the two sites are discussed. Tem-poral patterns of total NMHCs and other trace gases are com-pared between high and low O3 pollution days. In particular,high O3 episodes are analyzed in combination with the me-teorological conditions. Finally, we discuss the influence ofregional transport on these study areas by examining the re-lationship between selected VOC species ratios and the ageof air masses, and by analyzing their backward trajectories.
2 Methodology
2.1 Description of the sampling sites
The field measurement sampling sites – Wan Qing Sha(WQS) and Tung Chung (TC) – are shown in Fig. 1. Thedistance between the two sites is about 62 km. WQS(22.711◦ N, 113.549◦ E) is a small town located near the cen-ter of the PRD. This small town is surrounded by farmlandsand has very few textile and clothing workshops, so the localanthropogenic emissions are not remarkable. The major airpollutants are mainly from the surrounding cities. This site is50 km to the southeast of the Guangzhou urban center, 40 km
southwest of Dongguan, 50 km northwest of Shenzhen, and25 km northeast of Zhongshan, making it a good location tocharacterize the air pollution in the inland PRD. Conversely,since WQS is at the northernmost boundary of the Pearl Es-tuary and to the northwest of Hong Kong, it is an appropriatesite to investigate the influence of the inland PRD region onHong Kong when northerly wind is prevalent. The measure-ments were carried out on the rooftop of a 15 m high build-ing.
TC (22.30◦ N, 113.93◦ E) is located on northern LantauIsland, about 3 km south of the Hong Kong International air-port at Chek Lap Kok. It is a newly-developed residentialtown, but adjacent to the highway and to railway lines. Itis about 20 km to the southwest of Hong Kong urban center,and 38 km northeast of Macau. In addition to the influence oflocal emission sources, TC is also affected by polluted conti-nental air masses from the highly industrialized PRD regionof mainland China. Thus, this site is capable of monitoringair pollutants transported from the inland PRD region and issuitable for assessing their impact on local air quality. Thesamples were collected on the rooftop of a building with aheight of 15 m.
2.2 Measurement techniques
2.2.1 Continuous measurements of trace gases
Measurement instruments were housed in a laboratory sit-uated on the roof at both sites. Ambient air samples weredrawn through a 10 m long PFA Teflon tube (outside diame-ter 12.7 mm; inside diameter: 9.6 mm). The sampling tubeinlet was located 3 m above the rooftop of the laboratory,and the outlet was connected to a PFA-made manifold witha bypass pump drawing air at a rate of 15 L/min. Descrip-tions of the measurements of O3, CO, SO2 and NO-NO2-NOx can be found in Wang et al. (2003). In this study,continuous measurements of trace gases, including O3, NO-NO2-NOx, CO and SO2, were conducted from 22 Octo-ber to 1 December 2007 at WQS, while at TC the hourlydata of O3, CO, SO2, and NOx were obtained from thewebsite of the Hong Kong Environmental Protection De-partment (HKEPD) (http://www.epd.gov.hk). Detailed in-formation about the measurements and quality control andassurance at the TC site can be found in the HKEPD re-port (HKEPD, 2007). Here, we briefly describe the mea-surements at WQS. Ozone was measured using a commer-cial UV photometric instrument (Thermo Environmental In-struments (TEI), model 49C) that had a detection limit of2 ppbv and a 2-sigma (2-s) precision of 2 ppbv for a 2-minaverage. CO was measured with a gas filter correlation, non-dispersive infrared analyzer (API, Model 300) with a heatedcatalytic scrubber to convert CO to carbon dioxide (CO2)for baseline determination. SO2 was monitored by pulsedUV fluorescence (TEI, model 43S), with a detection limitof 0.06 ppbv and 2-s precision of 3% for ambient levels of
www.atmos-chem-phys.net/9/7343/2009/ Atmos. Chem. Phys., 9, 7343–7360, 2009

7346 H. Guo et al.: Concurrent observations of air pollutants
10 ppbv (2-min average). NO and NOx were detected with achemiluminescence NO-NO2-NOx analyzer (Thermo Elec-tron Corporation, Model 42i trace level). The analyzer has adetection limit of 0.05 ppbv. These analyzers were calibrateddaily by injecting scrubbed ambient air (TEI, Model 111)and a span gas mixture. A NIST-traceable standard (Scott-Marrin, Inc.) containing 156.5 ppmv CO (±2%), 15.64 ppmvSO2 (±2%), and 15.55 ppmv NO (±2%) was diluted using adynamic calibrator (Environics, Inc., Model 6100). For theO3, SO2, NO and NOx analyzers, a data logger (Environmen-tal Systems Corporation, Model 8816) was used to controlthe calibrations and to collect data, which were averaged to1-min values.
2.2.2 Sampling and analyses of VOCs and carbonyls
Ambient NMHC samples were collected using cleaned andevacuated 2-L electro-polished stainless steel canisters on se-lected days (26–27 Oct, 13 Nov, 15–17 Nov, 23 Nov, and 1Dec). These potential high O3 episode days were selected forNMHCs and carbonyl sampling on the basis of weather pre-diction and meteorological data analysis, which were usuallyrelated to stronger solar radiation, weaker wind speed andless vertical dilution of air pollution, compared to non-O3episode days. Details of the preparation and pre-conditioningof the canisters are described in Blake et al. (1994). Dur-ing the sampling, a flow-controlling device was used to col-lect 1-h integrated samples. At both sampling sites, hourlyNMHC samples were collected from 7 a.m. to 6 p.m. atTC, and from 6 a.m. to 6 p.m. at WQS for the selecteddays. The samples were analyzed by an Entech Model 7100Preconcentrator (Entech Instruments Inc., California, USA)coupled with a gas chromatography-mass selective detec-tor (GC-MSD, Agilent 5973N). A HP-1 capillary column(60 m×0.32µm×1.0µm, Agilent Technologiea, USA) wasused with helium as carrier gas. The GC oven temperaturewas initially held at−50◦C for 3 min, after which it was in-creased to 10◦C at 15◦C min−1, then to 120◦C at 5◦C,min−1,and finally to 250◦C at 10◦C min−1. The analysis was con-ducted after holding it at 250◦C for 10 min. The MSD wasused in selected ion monitoring (SIM) mode and the ion-ization method was electron impacting (EI). The detectionlimit of aromatics is 0.003 ppbv, and that of other NMHCs is0.005 ppbv.
Carbonyl samples were collected simultaneously atboth sites on the same selected days. Samples werecollected at 0.4–0.5 L/min for 150 mins using a car-bonyl sampler (ALDEHYDE, UNIT #7) by passing airthrough a silica cartridge impregnated with acidified 2, 4-dinitrophenylhydrazine, which is very reactive toward car-bonyls. An O3 scrubber was connected to the inlet of thecartridge during each sampling to eliminate the impact ofO3. About four carbonyl samples were collected during eachsampling day. All cartridges were stored in a refrigeratorat −4◦C after sampling. Each sampled cartridge was eluted
Table 1. The operating conditions of HPLC.
Column Nava-Pak C18 3.9×150 mm
Mobile phase A: Water/Acetonitrile/Tetrahydrofuran 60/30/10Gradient B: Water/Acetonitrile 40/60Flow rate 100% A for 2 min then a linear gradient from
100% A to 100% B in 18 min, 100% B for 4 minInjection 20µLvolumeDetection Absorbance at 360 nm
slowly with 5 mL of acetonitrile (ACN) into a 5 mL volu-metric flask. A 20-µL aliquot was injected into the HPLCsystem through an auto-sampler. The operating conditions ofthe HPLC are shown in Table 1. Typically C1-C8 carbonylcompounds are measured effectively by this technique witha detection limit of∼0.2 ppbv.
2.2.3 Quality control and assurance for VOC and car-bonyl analyses
Before sampling, all canisters were cleaned at least five timesby repeatedly filling and evacuating humidified pure nitrogengas. In order to check whether there was any contaminationin the canister, we filled the evacuated canisters with pureN2 and stored them in the laboratory for at least 24 hours.These canisters were then checked by the same VOC analyt-ical method to ensure that all the target compounds were notfound or were under the method detection limit (MDL). Inaddition, duplicate samples were regularly collected to checkthe precision and reliability of the sampling and analyticalmethods.
The eluted species were identified and quantified by MSD.The identification of each compound was based on its re-tention time and fragmentation pattern. The quantificationof target VOCs was accomplished using multi-point externalcalibration curves. The calibration curves were updated ev-ery day and were prepared using 1000 ppbv standard calibra-tion gases (TO-14 gases, Spectra Gases Inc.) at five differentdiluted concentrations plus humidified zero air (0-40 ppbv).The standard gases were analyzed in the same way as thefield samples.
Identification and quantification of carbonyl compoundswere based on retention times and peak areas of the corre-sponding calibration standards, respectively. The instrumentwas calibrated using five standard concentrations coveringthe concentrations of interest for ambient samples. Excel-lent linear relationships (R2>0.998) were observed betweenthe concentrations and responses for all carbonyls identi-fied. Cartridge collection efficiency was determined with twocartridges in series, and over 98% of carbonyl compoundswere found in the first cartridge. Relative percent differences(RPDs) for duplicate analysis were within 10%.
Atmos. Chem. Phys., 9, 7343–7360, 2009 www.atmos-chem-phys.net/9/7343/2009/
H. Guo et al.: Concurrent observations of air pollutants 7347
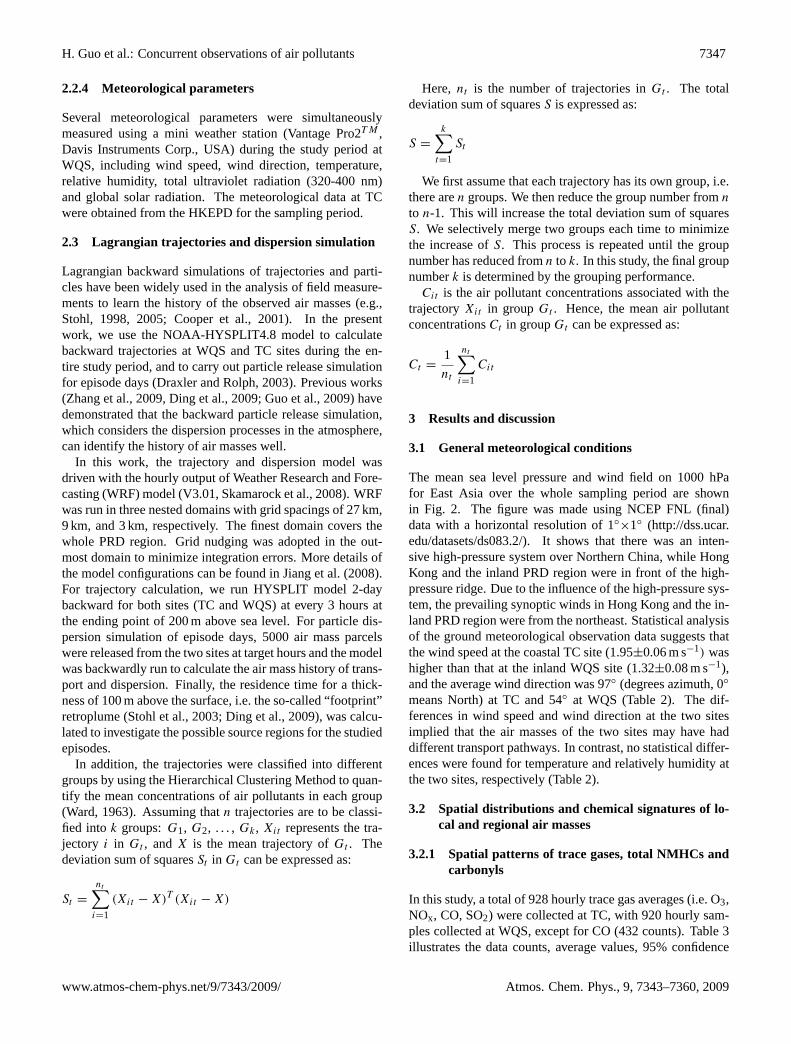
2.2.4 Meteorological parameters
Several meteorological parameters were simultaneouslymeasured using a mini weather station (Vantage Pro2T M ,Davis Instruments Corp., USA) during the study period atWQS, including wind speed, wind direction, temperature,relative humidity, total ultraviolet radiation (320-400 nm)and global solar radiation. The meteorological data at TCwere obtained from the HKEPD for the sampling period.
2.3 Lagrangian trajectories and dispersion simulation
Lagrangian backward simulations of trajectories and parti-cles have been widely used in the analysis of field measure-ments to learn the history of the observed air masses (e.g.,Stohl, 1998, 2005; Cooper et al., 2001). In the presentwork, we use the NOAA-HYSPLIT4.8 model to calculatebackward trajectories at WQS and TC sites during the en-tire study period, and to carry out particle release simulationfor episode days (Draxler and Rolph, 2003). Previous works(Zhang et al., 2009, Ding et al., 2009; Guo et al., 2009) havedemonstrated that the backward particle release simulation,which considers the dispersion processes in the atmosphere,can identify the history of air masses well.
In this work, the trajectory and dispersion model wasdriven with the hourly output of Weather Research and Fore-casting (WRF) model (V3.01, Skamarock et al., 2008). WRFwas run in three nested domains with grid spacings of 27 km,9 km, and 3 km, respectively. The finest domain covers thewhole PRD region. Grid nudging was adopted in the out-most domain to minimize integration errors. More details ofthe model configurations can be found in Jiang et al. (2008).For trajectory calculation, we run HYSPLIT model 2-daybackward for both sites (TC and WQS) at every 3 hours atthe ending point of 200 m above sea level. For particle dis-persion simulation of episode days, 5000 air mass parcelswere released from the two sites at target hours and the modelwas backwardly run to calculate the air mass history of trans-port and dispersion. Finally, the residence time for a thick-ness of 100 m above the surface, i.e. the so-called “footprint”retroplume (Stohl et al., 2003; Ding et al., 2009), was calcu-lated to investigate the possible source regions for the studiedepisodes.
In addition, the trajectories were classified into differentgroups by using the Hierarchical Clustering Method to quan-tify the mean concentrations of air pollutants in each group(Ward, 1963). Assuming thatn trajectories are to be classi-fied into k groups:G1, G2, . . . , Gk, Xit represents the tra-jectory i in Gt , andX is the mean trajectory ofGt . Thedeviation sum of squaresSt in Gt can be expressed as:
St =
nt∑i=1
(Xit − X)T (Xit − X)
Here, nt is the number of trajectories inGt . The totaldeviation sum of squaresS is expressed as:
S =
k∑t=1
St
We first assume that each trajectory has its own group, i.e.there aren groups. We then reduce the group number fromn
to n-1. This will increase the total deviation sum of squaresS. We selectively merge two groups each time to minimizethe increase ofS. This process is repeated until the groupnumber has reduced fromn to k. In this study, the final groupnumberk is determined by the grouping performance.
Cit is the air pollutant concentrations associated with thetrajectoryXit in groupGt . Hence, the mean air pollutantconcentrationsCt in groupGt can be expressed as:
Ct =1
nt
nt∑i=1
Cit
3 Results and discussion
3.1 General meteorological conditions
The mean sea level pressure and wind field on 1000 hPafor East Asia over the whole sampling period are shownin Fig. 2. The figure was made using NCEP FNL (final)data with a horizontal resolution of 1◦
×1◦ (http://dss.ucar.edu/datasets/ds083.2/). It shows that there was an inten-sive high-pressure system over Northern China, while HongKong and the inland PRD region were in front of the high-pressure ridge. Due to the influence of the high-pressure sys-tem, the prevailing synoptic winds in Hong Kong and the in-land PRD region were from the northeast. Statistical analysisof the ground meteorological observation data suggests thatthe wind speed at the coastal TC site (1.95±0.06 m s−1) washigher than that at the inland WQS site (1.32±0.08 m s−1),and the average wind direction was 97◦ (degrees azimuth, 0◦
means North) at TC and 54◦ at WQS (Table 2). The dif-ferences in wind speed and wind direction at the two sitesimplied that the air masses of the two sites may have haddifferent transport pathways. In contrast, no statistical differ-ences were found for temperature and relatively humidity atthe two sites, respectively (Table 2).
3.2 Spatial distributions and chemical signatures of lo-cal and regional air masses
3.2.1 Spatial patterns of trace gases, total NMHCs andcarbonyls
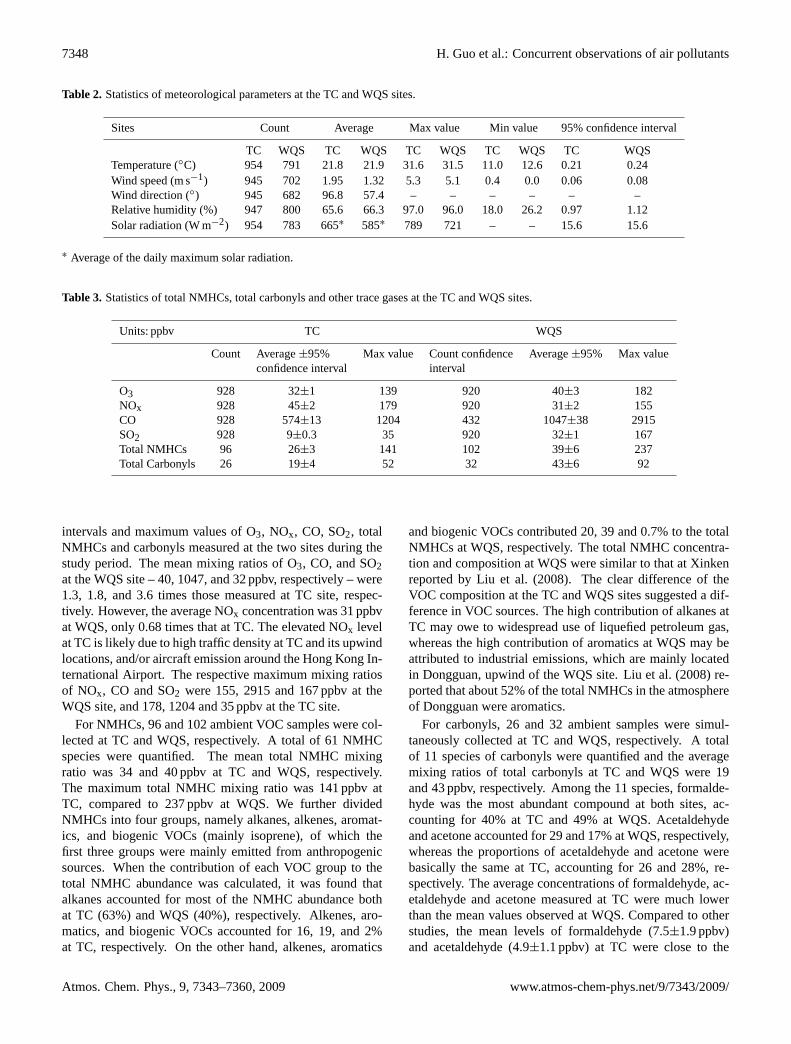
In this study, a total of 928 hourly trace gas averages (i.e. O3,NOx, CO, SO2) were collected at TC, with 920 hourly sam-ples collected at WQS, except for CO (432 counts). Table 3illustrates the data counts, average values, 95% confidence
www.atmos-chem-phys.net/9/7343/2009/ Atmos. Chem. Phys., 9, 7343–7360, 2009
7348 H. Guo et al.: Concurrent observations of air pollutants
Table 2. Statistics of meteorological parameters at the TC and WQS sites.
Sites Count Average Max value Min value 95% confidence interval
TC WQS TC WQS TC WQS TC WQS TC WQSTemperature (◦C) 954 791 21.8 21.9 31.6 31.5 11.0 12.6 0.21 0.24Wind speed (m s−1) 945 702 1.95 1.32 5.3 5.1 0.4 0.0 0.06 0.08Wind direction (◦) 945 682 96.8 57.4 – – – – – –Relative humidity (%) 947 800 65.6 66.3 97.0 96.0 18.0 26.2 0.97 1.12Solar radiation (W m−2) 954 783 665∗ 585∗ 789 721 – – 15.6 15.6
∗ Average of the daily maximum solar radiation.
Table 3. Statistics of total NMHCs, total carbonyls and other trace gases at the TC and WQS sites.
Units: ppbv TC WQS
Count Average±95% Max value Count confidence Average±95% Max valueconfidence interval interval
O3 928 32±1 139 920 40±3 182NOx 928 45±2 179 920 31±2 155CO 928 574±13 1204 432 1047±38 2915SO2 928 9±0.3 35 920 32±1 167Total NMHCs 96 26±3 141 102 39±6 237Total Carbonyls 26 19±4 52 32 43±6 92
intervals and maximum values of O3, NOx, CO, SO2, totalNMHCs and carbonyls measured at the two sites during thestudy period. The mean mixing ratios of O3, CO, and SO2at the WQS site – 40, 1047, and 32 ppbv, respectively – were1.3, 1.8, and 3.6 times those measured at TC site, respec-tively. However, the average NOx concentration was 31 ppbvat WQS, only 0.68 times that at TC. The elevated NOx levelat TC is likely due to high traffic density at TC and its upwindlocations, and/or aircraft emission around the Hong Kong In-ternational Airport. The respective maximum mixing ratiosof NOx, CO and SO2 were 155, 2915 and 167 ppbv at theWQS site, and 178, 1204 and 35 ppbv at the TC site.
For NMHCs, 96 and 102 ambient VOC samples were col-lected at TC and WQS, respectively. A total of 61 NMHCspecies were quantified. The mean total NMHC mixingratio was 34 and 40 ppbv at TC and WQS, respectively.The maximum total NMHC mixing ratio was 141 ppbv atTC, compared to 237 ppbv at WQS. We further dividedNMHCs into four groups, namely alkanes, alkenes, aromat-ics, and biogenic VOCs (mainly isoprene), of which thefirst three groups were mainly emitted from anthropogenicsources. When the contribution of each VOC group to thetotal NMHC abundance was calculated, it was found thatalkanes accounted for most of the NMHC abundance bothat TC (63%) and WQS (40%), respectively. Alkenes, aro-matics, and biogenic VOCs accounted for 16, 19, and 2%at TC, respectively. On the other hand, alkenes, aromatics
and biogenic VOCs contributed 20, 39 and 0.7% to the totalNMHCs at WQS, respectively. The total NMHC concentra-tion and composition at WQS were similar to that at Xinkenreported by Liu et al. (2008). The clear difference of theVOC composition at the TC and WQS sites suggested a dif-ference in VOC sources. The high contribution of alkanes atTC may owe to widespread use of liquefied petroleum gas,whereas the high contribution of aromatics at WQS may beattributed to industrial emissions, which are mainly locatedin Dongguan, upwind of the WQS site. Liu et al. (2008) re-ported that about 52% of the total NMHCs in the atmosphereof Dongguan were aromatics.
For carbonyls, 26 and 32 ambient samples were simul-taneously collected at TC and WQS, respectively. A totalof 11 species of carbonyls were quantified and the averagemixing ratios of total carbonyls at TC and WQS were 19and 43 ppbv, respectively. Among the 11 species, formalde-hyde was the most abundant compound at both sites, ac-counting for 40% at TC and 49% at WQS. Acetaldehydeand acetone accounted for 29 and 17% at WQS, respectively,whereas the proportions of acetaldehyde and acetone werebasically the same at TC, accounting for 26 and 28%, re-spectively. The average concentrations of formaldehyde, ac-etaldehyde and acetone measured at TC were much lowerthan the mean values observed at WQS. Compared to otherstudies, the mean levels of formaldehyde (7.5±1.9 ppbv)and acetaldehyde (4.9±1.1 ppbv) at TC were close to the
Atmos. Chem. Phys., 9, 7343–7360, 2009 www.atmos-chem-phys.net/9/7343/2009/

H. Guo et al.: Concurrent observations of air pollutants 7349
29
844
Figure 1. Location of the sampling sites, Pearl River Delta of Southern China. 845
846
Figure 2. Mean sea level pressure and wind field on 1000 hPa between 22 October and 1 847
December 2007. 848
C H I N A
Fig. 2. Mean sea level pressure and wind field on 1000 hPa between 22 October and 1 December 2007.
roadside values of Hong Kong in 2001–2002 (5.5–8.6 ppbvand 4.2–6.3 ppbv, respectively; Ho et al., 2006), indicat-ing the importance of photochemical production at TC. Onthe other hand, the formaldehyde and acetaldehyde levels atWQS (20.9±2.1 ppbv and 12.6±2.6 ppbv, respectively) weremuch higher than those observed in Guangzhou (10.2 ppbvand 4.2 ppbv, respectively; Feng et al., 2005) during a studyconducted from 15 July–20 September 2003. The high car-bonyls concentrations at WQS could be caused by nearbysources like power plants (in Humen town of Dongguan, ap-proximately 10 km to the southeast of WQS), and by photo-chemical reactions, corresponding with the high O3 concen-trations during the study period. Furthermore, as the sam-pling period in this study was different from those in previousstudies (Feng et al., 2005; Ho et al., 2006), the elevated val-ues found at TC and WQS might imply increased emissionsof carbonyls in the inland PRD region in recent years.
3.2.2 Characteristics of air masses in inland PRD andHong Kong
Carbon monoxide can be considered as an air pollution trans-port indicator due to its relatively long lifetime (months). Ascatter plot (not shown) of CO measured at TC vs. WQSshowed that the correlation coefficient was 0.40. The poorcorrelation implies that the transport of air masses betweenHong Kong and the inland PRD region during this study pe-riod may not be significant, or that local source influencesare a dominant factor.
The concentration ratios of SO2 to NOx and of CO toNOx can provide signatures of the air masses arriving ateach site. In this study, the SO2/NOx ratio was found tobe 0.25±0.01 ppbv/ppbv at TC and 1.26±0.06 ppbv/ppbv atWQS, whereas the CO/NOx ratio was 15.8±0.5 ppbv/ppbv atTC and 52.0±3.8 ppbv/ppbv at WQS. That is, the SO2/NOxand CO/NOx ratios at WQS were much higher than those atTC (p<0.001). This is because the air masses from main-land China are laden with relatively abundant CO and SO2while the air masses in Hong Kong have high NOx levels(Kok et al., 1997; Wang, T. et al., 2001, 2005). Compared toprevious studies, the SO2/NOx and CO/NOx ratios at WQS(1.26 and 52.0, respectively) were 3–4 times higher than thevalues reported in upwind Guangzhou urban areas (0.4 and11.9, respectively) (Zhang et al., 1998; Wang, X. M. et al.,2005). The higher ratios were probably caused by the lowerNOx level due to photochemical conversion at this rural site.
The potential influence of local and regional air masseson the TC site can be therefore evaluated by SO2/NOx andCO/NOx ratios. The SO2/NOx ratios at nine Hong Kongurban air quality monitoring stations were further investi-gated during the same period as this study. The ratio fromOctober to December 2007 ranged from 0.12 to 0.29 (datafrom HKEPD website,http://www.epd.gov.hk), suggestingthat the air masses at TC (SO2/NOx ratio: 0.25) had simi-lar chemical characteristics to that in Hong Kong urban ar-eas. Similarly, we investigated the CO/NOx ratios at HongKong urban air quality monitoring stations during the sameperiod as well. Data at two stations were available, namely
www.atmos-chem-phys.net/9/7343/2009/ Atmos. Chem. Phys., 9, 7343–7360, 2009

7350 H. Guo et al.: Concurrent observations of air pollutants
30
849
Figure 3. Scatter plots of (a) m,p-xylene to ethylbenzene (b) i-butane to propane at TC and WQS 850
during the VOC sampling period. 851
852
Figure 4 Time series of trace gases and total NMHCs between 22 October and 1 December 2007. 853
854
Fig. 3. Scatter plots of(a) m, p-xylene to ethylbenzene(b) i-butane to propane at TC and WQS during the VOC sampling period.
Tsuen Wan and Yuen Long, with ratios of 14.6±0.7 and20.6±0.6 ppbv/ppbv, respectively, which were similar to thevalue at TC (15.8 ppbv/ppbv). Hence, both the SO2/NOx andCO/NOx ratios suggest that the air masses at TC were mainlyimpacted by Hong Kong local emissions, in particular, theemissions of NOx, and that there does not appear to havebeen a significant temporal change in these ratios during thisdecade for autumn values.
The ratios of VOCs with different photochemical lifetimesare useful tools to examine the atmospheric processes of airmasses, including atmospheric transport and photochemicalaging. Due to different lifetimes of two given VOC species,their ratio may change during the course of air mass trans-port. Using the ratio of a more reactive VOC to a less re-active VOC, a higher ratio indicates relatively little photo-chemical processing of the air mass and major impact fromlocal emissions. On the other hand, a lower ratio is reflec-tive of more aged VOC mixes and thus presumably that theVOCs were emitted from more distant sources. Comparisonsof the ratios among sites can be used to estimate the relativeages of air parcels and help provide evidence of transporthistories. Moreover, this ratio analysis can further indicatewhether the site is dominantly affected by pollutants fromlocal or regional sources. In this study, we compared theratios ofm, p-xylene/ethylbenzene andi-butane/propane atthe two sites as a measure of atmospheric processing in dif-ferent air masses (e.g. Grosjean et al., 1999; So and Wang,2004; Guo et al., 2007).m, p-Xylene and ethylbenzene aremainly emitted from vehicles and solvent usage, whereasi-butane and propane have an origin of liquefied petroleum gasemission (Guo et al., 2007).m, p-Xylene is more reactivethan ethylbenzene, with lifetimes about 1 and 2 days, re-spectively;i-butane also has a shorter lifetime than propane,with lifetimes of about 6 and 12 days, respectively. Figure3 shows the scatter plots of (a)m, p-xylene to ethylbenzeneand (b)i-butane to propane at TC and WQS. Clearly, TC had
higher slopes than WQS for both VOC ratios, with anm, p-xylene/ethylbenzene ratio of 1.07 (versus 0.91 at WQS), andani-butane/propane ratio of 0.38 (versus 0.26 at WQS). Theresults suggested that the air masses at WQS were more agedthan that at TC, reflecting the higher importance of regionaltransport at the WQS site.
3.3 Temporal variations
3.3.1 Day-to-day variations
Figure 4 shows the day-to-day variations of O3, NOx, CO,SO2, and total NMHCs at the two sites, which were some-times similar on consecutive days such as 25–26 October:high concentrations of CO, SO2, NOx and O3 were observedat both sites on both days. In contrast, the day-to-day varia-tions at the two sites showed differing daily patterns on otherdays such as 26–27 October: high levels of air pollutantswere recorded on 26 October whereas the levels of air pol-lutants on 27 October were rather low. At the WQS sitethe maximum hourly average O3 concentration during thestudy reached 182 ppbv, whereas the peak hourly value was139 ppbv at the TC site (see Table 3). The number of O3episode days (the daily maximum value exceeds the HongKong Air Quality Objective of 122 ppbv) reached 13 daysout of 41 sampling days at WQS, compared to only 2 days atTC.
The concentrations of air pollutants have a close relation-ship with weather conditions, such as temperature, wind, so-lar radiation and so on (Wang et al., 2001, 2003; Wang andKwok, 2003). Figure 5 also shows the time series of temper-ature, relative humidity, solar radiation and wind observedat the two sites during the study period. It can be seen thatthere were four clearly cooling processes, which happenedon 30 October-1 November, 7–8 November, 18–19 Novem-ber, and 26–29 November. These processes, with a decrease
Atmos. Chem. Phys., 9, 7343–7360, 2009 www.atmos-chem-phys.net/9/7343/2009/

H. Guo et al.: Concurrent observations of air pollutants 7351
30
849
Figure 3. Scatter plots of (a) m,p-xylene to ethylbenzene (b) i-butane to propane at TC and WQS 850
during the VOC sampling period. 851
852
Figure 4 Time series of trace gases and total NMHCs between 22 October and 1 December 2007. 853
854 Fig. 4. Time series of trace gases and total NMHCs between 22 October and 1 December 2007.
31
855
Figure 5. Time series of the main meteorological factors between 22 October and 1 December 856
2007. 857
858
859
860
861
862
Fig. 5. Time series of the main meteorological factors between 22 October and 1 December 2007.
in air temperature, relative humidity and solar radiation, weregenerally associated with cold fronts, which brought dry andcold continental outflows to Southern China (Wang et al.,2003).
With the change of weather conditions, the concentrationsof air pollutants changed correspondingly (see Figs. 4 and5). Generally, when the northerly monsoons were enhanced,
the CO levels were dramatically increased at both sites (forexample, 30 October-1 November and 18–19 November).Chung et al. (1999) investigated the relationship betweenhigh CO episodes and synoptic conditions at a coastal stationin Hong Kong and found similar features as well. In contrastto CO, the O3 levels had a decreasing trend with enhancednortherly monsoons at both sites (for example, 30 October–1
www.atmos-chem-phys.net/9/7343/2009/ Atmos. Chem. Phys., 9, 7343–7360, 2009
7352 H. Guo et al.: Concurrent observations of air pollutants
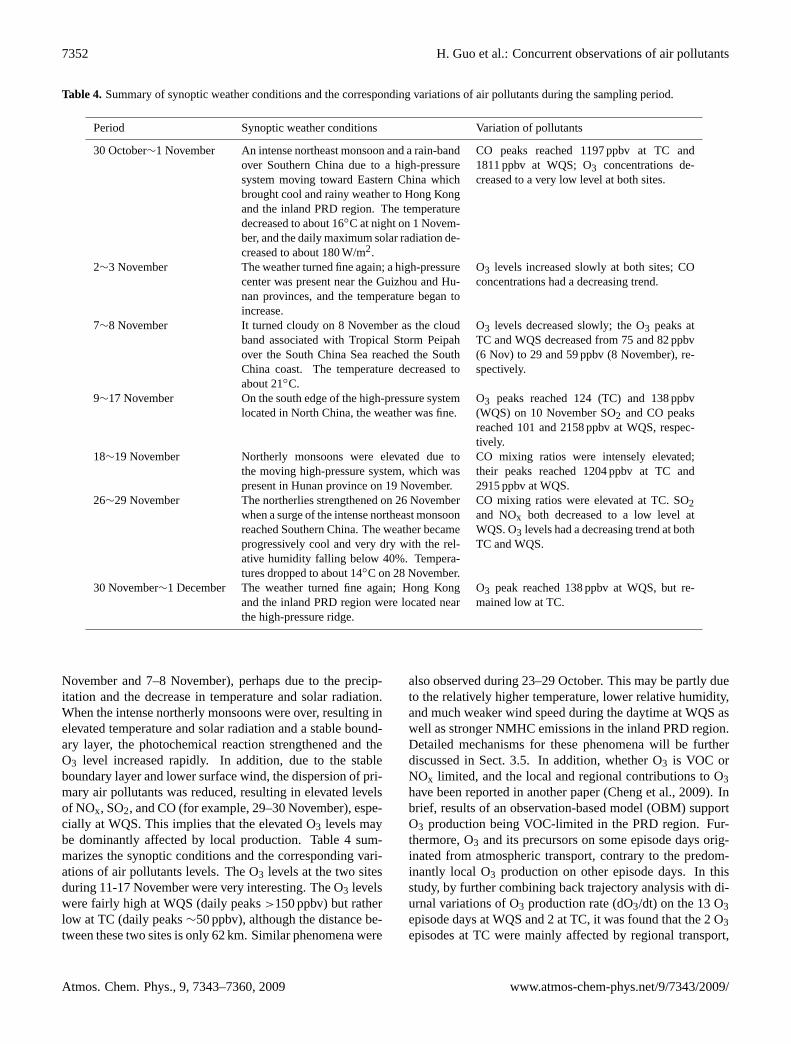
Table 4. Summary of synoptic weather conditions and the corresponding variations of air pollutants during the sampling period.
Period Synoptic weather conditions Variation of pollutants
30 October∼1 November An intense northeast monsoon and a rain-bandover Southern China due to a high-pressuresystem moving toward Eastern China whichbrought cool and rainy weather to Hong Kongand the inland PRD region. The temperaturedecreased to about 16◦C at night on 1 Novem-ber, and the daily maximum solar radiation de-creased to about 180 W/m2.
CO peaks reached 1197 ppbv at TC and1811 ppbv at WQS; O3 concentrations de-creased to a very low level at both sites.
2∼3 November The weather turned fine again; a high-pressurecenter was present near the Guizhou and Hu-nan provinces, and the temperature began toincrease.
O3 levels increased slowly at both sites; COconcentrations had a decreasing trend.
7∼8 November It turned cloudy on 8 November as the cloudband associated with Tropical Storm Peipahover the South China Sea reached the SouthChina coast. The temperature decreased toabout 21◦C.
O3 levels decreased slowly; the O3 peaks atTC and WQS decreased from 75 and 82 ppbv(6 Nov) to 29 and 59 ppbv (8 November), re-spectively.
9∼17 November On the south edge of the high-pressure systemlocated in North China, the weather was fine.
O3 peaks reached 124 (TC) and 138 ppbv(WQS) on 10 November SO2 and CO peaksreached 101 and 2158 ppbv at WQS, respec-tively.
18∼19 November Northerly monsoons were elevated due tothe moving high-pressure system, which waspresent in Hunan province on 19 November.
CO mixing ratios were intensely elevated;their peaks reached 1204 ppbv at TC and2915 ppbv at WQS.
26∼29 November The northerlies strengthened on 26 Novemberwhen a surge of the intense northeast monsoonreached Southern China. The weather becameprogressively cool and very dry with the rel-ative humidity falling below 40%. Tempera-tures dropped to about 14◦C on 28 November.
CO mixing ratios were elevated at TC. SO2and NOx both decreased to a low level atWQS. O3 levels had a decreasing trend at bothTC and WQS.
30 November∼1 December The weather turned fine again; Hong Kongand the inland PRD region were located nearthe high-pressure ridge.
O3 peak reached 138 ppbv at WQS, but re-mained low at TC.
November and 7–8 November), perhaps due to the precip-itation and the decrease in temperature and solar radiation.When the intense northerly monsoons were over, resulting inelevated temperature and solar radiation and a stable bound-ary layer, the photochemical reaction strengthened and theO3 level increased rapidly. In addition, due to the stableboundary layer and lower surface wind, the dispersion of pri-mary air pollutants was reduced, resulting in elevated levelsof NOx, SO2, and CO (for example, 29–30 November), espe-cially at WQS. This implies that the elevated O3 levels maybe dominantly affected by local production. Table 4 sum-marizes the synoptic conditions and the corresponding vari-ations of air pollutants levels. The O3 levels at the two sitesduring 11-17 November were very interesting. The O3 levelswere fairly high at WQS (daily peaks>150 ppbv) but ratherlow at TC (daily peaks∼50 ppbv), although the distance be-tween these two sites is only 62 km. Similar phenomena were
also observed during 23–29 October. This may be partly dueto the relatively higher temperature, lower relative humidity,and much weaker wind speed during the daytime at WQS aswell as stronger NMHC emissions in the inland PRD region.Detailed mechanisms for these phenomena will be furtherdiscussed in Sect. 3.5. In addition, whether O3 is VOC orNOx limited, and the local and regional contributions to O3have been reported in another paper (Cheng et al., 2009). Inbrief, results of an observation-based model (OBM) supportO3 production being VOC-limited in the PRD region. Fur-thermore, O3 and its precursors on some episode days orig-inated from atmospheric transport, contrary to the predom-inantly local O3 production on other episode days. In thisstudy, by further combining back trajectory analysis with di-urnal variations of O3 production rate (dO3/dt) on the 13 O3episode days at WQS and 2 at TC, it was found that the 2 O3episodes at TC were mainly affected by regional transport,
Atmos. Chem. Phys., 9, 7343–7360, 2009 www.atmos-chem-phys.net/9/7343/2009/
H. Guo et al.: Concurrent observations of air pollutants 7353
32
863
Figure 6 Mean diurnal variations of Figure 7 Diurnal variation of total NMHCs, other trace gases and 864
total NMHCs, other trace gases and wind fields on 26 and 27 October. 865
wind fields between 23 October to 866
1 December (total NMHCs were 867
averaged using all VOC samples 868
from 8 sampling days). 869
870
871
Figure 8. Three typical back trajectories for each site at the 200 m height level. 872
873
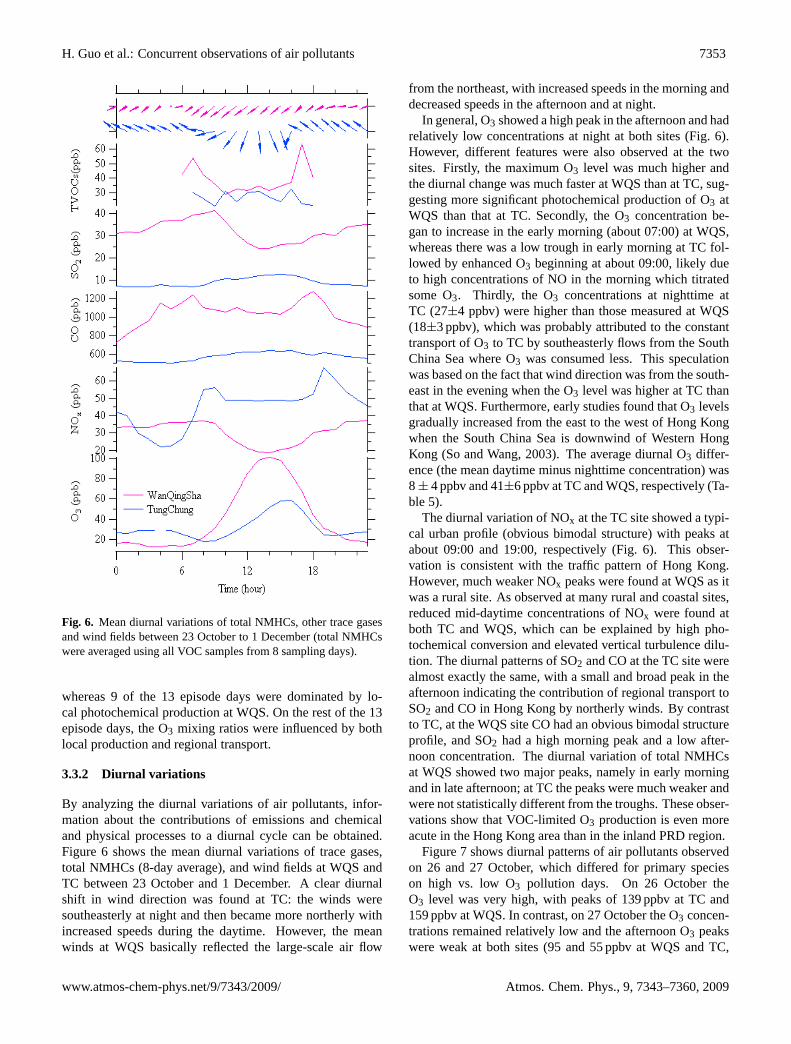
Fig. 6. Mean diurnal variations of total NMHCs, other trace gasesand wind fields between 23 October to 1 December (total NMHCswere averaged using all VOC samples from 8 sampling days).
whereas 9 of the 13 episode days were dominated by lo-cal photochemical production at WQS. On the rest of the 13episode days, the O3 mixing ratios were influenced by bothlocal production and regional transport.
3.3.2 Diurnal variations
By analyzing the diurnal variations of air pollutants, infor-mation about the contributions of emissions and chemicaland physical processes to a diurnal cycle can be obtained.Figure 6 shows the mean diurnal variations of trace gases,total NMHCs (8-day average), and wind fields at WQS andTC between 23 October and 1 December. A clear diurnalshift in wind direction was found at TC: the winds weresoutheasterly at night and then became more northerly withincreased speeds during the daytime. However, the meanwinds at WQS basically reflected the large-scale air flow
from the northeast, with increased speeds in the morning anddecreased speeds in the afternoon and at night.
In general, O3 showed a high peak in the afternoon and hadrelatively low concentrations at night at both sites (Fig. 6).However, different features were also observed at the twosites. Firstly, the maximum O3 level was much higher andthe diurnal change was much faster at WQS than at TC, sug-gesting more significant photochemical production of O3 atWQS than that at TC. Secondly, the O3 concentration be-gan to increase in the early morning (about 07:00) at WQS,whereas there was a low trough in early morning at TC fol-lowed by enhanced O3 beginning at about 09:00, likely dueto high concentrations of NO in the morning which titratedsome O3. Thirdly, the O3 concentrations at nighttime atTC (27±4 ppbv) were higher than those measured at WQS(18±3 ppbv), which was probably attributed to the constanttransport of O3 to TC by southeasterly flows from the SouthChina Sea where O3 was consumed less. This speculationwas based on the fact that wind direction was from the south-east in the evening when the O3 level was higher at TC thanthat at WQS. Furthermore, early studies found that O3 levelsgradually increased from the east to the west of Hong Kongwhen the South China Sea is downwind of Western HongKong (So and Wang, 2003). The average diurnal O3 differ-ence (the mean daytime minus nighttime concentration) was8± 4 ppbv and 41±6 ppbv at TC and WQS, respectively (Ta-ble 5).
The diurnal variation of NOx at the TC site showed a typi-cal urban profile (obvious bimodal structure) with peaks atabout 09:00 and 19:00, respectively (Fig. 6). This obser-vation is consistent with the traffic pattern of Hong Kong.However, much weaker NOx peaks were found at WQS as itwas a rural site. As observed at many rural and coastal sites,reduced mid-daytime concentrations of NOx were found atboth TC and WQS, which can be explained by high pho-tochemical conversion and elevated vertical turbulence dilu-tion. The diurnal patterns of SO2 and CO at the TC site werealmost exactly the same, with a small and broad peak in theafternoon indicating the contribution of regional transport toSO2 and CO in Hong Kong by northerly winds. By contrastto TC, at the WQS site CO had an obvious bimodal structureprofile, and SO2 had a high morning peak and a low after-noon concentration. The diurnal variation of total NMHCsat WQS showed two major peaks, namely in early morningand in late afternoon; at TC the peaks were much weaker andwere not statistically different from the troughs. These obser-vations show that VOC-limited O3 production is even moreacute in the Hong Kong area than in the inland PRD region.
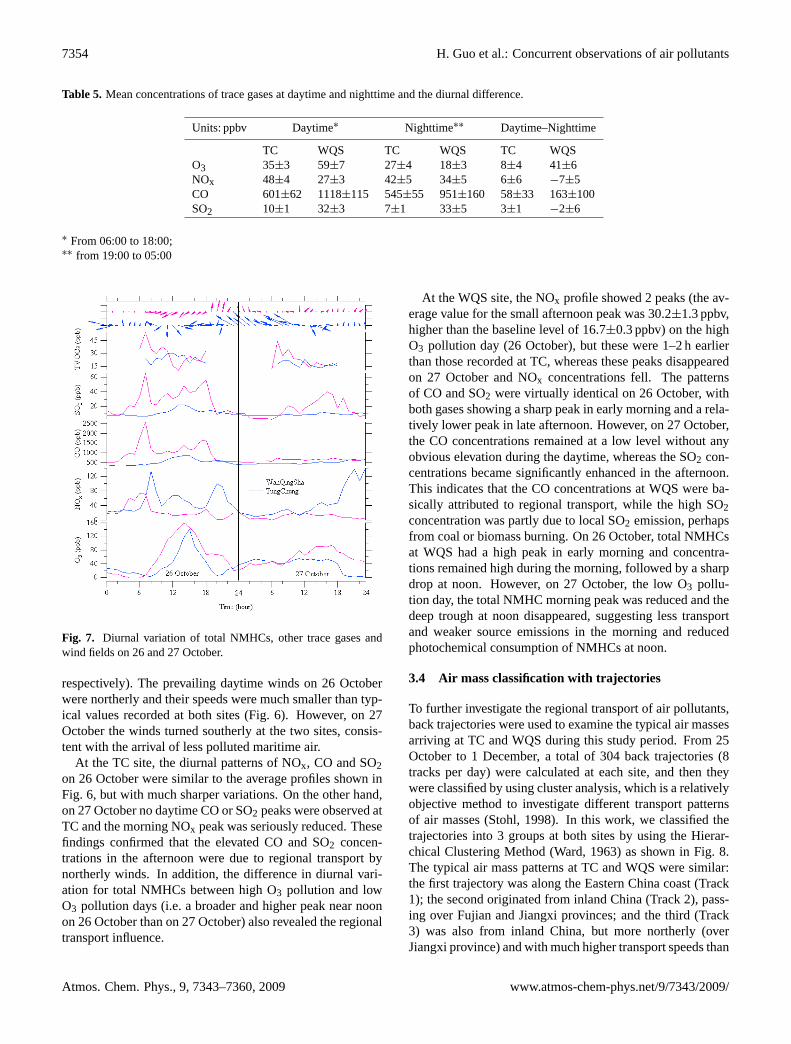
Figure 7 shows diurnal patterns of air pollutants observedon 26 and 27 October, which differed for primary specieson high vs. low O3 pollution days. On 26 October theO3 level was very high, with peaks of 139 ppbv at TC and159 ppbv at WQS. In contrast, on 27 October the O3 concen-trations remained relatively low and the afternoon O3 peakswere weak at both sites (95 and 55 ppbv at WQS and TC,
www.atmos-chem-phys.net/9/7343/2009/ Atmos. Chem. Phys., 9, 7343–7360, 2009
7354 H. Guo et al.: Concurrent observations of air pollutants
Table 5. Mean concentrations of trace gases at daytime and nighttime and the diurnal difference.
Units: ppbv Daytime∗ Nighttime∗∗ Daytime–Nighttime
TC WQS TC WQS TC WQSO3 35±3 59±7 27±4 18±3 8±4 41±6NOx 48±4 27±3 42±5 34±5 6±6 −7±5CO 601±62 1118±115 545±55 951±160 58±33 163±100SO2 10±1 32±3 7±1 33±5 3±1 −2±6
∗ From 06:00 to 18:00;∗∗ from 19:00 to 05:00
32
863
Figure 6 Mean diurnal variations of Figure 7 Diurnal variation of total NMHCs, other trace gases and 864
total NMHCs, other trace gases and wind fields on 26 and 27 October. 865
wind fields between 23 October to 866
1 December (total NMHCs were 867
averaged using all VOC samples 868
from 8 sampling days). 869
870
871
Figure 8. Three typical back trajectories for each site at the 200 m height level. 872
873
Fig. 7. Diurnal variation of total NMHCs, other trace gases andwind fields on 26 and 27 October.
respectively). The prevailing daytime winds on 26 Octoberwere northerly and their speeds were much smaller than typ-ical values recorded at both sites (Fig. 6). However, on 27October the winds turned southerly at the two sites, consis-tent with the arrival of less polluted maritime air.
At the TC site, the diurnal patterns of NOx, CO and SO2on 26 October were similar to the average profiles shown inFig. 6, but with much sharper variations. On the other hand,on 27 October no daytime CO or SO2 peaks were observed atTC and the morning NOx peak was seriously reduced. Thesefindings confirmed that the elevated CO and SO2 concen-trations in the afternoon were due to regional transport bynortherly winds. In addition, the difference in diurnal vari-ation for total NMHCs between high O3 pollution and lowO3 pollution days (i.e. a broader and higher peak near noonon 26 October than on 27 October) also revealed the regionaltransport influence.
At the WQS site, the NOx profile showed 2 peaks (the av-erage value for the small afternoon peak was 30.2±1.3 ppbv,higher than the baseline level of 16.7±0.3 ppbv) on the highO3 pollution day (26 October), but these were 1–2 h earlierthan those recorded at TC, whereas these peaks disappearedon 27 October and NOx concentrations fell. The patternsof CO and SO2 were virtually identical on 26 October, withboth gases showing a sharp peak in early morning and a rela-tively lower peak in late afternoon. However, on 27 October,the CO concentrations remained at a low level without anyobvious elevation during the daytime, whereas the SO2 con-centrations became significantly enhanced in the afternoon.This indicates that the CO concentrations at WQS were ba-sically attributed to regional transport, while the high SO2concentration was partly due to local SO2 emission, perhapsfrom coal or biomass burning. On 26 October, total NMHCsat WQS had a high peak in early morning and concentra-tions remained high during the morning, followed by a sharpdrop at noon. However, on 27 October, the low O3 pollu-tion day, the total NMHC morning peak was reduced and thedeep trough at noon disappeared, suggesting less transportand weaker source emissions in the morning and reducedphotochemical consumption of NMHCs at noon.
3.4 Air mass classification with trajectories
To further investigate the regional transport of air pollutants,back trajectories were used to examine the typical air massesarriving at TC and WQS during this study period. From 25October to 1 December, a total of 304 back trajectories (8tracks per day) were calculated at each site, and then theywere classified by using cluster analysis, which is a relativelyobjective method to investigate different transport patternsof air masses (Stohl, 1998). In this work, we classified thetrajectories into 3 groups at both sites by using the Hierar-chical Clustering Method (Ward, 1963) as shown in Fig. 8.The typical air mass patterns at TC and WQS were similar:the first trajectory was along the Eastern China coast (Track1); the second originated from inland China (Track 2), pass-ing over Fujian and Jiangxi provinces; and the third (Track3) was also from inland China, but more northerly (overJiangxi province) and with much higher transport speeds than
Atmos. Chem. Phys., 9, 7343–7360, 2009 www.atmos-chem-phys.net/9/7343/2009/

H. Guo et al.: Concurrent observations of air pollutants 7355
Table 6. Proportion of air masses associated with each track and the corresponding concentrations of trace gases.
Track 1 Track 2 Track 3
TC WQS TC WQS TC WQSProportion (%) 44 25 17 41 39 34O3 (ppbv) 35±3∗ 47±11 31±7 37±7 27±3 35±5NOx (ppbv) 40±5 30±5 48±7 37±4 49±4 25±4CO (ppbv) 470±30 894±64 648±45 1232±113 680±37 1351±153SO2 (ppbv) 8±1 27±4 9±1 38±4 11±1 31±3Total NMHCs (ppbv) 22±5 40±9 30±15 30±5 – –
∗ Mean±95% confidence interval.
32
863
Figure 6 Mean diurnal variations of Figure 7 Diurnal variation of total NMHCs, other trace gases and 864
total NMHCs, other trace gases and wind fields on 26 and 27 October. 865
wind fields between 23 October to 866
1 December (total NMHCs were 867
averaged using all VOC samples 868
from 8 sampling days). 869
870
871
Figure 8. Three typical back trajectories for each site at the 200 m height level. 872
873 Fig. 8. Three typical back trajectories for each site at the 200 mheight level.
Track 2. The proportion of air masses associated with eachtrack and the corresponding concentrations of air pollutantsare shown in Table 6. At TC, the air masses were mainlyfrom Track 1 (44%), followed by Track 3 (39%) and Track 2(17%). By comparison, the air masses arriving at WQS weremainly from Track 2 (41%), then Track 3 (34%) and Track 1(25%). These results confirm the discussion in Sect. 3.1 thatthe air masses sources of the two sites differed somewhat.
As anticipated at TC, air masses from Track 1 had thelowest concentrations for primary pollutants (i.e. NOx, CO,SO2), and those from Track 3 had the highest concentrationsof trace gases (p<0.01). In contrast, the mean O3 concentra-tion for Track 1 (35±3 ppbv) was significantly higher thanthat for Track 3 (27±3 ppbv) (p<0.01). Inspecting the cor-responding times of the Track 1 and Track 3 air masses, wefound that the transport pathways of air masses were mainlydominated by Track 3 when the northerly monsoons were el-evated, while Track 1 air masses were generally observed un-der fine weather conditions, i.e. with stronger solar radiation.It should be pointed out that these results were from the caseof averaged concentration. The particle release simulations(Sect. 3.5) suggest an important role of inland anthropogenicemissions to the afternoon ozone episode at the TC site.
At WQS, Track 2 air masses had the highest concen-trations of NOx (37±4 ppbv) and SO2 (38±4 ppbv), whichwere significantly higher than the concentrations of Track3 (p<0.05). The higher NOx and SO2 concentrations weremost likely caused by chimney emissions of the power plantin Humen town of Dongguan, because Track 2 passes overthe power plant area (labeled in Fig. 1). As was the casewith TC, the air masses from Track 1 (i.e. the coastline)had the lowest concentrations of CO (894±64 ppbv) com-pared to Tracks 2 and 3 (p<0.001), and the CO concentra-tions from Track 2 and Track 3 had no obvious difference(p = 0.26), indicating strong transport influences of CO fromEastern China regions. For O3, there were no statistical dif-ferences among the three tracks, further suggesting that O3levels were dominantly affected by local production and/orsub-regional transport.
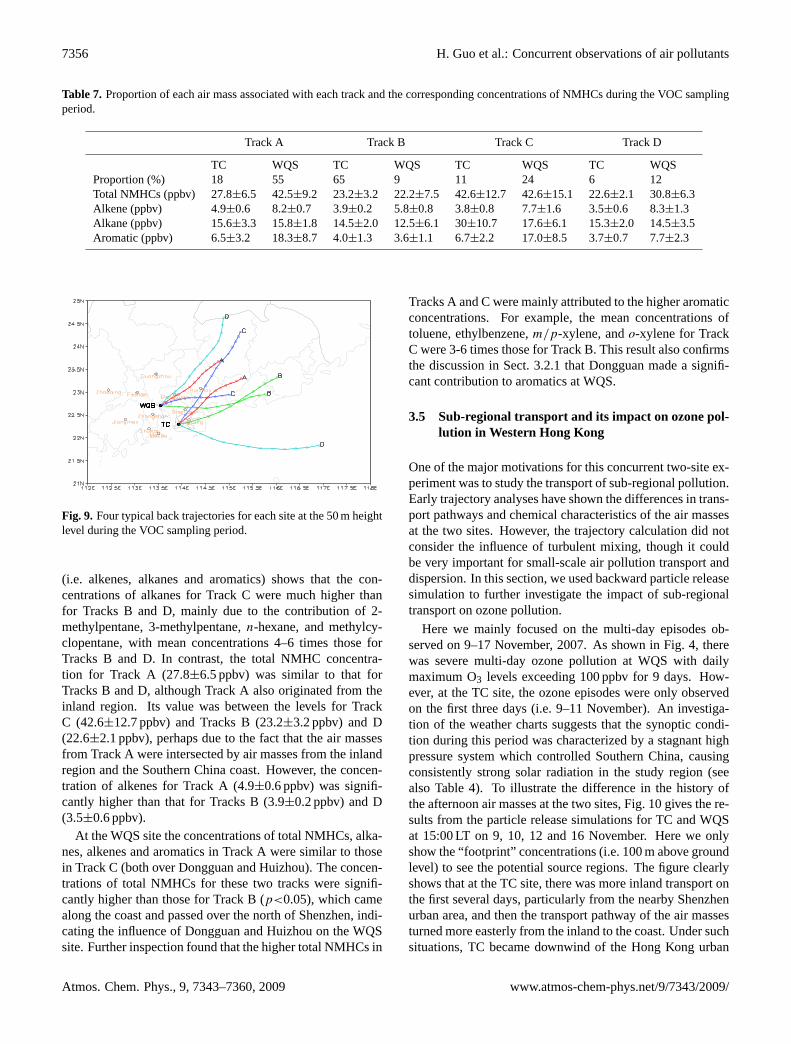
In contrast to the trace gases CO, SO2, NOx and O3,the NMHCs were manually monitored for 8 sampling dayswithin the study period. All samples were found to originatefrom Track 1 and Track 2, and no samples were observedfrom Track 3. Furthermore, because of relatively small sam-ple size there was no statistical difference in NMHC con-centration between the two tracks at both sites (p>0.05).In order to obtain a more detailed signature of NMHCs indifferent air masses, much a finer back trajectory analysiswas conducted to better understand the influence of regionaltransport on NMHCs. Nine-km resolution WRF output datawere used in the HYSPLIT model, and 12-hour back trajec-tories at a 50 m height level were calculated for each hourduring the VOC sampling period at both sites. Four groupsof air masses were identified at each site, namely, Tracks A,B, C, and D (Fig. 9). The corresponding concentrations ofNMHCs for each track were calculated as well (Table 7).
At the TC site, the air masses from Track C (passingover the inland region) had a higher total NMHC concen-tration than air masses from Tracks B and D (p<0.05),which originated from the coast and the South China Sea,respectively, suggesting the significant influence of emissionfrom the inland PRD region (mainly the northeastern part,i.e. Huizhou and Shenzhen) on NMHC levels at TC (Ta-ble 7). Further inspection of the anthropogenic NMHCs
www.atmos-chem-phys.net/9/7343/2009/ Atmos. Chem. Phys., 9, 7343–7360, 2009
7356 H. Guo et al.: Concurrent observations of air pollutants
Table 7. Proportion of each air mass associated with each track and the corresponding concentrations of NMHCs during the VOC samplingperiod.
Track A Track B Track C Track D
TC WQS TC WQS TC WQS TC WQSProportion (%) 18 55 65 9 11 24 6 12Total NMHCs (ppbv) 27.8±6.5 42.5±9.2 23.2±3.2 22.2±7.5 42.6±12.7 42.6±15.1 22.6±2.1 30.8±6.3Alkene (ppbv) 4.9±0.6 8.2±0.7 3.9±0.2 5.8±0.8 3.8±0.8 7.7±1.6 3.5±0.6 8.3±1.3Alkane (ppbv) 15.6±3.3 15.8±1.8 14.5±2.0 12.5±6.1 30±10.7 17.6±6.1 15.3±2.0 14.5±3.5Aromatic (ppbv) 6.5±3.2 18.3±8.7 4.0±1.3 3.6±1.1 6.7±2.2 17.0±8.5 3.7±0.7 7.7±2.3
33
874
Figure 9. Four typical back trajectories for each site at the 50 m height level during the VOC 875
sampling period. 876
877
878
Fig. 9. Four typical back trajectories for each site at the 50 m heightlevel during the VOC sampling period.
(i.e. alkenes, alkanes and aromatics) shows that the con-centrations of alkanes for Track C were much higher thanfor Tracks B and D, mainly due to the contribution of 2-methylpentane, 3-methylpentane,n-hexane, and methylcy-clopentane, with mean concentrations 4–6 times those forTracks B and D. In contrast, the total NMHC concentra-tion for Track A (27.8±6.5 ppbv) was similar to that forTracks B and D, although Track A also originated from theinland region. Its value was between the levels for TrackC (42.6±12.7 ppbv) and Tracks B (23.2±3.2 ppbv) and D(22.6±2.1 ppbv), perhaps due to the fact that the air massesfrom Track A were intersected by air masses from the inlandregion and the Southern China coast. However, the concen-tration of alkenes for Track A (4.9±0.6 ppbv) was signifi-cantly higher than that for Tracks B (3.9±0.2 ppbv) and D(3.5±0.6 ppbv).
At the WQS site the concentrations of total NMHCs, alka-nes, alkenes and aromatics in Track A were similar to thosein Track C (both over Dongguan and Huizhou). The concen-trations of total NMHCs for these two tracks were signifi-cantly higher than those for Track B (p<0.05), which camealong the coast and passed over the north of Shenzhen, indi-cating the influence of Dongguan and Huizhou on the WQSsite. Further inspection found that the higher total NMHCs in
Tracks A and C were mainly attributed to the higher aromaticconcentrations. For example, the mean concentrations oftoluene, ethylbenzene,m/p-xylene, ando-xylene for TrackC were 3-6 times those for Track B. This result also confirmsthe discussion in Sect. 3.2.1 that Dongguan made a signifi-cant contribution to aromatics at WQS.
3.5 Sub-regional transport and its impact on ozone pol-lution in Western Hong Kong
One of the major motivations for this concurrent two-site ex-periment was to study the transport of sub-regional pollution.Early trajectory analyses have shown the differences in trans-port pathways and chemical characteristics of the air massesat the two sites. However, the trajectory calculation did notconsider the influence of turbulent mixing, though it couldbe very important for small-scale air pollution transport anddispersion. In this section, we used backward particle releasesimulation to further investigate the impact of sub-regionaltransport on ozone pollution.
Here we mainly focused on the multi-day episodes ob-served on 9–17 November, 2007. As shown in Fig. 4, therewas severe multi-day ozone pollution at WQS with dailymaximum O3 levels exceeding 100 ppbv for 9 days. How-ever, at the TC site, the ozone episodes were only observedon the first three days (i.e. 9–11 November). An investiga-tion of the weather charts suggests that the synoptic condi-tion during this period was characterized by a stagnant highpressure system which controlled Southern China, causingconsistently strong solar radiation in the study region (seealso Table 4). To illustrate the difference in the history ofthe afternoon air masses at the two sites, Fig. 10 gives the re-sults from the particle release simulations for TC and WQSat 15:00 LT on 9, 10, 12 and 16 November. Here we onlyshow the “footprint” concentrations (i.e. 100 m above groundlevel) to see the potential source regions. The figure clearlyshows that at the TC site, there was more inland transport onthe first several days, particularly from the nearby Shenzhenurban area, and then the transport pathway of the air massesturned more easterly from the inland to the coast. Under suchsituations, TC became downwind of the Hong Kong urban
Atmos. Chem. Phys., 9, 7343–7360, 2009 www.atmos-chem-phys.net/9/7343/2009/

H. Guo et al.: Concurrent observations of air pollutants 7357
34
879
880
Figure 10 (a-d) Distribution of air mass concentrations (in unit of mass/m3 h) within surface 100 881
m from HYSPLIT Lagrangian backward particle release simulation for WQS and TC at 15:00LT 882
on 9 - 10, 12 and 16 November, 2007. 883
884
885
Fig. 10. (a–d)Distribution of air mass concentrations (in unit of mass/m3 h) within surface 100 m from HYSPLIT Lagrangian backwardparticle release simulation for WQS and TC at 15:00 LT on 9–10, 12 and 16 November 2007.
area, whereas the WQS site was consistently downwind ofDongguan and Huizhou. Hence, with the condition of strongsolar radiation, high anthropogenic emissions from this area(i.e. Dongguan, Shenzhen and Huizhou) caused high pho-tochemical pollution for the entire period at WQS and thefirst three days at TC, suggesting that large scale synopticweather, affecting regional/sub-regional transport, plays animportant role in ozone pollution in west Hong Kong in au-tumn. The cross-boundary transport makes it much difficultto formulate an effective air pollution control policy for localgovernments. An inseparable collaboration between inlandPRD and Hong Kong governments is needed to jointly solve
the photochemical pollution in this region. The retroplumepattern in Fig. 10 also shows that the plume width was muchboarder in the early stage of the episode period, suggesting asmall wind speed and a high horizontal dispersion. It is note-worthy that the method used in this study only accounted forgeneral transport and dispersion patterns for this O3 episodeevent. A more detailed analysis with 3-D chemical transportmodel will be carried out in the future.
www.atmos-chem-phys.net/9/7343/2009/ Atmos. Chem. Phys., 9, 7343–7360, 2009

7358 H. Guo et al.: Concurrent observations of air pollutants
4 Summary and conclusions
We analyzed measurement data collected concurrently at asite in the inland PRD region (WQS) and a site in greaterHong Kong (TC). The average levels of air pollutants at theWQS site were much higher than those at the TC site, withthe exception for NOx. The respective mean mixing ratios(±95% confidence interval) at WQS and TC were 40±2 and32±1 ppbv (O3), 31±2 and 45±2 ppbv (NOx), 1047±38 and574±13 ppbv (CO), 32±1 and 9±0.3 ppbv (SO2), 40±6 and33±4 ppbv (total NMHCs), and 43±6 ppbv and 19±4 ppbv(total carbonyls). The relatively high CO levels at WQS wereattributed to regional emissions, and the high SO2 levels atWQS were attributed to local power plant emissions in Hu-men of Dongguan. By comparison, the high traffic densityin Hong Kong contributed to the elevated NOx levels at TC.In addition, the results from this study indicate that carbonyllevels in the region have increased in recent years.
Northerly monsoons bring cold, dry air from the innerAsian continent to the PRD region. Whereas elevated COlevels were generally observed at both sites when northerlymonsoons were enhanced, the monsoons were associatedwith a decreasing O3 trend. Instead, O3 episodes usually oc-curred when weather systems were relatively stable. Anal-ysis of the synoptic weather conditions and variations ofair pollutants indicated that high O3 levels were mainly at-tributed to local photochemical production. However, sig-nificant differences in diurnal variations of air pollutantswere also observed at the two sites, indicating different lo-cal and regional contributions. In particular, ozone episodeswere stronger and more frequent at WQS than TC. Duringthe sampling period the daily maximum O3 value exceeded122 ppbv 13 times at WQS compared to 2 times at TC, withmaximum O3 levels of 182 ppbv at WQS vs. 139 ppbv at TC.Diurnal variations of O3 showed higher nighttime levels ofO3 at TC than at WQS as well as more photochemical activ-ity at WQS than TC. At each site, remarkable differences indiurnal variations were also found between high and low O3pollution days. An important conclusion from this work isthat Hong Kong is more acutely VOC-limited than the inlandPRD region.
A detailed look at the NMHCs showed that the composi-tion of NMHCs and carbonyls were different at the two sites,with relatively higher levels of alkanes at TC that were at-tributed to LPG usage, and relatively higher levels of aro-matics at WQS that were due to industry. Various air pollu-tant ratios (SO2/NOx, CO/NOx, m, p-xylene/ethylbenzene,i-butane/propane) further suggested that air masses arrivingat TC were mainly affected by local emissions superimposedby regional transport, whereas the air at WQS was highly in-fluenced by regional emissions and was therefore more aged.Indeed, backward trajectory analysis showed that air massesarriving at these two sites had different transport pathways.This finding was corroborated by higher wind speeds and dif-ferent wind directions at TC than WQS. The back trajecto-
ries showed that air masses arriving at WQS were mainlyaffected by inland China, including Dongguan and Huizhou,whereas air masses arriving at TC were primarily from theEast China Coast, which brought lower levels of pollutants toHong Kong. However, the anthropogenic emissions in East-ern PRD (e.g. Shenzhen urban area) could be transported toWestern Hong Kong and cause serious photochemical pollu-tion there.
Acknowledgements.The authors thank Steven Poon, ZengyueLi, and Wai Chun Tse for their help with sample collections.The project is supported by the Research Grants Council of theHong Kong Special Administrative Region (Project No. PolyU5163/07E), the Postgraduate Studentship (RGYE) and the ResearchGrant (87PK) of the Hong Kong Polytechnic University, and theNational Key Basic Research Support Foundation of China (GrantNo. 2006CB403706, 2006CB403703).
Edited by: T. Karl
References
Aneja, V. P., Kim, D. S., Das, M., and Hartsell, B. E.: Measure-ments and analysis of reactive nitrogen species in the rural tro-posphere of southeast United States: southern oxidant study sitesonia, Atmos. Environ., 30(4), 649–659, 1996.
Barletta, B., Meinardi, S., Simpson, I. J., Zou, S. C., Rowland, F.S., and Blake, D. R.: Ambient mixing ratios of nonmethane hy-drocarbons (NMHCs) in two major urban centers of the PearlRiver Delta (PRD) region: Guangzhou and Dongguan, Atmos.Environ., 42, 4393–4408, 2008.
Blake, D. R., Smith Jr., T. W., Chen, T.-Y., Whipple, W. J., andRowland, F. S.: Effects of biomass burning on summertime non-methane hydrocarbon concentrations in the Canadian wetlands,J. Geophys. Res.-Atmos., 99(D1), 1699–1719, 1994.
Chan, L. Y., Chan, C. Y., and Qin, Y.: Surface ozone pattern inHong Kong. J. Appl. Meteorol., 37 (10), 1153–1165, 1998a.
Chan, L. Y., Liu, H. Y., and Lam, K. S.: Analysis of the seasonalbehavior of tropospheric ozone at Hong Kong, Atmos. Environ.,32(2), 159–168, 1998b.
Chan, L. Y., Chu, K. W., Zou, S. C., Chan, C. Y., Wang, X. M., Bar-letta, B., Blake, D. R., Guo, H., and Tsai, W. Y.: Characteristicsof nonmethane hydrocarbons (NMHCs) in industrial, industrial-urban, and industrial-suburban atmospheres of the Pearl RiverDelta (PRD) region of south China, J. Geophys. Res.-Atmos.,111, D11304, doi:10.1029/2005JD006481, 2006.
Cheng, H. R., Guo, H., Wang, X. M., Saunders, S. M., Lam, S.H. M., Jiang, F., Wang, T. J., Lee, S. C., and Ho, K. F.: On therelationship between ozone and its precursors in the Pearl RiverDelta: Application of an Observation-Based Model (OBM), En-viron. Sci. Poll. Res., accepted, 2009.
Chung, K. K., Chan, J. C. L., Ng, C. N., Lam, K. S., and Wang,T.: Synoptic conditions associated with high carbon monoxideepisodes at a coastal station in Hong Kong, Atmos. Environ., 33,3087–3095, 1999.
Cooper, O. R., Moody, J. L., Parrish, D. D., Trainer, M., Ryerson, T.B., Holloway, J. S., Hubler, G., Fehenfeld, F. C., Oltmans, S. J.,and Evans, M. J.: Trace gas signatures of the airstreams within
Atmos. Chem. Phys., 9, 7343–7360, 2009 www.atmos-chem-phys.net/9/7343/2009/
H. Guo et al.: Concurrent observations of air pollutants 7359
North Atlantic cyclones: Case studies from the North AtlanticRegional Experiment (NARE ’97) aircraft intensive, J. Geophys.Res., 106(D6), 5437–5456, 2001.
Ding, A. J., Wang, T., Zhao M., Wang, T. J., and Li, Z. K.: Simula-tion of sea-land breezes and a discussion of their implications onthe transport of air pollution during a multi-day ozone episode inthe Pearl River Delta of China, Atmos. Environ. 38, 6737–6750,2004.
Ding, A., Wang, T., Xue, L. K., et al.: Transport of north China airpollution by midlatitude cyclones: Case study of aircraft mea-surements in summer 2007, J. Geophys. Res., 114, D08304,doi:10.1029/2008JD011023, 2009.
Draxler, R. R. and Rolph, G. D.: HYSPLIT (HYbrid Single-ParticleLagrangian Integrated Trajectory) Model access via NOAA ARLREADY Website (http://www.arl.noaa.gov/ready/hysplit4.html).NOAA Air Resources Laboratory, Silver Spring, Maryland,USA, 2003.
Environmental Protection Department (EPD): Air Quality in HongKong 1999. Air Science Group, Environmental Protection De-partment, the Government of the Hong Kong Special Adminis-trative Region, 2000.
Environmental Protection Department (EPD): Air Quality in HongKong 2006. Air Science Group, Environmental Protection De-partment, the Government of the Hong Kong Special Adminis-trative Region, 2007.
Feng, Y. L., Wen, S., Chen, Y. J., Wang, X. M., Lu, H. X., Bi, X.H., Sheng, G. Y., and Fu, J. M.: Ambient levels of carbonyl com-pounds and their sources in Guangzhou, China, Atmos. Environ.,39, 1789–1800, 2005.
Godish, T.: Air Quality, 4th edition, Lewis Publishers, Boca Raton,USA, 2004.
Guo, H., Lee, S. C., Louie, P. K. K., and Ho, K. F.: Characterizationof hydrocarbons, halocarbons and carbonyls in the atmosphereof Hong Kong, Chemosphere, 57, 1363–1372, 2004.
Guo, H., Wang, T., Blake, D. R., Simpson, I. J. Kwok, Y. H., and Li,Y. S.: Regional and local contributions to ambient non-methanevolatile organic compounds at a polluted rural/coastal site inPearl River Delta, China, Atmos. Environ., 40, 2345–2359, 2006.
Guo, H., So, K. L., Simpson, I. J., Barletta, B., Meinardi, S., andBlake, D. R.: C1–C8 volatile organic compounds in the atmo-sphere of Hong Kong: Overview of atmospheric processing andsource apportionment, Atmos. Environ., 41, 1456–1472, 2008.
Guo, H., Ding, A.J., Wang, T., et al.: Source origins, modeledprofiles, and apportionments of halogenated hydrocarbons in thegreater Pearl River Delta region, southern China, J. Geophys.Res., 114, D11302, doi:10.1029/2008JD011448, 2009.
Ho, K. F., Lee, S. C., and Tsai, W. Y.: Carbonyl compounds inthe roadside environment of Hong Kong, J. Hazard. Mater., 133,24–29, 2006.
Huang, J. P., Fung, C. H., and Lau, K. H.: Integrated processesanalysis and systematic meteorological classification of ozoneepisodes in Hong Kong, J. Geophys. Res.-Atmos., 111, D20309,doi:10.1029/2005JD007012, 2006.
Jiang, F., Wang, T. J., Wang, T. T., Xie, M., and Zhao H.: Numeri-cal modeling of a continuous photochemical pollution episode inHong Kong using WRF chem., Atmos. Environ., 42, 8717–8727,2008.
Kok, G. L., Lind, J. A., and Fang, M.: An airborne study of air qual-ity around the Hong Kong territory, J. Geophys. Res.-Atmos.,
102, 19043–19057, 1997.Lam, K. S., Wang, T., Chan, L. Y., and Liu, H. Y.: Observation
of surface ozone and carbon monoxide at a coastal site in HongKong, in: Proceedings of Quadrennial Ozone Symposium, 1998.
Lam, K. S., Wang, T. J., Wu, C. L., and Li, Y. S.: Study on anOzone Episode in Hot Season in Hong Kong and TransboundaryAir Pollution over Pearl River Delta Region of China, Atmos.Environ. 39, 1967–1977, 2005.
Lee, S. C., Chiu, M. Y., Ho, K. F., Zou, S. C., and Wang, X. M.:Volatile organic compounds in urban atmosphere of Hong Kong,Chemosphere, 48, 375–382, 2002.
Lee, Y. C., Calori, G., Hills, P., and Carmichael, G. R.: Ozoneepisodes in urban Hong Kong 1994–1999, Atmos. Environ., 36,1957–1968, 2002.
Lee, Y. C. and Savtchenko, A.: Relationship between Air Pollutionin Hong Kong and in the Pearl River Delta Region of South Chinain 2003 and 2004: An Analysis, J. Appl. Meteorol. Climatology,45, 269–282, 2006.
Liu, Y., Shao, M., Lu, S., Chang, C. C., Wang, J. L., and Chen, G.:Volatile Organic Compound (VOC) measurements in the PearlRiver Delta (PRD) region, China, Atmos. Chem. Phys., 8, 1531–1545, 2008,http://www.atmos-chem-phys.net/8/1531/2008/.
NRC (US National Research Council): Animals as Sentinels of En-vironmental Health Hazards. National Academy Press, Washing-ton DC, USA, 1991.
Skamarock, W. C., Klemp, J. B., Dudhia, J., Gill, D. O., Barker, D.M., Wang W., and Powers, J. G.: A description of the AdvancedResearch WRF Version 3. NCAR Tech Notes-475+STR (http://www.mmm.ucar.edu/wrf/users/docs/arwv3.pdf), 2008.
Seinfeld, J. H. and Pandis, S. N.: Atmospheric Chemistry andPhysics: from air pollution to climate change, 2nd edition. WileyPublisher, New Jersey, USA, 2006.
Sin, D. W. M., Wong, Y. C., and Louie, P. K. K.: Monitoring ofambient volatile organic compounds at two urban sites in HongKong from 1997 to 1998, Indoor Built Environ., 9, 216–227,2000.
So, K. L. and Wang, T.: On the local and regional influence onground-level ozone concentrations in Hong Kong, Environ. Pol-lut., 123(2), 307–317, 2003.
So, K. L. and Wang, T.: C3–C12 non-methane hydrocarbons in sub-tropical Hong Kong: spatial-temporal variations, sourcereceptorrelationships and photochemical reactivity, Sci. Total Environ.,328(1–3), 161–174, 2004.
Stohl, A.: Computation, accuracy and applications of trajectories– A review and bibliography, Atmos. Environ., 32, 6, 947–966,1998.
Stohl, A., Forster, C., Frank, A., et al.: Technical note: The La-grangian particle dispersion model FLEXPART version 6.2, At-mos. Chem. Phys., 5, 2461–2474, 2005,http://www.atmos-chem-phys.net/5/2461/2005/.
Stohl, A., Forster, C., Eckhardt, S., et al.: A backwardmodeling study of intercontinental pollution transport usingaircraft measurements, J. Geophys. Res., 108(D12), 4370,doi:10.1029/2002JD002862, 2003.
Tang, J. H., Chan, L. Y., Chan, C. Y., Li, Y. S., Chang, C. C., Liu, S.C., Wu, D., and Li, Y. D.: Characteristics and diurnal variationsof NMHCs at urban, suburban, and rural sites in the Pearl RiverDelta and a remote site in South China, Atmos. Environ., 41,8620–8632, 2007.
www.atmos-chem-phys.net/9/7343/2009/ Atmos. Chem. Phys., 9, 7343–7360, 2009

7360 H. Guo et al.: Concurrent observations of air pollutants
Wang, X. M., Carmichael, G., Chen, D. L., Tang, Y. H., and Wang,T. J.: Impacts of different emission sources on air quality dur-ing March 2001 in the Pearl River Delta (PRD) region, Atmos.Environ., 39, 5227–5241, 2005.
Wang, T., Lam, K. S., Lee, A. S. Y., Pang, S. W., and Tsui, W. S.:Meteorological and chemical characteristics of the photochemi-cal ozone episodes observed at Cape D’Aguilar in Hong Kong,J. Appl. Meteorol., 37, 1167–1177, 1998.
Wang, T., Wu, Y. Y., Cheung, T. F., and Lam, K. S.: A study ofsurface ozone and the relation to complex wind flow in HongKong, Atmos. Environ., 35, 3203–3215, 2001.
Wang, T. and Kwok, J. Y. H.: Measurement and analysis of a multi-day photochemical smog episode in the Pearl River Delta ofChina, J. Appl. Meteorol., 42, 404–416, 2003.
Wang, T., Poon, C. N., Kwok, Y. H., and Li, Y. S.: Characteriz-ing the temporal variability and emission patterns of pollutionplumes in the Pearl River Delta of China, Atmos. Environ., 37,3539–3550, 2003.
Wang, T., Guo, H., Blake, D. R., Kwok, Y. H., Simpson, I. J., andLi, Y. S.: Measurements of Trace Gases in the Inflow of SouthChina Sea Background Air and Outflow of Regional Pollution atTai O, Southern China, J. Atmos. Chem., 52, 295–317, 2005.
Wang, T. J., Lam, K. S., Xie, M., Wang, X. M., Carmichael, G., andLi, Y. S.: Integrated studies of a photochemical smog episodein Hong Kong and regional transport in the Pearl River Delta ofChina, Tellus 58B, 31–40, 2006.
Ward, J. H.: Hierarchical grouping to optimize an objective func-tion, J. Am. statistical assoc., 48, 236–244, 1963.
Warneck, P.: Chemistry of the Natural Atmosphere, 2nd Edition,Academic Press, San Diego, USA, 2000.
Zhang, J., Wang, T., Chameides, W. L., Cardelino, C., Kwok, J.,Blake, D. R., Ding A. J., and So, K. L.: Ozone production andhydrocarbon reactivity in Hong Kong, Southern China, Atmos.Chem. Phys., 7, 557–573, 2007,http://www.atmos-chem-phys.net/7/557/2007/.
Zhang, J. M., Wang, T., Ding, A. J., Zhou, X. H., Xue, L. K., Poon,C. N., Wu, W. S., Gao, J., Zuo, H. C., Chen, J. M., Zhang, X. C.,and Fan, S. J.: Continuous measurement of peroxyacetyl nitrate(PAN) in suburban and remote areas of western China, Atmos.Environ., 43, 228–237, 2009.
Zhang, Y. H., Shao, K. S., Tang, X. Y., and Li, J. L.: The study ofurban photochemical smog pollution in China, Acta ScientiarumNaturalium Universitatis Pekinensis, 34, 393–399, 1998.
Zhang, Y. H., Xie, S. D., Zeng, L. M., and Wang, H. X.: The traf-fic emission and its impact on air quality in Guangzhou area, J.Environ. Sci., 11(3), 355–360, 1999.
Zhang, Y. H., Su, H., Zhong, L. J., Cheng, Y. F., Zeng, L. M., Wang,X. S., Xiang, Y. R., Wang, J. L., Gao, D. F., Shao, M., Fan, S. J.,and Liu, S. C.: Regional ozone pollution and observation-basedapproach for analyzing ozone–precursor relationship during thePRIDE-PRD2004 campaign, Atmos. Environ., 42, 6203–6218,2008.
Zhou, X. L., Civerolo, K., and Dai, H. P.: Summertime nitrousacid chemistry in the atmospheric boundary layer at a ruralsite in New York State, J. Geophys. Res.-Atmos., 107(D21),doi:10.1029/2001JD001539, 2002.
Atmos. Chem. Phys., 9, 7343–7360, 2009 www.atmos-chem-phys.net/9/7343/2009/