condensed consolidated interim results for the six … · condensed consolidated interim results...
TRANSCRIPT

Condensed consolidated interim results for the six months ended 31 December 2017
30 years of property investment excellence.

HYPROP INVESTMENTS LIMITED(Incorporated in the Republic of South Africa) (Registration number 1987/005284/06) JSE share code: HYPISIN: ZAE000190724 (Approved as a REIT by the JSE) (“Hyprop” or “the company” or “the group”)
Highlights
Dividend up
8,3% Developments and extensions in the SA portfolio of
R290 million
Acquired The Mall in
Sofia, Bulgaria (via Hystead)
Agreement to acquire City Centre One Zagreb East and City Centre One Zagreb West in
Zagreb, Croatia (via Hystead)

Condensed consolidated interim results for the six months ended 31 December 2017
1
Unaudited six months
31 December 2017
R000
Unaudited six months
31 December 2016
R000
Audited 12 months
30 June 2017
R000
Revenue 1 539 370 1 621 331 3 167 649Investment property income 1 544 712 1 590 208 3 128 062 Straight-line rental income accrual (5 342) 31 123 39 587
Property expenses (521 113) (544 095) (1 073 877)Net property income 1 018 257 1 077 236 2 093 772Other operating expenses (28 295) (48 185) (78 232)
Operating income 989 962 1 029 051 2 015 540Net interest (161 646) (172 406) (336 502)
Received 151 132 160 423 294 177 Paid (312 778) (332 829) (630 679)
Net operating income 828 316 856 645 1 679 038Other income 22 996 17 505 36 931 Change in fair value 510 707 619 973 983 372
Investment property 541 717 590 391 1 181 786 Straight-line rental income accrual 5 342 (31 123) (39 587)Financial guarantee (29 409) (163 855)Investment in joint venture 10 102 10 102 Derivative instruments (6 943) 50 603 (5 074)
Profit/(loss) on disposal 86 (2 934) (526)Investment in subsidiary (2 557) (2 557)Investment property 86 (377) 2 031
Impairment of loan (AttAfrica) (8 539) (25 377)Impairment of goodwill (18 134) (18 134) Net income before equity-accounted investments 1 353 566 1 473 055 2 655 304Share of loss from joint ventures (50 380)Share of income from associate 96 Dividends 78 820 82 923 146 350 Profit before taxation 1 432 386 1 556 074 2 751 274Taxation (6 080) (3 710) (4 340)Profit for the period/year 1 426 306 1 552 364 2 746 934 Other comprehensive incomeItems that may be reclassified subsequently to profit or lossExchange differences on translation of foreign operations (6 331) (14 771) (27 623)
Total comprehensive income for the period/year 1 419 975 1 537 593 2 719 311
Total profit for the period/year attributable to:Shareholders of the company 1 436 930 1 577 849 2 767 652 Non-controlling interests (10 624) (25 485) (20 718) Profit for the period/year 1 426 306 1 552 364 2 746 934 Total comprehensive income attributable to:Shareholders of the company 1 434 389 1 572 409 2 755 272 Non-controlling interests (14 414) (34 816) (35 961) Total comprehensive income for the period/year 1 419 975 1 537 593 2 719 311
Condensed consolidated statement of comprehensive income
2 Condensed consolidated interim results for the six months ended 31 December 2017
Condensed reconciliation – headline earnings
Unaudited six months
31 December 2017
R000
Unaudited six months
31 December 2016
R000
Audited 12 months
30 June 2017
R000
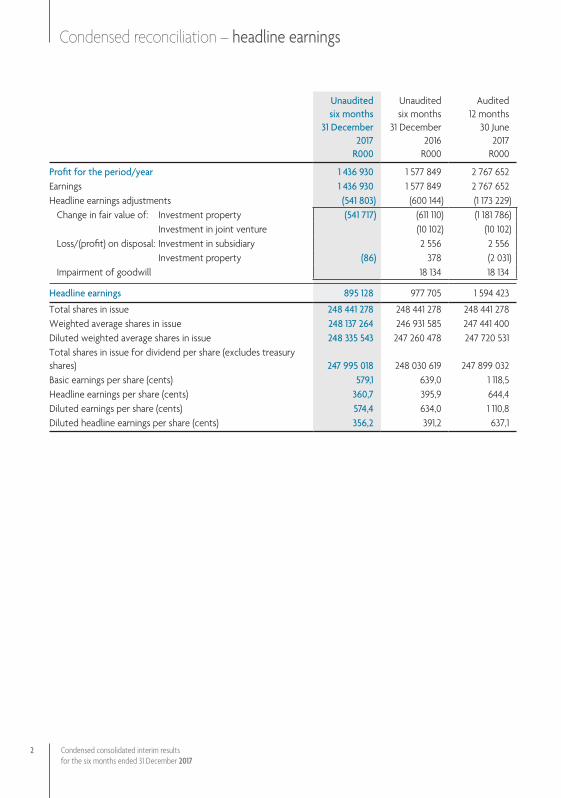
Profit for the period/year 1 436 930 1 577 849 2 767 652 Earnings 1 436 930 1 577 849 2 767 652 Headline earnings adjustments (541 803) (600 144) (1 173 229)
Change in fair value of: Investment property (541 717) (611 110) (1 181 786) Investment in joint venture (10 102) (10 102)
Loss/(profit) on disposal: Investment in subsidiary 2 556 2 556 Investment property (86) 378 (2 031)Impairment of goodwill 18 134 18 134
Headline earnings 895 128 977 705 1 594 423
Total shares in issue 248 441 278 248 441 278 248 441 278 Weighted average shares in issue 248 137 264 246 931 585 247 441 400 Diluted weighted average shares in issue 248 335 543 247 260 478 247 720 531 Total shares in issue for dividend per share (excludes treasury shares) 247 995 018 248 030 619 247 899 032 Basic earnings per share (cents) 579,1 639,0 1 118,5 Headline earnings per share (cents) 360,7 395,9 644,4 Diluted earnings per share (cents) 574,4 634,0 1 110,8 Diluted headline earnings per share (cents) 356,2 391,2 637,1

Condensed consolidated interim results for the six months ended 31 December 2017
3
Condensed consolidated statement of financial position
Unaudited 31 December
2017R000
Unaudited 31 December
2016R000
Audited30 June
2017 R000
AssetsNon-current assets 33 100 805 32 512 844 32 854 166
Investment property 30 275 912 29 186 107 29 681 596 South African portfolio 28 409 403 27 110 496 27 711 853 Ikeja City Mall (Lagos, Nigeria) 1 866 509 2 075 611 1 969 743
Building appurtenances and tenant installations 151 382 134 155 148 530 Investments in sub-Saharan Africa (excluding SA) 2 656 209 3 141 399 3 005 821 Loans receivable 17 302 16 991 17 434 Derivative instruments 34 192 785
Current assets 1 366 529 985 404 1 366 021Receivables 263 468 237 446 230 741 Derivative instruments 8 894 3 401 9 530 Cash and cash equivalents 1 094 167 744 557 1 125 750
Non-current assets held-for-sale 189 746 916 798 426 681
Total assets 34 657 080 34 415 046 34 646 868
Equity 25 430 456 24 560 294 24 882 553 Stated capital and reserves 25 350 571 24 464 850 24 788 254Non-controlling interest 79 885 95 444 94 299
LiabilitiesNon-current liabilities 6 042 607 9 011 418 5 428 316
Interest-bearing liabilities 5 648 768 8 838 496 5 068 332 Financial guarantee 193 264 163 855 Derivative instruments 61 822 32 789 56 530 Deferred taxation 138 753 140 133 139 599
Current liabilities 3 176 220 821 149 4 322 925Payables 479 816 521 149 489 681 Interest-bearing liabilities 2 695 583 300 000 3 832 306 Derivative instruments 821 938
Liabilities directly associated with non-current assets held-for-sale 7 797 22 185 13 074 Total liabilities 9 226 624 9 854 752 9 764 315
Total equity and liabilities 34 657 080 34 415 046 34 646 868
Net asset value per share (R) 102,22 98,47 99,78
4 Condensed consolidated interim results for the six months ended 31 December 2017
Condensed consolidated statement of changes in equity
Unaudited 31 December
2017R000
Unaudited 31 December
2016R000
Audited30 June
2017 R000
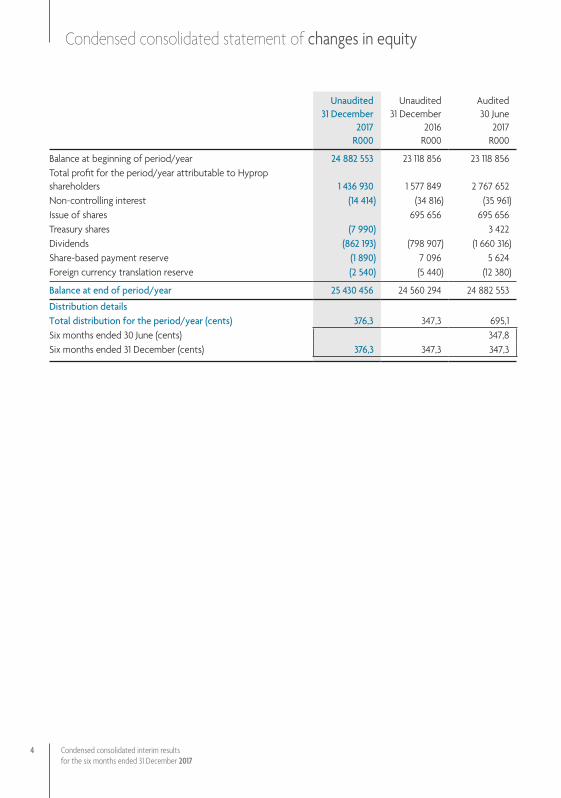
Balance at beginning of period/year 24 882 553 23 118 856 23 118 856Total profit for the period/year attributable to Hyprop shareholders 1 436 930 1 577 849 2 767 652 Non-controlling interest (14 414) (34 816) (35 961)Issue of shares 695 656 695 656 Treasury shares (7 990) 3 422 Dividends (862 193) (798 907) (1 660 316)Share-based payment reserve (1 890) 7 096 5 624 Foreign currency translation reserve (2 540) (5 440) (12 380)
Balance at end of period/year 25 430 456 24 560 294 24 882 553
Distribution detailsTotal distribution for the period/year (cents) 376,3 347,3 695,1Six months ended 30 June (cents) 347,8Six months ended 31 December (cents) 376,3 347,3 347,3
Condensed consolidated interim results for the six months ended 31 December 2017
5
Condensed consolidated statement of cash flows
Unaudited 31 December
2017R000
Unaudited 31 December
2016R000
Audited30 June
2017 R000
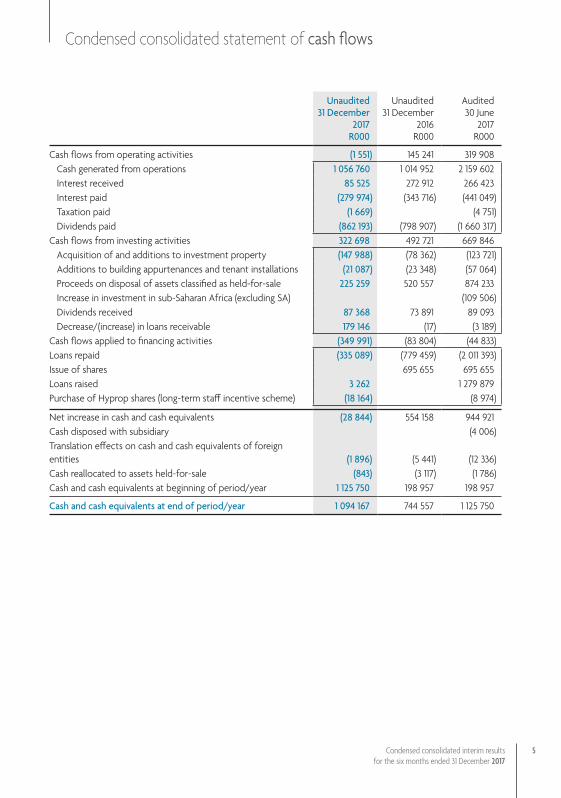
Cash flows from operating activities (1 551) 145 241 319 908 Cash generated from operations 1 056 760 1 014 952 2 159 602 Interest received 85 525 272 912 266 423 Interest paid (279 974) (343 716) (441 049)Taxation paid (1 669) (4 751)Dividends paid (862 193) (798 907) (1 660 317)
Cash flows from investing activities 322 698 492 721 669 846 Acquisition of and additions to investment property (147 988) (78 362) (123 721)Additions to building appurtenances and tenant installations (21 087) (23 348) (57 064)Proceeds on disposal of assets classified as held-for-sale 225 259 520 557 874 233 Increase in investment in sub-Saharan Africa (excluding SA) (109 506)Dividends received 87 368 73 891 89 093 Decrease/(increase) in loans receivable 179 146 (17) (3 189)
Cash flows applied to financing activities (349 991) (83 804) (44 833)Loans repaid (335 089) (779 459) (2 011 393)Issue of shares 695 655 695 655 Loans raised 3 262 1 279 879 Purchase of Hyprop shares (long-term staff incentive scheme) (18 164) (8 974)
Net increase in cash and cash equivalents (28 844) 554 158 944 921 Cash disposed with subsidiary (4 006)Translation effects on cash and cash equivalents of foreign entities (1 896) (5 441) (12 336)Cash reallocated to assets held-for-sale (843) (3 117) (1 786)Cash and cash equivalents at beginning of period/year 1 125 750 198 957 198 957
Cash and cash equivalents at end of period/year 1 094 167 744 557 1 125 750

6 Condensed consolidated interim results for the six months ended 31 December 2017
Commentary
INTRODUCTIONHyprop is a specialist shopping centre Real Estate Investment Trust (REIT), which operates a portfolio of shopping centres in South Africa (SA), sub-Saharan Africa (excluding SA) and South-Eastern Europe.
Hyprop’s strategy is to own dominant, quality shopping centres in major metropolitan areas, where such assets can be acquired or developed at attractive yields.
The shopping centre portfolio in South Africa includes super-regional centre Canal Walk, large regional centres Clearwater, The Glen, Woodlands, CapeGate, Somerset and Rosebank malls, and regional centre Hyde Park Corner.
The sub-Saharan African portfolio (excluding SA) includes interests in Accra Mall, West Hills Mall and Achimota Retail Centre (all in Accra, Ghana), Kumasi City Mall in Kumasi, Ghana, Manda Hill Centre in Lusaka, Zambia and Ikeja City Mall in Lagos, Nigeria.
Hyprop’s investments in South-Eastern Europe, held via a 60% interest in UK-based Hystead Limited (Hystead), include interests in Delta City Belgrade, Serbia, Delta City Podgorica, Montenegro, Skopje City Mall in Skopje, Macedonia and The Mall in Sofia, Bulgaria (acquired October 2017).
In February 2018, Hystead agreed to acquire a 90% interest in City Centre One Zagreb East and City Centre One Zagreb West, both in Zagreb, Croatia.
FINANCIAL RESULTSHyprop has declared a dividend of 376,3 cents per share for the six months ended 31 December 2017 (the period), an increase of 8,3% on the corresponding period in 2016.
DISTRIBUTABLE EARNINGS STATEMENT AND RECONCILIATION TO DIVIDEND DECLAREDDistributable earnings
Operating segment
Six months 31 December
2017R000
Six months31 December
2016R000
South African property portfolio 952 345 968 198 Continuing operations 944 034 924 877 Properties sold 8 311 43 321
Investments in sub-Saharan Africa (excluding SA) 40 025 30 884 Investments in South-Eastern Europe 91 615 58 351 Fund management expenses (29 900) (32 826)Net interest (148 373) (180 688)Other income 27 415 17 505 Total dividend 933 127 861 424 Total shares in issue at period-end 248 441 278 248 441 278 Treasury shares in issue (446 260) (410 659)Shares in issue for distributable earnings 247 995 018 248 030 619 Dividend per share (cents) 376,3 347,3 Dividend per share growth (%) 8,3 16,6
Distributable earnings for the period benefited from income received from the investments in South-Eastern Europe, particularly the new acquisitions in Skopje, Macedonia (November 2016) and in Sofia, Bulgaria (October 2017). The inclusion of distributable earnings from Ikeja City Mall in Lagos, Nigeria also contributed to the growth in distributable earnings for the period.

Condensed consolidated interim results for the six months ended 31 December 2017
7
Net interest costs of R148,4 million (31 December 2016: R180,7 million) reduced due to non-core asset sales of R867 million during the 2017 financial year and the sale of Willowbridge North for R225 million in September 2017.
The proceeds from non-core asset sales were applied in part to the reduction of debt and in part to capital expenditure in the South African portfolio. The remaining cash was placed on deposit.
Fund management expenses reduced during the period, partly due to asset management fees received from Hystead amounting to R7,4 million (31 December 2016: R6,8 million), and a reduction in the share-based payment expense relating to the staff share incentive scheme.
Included in other income are credit enhancement fees of R25,2 million (31 December 2016: R17,5 million) received for the funding guarantee provided by Hyprop in respect of the South-Eastern European investments.
RECONCILIATION FROM HEADLINE EARNINGS TO DISTRIBUTABLE EARNINGS
Unaudited six months
31 December 2017
R000
Unaudited six months
31 December 2016
R000
Audited 12 months
30 June 2017
R000
Headline earnings 895 127 977 705 1 594 423Distributable earnings adjustments 38 000 (116 281) 148 798
Change in fair value: Derivative instruments 6 943 (50 602) 5 074 Financial guarantee 29 409 163 855Investments in: Sub-Saharan Africa (excluding SA)1 (26 024) (48 487) (29 928) South African subsidiaries1 (364) 1 118 1 212 South-Eastern Europe 11 389 (24 572) (24 572)Impairment of loan (AttAfrica) 8 539 25 377Capital items 3 697 5 286 6 154Deferred taxation 4 411 976 1 626
Distributable earnings 933 127 861 424 1 743 2211 Net effect of converting IFRS earnings to distributable earnings
SOUTH AFRICAN PORTFOLIORevenue and distributable earnings
Unaudited six months ended Unaudited six months ended31 December 2017 31 December 2016
Business segmentRevenue
R000
Distributableearnings
R000Revenue
R000
Distributableearnings
R000
Shopping centres 1 318 591 877 306 1 287 100 860 789 Value centres 74 816 51 232 68 473 50 298 Total retail 1 393 407 928 538 1 355 573 911 087 Total standalone offices1 24 138 15 496 22 841 13 790 Investment property (excluding properties sold) 1 417 545 944 034 1 378 414 924 877 Properties sold2 10 494 8 311 74 173 43 488 Total investment property 1 428 039 952 345 1 452 587 968 365 1 Consists of Lakefield Office Park (held-for-sale) and Cradock Heights2 Willowbridge North was sold during the period. Properties sold in the prior year include Somerset Value Mart, Willowbridge
South, Glenfield and Glenwood office parks

8 Condensed consolidated interim results for the six months ended 31 December 2017
Commentary (continued)
Despite the difficult economic and political conditions in South Africa during the period, which had a negative effect on consumer confidence, the shopping centres achieved positive trading results.
Like-for-like growth in distributable earnings (excluding properties sold) for the period was 2,1%. Income was negatively affected by construction work at The Glen, Rosebank Mall and Canal Walk and vacancies as a consequence of Stuttafords vacating Clearwater Mall, Rosebank Mall and Canal Walk in May 2017.
Excluding the effects of the construction work and the Stuttafords vacancies, growth in distributable earnings from shopping centres was 5,2%.
Somerset Mall and CapeGate performed well during the period, with distributable earnings growth of 7,5% and 6,9% respectively.
Excluding The Glen, trading density growth for the period was 2,1% (31 December 2016: 3,5%). Trading density growth for the period including The Glen was 1,4% (31 December 2016: 2,7%). Good trading density growth was recorded at CapeGate (8,7%), Rosebank Mall (5,4%) and Clearwater Mall (4,0%).
While the decline in trading density growth is largely a function of the economic constraints faced by consumers, we continue to invest in and manage our properties in order to ensure that they remain relevant and attractive to customers.
Cost-to-income ratio
31 December 2017
30 June 2017
Net basis (%) 16,3 15,7
Gross basis (%) 33,3 33,3
The net cost-to-income ratio increased marginally, mainly due to increases in municipal rates as a consequence of increases in council valuations.
Tenant arrearsTotal arrears as a percentage of rental income were 0,8% (30 June 2017: 0,4%). The provision for bad debts increased to R12,1 million (30 June 2017: R6,5 million).
Although tenant arrears increased during the period, the arrears are still a relatively small percentage of rental income and are within market norms.
Vacancies
Sector
Rentablearea (m2)
31 December 2017
Change invacancy during
the period(m2)
% of total rentable area
31 December 2017
30 June 2017
Retail 5 818 (7 028) 0,9 1,9
Office 5 851 1 137 9,9 7,9
Total 11 669 (5 891) 1,6 2,4

Condensed consolidated interim results for the six months ended 31 December 2017
9
Retail vacancies reduced significantly, largely due to the successful letting of most of the former Stuttafords stores and the former HiFi Corporation store at CapeGate. The reintroduction of Nu Metro at Woodlands Boulevard also contributed to the reduction in the retail vacancy. Most of the new lettings were only income producing from November 2017 and will impact positively on rental income in the second half of the financial year.
The increase in office vacancies is primarily due to the relocation of Standard Bank from Cradock Heights to the Rosebank Mall (1 359m²) and lease expiries at Lakefield Office Park (919m²). These increases were partially offset by new lettings at Canal Walk and Hyde Park offices.
Valuations
Value attributable to HypropValue per
rentable area
Business segment
Rentable area(m2)
31 December 2017
R000
30 June 2017
R000
31 December 2017
(R/m2)
Shopping centres 643 611 27 158 792 26 490 589 46 340Value centres 48 848 1 277 000 1 248 000 26 143Total retail 692 459 28 435 792 27 738 589 44 915Total standalone offices1 20 328 307 775 310 798 15 141
Total (excluding properties sold) 712 787 28 743 567 28 049 387 44 066Properties sold2 225 000
Investment property 712 787 28 743 567 28 274 387 44 0661 Consists of Lakefield Office Park (held-for-sale) and Cradock Heights2 Willowbridge North was sold during the period
Investment property was valued at R28,7 billion at 31 December 2017 (30 June 2017: R28,0 billion), an increase of 2,5% (excluding assets sold). The weighted average capitalisation rate of the portfolio is 6,6%. (30 June 2017: 6,6%).
Capital expenditureThe Canal Walk La Piazza project (Hyprop share: R41,6 million) and the third phase of the solar photovoltaic plant at Clearwater Mall (R14,5 million) were successfully completed during the period.
The following extensions and refurbishments are underway:
Shopping centre Project Amount (Hyprop’s share) Completion date
Rosebank Mall Additional 4 300m2 rentable area R127,0 million April 2018
The GlenFood court enclosure and additional 1 200m2 rentable area R90,9 million April 2018
Woodlands MallFood court upgrade and Nu Metro refurbishment R30,3 million July 2018
The extension of Rosebank Mall will accommodate H&M, Sportsmans Warehouse and other key tenants. The refurbishments at The Glen and Woodlands will strengthen the retail offering at those centres. The estimated average forward yield on the capital projects is 7%.
Hyprop is focused on improving the quality and sustainability of its shopping centres and during the period R51,9 million (31 December 2016: R73,1 million) was spent on refurbishments, new equipment, tenant installations and technology.

10 Condensed consolidated interim results for the six months ended 31 December 2017
Commentary (continued)
Various water-saving initiatives are underway at the shopping centres in the Western Cape region. Alternative water supply will be obtained through new boreholes, the use of grey water and the implementation of water treatment plants. Additional back-up water tanks are being installed to cater for water disruptions during trading hours. With the support of tenants, the reduction in water consumption at the Western Cape malls year-on-year is between 20% and 34%.
The total capital spend of approximately R20 million will result in an increase in the independent water supply to the shopping centres in the future.
DisposalsWillowbridge North was sold during the period for R225 million. Transfer took place in September 2017.
Efforts to dispose of Lakefield Office Park, the last remaining non-core property in the portfolio, continue.
INVESTMENTS OUTSIDE SOUTH AFRICAThe functional and reporting currencies for the investments in sub-Saharan Africa (excluding SA) and South-Eastern Europe are the US Dollar and Euro, respectively.
The relevant exchange rates used to convert to Rand at the respective dates were as follows:
31 December 2017 30 June 2017
Average rate (R)
Period-end spot rate
(R)Average rate
(R)
Period-end spot rate
(R)
US Dollar 13,74 12,36 13,63 13,04 Euro 15,25 14,80 14,53 14,9
The average rates are a weighted average of the actual exchange rates on the dates that the foreign currency dividends were received in South Africa. The period-end spot rate is the rate used to translate balance sheet items at period-end.
Hyprop fixes the exchange rates on US Dollar and Euro income for six months in advance of receipt of the dividends.
INVESTMENTS IN SUB-SAHARAN AFRICA (EXCLUDING SA)Hyprop’s share of
distributable earnings
31 December 2017
R000
31 December 2016
R000
Distributions received 139 294 81 510 Interest and expenses (99 269) (50 626)
Net 40 025 30 884

Condensed consolidated interim results for the six months ended 31 December 2017
11
Distributable earnings from the investments in sub-Saharan Africa (excluding SA) increased to R40,0 million (31 December 2016: R30,8 million), due to the inclusion of distributable earnings from Ikeja City Mall, Lagos, Nigeria of R11,7 million (31 December 2016: Rnil). Income from Manda Hill shopping centre (Lusaka, Zambia) reduced due to vacancies and new lettings at lower rentals.
Vacancies City/Country
Hyprop’s effective
shareholding (%)
Rentable area (m2)
31 December2017
vacancy (%)
30 June 2017
vacancy (%)
Ikeja City Mall Lagos, Nigeria 75,0 22 223 1,5 Manda Hill Lusaka, Zambia 68,8 40 561 5,3 5,4 Accra Mall Accra, Ghana 17,6 21 349 5,5 West Hills Mall Accra, Ghana 16,8 27 560 12,3 5,3 Achimota Mall Accra, Ghana 28,1 15 006 3,6 6,1 Kumasi City Mall Kumasi, Ghana 28,1 17 948 11,2 26,5
Total portfolio 144 647 6,6 6,5
Economic growth prospects in Ghana and Nigeria have improved and we have seen a general increase in trading densities in Ghana. However, the local currencies remain weak and the financial performance of the centres has been negatively affected by increases in vacancies and slow rent collections. Vacancies in Accra Mall and West Hills increased mainly due to the withdrawal of Truworths and Identity from Ghana and the downsizing of fashion tenants.
At Achimota and West Hills, the current second food anchor will be replaced by Game in the coming months, which will strengthen the tenant mix in the centres. Kumasi has reduced its vacancy since opening in April 2017. At Manda Hill significant new lettings during the period included Home Essentials (3 277m²), Ster-Kinekor (1 700m²), both of which opened in September 2017, and Ackermans (805m²), which opened in December 2017.
Hyprop share of shareholder loans/investment property
At 31 December 2017 the Hyprop share of the US Dollar value of the AttAfrica portfolio, Manda Hill and Ikeja City Mall was USD281,8 million (30 June 2017: USD281,8 million) at a weighted average capitalisation rate of 8,4% (30 June 2017: 8,4%).
Hyprop’s share
31 December 2017
R000
30 June 2017
R000
AttAfrica and Manda Hill 2 656 209 3 005 821
Ikeja City Mall, Lagos, Nigeria (75%) 1 402 447 1 476 553
Investments in sub-Saharan Africa 4 058 656 4 482 374
The Rand equivalent value of the investments in sub-Saharan Africa (excluding SA) at 31 December 2017 was R4,1 billion (30 June 2017: R4,5 billion). The net reduction over the period was largely due to a reduction of the Hyprop Mauritius shareholder loan to AttAfrica in December 2017 and Rand appreciation against the US Dollar. Hyprop is considering a reduction of its exposure to investments in sub-Saharan Africa (excluding SA) over the next few years.
12 Condensed consolidated interim results for the six months ended 31 December 2017
Commentary (continued)
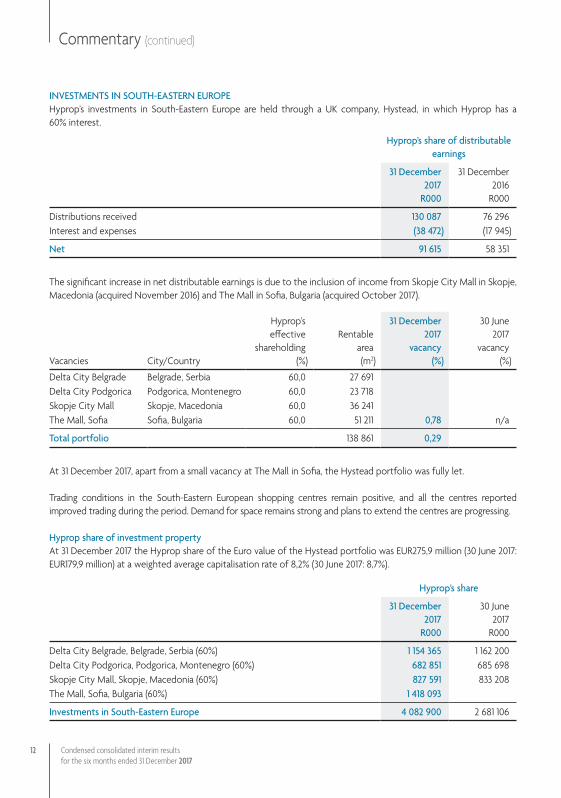
INVESTMENTS IN SOUTH-EASTERN EUROPEHyprop’s investments in South-Eastern Europe are held through a UK company, Hystead, in which Hyprop has a 60% interest.
Hyprop’s share of distributable earnings
31 December 2017
R000
31 December 2016
R000
Distributions received 130 087 76 296 Interest and expenses (38 472) (17 945)
Net 91 615 58 351
The significant increase in net distributable earnings is due to the inclusion of income from Skopje City Mall in Skopje, Macedonia (acquired November 2016) and The Mall in Sofia, Bulgaria (acquired October 2017).
Vacancies City/Country
Hyprop’seffective
shareholding (%)
Rentable area (m2)
31 December2017
vacancy (%)
30 June 2017
vacancy (%)
Delta City Belgrade Belgrade, Serbia 60,0 27 691 Delta City Podgorica Podgorica, Montenegro 60,0 23 718 Skopje City Mall Skopje, Macedonia 60,0 36 241 The Mall, Sofia Sofia, Bulgaria 60,0 51 211 0,78 n/a
Total portfolio 138 861 0,29
At 31 December 2017, apart from a small vacancy at The Mall in Sofia, the Hystead portfolio was fully let.
Trading conditions in the South-Eastern European shopping centres remain positive, and all the centres reported improved trading during the period. Demand for space remains strong and plans to extend the centres are progressing.
Hyprop share of investment propertyAt 31 December 2017 the Hyprop share of the Euro value of the Hystead portfolio was EUR275,9 million (30 June 2017: EUR179,9 million) at a weighted average capitalisation rate of 8,2% (30 June 2017: 8,7%).
Hyprop’s share
31 December 2017
R000
30 June 2017
R000
Delta City Belgrade, Belgrade, Serbia (60%) 1 154 365 1 162 200 Delta City Podgorica, Podgorica, Montenegro (60%) 682 851 685 698 Skopje City Mall, Skopje, Macedonia (60%) 827 591 833 208 The Mall, Sofia, Bulgaria (60%) 1 418 093
Investments in South-Eastern Europe 4 082 900 2 681 106

Condensed consolidated interim results for the six months ended 31 December 2017
13
The total Rand equivalent value of Hyprop’s share of investment property in South-Eastern Europe increased due to the acquisition of The Mall in Sofia, Bulgaria. The Rand equivalent value of the Delta City Centres and Skopje City Mall reduced marginally due to the appreciation of the Rand against the Euro.
The investments in South-Eastern Europe are accounted for as investments in financial assets with the gains on initial recognition of the financial assets being deferred. Accordingly, the investments do not appear on the consolidated statement of financial position.
Acquisition Post-period-end (February 2018), it was announced that Hystead had reached agreement to acquire a 90% interest in companies that own two shopping centres situated in Zagreb, Croatia (City Centre One Zagreb West and City Centre One Zagreb East). Completion of the acquisition remains subject to receipt of approval from the Competition Agency of Croatia. It is anticipated that the transaction will be effective from April 2018.
The purchase consideration, net of EUR154,4 million asset-based finance, is EUR129,1 million (7,0% yield), of which Hyprop’s 60% effective share is approximately EUR77,5 million (R1,16 billion).
Hystead has entered into a joint venture agreement with WKB3 (who will retain a 10% interest), an Austrian-based company that developed and has been the property and asset manager of the two shopping centres. The asset management of the shopping centres will be undertaken jointly by Hystead’s European-based executive management team and by CC Real, the operating company of WKB3.
CC Real will continue with the property management for an initial period of 18 months, providing for a continuation of management at the centres.
The acquisition is in line with Hyprop’s strategy to own high-quality, income producing shopping centres in South-Eastern Europe. The acquisition will grow Hystead’s portfolio of prime, dominant regional shopping centres in South-Eastern Europe to six centres, with Hystead’s share of gross asset value in excess of EUR740 million.
Hystead listingConsideration is being given to a possible listing of Hystead in the next six months.
NET ASSET VALUEThe net asset value (NAV) per share at 31 December 2017 increased by 2,5% to R102,22 (30 June 2017: R99,78). The increase was due to an increase in the independent valuation of the South African investment property portfolio, offset by the impact of a stronger Rand on the sub-Saharan Africa portfolio.
The NAV per share does not take into account the investments in South-Eastern Europe, which are not consolidated on the statement of financial position.

14 Condensed consolidated interim results for the six months ended 31 December 2017
Commentary (continued)
BORROWINGS31 December
2017Rm
30 June 2017Rm
South African debt 3 814 4 114 Bank debt 1 814 1 814 Corporate bonds 2 000 2 300
USD bank debt (Rand equivalent) 4 144 4 391 EUR bank debt (Rand equivalent) 3 552 2 673 Cash and cash equivalents (1 094) (1 126)
Net borrowings 10 416 10 052
Loan-to-value (%) 28,5 28,9
Debt at fixed rates (%)South African debt (%) 100,9 100,9 USD debt (%) 67,1 70,4
Maturity of fixes (years) 3,3 3,4South African debt (years) 3,7 3,9USD debt (years) 2,8 2,7
Cost of funding (%) 5,3 5,7 South African debt (%) 9,0 8,9 USD debt (%) 4,6 4,7 EUR debt (%) 2,1 2,2
Debt capital market (DCM) % of total debt 17 21
South African debtThe South African bank debt is secured against South African investment property, while the DCM funding is unsecured.
During the period, a maturing five-year corporate bond of R300 million was repaid with the proceeds from non-core asset sales. The ratio of DCM funding to total debt consequently reduced to 17%.
Maturing debt of R1,65 billion will be refinanced in the coming months. A portion of this funding may be refinanced with corporate bonds, which will increase the ratio of unsecured debt.
US Dollar-denominated debtThe Rand equivalent of the US Dollar-denominated bank debt reduced during the period, largely due to Rand appreciation against the US Dollar. The US Dollar debt includes debt in Hyprop Mauritius, as well as 75% of the in-country debt relating to Ikeja City Mall (Lagos, Nigeria).
Two bank loans in Hyprop Mauritius of USD40 million and USD20 million were consolidated and refinanced with a three-year USD60 million bank facility.
In-country debt relating to Ikeja City Mall (Lagos, Nigeria) of USD56,5 million (Hyprop share: USD42,4 million) was refinanced for three years (effective from January 2018) and converted to an interest only loan.

Condensed consolidated interim results for the six months ended 31 December 2017
15
Euro-denominated debtAll acquisitions in South-Eastern Europe have been funded with Euro-denominated bridge and term loans, supported by guarantees from Hyprop, with back-to-back security provided by the other shareholder in Hystead. The funding support results in the recognition of a financial guarantee on the Hyprop statement of financial position. Hyprop receives credit enhancement fees for the funding support provided to the other Hystead shareholder.
The Euro debt is not consolidated on the Hyprop statement of financial position. For the purposes of the above analysis (including calculation of the loan-to-value ratio), 60% of the debt and 60% of the corresponding asset values have been included (in line with Hyprop’s 60% interest in Hystead).
The first three acquisitions (Serbia, Montenegro and Macedonia) were debt funded (total debt EUR 294.6 million) with no in-country asset-backed finance on acquisition. Asset-backed finance of EUR 134.1 million for these acquisitions has been obtained and will be implemented in March 2018. The asset-backed finance will be secured against the properties with no recourse to Hyprop and will result in a proportionate reduction in the guarantees provided by Hyprop.
Euro-denominated debt increased during the period due to the acquisition of The Mall in Sofia, Bulgaria in October 2017. The corporate level debt for this acquisition (EUR 104.5 million) was raised by way of a 12-month bridge loan. The Mall was acquired with an existing asset-backed loan of EUR 58.3 million, with no recourse to Hyprop.
The interest rates on EUR denominated debt are not yet fixed and will be fixed once the asset-backed finance in Serbia, Montenegro and Macedonia has been implemented. The asset-backed finance (excluding the Croatia shopping centres but including The Mall, Sofia) is for periods of three to five years at an average interest rate of 4.36%.
Should the Hystead listing proceed, all of the remaining guarantees provided by Hyprop will be released.
PROSPECTSHyprop expects dividend growth of between 8% and 10% for the year to 30 June 2018. This is an upward revision to the guidance provided in September 2017 of 7% to 9%.
The guidance is based on the following key assumptions:• Forecast investment property income is based on contractual rental escalations and market-related renewals;• Appropriate allowances for vacancies have been incorporated into the forecast;• No major corporate and tenant failures will occur; • Earnings from offshore investments will not be materially impacted by exchange rate volatility. Exchange rates have
been assumed at R11,50 and R14,30 to the US Dollar and Euro, respectively; and • Loss of income from developments in the South African portfolio of R11,5 million.
The forecast has not been reviewed or reported on by the company’s auditors.

16 Condensed consolidated interim results for the six months ended 31 December 2017
Commentary (continued)
PAYMENT OF DIVIDENDAll rental income earned by the company, less property expenses and interest on debt, is distributed to shareholders bi-annually.
A dividend of 376,3 cents per share for the six months ended 31 December 2017 will be paid to shareholders as follows:
2018
Last day to trade cum dividend Monday, 26 March
Shares trade ex dividend Tuesday, 27 March
Record date Thursday, 29 March
Payment date Tuesday, 3 April
Shareholders may not dematerialise or rematerialise their shares between Tuesday, 27 March 2018 and Thursday, 29 March 2018, both days inclusive.
Payment of the dividend will be made to shareholders on Tuesday, 3 April 2018. In respect of dematerialised shareholders, the dividend will be transferred to the CSDP accounts/broker accounts on Tuesday, 3 April 2018. Certificated shareholders’ dividend payments will be deposited on or about Tuesday, 3 April 2018.
An announcement relating to the tax treatment of the dividend will be released separately.
BASIS OF PREPARATIONThe condensed consolidated interim financial statements for the six months ended 31 December 2017 were prepared in accordance with International Financial Reporting Standards, IAS 34 Interim Financial Reporting, the SAICA Financial Reporting Guides as issued by the Accounting Practices Committee and Financial Pronouncements as issued by the Financial Reporting Standards Council and the requirements of the Companies Act of South Africa.
All amendments to standards that are applicable to Hyprop for its financial year beginning 1 July 2017 have been considered. Based on management’s assessment, the amendments do not have a material impact on the group’s condensed consolidated interim financial statements.
All accounting policies applied in the preparation of the condensed consolidated interim financial statements are consistent with those applied by Hyprop in its consolidated group annual financial statements for the prior financial year.
These condensed consolidated interim financial statements have not been reviewed or audited by Hyprop’s independent external auditors. Preparation of the interim financial information was supervised by Laurence Cohen CA(SA) in his capacity as Financial Director.
On behalf of the board
GR Tipper PG PrinslooChairman CEO
2 March 2018
Corporate information
Directors
GR Tipper*† (Chairman)
PG Prinsloo (CEO)
LR Cohen (FD)
KM Ellerine*
L Engelbrecht*†
MJ Lewin*†
N Mandindi*†
TV Mokgatlha*†
L Norval*
S Shaw-Taylor*†
*Non-executive †Independent
Registered office
2nd Floor, Cradock Heights
21 Cradock Avenue, Rosebank
(PO Box 52509, Saxonwold, 2132)
Transfer secretaries
Computershare Investor Services Proprietary Limited
Rosebank Towers
15 Biermann Avenue, Rosebank
(PO Box 61051, Marshalltown, 2107)
Company secretaryCIS Company Secretaries Proprietary Limited
SponsorJava Capital
Investor relationsTelephone: +27 11 447 0090
Email: [email protected]
www.hyprop.co.za

Hyprop Investments Limited2nd Floor, Cradock Heights, 21 Cradock Avenue, Rosebank, 2196PO Box 52509, Saxonwold, 2132Tel: +27 11 447 0090Fax: +27 11 447 0092
www.hyprop.co.za