condensed fs2016 april

11
Summary Operating Statements For the Period September 1, 2015 April 30, 2016 For the Meeting of the Board of Trustees June 7, 2016 for Houston Community College System & Houston Community College Public Facility Corporation

Upload: houston-community-college

Post on 27-Jan-2017

290 views

Category:

Economy & Finance


0 download

TRANSCRIPT

Summary Operating Statements

For the Period

September 1, 2015 ‐ April 30, 2016

For the Meeting of the Board of Trustees ‐ June 7, 2016

forHouston Community College System

&

Houston Community College Public Facility Corporation

Summary Summary of Financial Statements 1

Fund Balances Fund Balance Statement  2

Operating Summary HCCS Unrestricted Revenue & Expenditures 3

Auxiliary Sources and Uses of Auxiliary Funds 4

Budgets Adjusted Budgets by Divisions 6

Balance Sheet Balance Sheet by Fund 8

Exemptions/Waivers Exemptions & Waivers Detail 9

Table of ContentsFor the Period September 1, 2015 ‐ April 30, 2016

Houston Community College System

1  

Houston Community College System Summary of Financial Statements 

As of April 30, 2016   


In the Unrestricted Fund as of April 30, 2016, total revenue received is $279.5 million. This 

represents 86.1% of budgeted annual revenues of $324.6 million. Expenses total $216 million to 

date; which is 66.6% of the total expense budget of $324.6 million.  Compared with the same 

time last year, revenue shows a 3.4% increase, and expenses are 9% higher than the prior year.  

Actual net revenue is $63.5 million to‐date.  That translates into a like amount increase in fund 

balance. 


Salaries increased 6.2%.  This increase is due namely to the compensation study alignment and 

an across the board salary increase of 2% for full‐time employees. 


The expenses in Transfers & Debt show an increase of $9.5 million namely due to the 

redemption of the PFC Westgate Bonds Series 2005A in the amount of $8.1 million.  


Total revenue and expenses are expected to fall within budget plan at year end.  


Unrestricted1 Restricted Auxiliary

Loan & 

Endowments  Scholarship Agency          

Unexpended 

Plant     

Capital and 

Technology

Retirement of 

Debt 

Investment in 

Plant     

Public Facility 

Corp. Grand Total

Fund Balance as of 9/1/2015, Audited  $        45,130,654   $     4,540,237   $        7,699,183   $               509,932   $            (29,805)  $                        ‐    $                27,332   $       5,660,509   $       52,039,009   $   251,542,378   $      (2,701,008)  $      364,418,421 

Revenues          279,533,161        20,466,870             6,434,176                                ‐            87,570,662                             ‐                 1,906,316                           ‐              50,584,073           (5,517,511)                          54           440,977,801 

ExpensesSalaries 125,581,068         3,403,598         1,242,013           ‐                            1,408,098           ‐                         188,217                 ‐                       ‐                         ‐                        ‐                        131,822,994         

Employee Benefits 15,454,426            9,446,935         398,858               ‐                            ‐                        ‐                         43,010                    ‐                       ‐                         ‐                        ‐                        25,343,230           

Supplies & General Exp 2,958,084              107,103            791,259               ‐                            ‐                        ‐                         846                         19,967                ‐                         ‐                        ‐                        3,877,259             

Travel 613,673                 80,649              173,471               ‐                            ‐                        ‐                         434                         ‐                       ‐                         ‐                        ‐                        868,226                 

Marketing Costs 362,665                 30,290              420,362               ‐                            ‐                        ‐                         ‐                          ‐                       ‐                         ‐                        ‐                        813,317                 

Rentals & Leases 1,629,945              87,911              37,456                 ‐                            ‐                        ‐                         3,757                      ‐                       ‐                         ‐                        ‐                        1,759,069             

Insurance/Risk Mgmt 4,541,915              7,336                 3,098                   ‐                            ‐                        ‐                         ‐                          ‐                       ‐                         ‐                        ‐                        4,552,349             

Contracted Services 13,874,952            2,481,467         1,446,614           ‐                            ‐                        ‐                         96,442                    26,125                245,723                ‐                        ‐                        18,171,324           

Utilities 5,343,086              ‐                     321,712               ‐                            ‐                        ‐                         ‐                          ‐                       ‐                         ‐                        ‐                        5,664,798             

Other Departmental Expenses 1,226,424              116,171            1,402,265           ‐                            ‐                        ‐                         ‐                          ‐                       ‐                         ‐                        ‐                        2,744,861             

Instructional and Other Materials 6,304,323              277,857            139,569               ‐                            ‐                        ‐                         807,736                 ‐                       ‐                         ‐                        ‐                        7,529,485             

Maintenance and Repair 523,757                 269,887            5,440                   ‐                            235,393               ‐                         ‐                          56,911                ‐                         ‐                        ‐                        1,091,389             

Transfers (In)/Out2 35,794,354            4,000,000         ‐                        251,000                   (2,578,997)          ‐                         500,000                 (9,000,000)         (28,966,358)         ‐                        ‐                        (0)                            

Debt 81,091                    ‐                     279                       ‐                            ‐                        ‐                         ‐                          ‐                       65,157,754           ‐                        1,495,641           66,734,765           

Capital Outlay 1,749,654              627,199            39,357                 ‐                            ‐                        ‐                         80,512,303            2,525,239          ‐                         ‐                        133,055               85,586,806           

Depreciation ‐                          ‐                     ‐                        ‐                            ‐                        ‐                         ‐                          ‐                       ‐                         14,576,074         ‐                        14,576,074           

Scholarship Distribution ‐                          ‐                     ‐                        ‐                            88,476,363         ‐                         ‐                          ‐                       ‐                         ‐                        ‐                        88,476,363           

Total Expenses 216,039,417         20,936,405      6,421,752           251,000                   87,540,857         ‐                         82,152,746            (6,371,758)         36,437,120           14,576,074         1,628,696           459,612,308         

NET REVENUE/(EXPENSES) 63,493,743            (469,534)           12,424                 (251,000)                 29,805                 ‐                         (80,246,430)          6,371,758          14,146,953           (20,093,585)        (1,628,642)          (18,634,507)          

Fund Balance Entries 182,029                 ‐                     ‐                        ‐                            ‐                        ‐                         98,024,141            1,013,738          1,279,420             26,926,673         (137,996)             127,288,005         

Fund Balance as of 4/30/2016 108,806,426$       4,070,703$      7,711,607$         258,932$                 (0)$                        ‐$                      17,805,043$         13,046,006$      67,465,382$        258,375,466$    (4,467,646)$       473,071,919$      

1The significant change in the unresticted fund balance is attributable to the implementation of GASB 68, Accounting and Reporting for Financial Pension .2Transfers include student revenue bond payment funds, scholarship matching funds, and transfers to Unexpended Plant and Capital and Technology Funds.

Unaudited Fund Balances and Activities ‐ All Funds

as of April 30, 2016

2

HOUSTON COMMUNITY COLLEGE SYSTEM

Year‐to‐Date Actuals 

Thru April 30, 2016 FY2016 Budget

Actuals as a % 

of Budget

Year‐to‐Date Actuals 

Thru April 30, 2016

Year‐to‐Date Actuals 

Thru April 30, 2015

Increase (Decrease) 

FY2016 Compared to 

FY2015

% Increase 

(Decrease)

REVENUES

State Appropriations 43,475,205$       69,995,427$         62.1% 43,475,205$         42,872,339$       602,866$               1.4%Ad Valorem Taxes 131,620,340        136,000,000        96.8% 131,620,340         122,018,960      9,601,380             7.9%Tuition, Net 37,506,815          40,925,000          91.6% 37,506,815           37,251,785         255,029                 0.7%Fees 58,155,902          65,325,000          89.0% 58,155,902           58,731,754         (575,852)               ‐1.0%Other Local Income 1,787,458            2,250,000            79.4% 1,787,458            1,554,521           232,936                 15.0%Tuition & Fee, Net

 ‐‐ Extended Learning6,652,310             9,500,000              70.0% 6,652,310             7,509,444             (857,133)                 ‐11.4%

Indirect Cost Revenues, Grant  335,131                620,000                54.1% 335,131                393,792               (58,661)                  ‐14.9%Total Revenues 279,533,161        324,615,427        86.1% 279,533,161         270,332,596      9,200,565             3.4%

EXPENSES

Salaries 125,581,068        188,436,441        66.6% 125,581,068         118,227,723      7,353,345             6.2%Employee Benefits 15,454,426          21,210,175          72.9% 15,454,426           12,829,403         2,625,023             20.5%Supplies Gen Exp 2,958,084            5,873,370            50.4% 2,958,084            2,698,267           259,817                 9.6%Travel 613,673                1,880,217            32.6% 613,673                629,318               (15,645)                  ‐2.5%Marketing Costs 362,665                1,064,232            34.1% 362,665                732,635               (369,970)               ‐50.5%Rental & Leases 1,629,945            2,525,155            64.5% 1,629,945            1,654,284           (24,338)                  ‐1.5%Insurance/Risk Mgmt 4,541,915            5,551,813            81.8% 4,541,915            6,409,513           (1,867,598)            ‐29.1%Contract Services 13,874,952          24,569,264          56.5% 13,874,952           14,255,591         (380,639)               ‐2.7%Utilities 5,343,086            10,242,051          52.2% 5,343,086            5,317,590           25,496                   0.5%Other Departmental Expenses 1,226,424            2,288,295            53.6% 1,226,424            977,514               248,911                 25.5%Instructional & Other Materials 6,304,323            9,971,044            63.2% 6,304,323            6,070,996           233,327                 3.8%Maintenance & Repair 523,757                1,218,950            43.0% 523,757                630,979               (107,222)               ‐17.0%Transfers/Debt 35,875,445          40,723,903          88.1% 35,875,445           26,350,065         9,525,380             36.1%Contingency ‐                             4,899,339            0.0% ‐                             ‐                        ‐                          0.0%Capital Outlay 1,749,654            4,161,177            42.0% 1,749,654            1,370,189           379,465                 27.7%

     Total Expenses  216,039,417$      324,615,427$      66.6% 216,039,417$      198,154,066$     17,885,352           9.0%

NET REVENUE/(EXPENSES) 63,493,743$       0$                           0.0% 63,493,743$         72,178,530$       (8,684,787)$           ‐12.0%

HOUSTON COMMUNITY COLLEGE SYSTEMComparison to Budget and Comparison to Previous Fiscal Year

as of April 30, 2016

  HCCS CURRENT UNRESTRICTED

3

66.7% of Year Expended

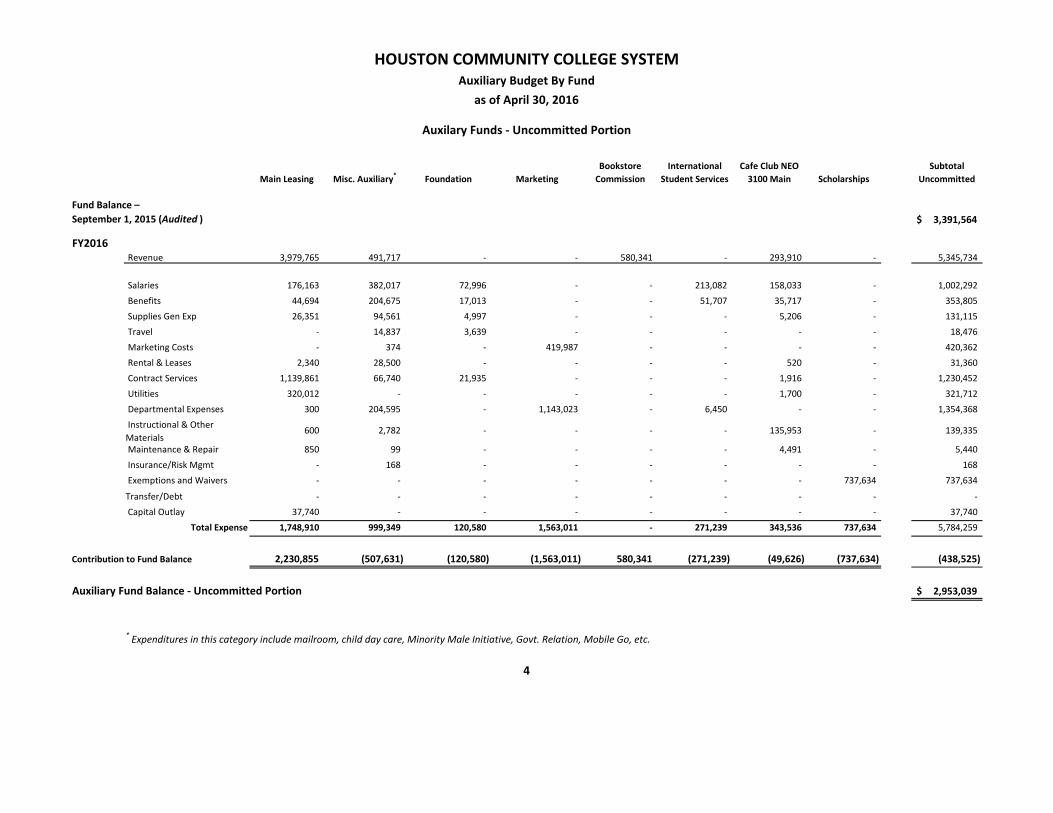
Main Leasing Misc. Auxiliary* Foundation Marketing

Bookstore 

Commission

International 

Student Services

Cafe Club NEO 

3100 Main Scholarships

Subtotal 

Uncommitted

21,608,919$      (15,867,575)$       (1,919,115)$           (22,697,403)$           26,337,287$      (2,029,029)$      (1,579,123)$      (462,396)$          3,391,564$     

FY2016 Revenue  3,979,765             491,717                 ‐                                ‐                                   580,341               ‐                           293,910              ‐                           5,345,734        

 Salaries  176,163                382,017                   72,996                        ‐                                     ‐                             213,082                158,033                ‐                             1,002,292          

 Benefits  44,694                   204,675                   17,013                        ‐                                     ‐                             51,707                   35,717                   ‐                             353,805              

 Supplies Gen Exp  26,351                   94,561                      4,997                          ‐                                     ‐                             ‐                             5,206                     ‐                             131,115              

 Travel  ‐                             14,837                      3,639                          ‐                                     ‐                             ‐                             ‐                             ‐                             18,476                

 Marketing Costs  ‐                             374                           ‐                                  419,987                        ‐                             ‐                             ‐                             ‐                             420,362              

 Rental & Leases  2,340                     28,500                      ‐                                  ‐                                     ‐                             ‐                             520                        ‐                             31,360                

 Contract Services  1,139,861             66,740                      21,935                        ‐                                     ‐                             ‐                             1,916                     ‐                             1,230,452          

 Utilities  320,012                ‐                                ‐                                  ‐                                     ‐                             ‐                             1,700                     ‐                             321,712              

 Departmental Expenses  300                        204,595                   ‐                                  1,143,023                     ‐                             6,450                     ‐                             ‐                             1,354,368          

 Instructional & Other 

Materials 600                        2,782                        ‐                                  ‐                                     ‐                             ‐                             135,953                ‐                             139,335              

 Maintenance & Repair  850                        99                             ‐                                  ‐                                     ‐                             ‐                             4,491                     ‐                             5,440                  

 Insurance/Risk Mgmt  ‐                             168                           ‐                                  ‐                                     ‐                             ‐                             ‐                             ‐                             168                     

 Exemptions and Waivers  ‐                             ‐                                ‐                                  ‐                                     ‐                             ‐                             ‐                             737,634                737,634              

Transfer/Debt ‐                             ‐                                ‐                                  ‐                                     ‐                             ‐                             ‐                             ‐                             ‐                           

 Capital Outlay  37,740                   ‐                                ‐                                  ‐                                     ‐                             ‐                             ‐                             ‐                             37,740                

 Total Expense  1,748,910             999,349                   120,580                     1,563,011                     ‐                             271,239                343,536                737,634                5,784,259          

Contribution to Fund Balance 2,230,855          (507,631)             (120,580)               (1,563,011)              580,341             (271,239)          (49,626)            (737,634)          (438,525)        

Auxiliary Fund Balance ‐ Uncommitted Portion 2,953,039$     

* Expenditures in this category include mailroom, child day care, Minority Male Initiative, Govt. Relation, Mobile Go, etc.

4

Fund Balance – 

September 1, 2015 (Audited )

HOUSTON COMMUNITY COLLEGE SYSTEMAuxiliary Budget By Fund

as of April 30, 2016

Auxilary Funds ‐ Uncommitted Portion

Total

Saigon Tech

Other 

International 

Initiatives

Subtotal 

International

Minority 

Business 

Development 

Agency

Student 

Vending 

Commission

Student 

Activity Fee

Student  

Athletic Fee Subtotal 

Committed Total Auxiliary

328,922$      (92,954)$       1,818,386$     ‐$                  324,132$        1,005,688$    1,159,414$    2,489,233$       7,699,183$    (Audited)

FY2016 Revenue  23,333               ‐                         23,333               ‐                          63,000                989,165             769,173           1,821,339           7,190,405        

 Salaries  ‐                          ‐                         ‐                             ‐                            4,200                   73,500                162,021             239,721                 1,242,013          

 Benefits  ‐                          ‐                         ‐                             ‐                            7,089                   37,963               45,053                   398,858             

 Supplies Gen Exp  484                    ‐                         484                       ‐                            40,801                 453,429              165,431             659,661                 791,259             

 Travel  5,992                 49,139              55,131                 ‐                            45                         48,395                51,425               99,865                   173,471             

 Marketing Costs  ‐                          ‐                         ‐                             ‐                            ‐                            ‐                           ‐                           ‐                              420,362             

 Rental & Leases  ‐                          ‐                         ‐                             ‐                            ‐                            ‐                           6,096                  6,096                     37,456                

 Contract Services  ‐                          ‐                         ‐                             ‐                            ‐                            87,305                128,857             216,162                 1,446,614          

 Utilities  ‐                          ‐                         ‐                             ‐                            ‐                            ‐                           ‐                           ‐                              321,712             

 Departmental Expenses  ‐                          ‐                         ‐                             ‐                            18,000                 11,069                18,828               47,897                   1,402,265          

 Instructional & Other 

Materials ‐                          ‐                         ‐                             ‐                            ‐                            ‐                           234                     234                         139,569             

 Maintenance & Repair  ‐                          ‐                         ‐                             ‐                            ‐                            ‐                           ‐                           ‐                              5,440                  

 Insurance/Risk Mgmt  ‐                          ‐                         ‐                             ‐                            ‐                            630                      2,300                  2,930                     3,098                  

 Exemptions and Waivers  ‐                          ‐                         ‐                             ‐                            ‐                            18,194                400                     18,594                   756,229             

Transfer ‐                          ‐                         ‐                             ‐                            ‐                            ‐                           ‐                           ‐                              ‐                           

 Capital Outlay  ‐                          ‐                         ‐                             ‐                            ‐                            1,896                   ‐                           1,896                     39,636                

 Total Expense  6,476                 49,139              55,614                 ‐                            63,046                 701,506              573,556             1,338,108             7,177,981          

Contribution to Fund Balance 16,857           (49,139)         (32,281)            ‐                            (46)                       287,659              195,618             483,230                 12,424            

Auxiliary Fund Balance ‐ Intl, Committed, Total 1,786,105$     ‐$                  324,085$        1,293,347$    1,355,031$    2,972,464$       7,711,607$    

HOUSTON COMMUNITY COLLEGE SYSTEMAuxiliary Budget By Fund

as of April 30, 2016

5

Auxiliary Funds ‐ International and Committed Portions

International Committed

Fund Balance – 

September 1, 2015 

as of April 30, 2016

 Budgeted Expenditures   CENTRAL  NORTH

WEST 

 NORTH

EAST 

 SOUTH

WEST 

 SOUTH

EAST  COLEMAN 

 EXTENDED 

LEARNING 

 ACADEMIC 

INSTRUCTION 

Salary 9,137,186$        8,760,208$        11,519,365$             10,169,080$         5,621,790$           12,515,396$     11,664,723$         56,204,358$        

Employee Benefits ‐                      ‐                      ‐                              ‐                          ‐                          ‐                      ‐                         ‐                        

Supplies & Gen 233,211             245,163             231,226                     317,178                 303,014                 313,654             202,521                 334,923                

Travel 39,050               79,173               26,888                       46,336                   32,980                   110,610             98,982                   156,555                

Marketing Costs 13,645               37,207               56,019                       26,432                   98,027                   18,210               286,057                 22,618                  

Rentals & Leases 5,330                  59,271               940,162                     503,206                 60,566                   497,054             25,443                   19,160                  

Insurance/Risk Mgmt ‐                      ‐                      ‐                              ‐                          ‐                          126                     ‐                         511                       

Contracted Services 286,511             264,368             76,819                       15,386                   65,445                   181,691             131,659                 371,695                

Utilities 5,125                  ‐                      ‐                              1,826                     ‐                          ‐                      ‐                         ‐                        

Other Departmental Expenses 54,338               68,313               30,374                       32,620                   26,146                   91,119               57,621                   72,271                  

Instructional And Other Materials 317,954             56,209               192,197                     119,961                 72,905                   244,783             772,029                 1,204,253            

Maintenance and Repair 138,855             45,862               126,399                     11,815                   26,595                   60,718               123,511                 44,462                  

Transfers/Debt ‐                      ‐                      1,186                          ‐                          ‐                          ‐                      ‐                         ‐                        

Contingency 457,212             440,543             120,335                     285,061                 45,363                   427,617             201,794                 ‐                        

Capital Outlay 502,712             230,675             232,518                     212,227                 150,885                 124,144             132,459                 334,195                

 Total 11,191,129$  10,286,992$  13,553,487$          11,741,128$      6,503,716$        14,585,122$  13,696,799$      58,765,001$     

HOUSTON COMMUNITY COLLEGEFY 2015‐16 Adjusted Budget by Divisions

6

as of April 30, 2016

HOUSTON COMMUNITY COLLEGEFY 2015‐16 Adjusted Budget by Divisions

 Budgeted Expenditures   CHANCELLOR FINANCE & 

ADMIN.  SUSTAINABILITY 

INSTRUCTIONAL 

SERVICES 

 STUDENT 

SERVICES  SYSTEM   Grand Total 

Salary 5,844,862$        31,581,172$     2,389,518$                17,588,429$         4,789,776$           650,578$           188,436,441$      

Employee Benefits ‐                      ‐                      ‐                              ‐                          ‐                          21,210,175        21,210,175          

Supplies & Gen 722,227             1,010,368          153,690                     311,159                 195,036                 1,300,000          5,873,370            

Travel 171,375             267,866             63,153                       739,310                 47,939                   ‐                      1,880,217            

Marketing Costs 242,000             254,739             7,278                          2,000                     ‐                          ‐                      1,064,232            

Rentals & Leases 87,700               252,388             57,156                       12,319                   5,400                     ‐                      2,525,155            

Insurance/Risk Mgmt 5,550,000          ‐                      ‐                              1,176                     ‐                          ‐                      5,551,813            

Contracted Services 3,465,976          15,616,506        47,500                       142,843                 1,376,812              2,526,053          24,569,264          

Utilities ‐                      1,752,227          ‐                              94                           ‐                          8,482,779          10,242,051          

Other Departmental Expenses 782,145             383,292             53,786                       525,812                 110,458                 ‐                      2,288,295            

Instructional And Other Materials 62,415               5,985,372          39,000                       568,797                 335,169                 ‐                      9,971,044            

Maintenance and Repair 15,446               620,909             3,050                          444                         884                         ‐                      1,218,950            

Transfers/Debt 200,000             43,591               ‐                              ‐                          ‐                          40,479,126        40,723,903          

Contingency 150,000             246,064             232,659                     50,758                   9,396                     2,232,537          4,899,339            

Capital Outlay 130,918             1,842,578          200,604                     51,413                   15,850                   ‐                      4,161,177            

 Total 17,425,064$  59,857,072$  3,247,394$            19,994,554$      6,886,720$        76,881,248$  324,615,427$  

7


CURRENT & 

LOAN FUNDS1PLANT & BOND 

FUNDS2  Total All Funds 

ASSETSCurrent Assets:

Cash &  cash equivalents 140,564,076$     41,695,515$          182,259,591$        Restricted cash & cash equivalents 3,885,386          ‐                             3,885,386              Short term Investments ‐                          ‐                             ‐                             Accounts/Other receivable (net) 17,218,197        3,004,776             20,222,973            Deferred charges 30,378                ‐                             30,378                    Prepaids 1,945,082          673,299                2,618,381              

Total Current Assets 163,643,119      45,373,590           209,016,710          

Non‐current Assets:Restricted cash & cash equivalents ‐                          168,274,368         168,274,368          Restricted long‐term investments ‐                          93,903,385           93,903,385            Long‐term Investments 44,427,905        ‐                             44,427,905            Deferred Outflows of Resources: Pension 11,299,015        ‐                             11,299,015            Advance Funding Valuation Outflows ‐                          8,743,822             8,743,822              Capital Assets, net ‐                          1,003,128,981      1,003,128,981       

Total Non‐current Assets 55,726,920        1,274,050,556      1,329,777,476       

Total Assets 219,370,042$     1,319,424,146$    1,538,794,189$    

LIABILITIESCurrent Liabilities:

Accounts payable 5,502,798          2,075,071             7,577,869              

Accrued liabilities 58,503                  19,444                     77,947                    Compensated absences 2,526,083          ‐                             2,526,083              Funds held for others 708,856             189,209                898,065                 Deferred revenue 1,671,221          263,726                1,934,947              Notes payable‐current portion ‐                          ‐                             ‐                             Bonds payable‐current portion ‐                          ‐                             ‐                             

Total Current Liabilities 10,467,461        2,547,451             13,014,912            

Non‐current Liabilities:Deposits ‐                          ‐                             ‐                             Net Pension Liability 67,428,372        ‐                             67,428,372            Deferred Inflows of Resources: Pension 20,626,539        ‐                             20,626,539            Advance Funding Valuation Inflows ‐                          795,245                795,245                 Notes payable ‐                          153,344,686         153,344,686          Bonds payable ‐                          760,205,808         760,205,808          Capital lease obligations ‐                          45,839,058           45,839,058            

Total Non‐current Liabilities 88,054,911        960,184,798         1,048,239,709       

Total Liabilities 98,522,372$       962,732,248$        1,061,254,621$    

 Fund Balance‐ 

August 31, 2015 Audited  57,850,201        309,269,229         367,119,430          

Revenues Over Expenditures     Unrestricted 63,688,197        63,688,197                 Restricted (690,728)            (690,728)                     Net Investment in Plant 47,422,670           47,422,670            

Total Fund Balances 120,847,670$     356,691,899$        477,539,569$        

 Total Liabilities &  Fund Balances  219,370,042$     1,319,424,147$    1,538,794,189$    

1  In cludes Unrestricted, Restricted, Loan & Endowment, Scholarship, Agency and Auxiliary Funds.2  Includes Unexpended Plant, Retirement of Debt and Investment in Plant Funds.

Houston Community CollegeBalance Sheet By Fund

For Month Ended April 30, 2016

8

FY 2014‐15 FY 2015‐16

Budget:Adjusted Budget FY 2015‐16, Net 40,925,000$         

Revenues Received:Tuition 46,585,807          43,370,845          43,755,901          

Waivers & Exemptions:Dual Credit & Early College HS (5,045,017)           (4,677,565)           (4,967,973)           

Other (1,603,037)           (1,441,495)           (1,281,113)           

Total Waivers & Exemptions (6,648,054)           (6,119,060)           (6,249,086)           

Total Tuition Revenue, Net 39,937,754$        37,251,785$        37,506,815$         

Budget:Budget FY 2015‐16, Net 9,500,000$           

Revenues Received:Tuition 11,329,490          8,936,107            7,724,692             

Waivers & Exemptions:Department of Corrections (1,946,863)           (1,426,663)           (1,072,382)           

Total EL Tuition Revenue, Net 9,382,627$          7,509,444$          6,652,310$           

FY 2014‐15 FY 2015‐16

Dept of Corrections 1,946,863$           1,426,663$           1,072,382$            ‐24.8%

Dual Credit & Early College HS Waiver 5,045,017            4,677,565            4,967,973              6.2%

Other:

Employee Fee Exemptions 61,121                 52,411                 50,879                   ‐2.9%

Firemen 12,870                 11,404                 7,403                     ‐35.1%

Hazelwood 942,773               850,264               682,548                 ‐19.7%

Deaf & Blind 190,174               171,622               191,245                 11.4%

High Ranking Hi SCH Grad 1,805                    1,805                    1,519                     ‐15.8%

Child of Disabled Vet ETC 7,264                    7,264                    3,295                     ‐54.6%

Emp of State Coll & Univ ‐                        ‐                        2,372                     0.0%

Nonres Teach/Research Asst 6,363                    6,098                    965                         ‐84.2%

Nonres Competitive Scholar 8,558                    8,558                    33,426                   290.6%

Senior Citizens 13,668                 12,961                 11,907                   ‐8.1%

Scholarship Distribution 2,800                    ‐                        2,800                     0.0%

A VISA Waiver (Non‐Alien Waiver) 888                         888                     ‐                          ‐100.0%

Foster Children‐Resident 247,117               224,536               145,222                 ‐35.3%

Fire Academy Waiver ‐                        ‐                        (15)                          0.0%

Undocumented Students 5,723                    5,378                    1,859                     ‐65.4%

TX Tomorrow Waiver 6,076                    5,810                    1,792                     ‐69.2%

Surviving Spouse/Children ‐                        ‐                        2,942                     0.0%

Peace Officer Exemption 3,868                    3,297                    1,359                     ‐58.8%

Adopted Student Waiver 91,719                 78,949                 139,595                 76.8%

Stipends 250                       250                       ‐                         0.0%

Total Other Exemptions 1,603,037            1,441,495            1,281,113              ‐11.1%

Grand Total Exemptions & Waivers 8,594,917$          7,545,723$          7,321,468$            ‐3.0%

 Year‐to‐Date 

Activity thru 

4/30/2016 

Houston Community College

9

 Actuals % 

Inc/(Dec)YTD 

vs. PriorYTD 

Exemptions & WaiversThrough April 30, 2016

Account

 End of Year 

Activity 

Year‐to‐Date 

Activity thru 

4/30/2015

 Year‐to‐Date 

Activity thru 

4/30/2016 

Tuition

Tuition ‐ Extended Learning

Exemptions & Waivers

 End of Year 

Activity 

Year‐to‐Date 

Activity thru 

4/30/2015