condensed fs2016 september
TRANSCRIPT

Summary Operating Statements
For the Period
September 1, 2016 ‐ September 30, 2016
For the Meeting of the Board of Trustees ‐ November 10, 2016
forHouston Community College System
&
Houston Community College Public Facility Corporation

Summary Summary of Financial Statements 1
Fund Balances Fund Balance Statement 2
Operating Summary HCCS Unrestricted Revenue & Expenditures 3
Auxiliary Sources and Uses of Auxiliary Funds 4
Budgets Adjusted Budgets by Divisions 6
Balance Sheet Balance Sheet by Fund 8
Exemptions/Waivers Exemptions & Waivers Detail 9
Table of ContentsFor the Period September 1, 2016 ‐ September 30, 2016
Houston Community College System

1
Houston Community College System Summary of Financial Statements
As of September 30, 2016
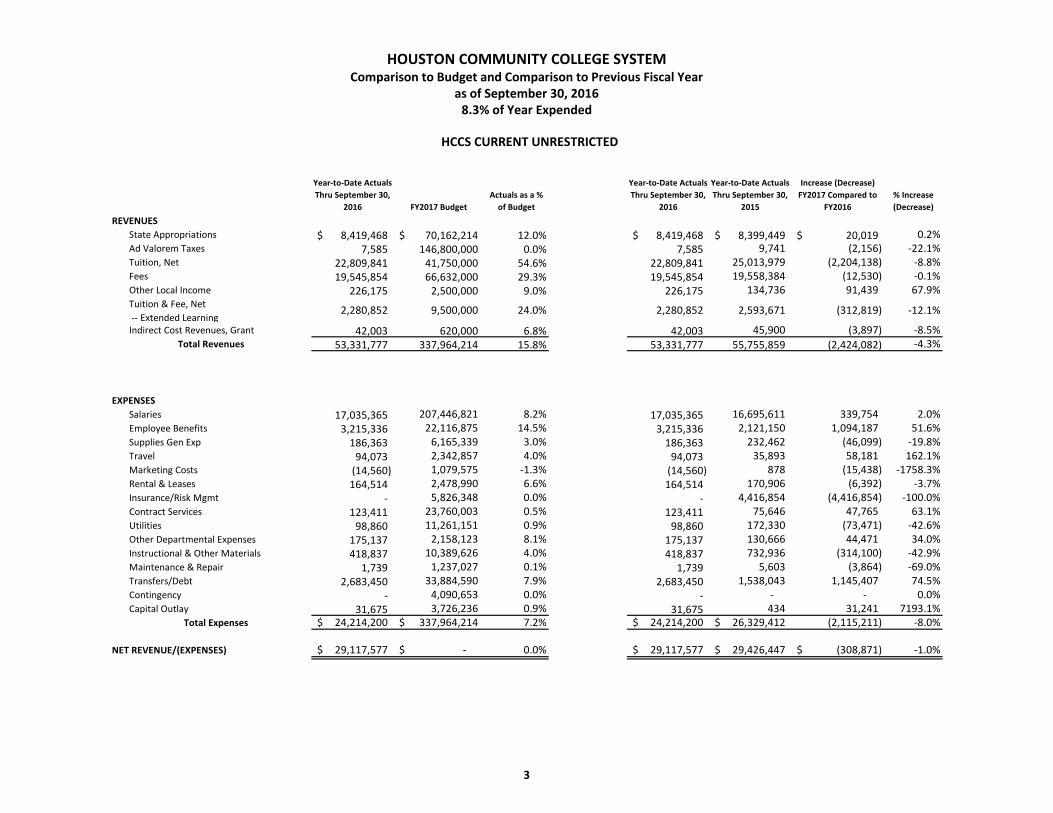
In the Unrestricted Fund as of September 30, 2016, total revenue received is $53.3 million. This
represents 15.8% of budgeted annual revenues of $338 million. Expenses total $24.2 million to
date; which is 7.2% of the total expense budget of $338 million. Compared with the same time
last year, revenue shows a 4.3% decrease, and expenses are 8% lower than the prior year.
Actual net revenue is $29.1 million to‐date. That translates into a like amount increase in fund
balance.
Salaries increased 2%. This increase is due namely to the compensation study alignment and an
across the board salary increase of 2% for full‐time employees.
The expenses in Transfers & Debt show an increase of $1.1 million namely due to the call on the
2006 Jr Lien Revenue Bonds and 2006 Maintenance Tax Notes in the amount of $2 million.
Total revenue and expenses are expected to fall within budget plan at year end.

Unrestricted Restricted Auxiliary
Loan &
Endowments Scholarship Agency
Unexpended
Plant
Capital and
Technology
Retirement of
Debt
Investment in
Plant
Public Facility
Corp. Grand Total
Fund Balance as of 9/1/2016, Unaudited $ 51,006,557 $ 1,673,387 $ 8,065,581 $ 238,698 $ (29,803) $ ‐ $ 18,252,093 $ 9,116,088 $ 66,032,435 $ 265,719,441 $ (3,342,508) $ 416,731,968
Revenues 53,331,777 2,357,344 1,096,775 ‐ 21,566,967 ‐ 302,327 ‐ 2,122,365 ‐ ‐ 80,777,556
ExpensesSalaries 17,035,365 370,405 164,063 ‐ 46,502 ‐ 27,577 ‐ ‐ ‐ ‐ 17,643,913
Employee Benefits 3,215,336 62,787 50,115 ‐ ‐ ‐ 5,615 ‐ ‐ ‐ ‐ 3,333,853
Supplies & General Exp 186,363 3,209 (3,959) ‐ ‐ ‐ ‐ ‐ ‐ ‐ ‐ 185,613
Travel 94,073 19,013 4,974 ‐ ‐ ‐ ‐ ‐ ‐ ‐ ‐ 118,061
Marketing Costs (14,560) 1,000 10,275 ‐ ‐ ‐ ‐ ‐ ‐ ‐ ‐ (3,285)
Rentals & Leases 164,514 7,525 225 ‐ ‐ ‐ ‐ ‐ ‐ ‐ ‐ 172,264
Insurance/Risk Mgmt ‐ ‐ ‐ ‐ ‐ ‐ ‐ ‐ ‐ ‐ ‐ ‐
Contracted Services 123,411 85,764 ‐ ‐ ‐ ‐ ‐ ‐ 6,311 ‐ ‐ 215,486
Utilities 98,860 ‐ ‐ ‐ ‐ ‐ ‐ ‐ ‐ ‐ ‐ 98,860
Other Departmental Expenses 175,137 27,895 11,445 ‐ ‐ ‐ ‐ ‐ ‐ ‐ ‐ 214,477
Instructional and Other Materials 418,837 2,791 9,584 ‐ ‐ ‐ ‐ ‐ ‐ ‐ ‐ 431,211
Maintenance and Repair 1,739 32,145 ‐ ‐ 14,869 ‐ 2,226 1,150 ‐ ‐ ‐ 52,129
Transfers (In)/Out1 2,673,231 ‐ ‐ ‐ (695,653) ‐ ‐ ‐ (1,977,578) ‐ ‐ ‐
Debt 10,220 ‐ ‐ ‐ ‐ ‐ 430,380 ‐ 4,045,501 474,726 ‐ 4,960,827
Capital Outlay 31,675 51,355 ‐ ‐ ‐ ‐ 6,312,151 86,434 ‐ ‐ ‐ 6,481,615
Depreciation ‐ ‐ ‐ ‐ ‐ ‐ ‐ ‐ ‐ 1,965,369 ‐ 1,965,369
Scholarship Distribution ‐ ‐ ‐ ‐ 22,169,252 ‐ ‐ ‐ ‐ ‐ ‐ 22,169,252
Total Expenses 24,214,200 663,887 246,723 ‐ 21,534,970 ‐ 6,777,949 87,584 2,074,234 2,440,095 ‐ 58,039,643
NET REVENUE/(EXPENSES) 29,117,577 1,693,458 850,052 ‐ 31,998 ‐ (6,475,622) (87,584) 48,131 (2,440,095) ‐ 22,737,914
Fund Balance Entries 66,780 ‐ ‐ ‐ ‐ ‐ (8,410,065) (1,016,958) (44,254) 14,491,285 3,956,220 9,043,007
Fund Balance as of 9/30/2016 80,190,914$ 3,366,845$ 8,915,632$ 238,698$ 2,195$ ‐$ 3,366,406$ 8,011,546$ 66,036,312$ 277,770,631$ 613,712$ 448,512,890$
1Transfers include student revenue bond payment funds, scholarship matching funds, and transfers to Unexpended Plant and Capital and Technology Funds.
Unaudited Fund Balances and Activities ‐ All Funds
as of September 30, 2016
2
HOUSTON COMMUNITY COLLEGE SYSTEM
Year‐to‐Date Actuals
Thru September 30,
2016 FY2017 Budget
Actuals as a %
of Budget
Year‐to‐Date Actuals
Thru September 30,
2016
Year‐to‐Date Actuals
Thru September 30,
2015
Increase (Decrease)
FY2017 Compared to
FY2016
% Increase
(Decrease)
REVENUES
State Appropriations 8,419,468$ 70,162,214$ 12.0% 8,419,468$ 8,399,449$ 20,019$ 0.2%Ad Valorem Taxes 7,585 146,800,000 0.0% 7,585 9,741 (2,156) ‐22.1%Tuition, Net 22,809,841 41,750,000 54.6% 22,809,841 25,013,979 (2,204,138) ‐8.8%Fees 19,545,854 66,632,000 29.3% 19,545,854 19,558,384 (12,530) ‐0.1%Other Local Income 226,175 2,500,000 9.0% 226,175 134,736 91,439 67.9%Tuition & Fee, Net
‐‐ Extended Learning2,280,852 9,500,000 24.0% 2,280,852 2,593,671 (312,819) ‐12.1%
Indirect Cost Revenues, Grant 42,003 620,000 6.8% 42,003 45,900 (3,897) ‐8.5%Total Revenues 53,331,777 337,964,214 15.8% 53,331,777 55,755,859 (2,424,082) ‐4.3%
EXPENSES
Salaries 17,035,365 207,446,821 8.2% 17,035,365 16,695,611 339,754 2.0%Employee Benefits 3,215,336 22,116,875 14.5% 3,215,336 2,121,150 1,094,187 51.6%Supplies Gen Exp 186,363 6,165,339 3.0% 186,363 232,462 (46,099) ‐19.8%Travel 94,073 2,342,857 4.0% 94,073 35,893 58,181 162.1%Marketing Costs (14,560) 1,079,575 ‐1.3% (14,560) 878 (15,438) ‐1758.3%Rental & Leases 164,514 2,478,990 6.6% 164,514 170,906 (6,392) ‐3.7%Insurance/Risk Mgmt ‐ 5,826,348 0.0% ‐ 4,416,854 (4,416,854) ‐100.0%Contract Services 123,411 23,760,003 0.5% 123,411 75,646 47,765 63.1%Utilities 98,860 11,261,151 0.9% 98,860 172,330 (73,471) ‐42.6%Other Departmental Expenses 175,137 2,158,123 8.1% 175,137 130,666 44,471 34.0%Instructional & Other Materials 418,837 10,389,626 4.0% 418,837 732,936 (314,100) ‐42.9%Maintenance & Repair 1,739 1,237,027 0.1% 1,739 5,603 (3,864) ‐69.0%Transfers/Debt 2,683,450 33,884,590 7.9% 2,683,450 1,538,043 1,145,407 74.5%Contingency ‐ 4,090,653 0.0% ‐ ‐ ‐ 0.0%Capital Outlay 31,675 3,726,236 0.9% 31,675 434 31,241 7193.1%
Total Expenses 24,214,200$ 337,964,214$ 7.2% 24,214,200$ 26,329,412$ (2,115,211) ‐8.0%
NET REVENUE/(EXPENSES) 29,117,577$ ‐$ 0.0% 29,117,577$ 29,426,447$ (308,871)$ ‐1.0%
HOUSTON COMMUNITY COLLEGE SYSTEMComparison to Budget and Comparison to Previous Fiscal Year
as of September 30, 2016
HCCS CURRENT UNRESTRICTED
3
8.3% of Year Expended
Main Leasing Misc. Auxiliary* Foundation Marketing
Bookstore
Commission
International
Student Services
Cafe Club NEO
3100 Main Scholarships
Subtotal
Uncommitted
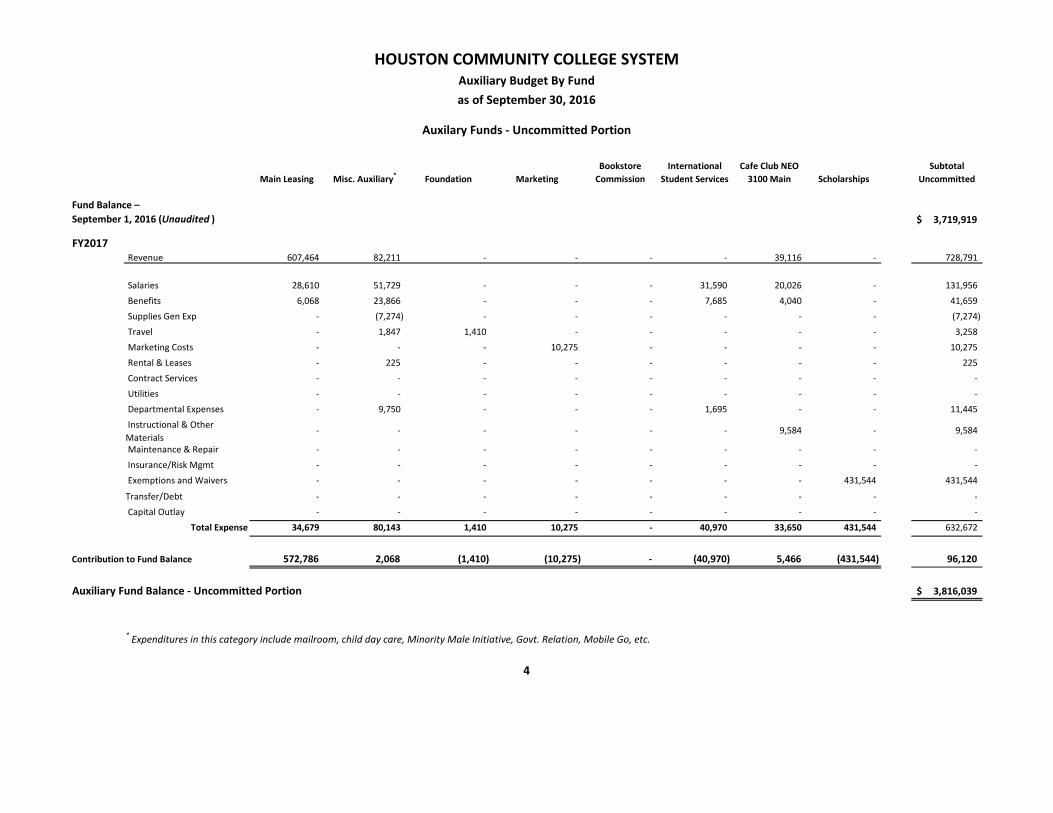
25,583,694$ (16,924,326)$ (2,139,046)$ (24,866,788)$ 28,251,330$ (2,462,581)$ (1,656,257)$ (2,066,107)$ 3,719,919$
FY2017 Revenue 607,464 82,211 ‐ ‐ ‐ ‐ 39,116 ‐ 728,791
Salaries 28,610 51,729 ‐ ‐ ‐ 31,590 20,026 ‐ 131,956
Benefits 6,068 23,866 ‐ ‐ ‐ 7,685 4,040 ‐ 41,659
Supplies Gen Exp ‐ (7,274) ‐ ‐ ‐ ‐ ‐ ‐ (7,274)
Travel ‐ 1,847 1,410 ‐ ‐ ‐ ‐ ‐ 3,258
Marketing Costs ‐ ‐ ‐ 10,275 ‐ ‐ ‐ ‐ 10,275
Rental & Leases ‐ 225 ‐ ‐ ‐ ‐ ‐ ‐ 225
Contract Services ‐ ‐ ‐ ‐ ‐ ‐ ‐ ‐ ‐
Utilities ‐ ‐ ‐ ‐ ‐ ‐ ‐ ‐ ‐
Departmental Expenses ‐ 9,750 ‐ ‐ ‐ 1,695 ‐ ‐ 11,445
Instructional & Other
Materials ‐ ‐ ‐ ‐ ‐ ‐ 9,584 ‐ 9,584
Maintenance & Repair ‐ ‐ ‐ ‐ ‐ ‐ ‐ ‐ ‐
Insurance/Risk Mgmt ‐ ‐ ‐ ‐ ‐ ‐ ‐ ‐ ‐
Exemptions and Waivers ‐ ‐ ‐ ‐ ‐ ‐ ‐ 431,544 431,544
Transfer/Debt ‐ ‐ ‐ ‐ ‐ ‐ ‐ ‐ ‐
Capital Outlay ‐ ‐ ‐ ‐ ‐ ‐ ‐ ‐ ‐
Total Expense 34,679 80,143 1,410 10,275 ‐ 40,970 33,650 431,544 632,672
Contribution to Fund Balance 572,786 2,068 (1,410) (10,275) ‐ (40,970) 5,466 (431,544) 96,120
Auxiliary Fund Balance ‐ Uncommitted Portion 3,816,039$
* Expenditures in this category include mailroom, child day care, Minority Male Initiative, Govt. Relation, Mobile Go, etc.
4
Fund Balance –
September 1, 2016 (Unaudited )
HOUSTON COMMUNITY COLLEGE SYSTEMAuxiliary Budget By Fund
as of September 30, 2016
Auxilary Funds ‐ Uncommitted Portion
Total
Saigon Tech
Other
International
Initiatives
Subtotal
International
Minority
Business
Development
Agency
Student
Vending
Commission
Student
Activity Fee
Student
Athletic Fee Subtotal
Committed Total Auxiliary
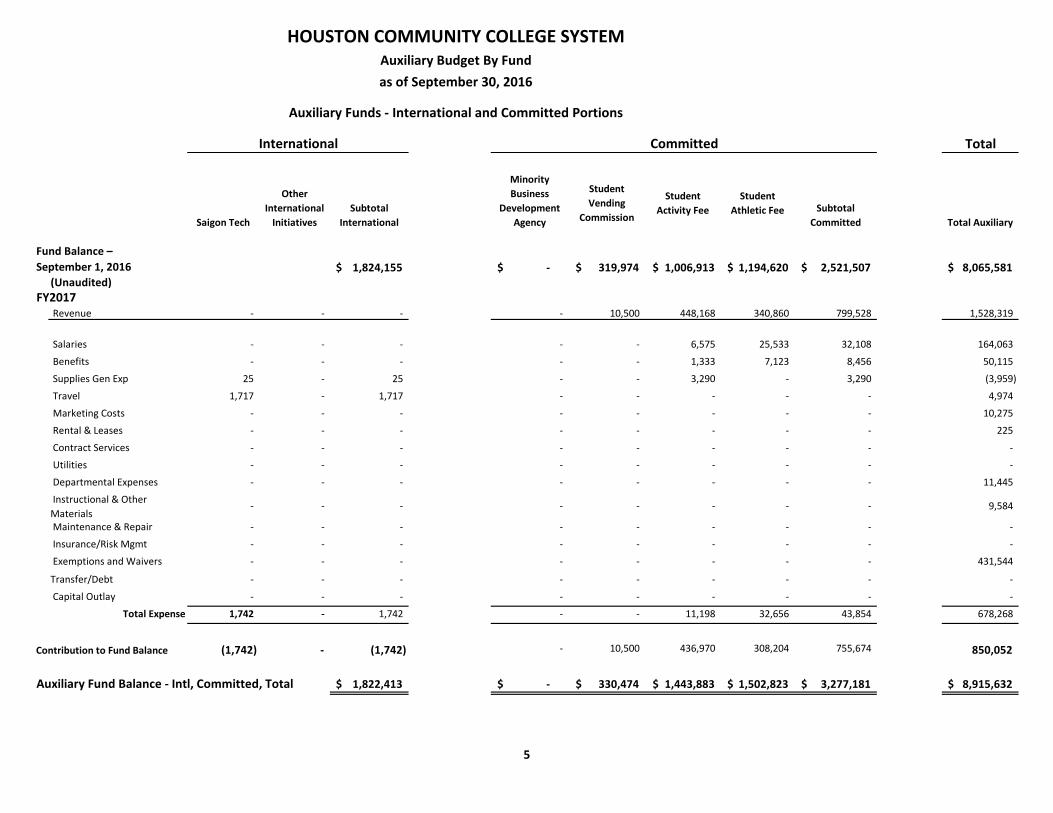
395,829$ (154,092)$ 1,824,155$ ‐$ 319,974$ 1,006,913$ 1,194,620$ 2,521,507$ 8,065,581$ (Unaudited)
FY2017 Revenue ‐ ‐ ‐ ‐ 10,500 448,168 340,860 799,528 1,528,319
Salaries ‐ ‐ ‐ ‐ ‐ 6,575 25,533 32,108 164,063
Benefits ‐ ‐ ‐ ‐ ‐ 1,333 7,123 8,456 50,115
Supplies Gen Exp 25 ‐ 25 ‐ ‐ 3,290 ‐ 3,290 (3,959)
Travel 1,717 ‐ 1,717 ‐ ‐ ‐ ‐ ‐ 4,974
Marketing Costs ‐ ‐ ‐ ‐ ‐ ‐ ‐ ‐ 10,275
Rental & Leases ‐ ‐ ‐ ‐ ‐ ‐ ‐ ‐ 225
Contract Services ‐ ‐ ‐ ‐ ‐ ‐ ‐ ‐ ‐
Utilities ‐ ‐ ‐ ‐ ‐ ‐ ‐ ‐ ‐
Departmental Expenses ‐ ‐ ‐ ‐ ‐ ‐ ‐ ‐ 11,445
Instructional & Other
Materials ‐ ‐ ‐ ‐ ‐ ‐ ‐ ‐ 9,584
Maintenance & Repair ‐ ‐ ‐ ‐ ‐ ‐ ‐ ‐ ‐
Insurance/Risk Mgmt ‐ ‐ ‐ ‐ ‐ ‐ ‐ ‐ ‐
Exemptions and Waivers ‐ ‐ ‐ ‐ ‐ ‐ ‐ ‐ 431,544
Transfer/Debt ‐ ‐ ‐ ‐ ‐ ‐ ‐ ‐ ‐
Capital Outlay ‐ ‐ ‐ ‐ ‐ ‐ ‐ ‐ ‐
Total Expense 1,742 ‐ 1,742 ‐ ‐ 11,198 32,656 43,854 678,268
Contribution to Fund Balance (1,742) ‐ (1,742) ‐ 10,500 436,970 308,204 755,674 850,052
Auxiliary Fund Balance ‐ Intl, Committed, Total 1,822,413$ ‐$ 330,474$ 1,443,883$ 1,502,823$ 3,277,181$ 8,915,632$
HOUSTON COMMUNITY COLLEGE SYSTEMAuxiliary Budget By Fund
as of September 30, 2016
5
Auxiliary Funds ‐ International and Committed Portions
International Committed
Fund Balance –
September 1, 2016
as of September 30, 2016
Budgeted Expenditures CENTRAL NORTH
WEST
NORTH
EAST
SOUTH
WEST
SOUTH
EAST COLEMAN
EXTENDED
LEARNING
ACADEMIC
INSTRUCTION
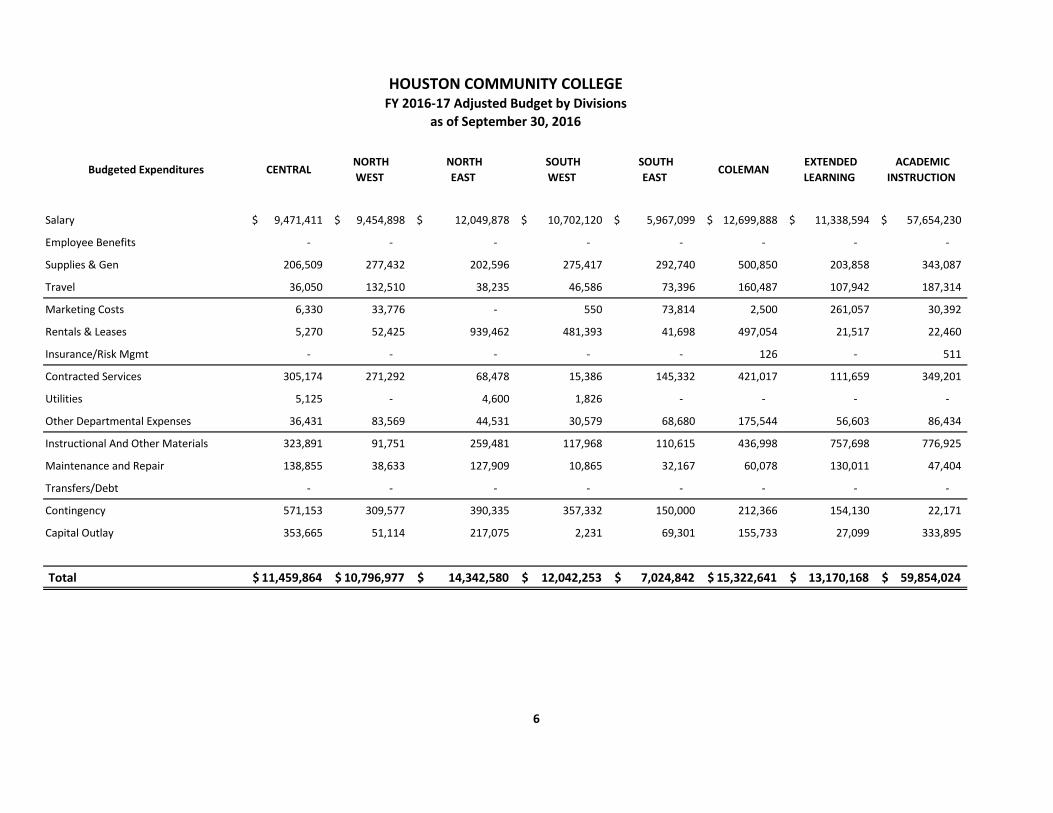
Salary 9,471,411$ 9,454,898$ 12,049,878$ 10,702,120$ 5,967,099$ 12,699,888$ 11,338,594$ 57,654,230$
Employee Benefits ‐ ‐ ‐ ‐ ‐ ‐ ‐ ‐
Supplies & Gen 206,509 277,432 202,596 275,417 292,740 500,850 203,858 343,087
Travel 36,050 132,510 38,235 46,586 73,396 160,487 107,942 187,314
Marketing Costs 6,330 33,776 ‐ 550 73,814 2,500 261,057 30,392
Rentals & Leases 5,270 52,425 939,462 481,393 41,698 497,054 21,517 22,460
Insurance/Risk Mgmt ‐ ‐ ‐ ‐ ‐ 126 ‐ 511
Contracted Services 305,174 271,292 68,478 15,386 145,332 421,017 111,659 349,201
Utilities 5,125 ‐ 4,600 1,826 ‐ ‐ ‐ ‐
Other Departmental Expenses 36,431 83,569 44,531 30,579 68,680 175,544 56,603 86,434
Instructional And Other Materials 323,891 91,751 259,481 117,968 110,615 436,998 757,698 776,925
Maintenance and Repair 138,855 38,633 127,909 10,865 32,167 60,078 130,011 47,404
Transfers/Debt ‐ ‐ ‐ ‐ ‐ ‐ ‐ ‐
Contingency 571,153 309,577 390,335 357,332 150,000 212,366 154,130 22,171
Capital Outlay 353,665 51,114 217,075 2,231 69,301 155,733 27,099 333,895
Total 11,459,864$ 10,796,977$ 14,342,580$ 12,042,253$ 7,024,842$ 15,322,641$ 13,170,168$ 59,854,024$
HOUSTON COMMUNITY COLLEGEFY 2016‐17 Adjusted Budget by Divisions
6

as of September 30, 2016
HOUSTON COMMUNITY COLLEGEFY 2016‐17 Adjusted Budget by Divisions
Budgeted Expenditures CHANCELLOR FINANCE &
ADMIN. SUSTAINABILITY
INSTRUCTIONAL
SERVICES
STUDENT
SERVICES SYSTEM Grand Total
Salary 8,326,540$ 33,885,901$ 3,463,616$ 19,034,371$ 5,145,373$ 8,252,902$ 207,446,821$
Employee Benefits ‐ ‐ ‐ ‐ ‐ 22,116,875 22,116,875
Supplies & Gen 758,950 831,062 127,428 356,636 201,190 1,587,584 6,165,339
Travel 249,890 274,104 63,235 877,669 95,439 ‐ 2,342,857
Marketing Costs 438,417 224,739 5,000 3,000 ‐ ‐ 1,079,575
Rentals & Leases 66,473 272,246 61,273 12,319 5,400 ‐ 2,478,990
Insurance/Risk Mgmt 5,824,129 ‐ ‐ 1,582 ‐ ‐ 5,826,348
Contracted Services 3,271,738 14,669,484 81,654 129,723 1,093,812 2,826,053 23,760,003
Utilities ‐ 1,766,727 ‐ 94 ‐ 9,482,779 11,261,151
Other Departmental Expenses 479,390 326,839 97,198 538,867 133,458 ‐ 2,158,123
Instructional And Other Materials 89,918 6,178,963 40,680 843,070 361,668 ‐ 10,389,626
Maintenance and Repair 16,909 629,814 3,938 444 ‐ ‐ 1,237,027
Transfers/Debt 200,000 43,591 ‐ ‐ ‐ 33,640,999 33,884,590
Contingency 159,000 112,384 65,082 365,947 197,000 1,024,176 4,090,653
Capital Outlay 303,186 2,114,114 40,252 54,413 4,158 ‐ 3,726,236
Total 20,184,540$ 61,329,968$ 4,049,356$ 22,218,135$ 7,237,498$ 78,931,368$ 337,964,214$
7
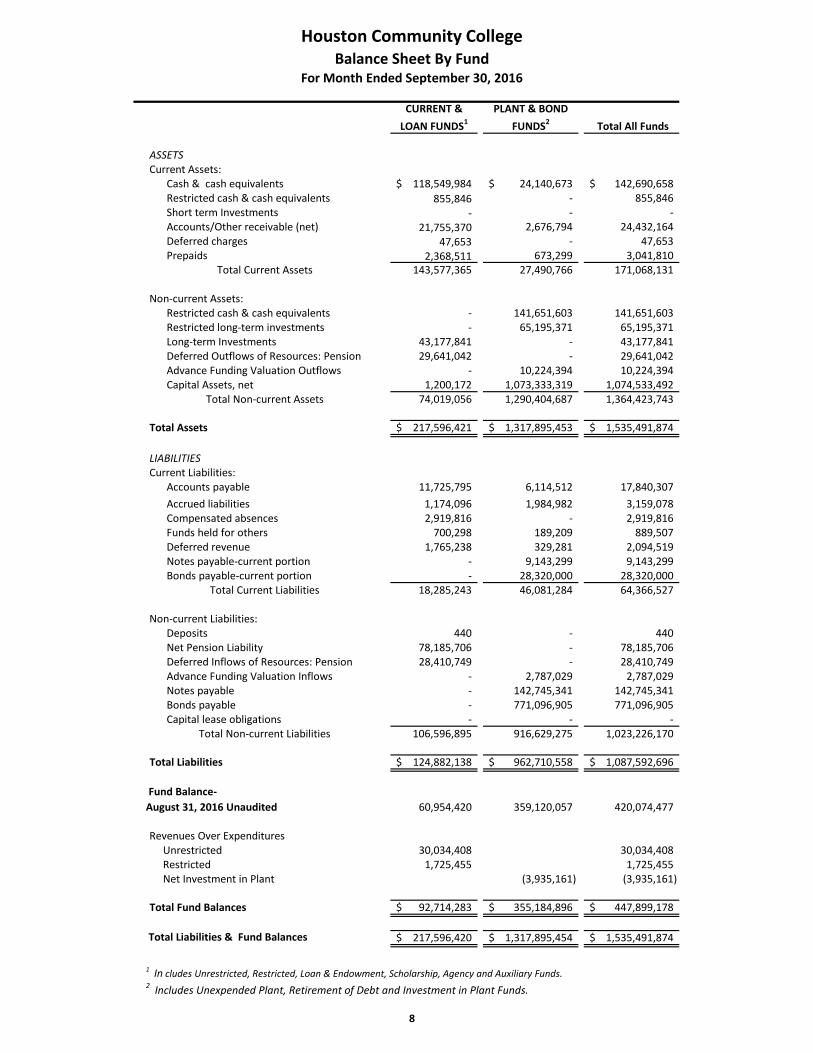
CURRENT &
LOAN FUNDS1PLANT & BOND
FUNDS2 Total All Funds
ASSETSCurrent Assets:
Cash & cash equivalents 118,549,984$ 24,140,673$ 142,690,658$ Restricted cash & cash equivalents 855,846 ‐ 855,846 Short term Investments ‐ ‐ ‐ Accounts/Other receivable (net) 21,755,370 2,676,794 24,432,164 Deferred charges 47,653 ‐ 47,653 Prepaids 2,368,511 673,299 3,041,810
Total Current Assets 143,577,365 27,490,766 171,068,131
Non‐current Assets:Restricted cash & cash equivalents ‐ 141,651,603 141,651,603 Restricted long‐term investments ‐ 65,195,371 65,195,371 Long‐term Investments 43,177,841 ‐ 43,177,841 Deferred Outflows of Resources: Pension 29,641,042 ‐ 29,641,042 Advance Funding Valuation Outflows ‐ 10,224,394 10,224,394 Capital Assets, net 1,200,172 1,073,333,319 1,074,533,492
Total Non‐current Assets 74,019,056 1,290,404,687 1,364,423,743
Total Assets 217,596,421$ 1,317,895,453$ 1,535,491,874$
LIABILITIESCurrent Liabilities:
Accounts payable 11,725,795 6,114,512 17,840,307
Accrued liabilities 1,174,096 1,984,982 3,159,078 Compensated absences 2,919,816 ‐ 2,919,816 Funds held for others 700,298 189,209 889,507 Deferred revenue 1,765,238 329,281 2,094,519 Notes payable‐current portion ‐ 9,143,299 9,143,299 Bonds payable‐current portion ‐ 28,320,000 28,320,000
Total Current Liabilities 18,285,243 46,081,284 64,366,527
Non‐current Liabilities:Deposits 440 ‐ 440 Net Pension Liability 78,185,706 ‐ 78,185,706 Deferred Inflows of Resources: Pension 28,410,749 ‐ 28,410,749 Advance Funding Valuation Inflows ‐ 2,787,029 2,787,029 Notes payable ‐ 142,745,341 142,745,341 Bonds payable ‐ 771,096,905 771,096,905 Capital lease obligations ‐ ‐ ‐
Total Non‐current Liabilities 106,596,895 916,629,275 1,023,226,170
Total Liabilities 124,882,138$ 962,710,558$ 1,087,592,696$
Fund Balance‐
August 31, 2016 Unaudited 60,954,420 359,120,057 420,074,477
Revenues Over Expenditures Unrestricted 30,034,408 30,034,408 Restricted 1,725,455 1,725,455 Net Investment in Plant (3,935,161) (3,935,161)
Total Fund Balances 92,714,283$ 355,184,896$ 447,899,178$
Total Liabilities & Fund Balances 217,596,420$ 1,317,895,454$ 1,535,491,874$
1 In cludes Unrestricted, Restricted, Loan & Endowment, Scholarship, Agency and Auxiliary Funds.2 Includes Unexpended Plant, Retirement of Debt and Investment in Plant Funds.
Houston Community CollegeBalance Sheet By Fund
For Month Ended September 30, 2016
8
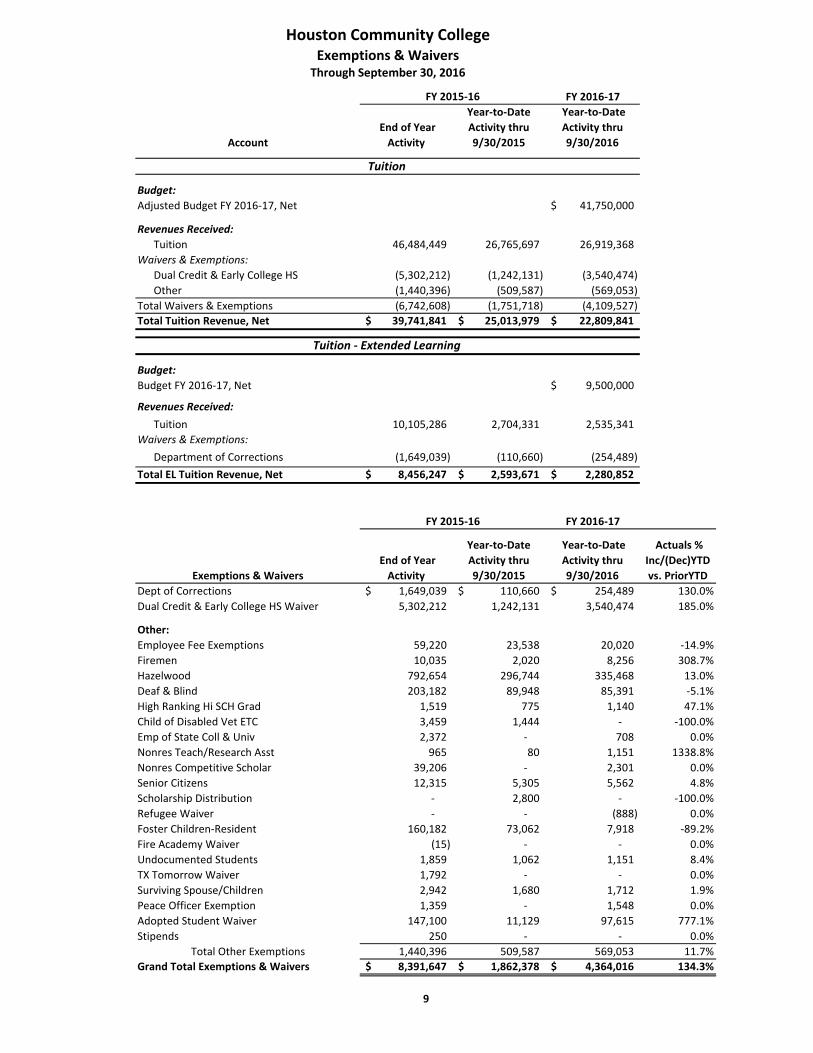
FY 2015‐16 FY 2016‐17
Budget:Adjusted Budget FY 2016‐17, Net 41,750,000$
Revenues Received:Tuition 46,484,449 26,765,697 26,919,368
Waivers & Exemptions:Dual Credit & Early College HS (5,302,212) (1,242,131) (3,540,474)
Other (1,440,396) (509,587) (569,053)
Total Waivers & Exemptions (6,742,608) (1,751,718) (4,109,527)
Total Tuition Revenue, Net 39,741,841$ 25,013,979$ 22,809,841$
Budget:Budget FY 2016‐17, Net 9,500,000$
Revenues Received:Tuition 10,105,286 2,704,331 2,535,341
Waivers & Exemptions:Department of Corrections (1,649,039) (110,660) (254,489)
Total EL Tuition Revenue, Net 8,456,247$ 2,593,671$ 2,280,852$
FY 2015‐16 FY 2016‐17
Dept of Corrections 1,649,039$ 110,660$ 254,489$ 130.0%
Dual Credit & Early College HS Waiver 5,302,212 1,242,131 3,540,474 185.0%
Other:
Employee Fee Exemptions 59,220 23,538 20,020 ‐14.9%
Firemen 10,035 2,020 8,256 308.7%
Hazelwood 792,654 296,744 335,468 13.0%
Deaf & Blind 203,182 89,948 85,391 ‐5.1%
High Ranking Hi SCH Grad 1,519 775 1,140 47.1%
Child of Disabled Vet ETC 3,459 1,444 ‐ ‐100.0%
Emp of State Coll & Univ 2,372 ‐ 708 0.0%
Nonres Teach/Research Asst 965 80 1,151 1338.8%
Nonres Competitive Scholar 39,206 ‐ 2,301 0.0%
Senior Citizens 12,315 5,305 5,562 4.8%
Scholarship Distribution ‐ 2,800 ‐ ‐100.0%
Refugee Waiver ‐ ‐ (888) 0.0%
Foster Children‐Resident 160,182 73,062 7,918 ‐89.2%
Fire Academy Waiver (15) ‐ ‐ 0.0%
Undocumented Students 1,859 1,062 1,151 8.4%
TX Tomorrow Waiver 1,792 ‐ ‐ 0.0%
Surviving Spouse/Children 2,942 1,680 1,712 1.9%
Peace Officer Exemption 1,359 ‐ 1,548 0.0%
Adopted Student Waiver 147,100 11,129 97,615 777.1%
Stipends 250 ‐ ‐ 0.0%
Total Other Exemptions 1,440,396 509,587 569,053 11.7%
Grand Total Exemptions & Waivers 8,391,647$ 1,862,378$ 4,364,016$ 134.3%
Year‐to‐Date
Activity thru
9/30/2016
Houston Community College
9
Actuals %
Inc/(Dec)YTD
vs. PriorYTD
Exemptions & WaiversThrough September 30, 2016
Account
End of Year
Activity
Year‐to‐Date
Activity thru
9/30/2015
Year‐to‐Date
Activity thru
9/30/2016
Tuition
Tuition ‐ Extended Learning
Exemptions & Waivers
End of Year
Activity
Year‐to‐Date
Activity thru
9/30/2015