condition assessments using pipe penetrating radar: the ... · penetrating radar gpr( ), a...
TRANSCRIPT
Condition Assessments using Pipe Penetrating Radar: the Metro Wastewater Reclamation District – Denver, CO
Harvard Gulch Interceptor Case Study Csaba Ékes, PhD, PGeo.1 and Jeff Maier, P.E.2 1SewerVUE Technology Corp., 4650A Dawson St., Burnaby, BC, Canada V5C 4C3; Tel: 1-888-973-9378, email: [email protected] 2Metro Wastewater Reclamation District, 6450 York Street, Denver, CO 80229, USA, Tel: 303-286- 3285, email: [email protected] ABSTRACT
Pipe Penetrating Radar (PPR) is the underground in-pipe application of ground penetrating radar (GPR), a non-destructive testing method that can detect defects and cavities within and outside mainline diameter (>18 in / 450mm) non-metallic (reinforced concrete, vitrified clay, PVC, HDPE, etc.) underground pipes. The key advantage of PPR is the unique ability to map pipe wall thickness and deterioration including voids outside the pipe, enabling accurate predictability of needed rehabilitation or the timing of replacement.
A case study was conducted to demonstrate the capabilities of the SewerVUE PPR pipe condition assessment technology for the Metro Wastewater Reclamation District (MWRD) in Denver, CO. This paper describes the in-pipe data collection at the Harvard Gulch Interceptor and subsequent analysis focusing on the results obtained from the PPR data. These include: exact measurement of pipe wall thickness, pipe wall corrosion, loss of rebar cover and mapping grout thickness around the pipe. An overview of MWRD’s advanced pipe condition assessment technology research, comparison of available technologies, and how these findings have helped improve asset management strategies is also discussed. With limited available funding and budget constraints becoming more prevalent, timing of rehabilitation and overall intelligent asset management is more critical than ever for municipalities Advanced pipe condition assessment technologies, including the SewerVUE PPR system, show promise as being cost-effective, non-destructive methods that are able to help better refine estimated remaining life of an interceptor, accurately determine overall severity of pipe degradation, as well as provide a basis for improved cost allocation and timing of rehabilitation efforts. INTRODUCTION
Underground pipe infrastructure including tunnels and culverts is deteriorating at an alarming rate (ASCE, 2009). The majority of the current underground pipe infrastructure was constructed over 50 years ago and is close to the end of its design life. In order to establish the extent of rehabilitation required or the timing of replacement, an internal inspection method is necessary. Although Closed Circuit
562Pipelines 2012: Innovations in Design, Construction, Operations, and Maintenance–—Doing More with Less © ASCE 2012

Television (CCTV) inspection methods are effective and widely available tools for identifying visible defects on the internal wall of pipelines, CCTV cannot see behind the pipe’s inner surface nor can quantitatively determine extent of corrosion. In order to overcome these limitations and provide engineers, utility owners and decision makers with a quantitative and predictive inspection and asset management tool, pipe penetrating radar (PPR), the in-pipe application of ground penetrating radar (GPR), has been developed. This technology allows the implementation of proactive preventative maintenance procedures for non-ferrous wastewater and water underground infrastructure. The combined application of PPR, CCTV and laser (LIDAR) provides the most complete and state of the art inspection technology to enable proactive asset management and allow utility owners to plan and schedule the inspection and rehabilitation of critical utilities prior to the occurrence of emergency scenarios (Koo and Ariaratnam, 2006). Over the past several years, the Metro Wastewater Reclamation District (MWRD) has been actively researching advanced pipe condition assessment technologies and performing field demonstrations of each system to assess actual capabilities and provide real-life comparisons of the various technologies. The goal of MWRD’s research efforts has been to identify non-destructive condition assessment technologies that are capable of providing more detailed information about the overall condition of interceptor pipelines than what can typically be determined from conventional CCTV-only and/or destructive coring condition assessment methods. With limited available funding and budget constraints becoming more prevalent, timing of rehabilitation and overall intelligent asset management is more critical than ever for utility owners. Advanced pipe condition assessment technologies, including the SewerVUE PPR system, show promise as being cost-effective, non-destructive methods that are able to help better refine estimated remaining life of a pipeline, accurately determine severity of pipe degradation, as well as provide a basis for improved cost allocation and timing of rehabilitation efforts. This paper summarizes the application and results of the PPR technology through a pilot project conducted for Metro Wastewater Reclamation District in Denver, Colorado. The project took place in October 2011 on MWRD’s Harvard Gulch Interceptor. PIPE PENETRATING RADAR FUNDAMENTALS Pipe Penetrating Radar (PPR) is the underground in-pipe application of ground penetrating radar. The PPR pulse travels through a pipe material as a function of its dielectric properties which are in turn a function of the materials’ chemical and physical composition. Some of this pulse will also be reflected and refracted by any sharp change in material properties, such as at the interface between pipe material and air or water. The greater the difference in the material properties, the greater the amount of energy is reflected back. These reflected waves are detected by a receiving antenna and recorded as a single trace (A-scan). This process is repeated continuously
563Pipelines 2012: Innovations in Design, Construction, Operations, and Maintenance–—Doing More with Less © ASCE 2012
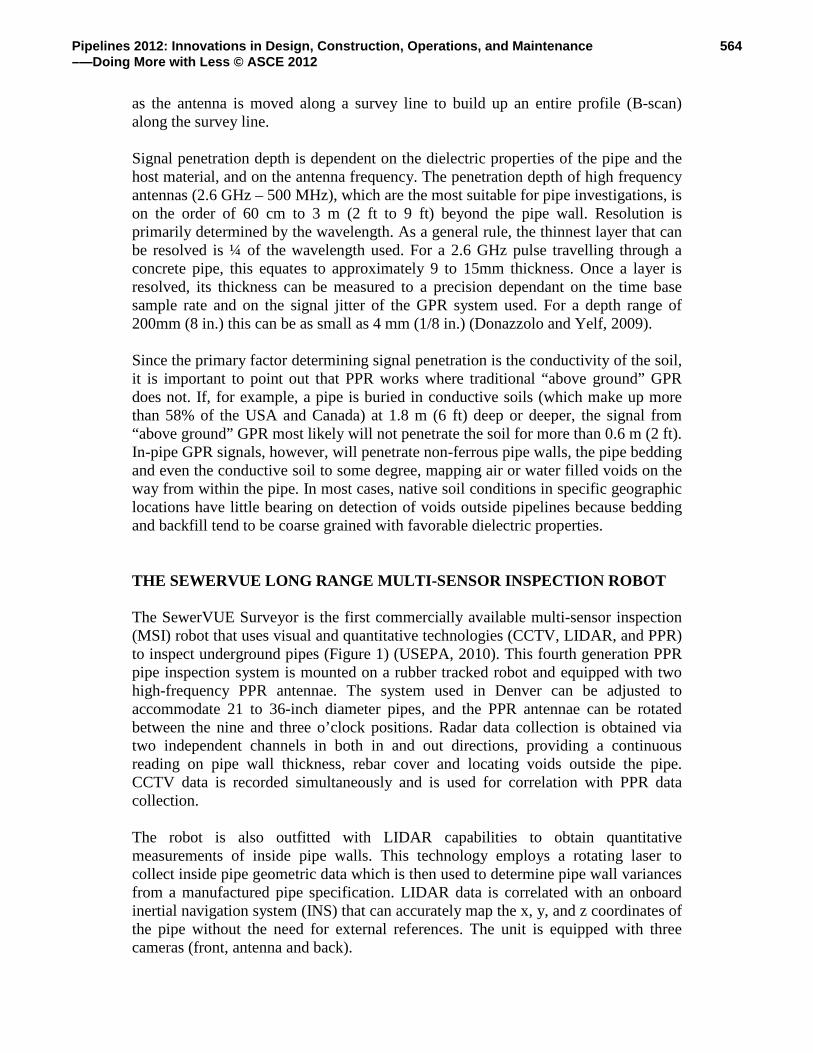
as the antenna is moved along a survey line to build up an entire profile (B-scan) along the survey line. Signal penetration depth is dependent on the dielectric properties of the pipe and the host material, and on the antenna frequency. The penetration depth of high frequency antennas (2.6 GHz – 500 MHz), which are the most suitable for pipe investigations, is on the order of 60 cm to 3 m (2 ft to 9 ft) beyond the pipe wall. Resolution is primarily determined by the wavelength. As a general rule, the thinnest layer that can be resolved is ¼ of the wavelength used. For a 2.6 GHz pulse travelling through a concrete pipe, this equates to approximately 9 to 15mm thickness. Once a layer is resolved, its thickness can be measured to a precision dependant on the time base sample rate and on the signal jitter of the GPR system used. For a depth range of 200mm (8 in.) this can be as small as 4 mm (1/8 in.) (Donazzolo and Yelf, 2009). Since the primary factor determining signal penetration is the conductivity of the soil, it is important to point out that PPR works where traditional “above ground” GPR does not. If, for example, a pipe is buried in conductive soils (which make up more than 58% of the USA and Canada) at 1.8 m (6 ft) deep or deeper, the signal from “above ground” GPR most likely will not penetrate the soil for more than 0.6 m (2 ft). In-pipe GPR signals, however, will penetrate non-ferrous pipe walls, the pipe bedding and even the conductive soil to some degree, mapping air or water filled voids on the way from within the pipe. In most cases, native soil conditions in specific geographic locations have little bearing on detection of voids outside pipelines because bedding and backfill tend to be coarse grained with favorable dielectric properties. THE SEWERVUE LONG RANGE MULTI-SENSOR INSPECTION ROBOT The SewerVUE Surveyor is the first commercially available multi-sensor inspection (MSI) robot that uses visual and quantitative technologies (CCTV, LIDAR, and PPR) to inspect underground pipes (Figure 1) (USEPA, 2010). This fourth generation PPR pipe inspection system is mounted on a rubber tracked robot and equipped with two high-frequency PPR antennae. The system used in Denver can be adjusted to accommodate 21 to 36-inch diameter pipes, and the PPR antennae can be rotated between the nine and three o’clock positions. Radar data collection is obtained via two independent channels in both in and out directions, providing a continuous reading on pipe wall thickness, rebar cover and locating voids outside the pipe. CCTV data is recorded simultaneously and is used for correlation with PPR data collection.
The robot is also outfitted with LIDAR capabilities to obtain quantitative measurements of inside pipe walls. This technology employs a rotating laser to collect inside pipe geometric data which is then used to determine pipe wall variances from a manufactured pipe specification. LIDAR data is correlated with an onboard inertial navigation system (INS) that can accurately map the x, y, and z coordinates of the pipe without the need for external references. The unit is equipped with three cameras (front, antenna and back).
564Pipelines 2012: Innovations in Design, Construction, Operations, and Maintenance–—Doing More with Less © ASCE 2012
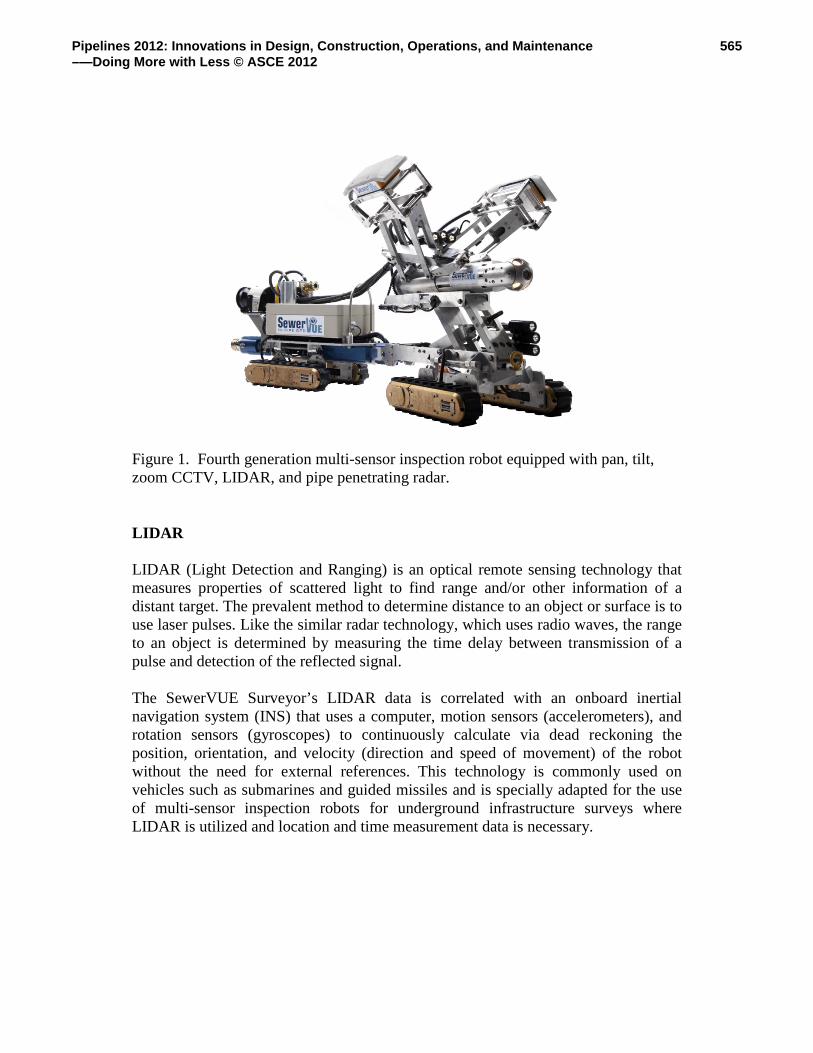
Figure 1. Fourth generation multi-sensor inspection robot equipped with pan, tilt, zoom CCTV, LIDAR, and pipe penetrating radar. LIDAR LIDAR (Light Detection and Ranging) is an optical remote sensing technology that measures properties of scattered light to find range and/or other information of a distant target. The prevalent method to determine distance to an object or surface is to use laser pulses. Like the similar radar technology, which uses radio waves, the range to an object is determined by measuring the time delay between transmission of a pulse and detection of the reflected signal. The SewerVUE Surveyor’s LIDAR data is correlated with an onboard inertial navigation system (INS) that uses a computer, motion sensors (accelerometers), and rotation sensors (gyroscopes) to continuously calculate via dead reckoning the position, orientation, and velocity (direction and speed of movement) of the robot without the need for external references. This technology is commonly used on vehicles such as submarines and guided missiles and is specially adapted for the use of multi-sensor inspection robots for underground infrastructure surveys where LIDAR is utilized and location and time measurement data is necessary.
565Pipelines 2012: Innovations in Design, Construction, Operations, and Maintenance–—Doing More with Less © ASCE 2012

MWRD’s HARVARD GULCH INTERCEPTOR, DENVER, CO - BACKGROUND The Harvard Gulch Interceptor (Figure 2), a sewer interceptor pipeline owned and operated by the Metro Wastewater Reclamation District (MWRD) in Denver, CO was originally constructed in the early 1950's by the City and County of Denver. Because of rapid growth in the Metro Denver area and problems with the original vitrified clay pipe joints, approximately 80 percent of the interceptor was replaced in the late 1970's with larger diameter reinforced concrete pipe. Several years after this pipe replacement, the interceptor ownership was transferred to MWRD, the wholesale provider of wastewater transmission and treatment for the Denver metropolitan area. The interceptor ranges in size from 8 to 48 inches, consisting mostly of reinforced concrete pipe (RCP) with the remainder consisting of original vitrified clay pipe (VCP). The main problems on the Harvard Gulch interceptor include significant levels of corrosion in the concrete pipe segments, cracking issues, as well as faulty joints and root penetration problems. A portion of the interceptor was recently rehabilitated in 2008 with CIPP lining. Future rehabilitation efforts using CIPP or sliplining are planned on this interceptor in the next 10-15 years, with timing based on corrosion severity and budgeting for this rehabilitation work being the primary challenges.
Figure 2. Aerial photo showing the inspected section (green) of the Harvard Gulch Interceptor. Yellow and red colors indicate areas of concern.
566Pipelines 2012: Innovations in Design, Construction, Operations, and Maintenance–—Doing More with Less © ASCE 2012
PPR AND LIDAR INSPECTION AND RESULTS
This project’s PPR survey was completed using 1.6 and 2.3 GHz frequency antennas (Figure 3). 2D line data was collected on the springline and along the obvert of the pipe. The PPR lines were located along the 9:00, 10:30, 12:00, 1:00 and 3:00 o’clock positions inside the pipe.
Figure 3. Metro Wastewater O & M personnel readying the SewerVUE Surveyor robot for deployment at Harvard Gulch Interceptor, Denver, CO.
The 2.6 GHz PPR data were of excellent quality. Signal penetration allowed analysis to a depth of 16 to 27 inches from the inside pipe wall surface. The objective of PPR data display is to present the processed data that closely approximates an image of the pipe and its bedding material with anomalies that are associated with the objects of interest in their proper spatial positions. The most commonly used data displays are the two dimensional cross sections or the two dimensional depth slice. SewerVUE’s integrated pipe penetrating radar data display (IPPRDD) is the most comprehensive and is used in this report. These interpreted PPR depth sections are illustrated in Figure 4. PPR results are displayed with the interpretation superimposed on the actual depth profiles. The top lines typically show the individual PPR profiles with the corresponding clock position and antenna frequency denoted with an icon to the left of the corresponding profile. The horizontal scales are in feet, while the vertical scales are in inches. The location of the scan lines are marked on the foldout view of the pipe at the bottom of each pipe segment with the corresponding clock positions on
567Pipelines 2012: Innovations in Design, Construction, Operations, and Maintenance–—Doing More with Less © ASCE 2012

the vertical axis. Anomalies and other notable features are color coded. Pipe wall thickness is marked by a continuous black line, reinforcement is marked by red dots which are then connected by a red line. Vertical exaggeration is used to better illustrate variations in pipe wall thickness measurements. The PPR data have been corrected to an assumed continuous outside pipe wall dimension as these manufacturing tolerances are generally tighter to ensure proper seating in gasketed pipe joints in order to reflect changes in inner pipe wall diameter.
Figure 4. PPR results with corresponding CCTV foldout view. Color coded pipe condition marker helps to easily identify areas of concern.
The PPR data show variations in pipe wall thickness, as well as location, depth and spacing of rebar. Pipe wall thickness appears to be uniform with no significant pipe wall loss. The remaining pipe-wall thickness is between 2.5 - 3.3“ with an average of 3.0”. The measured minimum pipe wall thickness is 2.5” between MH-HG 89 and MH-HG 88 (at 195.2 ft and 11:30 o’clock). Rebar cover, while showing variations along the surveyed clock positions appears to be in the 0.25” and 3.2” range. Notable exceptions where rebar cover appears to be less than 0.73” are shown in Figure 5. This loss of rebar cover, however, appears to be mostly due to the pipe manufacturing process and not the result of pipe wall loss.
568Pipelines 2012: Innovations in Design, Construction, Operations, and Maintenance–—Doing More with Less © ASCE 2012

100 200 300 400 500
0
1
2
3
In-pipe position [feet]
reba
r cov
er [i
nche
s]
Figure 5. Combined rebar cover diagram created from two parallel PPR sections. Vertical lines represent the minimum and maximum rebar cover. Yellow and red horizontal lines show the 0.73” and 0.53” rebar cover respectively. The PPR data show the presence of a casing and grouting between the casing and the sewer pipe between MH HG92 and HG93. The grout appears to be uniform with a 0.75 -1” thickness (Figure 6).
Figure 6. PPR results with corresponding CCTV and LIDAR foldout views. Grout is shown in lighter green.
In order to facilitate the quick review of the PPR data, a simple color code was developed. A color coded line runs under each interpreted pipe section. Green color indicates acceptable pipe conditions, yellow indicates potential problem areas, while red marks areas where immediate attention is recommended. The interpreted PPR anomalies are summarized on the pipe location map (Figure 2). No significant voids were detected along the inspected line. Hence the yellow and red
569Pipelines 2012: Innovations in Design, Construction, Operations, and Maintenance–—Doing More with Less © ASCE 2012

sections indicate areas where rebar cover is less than that recommended by ASTM C 76M-08.
Figure 7. SewerVUE Surveyor robot operating at Harvard Gulch, Denver, CO. LIDAR results are provided as foldout views together with the foldout views of the CCTV and the interpreted PPR profiles (Figure 6). LIDAR results are color coded: white marks no corrosion, while yellow and red colors mark increasing amounts of corrosion. Both the foldout view and the cross-sections show significant pipe wall erosion around the current flow level, at the 7:30 and 4:30 clock positions (Figure 6 and 9). LIDAR data can also be visualized by projecting the color coded pipe wall loss to the original pipe surface as 3D images (Figure 8).
Figure 8. 3D visualization of LIDAR results. Color coded pipe-wall loss (A) and CCTV foldout view (B) are projected to the scanned inner surface.
A B
570Pipelines 2012: Innovations in Design, Construction, Operations, and Maintenance–—Doing More with Less © ASCE 2012

0
00
10
10
20
20-20
-20
-10
-10
1
2
3
[inch
es]
pipe
wal
l los
s [in
ches
]
[inches]
Figure 9. Summarized inner pipe-wall geometry based on LIDAR data. Black line: original 27 inch diameter. Pipe erosion is most pronounced at the current flow level at 7:30 and 4:30 clock positions. MWRD’s ADVANCED PIPE CONDITION ASSESSMENT TECHNOLOGY COMPARISON FINDINGS The Metro Wastewater Reclamation District’s Interceptor Inspection Data Assessment Program was originally initiated in 2003 to inspect sewer mains throughout the MWRD Interceptor System using closed circuit television video (CCTV). The purpose of this ongoing assessment project was to help refine the extent of the rehabilitation requirements, determine the timing of these activities, and estimate the cost of the expenditures. The CCTV video footage was reviewed in-house by the MWRD Engineering Department staff and divided into five categories (Good through Very Poor) based on pipe condition. These ratings provide a general sense of which pipes need rehabilitation and to what degree, but do not quantitatively address specific corrosion problems typically associated with concrete pipes (RCP and CP). In order to determine the severity and extent of the concrete corrosion damage, core drill samples from several points along an affected interceptor constructed with concrete pipe were taken. This portion of the study project was completed by pipeline/ concrete contractors who performed the core drilling in two separate phases. A comprehensive analysis of each core obtained was performed to determine the extent of corrosion, the condition of reinforcement steel (if any), and help predict
571Pipelines 2012: Innovations in Design, Construction, Operations, and Maintenance–—Doing More with Less © ASCE 2012

remaining life of the pipe in question. Once the cores were removed from the pipe, patching was completed. In November 2006, a small project appropriation was allocated to provide funding for these coring efforts and investigate other condition assessment alternatives. In 2007, the coring program construction (phase 1) was initiated to provide additional information regarding each interceptor’s condition. In the fall of 2007, eleven cores were taken from carefully selected concrete interceptor segments to validate the MWRD Engineering Department’s CCTV ratings and provide additional definitive information about the severity and extent of the corrosion within these interceptors. Because of the expense, difficulty, and impact of open excavation merely for information gathering purposes, evaluation of emerging advanced non-destructive pipe condition assessment technologies became an evolving priority of the coring program. These technologies, if proven viable, would take the place of future coring efforts by providing a non-destructive, composite, more complete, computer generated analysis of the pipe segments in question through multiple sensor systems including laser profiling, sonar, pipe penetrating radar, and high definition CCTV. The goal of the analysis was to determine if new non-destructive condition assessment technologies could be used throughout the District’s transmission system instead of relying on destructive concrete pipe coring to provide supplemental information and validation of the MWRD Engineering Department’s CCTV condition ratings. In 2009, after significant research, the Metro District was approached by Redzone Robotics Inc. about performing a demonstration of their new non-destructive multi-sensor sonar, HD CCTV, and laser profiling technology, to demonstrate how the new technology could assist in condition assessments of reinforced concrete pipe (RCP) located throughout the wastewater interceptor system. A demonstration was initiated in live flow conditions to investigate the use of the RedZone Responder technology on the Sand Creek Parallel Interceptor segments SCP 22 to SCP 19 (54” diameter RCP), segments that were already determined to be in “poor” condition and that had recently been cored. This would provide MWRD’s first direct comparison in the accuracy of information obtained by destructive coring methods versus non-destructive advanced pipe condition assessment technology. The results were very positive with high levels of accuracy achieved when comparing the assessment results to the physical core samples taken from the Sand Creek Parallel Interceptor. As research continued, and other advanced pipe condition assessment technologies were identified and/or entered the marketplace, MWRD determined it would be beneficial to obtain additional concrete cores to accurately cross-reference other to-be-demonstrated emerging pipe condition assessment technologies with real-world data from a concrete core. Having more than one comparable technology capable of providing advanced pipe condition assessment information is very important for municipalities, due to the low-bid procurement restrictions required for most contacts and services.
572Pipelines 2012: Innovations in Design, Construction, Operations, and Maintenance–—Doing More with Less © ASCE 2012

In its entirety, the Metro District performed eighteen concrete cores, eleven concrete cores in 2007 and seven concrete cores in early 2011. The concrete cores were taken along the top portion of the pipe, typically where biogenic sulfide corrosion attack is most prevalent in unlined concrete wastewater pipes. The core locations were selected according to previous CCTV visual inspection, in areas that were in suspect condition, were not very deep, and provided adequate access for excavation activities. Once coring took place, the concrete pipe was then subsequently patched with a MWRD-approved rehabilitation patching product. All the cores were then evaluated by MWRD Engineering staff to ascertain the properties of the pipe wall, examine corrosion patterns, as well as to determine the remaining pipe wall thickness of the reinforced concrete pipe. In spring 2011, a demonstration was performed by a second non-destructive advanced pipe condition assessment technology firm, Hydromax USA, using the Cleanflow Fly-Eye HD Profiler System. The Cleanflow unit, similar to the Redzone Responder, features a multi-sensor laser and sonar profiling system that uses strictly a float deployment method, while the RedZone Responder utilizes either a float or tread-mounted platform depending on flow conditions. The demonstration occurred in live flow conditions on the Sand Creek Parallel, in segments SCP 22 to SCP 19, the same segments in which the RedZone Responder system was demonstrated, allowing for direct comparison of the two technologies and correlation of results. Since the demonstration, RedZone acquired the Cleanflow HD Profiler technology and has incorporated it into its product services line up. Again, positive results were obtained from the Cleanflow demonstration and accurate correlations of assessment information were made to the concrete core samples. Later in 2011, a non-destructive pipe penetrating radar evaluation was performed by SewerVUE Technology Corp. For this third system, the demonstration occurred on the Harvard Gulch Interceptor in segments HG 87 to HG 94 (27” diameter RCP). The demonstration was performed on these segments for the following reasons: the SewerVUE PPR equipment currently available only has the capability to test up to 36” diameter lines, and MWRD had previously taken core samples from these segments in 2007 to provide evaluation correlation. Again, positive results were obtained and the SewerVUE system accuracy was proven to be excellent throughout the demonstration. The SewerVUE PPR technology demonstration was especially interesting to MWRD because it not only provides the laser profiling of the other systems, but it also includes the pipe penetrating radar component and ability to “see” into the pipe wall. In comparing results obtained from other evaluations, PPR has demonstrated early successes as a standalone pipe inspection system operated both in manned entry and remote robotic mode (Parkinson and Ékes, 2008 and Ékes et al., 2011). The three advanced pipe condition assessment technologies demonstrated as part of the MWRD Interceptor Inspection Data Assessment Program were the RedZone Responder system, the HydroMAX Clean Flow Fly-Eye HD Profiler system, and the SewerVUE In-Pipe GPR system, all with very positive results that successfully demonstrated the accuracy of these advanced systems.
573Pipelines 2012: Innovations in Design, Construction, Operations, and Maintenance–—Doing More with Less © ASCE 2012

The integration of advanced pipe condition assessment technology into the MWRD pipeline condition assessment program will provide detailed supplemental inspection information in critical pipe segments where condition ratings are difficult to determine or where it is suspected that corrosion has significantly deteriorated the structural integrity, and consequently shortened the lifespan of these pipe segments. It is expected that advanced pipe condition assessment technologies will eventually be utilized on approximately 10-20% of pipe in the MWRD Interceptor System.
SUMMARY AND CONCLUSIONS A case study was conducted in October 2011 to demonstrate the capabilities of the SewerVUE PPR pipe condition assessment technology for the Metro Wastewater Reclamation District (MWRD) in Denver, CO. PPR is the underground in-pipe application of GPR, a non-destructive testing method that can detect defects and cavities within and outside mainline diameter (>18 in / 450mm) non-metallic (reinforced concrete, vitrified clay, PVC, HDPE, etc.) underground pipes. The field demonstration of the SewerVUE PPR system took place on MWRD’s Harvard Gulch Interceptor, a pipeline consisting mostly of reinforced concrete pipe that has a history of significant corrosion problems, cracking issues, and faulty joints. The key advantage of PPR is the unique ability to map pipe wall thickness and deterioration including voids outside the pipe, enabling accurate predictability of needed rehabilitation or the timing of replacement. 880 ft of PPR data were collected with the multisensory SewerVUE Surveyor inspection robot in this demonstration project. Pipe wall thickness of the inspected 27” diameter section of the Harvard Gulch Interceptor appears to be uniform with no significant pipe wall loss. The remaining pipe-wall thickness is between 2.5 - 3.3“ with an average of 3.0”. This matches accurately the core samples taken earlier by MWRD staff. The measured minimum pipe wall thickness is 2.5” between MH-HG 89 and MH-HG 88 at 195.2 ft and 11:30 o’clock). Rebar cover appears to be in the 0.25” and 3.2” range. Exceptions, where rebar cover is less than 0.53” appear to be mostly due to the pipe manufacturing process and not the result of pipe wall loss. LIDAR results show significant pipe wall erosion at the flow level.
With limited available funding and budget constraints becoming more prevalent, timing of rehabilitation and overall intelligent asset management is more critical than ever for municipalities Advanced pipe condition assessment technologies, including the SewerVUE PPR system, have demonstrated to be cost-effective, non-destructive methods that are able to help better refine estimated remaining life of an interceptor, accurately determine overall severity of pipe degradation, as well as provide a basis for improved cost allocation and timing of rehabilitation efforts.
The Metro Wastewater Reclamation District’s pioneering Interceptor Inspection Data Assessment Program concluded that advanced pipe condition assessment
574Pipelines 2012: Innovations in Design, Construction, Operations, and Maintenance–—Doing More with Less © ASCE 2012
technologies such as the RedZone Responder system, the HydroMAX Clean Flow Fly-Eye HD Profiler system, and the SewerVUE In-Pipe GPR system, all provide very positive results that demonstrated the accuracy of these advanced systems. The integration of advanced pipe condition assessment technology into the MWRD pipeline condition assessment program will provide detailed supplemental inspection information in critical pipe segments where condition ratings are difficult to determine or where it is suspected that corrosion has significantly deteriorated the structural integrity, and consequently shortened the lifespan of these pipe segments. It is expected that advanced pipe condition assessment technologies will eventually be utilized on approximately 10-20% of pipe in the MWRD Interceptor System. REFERENCES American Society of Civil Engineers (ASCE), (2009). 2009 Report Card for America’s Infrastructure. ASCE: Washington, DC. Donazzolo, V., and Yelf, R. (2009). Determination of Wall Thickness and Condition of Asbestos Cement Pipes in Sewer Rising Mains using Surface Penetrating Radar, Proceedings of the Fourteenth International Conference on Ground Penetrating Radar, (IEEE, Lecce, 2010) 234-238. Ékes, C., Neducza, B., and Henrich, R. G. (2011). GPR Goes Underground: Pipe Penetrating Radar, Proceedings of North American Society for Trenchless Technology (NASTT), No Dig Show 2011, Washington, D.C., Mar 27-31, 2011. Koo, D. H., and Ariaratnam, S.T. (2006). Innovative Method for Assessment of Underground Sewer Pipe Condition. Automation in Construction.15 (4): 479-488. Parkinson, G., and Ékes, C. (2008). Ground Penetrating Radar Evaluation of Concrete Tunnel Linings, Proceedings of 12th International Conference on Ground Penetrating Radar, Birmingham, UK June 16-19, 2008. USEPA. (2010). Report on Condition Assessment Technology of Wastewater Collection Systems, Document EPA/600/R-10/101, www.epa.gov/nrmrl, National Risk Management Research Laboratory (NRMRL) August 2010.
575Pipelines 2012: Innovations in Design, Construction, Operations, and Maintenance–—Doing More with Less © ASCE 2012