condition monitoring of motor-operated valves in - gipsa-lab
TRANSCRIPT

Condition monitoring of motor-operated valves in nuclear power plants
Pierre Granjon Gipsa-lab / Grenoble University
Grenoble, France 33 4 76 82 71 32
Abstract This article deals with a new motor-operated valves (MOVs) condition monitoring method. MOVs mainly consist of an induction machine driving a valve through a mechanical actuator. Such systems need important maintenance policies since they are critical concerning the operational readiness of the safety related systems of nuclear power plants. Unfortunately, today’s policies present a major drawback. Indeed, these monitoring techniques rely on the measurement of an internal mechanical quantity and require the presence of human operators in dangerous power plants areas. The aim of this research work is to develop a monitoring method relying exclusively on remote electrical measurements (MOV supply voltages and currents), without the need of any internal MOV quantity. In this article, the instantaneous active power absorbed by the induction machine is first shown to be an interesting electrical quantity to elaborate mechanical failure indicators. An efficient real-time algorithm developed to estimate this physical quantity is then detailed and mechanical failure indicators based on the estimated electrical power are proposed. Finally, their performance is illustrated through experimental data. 1. Introduction Nuclear power provides about 14% of the world’s electricity, with the United States of America, France and Japan together accounting for about 50% of nuclear generated electricity (1). This important production is realized through complex systems subject to drastic safety constraints: nuclear power plants. Key components of such systems are motor-operated valves (MOVs), whose condition has to be continuously monitored in order to ensure power plants security, safety and performance requirements. Nowadays, condition monitoring of MOVs is usually based on the joint analysis of electrical supply and internal mechanical quantities. Unfortunately, these methods require access to the valve and increases radiation exposure of operators, leading to long overhaul outage and high maintenance costs. A possible solution is to realise MOVs condition monitoring by using supply voltages and currents only, without any mechanical measurements. Indeed, electrical quantities are accessible outside radioactively contaminated areas and allow remote and nonintrusive MOV testing. However, necessary mechanical information initially given by mechanical measurements has now to be extracted from MOVs electrical quantities. One possibility is to use the instantaneous fundamental positive-sequence active power delivered to the MOV. Indeed, this electrical quantity is closely related to the instantaneous mechanical power

2
produced by the induction motor of the MOV, and is therefore an image of internal MOVs mechanical phenomena. This paper describes a new MOVs condition monitoring method based exclusively on the analysis of the fundamental positive-sequence active power absorbed by these systems. Section 2 justifies this approach through a general description of MOVs and of their usual monitoring techniques. The real-time active power estimation algorithm developed for this specific application is described in section 3, followed by experimental results in section 4 and some concluding remarks in section 5. 2. Motor-operated valves condition monitoring and problem statement 2.1 Motor-operated valves description The purpose of motor-operated valves (MOVs) encountered in all nuclear power plants is to control the flow of fluids in the whole plant fluid system. Their typical constitution is illustrated in Fig. 1, and consists of three main parts:
- The first element is a three-phase induction machine that drives the system for opening or closing, depending on its rotation direction. - The second part is a mechanical actuator whose input is the shaft driven by the induction machine, and whose output is the valve stem. Its purpose is to transform the output torque of the induction machine into a vertical translation force applied to the valve stem, the stem thrust. Indeed, the electrical motor drives a worm gear through a worm fixed on the machine shaft. The stem nut, driven by the worm gear, then raises or lowers the valve stem depending on its rotation direction. - The third and last part of the MOV is a valve which is closed when the valve stem is lowered and opened in the opposite case.
Figure 1. Schematic representation of a motor-operated valve
The time evolution of some MOV’s physical quantities can help to understand the different physical phenomena occurring in such a system. Fig. 2 shows the waveforms of the stem thrust and the electrical apparent power absorbed by the induction machine during opening and closing strokes.

3
2.a. opening stroke
2.b. closing stroke
Figure 2. Time waveforms of MOV stem thrust and electrical apparent power At the beginning of the opening stroke, the stem valve is under pressure in order to maintain the valve correctly closed, the measured thrust is then strongly negative. Next, the electrical power transient induced by the induction machine starting is clearly visible around t = 2 s. Then, the motor drives the mechanical actuator, cancels the pressure in the stem valve (the stem thrust tends to 0 kN just before t = 3 s) and unseats the valve (positive transient on stem thrust just after t = 3 s). Afterwards, the valve stem rises up with a constant speed and the whole MOV is in steady-state operation. The stem thrust and the electrical apparent power are approximately constant during this long period of time. Just after t = 18 s, the valve stem reaches its maximal height in the MOV and a sensor stops the induction machine and the opening stroke ends. The closing stroke contains similar events. Indeed, the electrical power transient generated by the motor starting occurs just after t = 1 s and is followed by the long steady-state behaviour when the stem lowers at constant speed. The valve finally seats around t = 17 s, and the valve stem is put under pressure (the stem thrust becomes strongly negative) in order to correctly close the valve. This last event necessitates an important motor torque, and implies an increase of the electrical power visible on the corresponding curve. The closing stroke is finally stopped by a torque switch mounted on the motor shaft. The previous description of MOVs brings to light two types of behaviour for these systems:
- short dynamic behaviours at the beginning and at the end of strokes (motor starting, actuator locking/unlocking, valve seating/unseating), - long steady-state behaviours in the middle of strokes (stem rising and lowering). The above information will be useful to understand MOVs condition monitoring techniques described in the following paragraph.
2.2 Classical monitoring methods Most of usual MOVs condition monitoring methods need at the same time stem thrust and electrical supply quantities measurements in order to elaborate mechanical fault indicators (2)(3). Unfortunately, stem thrust measurement requires access to the valve for installation of mechanical transducers. Therefore, these ‘at-the-valve testing methods’ lead to strong human problems (because of operators radiation exposure) and strong economic problems (because of maintenance outage and costs). Other existing methods only use electrical supply quantities to elaborate mechanical fault indicators (4)(5)(6), but they rely on an
4
electrical model of the induction machine present in the MOV. Consequently, such ‘model-based methods’ lead to problems in terms of model validity, model identification and model update usually connected to such approaches. Moreover, all these methods are based on measurements acquired during dynamic behaviours of the MOVs because their mechanical parts are then strongly excited. The previous paragraph has shown that such dynamic behaviour events have very short duration, which most often leads to fault indicators with strong variability. Finally, these drawbacks limit the performance of the MOVs condition monitoring methods usually employed in nuclear power plants. 2.3 Principle of the proposed method In order to avoid the problems of the previously described classical methods, the method proposed in this article has the following principles. First, fault indicators are calculated by using exclusively electrical supply voltages and currents of the MOV. This approach avoids any at-the-valve measurement and allows remote testing since such quantities are accessible outside radioactively contaminated areas. Second, mechanical fault indicators are obtained through the analysis of the instantaneous fundamental positive-sequence active power absorbed by the induction machine contained by the MOV. Indeed, the usage of this particular electrical quantity presents numerous advantages:
- Apart from losses, it is equal to the mechanical power produced at the induction machine output (7). Therefore, this electrical quantity is closely related to internal mechanical phenomena occurring in the MOV. - It is estimated by using the three voltages and currents of the induction machine, and therefore realizes some kind of data fusion of the whole information contained in this three-phase system. - Its estimator is based on a physical definition and not on any induction machine model contrary to classical methods.
Last, measurement and analysis of electrical supply quantities are done during steady-state operations of the MOV. As shown in paragraph 2.1, such behaviours have long duration (for example more than 10 s on Fig. 2) and lead to fault indicators with small variability. Moreover, the measured physical quantities are stationary during these operations, and classical signal processing tools such as spectral analysis can be used without any restriction. Therefore, the proposed method consists of two main steps:
- the real-time estimation of the instantaneous fundamental positive-sequence active power absorbed by the MOV, - the analysis of this instantaneous electrical quantity in order to propose efficient mechanical fault indicators.
These two points are further detailed in the following two sections. 3. Active power estimation algorithm This section is dedicated to the real-time estimation algorithm of the instantaneous fundamental positive-sequence active power in three-phase systems. The first paragraph deals with the physical definition of this quantity, and the second paragraph describes the proposed algorithm.

5
3.1 Power definition A general expression for a three-phase voltage system is:
€
va t( )vb t( )vc t( )
⎡
⎣
⎢ ⎢ ⎢
⎤
⎦
⎥ ⎥ ⎥
=
Va cos 2πf1t +ϕa( ) + ˜ v a t( )Vb cos 2πf1t +ϕb( ) + ˜ v b t( )Vc cos 2πf1t +ϕc( ) + ˜ v c t( )
⎡
⎣
⎢ ⎢ ⎢
⎤
⎦
⎥ ⎥ ⎥ , ( 1 )
where
€
f1 is the fundamental frequency and
€
˜ v t( ) are voltage components with frequency different from
€
f1. Such a system is completely characterized at the fundamental frequency
€
f1 by the following vector containing three complex phasors:
€
Va
Vb
Vc
⎡
⎣
⎢ ⎢ ⎢
⎤
⎦
⎥ ⎥ ⎥
=
Vaejϕ a
Vbejϕ b
Vcejϕ c
⎡
⎣
⎢ ⎢ ⎢
⎤
⎦
⎥ ⎥ ⎥ . ( 2 )
Since Fortescue (8), it is known that such a system is equivalent to its ‘symmetrical components’:
€
V+
V−
V0
⎡
⎣
⎢ ⎢ ⎢
⎤
⎦
⎥ ⎥ ⎥
=
13Va + aVb + a2Vc( )
13Va + a2Vb + aVc( )13Va +Vb +Vc( )
⎡
⎣
⎢ ⎢ ⎢ ⎢ ⎢
⎤
⎦
⎥ ⎥ ⎥ ⎥ ⎥
=13
1 a a2
1 a2 a1 1 1
⎡
⎣
⎢ ⎢ ⎢
⎤
⎦
⎥ ⎥ ⎥
Va
Vb
Vc
⎡
⎣
⎢ ⎢ ⎢
⎤
⎦
⎥ ⎥ ⎥ , ( 3 )
where
€
a = ej2π3 is a complex number, and
€
V+ ,
€
V− and
€
V0 refer respectively to fundamental positive-, negative- and zero-sequence components. This transform is commonly used to analyse three-phase quantities in power networks because it allows simple and intuitive physical interpretations. Indeed, the positive-sequence component represents for example the amount of voltage contributing to the power flow from generators to loads (9). Another useful interpretation is that the torque produced by an induction motor is determined by the positive-sequence component of its supply voltages (9). The three-phase voltage system given by Eq. ( 1 ) is now supposed to feed a three-phase induction machine. Such a load absorbs a three-phase current system and transforms electrical input power into mechanical output power. Several electrical powers have been defined for three-phase systems (10), but the fundamental positive-sequence active power plays a very important role. Indeed, it is known (11) that this power is the only one converted into mechanical power by a three-phase motor. It is definition, given thanks to symmetrical components of three-phase voltage and current systems, is the following one:
€
P+ =32Re V+ I+
*{ } =32V+I+ cos θ+( ), ( 4 )

6
where
€
Re{ } is the real part and
€
* the complex conjugate. In this definition,
€
V+ and
€
I+ refer respectively to the positive-sequence components of voltage and current systems, and
€
θ+ is the phase difference between them or equivalently the phase angle of the complex number
€
V+ I+*.
This electrical power being closely related to the mechanical power produced by the induction machine of the MOV, its instantaneous value
€
P+ t( ) can be seen as the image of the internal mechanical phenomena generated at each time in this system. This instantaneous electrical quantity is clearly interesting to monitor mechanical phenomena and create efficient mechanical fault indicators. 3.2 Power estimation algorithm An elegant way to obtain a real-time estimation of
€
P+ t( ) is through the instantaneous symmetrical components (12)(13). They are obtained thanks to a transformation similar to Eq. ( 3 ), but directly applied to time-domain waveforms instead of the fundamental phasors. For example, the instantaneous symmetrical components of the previous three-phase voltage system are given by:
€
v+ t( )v− t( )v0 t( )
⎡
⎣
⎢ ⎢ ⎢
⎤
⎦
⎥ ⎥ ⎥
=
23va t( ) + avb t( ) + a2vc t( )( )
23va t( ) + a2vb t( ) + avc t( )( )23va t( ) + vb t( ) + vc t( )( )
⎡
⎣
⎢ ⎢ ⎢ ⎢ ⎢
⎤
⎦
⎥ ⎥ ⎥ ⎥ ⎥
=23
1 a a2
1 a2 a1 1 1
⎡
⎣
⎢ ⎢ ⎢
⎤
⎦
⎥ ⎥ ⎥
va t( )vb t( )vc t( )
⎡
⎣
⎢ ⎢ ⎢
⎤
⎦
⎥ ⎥ ⎥ . ( 5 )
By analogy with the symmetrical components defined in Eq. ( 3 ),
€
v+ t( )
€
v− t( ) and
€
v0 t( ) refer respectively to instantaneous positive-, negative- and zero-sequence components. This transform thus leads to three time-domain signals among which
€
v+ t( ) and
€
v− t( ) are complex-valued, and
€
v0 t( ) is real-valued. The nature of such signals can be understood thanks to their frequency contents. Indeed, under the assumption that all Fourier transforms exist, the Fourier transform of Eq. ( 5 ) leads to:
€
V+ f( )V− f( )V0 f( )
⎡
⎣
⎢ ⎢ ⎢
⎤
⎦
⎥ ⎥ ⎥
=
23Va f( ) + aVb f( ) + a2Vc f( )( )
23Va f( ) + a2Vb f( ) + aVc f( )( )23Va f( ) +Vb f( ) +Vc f( )( )
⎡
⎣
⎢ ⎢ ⎢ ⎢ ⎢
⎤
⎦
⎥ ⎥ ⎥ ⎥ ⎥
. ( 6 )
More particularly, at the fundamental frequency
€
f1, this relation becomes:

7
€
V+ f1( )V− f1( )V0 f1( )
⎡
⎣
⎢ ⎢ ⎢
⎤
⎦
⎥ ⎥ ⎥
=
132Va f1( ) + a × 2Vb f1( ) + a2 × 2Vc f1( )( )
132Va f1( ) + a2 × 2Vb f1( ) + a × 2Vc f1( )( )132Va f1( ) + 2Vb f1( ) + 2Vc f1( )( )
⎡
⎣
⎢ ⎢ ⎢ ⎢ ⎢
⎤
⎦
⎥ ⎥ ⎥ ⎥ ⎥
=
13Va + aVb + a2Vc( )
13Va + a2Vb + aVc( )13Va +Vb +Vc( )
⎡
⎣
⎢ ⎢ ⎢ ⎢ ⎢
⎤
⎦
⎥ ⎥ ⎥ ⎥ ⎥
=
V+
V−
V0
⎡
⎣
⎢ ⎢ ⎢
⎤
⎦
⎥ ⎥ ⎥ . ( 7 )
Therefore, the spectral contents of the instantaneous symmetrical components at the fundamental frequency
€
f1 consist of the classical symmetrical components of the three-phase system. More particularly, the classical fundamental positive-sequence component
€
V+ is contained by the instantaneous positive-sequence component
€
v+ t( ) at frequency
€
f1. Following this result, the output of a selective bandpass filter applied to
€
v+ t( ) whose only passband is centered on the fundamental frequency
€
+ f1 is given by
€
v+1 t( ) =V+e
j2πf1t . It should be noticed that this filter only passes spectral components located around
€
+ f1, its transfer function being different from zero only around
€
+ f1 and not around
€
− f1. This transfer function does not verify the so-called hermitian symmetry, and can only be obtained with complex-valued filter coefficients. Such ‘complex filters’ are very useful for real-time demodulation (14)(15) or real-time Hilbert transform (16) applications. Similarly, the same filter applied to the instantaneous positive-sequence component
€
i+ t( ) of the three-phase current system gives
€
i+1 t( ) = I+e
j2πf1t . A real-time estimator
€
ˆ P + t( ) of the fundamental positive-sequence active power
€
P+ defined by Eq. ( 4 ) is finally obtained by using the two previous filtered signals in the following way:
€
ˆ P + t( ) =32
Re v+1 t( ) × i+
1 t( )*{ } . ( 8 )
Figure 3 gives a schematic representation of the proposed algorithm.
Figure 3. Real-time estimation of the fundamental positive-sequence active power
Clearly, each operation appearing in Fig. 3 (the linear combination of Eq. ( 5 ), the complex bandpass filter or the product and real part of Eq. ( 8 )) can be easily real-time implemented. In the next section, this algorithm is applied to realize MOVs condition monitoring.
8
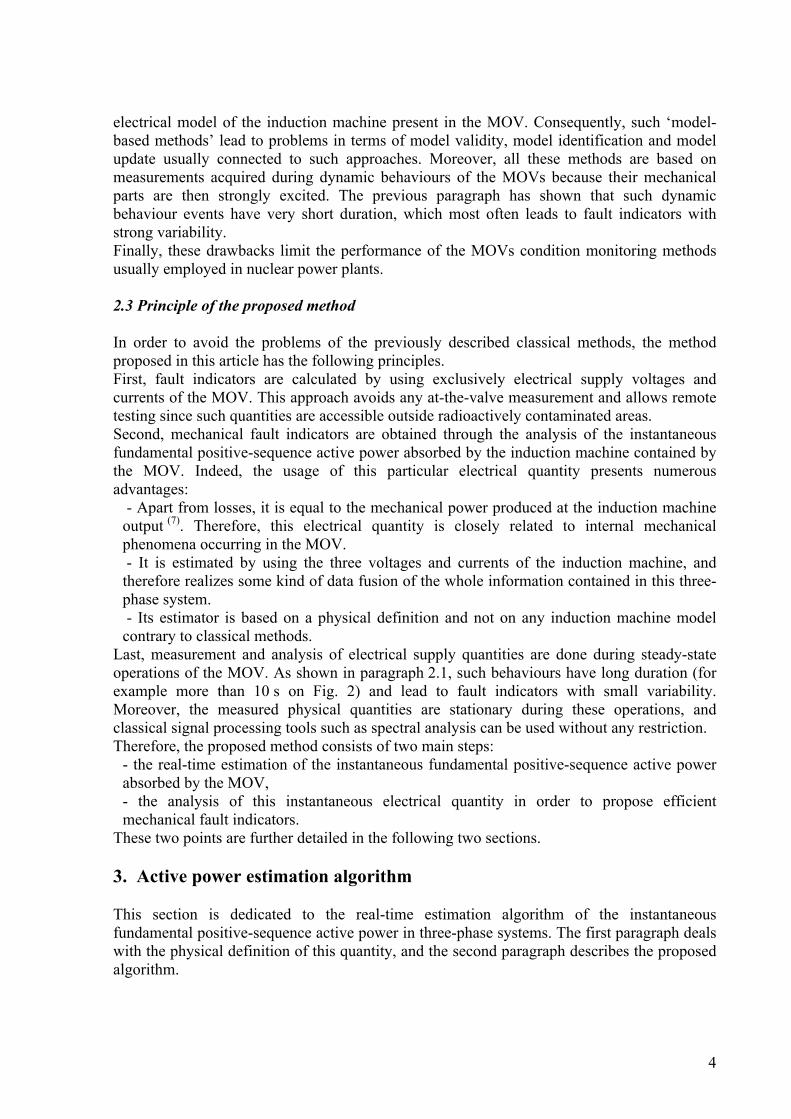
4. Experimental results of MOVs condition monitoring The algorithm described in the previous section is now applied to the electrical supply quantities of a MOV. The aim is to estimate the instantaneous value of the fundamental positive-sequence active power, and next to employ this estimate to monitor the mechanical condition of the MOV. 4.1 Active power waveform The proposed algorithm is applied to the same data used to obtain the curves shown in Fig. 2 and consisting of an opening and a closing stroke. The estimated value of the fundamental positive-sequence active power
€
ˆ P + t( ) appears in red in Fig. 4, while the apparent power first shown in Fig. 2 now appears in black.
4.a. opening stroke
4.b. closing stroke
Figure 4. Time waveforms of MOV stem thrust, apparent and active powers Naturally, the estimated active power
€
ˆ P + t( ) remains lower than the apparent power absorbed by the induction machine. However, as expected, important mechanical events appear much more clearly in the active power. This is verified for the hammer blow and the valve unseating (the two events following the starting transient at the beginning of the opening stroke), and for the valve seating (at the end of the closing stroke). These results validate the idea that
€
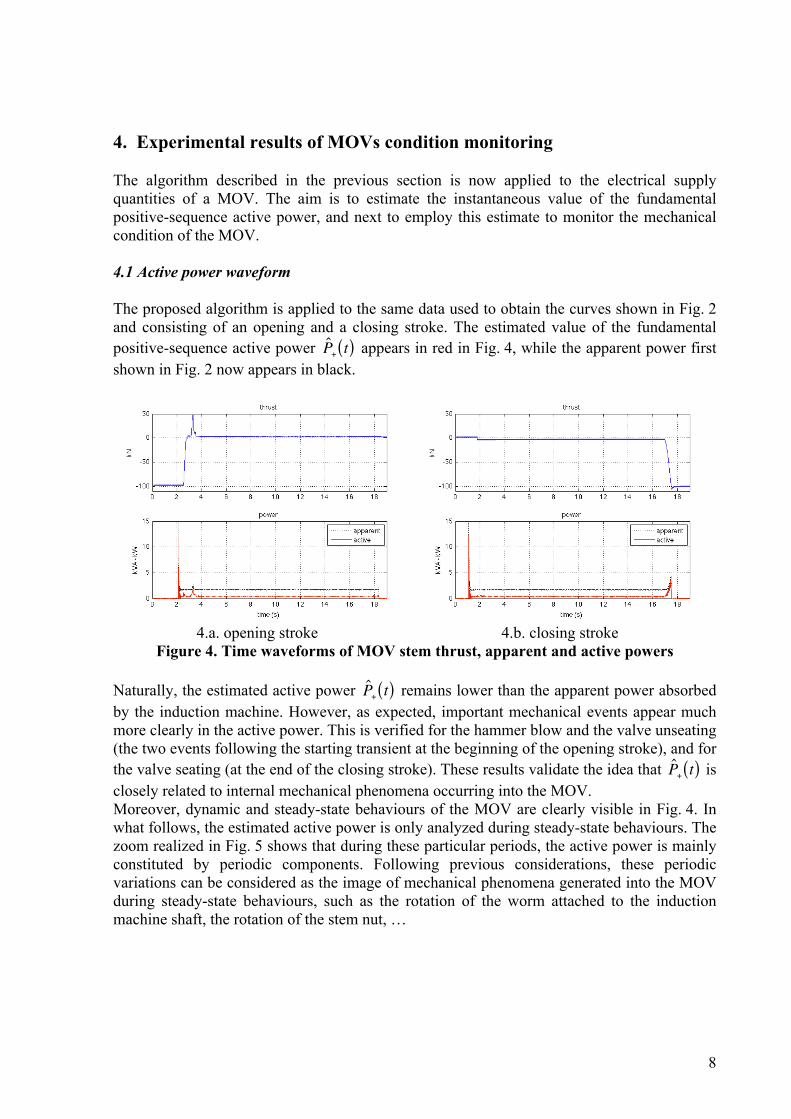
ˆ P + t( ) is closely related to internal mechanical phenomena occurring into the MOV. Moreover, dynamic and steady-state behaviours of the MOV are clearly visible in Fig. 4. In what follows, the estimated active power is only analyzed during steady-state behaviours. The zoom realized in Fig. 5 shows that during these particular periods, the active power is mainly constituted by periodic components. Following previous considerations, these periodic variations can be considered as the image of mechanical phenomena generated into the MOV during steady-state behaviours, such as the rotation of the worm attached to the induction machine shaft, the rotation of the stem nut, …
9
Figure 5. Time waveforms of MOV active power during steady-state operations
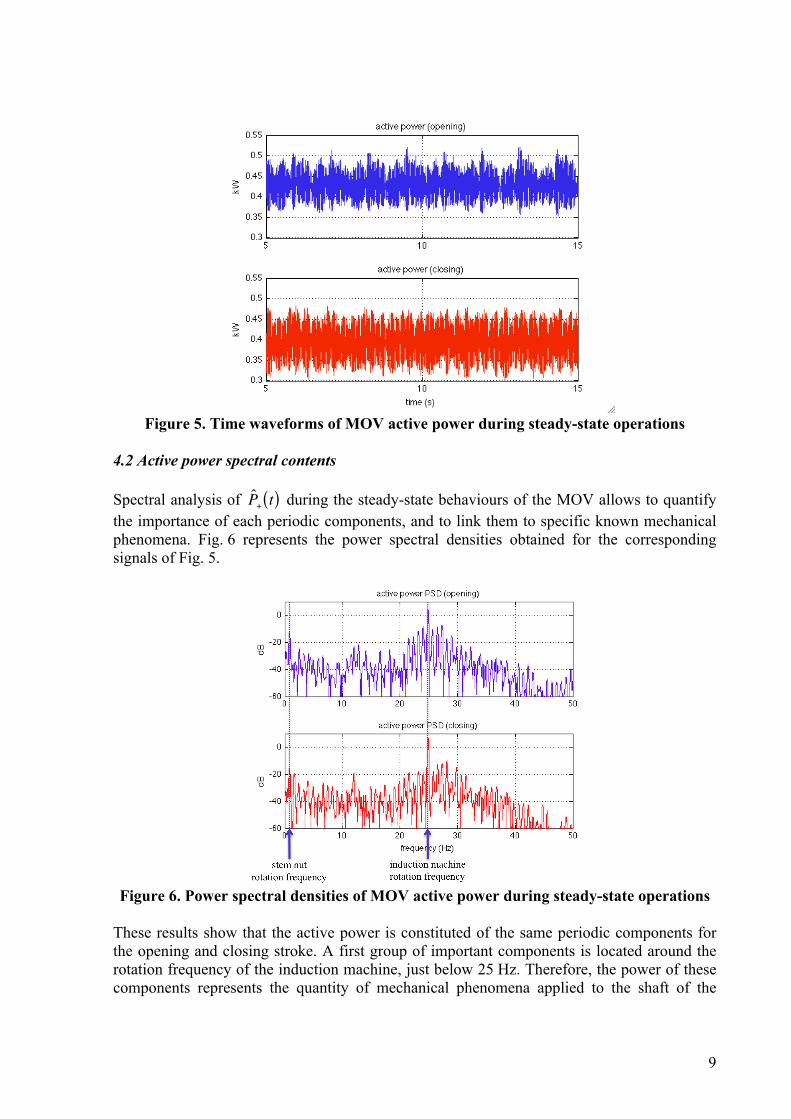
4.2 Active power spectral contents Spectral analysis of
€
ˆ P + t( ) during the steady-state behaviours of the MOV allows to quantify the importance of each periodic components, and to link them to specific known mechanical phenomena. Fig. 6 represents the power spectral densities obtained for the corresponding signals of Fig. 5.
Figure 6. Power spectral densities of MOV active power during steady-state operations
These results show that the active power is constituted of the same periodic components for the opening and closing stroke. A first group of important components is located around the rotation frequency of the induction machine, just below 25 Hz. Therefore, the power of these components represents the quantity of mechanical phenomena applied to the shaft of the

10
induction machine at each revolution. A second group of components is located in the low frequency band with a fundamental frequency of 0.82 Hz, the rotation frequency of the stem nut. Therefore, the power of these low frequency components is directly related to the mechanical efforts generated in the stem nut, and can be used as an indicator of the stem nut mechanical condition. Finally, these results show that the spectral contents of
€
ˆ P + t( ) can be used to monitor the mechanical condition of different parts of the MOVs. 4.3 Fault indicators and experimental results These results encourage the creation of mechanical fault indicators based on the analysis of the estimated active power. One example is the condition monitoring of the stem nut through the low frequency contents of
€
ˆ P + t( ) . In that case, the indicator is simply obtained by summing the power spectral density of
€
ˆ P + t( ) from 0 to 10 Hz, and represents the quantity of low frequency phenomena in
€
ˆ P + t( ) , and therefore the stem nut mechanical condition. Figure 7 shows the results obtained with this particular indicator applied to 14 similar MOVs in different French nuclear power plants. This indicator reaches a high value for MOVs number 2 and 12. These particular MOVs have been controlled, and it has been noticed that the corresponding stem nuts present an important lack of grease. This first result is encouraging and other efficient mechanical fault indicators should be proposed in the future to monitor MOVs condition through electrical active power.
Figure 7. Stem nut fault indicator based on low frequency components of
€
ˆ P + t( ) 5. Conclusion In this paper, a new condition monitoring technique dedicated to motor-operated valves in nuclear power plants has been proposed. This method is based on the idea that the fundamental positive-sequence active power absorbed by the MOV can be used to monitor the mechanical condition of this system. As a consequence, a new real-time estimation algorithm of this electrical quantity has been presented in section 3 (see Fig. 3). Moreover, an example of one mechanical failure indicator elaborated from the previous estimated active power has

11
been described in section 4. Obtained results, shown in Fig. 4, are very encouraging and allows to monitor the mechanical condition of one particular part of the MOV. Futur works need to be addressed, however. For example, others fault indicators are needed to monitor the condition of each part of the MOV independently. Acknowledgements The author would like to thank EDF-DTG for his assistance and financial support. References and footnotes 1. Nuclear power. (2011, April 4). In Wikipedia, The Free Encyclopedia. Retrieved 13:19,
April 4, 2011, from: http://en.wikipedia.org/w/index.php?title=Nuclear_power&oldid=422269454.
2. D-W. Kim et al, ‘A study on a characteristic of stem friction coefficient for motor-operated flexible wedge gate valve’, Nuclear Engineering and Design, Vol 239, Issue 10, pp 1744-1749, October 2009.
3. S. Kang et al, ‘A study on the actuator efficiency behavior of safety-related motor-operated gate and globe valves’, Nuclear Engineering and Design, Vol 239, Issue 12, pp 2705-2712, December 2009.
4. J-C. Jund and P-H. Seong, ‘Error analysis in improved motor control center method for stem thrust estimation of motor-operated valves in nuclear power plants’, IEEE Transactions on Nuclear Science, Vol 50, N° 3, pp 735-740, June 2003.
5. S. Kang et al, ‘Motor control center based technology study for safety-related motor-operated valves’, Nuclear Engineering and Technology, Vol 38, N° 2, pp 155-162, 2005.
6. J. Chai, ‘Non-invasive diagnostics of motor-operated valves’, Proceedings of the American Control Conference, Baltimore, Maryland, June 1994.
7. P. L. Alger, ‘Induction machines’, 2d edition, Gordon & Breach Science Pub, 1995. 8. Charles L. Fortescue, ‘Method of symmetrical co-ordinates applied to the solution of
polyphase networks’, AIEE Transactions, Vol 37, Part II, pp 1027-1140, 1918. 9. M. Bollen and I. Gu, ‘Signal processing of power quality disturbances’, Wiley IEEE
Press, pp 68-71, 2006. 10. A. E. Emanuel, ‘Summary of IEEE standard 1459: definitions for the measurement of
electric power quantities under sinusoidal, nonsinusoidal, balanced or unbalanced conditions’, IEEE Transactions on Industry Applications, Vol 40, N° 3, pp 869-876, May-June 2004.
11. S. Orts-Grau et al, ‘Discussion on useless active dans reactive powers contained in the IEEE standard 1459’, IEEE Transactions on Power Delivery, to be appeared, 2011.
12. W. V. Lyon, ‘Transient analysis of alternating-current machinery’, Wiley, 1954. 13. G. C. Paap, ‘Symmetrical components in the time domain and their application to power
network calculations’, IEEE Transactions on Power Systems, Vol 15, N° 2, pp 522-528, May 2000.
14. Y. T. Sheen, ‘A complex filter for vibration signal demodulation in bearing defect diagnosis’, Journal of Sound and Vibration, Vol 276, N° 1-2, pp 105-119, 2004.
15. P. Granjon et al, ‘Surveillance du désalignement d’un moteur asynchrone par analyse du vecteur d’espace courant’, GIS 3SGS workshop, Nancy France, June 2009.
16. A. Reilly et al, ‘Analytic signal generation – tips and traps’, IEEE Transactions on Signal Processing, Vol 42, N° 11, November 1994.