condition monitoring of the coorong, lower lakes and ... · condition monitoring of the coorong,...
TRANSCRIPT
Condition Monitoring of the Coorong, Lower Lakes and Murray Mouth Icon Site: Waterbirds in the Coorong and Lower Lakes 2016
David C. Paton, Fiona L. Paton & Colin P. Bailey
June 2016
School of Biological Sciences University of Adelaide

ii
© The University of Adelaide and The Department of Environment, Water and Natural
Resources (DEWNR)
With the exception of the Commonwealth Coat of Arms, the Murray-Darling Basin Authority
logo, photographs and all material presented in this document is provided under a Creative
Commons Attribution 4.0 International licence
(https://creativecommons.org/licences/by/4.0/).
For the avoidance of any doubt, this licence only applies to the material set out in this
document.
The details of the licence are available on the Creative Commons website (accessible using the
links provided) as is the full legal code for the CC BY 4.0 licence
(https://creativecommons.org/licences/by/4.0/legal code).
MDBA’s preference is that this publication be attributed (and any material sourced from it)
using the following:
Publication title: Condition monitoring of the Lower Lakes, Murray Mouth and Coorong Icon
Site: Waterbirds in the Coorong and Lower Lakes 2016.
Source: Licensed from The Department of Environment, Water and Natural Resources under a
Creative Commons Attribution 4.0 International Licence.
Authors: David C. Paton, Fiona L. Paton & Colin P. Bailey.
Cover Image: Red-necked Stint foraging in the South Lagoon, Coorong, January 2016.
Photographer: Fiona Paton
The contents of this publication do not purport to represent the position of the Commonwealth
of Australia or the MDBA in any way and are presented for the purpose of informing and
stimulating discussion for improved management of Basin's natural resources.
To the extent permitted by law, the copyright holders (including its employees and
consultants) exclude all liability to any person for any consequences, including but not limited
to all losses, damages, costs, expenses and any other compensation, arising directly or
indirectly from using this report (in part or in whole) and any information or material contained
in it.
Contact us
Enquiries regarding the licence and any use of the document are welcome to: Adrienne
Rumbelow LLCMM Icon Site Coordinator [email protected]

iii
Executive Summary
Over 185,000 waterbirds (57 species) were using the Coorong in January 2016. More than half
(over 93,000) of these waterbirds were using the South Lagoon, with Red-necked Stints (Calidris
ruficollis), Grey Teal (Anas gracilis), Hoary-headed Grebes (Poliocephalus poliocephalus) and
Banded Stilts (Cladorhynchus leucocephalus) all exceeding 10,000 birds. Australian Shelduck
(Tandorna tadornoides), Whiskered Terns (Chlidonias hybridus), Silver Gulls (Chroicocephalus
novaehollandiae), Red-necked Avocets (Recurvirostra novaehollandiae), Red-capped Plovers
(Charadrius ruficapillus), Sharp-tailed Sandpipers (Calidris acuminata), Chestnut Teal (Anas
castanea), and Australian Pelicans (Pelecanus conspicillatus) were also prominent in the South
Lagoon, with more than a thousand individuals of each. A little over 45,000 waterbirds were using
the North Lagoon, with Grey Teal, Silver Gulls, Australian Shelducks, Whiskered Terns, Sharp-tailed
Sandpipers, Chestnut Teal and Black Swans (Cygnus atratus) prominent in this region of the
Coorong. Around 46,000 waterbirds were using the Murray Estuary in January 2016. Sharp-tailed
Sandpipers, Grey Teal and Red-necked Stints were the most abundant species in this region,
exceeding 5,000 individuals and collectively they accounted for more than half the birds counted
in this region of the Coorong. A thousand or more Silver Gulls, Whiskered Terns, Great Cormorants
(Phalacrocorax carbo), Banded Stilts, Black Swans and Red-necked Avocets were also present.
Most species of waterbirds using the Coorong in January 2016 exceeded their long-term median
abundance. Amongst the more abundant species that failed to meet their long-term median
abundances in January 2016 were the Chestnut Teal, Banded Stilt and Curlew Sandpiper (Callidris
ferruginea), despite the abundances of Chestnut Teal and Banded Stilts being higher in January
2016 compared with January 2015. The numbers of Curlew Sandpipers counted in January 2016,
however, were about 30% of those of the previous year. Red-necked Stint abundances in January
2016 were also much lower, with around half the abundances recorded compared to January
2015. In contrast, the numbers of Sharp-tailed Sandpipers were higher in January 2016 than the
previous year, and January 2016 was the first year since the end of the millennium drought when
Common Greenshanks (Tringa nebularia) exceeded their long-term median abundance.
Over 85,000 waterbirds were counted in the Lower Lakes, less than half the numbers of birds that
were using the Coorong. Prominent species in the Lower Lakes were: Great Cormorants, Pied
Cormorants (Phalacrocorax varius), Australian Pelicans and Whiskered Terns – all fish-eating
species; and Australian Shelducks, Grey Teal, Pacific Black Ducks (Anas superciliosus), Black Swans
and Eurasian Coots – all largely herbivorous species. These ten species accounted for over 85% of
the waterbirds using the Lower Lakes. As has been the case in recent years, only small numbers
(~700) of migratory shorebirds (stints, sandpipers) used the Lower Lakes in January 2016.
Abundances of several endemic shorebirds (stilts, avocets, plovers, lapwings) were also low
(~1000) but a little higher than the migratory species and comparable to abundances in previous
years.
A Whole of Icon Site Score (WOISS) for waterbird populations in the Coorong was derived using
the abundances and distributions of 40 selected waterbird species and whether they met their
ecological targets. In January 2016, the WOISS for waterbird populations in the Coorong was -26.
iv
This was slightly lower than the WOISS recorded in January 2015 but similar to the values recorded
in 2002 and 2003 and substantially higher than the lowest value (-88) in January 2011. A negative
WOISS indicates that some of the waterbird species failed to exceed their long-term median
abundance in two of the last three years and/or failed to meet the 75% thresholds for Extent of
Occurrence or Area of Occupation. For the Coorong, there was a steady improvement in the
WOISS from 2011 to 2015 but the lower score in 2016 suggests that the TLM ecological objective
of maintaining and improving waterbird populations in the Coorong was not met in 2016. A similar
WOISS for the Lower Lakes, based on the 25 species of waterbird that regularly use the Lower
Lakes, was -11 in 2016, equivalent to -0.44 per bird. The WOISS score per waterbird species for the
Coorong was lower than the Lower Lakes score at -0.65, suggesting that the waterbirds of the
Coorong were more depressed than those of the Lower Lakes.
Various shorebirds (sandpipers, stints) continued to spend 80-90% of their time foraging,
indicative of poor food resources. The presence of dead, emaciated shorebirds in the southern
Coorong was consistent with some birds failing to secure sufficient food. Some of the herbivorous
waterfowl (Black Swan, Grey Teal) were also spending up to 70% of the day foraging when using
the Coorong. In comparison, various fish-eating species (pelican, cormorants, terns) were spending
less than 40% of the time fishing, indicating that fish abundances were more than adequate to
meet their needs. The poor performances of some of the shorebirds and herbivorous waterfowl in
the southern Coorong are linked to the poor recovery of Ruppia tuberosa. Importantly, R. tuberosa
continues to show little reproductive activity due primarily to falling water levels in spring that
expose this aquatic annual plant to desiccation before the plants have had time to set seeds and
turions. This limits the quantity of plants available to herbivorous waterfowl and the quantities of
seeds and turions available to other species of waterbirds. Abundances of seeds and turions in
January 2016 were around 1% and 20% of their historic levels, respectively. Even when the Murray
Darling Basin Plan is fully implemented, the flows over the Murray Barrages in most years are
unlikely to be adequate to sustain water levels in the southern Coorong. Alternative management
actions need to be considered. Logical options include constructing a barrier across the Coorong
midway along its length to help maintain water levels in the southern Coorong in spring and
considering constructing alternative wetlands nearby to compensate waterbird populations for
the on-going poor quality of the Coorong.

v
Table of Contents
Executive Summary iii
1 Preamble 1
2 Introduction 1
3 Methods 6
3.1 Counting birds in the Coorong 6
3.2 Counting birds in the Lower Lakes 6
3.3 Behavioural surveys of waterbirds 7
3.4 Data analysis 7
3.5 Assessing changes in the food resources for birds in the Coorong 8
4 Results and Preliminary Discussion 10
4.1 Abundances of birds in the Coorong in January 2016 10
4.2 Abundances of birds in the Lower Lakes in January 2016 10
4.3 Birds of listed conservation status 10
4.4 Abundances of waterbirds using the Coorong and Lower Lakes in 2016 compared to
other years 14
4.5 AOO and EOO for waterbirds using the Coorong and Lower Lakes in 2016 18
4.6 Whole of Icon Site Score (WOISS) for waterbird populations in the Coorong for January
2016 20
4.7 Whole of Icon Site Score (WOISS) for waterbird populations in the Lower Lakes for January
2016 20
4.8 Comparison of the waterbird communities of the Coorong and Lower Lakes for 2016 23
4.9 Waterbird breeding in the Coorong and Lower Lakes in January 2016 24
4.10 Waterbird foraging levels 24
4.11 Ecological conditions and food resources in the Coorong in January 2016 29
5 General Discussion and Conclusions 35
6 Acknowledgements 38
7 References 39
8 Appendix 41

vi

1
1 Preamble
This report builds on a series of annual reports on waterbirds in the Coorong and Lower Lakes.
Substantial parts of previous reports are reiterated so that relevant background and historical
perspectives, as well as details of methods and monitoring targets, are provided within this report,
reducing the need to revisit previous reports for those details.
2 Introduction
The Lower Lakes, Coorong and Murray Mouth (LLCMM) region is a Wetland of International
Importance under the Ramsar Convention and is one of the Living Murray’s (TLM) icon sites within
the Murray-Darling Basin. Large numbers of small migratory and non-migratory waders
(sandpipers, plovers and stilts), piscivorous birds (pelicans, cormorants, grebes and terns) and
waterfowl (swans and ducks) use components of this wetland system, particularly during summer
(e.g., Paton 2010). This abundance and diversity of waterbirds was one of the prime reasons for
the LLCMM region being listing as a Wetland of International Importance. Most waterbirds use the
shallow but often highly productive margins of wetlands, and the permanent wetlands of the
Coorong and Lower Lakes have historically provided extensive areas of shallow productive wetland
habitat, even in droughts (Paton et al. 2015a).
Waterbird use of the Lower Lakes has been assessed annually since 2009, while the Coorong and
Murray Mouth region has been assessed annually since 2000 with the counts taking place during
summer when the extent of birds using these wetlands is highest (Paton 2010). These systematic
counts are then used to document changes in the distributions and abundances of waterbirds
within the different components of the LLCMM and in recent years this annual census has been
used to assess various waterbird-related targets (e.g., Paton & Bailey 2012a,b; 2013) listed in the
LLCMM Icon Site Condition Monitoring Plan (Maunsell 2009). Amongst these targets is target B-1 -
to maintain or improve water bird populations in the Lower Lakes, Coorong and Murray Mouth.
These targets and the associated annual monitoring programs were reviewed and new ecological
targets set (e.g., Paton 2014; Robinson 2014; Paton et al. 2015b, Table 1). This report summarises
the results of the 2016 summer waterbird census for the Coorong, Lower Lakes and Murray Mouth
region against the new targets.
The annual counts of waterbirds within the LLCMM need to be placed in context, the context of a
wetland system that has been recovering from severe perturbations that resulted in the quality of
wetland habitats deteriorating for waterbirds. With these wetlands now recovering post drought,
a key focus for the current waterbird monitoring has been to establish if the waterbird
communities have also recovered. To appreciate any recovery requires an understanding of the
extent to which these wetland systems were perturbed and the causes of those perturbations.
Over the last sixteen years, there have been dramatic changes to the hydrology of the LLCMM
region. Within the Lower Lakes, water levels during 2009 and most of 2010 were consistently
below sea-level (-0.5m AHD in Lake Albert; and -0.7 m to -0.9 m AHD in Lake Alexandrina). This
resulted in the waterline disconnecting from the fringing vegetation, along with an increased risk

2
of acid-sulfate soils being exposed to the air, leading to potential acidification. For the Coorong
and Murray Mouth, there were no substantial River Murray flows over the barrages for almost
eight years from 2002-2010. During this period, the Murray Mouth and associated channels had to
be dredged to keep the Mouth open. The lack of flows also affected the ecology of the Coorong,
disrupting seasonal patterns to water levels and resulting in the accumulation of excessive
amounts of salt in the South Lagoon (Paton 2010). These hydrological changes led to changes in
the distributions and abundances of key aquatic food resources (plants, invertebrates and fish)
used by waterbirds in the Coorong. As the salinities increased, the distributions of the salt tolerant
fish, the smallmouth hardyhead (Atherinosoma microstoma), and the salt-tolerant chironomid
(Tanytarsus barbitarsis), that are prominent in the southern Coorong, retracted northwards. From
2007 onwards, both were absent from the South Lagoon, when salinities exceeded 150 gL-1.
However, brine shrimps (Parartemia zietziana) thrived in the South Lagoon and southern reaches
of the North Lagoon during this period. The other major change to food resources was the loss of
the key aquatic macrophyte Ruppia tuberosa from the southern Coorong during this period. These
ecological changes in turn affected the distributions and abundances of waterbirds, with many
piscivorous and herbivorous bird species forced to vacate the South Lagoon (Paton 2010). These
changes have been attributed to an extensive drought within the Murray-Darling Basin during the
2000s, coupled with on-going over-extraction of water for human use.
During the latter half of 2010, extensive rains within the Murray-Darling Basin brought floods to
the River Murray and flows returned to the Lower Lakes. Water levels in the Lower Lakes returned
to the more typical managed water levels between 0.6 m and 0.8 m AHD in 2011 and have
remained on or around this level since then. With these changes in water levels, there were
dramatic changes in the waterbird communities using the Lower Lakes. For example, in 2009 and
2010, there were tens of thousands of stints and sandpipers foraging around the southern
shorelines of the Lower Lakes, taking advantage of rarely exposed mudflats as levels dropped as
low as -1 m AHD (e.g., Paton & Bailey 2010). However, in spring 2010, water levels in the lakes
were re-instated to more typical levels, covering the extensive areas of mudflat that were covered
with shallow water in 2009 and 2010 with deep water. This excluded wading birds like stints and
sandpipers and, consequently, they had all but disappeared from the Lower Lakes when the
counts were undertaken in January 2011 (e.g., Paton & Bailey 2011a). These shorebird species
have remained in low abundances around the Lower Lakes ever since (e.g., Paton & Bailey 2012a,
2013, 2014, Paton et al. 2015c). However, the distributions and abundances of other species of
waterbirds increased over the next 2-3 years and are now considered to have recovered from the
severe drought (e.g., Paton & Bailey 2012a, 2013, 2014, Paton et al. 2015a,b).

3
Table 1: Ecological targets for waterbirds using the Coorong and Lower Lakes. Table A1 (Appendix) lists the 40 species
that are used in the assessment of waterbird populations in the Coorong (including Murray Mouth), and their long-
term (2000-2015) median abundances, and long-term (2000-2015) average AOO and EOO, while Table A2 (Appendix)
lists the 25 species that are used in the assessment of waterbird populations in the Lower Lakes, and their recent
(2013-2015) median abundances, and recent (2013-2015) average AOO and EOO.
Ecological
Objective
Maintain or improve water bird populations in the Lower Lakes, Coorong and
Murray Mouth.
Definition of
how objective
is interpreted
Maintain means continuing to meet the long-term threshold ecological targets
set for the abundances and distributions of selected species of waterbirds in
the Coorong (40 species) and in the Lower Lakes (25 species). A simple index
(negative) based on the number of species that failed to meet their threshold
ecological targets is used to derive a Whole of Icon Site Score (WOISS) for the
Coorong and for the Lower Lakes. Maintain means that the index calculated in
a particular year is at or above the 2015 index.
Improve means that the waterbird indices for the Coorong have exceeded the
2015 indices for three consecutive years.
Ecological
target(s)
Coorong waterbirds
1. Exceed the long-term (2000-2015) median value for abundance of each of 40
selected waterbird species in the Coorong in two of the last three years.
2. Exceed the 75% threshold for the long-term (2000-2015) Area of Occupation
(AOO) for each of 40 selected waterbird species in the Coorong.
3. Exceed the 75% threshold for the long-term (2000-2015) Extent of Occurrence
(EOO) for each of 40 selected waterbird species in the Coorong.
4. All waterbird species to spend less than 70% of their time foraging.
Lower Lakes waterbirds
1. Exceed the recent (2013-2015) median value for abundance of each of 25
selected waterbird species in the Lower Lakes in two of the last three years.
2. Exceed the lower 75% threshold for the recent (2013-2015) Area of
Occupation (AOO) for each of 25 selected waterbird species in the Lower
Lakes.
3. Exceed the 75% threshold for the recent (2013-2015) Extent of Occurrence
(EOO) for each of 25 selected waterbird species in the Lower Lakes.
4. All waterbird species to spend less than 70% of their time foraging.
4
Once the Lower Lakes had re-filled in spring 2010, the barrage gates were opened, reinstating
flows to the Murray Mouth in late September 2010. With this release, the northern channels of
the Murray Estuary were quickly freshened, before flows continued down the Coorong, diluting
the high salinities in the South Lagoon as well. The general consensus was that this freshening of
the Coorong would be beneficial, allowing a wide range of different taxa, including plants,
invertebrates, fish and birds, to rebuild their population sizes. In January 2011, chironomids had
recolonised the South Lagoon and were abundant, yet only small numbers of smallmouth
hardyheads were in the South Lagoon, and there was no detectable recovery of R. tuberosa.
However, R. tuberosa and chironomids were still abundant in the middle and southern sections of
the North Lagoon, where they had established during the previous five years (Paton & Bailey
2011b). Brine shrimps, however, continued to be abundant throughout the South Lagoon. The
other key food resources, various polychaete worms (particularly Capitella sp), were still mainly
restricted to the northern sections of the North Lagoon and the Murray Estuary (Paton & Bailey
2011b). Despite some modest recovery, waterbird numbers for the Coorong and Lower Lakes
were the lowest on record in January 2011 and lower than abundances during the drought. The
low numbers were largely attributed to extremely high water levels in the Coorong in January,
with the high water levels excluding most birds from accessing food resources around the shores
of the Coorong lagoons (Paton & Bailey 2011b; Paton et al. 2015a). With the continuation of flows
and the maintenance of lower salinities throughout 2011, there were further changes in the
distributions and abundances of food resources. By July 2011, there were no brine shrimps
detected in the Coorong, and by January 2012, smallmouth hardyhead were extremely abundant
in the southern Coorong (Paton & Bailey 2012b). However there had been no recovery of R.
tuberosa. In fact R. tuberosa had declined further by January 2012, as the extensive beds that
were present in the North Lagoon in January 2011 were absent, having vanished by June 2011
(Paton & Bailey 2012c). Ruppia tuberosa has been slowly recovering throughout the southern
Coorong since then. By summer 2015, the species had recovered its former range but had not
reached the same level of vigour (cover, productivity) as existed prior to the millennium drought
(e.g., Paton et al. 2016a). The seed banks for this species were still to be replenished and so R.
tuberosa continues to lack any long-term resilience in the Coorong (Paton et al. 2015d, 2016a,b).
This report provides a summary for the waterbird census that was conducted in the Coorong,
Murray Mouth and Lower Lakes region in January 2016 and assesses the abundances against the
proposed targets set for waterbirds in the revised Condition Monitoring Plan (Maunsell, 2009,
Table 1). For the Coorong, the abundances and distributions of 40 species of waterbirds are used
as the basis for assessing Target B-1: To maintain or improve bird populations in the [Lower Lakes,]
Coorong and Murray Mouth, where the abundances of each of the 40 species should exceed the
long-term (2000-2015) median abundance in two out of three years in the future (e.g., Paton et al.
2015b). For the Lower Lakes, the abundances and distributions of 25 species of waterbirds are
used as the basis for assessing Target B-1: To maintain or improve bird populations in the Lower
Lakes, [Coorong and Murray Mouth], where the abundances of each of the 25 species should
exceed the recent (2013-2015) median abundance in two out of three years in the future. For the
Lower Lakes, systematic counts of waterbirds did not commence until 2009 and the first two years
of Lakes’ censuses coincided with a period when the Lakes were at unprecedented low water
5
levels and the waterbird community was atypical, as many of the reed dependent species were
excluded. For the next two years (2011, 2012) the waterbird populations recovered and since then
have been reasonably consistent and typical of the water community likely to have occupied the
wetlands of the Lakes prior to the millennium drought (Paton et al. 2015a,b). Thus, the census
data collected in 2013, 2014 and 2015 has been used to create the target for median abundance.
The use of medians, and the requirement to exceed the median in two out of three years, takes
into account the inherent variability that exists in waterbird count data and the goal of enhancing
waterbird populations across the wetlands.
Most of the waterbirds using the Coorong use the wetland during the summer months when other
wetlands are usually dry (Paton 2010, Paton et al. 2015a). Thus, the numbers of waterbirds
counted in the Coorong and Lower Lakes in any one year is likely to be influenced by conditions of
other wetlands that the birds use, including those used at other times of the year. Some care is
therefore required in interpreting changes in abundances. The use of median values rather than
means overcomes some of the variability that inevitably exists in counts. Two other targets
consider the distribution of the birds: (1) the extent of occurrence (EOO) and (2) the area of
occupation (AOO), with both of these needing to fall within 75% of the long-term (2000-2015)
average values for those variables for the Coorong (Paton et al. 2015b) and within 75% of the
recent (2013-2015) average values for those variables for the Lower Lakes.
A further index, namely the percent of birds that were foraging when counted during the census,
provides a measure of the quality of the habitat or resources for different waterbird species. This
index is independent of other wetlands and is likely to be more informative of the actual
conditions in the Coorong and Lower Lakes for waterbirds. The percent of birds foraging reflects
the amount of time a bird needs to allocate to foraging and so is a measure of how easily an
individual of a species can harvest its food requirements (Paton et al. 2015a, 2015e). The quality of
a habitat for foraging is higher when birds spend less time foraging compared to wetlands where
the birds spend more time foraging. The interim target for foraging is to have fewer than 70% of
the birds foraging when counted for each of the waterbird species. When more than 70% of the
birds are foraging during the January counts, the quality of the habitat is poor for those species
(Paton et al. 2015a, 2015e). Reporting of this index simply involves determining the number of
species that are spending more than 70% of their time foraging.

6
3 Methods
All waterbird observations were made using either binoculars (8-10x magnification), or spotting
scopes (20x-60x magnification). Birds were identified to species, counted, and their activity
classified to one of four categories (foraging, resting, flying-over or breeding).
3.1 Counting birds in the Coorong
In order to census the waterbirds of the Coorong, the system was divided into 1-km sections,
running approximately perpendicular to the direction of the wetlands. This sampling strategy was
initially established in 1984-5 when the birds using the South Lagoon were first counted (Paton
2010) and the same sampling strategy was applied to the whole Coorong when complete counts
commenced in 2000 to allow historical comparisons (e.g., Paton et al. 2009; Paton 2010). The
Murray Estuary was, therefore, divided into 17 x1-km sections running from Pelican Point to
Goolwa Barrage while the North Lagoon of the Coorong was divided into 45 x 1-km sections
running from Parnka Point to Pelican Point. The South Lagoon consisted of 55 x 1-km sections
running from Parnka Point to 42-Mile Crossing; however, the number of sections actually counted
in summer in the South Lagoon has varied (between 43 and 48) with inter-annual variations in
water levels (with the southernmost end being completely exposed in years with low water
levels).
Within each 1-km section, counts of waterbirds were conducted both on foot, and by boat. In
2016, the eastern shorelines of each section were walked by at least two observers, while open
water areas in the middle of the Coorong and other areas inaccessible by foot (such as islands)
were counted from a boat, again by at least two observers. The western shorelines were either
counted on foot or from a small boat, again with at least two observers. All waterbirds detected
within each component (e.g., eastern shoreline, western shoreline, centre, islands) of each 1-km
section were recorded. This division of the data into 1-km sections allows for assessments of
changes in distribution through time, at a fine-scale, and allows AOO and EOO to be determined.
Within a census period, typically between 10 and 20 consecutive 1-km sections were counted per
day, depending on the number of birds, their geographical location within each section, as well as
other factors, such as weather conditions. Some variance thus occurs in the total duration (7-16
days) of the census from one year to the next. In 2016, the census of waterbirds in the Coorong
was conducted between 7 and 16 January 2016 (10 days; 7 days surveying), with the counts
commencing at the southern end of the Coorong and moving northwards during the sampling
period, as was the case in previous years. The North and South Lagoons were counted in the first 6
days of surveying, but bad weather for 3 days prevented counting from the 13-15 January
(inclusive), forcing the last of the counts of the Murray Estuary to be concluded on 16 January.
3.2 Counting birds in the Lower Lakes
Similar methods were used to count waterbirds around the shores of the Lower Lakes between 20
January and 7 February 2016, with a total of 8 survey days. The shorelines of each lake were
divided into 1 km x 1 km grid cells (based on Transverse Mercator Projection, Map Grid of

7
Australia (MGA94), Zone 54) and the numbers of birds present in each grid cell were recorded
along with their activity (foraging, flying, resting, breeding), allowing both the abundance and the
distribution of birds over the Lower Lakes to be determined. Grid cells, however, differed in the
amount of shoreline present and also in the extent of shallow water but no adjustments of the
numbers of birds was undertaken to account for any differences in grid cells. The time spent
surveying each 1km x 1km grid also varied depending on the length of shoreline and aquatic
habitat and the ease with which the cell could be covered. The time spent in each cell was set as
the time required to cover all aquatic habitat and count all of the birds within the cell. Usually two
or three observers worked collaboratively to cover each grid cell. In all, 490 grid cells (127 around
Lake Albert, 283 around Lake Alexandrina and a further 80 which covered the Goolwa Channel and
related tributaries) were counted during the census period, with all cells containing shoreline
being surveyed.
Counts of waterbirds around the shores of the Lower Lakes were conducted either by foot, from a
small boat or both, depending on the extent of backwaters and ease of access with a boat to the
shoreline. During the counts, the location of observers was continuously verified using hand-held
GPS units to ensure the integrity of data for each section of shoreline.
3.3 Behavioural surveys of waterbirds
In addition to recording the behaviour of waterbirds when detected during the counts, repeated
counts of birds and their activities were undertaken throughout the day at selected sites (e.g. a
bay) along the Coorong. This involved counting the numbers of birds in different activities
(including foraging) typically at 2-5 minute intervals for 2-3 hours, and then repeating this for five
three-hour periods of the day (0600-0900; 0900-1200; 1200-1500; 1500-1800; 1800-2100). This
provided a minimum of 30, and usually 40, counts within each of these periods. In January 2016,
surveys were conducted at seven sites spread out along the length of the Coorong (from the South
Lagoon to the Murray Estuary). These seven sites are a subset of 10 sites that have been surveyed
since 2007; however, not all sites were surveyed in each year and no sites were surveyed in 2010,
due to restricted site access and/or lack of funding and skilled personnel. In most years the same
sites (e.g., bays) were re-surveyed but differences in water levels and hence the shorelines caused
some adjustments to the areas observed. Changes in January 2016 included (1) shifting the most
northern site in the Murray Estuary from the eastern shoreline to the western shoreline, as the
eastern shoreline was no longer accessible; and (2) shifting the Noonameena survey slightly
southward, as the bay that is usually surveyed at Noonameena contained no water in January
2016.
3.4 Data analysis
For the purposes of reporting against the ecological targets in Table 1, the overall abundances of
waterbirds using the Coorong were determined by adding the counts for each 1-km section, while
for the Lower Lakes, overall abundances were determined by adding the counts of the 1 km by
1 km grid cells.

8
For calculations of AOO and EOO, all birds that were flying when detected were excluded as these
birds may not be using the particular 1-km section in the Coorong or the 1 km x 1 km grid cell in
the Lower Lakes. The AOO for each species using the Coorong consisted of dividing each 1-km
section into three subsections (eastern shore, centre and western shore) and reporting on the
number of subsections where a particular species was resting, foraging or breeding in the
Coorong, while the EOO for the Coorong was calculated as the number of 1-km sections between
the most northerly and most southerly presence of the species. For the Lower Lakes, AOO for each
species equated to the number of grid cells where a particular species was resting, foraging or
breeding. The EOO for the Lower Lakes was reported as the area (in km2) of the minimum convex
polygon enclosing all 1 km x 1 km grid cells where a particular species was resting, foraging or
breeding. This was specifically performed in ArcGIS 10.1 using the Minimum Bounding Geometry
tool in the ArcGIS toolbox.
The assessment of foraging effort in the Coorong for January 2016 was expressed as a percentage
of the total number of birds of a species foraging divided by the total number of birds of that
species counted during the January 2016 census of the Coorong. The same method was also
applied for calculating foraging effort in the Lower Lakes.
The foraging effort for the Coorong was also supplemented by behavioural data collected
repeatedly at selected sites along the Coorong in January 2016. For each species, observations
made during these surveys from the five three-hourly periods were amalgamated for each site,
with sites only included in estimating foraging effort for a particular species if counts of 100 or
more birds of that species were made over the day. This removed sites with only small and
potentially unrepresentative sample sizes. Foraging effort for a species was then expressed as a
percentage of the total number of birds foraging for those sites that met the >100 bird count
requirement divided by the total number of birds of that species at those sites.
3.5 Assessing changes in the food resources for birds in the Coorong
Since 2001, the relative abundances of key food resources (small fish, aquatic benthic
invertebrates, seeds, turions and plants) for waterbirds have been assessed in the Coorong at the
same time as the bird counts. The same methods are used each year. In January 2016, four sets of
10-25 core samples (core size: 7.5 cm ø, 4 cm deep) of surface mud were collected at each of 17
monitoring sites spread along the Coorong. Additional assessments of resources were also
conducted at eight sites on the western shoreline of the South Lagoon to confirm patterns
detected for the eastern shoreline (see Table A2 and Figure A1 in the appendix for details of the
locations). Each of the four sets of samples were collected at a different position relative to the
waterline (i.e. dry mudflat mid-way between the current waterline and the shore line; mudflat at
the water line, mudflat covered by 30 cm of water; and mudflat covered by 60 cm of water. All
mud samples were then sifted in situ through an Endecott sieve (500 m mesh size), and the
abundance of plant (Ruppia spp) propagules (seeds, turions) and shoots, chironomid larvae and
pupae, and other aquatic invertebrates (e.g., polychaetes), were recorded. Twenty-five cores were
taken from each of the sampled depths for sites with R. tuberosa in the southern Coorong, while
ten samples from each depth were taken at other sites without R. tuberosa in the northern

9
Coorong. The aquatic invertebrates (polychaetes) in the northern Coorong were more evenly
distributed within a site and so only ten cores were required to provide an adequate measure of
abundances, unlike the areas with R. tuberosa, where both the plants and invertebrates
(chironomids) were patchily distributed.
Water quality measures were also taken at the time of assessing food resources, with turbidity
recorded in situ using a Secchi disc, and water samples collected so that the conductivity could be
measured with a TPS conductivity metre subsequently in the laboratory. Water samples were
diluted when required to remain within the optimum range of the conductivity sensor being used.
Conductivity was converted to salinities (gL-1) using the equation developed by Webster (unpubl.)
specifically for the Coorong. Previously, the equation developed by Williams (1986) was used to
convert conductivities to concentration but this equation slightly under-estimates salinities,
particularly at high conductivities. Estimates of fish abundance were collected by dragging a 7m
seine net, a distance of 50m, in water approximately 0.7m deep. The seine net was dragged three
times at each of the 17 eastern sites to provide replicate samples.
10
4 Results and Preliminary Discussion
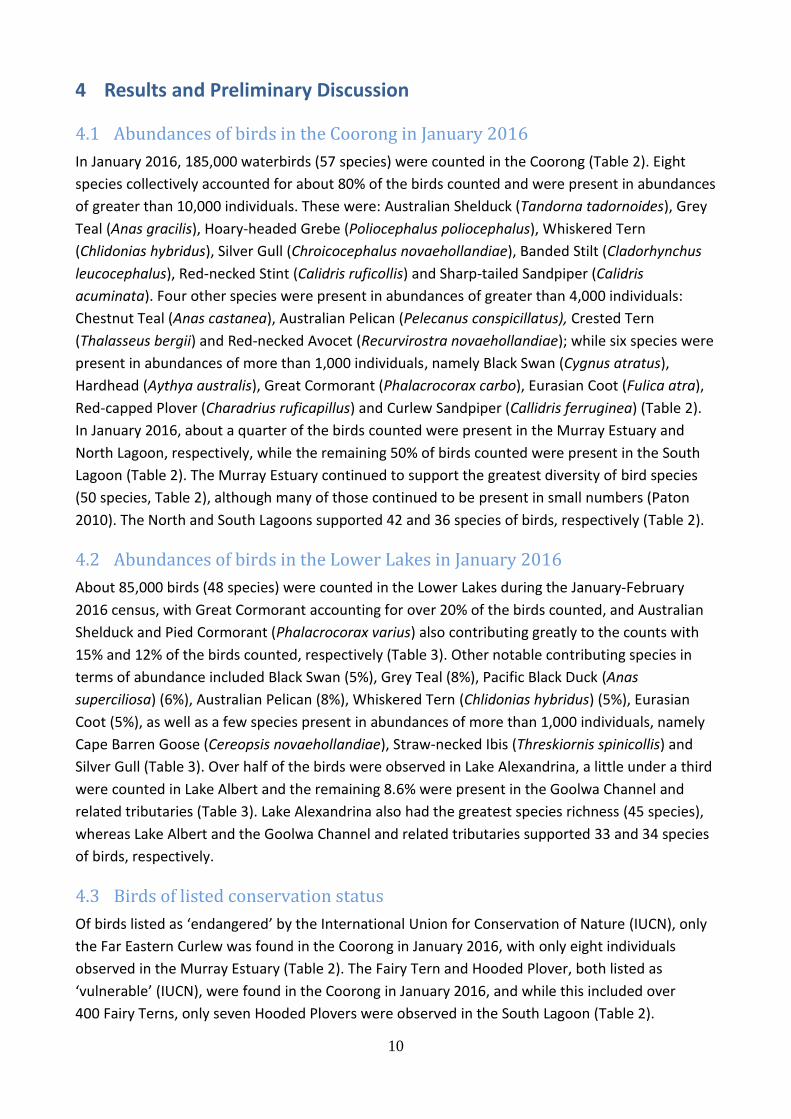
4.1 Abundances of birds in the Coorong in January 2016
In January 2016, 185,000 waterbirds (57 species) were counted in the Coorong (Table 2). Eight
species collectively accounted for about 80% of the birds counted and were present in abundances
of greater than 10,000 individuals. These were: Australian Shelduck (Tandorna tadornoides), Grey
Teal (Anas gracilis), Hoary-headed Grebe (Poliocephalus poliocephalus), Whiskered Tern
(Chlidonias hybridus), Silver Gull (Chroicocephalus novaehollandiae), Banded Stilt (Cladorhynchus
leucocephalus), Red-necked Stint (Calidris ruficollis) and Sharp-tailed Sandpiper (Calidris
acuminata). Four other species were present in abundances of greater than 4,000 individuals:
Chestnut Teal (Anas castanea), Australian Pelican (Pelecanus conspicillatus), Crested Tern
(Thalasseus bergii) and Red-necked Avocet (Recurvirostra novaehollandiae); while six species were
present in abundances of more than 1,000 individuals, namely Black Swan (Cygnus atratus),
Hardhead (Aythya australis), Great Cormorant (Phalacrocorax carbo), Eurasian Coot (Fulica atra),
Red-capped Plover (Charadrius ruficapillus) and Curlew Sandpiper (Callidris ferruginea) (Table 2).
In January 2016, about a quarter of the birds counted were present in the Murray Estuary and
North Lagoon, respectively, while the remaining 50% of birds counted were present in the South
Lagoon (Table 2). The Murray Estuary continued to support the greatest diversity of bird species
(50 species, Table 2), although many of those continued to be present in small numbers (Paton
2010). The North and South Lagoons supported 42 and 36 species of birds, respectively (Table 2).
4.2 Abundances of birds in the Lower Lakes in January 2016
About 85,000 birds (48 species) were counted in the Lower Lakes during the January-February
2016 census, with Great Cormorant accounting for over 20% of the birds counted, and Australian
Shelduck and Pied Cormorant (Phalacrocorax varius) also contributing greatly to the counts with
15% and 12% of the birds counted, respectively (Table 3). Other notable contributing species in
terms of abundance included Black Swan (5%), Grey Teal (8%), Pacific Black Duck (Anas
superciliosa) (6%), Australian Pelican (8%), Whiskered Tern (Chlidonias hybridus) (5%), Eurasian
Coot (5%), as well as a few species present in abundances of more than 1,000 individuals, namely
Cape Barren Goose (Cereopsis novaehollandiae), Straw-necked Ibis (Threskiornis spinicollis) and
Silver Gull (Table 3). Over half of the birds were observed in Lake Alexandrina, a little under a third
were counted in Lake Albert and the remaining 8.6% were present in the Goolwa Channel and
related tributaries (Table 3). Lake Alexandrina also had the greatest species richness (45 species),
whereas Lake Albert and the Goolwa Channel and related tributaries supported 33 and 34 species
of birds, respectively.
4.3 Birds of listed conservation status
Of birds listed as ‘endangered’ by the International Union for Conservation of Nature (IUCN), only
the Far Eastern Curlew was found in the Coorong in January 2016, with only eight individuals
observed in the Murray Estuary (Table 2). The Fairy Tern and Hooded Plover, both listed as
‘vulnerable’ (IUCN), were found in the Coorong in January 2016, and while this included over
400 Fairy Terns, only seven Hooded Plovers were observed in the South Lagoon (Table 2).
11
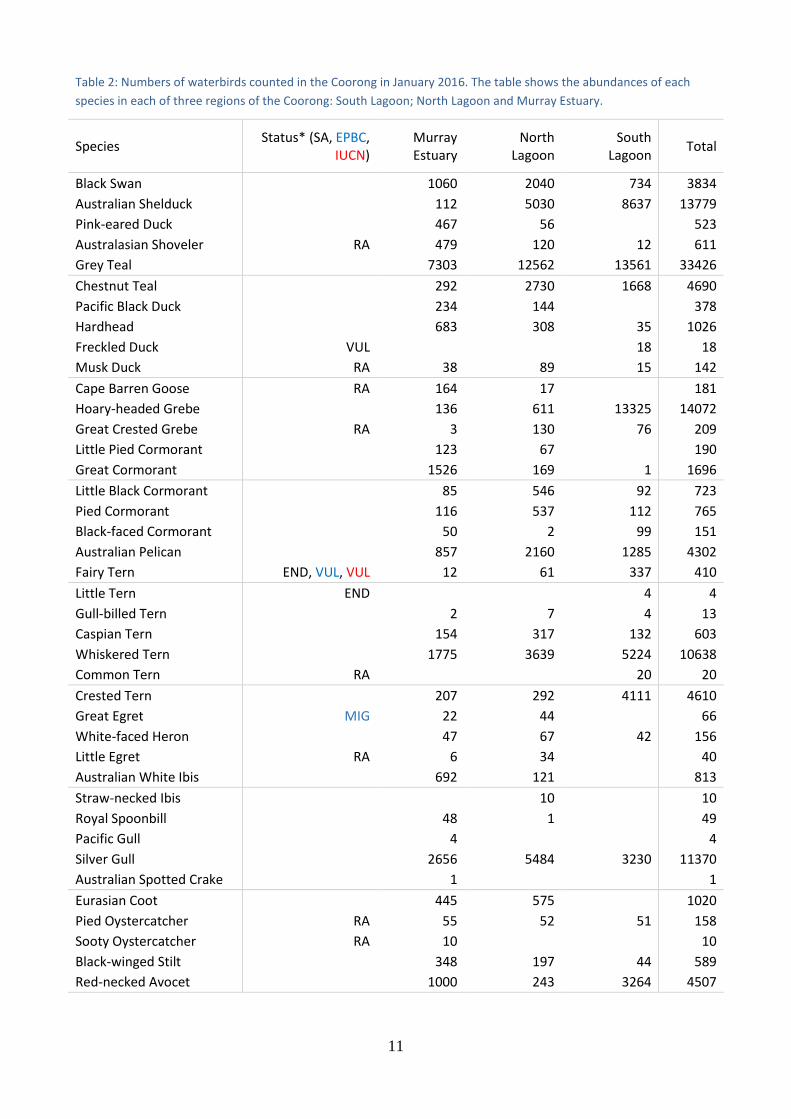
Table 2: Numbers of waterbirds counted in the Coorong in January 2016. The table shows the abundances of each
species in each of three regions of the Coorong: South Lagoon; North Lagoon and Murray Estuary.
Species Status* (SA, EPBC,
IUCN) Murray Estuary
North Lagoon
South Lagoon
Total
Black Swan
1060 2040 734 3834
Australian Shelduck
112 5030 8637 13779
Pink-eared Duck
467 56
523
Australasian Shoveler RA 479 120 12 611
Grey Teal
7303 12562 13561 33426
Chestnut Teal
292 2730 1668 4690
Pacific Black Duck
234 144
378
Hardhead
683 308 35 1026
Freckled Duck VUL
18 18
Musk Duck RA 38 89 15 142
Cape Barren Goose RA 164 17
181
Hoary-headed Grebe
136 611 13325 14072
Great Crested Grebe RA 3 130 76 209
Little Pied Cormorant
123 67
190
Great Cormorant
1526 169 1 1696
Little Black Cormorant
85 546 92 723
Pied Cormorant
116 537 112 765
Black-faced Cormorant
50 2 99 151
Australian Pelican
857 2160 1285 4302
Fairy Tern END, VUL, VUL 12 61 337 410
Little Tern END
4 4
Gull-billed Tern
2 7 4 13
Caspian Tern
154 317 132 603
Whiskered Tern
1775 3639 5224 10638
Common Tern RA
20 20
Crested Tern
207 292 4111 4610
Great Egret MIG 22 44
66
White-faced Heron
47 67 42 156
Little Egret RA 6 34
40
Australian White Ibis
692 121
813
Straw-necked Ibis
10
10
Royal Spoonbill
48 1
49
Pacific Gull
4
4
Silver Gull
2656 5484 3230 11370
Australian Spotted Crake
1
1
Eurasian Coot
445 575
1020
Pied Oystercatcher RA 55 52 51 158
Sooty Oystercatcher RA 10
10
Black-winged Stilt
348 197 44 589
Red-necked Avocet
1000 243 3264 4507
12
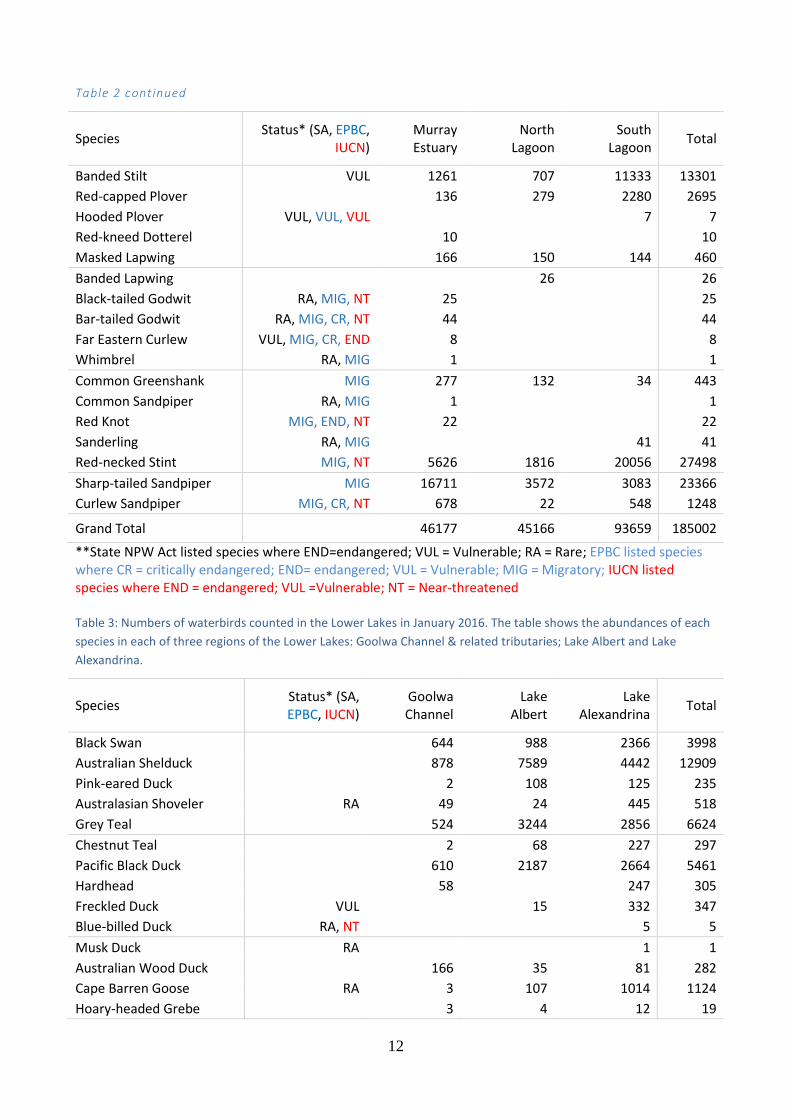
Table 2 continued
Species Status* (SA, EPBC,
IUCN) Murray Estuary
North Lagoon
South Lagoon
Total
Banded Stilt VUL 1261 707 11333 13301
Red-capped Plover
136 279 2280 2695
Hooded Plover VUL, VUL, VUL
7 7
Red-kneed Dotterel
10
10
Masked Lapwing
166 150 144 460
Banded Lapwing
26
26
Black-tailed Godwit RA, MIG, NT 25
25
Bar-tailed Godwit RA, MIG, CR, NT 44
44
Far Eastern Curlew VUL, MIG, CR, END 8
8
Whimbrel RA, MIG 1 1
Common Greenshank MIG 277 132 34 443
Common Sandpiper RA, MIG 1
1
Red Knot MIG, END, NT 22
22
Sanderling RA, MIG
41 41
Red-necked Stint MIG, NT 5626 1816 20056 27498
Sharp-tailed Sandpiper MIG 16711 3572 3083 23366
Curlew Sandpiper MIG, CR, NT 678 22 548 1248
Grand Total
46177 45166 93659 185002
**State NPW Act listed species where END=endangered; VUL = Vulnerable; RA = Rare; EPBC listed species where CR = critically endangered; END= endangered; VUL = Vulnerable; MIG = Migratory; IUCN listed species where END = endangered; VUL =Vulnerable; NT = Near-threatened Table 3: Numbers of waterbirds counted in the Lower Lakes in January 2016. The table shows the abundances of each
species in each of three regions of the Lower Lakes: Goolwa Channel & related tributaries; Lake Albert and Lake
Alexandrina.
Species Status* (SA, EPBC, IUCN)
Goolwa Channel
Lake Albert
Lake Alexandrina
Total
Black Swan
644 988 2366 3998
Australian Shelduck
878 7589 4442 12909
Pink-eared Duck
2 108 125 235
Australasian Shoveler RA 49 24 445 518
Grey Teal
524 3244 2856 6624
Chestnut Teal
2 68 227 297
Pacific Black Duck
610 2187 2664 5461
Hardhead
58
247 305
Freckled Duck VUL
15 332 347
Blue-billed Duck RA, NT
5 5
Musk Duck RA
1 1
Australian Wood Duck
166 35 81 282
Cape Barren Goose RA 3 107 1014 1124
Hoary-headed Grebe 3 4 12 19
13
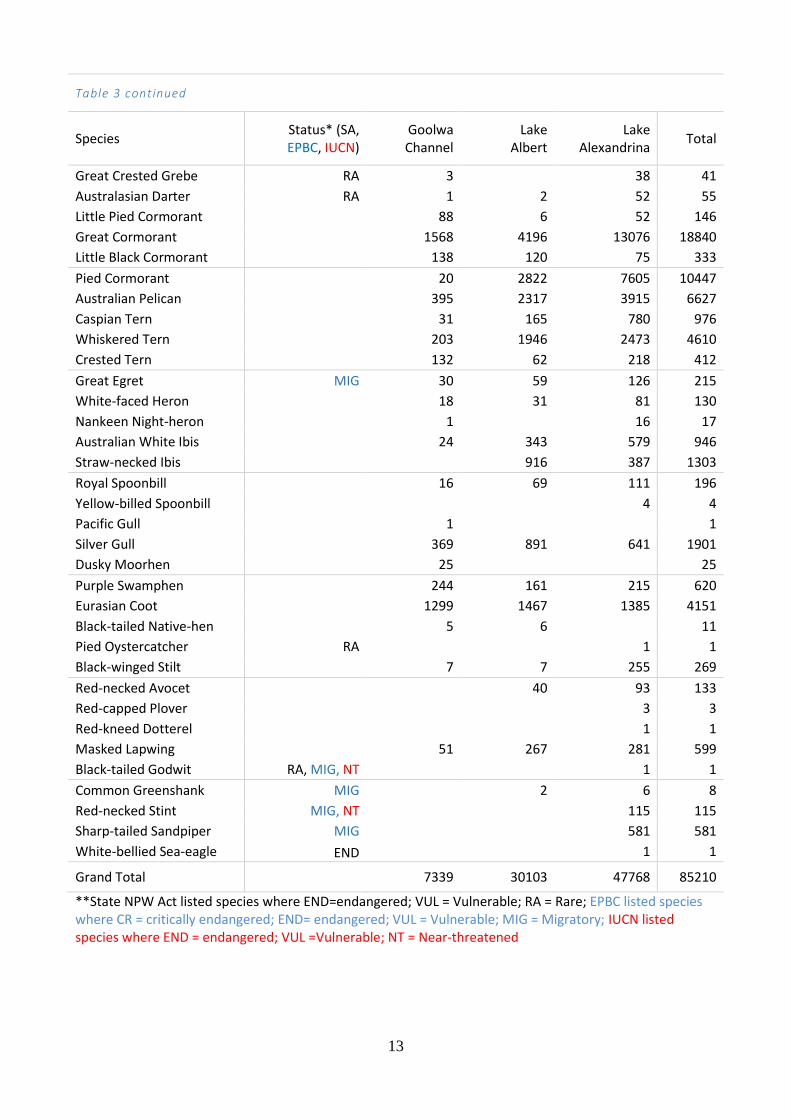
Table 3 continued
Species Status* (SA, EPBC, IUCN)
Goolwa Channel
Lake Albert
Lake Alexandrina
Total
Great Crested Grebe RA 3 38 41
Australasian Darter RA 1 2 52 55
Little Pied Cormorant
88 6 52 146
Great Cormorant
1568 4196 13076 18840
Little Black Cormorant
138 120 75 333
Pied Cormorant
20 2822 7605 10447
Australian Pelican
395 2317 3915 6627
Caspian Tern
31 165 780 976
Whiskered Tern
203 1946 2473 4610
Crested Tern
132 62 218 412
Great Egret MIG 30 59 126 215
White-faced Heron
18 31 81 130
Nankeen Night-heron
1
16 17
Australian White Ibis
24 343 579 946
Straw-necked Ibis
916 387 1303
Royal Spoonbill
16 69 111 196
Yellow-billed Spoonbill
4 4
Pacific Gull
1
1
Silver Gull
369 891 641 1901
Dusky Moorhen
25
25
Purple Swamphen
244 161 215 620
Eurasian Coot
1299 1467 1385 4151
Black-tailed Native-hen
5 6
11
Pied Oystercatcher RA
1 1
Black-winged Stilt
7 7 255 269
Red-necked Avocet
40 93 133
Red-capped Plover
3 3
Red-kneed Dotterel
1 1
Masked Lapwing
51 267 281 599
Black-tailed Godwit RA, MIG, NT
1 1
Common Greenshank MIG
2 6 8
Red-necked Stint MIG, NT
115 115
Sharp-tailed Sandpiper MIG
581 581
White-bellied Sea-eagle END
1 1
Grand Total
7339 30103 47768 85210
**State NPW Act listed species where END=endangered; VUL = Vulnerable; RA = Rare; EPBC listed species where CR = critically endangered; END= endangered; VUL = Vulnerable; MIG = Migratory; IUCN listed species where END = endangered; VUL =Vulnerable; NT = Near-threatened

14
However, six ‘near threatened’ IUCN listed species were observed in the Coorong and Lower
Lakes, namely Black-tailed Godwit (Limosa limosa), Bar-tailed Godwit (Limosa lapponica), Red Knot
(Calidris canutus), Blue-billed Duck (Oxyura australis), Red-necked Stint and Curlew Sandpiper,
with the two latter species exceeding 27,000 and 1200 birds, respectively (Table 2; Table 3).
Furthermore, under the Environment Protection and Biodiversity Conservation (EPBC) Act 1999,
the Far Eastern Curlew, Bar-tailed Godwit and Curlew Sandpiper are considered ‘critically
endangered’, while the Red Knot is listed as ‘endangered’ (Table 2).
Bar the Fairy Tern, Hooded Plover and Blue-billed Duck, the species listed above are considered
‘migratory’ under the Environment Protection and Biodiversity Conservation (EPBC) Act 1999
(Table 2; Table 3). Three other ‘migratory’ birds (EPBC) observed in the Coorong in January 2016
were also considered ‘rare’ under the South Australian National Parks and Wildlife (SANPW) Act
1972, namely Whimbrel, Common Sandpiper and Sanderling (Table 2). In addition, of most
concern under this South Australian listing in the Coorong and Lower Lakes is the Fairy Tern, Little
Tern and White-bellied Sea-eagle (listed as endangered) and, albeit to a lesser extent, Freckled
Duck, Banded Stilt, Hooded Plover and Far Eastern Curlew (listed as vulnerable) (Table 2; Table 3).
4.4 Abundances of waterbirds using the Coorong and Lower Lakes in 2016
compared to other years
Excluding species with less than a handful of birds counted, eleven species in the Coorong had
abundances in January 2016 that were at least half of their abundances in January 2015: Blue-
billed Duck, Cape Barren Goose, Little Black Cormorant (Phalacrocorax sulcirostris), Gull-billed
Tern, Straw-necked Ibis, Eurasian Coot, Red-necked Avocet, Pacific Golden Plover (Pluvialis fulva),
Sanderling (Calidris alba), Red-necked Stint and Curlew Sandpiper (Table 4). Of these, four are
migratory shorebirds, and, of these, both Curlew Sandpiper and Pacific Golden Plover did not meet
their respective long-term median targets in January 2016, along with another nine species (Table
4). Furthermore, not a single Pacific Golden Plover was sighted in the Coorong in January 2016.
Contrastingly, large increases in abundances in January 2016 compared to January 2015 were
observed for Banded Stilt and Hardheads, and to a lesser extent (albeit still with increases of
greater than 50%) Australian Shelduck, Grey Teal, Little Egret, Red-capped Plover and Sharp-tailed
Sandpiper (Table 4).
Most of the herbivorous species (Eurasian Coot, Black Swan and duck) exhibited marked increases
in abundances in January 2016 compared with January 2015 for the Lower Lakes (Table 5). Some
of the piscivores (Little Pied Cormorant, Caspian Tern and Great Egret), as well as Australian White
Ibis, Straw-necked Ibis, Black-winged Stilt, Red-necked Avocet, Red-necked Stint and Sharp-tailed
Sandpiper also had much greater abundances in January 2016 than January 2015 in the Lower
Lakes (Table 5). Only a few species showed a marked decline in numbers in January 2016
compared with January 2015 for the Lower Lakes, namely Great-crested Grebe, Yellow-billed
Spoonbill, Red-capped Plover and Curlew Sandpiper, although most of these are only usually
counted in small numbers in the Lower Lakes. Eight species of waterbird using the Lower Lakes in
January 2016 failed to surpass their 2013-15 medians (Table 5): Australian Shelduck, Hoary-
headed Grebe, Great Crested Grebe, Australasian Darter, Little Black Cormorant, Crested Tern,
Straw-necked Ibis and Royal Spoonbill.

15
Table 4: Abundance, Area of Occupation (AOO) and Extent of Occurrence (EOO) for waterbirds counted in the Coorong
in January 2016. The table lists all waterbird species recorded during January counts for 2016 and the two previous
years. The median abundances and target values for AOO and EOO are also given for the 40 species of waterbirds
regularly counted in the Coorong that are used to determine the whole of icon site score (WOISS), along with the
contribution that each of these species made to the 2016 WOISS. Abundances that fall below the long-term median
are indicated by red text, as are the AOOs and EOOs when these fall below the target value of 75% of the long-term
average AOO and EOO. The WOISS scores for individual species were determined by assigning a value of-1 if two of
the three counts over the last 3 years fell below the long-term median abundance, and -2 if all three counts fell below
the median. An additional -1 was added to the individual species score if the AOO or EOO fell below the target value
for these variables, and -2 if both targets for these variables were not met.
Species Abundance AOO EOO
WOISS 2014 2015 2016 Median 2016 Target 2016 Target
Black Swan 1966 3614 3834 1633 98 45 103 72 0
Australian Shelduck 13352 7597 13779 8426 154 96 101 74 0
Pink-eared Duck 131 516 523 13 20
Australasian Shoveler 48 1077 611 12 89
Grey Teal 87029 21748 33426 11846 172 93 103 76 0
Chestnut Teal 4880 4000 4690 7216 105 82 102 72 -2
Pacific Black Duck 453 657 378 223 29 14 31 47 -1
Hardhead 1570 34 1026 23 98
Freckled Duck 1 0 18 1 1
Blue-billed Duck 27 23 0
Musk Duck 61 263 142 171 18 14 86 62 -1
Cape Barren Goose 678 519 181 97 5 5 15 16 -2
Hoary-headed Grebe 4025 11907 14072 4218 81 50 99 70 0
Great Crested Grebe 135 147 209 199 39 26 94 53 -1
Little Pied Cormorant 114 186 190 258 40 26 51 39 -2
Great Cormorant 4703 2549 1696 1287 64 30 47 47 0
Little Black Cormorant 2433 3765 723 1253 55 26 96 49 0
Pied Cormorant 760 766 765 271 72 34 96 49 0
Black-faced Cormorant 143 139 151 130 19 5 85 50 0
Australian Pelican 5122 3616 4302 3410 170 100 99 75 0
Fairy Tern 347 406 410 337 29 26 92 57 0
Little Tern 2 0 4 3 30
Gull-billed Tern 17 29 13 4 70
Caspian Tern 973 680 603 598 101 52 99 63 0
Whiskered Tern 8966 7850 10638 5360 202 120 99 73 0
Common Tern 66 25 20 3 7
Crested Tern 3075 3697 4610 3897 80 50 97 70 -1
Great Egret 203 61 66 36 27 20 43 40 0
White-faced Heron 204 160 156 156 72 45 102 75 0
Nankeen Night Heron 5 0 0
Glossy Ibis 0 7 0
Little Egret 26 24 40 7 15 4 60 35 0
Australian White Ibis 1022 709 813 300 57 22 46 27 0
Straw-necked Ibis 340 69 10 25 2 2 17 15 -1
Royal Spoonbill 100 96 49 22 9 5 32 24 0
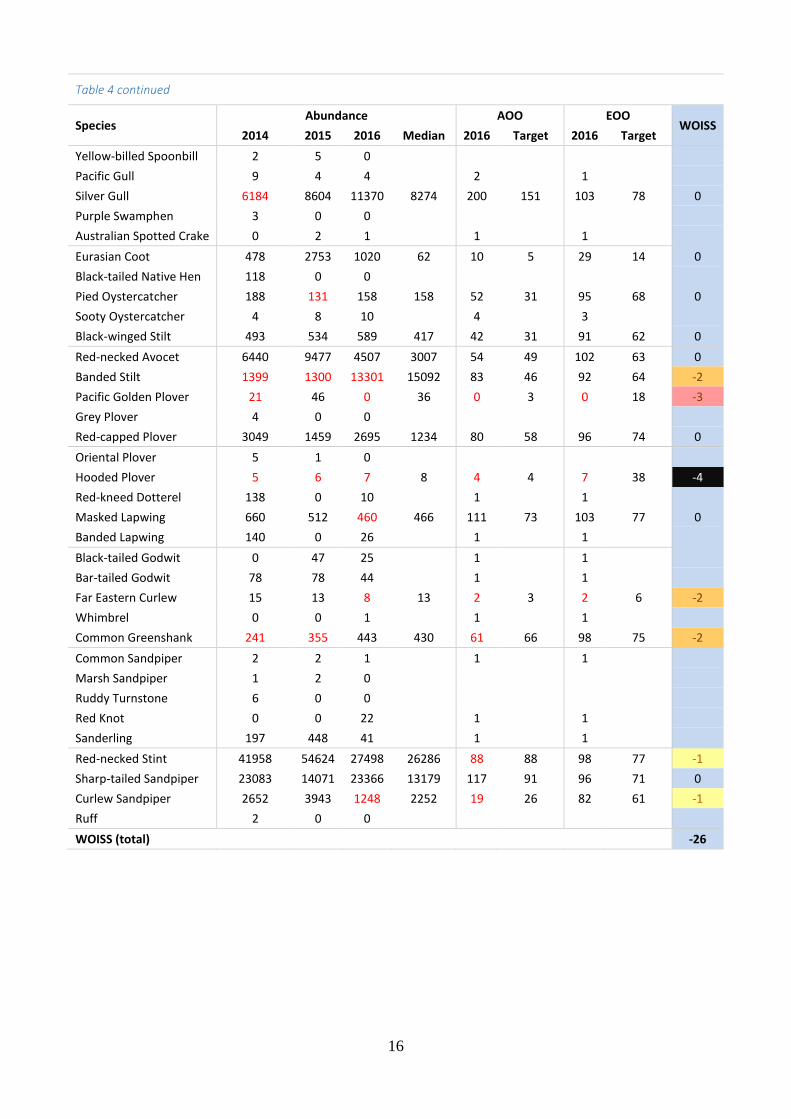
16
Table 4 continued
Species Abundance AOO EOO
WOISS 2014 2015 2016 Median 2016 Target 2016 Target
Yellow-billed Spoonbill 2 5 0
Pacific Gull 9 4 4 2 1
Silver Gull 6184 8604 11370 8274 200 151 103 78 0
Purple Swamphen 3 0 0
Australian Spotted Crake 0 2 1 1 1
Eurasian Coot 478 2753 1020 62 10 5 29 14 0
Black-tailed Native Hen 118 0 0
Pied Oystercatcher 188 131 158 158 52 31 95 68 0
Sooty Oystercatcher 4 8 10 4 3
Black-winged Stilt 493 534 589 417 42 31 91 62 0
Red-necked Avocet 6440 9477 4507 3007 54 49 102 63 0
Banded Stilt 1399 1300 13301 15092 83 46 92 64 -2
Pacific Golden Plover 21 46 0 36 0 3 0 18 -3
Grey Plover 4 0 0
Red-capped Plover 3049 1459 2695 1234 80 58 96 74 0
Oriental Plover 5 1 0
Hooded Plover 5 6 7 8 4 4 7 38 -4
Red-kneed Dotterel 138 0 10 1 1
Masked Lapwing 660 512 460 466 111 73 103 77 0
Banded Lapwing 140 0 26 1 1
Black-tailed Godwit 0 47 25 1 1
Bar-tailed Godwit 78 78 44 1 1
Far Eastern Curlew 15 13 8 13 2 3 2 6 -2
Whimbrel 0 0 1 1 1
Common Greenshank 241 355 443 430 61 66 98 75 -2
Common Sandpiper 2 2 1 1 1
Marsh Sandpiper 1 2 0
Ruddy Turnstone 6 0 0
Red Knot 0 0 22 1 1
Sanderling 197 448 41 1 1
Red-necked Stint 41958 54624 27498 26286 88 88 98 77 -1
Sharp-tailed Sandpiper 23083 14071 23366 13179 117 91 96 71 0
Curlew Sandpiper 2652 3943 1248 2252 19 26 82 61 -1
Ruff 2 0 0
WOISS (total) -26

17
Table 5: Abundance, Area of Occupation (AOO) and Extent of Occurrence (EOO) for waterbirds counted in the Lower
Lakes in January 2016. The table lists all waterbird species recorded during January counts for 2016 and the two
previous years. The median abundances and target values for AOO and EOO are also given for the 25 species of
waterbirds regularly counted in the Lower Lakes that are used to determine the whole of icon site score (WOISS),
along with the contribution that each of these species made to the 2016 WOISS. Abundances that fall below the
recent median are indicated by red text, as are the AOOs and EOOs when these fall below the target value of 75% of
the recent average AOO and EOO. The WOISS scores for individual species were determined by assigning a value of-1
if two of the three counts over the last 3 years fell below the long-term median abundance, and -2 if all three counts
fell below the median. An additional -1 was added to the individual species score if the AOO or EOO fell below the
target value for these variables, and -2 if both targets for these variables were not met.
Species Abundance AOO EOO
WOISS 2014 2015 2016 Median 2016 Target 2016 Target
Black Swan 2700 1692 3998 1799 210 150 1625 1239 0
Australian Shelduck 20764 13249 12909 13249 172 137 1483 1186 0
Pink-eared Duck 84 30 235 9 1032
Australasian Shoveler 143 252 518 9 510
Grey Teal 3912 1023 6624 3912 100 67 1671 1183 0
Chestnut Teal 51 56 297 19 589
Pacific Black Duck 7376 4538 5461 4981 220 162 1688 1275 0
Hardhead 2205 41 305 18 275
Freckled Duck 129 56 347 6 233
Blue-billed Duck 3 0 5 1 1
Musk Duck 42 0 1 1 1
Australian Wood Duck 70 7 282 19 1394
Cape Barren Goose 1010 853 1124 1010 20 27 1032 781 -1
Australasian Grebe 11 0 0
Hoary-headed Grebe 103 3 19 103 6 8 554 538 -2
Great Crested Grebe 128 75 41 128 18 30 879 733 -2
Australasian Darter 32 73 55 73 24 22 647 643 -1
Little Pied Cormorant 84 53 146 84 44 31 1114 1038 0
Great Cormorant 12828 14963 18840 14963 327 228 1654 1285 0
Little Black Cormorant 1025 412 333 907 54 63 1183 1092 -2
Pied Cormorant 8463 8759 11187 8759 254 171 1421 1154 0
Black-faced Cormorant 29 0 0
Australian Pelican 6239 7203 6627 6239 335 229 1732 1297 0
Caspian Tern 609 583 976 609 125 82 1562 1131 0
Whiskered Tern 4497 3610 4622 4497 340 268 1672 1291 0
Common Tern 0 1 0
Crested Tern 335 490 412 490 114 69 1463 1071 -1
White-necked Heron 1 0 0
Great Egret 133 51 215 133 58 73 1446 961 -1
White-faced Heron 119 96 130 119 69 48 1577 1196 0
Nankeen Night Heron 12 5 17 2 1
Glossy Ibis 0 22 0
Little Egret 2 0 0
Australian White Ibis 899 508 946 611 94 80 1499 1245 0
Straw-necked Ibis 2136 239 1333 1620 38 27 1137 992 -1

18
Table 5 continued
Species Abundance AOO EOO
WOISS 2014 2015 2016 Median 2016 Target 2016 Target
Royal Spoonbill 209 215 201 209 38 22 1379 1004 0
Yellow-billed Spoonbill 25 11 4 2 2
White-bellied Sea-eagle 1 2 1 1 1
Pacific Gull 0 0 1 1 1
Silver Gull 1172 1823 1901 1823 122 74 1514 1133 0
Purple Swamphen 448 463 620 463 127 83 1521 1166 0
Australian Spotted Crake 2 0 0
Dusky Moorhen 25 32 25 5 4
Eurasian Coot 3339 2492 4151 3339 118 114 1622 1233 0
Black-tailed Native Hen 78 0 11 4 63
Pied Oystercatcher 0 0 1 1 1
Black-winged Stilt 65 85 269 18 925
Red-necked Avocet 0 0 133 4 209
Banded Stilt 8 0 0
Red-capped Plover 7 15 3 1 1
Black-fronted Dotterel 4 0 0
Red-kneed Dotterel 93 0 3 1 1
Masked Lapwing 587 565 599 565 94 56 1654 1170 0
Banded Lapwing 45 0 0
Latham's Snipe 1 0 0
Black-tailed Godwit 0 1 1 0 0
Common Greenshank 4 10 8 6 415
Common Sandpiper 1 0 0
Marsh Sandpiper 10 4 0
Wood Sandpiper 9 1 0
Red-necked Stint 6 30 115 3 6
Sharp-tailed Sandpiper 88 214 581 11 395
Curlew Sandpiper 0 52 0
WOISS (total) -11
4.5 AOO and EOO for waterbirds using the Coorong and Lower Lakes in 2016
The areas of occupation (AOO) and extents of occurrence (EOO) for all of the waterbird species
counted in the Coorong and Lower Lakes during the 2016 census are provided in Table 4 and Table
5, respectively.
AOOs and EOOs provide measures of the distribution of the different bird species within these two
wetland systems and can also be used to assess the status and changes in status of species over
time. The EOO measures the spread of a species while the AOO indicates the amount of area being
used by a species. Species with a high EOO are widely distributed across a wetland, while those
with a low EOO may have a restricted distribution which may indicate specific habitat
requirements. A high AOO indicates that most of the wetland is being used by a species while a
low AOO indicates that only a small portion of the wetland is being used, perhaps because specific

19
habitat needs are rarely met. Alternatively, species with a low AOO may aggregate in flocks and so
only occupy a few areas at any one time, or the species has a low abundance overall resulting in
few areas being used.
For the Coorong, 31 species used all three wetland components (estuary, north and south lagoons)
in January 2016 (Table 2) and so had high EOOs, with 29 species spread over at least 80 km of the
Coorong (Table 4). For AOOs, five species were recorded at more than 150 locations (cells) within
the Coorong, and a further ten species were detected at 80 or more locations. For the Lower
Lakes, 24 species had EOOs in excess of 1000 km2 (Table 5). These species were mainly waterfowl
(e.g., ducks) and fish-eating species (e.g., cormorants) but also included Australian White Ibis,
Straw-necked Ibis, Silvergull, Purple Swamphen, Eurasian Coot and Masked Lapwing. Waterbirds,
however, only use the margins of the Lower Lakes and, as the EOO is calculated as the minimum
convex polygon that includes all records, much of the area included in the EOO is not used.
Thirteen of these 24 species were counted in at least 100 of the 1km x 1km cells, and three of
these were counted in excess of 300 cells (Great Cormorant, Australian Pelican and Whiskered
Tern) (Table 5). Of the species with EOOs of less than 1000 km2, none were detected in more than
25 of the 1 km x 1 km cells (Table 5). The EOO and AOO can provide useful information on changes
in distribution and abundance. For example, the EOO, AOO and abundance of Purple Swamphens
all increased as this species re-established across the Lower Lakes, with distributions expanding as
the abundances increased (Figure 1). All three variables have been relatively constant since 2013,
suggesting that the species has returned to pre-drought levels for both abundance and
distribution.
Although both the EOO and AOO allow quantitative comparisons, simply considering these on
their own can miss important patterns in the distributions of the birds that are only revealed when
the distributions and abundances are mapped. For example, there were differences in the
distributions of Little Black, Great, Pied and Little Pied Cormorants in the Coorong and Lower Lakes
in January 2016 (Figure 2). Little Black and Pied Cormorants extended their distribution into the
southern Coorong, while Great and Little Pied Cormorants were restricted to the northern
Coorong. Pied and Great Cormorants were abundant and widespread around the shores of the
Lower Lakes, while the other two smaller species, Little Black and Little Pied Cormorants, were
more patchily distributed around the Lower Lakes (Figure 2). Another example is the distribution
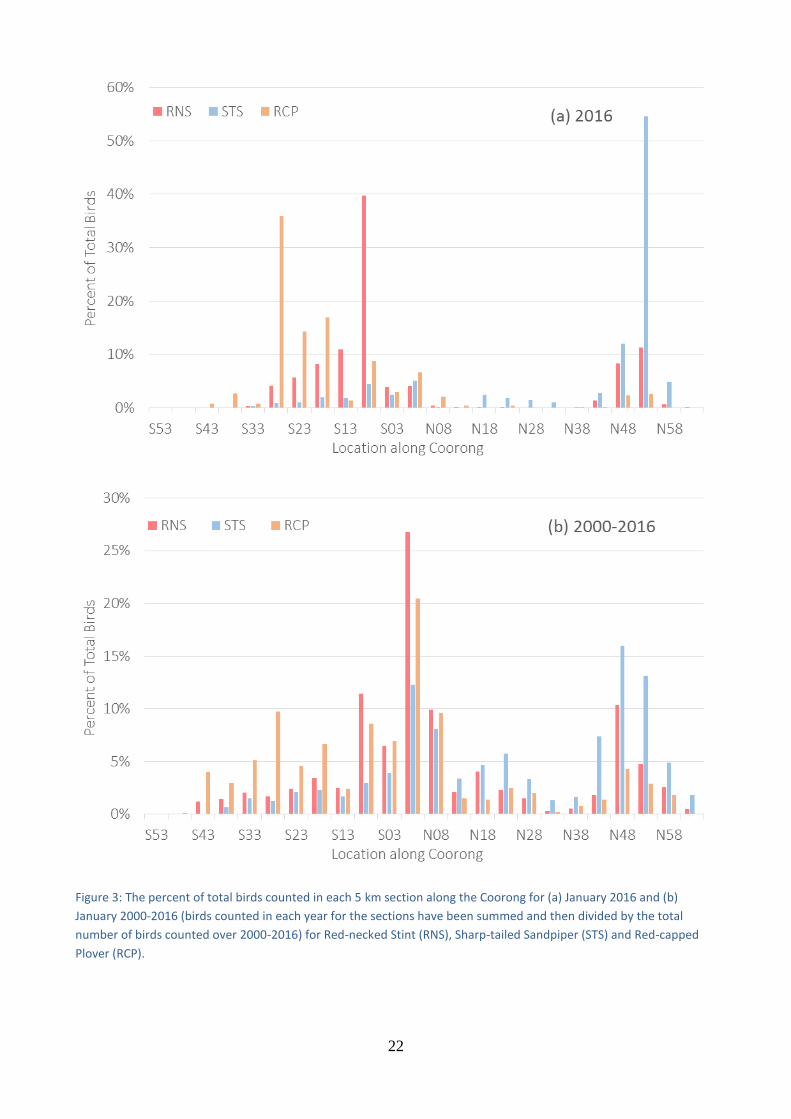
of three small shorebirds using the Coorong. Red-necked Stints, although widespread in the
Coorong, predominantly aggregate in large numbers around the junction of the two lagoons,
where there are extensive mudflats and areas with better Ruppia tuberosa populations (Figure 3;
and Section 4.11). Sharp-tailed Sandpipers, while also favouring this area more so than other parts
of the Coorong (although not as much in January 2016), are most prominent in the northern
estuarine area of the Coorong (as was the case particularly in January 2016), which is also
favoured by Red-necked Stint, albeit not to the same extent (Figure 3). Red-capped Plovers,
however, are more prominent along the shores of the South Lagoon, which was particularly true
for January 2016 (Figure 3). These differences in distribution indicate the need to provide a
diversity of wetland habitats within the Coorong.

20
Figure 1: The number of Purple Swamphen in the Lower Lakes during the January census from 2009 to 2016 (primary axis), Figure 1: The number of Purple Swamphen in the Lower Lakes during the January census from 2009 to 2016 (primary axis), along with their extent of occurrence as an area in km2 (primary axis) and their area of occupation (secondary axis).
4.6 Whole of Icon Site Score (WOISS) for waterbird populations in the Coorong
for January 2016
The Whole of Icon Site Score (WOISS) for the Coorong in January 2016 was -26 (Table 4). While the
2016 score is a little worse than the 2015 score, in general there has been a steady improvement
in the WOISS since 2011 (Figure 4), so that it is now comparable to that in January 2002 and 2003,
prior to an extended period (2002-2010) when negligible volumes of water were released over the
barrages. Of the species contributing to the WOISS for the Coorong, Chestnut Teal, Curlew
Sandpiper, Musk Duck, Pacific Golden Plover and Far Eastern Curlew are species that had smaller
distributions and/or abundances over the last three years and are of concern. Several other
species, including Banded Stilt, Hooded Plover and Little Pied and Little Black Cormorants, have
failed to meet their species targets for abundance, AOO and/or EOO in recent years but are not of
such concern given that these species are known to use other nearby (Lower Lakes, ocean beach),
or more distant, wetlands. However Little Black Cormorants were also less abundant in the Lower
Lakes in 2016.
4.7 Whole of Icon Site Score (WOISS) for waterbird populations in the Lower
Lakes for January 2016
The Whole of Icon Site Score (WOISS) for the Lower Lakes in January 2016 was -11 (Table 5). This
was comparable to January 2015, when the WOISS was -12. Three species contributed more than
half of the score to the WOISS for the Lower lakes: Great Crested Grebe, Hoary-headed Grebe and
Little Black Cormorant. All three species have failed to meet their abundance targets in the last

21
Figure 2: Distributions and abundances of Little Black Cormorant, Pied Cormorant, Great Cormorant and Little Pied
Cormorant in the Coorong and Lower Lakes in January 2016.
22
Figure 3: The percent of total birds counted in each 5 km section along the Coorong for (a) January 2016 and (b)
January 2000-2016 (birds counted in each year for the sections have been summed and then divided by the total
number of birds counted over 2000-2016) for Red-necked Stint (RNS), Sharp-tailed Sandpiper (STS) and Red-capped
Plover (RCP).

23
Figure 4: Changes in the whole of icon site score (WOISS) for waterbirds using the Coorong in January from 2002 to
2016. See Table 4 for the individual species and their scores used in calculated the WOISS in 2016.
two years and had reduced areas of occupation in 2016. These three species largely consume
small fish and reduced abundances may reflect a shift in the availability of suitably-sized small fish.
While diminished small-fish resource availability is supported by the contribution of three other
piscivores to the Lower Lakes WOISS (Australasian Darter, Crested Tern and Great Egret), other
piscivores were, if anything, more abundant in 2016 than the previous year (Table 5).
The WOISS calculated for waterbirds using the Lower Lakes is not comparable to the WOISS
calculated for waterbirds using the Coorong because of differences in the range and number of
species used in the calculations. The Coorong WOISS is based on 40 species while the WOISS for
the Lower Lakes is based on 25 species. On a ‘per species’ basis, the average contribution of the 40
species contributing to the WOISS for the Coorong in 2016 was -0.65 compared to -0.44 for the 25
species contributing to the Lower Lakes WOISS in 2016, meaning that the WOISS score for the
Coorong was relatively poorer than for the Lower Lakes.
4.8 Comparison of the waterbird communities of the Coorong and Lower Lakes
for 2016
There were substantial differences in the waterbird communities using the Lower Lakes and those
using the Coorong in 2016 (Table 4; Table 5) that were consistent with recent years (Paton &
Bailey 2013, 2014; Paton et al. 2015a). The waterbird community of the Lower Lakes was
dominated by various fish-eating species (Australian Pelican, Great Cormorant, Pied Cormorant
and Whiskered Tern) and several largely herbivorous waterfowl (Australian Shelduck, Pacific Black
Duck, Grey Teal, Black Swan and Eurasian Coot). The Coorong also had prominent piscivorous and
herbivorous waterbird species, but with some differences. In the Coorong, the prominent
fish-eating species were the Australian Pelican, Hoary-headed Grebe, Whiskered Tern and Crested
24
Tern, with smaller numbers of cormorants compared to the Lower Lakes. Black Swan, Australian
Shelduck, Grey Teal and Chestnut Teal were the prominent herbivorous species in the Coorong.
The major difference in the waterbird communities of the two wetland systems was the large
numbers of shorebirds including migratory species that used the Coorong but were largely absent
from the Lower Lakes. Prominent shorebird species in the Coorong in January 2016 were Banded
Stilt, Black-winged Stilt, Red-necked Avocet, Red-capped Plover, Red-necked Stint, Curlew
Sandpiper and Sharp-tailed Sandpiper. The near absence of these species from the Lower Lakes
reflects the absence of suitable habitat in the Lower Lakes when water levels in the Lower Lakes
are maintained at or above 0.5 m AHD.
4.9 Waterbird breeding in the Coorong and Lower Lakes in January 2016
The Coorong is an important breeding ground for colonies of Fairy Terns and supports other
colonial nesting birds, such as Australian Pelican, Crested Tern and Caspian Tern. In January 2016,
relatively good numbers of Fairy Tern and Crested Tern were observed breeding on islands in the
South Lagoon, but breeding for Australian Pelican and Caspian Tern was relatively poor compared
with recent years (Paton & Paton 2016). In January 2016, two dependent Hooded Plover chicks
were also seen in the South Lagoon near Salt Creek, while a pair of Gull-billed Terns (Gelochelidon
nilotica) with a large runner was observed on an island in the South Lagoon.
The Lower Lakes also provide breeding grounds for certain bird species (Figure 5). Notably during
the census of the Lower Lakes in 2016, four colonies of Pied Cormorants were observed (Figure 5),
with a total of 1600 chicks, plus 25 dead chicks, and 300 nests with eggs. The colony of Pied
Cormorants in Lake Albert also had 250 Straw-necked Ibis fledglings and 30 Straw-necked Ibis
chicks, two Australian White Ibis nests with a total of three chicks, and a Royal Spoonbill nest with
two chicks. Three locations in Lake Alexandrina were also used by Royal Spoonbill for breeding
(Figure 5); one had 3 chicks, another had one nest with two chicks, while the third had six nests
(although three were empty) with a total of three chicks and an egg. In addition, three Juvenile
Purple Swamphen were observed in the Goolwa Channel, two Red-kneed Dotterel chicks were
observed in Tolderol and 79 cygnets were observed throughout the Lower Lakes during the census
in January-February 2016 (Figure 5).
4.10 Waterbird foraging levels
Waterbird species using the Coorong in January 2016 differed with respect to the percentages of
birds that were foraging when detected. In general, fish-eating species had low percentages of
foraging birds (Table 6), indicating that little time was needed to harvest the food they needed and
that food resources were easily harvested. That several fish-eating species (terns and Australian
Pelican) were also breeding in the Coorong in January 2016 is consistent with an abundance of
food. In contrast, most of the shorebirds (stilts, stints, sandpipers) using the Coorong were
foraging when counted, indicating that their food resources were poor. For Black-winged Stilt,
Banded Stilt, Red-necked Stint, Sharp-tailed Sandpiper and Curlew Sandpiper, more than 70% of
the birds were foraging during the January 2016 census (Table 6). For two other species of
shorebird (Red-capped Plover and Common Greenshank), in excess of 60% of the birds counted
were foraging. These patterns in numbers of birds that were foraging, and hence the amount of

25
Figure 5: Locations of breeding birds (SNI = Straw-necked Ibis, RS = Royal Spoonbill, RKD = Red-kneed Dotterel, PSH =
Purple Swamphen, PCO = Pied Cormorant, AWI = Australian White Ibis) and sightings of Black Swan cygnets in the
Lower Lakes in January 2016.
time allocated to foraging by different species, was consistent with data collected in previous
years (Table 6). Furthermore, in January 2016, as has occurred in previous years over the last 8-10
years, dead shorebirds were detected along the shores and on some of the islands in the southern
Coorong (e.g., Paton 2016; Figure 6). The dead birds were emaciated and their stomachs were
empty, suggesting that they had starved.
All day observations of birds at selected sites along the Coorong (during the behavioural waterbird
surveys) also confirmed that most shorebirds allocated a high proportion of time to foraging, while
piscivores spent much less time foraging (Table 7). These observations also highlighted that some
of the largely herbivorous species (i.e., Black Swan, Australian Shelduck, Pacific Black Duck and
Grey Teal) were foraging in excess of 60% of the day in January 2016, suggesting their food
resources were also poor. The percent of time allocated to foraging by these species was much
lower during counts (Table 6), with the likely explanation being that these waterbirds are easily
disturbed and so stop foraging as people or boats approach them during the census.
Lake Albert
Lake Alexandrina

26
Table 6: Percent of birds that were foraging when detected during the census of waterbirds in the Coorong in January
from 2006 to 2016, for species where more than 100 individuals were detected and assigned a behavioural activity.
Those species where 70% or more of the birds were foraging are shaded in dark pink (with white text), and those with
50-69% of the birds foraging are shaded in pale pink. The amount of foraging is likely to be related to the quality of the
habitat, such that if 70% or more of the birds are foraging the habitat quality and associated food resources are poor.
Species 2006 2007 2008 2009 2010 2011 2012 2013 2014 2015 2016
Black Swan 35 30 46 57 24 17 21 30 20 26 20
Australian Shelduck 13 14 14 9 24 4 11 5 21 19 19
Grey Teal 11 22 7 7 30 0 18 24 14 14 19
Chestnut Teal 8 9 12 4 36 0 15 3 6 22 12
Pacific Black Duck 65 21 15 31 38 31 11 12 19 48 27
Musk Duck 25 10 95 52 44 38 57 58 77 19 27
Hoary-headed Grebe 99 90 81 35 73
67 66 62 64 14
Great Crested Grebe 60 85 14 17 59 0 77 48 73 54 56
Great Cormorant 7 1 13 2 1 18 13 14 1 3 3
Little Black Cormorant 65 1 5 22 0 1 38 2 2 9 3
Pied Cormorant 23 3 18 25 8 22 17 4 9 11 10
Australian Pelican 13 3 10 21 3 11 7 6 11 14 16
Fairy Tern 20 16 26 34 83 3 13 7 8 15 17
Caspian Tern 8 2 16 8 7 23 16 12 12 16 16
Whiskered Tern 47 33 36 42 29 0 40 33 34 33 28
Crested Tern 3 0 1 0 0 8 5 1 1 6 2
White-faced Heron 44 16 36 30 9 27 22 43 27 33 32
Australian White Ibis 58 64 57 32 29 19 59 57 58 68 76
Silver Gull 16 24 26 31 25 23 24 29 27 34 21
Eurasian Coot 2 21 33 19 57 6
Black-winged Stilt 27 80 67 58 64 57 39 67 70 81 75
Red-necked Avocet 31 46 48 14 22 25 30 51 61 78 37
Banded Stilt 65 53 72 98 82 68 79 89 78 75 81
Red-capped Plover 51 50 74 49 66 61 77 84 86 77 61
Masked Lapwing 11 7 18 12 20 7 6 16 14 17 44
Common Greenshank 62 58 64 46 27 16 48 51 57 63 64
Red-necked Stint 75 72 80 60 30 41 85 92 84 88 77
Sharp-tailed Sandpiper 60 67 72 62 47 47 73 90 89 72 87
Curlew Sandpiper 76 79 96 98 64 69 78 96 41 60 84
A similar data set was also collected during the census for the Lower Lakes but only three species
spent more than 50% of their time foraging in 2016: Australian White Ibis, Purple Swamphen and
Eurasian Coot (Table 8). All the other species were typically spending less than 40% of the daylight
hours foraging, indicating that food resources were meeting their requirements.
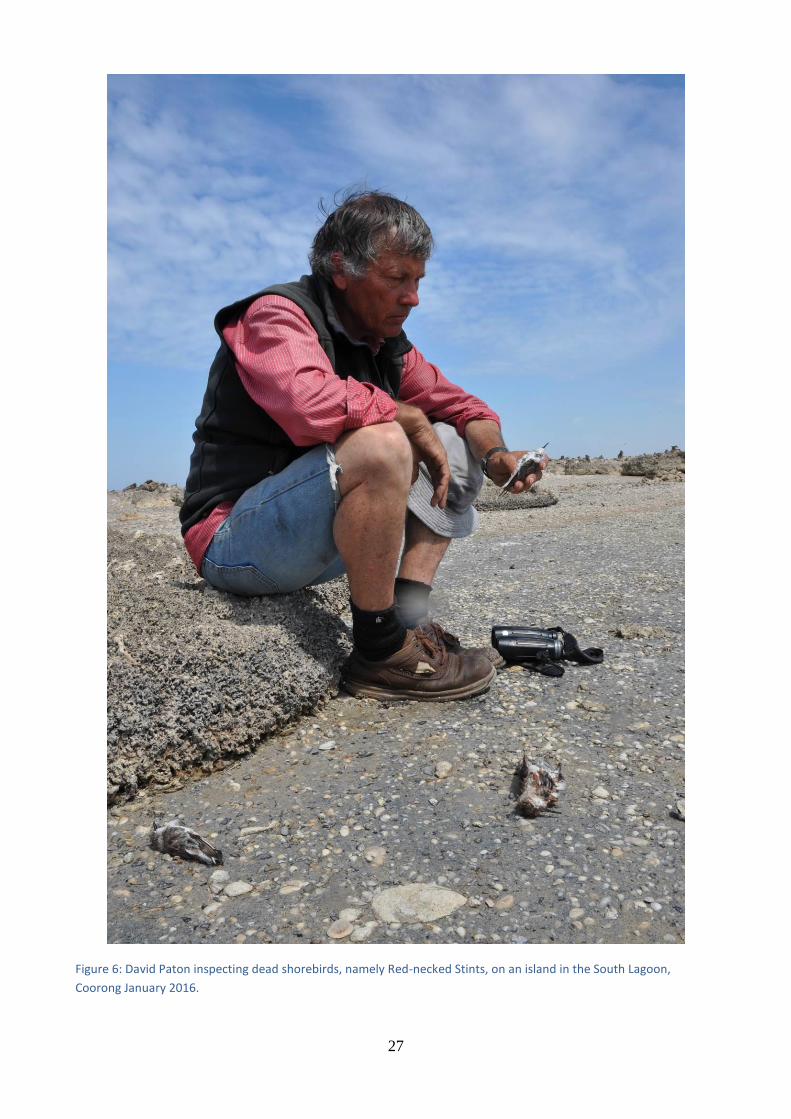
27
Figure 6: David Paton inspecting dead shorebirds, namely Red-necked Stints, on an island in the South Lagoon,
Coorong January 2016.

28
Table 7: Percent of birds that were foraging over the course of a day in the Coorong in January from 2007 to 2016, for
species where more than 100 individuals were detected and assigned a behavioural activity during that day at a
particular site. Data were collected during behavioural bird surveys from across 10 sites spread along the length of the
Coorong from the Northern section of the Murray Estuary to Salt Creek in the South Lagoon, with at least seven of
these sites sampled in any one year. Those species where 70% or more of the birds were foraging are shaded in dark
pink (with white text), and those with 50-69% of the birds foraging are shaded in pale pink. The amount of foraging is
likely to be related to the quality of the habitat, such that if 70% or more of the birds are foraging the habitat quality
and associated food resources are poor.
Species 2007 2008 2009 2011 2012 2013 2014 2015 2016
Black Swan 63 89 66 46 32 81 60 85 67
Australian Shelduck 8 5
4 10 7 10 10 64
Grey Teal 36 2 48 8 58 46 43 37 70
Chestnut Teal 51 27 57 9 11 31 62 44 48
Pacific Black Duck 77 12
21
66 79 73
Musk Duck 8 0 8 98
51 30 1
Hoary-headed Grebe 35 59
34 43 71 42 37
Great Crested Grebe 62 11
47 30 39 Great Cormorant 0 3 0 2 0 2 0 9 4
Little Black Cormorant 0
16 26 19 1
10
Pied Cormorant 0
2
7 Australian Pelican 2 0 1 13 20 4 14 4 5
Fairy Tern 3 3 0 0
0
46 Caspian Tern 1 3
58 29 2 7 12 1
Whiskered Tern 8 13 8
33 21 29 18 18
Crested Tern 0 0 0 19 8 4 2 0 0
White-faced Heron 67
61 36 74 Australian White Ibis 88 96
37
80 91 94
Silver Gull 17 22 15 19 9 13 23 27 23
Eurasian Coot
30 78
85
Black-winged Stilt 64 80 92
81 71 77 70 73
Red-necked Avocet 51
27 45 53 54 44 20
Banded Stilt 84 99
80 83 84 78 72 81
Red-capped Plover 58 15
76 74 53 18 68
Masked Lapwing 37
14 17 37 39 17 15
Common Greenshank 29 72 75 55 62 63 64 63 48
Red-necked Stint 73 27 76 33 92 90 95 60 81
Sharp-tailed Sandpiper 74 75 47
86 97 94 69 79
Curlew Sandpiper 72
99
59 94 11 97

29
Table 8: Percent of birds that were foraging when detected during the census of waterbirds in the Lower Lakes in
January from 2009 to 2016, for species where more than 100 individuals were detected and assigned a behavioural
activity. Those species where 70% or more of the birds were foraging are shaded in dark pink (with white text), and
those with 50-69% of the birds foraging are shaded in pale pink. The amount of foraging is likely to be related to the
quality of the habitat, such that if 70% or more of the birds are foraging the habitat quality and associated food
resources are poor.
Species 2009 2011 2012 2013 2014 2015 2016
Black Swan 46 38 16 20 8 20 24
Australian Shelduck 18 19 7 9 13 29 8
Grey Teal 33 1 3 17 20 7 13
Pacific Black Duck 11 3 14 21 13 17 10
Cape Barren Goose 20 19 41 58 54 66 44
Great Cormorant 1 24 27 3 8 21 20
Little Black Cormorant 4 4 14 12 2 12 6
Pied Cormorant 7 6 13 12 11 13 13
Australian Pelican 22 11 6 13 5 14 11
Caspian Tern 11 40 29 12 27 19 16
Whiskered Tern 22
51 60 51 49 41
Crested Tern 17 23 38 9 31 38 36
Great Egret 39 22 27 37 16
38
White-faced Heron
8 48 32 35
38
Australian White Ibis 40 14 37 55 25 55 60
Straw-necked Ibis 3 6 28 13 9 60 37
Royal Spoonbill 1 4 8 29 8 5 28
Silver Gull 26 6 3 4 6 9 5
Purple Swamphen
57 59 63 56 54
Eurasian Coot 77
34 53 40 45 52
Masked Lapwing 32 5 8 8 16 18 18
4.11 Ecological conditions and food resources in the Coorong in January 2016
In January 2016, salinities of the Murray estuary of the Coorong ranged from 34-43 gL-1, while for
the North Lagoon salinities increased gradually southwards from 43 gL-1 at Long Point to 141 gL -1
at Magrath Flat (Figure 7). There was no gradient of salinities in the South Lagoon with salinities
varying between 125 gL-1 and 147 gL-1 (Figure 7). These salinities were higher than the previous six
years but were still lower than salinities recorded from January 2007 through January 2010 (Figure
7).
The distributions and abundances of key aquatic foods used by waterbirds within the Coorong in
January 2016 were similar to those of the previous five years. Polychaetes continued to be
prominent in the North Lagoon but in general were less abundant than previous years, particularly
in comparison to abundances in January 2015 (Figure 8). Polychaetes were absent from Magrath
Flat in January 2016 (54 km from the Murray Mouth, Figure 8), despite being present at this site in
the previous year. Chironomid larvae continued to be widely distributed throughout the southern
Coorong from at least Magrath Flat southwards (Figure 9). Abundances of chironomid larvae were
greatest in the northern parts of the South Lagoon (Figure 9). Several other aquatic invertebrates,
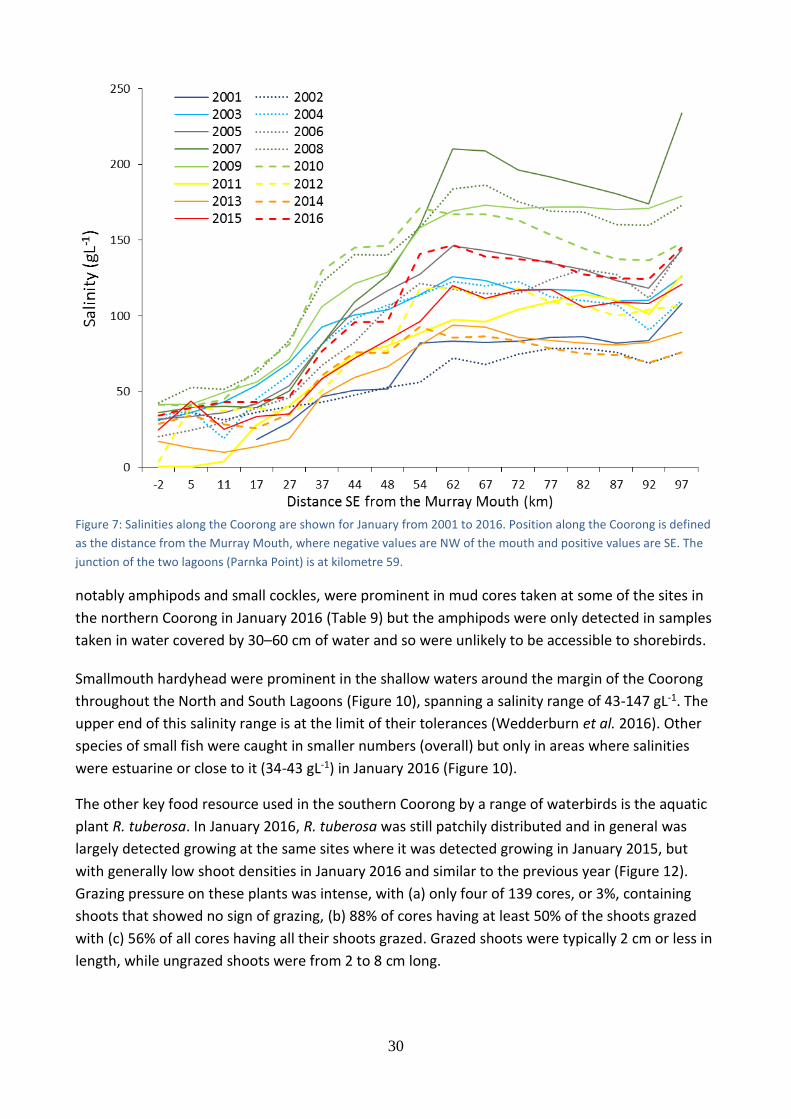
30
Figure 7: Salinities along the Coorong are shown for January from 2001 to 2016. Position along the Coorong is defined
as the distance from the Murray Mouth, where negative values are NW of the mouth and positive values are SE. The
junction of the two lagoons (Parnka Point) is at kilometre 59.
notably amphipods and small cockles, were prominent in mud cores taken at some of the sites in
the northern Coorong in January 2016 (Table 9) but the amphipods were only detected in samples
taken in water covered by 30–60 cm of water and so were unlikely to be accessible to shorebirds.
Smallmouth hardyhead were prominent in the shallow waters around the margin of the Coorong
throughout the North and South Lagoons (Figure 10), spanning a salinity range of 43-147 gL-1. The
upper end of this salinity range is at the limit of their tolerances (Wedderburn et al. 2016). Other
species of small fish were caught in smaller numbers (overall) but only in areas where salinities
were estuarine or close to it (34-43 gL-1) in January 2016 (Figure 10).
The other key food resource used in the southern Coorong by a range of waterbirds is the aquatic
plant R. tuberosa. In January 2016, R. tuberosa was still patchily distributed and in general was
largely detected growing at the same sites where it was detected growing in January 2015, but
with generally low shoot densities in January 2016 and similar to the previous year (Figure 12).
Grazing pressure on these plants was intense, with (a) only four of 139 cores, or 3%, containing
shoots that showed no sign of grazing, (b) 88% of cores having at least 50% of the shoots grazed
with (c) 56% of all cores having all their shoots grazed. Grazed shoots were typically 2 cm or less in
length, while ungrazed shoots were from 2 to 8 cm long.
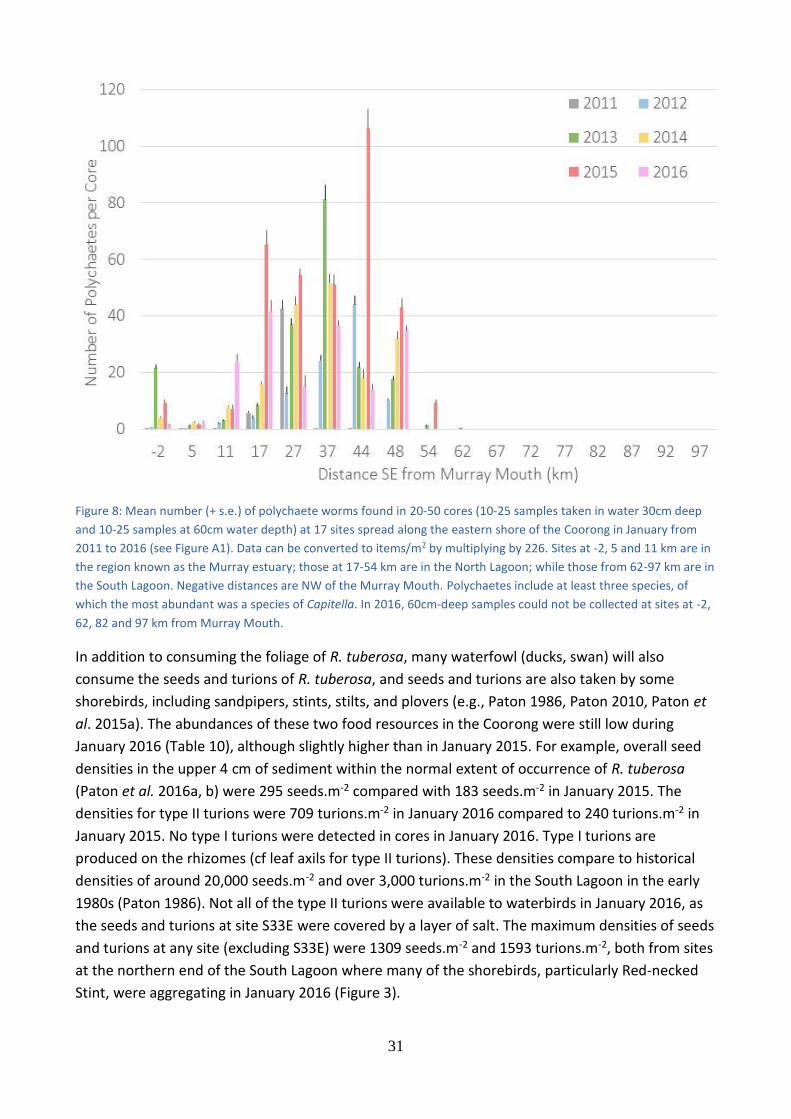
31
Figure 8: Mean number (+ s.e.) of polychaete worms found in 20-50 cores (10-25 samples taken in water 30cm deep
and 10-25 samples at 60cm water depth) at 17 sites spread along the eastern shore of the Coorong in January from
2011 to 2016 (see Figure A1). Data can be converted to items/m2 by multiplying by 226. Sites at -2, 5 and 11 km are in
the region known as the Murray estuary; those at 17-54 km are in the North Lagoon; while those from 62-97 km are in
the South Lagoon. Negative distances are NW of the Murray Mouth. Polychaetes include at least three species, of
which the most abundant was a species of Capitella. In 2016, 60cm-deep samples could not be collected at sites at -2,
62, 82 and 97 km from Murray Mouth.
In addition to consuming the foliage of R. tuberosa, many waterfowl (ducks, swan) will also
consume the seeds and turions of R. tuberosa, and seeds and turions are also taken by some
shorebirds, including sandpipers, stints, stilts, and plovers (e.g., Paton 1986, Paton 2010, Paton et
al. 2015a). The abundances of these two food resources in the Coorong were still low during
January 2016 (Table 10), although slightly higher than in January 2015. For example, overall seed
densities in the upper 4 cm of sediment within the normal extent of occurrence of R. tuberosa
(Paton et al. 2016a, b) were 295 seeds.m-2 compared with 183 seeds.m-2 in January 2015. The
densities for type II turions were 709 turions.m-2 in January 2016 compared to 240 turions.m-2 in
January 2015. No type I turions were detected in cores in January 2016. Type I turions are
produced on the rhizomes (cf leaf axils for type II turions). These densities compare to historical
densities of around 20,000 seeds.m-2 and over 3,000 turions.m-2 in the South Lagoon in the early
1980s (Paton 1986). Not all of the type II turions were available to waterbirds in January 2016, as
the seeds and turions at site S33E were covered by a layer of salt. The maximum densities of seeds
and turions at any site (excluding S33E) were 1309 seeds.m-2 and 1593 turions.m-2, both from sites
at the northern end of the South Lagoon where many of the shorebirds, particularly Red-necked
Stint, were aggregating in January 2016 (Figure 3).
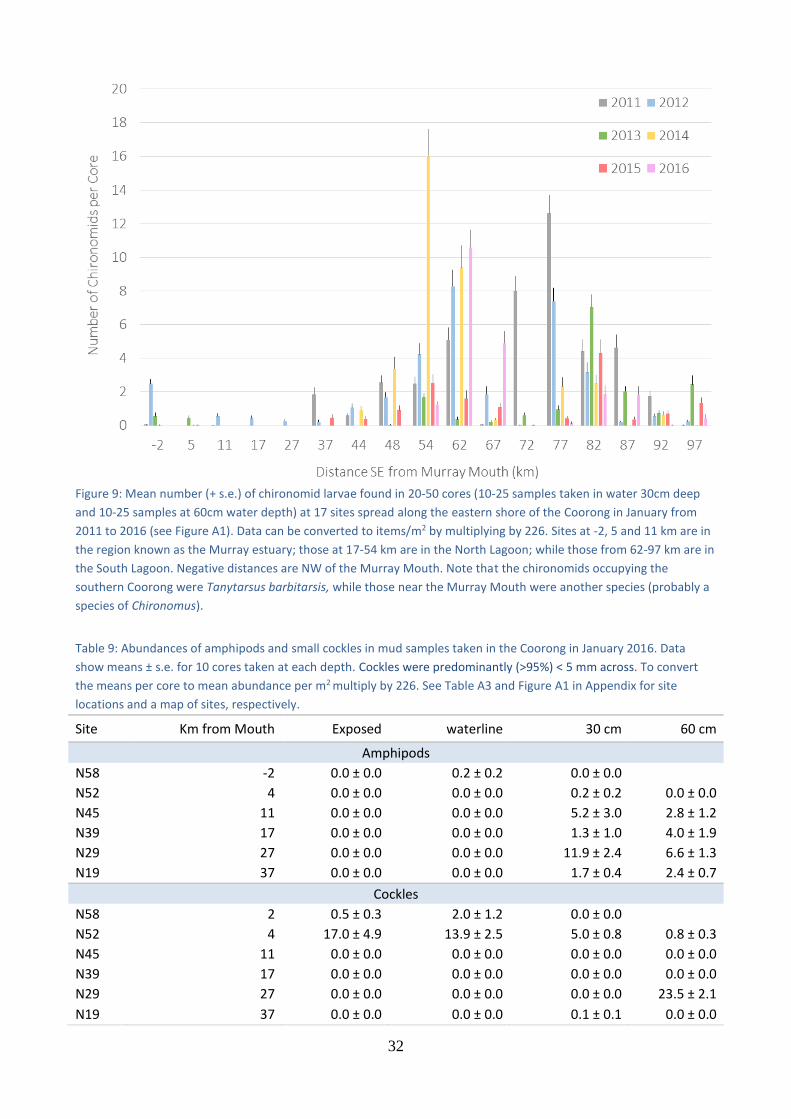
32
Figure 9: Mean number (+ s.e.) of chironomid larvae found in 20-50 cores (10-25 samples taken in water 30cm deep
and 10-25 samples at 60cm water depth) at 17 sites spread along the eastern shore of the Coorong in January from
2011 to 2016 (see Figure A1). Data can be converted to items/m2 by multiplying by 226. Sites at -2, 5 and 11 km are in
the region known as the Murray estuary; those at 17-54 km are in the North Lagoon; while those from 62-97 km are in
the South Lagoon. Negative distances are NW of the Murray Mouth. Note that the chironomids occupying the
southern Coorong were Tanytarsus barbitarsis, while those near the Murray Mouth were another species (probably a
species of Chironomus).
Table 9: Abundances of amphipods and small cockles in mud samples taken in the Coorong in January 2016. Data
show means ± s.e. for 10 cores taken at each depth. Cockles were predominantly (>95%) < 5 mm across. To convert
the means per core to mean abundance per m2 multiply by 226. See Table A3 and Figure A1 in Appendix for site
locations and a map of sites, respectively.
Site Km from Mouth Exposed waterline 30 cm 60 cm
Amphipods
N58 -2 0.0 ± 0.0 0.2 ± 0.2 0.0 ± 0.0
N52 4 0.0 ± 0.0 0.0 ± 0.0 0.2 ± 0.2 0.0 ± 0.0
N45 11 0.0 ± 0.0 0.0 ± 0.0 5.2 ± 3.0 2.8 ± 1.2
N39 17 0.0 ± 0.0 0.0 ± 0.0 1.3 ± 1.0 4.0 ± 1.9
N29 27 0.0 ± 0.0 0.0 ± 0.0 11.9 ± 2.4 6.6 ± 1.3
N19 37 0.0 ± 0.0 0.0 ± 0.0 1.7 ± 0.4 2.4 ± 0.7
Cockles
N58 2 0.5 ± 0.3 2.0 ± 1.2 0.0 ± 0.0
N52 4 17.0 ± 4.9 13.9 ± 2.5 5.0 ± 0.8 0.8 ± 0.3
N45 11 0.0 ± 0.0 0.0 ± 0.0 0.0 ± 0.0 0.0 ± 0.0
N39 17 0.0 ± 0.0 0.0 ± 0.0 0.0 ± 0.0 0.0 ± 0.0
N29 27 0.0 ± 0.0 0.0 ± 0.0 0.0 ± 0.0 23.5 ± 2.1
N19 37 0.0 ± 0.0 0.0 ± 0.0 0.1 ± 0.1 0.0 ± 0.0

33
Figure 10: Mean number (+s.e.) of smallmouth hardyheads found in three replicate 50 m long trawls of 7 m seine net at 17 sites spread along the eastern shore of the Coorong for January from 2011 to 2016 (see Figure A1). Sites at -2, 5 and 11 km are in the region known as the Murray estuary; those at 17-54 km are in the North Lagoon; while those from 62-97 km are in the South Lagoon. Negative distances are NW of the Murray Mouth. No trawls were undertaken at site -2 in January due to extensive amounts of red algae that prevented seining.
Figure 11: Mean number (+s.e.) of fish (other than smallmouth hardyheads) found in three replicate 50 m long trawl of a 7 m seine net at 17 sites spread along the eastern shore of the Coorong for January from 2011 to 2016 (see Figure A1). Sites at -2, 5 and 11 km are in the region known as the Murray estuary; those at 17-54 km are in the North Lagoon; while those from 62-97 km are in the South Lagoon. Negative distances are NW of the Murray Mouth. No trawls were undertaken at site -2 in January due to extensive amounts of red algae that prevented seining.

34
Figure 12: Mean number of Ruppia tuberosa shoots (+ s.e) present in 50 core samples (25 taken at each of two water depths (0.3m and 0.6m)) at 17 sites spread along the eastern shore of the Coorong in January from 2011 to 2016 (see Figure A1). Data can be converted to shoots/m2 by multiplying by 226. Sites at -2, 5 and 11 km are in the region known as the Murray estuary; sites at 17-54 km are in the North Lagoon; while those from 62-97 km are in the South Lagoon. Negative distances are NW of the Murray Mouth.
Table 10: Densities of Ruppia tuberosa seeds and turions found in cores taken at sites along the Coorong in January 2016. The table shows the mean number of seeds (± s.e.) per core (75 mm diam x 4 cm deep) and mean number of type II turions at 21 sampling sites in the Coorong where R. tuberosa has been present (note the four most Northern sites had no R. tuberosa present and so are not shown). To calculate densities of seeds and turions multiply the mean numbers per core by 226. See Table A3 and Figure A1 in Appendix for site locations and a map of sites, respectively.
Site Km from mouth Seeds per core (mean ± s.e.) Turions per core (mean ± s.e.)
Eastern shore Western shore Eastern shore Western shore
N29 27 0.05 ± 0.03
0.0 ± 0.0
N19 37 0.14 ± 0.05
0.0 ± 0.0
N12 44 0.00 ± 0.00
0.0 ± 0.0
N08 48 0.37 ± 0.09
0.0 ± 0.0
N02 54 1.90 ± 0.40 1.58 ± 0.36
S06 62 5.79 ± 1.10 3.19 ± 0.36 7.05 ± 1.46 4.44 ± 0.84
S11 67 0.33 ± 0.08 0.44 ± 0.16 0.13 ± 0.04 2.89 ± 0.64
S16 72 0.10 ± 0.04 0.56 ± 0.10 0.00 ± 0.00 5.03 ± 0.90
S21 77 0.18 ± 0.06 1.68 ± 0.32 1.19 ± 0.48 4.09 ± 0.56
S26 82 2.75 ± 0.42 0.36 ± 0.10 6.57 ± 0.99 3.85 ± 0.76
S31 87 0.01 ± 0.01 0.03 ± 0.02 0.09 ± 0.06 1.59 ± 0.68
S33 89 3.44 ± 0.61
11.24 ± 1.08
S36 92 0.35 ± 0.10 0.00 ± 0.00 0.08 ± 0.04 0.00 ± 0.00
S41 97 2.27 ± 0.45 0.12 ± 0.05 6.37 ± 1.76 0.30 ± 0.09
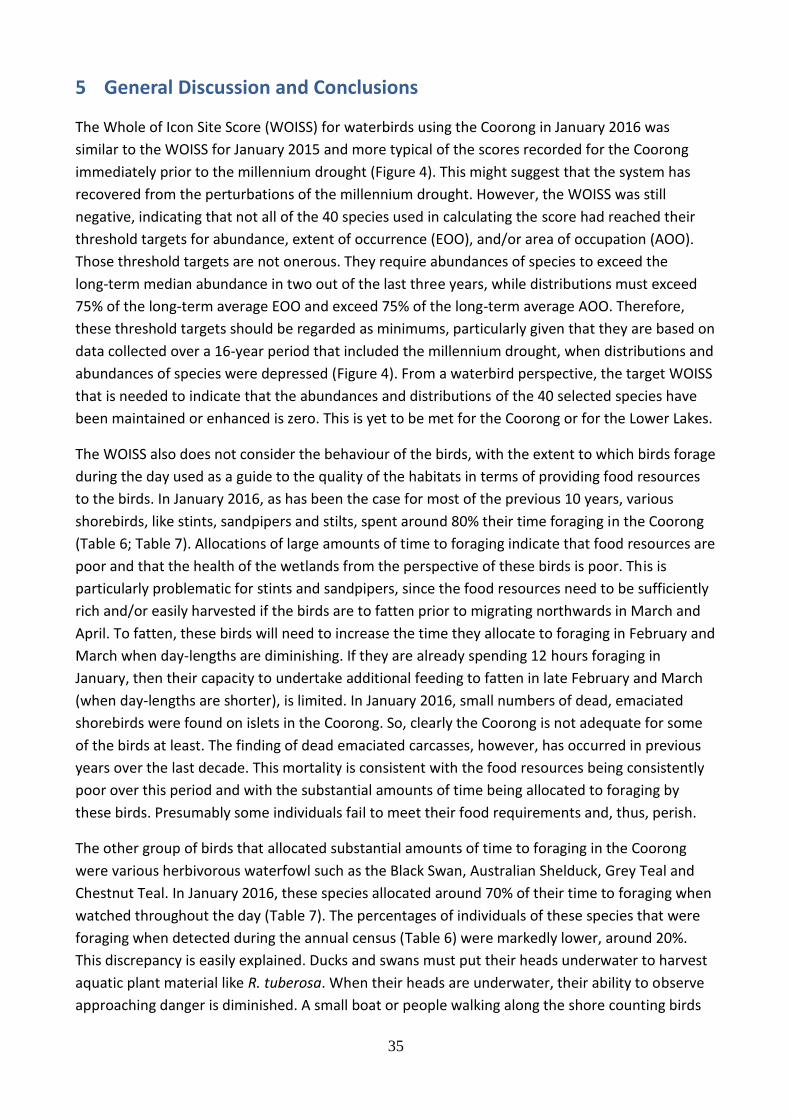
35
5 General Discussion and Conclusions
The Whole of Icon Site Score (WOISS) for waterbirds using the Coorong in January 2016 was
similar to the WOISS for January 2015 and more typical of the scores recorded for the Coorong
immediately prior to the millennium drought (Figure 4). This might suggest that the system has
recovered from the perturbations of the millennium drought. However, the WOISS was still
negative, indicating that not all of the 40 species used in calculating the score had reached their
threshold targets for abundance, extent of occurrence (EOO), and/or area of occupation (AOO).
Those threshold targets are not onerous. They require abundances of species to exceed the
long-term median abundance in two out of the last three years, while distributions must exceed
75% of the long-term average EOO and exceed 75% of the long-term average AOO. Therefore,
these threshold targets should be regarded as minimums, particularly given that they are based on
data collected over a 16-year period that included the millennium drought, when distributions and
abundances of species were depressed (Figure 4). From a waterbird perspective, the target WOISS
that is needed to indicate that the abundances and distributions of the 40 selected species have
been maintained or enhanced is zero. This is yet to be met for the Coorong or for the Lower Lakes.
The WOISS also does not consider the behaviour of the birds, with the extent to which birds forage
during the day used as a guide to the quality of the habitats in terms of providing food resources
to the birds. In January 2016, as has been the case for most of the previous 10 years, various
shorebirds, like stints, sandpipers and stilts, spent around 80% their time foraging in the Coorong
(Table 6; Table 7). Allocations of large amounts of time to foraging indicate that food resources are
poor and that the health of the wetlands from the perspective of these birds is poor. This is
particularly problematic for stints and sandpipers, since the food resources need to be sufficiently
rich and/or easily harvested if the birds are to fatten prior to migrating northwards in March and
April. To fatten, these birds will need to increase the time they allocate to foraging in February and
March when day-lengths are diminishing. If they are already spending 12 hours foraging in
January, then their capacity to undertake additional feeding to fatten in late February and March
(when day-lengths are shorter), is limited. In January 2016, small numbers of dead, emaciated
shorebirds were found on islets in the Coorong. So, clearly the Coorong is not adequate for some
of the birds at least. The finding of dead emaciated carcasses, however, has occurred in previous
years over the last decade. This mortality is consistent with the food resources being consistently
poor over this period and with the substantial amounts of time being allocated to foraging by
these birds. Presumably some individuals fail to meet their food requirements and, thus, perish.
The other group of birds that allocated substantial amounts of time to foraging in the Coorong
were various herbivorous waterfowl such as the Black Swan, Australian Shelduck, Grey Teal and
Chestnut Teal. In January 2016, these species allocated around 70% of their time to foraging when
watched throughout the day (Table 7). The percentages of individuals of these species that were
foraging when detected during the annual census (Table 6) were markedly lower, around 20%.
This discrepancy is easily explained. Ducks and swans must put their heads underwater to harvest
aquatic plant material like R. tuberosa. When their heads are underwater, their ability to observe
approaching danger is diminished. A small boat or people walking along the shore counting birds
36
even from a distance usually results in the birds ceasing to forage, and moving away from shallow
water. Observers sitting stationary on the shoreline scoring the behaviour of the birds do not elicit
the same response. That these largely herbivorous birds were also spending substantial amounts
of the day foraging suggests their food supply, like shorebirds, is also not easily harvested. This
contrasts with the piscivorous species (terns, cormorants and pelicans) that were typically
spending less than 30% of the day time foraging. Various terns, cormorants and pelicans were also
breeding during summer, consistent with their food resources being readily harvested. The only
exceptions were the grebes that were spending more time than other piscivorous species foraging,
but this may reflect the difficulty in assessing when they are diving to catch fish as opposed to
diving to evade an incoming disturbance. Generally, the all-day observations showed a much lower
allocation of time to foraging for these species compared to the numbers recorded as foraging
during the census, suggesting that, at least during the counts, many of the birds recorded as diving
were escaping disturbance and not foraging.
One of the striking features with the distributions and abundances of birds using the Coorong in
January 2016 was that more than half of the 185,000 birds counted were using the South Lagoon.
This was despite salinities in the South Lagoon exceeding 120 gL-1. Such salinities are well above
the target range of 60-100 gL-1, and close to the upper salinity tolerances of both smallmouth
hardyheads and the chironomid T. barbitarsis (e.g., Wedderburn et al. 2016 and Kokkinn &
Williams 1988, respectively). Both taxa were still prominent in the southern Coorong despite these
salinities. The South Lagoon of the Coorong and the southern 6 km of the North Lagoon coincide
with the area where R. tuberosa forms a key component of the food webs. The southern 6 km of
the North Lagoon were supporting a further 12,000 birds in January 2016. The abundances of birds
using the southern Coorong highlights the importance of R. tuberosa as an important food source
for them. Amongst the species that were prominent in the southern Coorong were Hoary-headed
Grebes, Red-necked Stints, Red-capped Plovers, Banded Stilts, Red-necked Avocets, Australian
Shelducks and Grey Teal. Several thousand Sharp-tailed Sandpipers and Chestnut Teal were also
recorded. Of these species, only the ducks feed on R. tuberosa vegetation directly in the southern
Coorong, while most of the other species largely take chironomid larvae but will include seeds and
turions in their diets, if available (e.g., Paton 1986). However, Hoary-headed Grebes are
piscivorous in the southern Coorong.
Given the importance of R. tuberosa (both directly and indirectly) to a wide range of birds, the
maintenance of vigorous populations of R. tuberosa across the southern Coorong is paramount for
supporting the birds. Ruppia tuberosa, however, has struggled to re-establish its historical
prominence in the southern Coorong. A greater focus needs to be on managing the recovery and
re-establishment of resilient populations of R. tuberosa. Although there has been modest
improvement in the distribution and abundances of plants within the southern Coorong, the
numbers of propagules, both seeds and turions, are depressed compared to historical abundances
(e.g., Paton et al. 2016c). For example, historically, there were around 20,000 seeds per square
metre on the mudflats of the southern Coorong in the 1980s (Paton 1986), but, for most of the
last decade, seed abundances have been between 200-1000 seeds per square metre, 1-5% of

37
historical levels (e.g. Paton et al. 2016b,c). That shorebirds are struggling to find sufficient food is
entirely consistent with these dramatic changes in the abundances of resources.
The ultimate factor limiting the recovery of R. tuberosa in the southern Coorong is the
maintenance of adequate water levels in spring. For most of the last decade (at least), water levels
have fallen during spring. This has resulted in R. tuberosa becoming exposed and desiccated
before it is able to complete its reproductive cycle. Consequently, renewal of seeds and turions
cannot take place. Other factors, such as grazing on the remaining plants and smothering by
filamentous green algae, further reduce the reproductive performance of R. tuberosa. But,
ultimately, the lack of adequate water levels is the limiting factor. Prior to extraction of water from
the Murray Darling Basin for human use, flows to the Murray Mouth were substantial during
spring, usually peaking from October through December (Paton 2010), and more than sufficient to
maintain water levels in the southern Coorong through spring and into summer. However, the
current volumes reaching the end of the river are insufficient for this to occur (Paton 2010), with
barrage releases typically decreasing throughout mid spring until the end of summer due to
reduced upstream flows and constraints in delivery of environmental water to South Australia at
this time of year. Even when the Murray Darling Basin Plan is fully implemented, the volumes will
be inadequate in the majority of years, and the volumes to be returned are likely to be diminished
because of climate change. Alternatives to managing the southern Coorong and its unique
hypersaline R. tuberosa ecosystem are urgently needed. For example, a structure across the
Coorong, somewhere near the southern end of the North Lagoon, could prevent water leaving the
southern Coorong in spring, ensuring the R. tuberosa beds remain inundated with water long
enough to set seeds and turions. Without such management approaches, the very unique
ecological character of the Coorong as we know it, including the migratory shorebirds for which
the site is of international importance under the Ramsar convention, may not exist in the future.
38
6 Acknowledgements
The 2016 work was commissioned by the South Australian Department of Environment, Water and Natural Resources (Coorong, Lower Lakes and Murray Mouth Recovery Program). It is part of the South Australian Government’s Murray Futures program, funded by the Australian Government’s Water for the Future initiative. This project was also part funded by The Living Murray initiative of the Murray-Darling Basin Authority. The Living Murray is a joint initiative funded by the New South Wales, Victorian, South Australian, Australian Capital Territory and Commonwealth governments, coordinated by the Murray – Darling Basin Authority. Prior to 2008, part funding for the annual census of water birds and their resources in the Coorong was provided by the South Australian Department for Environment and Heritage (2000-2006), the Nature Foundation of South Australia (2007), and Earthwatch Australia (2001-2007). These earlier censuses were conducted with the assistance of staff, students and volunteers from the University of Adelaide, and Earthwatch (Australia) volunteers. The Department of Environment, Water and Natural Resources provided permits for this monitoring, with the monitoring conducted under Animal Ethics approvals from the University of Adelaide. Adrienne Rumbelow, Jason Higham and Adam Watt provided administrative support. We thank Joel Allan, Donna Belder, Tom Bradley, Tom Hunt, Grace Hodder, Hayley Merigot, Victoria McCarron, Sally Nobbs, Philip Northeast, Lynn Pedler, Alastair Wood, Louise Moore, Simon Fahey-Sparks, Adam Toomes, Merle Widlock and Nicole Monjonnier for assistance with the annual waterbird surveys in the Coorong and Lower Lakes in 2016.

39
7 References
Kokkinn MJ & Williams WD 1988. Adaptations to life in a hypersaline water body: adaptations at
the egg and early embryonic stage of Tanytarsus barbitarsis freeman (Diptera, chironomidae).
Aquatic Insects 10 (4): 205-214.
Maunsell 2009. Lower Lakes, Coorong and Murray Mouth Icon Site Condition Monitoring Plan.
(Maunsell Australia, Adelaide)
Paton PA 1986. Use of aquatic plants by birds in the Coorong, South Australia pp 94-101. In HA
Ford & DC Paton (eds). The dynamic partnership: birds and plants in southern Australia. (SA Govt
Printer, Adelaide)
Paton DC 2010. At the End of the River: The Coorong and Lower Lakes. ATF Press, Hindmarsh.
Paton DC 2014. Contribution to the Living Murray Icon Site Condition Monitoring Plan refinement
project. Icon Site Condition Monitoring Plan Chapter 4.1 – Birds. (University of Adelaide, Adelaide)
Paton DC 2016. Murray Darling Basin Plan won’t deliver enough water to help the Coorong. The
Advertiser, 11 February 2016.
Paton DC & Bailey CP 2010. Condition monitoring of the Lower Lakes, Coorong and Murray Mouth
Icon Site: Waterbirds using the Coorong and Murray Estuary 2010. (University of Adelaide,
Adelaide)
Paton DC & Bailey CP 2011a. Condition monitoring of the Lower Lakes, Coorong and Murray
Mouth Icon Site: Waterbirds using the Lower Lakes in 2011. (University of Adelaide, Adelaide)
Paton DC & Bailey CP 2011b. Condition monitoring of the Lower Lakes, Coorong and Murray
Mouth Icon Site: Waterbirds using the Coorong and Murray Estuary 2011. (University of Adelaide,
Adelaide)
Paton DC & Bailey CP 2012a. Condition monitoring of the Lower Lakes, Coorong and Murray
Mouth Icon Site: Waterbirds using the Lower Lakes in 2012. (University of Adelaide, Adelaide)
Paton DC & Bailey CP 2012b. Condition monitoring of the Lower Lakes, Coorong and Murray
Mouth Icon Site: Waterbirds using the Coorong and Murray Estuary 2012. (University of Adelaide,
Adelaide)
Paton DC & Bailey CP 2012c. Annual monitoring of Ruppia tuberosa in the Coorong region of South
Australia, July 2011 (University of Adelaide, Adelaide)
Paton DC & Bailey CP 2013. Condition monitoring of the Lower Lakes, Coorong and Murray Mouth
Icon Site: Waterbirds 2013. (University of Adelaide, Adelaide)
Paton DC & Bailey CP 2014. Condition monitoring of the Lower Lakes, Coorong and Murray Mouth
Icon Site: waterbirds 2014. (University of Adelaide, Adelaide)
40
Paton DC, Bailey CP & Paton FL 2015c Condition monitoring of the Coorong, Lower Lakes and
Murray Mouth Icon Site: Waterbirds in the Coorong 2015. (University of Adelaide, Adelaide)
Paton DC, Bailey CP & Paton FL 2016a. Monitoring of Ruppia tuberosa in the southern Coorong,
summer 2014-15. (University of Adelaide, Adelaide)
Paton DC, Bailey CP & Paton FL 2016b. Annual winter monitoring of Ruppia tuberosa in the
Coorong region of South Australia, July 2015. (University of Adelaide, Adelaide)
Paton FL & Paton DC 2016. Colonial breeding birds in the Coorong during summer 2015-16, May
2016. (University of Adelaide, Australia)
Paton DC, Paton FL & Bailey CP 2015a. A broad synthesis of waterbird knowledge for the Coorong,
Lower Lakes and Murray Mouth region, including comment on future management and
monitoring options. (University of Adelaide, Adelaide)
Paton, DC, Paton FL & Bailey CP 2015b. Further refinement of the Condition Monitoring Plan for
waterbirds and Ruppia tuberosa for the Coorong, Lower Lakes and Murray Mouth Icon Site.
(University of Adelaide, Adelaide)
Paton DC, Paton FL & Bailey CP 2016c. Monitoring of Ruppia tuberosa in the southern Coorong,
summer 2015-16. (University of Adelaide, Adelaide)
Paton DC, Rogers DJ, Hill BM, Bailey CP & Ziembicki M 2009. Temporal changes to spatially-
stratified waterbird communities of the Coorong, South Australia: implications for the
management of heterogenous wetlands. Animal Conservation 12: 408-17.
Robinson WA 2014. The Living Murray Condition Monitoring Plan refinement project: Summary
report. Technical report to the MDBA, March 2015. 95 pp.
Wedderburn SD, Bailey CP, Delean S & Paton DC 2016. Population and osmoregulatory responses
of a euryhaline fish to extreme salinity fluctuations in coastal lagoons of the Coorong, Australia.
Estuarine, Coastal and Shelf Science 168: 50-57
Williams WD 1986. Conductivity and salinity of Australian Salt Lakes. Aust.J. Mar, Freshwat. Res.
37: 177-182.
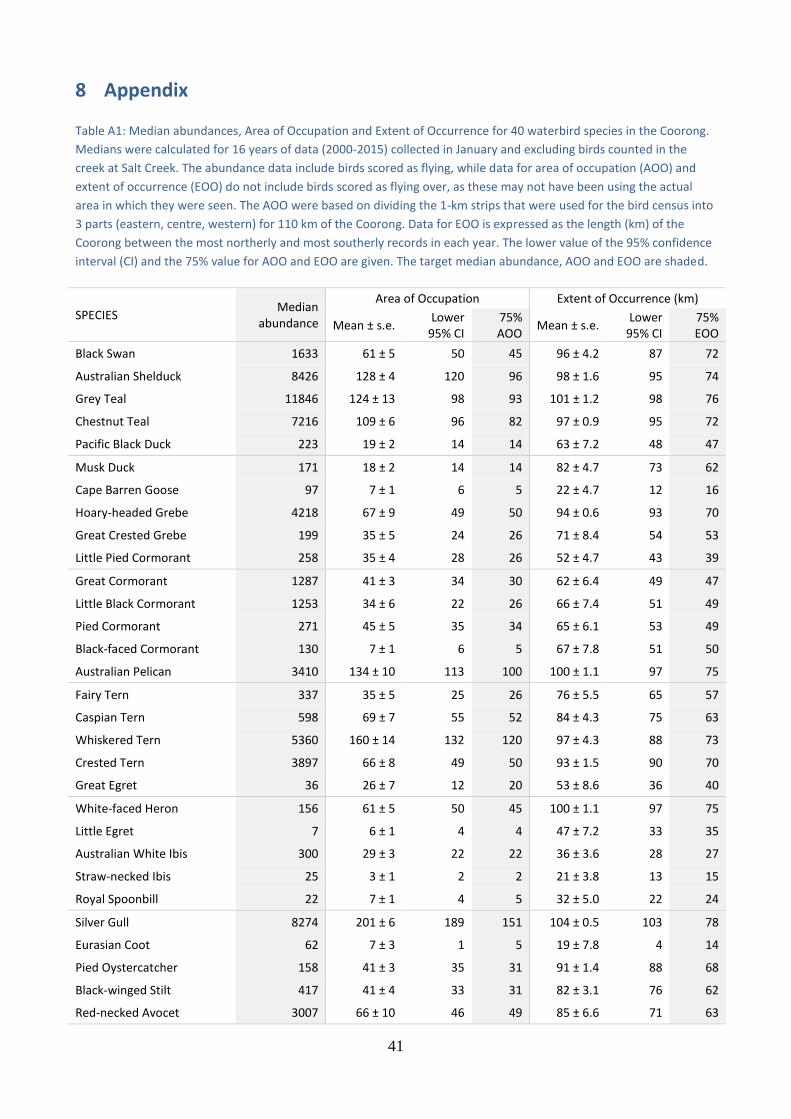
41
8 Appendix
Table A1: Median abundances, Area of Occupation and Extent of Occurrence for 40 waterbird species in the Coorong.
Medians were calculated for 16 years of data (2000-2015) collected in January and excluding birds counted in the
creek at Salt Creek. The abundance data include birds scored as flying, while data for area of occupation (AOO) and
extent of occurrence (EOO) do not include birds scored as flying over, as these may not have been using the actual
area in which they were seen. The AOO were based on dividing the 1-km strips that were used for the bird census into
3 parts (eastern, centre, western) for 110 km of the Coorong. Data for EOO is expressed as the length (km) of the
Coorong between the most northerly and most southerly records in each year. The lower value of the 95% confidence
interval (CI) and the 75% value for AOO and EOO are given. The target median abundance, AOO and EOO are shaded.
SPECIES Median
abundance
Area of Occupation Extent of Occurrence (km)
Mean ± s.e. Lower
95% CI 75% AOO
Mean ± s.e. Lower
95% CI 75% EOO
Black Swan 1633 61 ± 5 50 45 96 ± 4.2 87 72
Australian Shelduck 8426 128 ± 4 120 96 98 ± 1.6 95 74
Grey Teal 11846 124 ± 13 98 93 101 ± 1.2 98 76
Chestnut Teal 7216 109 ± 6 96 82 97 ± 0.9 95 72
Pacific Black Duck 223 19 ± 2 14 14 63 ± 7.2 48 47
Musk Duck 171 18 ± 2 14 14 82 ± 4.7 73 62
Cape Barren Goose 97 7 ± 1 6 5 22 ± 4.7 12 16
Hoary-headed Grebe 4218 67 ± 9 49 50 94 ± 0.6 93 70
Great Crested Grebe 199 35 ± 5 24 26 71 ± 8.4 54 53
Little Pied Cormorant 258 35 ± 4 28 26 52 ± 4.7 43 39
Great Cormorant 1287 41 ± 3 34 30 62 ± 6.4 49 47
Little Black Cormorant 1253 34 ± 6 22 26 66 ± 7.4 51 49
Pied Cormorant 271 45 ± 5 35 34 65 ± 6.1 53 49
Black-faced Cormorant 130 7 ± 1 6 5 67 ± 7.8 51 50
Australian Pelican 3410 134 ± 10 113 100 100 ± 1.1 97 75
Fairy Tern 337 35 ± 5 25 26 76 ± 5.5 65 57
Caspian Tern 598 69 ± 7 55 52 84 ± 4.3 75 63
Whiskered Tern 5360 160 ± 14 132 120 97 ± 4.3 88 73
Crested Tern 3897 66 ± 8 49 50 93 ± 1.5 90 70
Great Egret 36 26 ± 7 12 20 53 ± 8.6 36 40
White-faced Heron 156 61 ± 5 50 45 100 ± 1.1 97 75
Little Egret 7 6 ± 1 4 4 47 ± 7.2 33 35
Australian White Ibis 300 29 ± 3 22 22 36 ± 3.6 28 27
Straw-necked Ibis 25 3 ± 1 2 2 21 ± 3.8 13 15
Royal Spoonbill 22 7 ± 1 4 5 32 ± 5.0 22 24
Silver Gull 8274 201 ± 6 189 151 104 ± 0.5 103 78
Eurasian Coot 62 7 ± 3 1 5 19 ± 7.8 4 14
Pied Oystercatcher 158 41 ± 3 35 31 91 ± 1.4 88 68
Black-winged Stilt 417 41 ± 4 33 31 82 ± 3.1 76 62
Red-necked Avocet 3007 66 ± 10 46 49 85 ± 6.6 71 63

42
Table A1 continued
SPECIES Median
abundance
Area of Occupation Extent of Occurrence (km)
Mean ± s.e. Lower
95% CI 75% AOO
Mean ± s.e. Lower
95% CI 75% EOO
Banded Stilt 15092 61 ± 11 40 46 85 ± 4.8 76 64
Pacific Golden Plover 36 4 ± 1 3 3 24 ± 4.0 16 18
Red-capped Plover 1234 77 ± 5 68 58 98 ± 2.4 94 74
Hooded Plover 8 6 ± 1 4 4 51 ± 8.1 35 38
Masked Lapwing 466 97 ± 3 91 73 103 ± 0.5 102 77
Far Eastern Curlew 13 4 ± 1 3 3 7 ± 2.2 3 6
Common Greenshank 430 88 ± 4 80 66 99 ± 0.6 98 75
Red-necked Stint 26286 118 ± 11 96 88 103 ± 0.7 101 77
Sharp-tailed Sandpiper 13179 121 ± 11 99 91 95 ± 2.8 89 71
Curlew Sandpiper 2252 35 ± 5 26 26 82 ± 5.3 71 61

43
Table A2: Median abundances, Area of Occupation and Extent of Occurrence for 25 waterbird species in the Lower
Lakes. Medians were calculated for 3 years of data (2013-2015) collected in January. The abundance data include birds
scored as flying, while data for area of occupation (AOO) and extent of occurrence (EOO) do not include birds scored
as flying over, as these may not have been using the actual area in which they were seen. The AOO were based on
dividing the 1-km strips that were used for the bird census into 3 parts (eastern, centre, western) for 110 km of the
Coorong. Data for EOO is expressed as the length (km) of the Coorong between the most northerly and most southerly
records in each year. The lower value of the 95% confidence interval (CI) and the 75% value for AOO and EOO are
given. The target median abundance, AOO and EOO are shaded.
SPECIES Median
abundance
Area of Occupation (km2) Extent of Occurrence (km2)
Mean ± s.e. Lower 95% CI
75% AOO Mean ± s.e. Lower 95% CI
75% EOO
Black Swan 1799 200 ± 7 186 150 1652 ± 39 1575 1239
Australian Shelduck 13249 183 ± 4 175 137 1582 ± 50 1484 1186
Grey Teal 3912 89 ± 30 29 67 1577 ± 92 1396 1183
Pacific Black Duck 4981 216 ± 12 193 162 1700 ± 16 1669 1275
Cape Barren Goose 1010 36 ± 5 27 27 1041 ± 11 1019 781
Hoary-headed Grebe 103 10 ± 7 -4 8 717 ± 383 -34 538
Great Crested Grebe 128 39 ± 18 3 30 978 ± 227 533 733
Darter 73 29 ± 9 12 22 857 ± 267 334 643
Little Pied Cormorant 84 42 ± 12 19 31 1384 ± 116 1157 1038
Great Cormorant 14963 304 ± 18 270 228 1714 ± 13 1688 1285
Little Black Cormorant 907 83 ± 34 17 63 1456 ± 140 1181 1092
Pied Cormorant 8759 228 ± 17 194 171 1538 ± 75 1390 1154
Australian Pelican 6239 305 ± 8 290 229 1729 ± 8 1714 1297
Caspian Tern 609 110 ± 8 95 82 1508 ± 18 1472 1131
Whiskered Tern 4497 357 ± 27 303 268 1722 ± 15 1693 1291
Crested Tern 490 92 ± 17 59 69 1428 ± 77 1277 1071
Great Egret 133 98 ± 46 8 73 1281 ± 339 616 961
White-faced Heron 119 64 ± 3 58 48 1595 ± 8 1579 1196
Australian White Ibis 611 107 ± 6 95 80 1660 ± 10 1640 1245
Straw-necked Ibis 1620 36 ± 9 19 27 1322 ± 154 1021 992
Royal Spoonbill 209 29 ± 5 19 22 1338 ± 35 1270 1004
Silver Gull 1823 99 ± 15 69 74 1511 ± 15 1481 1133
Purple Swamphen 463 111 ± 8 95 83 1555 ± 62 1434 1166
Eurasian Coot 3339 152 ± 41 72 114 1644 ± 39 1569 1233
Masked Lapwing 565 74 ± 4 67 56 1560 ± 42 1478 1170

44
Table A3: Location details for sampling sites used for mud sampling to assess benthic food resources for birds during
January 2016. Eastings and northings are Map Zone 54H in GDA94 units to the nearest 5m. The values given are the
average of the easting and northings of the four depths at which mud sampling took place at each site. The individual
locations for each of the depths are held with the data (not provided).
Site Site name
(Eastern shore) Lagoon
Distance from Mouth (km)*
Eastern shore Western shore
Zone Easting Northing Zone Easting Northing
N58 Estuary -2 54H 305462 6065378
N52 Estuary 4 54H 313418 6063013
N45 Pelican Point North 11 54H 321098 6058904
N39 Mark Point North 17 54H 326273 6055286
N29 Long Point North 27 54H 333977 6048502
N19 Noonameena North 37 54H 342533 6042174
N12 North 44 54H 347959 6037285
N08 North 48 54H 350522 6034249
N02 Magrath Flat North 54 54H 354684 6029538
S06 Villa dei Yuma South 62 54H 360454 6024694 54H 358067 6024263
S11 Braeside South 67 54H 363123 6022500 54H 360914 6020398
S16 South 72 54H 367049 6018086 54H 363817 6016002
S21 South 77 54H 370278 6013457 54H 367502 6012315
S26 Policeman’s
Point South 82 54H 372526 6008937 54H 369874 6007766
S31 South 87 54H 374401 6004315 54H 372631 6003931
S33 Gemini Downs South 89 54H 376381 6003588
S36 Salt Creek South 92 54H 377502 6000803 54H 375476 5999686
S41 Tea Tree Crossing
South 97 54H 378547 5996472 54H 377511 5995712
*distances are negative for sites NW of the Murray Mouth and positive for sites SE of the Murray Mouth

45
Figure A1: Map of the Coorong showing sites used for mud sampling to detect benthic food resources for birds during
January 2016. Codes for sites have been indicated.