conducting kap surveys: a learning document … kap surveys: a learning document based on ... choose...
TRANSCRIPT
Lessons Learnt from KAP Survey Failures
1
Conducting KAP Surveys:
A Learning Document Based on KAP Failures
January 2013
Lessons Learnt from KAP Survey Failures
2
I. Objectives: Why talk about failure?
Typically learning documents focus on successful projects, hoping to steer future activities in the same direction. While this approach is valuable, true “failures” produce far more lessons and yet are rarely recorded for learning purposes. There is a growing movement in the humanitarian and development sector to openly discuss and learn from failure as well as success, making it less taboo to talk about “not perfect” moments.
The goal of this document is to provide useful lessons and advice on how to avoid common pitfalls in household survey design, implementation, and analysis. Each of the errors highlighted here have been seen in practice, usually multiple times.
The lessons presented are valuable to anyone implementing household surveys and will illustrate common errors and give suggestions to avoid them. This document mainly focuses on a poorly designed and executed survey from the ACF South Sudan mission, but also draws on other failures to complement the South Sudan story. All the examples are knowledge, attitudes and practices (KAP) surveys from the water, sanitation and hygiene (WASH) sector, but the lessons are valid and important for ACF teams implementing nutrition surveys, integrated surveys, economic and livelihood surveys, housing surveys etc.
Any humanitarian worker familiar with surveys will recognize that the following discussion presents ideas that are common pointers for success found in survey literature. The point is that these are typical mistakes that all surveys make: perhaps it is uncommon for all such errors to be made at once, but all surveys have faults. The aim is not only to highlight common mistakes, but also to hopefully perpetuate a culture where admitting such errors leads to a better and more realistic understanding of the data (and its limitations) which is gathered in surveys.
This document will not attempt to summarize how to do a survey, but will link to a few key resources. Studying such resources is essential for anyone leading the implementation of surveys.
II. Summary of advice
The ACF experiences with KAP surveys illustrates how even just a few small errors can make a survey useless and that adherence to simple best practices is essential:
1) Choose an appropriate sampling method, understand it and its limitations, and implement it properly. In most cases, the most common method is appropriate.
2) The questionnaire design and testing are key steps to making a survey fool‐proof. The South Sudan example highlights this point extensively.
3) Team training must be thorough and the survey leaders must make special efforts during the survey exercise to ensure quality control of data collection from the beginning to avoid bad surprises in the end.
4) Follow basic best practices for data analysis, presentation, and reporting. Think critically about what you are calculating and the conclusions you draw.
5) Most importantly, when you discover an error in your surveys (and you will), discuss it and find a solution to address it quickly and openly.
III. Background
The ACF WASH team based in Malualkon, South Sudan is working in Aweil East (AE) and Aweil North (AN) Counties in Northern Bahr el Ghazal State. In May 2012, nine villages were selected based on nutrition criteria
“Fear, embarrassment, and intolerance of failure drives our learning underground.
No more. Failure is strength.
The most effective and innovative organizations are those that are willing to speak openly about their failures. Because the only truly "bad" failure
is one that's repeated.”
http://www.admittingfailure.com/
Lessons Learnt from KAP Survey Failures
3
for targeted hygiene promotion activities under CHF, OFDA, ECHO and SDC funded WASH programs. A KAP questionnaire was administered by ACF hygiene promotion staff in order to establish a baseline of the WASH situation and to have a reference from which to gauge the impact of the hygiene promotion activities.
Due to the problems presented in this report, the results of the KAP survey attempt were neither statistically significant nor accurate. Therefore, a majority of the data was not used, and instead a simplistic baseline of the number of household latrines and some supplementary data from nutrition programs will be used to compare post‐hygiene promotion implementation results from the villages at project end in February/March 2013.
A special thanks to the courageous team in Malualkon, whose enthusiasm and openness resulted in more people talking about failures to complete their story. The Malualkon experience was the starting point for this document and the Annexes about questionnaires are exclusively from this case study.
IV. Introduction
In the context of this document the term “survey” will refer to household surveys where a questionnaire is administered to quantify various indicators in a statistically significant manner. The discussion is generally focused around probabilistic type sampling methods, but some of the issues raised can be applicable to other sampling methods (e.g. stratified sampling etc.). The data collected aims to be representative of a population at a certain time, and is often used to compare with other snapshots in time (e.g. for impact assessment or trend analysis). The following discussion will address common errors in each of the steps in a survey: - Problems in survey sampling design - Problems in questionnaire design - Problems in survey execution - Problems in data analysis - Problems in reporting
V. Problems in survey sampling design
Sample design refers to the decisions regarding the type of sampling the survey will use. The goal is to interview as few households as necessary, but enough such that the indicators can be reliably quantified (i.e. that they are accurate and representative). Sampling design is a technical task, thus the leader of the survey must commit to learning about and fully understanding the options and norms in his or her sector.
The technical aspects of a “statistically representative sample” will not be discussed in detail, but it is important to be aware that many common errors discussed here make null the validity of the statistics, thus rendering the data invalid and technically useless.
Representativeness: For a sample to be representative of a population it must be big enough and it also must be randomly chosen (i.e. each household in the target population has an equal chance of being interviewed). A further discussion of ensuring randomness will be included in the implementation section.
Accuracy: Different types of surveys demand different degrees of statistical accuracy, which will require different sample sizes.
For example, a KAP survey generally aims for a 10% accuracy, which for a large dispersed population leads to a sample size of 192 households when using the common cluster sampling method. This sample size, N, is then rounded up to 210 in order to work with 30
Selected references for survey and sampling design:
- Water, Sanitation and Hygiene Manual for Populations at Risk. ACF. 2008. (Part V, Section 2.3.4)
- ACF Food Security and Livelihoods Assessment Guideline. ACF. 2010. (Sections 2 and 3)
- Emergency Food Security Assessment Handbook. 2nd Ed. WFP. 2009. (Part III, Section 2.7)
- WatSan Mission Assistant – Assessment Section (wiki website). http://watsanmissionassistant.wikispaces.com/Assessment+Tools
Lessons Learnt from KAP Survey Failures
4
clusters of 7 people each (WHO model used for vaccination surveys), and to have extra surveys in case some have to be discarded1.
Sampling methodology must be clear and properly used: There are many appropriate methods for ensuring a survey’s sample is representative of the target population2. Be sure to understand the method you have chosen and be able to describe it using technical terms accurately. Use the most common methodology; don’t use a new “sexy” method unless you have a good reason and appropriate technical support.
As mentioned above, for KAP surveys in a large dispersed population a 2 stage, cluster sampling method with an accuracy of 10% or 5% (for impact studies) is usually used, following the WHO public health model3. Food security and nutrition surveys have similar norms. If you do not understand or are having trouble, then enlist the help of a colleague or advisor to ensure your success.
- In the Malualkon survey, it was not clear which (if any) methodology was followed for the sampling design: Why was it decided to survey 10 households per village when it is known that all the villages are not the same size? Even that was not achieved, and it was not clear why not. Also, there are no sampling methods in which a sample size of N=78 households will give any significant conclusions for a large population4.
- An example shared from Indonesia had the opposite problem: 4,000 household questionnaires were administered. This is a case of oversampling to the point of wasting time and money for no added value.
- A programme in Haiti decided to aim for an accuracy of 5% through a clustered sampling. Although generally not recommended by ACF for a WASH KAP survey, this methodology can be used. It then requires a sample of 768 questionnaires split between 30 clusters: 25.6 per cluster. To simplify, the mission decided to round down to 25, 750 questionnaires total, instead of the correct methodology, which is to round UP (as mentioned in ACF KAP self training) to 26 (780 questionnaires total). Therefore, the sample used in the Haiti KAP was no longer representative of a 5% accuracy, wasting valuable time and resources when only 210 questionnaires would have been sufficient.
- In Kenya, a study claimed to use “cluster sampling” for qualitative focus group discussions, which doesn’t make sense because cluster sampling is a specific method for quantitative household surveys. While the focus groups may have been “clustered” around a particular group and geographic area, “cluster sampling” is a very specific methodology and the term was not used appropriately in this case.
- Again in Kenya, a KAP survey tried to use cluster sampling, but rather than 30 clusters of 7 households randomly distributed over the target villages (which is a common distribution for a WASH KAP), they had 1 cluster per village and the cluster size was proportional to the village size, scaled to get 200 questionnaires. So while the number of questionnaires was acceptable for accuracy of 10% (192 needed) and the households were chosen randomly, they didn’t exactly follow the methodology for “cluster sampling” therefore they should call it something else.
Background data needs to be accurate, or at least clear as to its limitations: A very important piece of information in sampling method design is the size and distribution of the target population. This usually5 means getting a list of villages or communities with their respective population numbers. It is often a challenge to get accurate lists (e.g. village chiefs can exaggerate numbers, for example). You can ask regional authorities (like a district officer) that probably have such a list, which is official and often the best source, even if not perfect. You can use national census data, which is easily projected using national growth rates, although sometimes this is not broken down to the detail you might need.
1 Water, Sanitation and Hygiene Manual for Populations at Risk. ACF. 2008. 2 ACF is preparing a guidance brief on KAP sampling options that will be released in 2013.
3 Water, Sanitation and Hygiene Manual for Populations at Risk. ACF. 2008 4 For example using simple random sampling: if population is <200 people then N=65 will give 10% accuracy, but an
exhaustive list of households must be known, which was not the case in South Sudan. (KAP Self‐training CD. ACF.) 5 A list of households is needed for some sampling methods, but in practice this is usually not possible, so these methods
are rarely used.
Lessons Learnt from KAP Survey Failures
5
VI. Problems in questionnaire design The Malualkon case study is a good example of a badly designed questionnaire. In Annex A, each question/response is critiqued and consequences are discussed (which makes for a very good read, because they often seem like silly mistakes, but are in fact all common errors). Annex B presents selected “bad examples” alongside an improved version of the question and responses. The Malualkon questionnaire itself is presented “as is” in Annex C. Below general advice is shared with selected examples. A well‐designed questionnaire can go a long way to ensure the collection of high quality data: but what makes a questionnaire good? It needs to consistently gather data to measure indicators in a precise manner. Generally, the questionnaire has the questions to be asked, as well as a listing of response choices, which the enumerators are to use only to record the response. The wording of both must be very clear and precise. There are many good examples of survey questionnaires, which can be easily adapted to your needs and are always a good place to start. The questionnaire should be a tool for the enumerators; therefore they should be involved in the development. The layout on the page should also be easy for the enumerator to fill out. The questionnaire must be well thought out: Ideally, one should first carefully create a research background and purpose document so you know what data is needed to answer the research question. Think about exactly which indicators interest you and why. A good starting point is to focus on basic and well‐known indicators for your sector, thinking carefully about the units and the meaning of each indicator. Only include questions in your survey that are necessary to answer the research question(s) or to quantify your indicators. Be critical and leave off indicators that are not important to your context or that can be obtained by other ways. Too often surveyors add everything because they want to be thorough, but the data is neither important nor necessary. This unnecessary data will not be analyzed, let alone used, so why include it? Remember that you are taking precious time from a busy mother/father. For example, WASH endline/impact surveys sometimes ask about educational background of the mother, which is interesting, but has little relevance to the impact of WASH program. It goes both ways, however. If you do not ask the appropriate questions, the answers you get will not be enough to answer the research question(s). An important WASH indicator, which is often wasted or missed, is the quantity of water used per person per day. Sometimes the survey question will simply ask “How many liters of water per day does each person use?”, which is generally very hard for anyone to say accurately. Rather, it is usually better to ask about and observe the total number of water containers used in the household, record the volume of each, and ask how many of these are used by the family per day (much easier for the respondent to remember or estimate). Thus during the analysis the total volume of water used per day for the family can be calculated, then divided by the total number of people living in the household to give average per capita water use (l/p/d). And don’t forget to record the number of people per household or you will not be able to accurately complete the analysis. The wording in a questionnaire must be precise: Take the time to ensure that the wording of each question and response is simple, clear, and that it will give you the data you need. The language should be clear to an outsider. The language should be adapted to the context. The Malualkon questionnaire attempted to ask about various water sources by season, so the first question in the series asks about the dry season, but the subsequent water questions do not state “dry” or “rainy” season so there is no way to understand how the enumerator phrased the question or how the respondents answered. The questions ask for “alternate” water source, but do not give an answer option of “do not have alternate” which may be the case in many areas. Additionally in this series of questions it asks about water sources used for drinking or for other purposes, but there is actually no way to tell if they are the same because there is no response choice of “same as drinking water”. The common KAP question about hand‐washing is often badly asked. First, the question is sometimes simply asked as "when do you wash your hands", if someone gives the first answer that comes to their head (e.g. before eating), it is sometimes automatically assumed that these individuals do not wash their hands after using the toilet ‐ but this is not necessarily the case. It is better to ask the question referring to each critical
Lessons Learnt from KAP Survey Failures
6
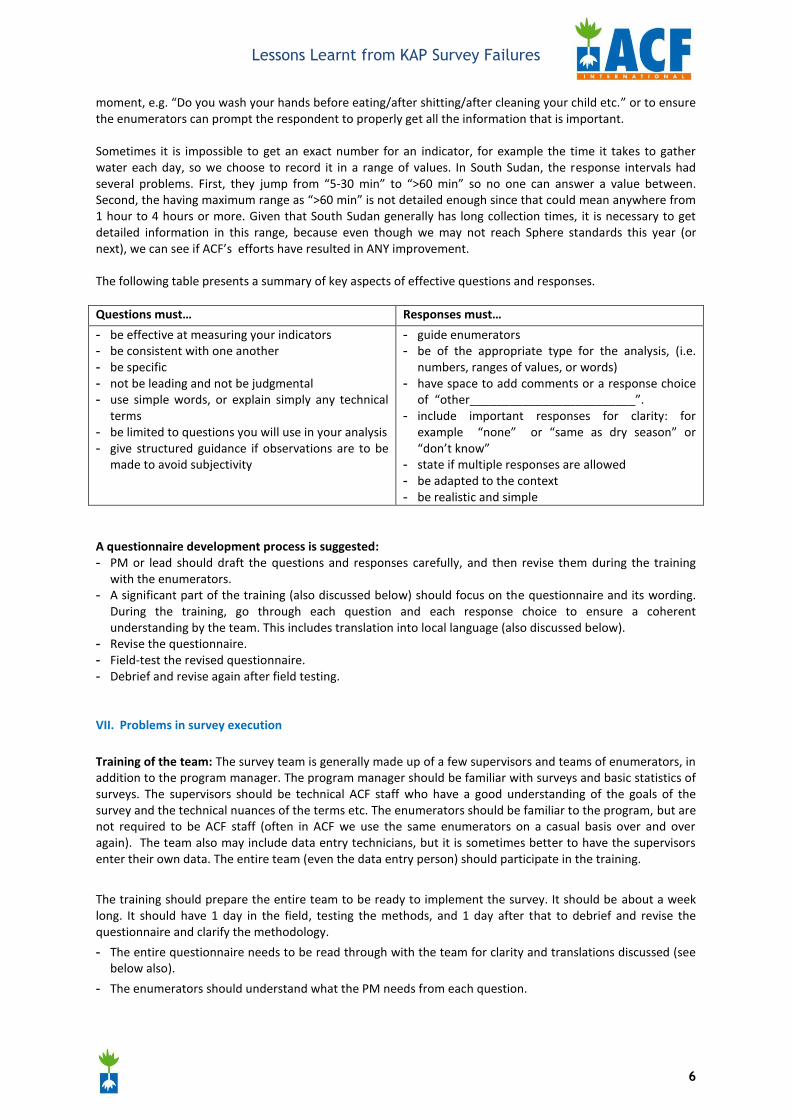
moment, e.g. “Do you wash your hands before eating/after shitting/after cleaning your child etc.” or to ensure the enumerators can prompt the respondent to properly get all the information that is important. Sometimes it is impossible to get an exact number for an indicator, for example the time it takes to gather water each day, so we choose to record it in a range of values. In South Sudan, the response intervals had several problems. First, they jump from “5‐30 min” to “>60 min” so no one can answer a value between. Second, the having maximum range as “>60 min” is not detailed enough since that could mean anywhere from 1 hour to 4 hours or more. Given that South Sudan generally has long collection times, it is necessary to get detailed information in this range, because even though we may not reach Sphere standards this year (or next), we can see if ACF’s efforts have resulted in ANY improvement. The following table presents a summary of key aspects of effective questions and responses. Questions must… Responses must…
- be effective at measuring your indicators - be consistent with one another - be specific - not be leading and not be judgmental - use simple words, or explain simply any technical
terms - be limited to questions you will use in your analysis - give structured guidance if observations are to be
made to avoid subjectivity
- guide enumerators - be of the appropriate type for the analysis, (i.e.
numbers, ranges of values, or words) - have space to add comments or a response choice
of “other_________________________”. - include important responses for clarity: for
example “none” or “same as dry season” or “don’t know”
- state if multiple responses are allowed - be adapted to the context - be realistic and simple
A questionnaire development process is suggested: - PM or lead should draft the questions and responses carefully, and then revise them during the training
with the enumerators. - A significant part of the training (also discussed below) should focus on the questionnaire and its wording.
During the training, go through each question and each response choice to ensure a coherent understanding by the team. This includes translation into local language (also discussed below).
- Revise the questionnaire. - Field‐test the revised questionnaire. - Debrief and revise again after field testing. VII. Problems in survey execution
Training of the team: The survey team is generally made up of a few supervisors and teams of enumerators, in addition to the program manager. The program manager should be familiar with surveys and basic statistics of surveys. The supervisors should be technical ACF staff who have a good understanding of the goals of the survey and the technical nuances of the terms etc. The enumerators should be familiar to the program, but are not required to be ACF staff (often in ACF we use the same enumerators on a casual basis over and over again). The team also may include data entry technicians, but it is sometimes better to have the supervisors enter their own data. The entire team (even the data entry person) should participate in the training.
The training should prepare the entire team to be ready to implement the survey. It should be about a week long. It should have 1 day in the field, testing the methods, and 1 day after that to debrief and revise the questionnaire and clarify the methodology.
- The entire questionnaire needs to be read through with the team for clarity and translations discussed (see below also).
- The enumerators should understand what the PM needs from each question.
Lessons Learnt from KAP Survey Failures
7
- Demonstrations of effective interview techniques should be done, especially focusing on how to properly execute prompting for responses and questions where prompting is not allowed.
In the Malualkon case, the enumerators were not trained to understand the questionnaire, let alone trained together to standardize their approach, resulting in each person administering the questionnaire differently, and often incorrectly. The answer depends on how the question is asked, so when different people asked it in different ways or record the answers differently, the result is inaccurate “data.”
While related to translation, the understanding of the goals of the survey needs to be emphasized to the enumerators and thus the issue of training the team is bigger than translation alone.
Several examples highlight these issues:
- For example, in Mayenulem Village, South Sudan the enumerator recorded “b. returnee” for 9 out of 10 surveys but never wrote from where or when the family returned. From background information gathered in the area, this is an error, as it is too high of a returnee % compared to past surveys/data.
- As another example, the enumerator for Rumgeng, South Sudan was the only one with responses “do not pay” to Q108. This was not a response choice, so the enumerator wrote this response in. Writing in a response that does not appear as a choice is not a problem (it is actually good practice), but the fact that ONLY one enumerator did this when it is clear that this is a common answer is the problem.
- Certain enumerators asked the question as “what should you do” rather than “what do you do.”
- Certain enumerators completed the surveys with only the multiple choice responses chosen (and often the ideal/”right” answer chosen), while other enumerators wrote‐in additional answers to questions that seemed more like what the respondent would have said if asked the question open‐ended (not read the answers).
Questionnaire Translation: Although a basic requirement, it is not always done in the field! If at all possible, it is best to develop a written translation of the questionnaire into the local language and have it crosschecked multiple times to create an accurate final draft. This will take extra effort but the results will be a high quality questionnaire, which then can be used by projects over and over (by your own organization and others)! If not possible to translate into a written form, at least hold an in‐depth training with all enumerators together, well before implementation to ensure everyone understands each question and then comes to a consensus on the terminology and methodology that will be used in administering the questionnaire. Time should be built into any good survey plan to ensure the training is conducted and questionnaire translations can be tested on community members with revisions prior to the actual implementation (as noted above).
In the Malualkon case study, the questionnaire was in English and the enumerators were not trained together to standardize the Dinka translation and there were issues in the way questions were asked and how responses were recorded. - For example, “unprotected” can be difficult to translate, so many enumerators circled “e. protected well”
instead of the proper answer “unprotected hand dug well,” which was not available. - Also, there is no word “malnourished” in Dinka and many local languages, so this word is often translated
differently by different people, resulting in non‐standardized answers and thus low‐quality data. - The understanding of the word “diarrhea” was unclear.
In Burma, there is no written form of the local dialect. Questionnaires are designed in English, translated in writing into Burmese, and questions translated on the spot by hygiene animators whose primary language was either Burmese or the local dialect. Some “ACF” words like “watsan” or “handpump” were used as such in the local language because the staffs knew about it from ACF, but couldn’t translate them. Only beneficiaries already targeted by previous NGO’s projects could then understand those words
Do not assume enumerators can translate from English/French/Spanish to local language (Dinka for example), much less on the spot while asking the questions in the households. The enumerators may not have a solid grasp of English itself, as well as the fact that technical words and the specifics of how words are used in the technical aspects of a WASH survey (for example) also may be new to them. Additionally, on‐the‐spot translation requires one to really understand the survey or else there is significant lag time in the enumerator
Lessons Learnt from KAP Survey Failures
8
reading the questions, formulating the translation and then asking it. This slows the survey down and often bores the respondents/takes too much of their time away from other activities which leads them to “hurry and finish” rather than answer honestly.
Ensuring a random sample: Sampling is not just about numbers and statistics, it is also about choosing the respondents in a random way. Random doesn’t mean hap‐hazard: it means in such a way that every member of the population has an equal chance at being chosen. The literature has many methods for ensuring randomness, but usually there are multiple stages of the random selection: villages are chosen randomly (it is not always necessary to visit every village in your target area), and the houses within the village are chosen randomly. Make sure your team understands the importance of following the random sampling methodology to avoid biases in the data.
- Practice random sampling in the field before hand. Sometimes what seems simple in the training or in a
book is more difficult in the field. Also, when the team is familiar with what to do before‐hand, they can be efficient during official data collection.
- Avoid convenience sampling of households: In the Malualkon example, Enumerators went to a cluster of houses that were easily accessible (off the main road) and so answers are not representative of the whole village. Random sampling methods are designed to eliminate this type of sampling bias and must be strictly followed to have representative data. In this case study, for example, for Ajeriak Village, all households surveyed live close to the hand pump, which will not give a representative estimate for use of water source, amount of time to collect water, volume of water used, etc. for the rest of the village. Non‐respondents or refusals were not recorded so again, only those enthusiastic to respond were surveyed which nulls the result.
The data collection process should be mapped out and formalized:
- A clear logistical plan should be in place as to not waste time getting the team going each morning. (How many cars, which drivers, where are they going each day, who is in each car, departure times etc.)
- Each day after data collection, a quality control review should be done on each team’s questionnaires by the supervisor. Then if there are clarifications needed, the interviews are fresh in the enumerators mind and any errors or misunderstandings are caught early and can be addressed.
- Also, a quick debrief each day as part of the quality control is a good idea to clarify any challenges or questions that arose during the data collection. Any clarifications or information should be shared with the entire team so everyone is on the same page. For example, if one enumerator had a question on a translation then clarified it, this information should be shared even if others didn’t have the same question. Make the point that if one person made a mistake, then chances are other people are making the same mistake (i.e. no shame).
- Data entry should begin after the first day of data collection, if at all possible (i.e. if you have a dedicated data entry person). In this way, again, any errors or misunderstandings related to the database can be discovered and clarified while the survey is still fresh in the teams mind. If you don’t have a dedicated data entry person, then the PM and/or supervisors entering a few sample questionnaires into the database can be another type of quality control. (There are even examples of the PM entering all the questionnaires at the end of each day, but this can be heavy and lead to tiredness and errors in data entry.)
VIII. Problems in Data Analysis This section is mostly drawn from experiences beyond the Malualkon case study, as this example was not able to perform a meaningful analysis of the data. Choose software appropriately: There are user‐friendly, sophisticated software like Sphinx, designed for survey design and analysis. These are excellent and their use is recommended, but if you want to use them, first ensure that you have a legal version, and secondly take the time to learn it ahead of time.
Lessons Learnt from KAP Survey Failures
9
Sphinx is a good example because it can ease the work of survey design: questionnaire design (including layout), database design (integrated) and data entry (including coding), graphs, and analysis. It helps the analyst pay attention and think about the data through 2 basic rules: 1) Do you want to measure “x against y”, or “y against x”? and 2) Is the question calculated against 100% (1 choice answer), or is it a multiple response (>100% OK). The basics of Sphinx can be learnt in about an hour, but a day is required to become comfortable and familiar in using it – and time is also required to train the team for data entry. If you don’t have access to Sphinx or time to learn it, Microsoft Word is fine for the questionnaire and Excel is fine for making a database and analysis. An example in Congo used Sphinx to design a beautiful survey and enter the data, but when it came time for analysis, the team ended up exporting the data to an Excel spreadsheet because no one on the team was familiar with the analysis part of Sphinx. The drawback of using Word and Excel is that if you rush and do not think critically about what your are trying to achieve there are more chances for errors in your survey design that Sphinx helps to avoid. The following are some ideas to keep in mind, in particular if you are using the Word and Excel option: - Design your database as you design your questionnaire: If you work on the questionnaire and the database
at the same time, you will be able to troubleshoot your questionnaire and your database as you go, hopefully eliminating any confusion down the road. Coding of responses can be difficult.
- Keep your database simple, concise and clear.
- An outsider should be able to look at your database and understand how to use it and what you have done in your calculations. Add notes about your calculations.
- Note any assumptions you have made (e.g. household size).
- When using Microsoft Excel, it is usually best to put the questions across the top (as columns) and the responses down the side (as rows). This allows the top few rows to be used for quality control checks and calculations.
- Likewise it is usually best to have your data entered on one sheet and make your calculations and graphs on subsequent sheets, perhaps grouped by theme (e.g. summary statistics, water questions, sanitation questions, etc.).
Errors will occur in data collection. Deal with errors in the data in a systematic and clear manner: - Collect a few extra questionnaires so that sample size remains big enough to give statistically significant
analysis, even if you have some null values or questionnaires that have to be discarded. - Develop a coding system for the database to deal with null or unclear responses. - Explain clearly in your reporting how you have handled questionable data and responses.
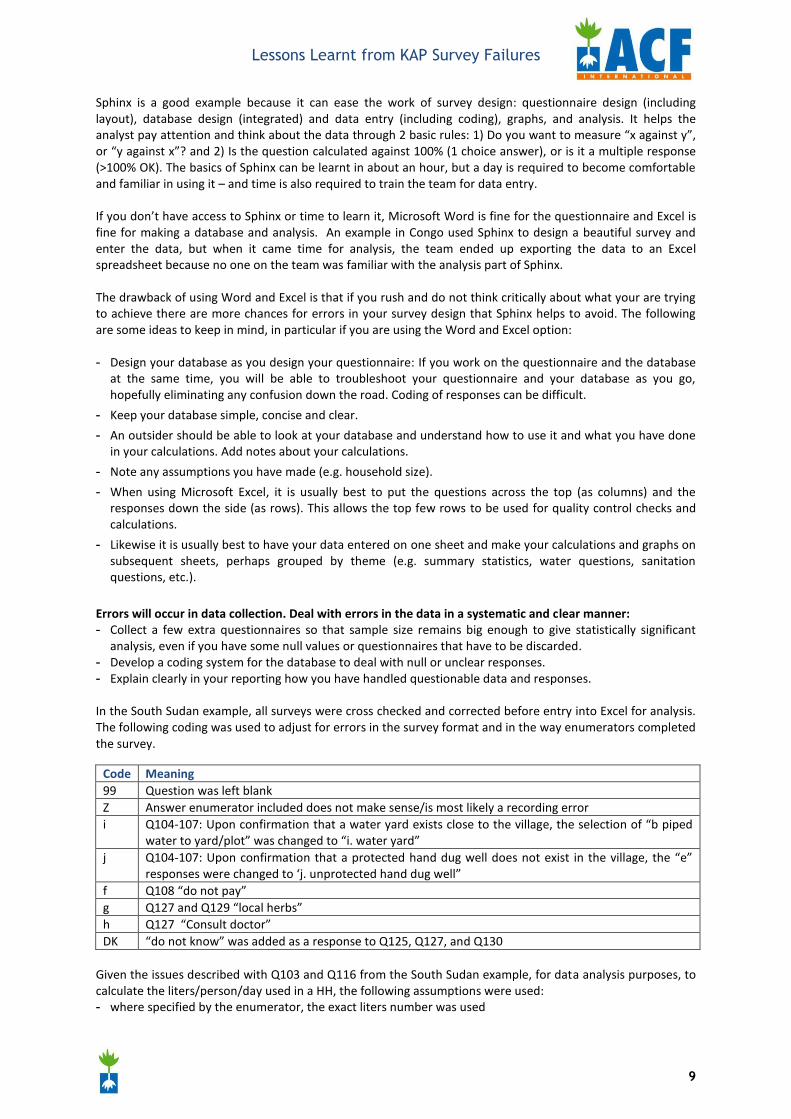
In the South Sudan example, all surveys were cross checked and corrected before entry into Excel for analysis. The following coding was used to adjust for errors in the survey format and in the way enumerators completed the survey.
Code Meaning 99 Question was left blank Z Answer enumerator included does not make sense/is most likely a recording error i Q104‐107: Upon confirmation that a water yard exists close to the village, the selection of “b piped
water to yard/plot” was changed to “i. water yard” j Q104‐107: Upon confirmation that a protected hand dug well does not exist in the village, the “e”
responses were changed to ‘j. unprotected hand dug well” f Q108 “do not pay” g Q127 and Q129 “local herbs” h Q127 “Consult doctor” DK “do not know” was added as a response to Q125, Q127, and Q130
Given the issues described with Q103 and Q116 from the South Sudan example, for data analysis purposes, to calculate the liters/person/day used in a HH, the following assumptions were used: - where specified by the enumerator, the exact liters number was used
Lessons Learnt from KAP Survey Failures
10
- when not specified (i.e. only interval circled) the greater end of the interval was used for number of liters
- if “f. >50l/HH/day” was selected but no specific number of liters was written, 60l was used for the calculation
Make backup copies onto different computers. Save often. (Field computers die often. There was a huge database in Uganda that is probably lost due to the fact that it was only stored on a single computer, which died.)
The key to effective data analysis is to reflect about what you are trying to show and to have an idea of how you will show this before you start. - Baseline or initial surveys aim to quantify the target population “before” the program or at a specific point
in time. It is to characterize a situation. o When choosing the geographical coverage of your baseline survey, consider your
implementation area. If the implementation area changes slightly, but within the same context, your baseline survey should still be generally valid.
o When timing the baseline survey, you may not have much choice, but if you do choose the time of year most relevant to your project, often the “lean time” (worst time of year) or dry season.
o If an indicator is not relevant to your program, then don’t measure it. For example, if you are not going to promote water treatment, then don’t ask about it.
o However it must also be noted that a baseline survey may be used to define and tailor the hygiene promotion messaging, in which case a wide range of hygiene practice topics will need to be covered by the survey (perhaps wider than your endline questionnaire).
- Endline or final surveys aim to measure the impact of a program by showing improvements (or not) of selected indicators.
o Sample only your intervention villages, i.e. the villages that benefitted from your program. In this manner your endline/final survey coverage may be smaller than your baseline (not usually by much and your sample size is generally the same).
o Use the same questionnaire and survey teams. Use the same database format. Do not reinvent the wheel.
o If the project timing permits, the baseline and endline surveys should be done in the same season. This provides fewer external variables for comparing the baseline and endline surveys. If not possible, then be sure to explicitly consider seasonal effects when in your analysis and reporting.
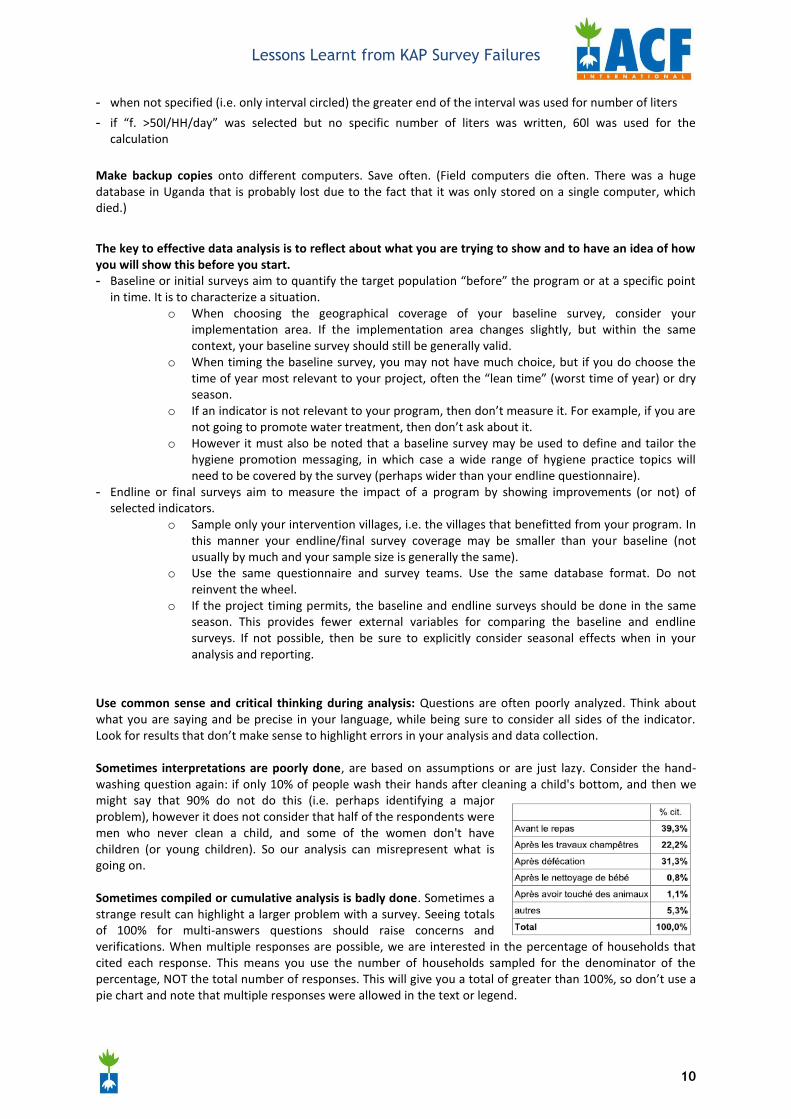
Use common sense and critical thinking during analysis: Questions are often poorly analyzed. Think about what you are saying and be precise in your language, while being sure to consider all sides of the indicator. Look for results that don’t make sense to highlight errors in your analysis and data collection. Sometimes interpretations are poorly done, are based on assumptions or are just lazy. Consider the hand‐washing question again: if only 10% of people wash their hands after cleaning a child's bottom, and then we might say that 90% do not do this (i.e. perhaps identifying a major problem), however it does not consider that half of the respondents were men who never clean a child, and some of the women don't have children (or young children). So our analysis can misrepresent what is going on. Sometimes compiled or cumulative analysis is badly done. Sometimes a strange result can highlight a larger problem with a survey. Seeing totals of 100% for multi‐answers questions should raise concerns and verifications. When multiple responses are possible, we are interested in the percentage of households that cited each response. This means you use the number of households sampled for the denominator of the percentage, NOT the total number of responses. This will give you a total of greater than 100%, so don’t use a pie chart and note that multiple responses were allowed in the text or legend.
Lessons Learnt from KAP Survey Failures
11
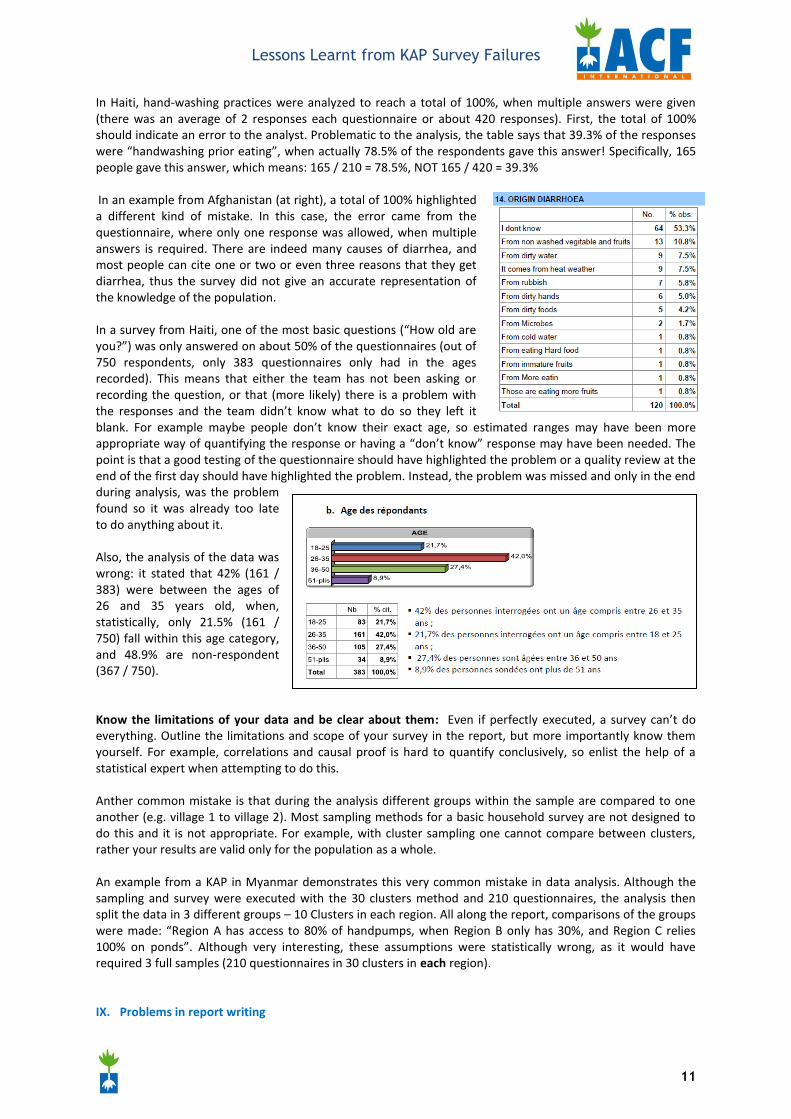
In Haiti, hand‐washing practices were analyzed to reach a total of 100%, when multiple answers were given (there was an average of 2 responses each questionnaire or about 420 responses). First, the total of 100% should indicate an error to the analyst. Problematic to the analysis, the table says that 39.3% of the responses were “handwashing prior eating”, when actually 78.5% of the respondents gave this answer! Specifically, 165 people gave this answer, which means: 165 / 210 = 78.5%, NOT 165 / 420 = 39.3% In an example from Afghanistan (at right), a total of 100% highlighted a different kind of mistake. In this case, the error came from the questionnaire, where only one response was allowed, when multiple answers is required. There are indeed many causes of diarrhea, and most people can cite one or two or even three reasons that they get diarrhea, thus the survey did not give an accurate representation of the knowledge of the population. In a survey from Haiti, one of the most basic questions (“How old are you?”) was only answered on about 50% of the questionnaires (out of 750 respondents, only 383 questionnaires only had in the ages recorded). This means that either the team has not been asking or recording the question, or that (more likely) there is a problem with the responses and the team didn’t know what to do so they left it blank. For example maybe people don’t know their exact age, so estimated ranges may have been more appropriate way of quantifying the response or having a “don’t know” response may have been needed. The point is that a good testing of the questionnaire should have highlighted the problem or a quality review at the end of the first day should have highlighted the problem. Instead, the problem was missed and only in the end during analysis, was the problem found so it was already too late to do anything about it. Also, the analysis of the data was wrong: it stated that 42% (161 / 383) were between the ages of 26 and 35 years old, when, statistically, only 21.5% (161 / 750) fall within this age category, and 48.9% are non‐respondent (367 / 750).
Know the limitations of your data and be clear about them: Even if perfectly executed, a survey can’t do everything. Outline the limitations and scope of your survey in the report, but more importantly know them yourself. For example, correlations and causal proof is hard to quantify conclusively, so enlist the help of a statistical expert when attempting to do this. Anther common mistake is that during the analysis different groups within the sample are compared to one another (e.g. village 1 to village 2). Most sampling methods for a basic household survey are not designed to do this and it is not appropriate. For example, with cluster sampling one cannot compare between clusters, rather your results are valid only for the population as a whole. An example from a KAP in Myanmar demonstrates this very common mistake in data analysis. Although the sampling and survey were executed with the 30 clusters method and 210 questionnaires, the analysis then split the data in 3 different groups – 10 Clusters in each region. All along the report, comparisons of the groups were made: “Region A has access to 80% of handpumps, when Region B only has 30%, and Region C relies 100% on ponds”. Although very interesting, these assumptions were statistically wrong, as it would have required 3 full samples (210 questionnaires in 30 clusters in each region). IX. Problems in report writing
Lessons Learnt from KAP Survey Failures
12
children 5 yrsMean = 1.71Median = 2.00Min = 0.00 Max = 8.00
Less than 1 20 10.3%1 67 34.5%2 71 36.6%3 28 14.4%4 5 2.6%5 and more 3 1.5%Total 194 100.0%
10.3%
34.5%
36.6%
14.4%
2.6%
1.5%
collector
w oman 92.4%children 35.0%man 8.1% w oman (92.4%)
children (35.0%)man (8.1%)
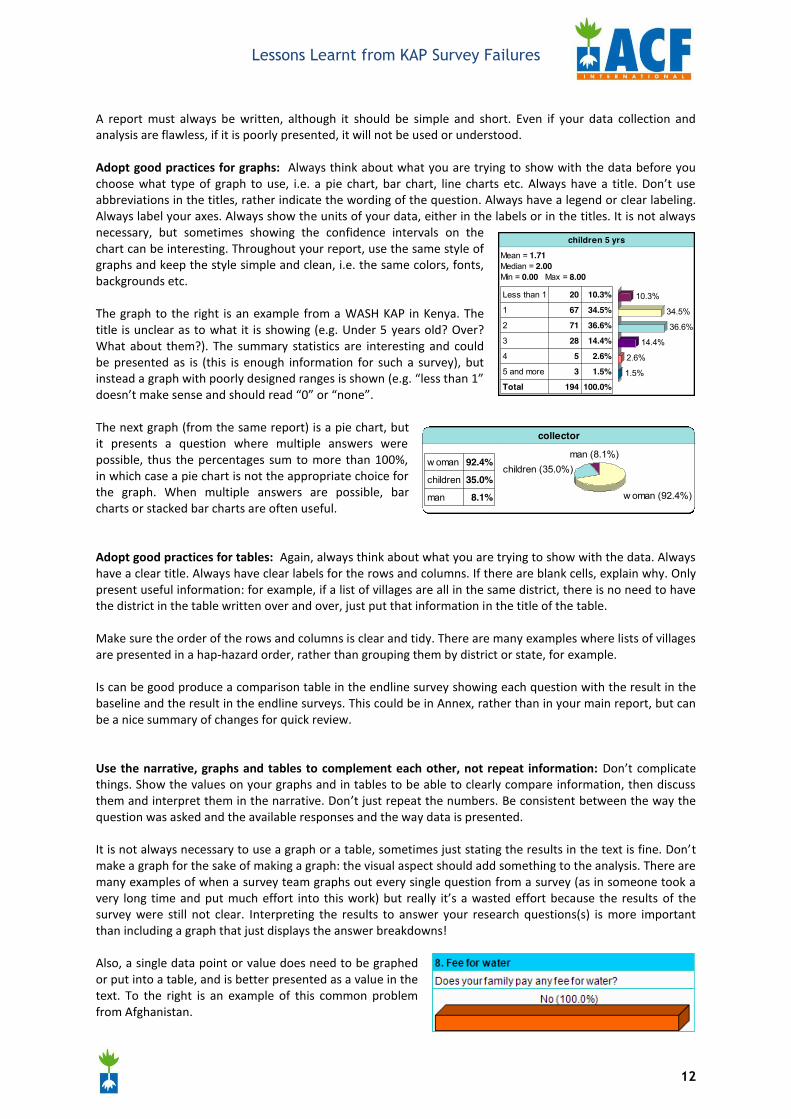
A report must always be written, although it should be simple and short. Even if your data collection and analysis are flawless, if it is poorly presented, it will not be used or understood. Adopt good practices for graphs: Always think about what you are trying to show with the data before you choose what type of graph to use, i.e. a pie chart, bar chart, line charts etc. Always have a title. Don’t use abbreviations in the titles, rather indicate the wording of the question. Always have a legend or clear labeling. Always label your axes. Always show the units of your data, either in the labels or in the titles. It is not always necessary, but sometimes showing the confidence intervals on the chart can be interesting. Throughout your report, use the same style of graphs and keep the style simple and clean, i.e. the same colors, fonts, backgrounds etc. The graph to the right is an example from a WASH KAP in Kenya. The title is unclear as to what it is showing (e.g. Under 5 years old? Over? What about them?). The summary statistics are interesting and could be presented as is (this is enough information for such a survey), but instead a graph with poorly designed ranges is shown (e.g. “less than 1” doesn’t make sense and should read “0” or “none”. The next graph (from the same report) is a pie chart, but it presents a question where multiple answers were possible, thus the percentages sum to more than 100%, in which case a pie chart is not the appropriate choice for the graph. When multiple answers are possible, bar charts or stacked bar charts are often useful. Adopt good practices for tables: Again, always think about what you are trying to show with the data. Always have a clear title. Always have clear labels for the rows and columns. If there are blank cells, explain why. Only present useful information: for example, if a list of villages are all in the same district, there is no need to have the district in the table written over and over, just put that information in the title of the table. Make sure the order of the rows and columns is clear and tidy. There are many examples where lists of villages are presented in a hap‐hazard order, rather than grouping them by district or state, for example. Is can be good produce a comparison table in the endline survey showing each question with the result in the baseline and the result in the endline surveys. This could be in Annex, rather than in your main report, but can be a nice summary of changes for quick review. Use the narrative, graphs and tables to complement each other, not repeat information: Don’t complicate things. Show the values on your graphs and in tables to be able to clearly compare information, then discuss them and interpret them in the narrative. Don’t just repeat the numbers. Be consistent between the way the question was asked and the available responses and the way data is presented. It is not always necessary to use a graph or a table, sometimes just stating the results in the text is fine. Don’t make a graph for the sake of making a graph: the visual aspect should add something to the analysis. There are many examples of when a survey team graphs out every single question from a survey (as in someone took a very long time and put much effort into this work) but really it’s a wasted effort because the results of the survey were still not clear. Interpreting the results to answer your research questions(s) is more important than including a graph that just displays the answer breakdowns! Also, a single data point or value does need to be graphed or put into a table, and is better presented as a value in the text. To the right is an example of this common problem from Afghanistan.
Lessons Learnt from KAP Survey Failures
13
Draw conclusions intelligently: This is a very common error. Think about big picture issues. Think about factors outside your program. When stuck or unsure, consult local people (actually always a good idea to involve local staff or key informants from the area to help you understand your results). Think about seasonality. - A KAP from Kenya showed a decrease in latrine coverage, but the program had built many latrines. Upon
further inspection it was clear from the housing type and verified in the field that many nomadic pastoralists had moved into town for the dry season, thus affecting the results of the survey.
- An integrated survey, also in Kenya, showed significant reduction in malnutrition, attributing this to ACF’s programs. While there was some positive impact from ACF, it was also clear that environmental and market improvements were contributing as well. Poorly analyzed and self‐serving conclusions such as this can in fact detract from the survey by reducing the perceived trustworthiness of the report.
X. Conclusions We hope that this document brings to light the many mistakes we make during the implementation of household surveys. We are sure you have your own funny stories of silly mistakes you have seen as well. When you make these mistakes, know you are not alone. Everyone makes them. The point is that not everyone admits they make errors and thus they are not addressed or corrected. In your next survey, please consider:
1) Choose an appropriate sampling method, understand it and its limitations, and implement it properly. a. In most cases, the most common method is appropriate. b. If you are having trouble with this technical part, ask for help. (It’s not easy!) c. Don’t use terminology you don’t understand.
2) The questionnaire design and testing are key steps to making a survey fool‐proof. The South Sudan example highlights this point extensively.
a. Questions and responses must be carefully thought out and designed. b. Get the translation correct. c. Test the survey and then revise it.
3) Team training must be thorough and the leaders must make special efforts during the survey exercise to ensure quality control of data collection from the beginning to avoid bad surprises in the end.
a. Take enough time for the training. b. Have a logistical plan that is clear for everyone. c. Build in quality control checks during data collection to correct errors as they happen.
4) Follow basic best practices for data analysis, presentation, and reporting. a. Make sure your database is clear to an outsider and simple. b. Use graphs and tables appropriately. c. Think critically about what you are calculating and the conclusions you draw.
5) Most importantly, when you discover an error in your surveys (and you will), discuss it and find a solution to address it quickly and openly.
Lessons Learnt from KAP Survey Failures
14
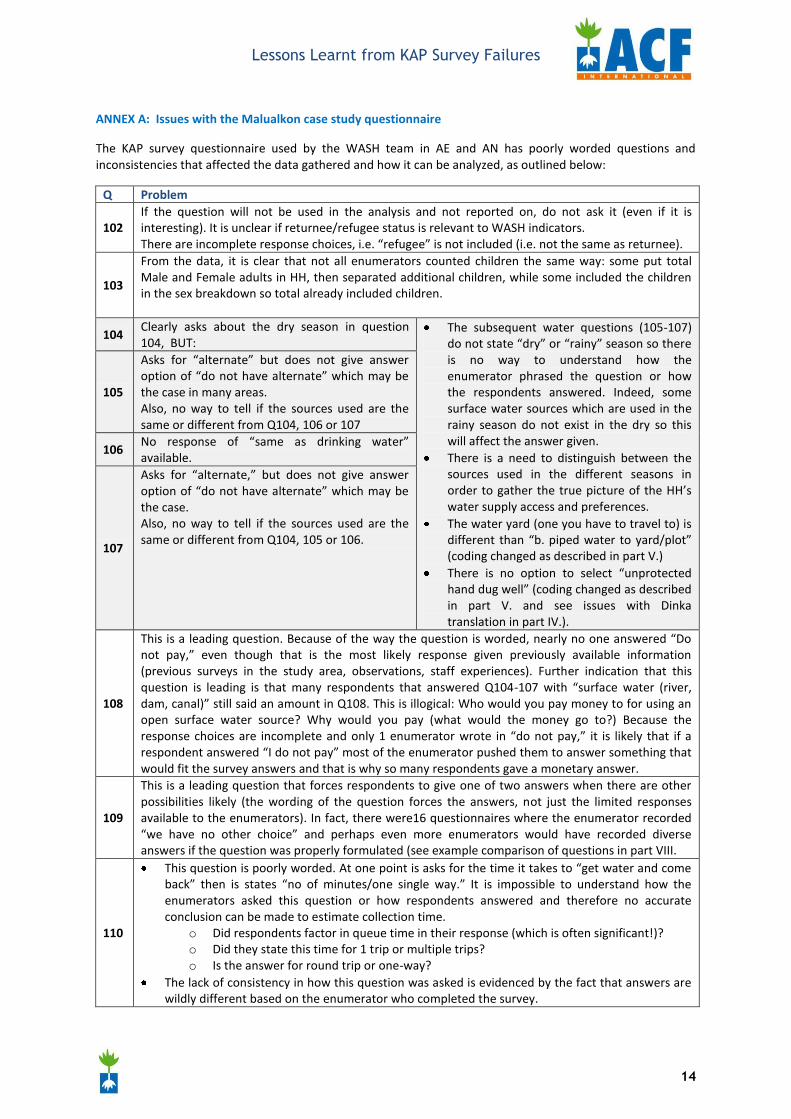
ANNEX A: Issues with the Malualkon case study questionnaire
The KAP survey questionnaire used by the WASH team in AE and AN has poorly worded questions and inconsistencies that affected the data gathered and how it can be analyzed, as outlined below:
Q Problem
102 If the question will not be used in the analysis and not reported on, do not ask it (even if it is interesting). It is unclear if returnee/refugee status is relevant to WASH indicators. There are incomplete response choices, i.e. “refugee” is not included (i.e. not the same as returnee).
103
From the data, it is clear that not all enumerators counted children the same way: some put total Male and Female adults in HH, then separated additional children, while some included the children in the sex breakdown so total already included children.
104 Clearly asks about the dry season in question 104, BUT:
The subsequent water questions (105‐107) do not state “dry” or “rainy” season so there is no way to understand how the enumerator phrased the question or how the respondents answered. Indeed, some surface water sources which are used in the rainy season do not exist in the dry so this will affect the answer given.
There is a need to distinguish between the sources used in the different seasons in order to gather the true picture of the HH’s water supply access and preferences.
The water yard (one you have to travel to) is different than “b. piped water to yard/plot” (coding changed as described in part V.)
There is no option to select “unprotected hand dug well” (coding changed as described in part V. and see issues with Dinka translation in part IV.).
105
Asks for “alternate” but does not give answer option of “do not have alternate” which may be the case in many areas. Also, no way to tell if the sources used are the same or different from Q104, 106 or 107
106 No response of “same as drinking water” available.
107
Asks for “alternate,” but does not give answer option of “do not have alternate” which may be the case. Also, no way to tell if the sources used are the same or different from Q104, 105 or 106.
108
This is a leading question. Because of the way the question is worded, nearly no one answered “Do not pay,” even though that is the most likely response given previously available information (previous surveys in the study area, observations, staff experiences). Further indication that this question is leading is that many respondents that answered Q104‐107 with “surface water (river, dam, canal)” still said an amount in Q108. This is illogical: Who would you pay money to for using an open surface water source? Why would you pay (what would the money go to?) Because the response choices are incomplete and only 1 enumerator wrote in “do not pay,” it is likely that if a respondent answered “I do not pay” most of the enumerator pushed them to answer something that would fit the survey answers and that is why so many respondents gave a monetary answer.
109
This is a leading question that forces respondents to give one of two answers when there are other possibilities likely (the wording of the question forces the answers, not just the limited responses available to the enumerators). In fact, there were16 questionnaires where the enumerator recorded “we have no other choice” and perhaps even more enumerators would have recorded diverse answers if the question was properly formulated (see example comparison of questions in part VIII.
110
This question is poorly worded. At one point is asks for the time it takes to “get water and come back” then is states “no of minutes/one single way.” It is impossible to understand how the enumerators asked this question or how respondents answered and therefore no accurate conclusion can be made to estimate collection time.
o Did respondents factor in queue time in their response (which is often significant!)? o Did they state this time for 1 trip or multiple trips? o Is the answer for round trip or one‐way?
The lack of consistency in how this question was asked is evidenced by the fact that answers are wildly different based on the enumerator who completed the survey.
Lessons Learnt from KAP Survey Failures
15
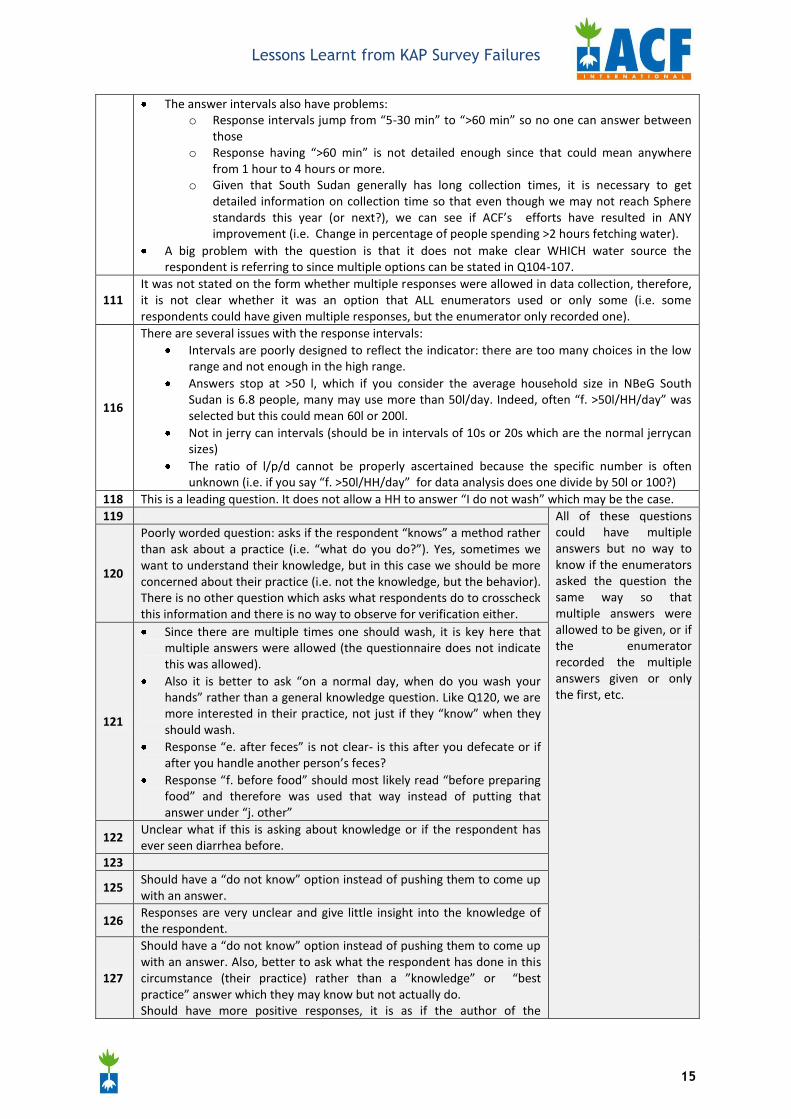
The answer intervals also have problems: o Response intervals jump from “5‐30 min” to “>60 min” so no one can answer between
those o Response having “>60 min” is not detailed enough since that could mean anywhere
from 1 hour to 4 hours or more. o Given that South Sudan generally has long collection times, it is necessary to get
detailed information on collection time so that even though we may not reach Sphere standards this year (or next?), we can see if ACF’s efforts have resulted in ANY improvement (i.e. Change in percentage of people spending >2 hours fetching water).
A big problem with the question is that it does not make clear WHICH water source the respondent is referring to since multiple options can be stated in Q104‐107.
111 It was not stated on the form whether multiple responses were allowed in data collection, therefore, it is not clear whether it was an option that ALL enumerators used or only some (i.e. some respondents could have given multiple responses, but the enumerator only recorded one).
116
There are several issues with the response intervals: Intervals are poorly designed to reflect the indicator: there are too many choices in the low
range and not enough in the high range. Answers stop at >50 l, which if you consider the average household size in NBeG South
Sudan is 6.8 people, many may use more than 50l/day. Indeed, often “f. >50l/HH/day” was selected but this could mean 60l or 200l.
Not in jerry can intervals (should be in intervals of 10s or 20s which are the normal jerrycan sizes)
The ratio of l/p/d cannot be properly ascertained because the specific number is often unknown (i.e. if you say “f. >50l/HH/day” for data analysis does one divide by 50l or 100?)
118 This is a leading question. It does not allow a HH to answer “I do not wash” which may be the case. 119 All of these questions
could have multiple answers but no way to know if the enumerators asked the question the same way so that multiple answers were allowed to be given, or if the enumerator recorded the multiple answers given or only the first, etc.
120
Poorly worded question: asks if the respondent “knows” a method rather than ask about a practice (i.e. “what do you do?”). Yes, sometimes we want to understand their knowledge, but in this case we should be more concerned about their practice (i.e. not the knowledge, but the behavior). There is no other question which asks what respondents do to crosscheck this information and there is no way to observe for verification either.
121
Since there are multiple times one should wash, it is key here that multiple answers were allowed (the questionnaire does not indicate this was allowed).
Also it is better to ask “on a normal day, when do you wash your hands” rather than a general knowledge question. Like Q120, we are more interested in their practice, not just if they “know” when they should wash.
Response “e. after feces” is not clear‐ is this after you defecate or if after you handle another person’s feces?
Response “f. before food” should most likely read “before preparing food” and therefore was used that way instead of putting that answer under “j. other”
122 Unclear what if this is asking about knowledge or if the respondent has ever seen diarrhea before.
123
125 Should have a “do not know” option instead of pushing them to come up with an answer.
126 Responses are very unclear and give little insight into the knowledge of the respondent.
127
Should have a “do not know” option instead of pushing them to come up with an answer. Also, better to ask what the respondent has done in this circumstance (their practice) rather than a ”knowledge” or “best practice” answer which they may know but not actually do. Should have more positive responses, it is as if the author of the
Lessons Learnt from KAP Survey Failures
16
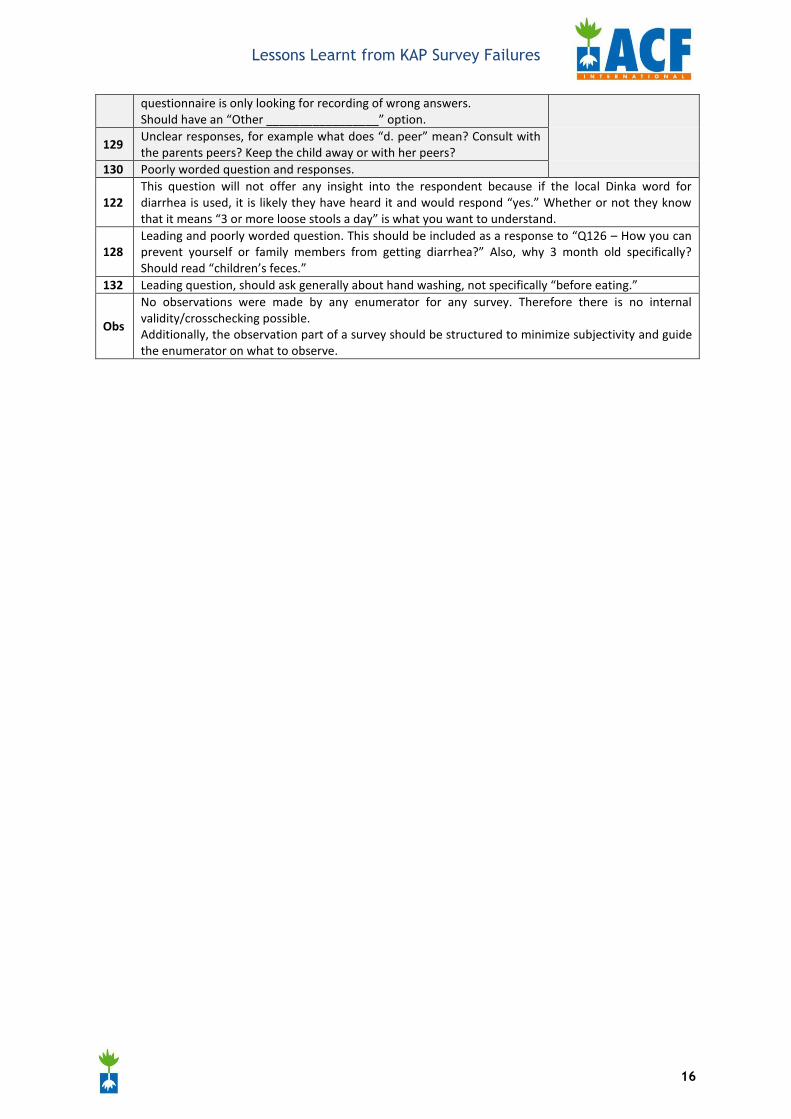
questionnaire is only looking for recording of wrong answers. Should have an “Other _________________” option.
129 Unclear responses, for example what does “d. peer” mean? Consult with the parents peers? Keep the child away or with her peers?
130 Poorly worded question and responses.
122 This question will not offer any insight into the respondent because if the local Dinka word for diarrhea is used, it is likely they have heard it and would respond “yes.” Whether or not they know that it means “3 or more loose stools a day” is what you want to understand.
128 Leading and poorly worded question. This should be included as a response to “Q126 – How you can prevent yourself or family members from getting diarrhea?” Also, why 3 month old specifically? Should read “children’s feces.”
132 Leading question, should ask generally about hand washing, not specifically “before eating.”
Obs
No observations were made by any enumerator for any survey. Therefore there is no internal validity/crosschecking possible. Additionally, the observation part of a survey should be structured to minimize subjectivity and guide the enumerator on what to observe.
Lessons Learnt from KAP Survey Failures
17
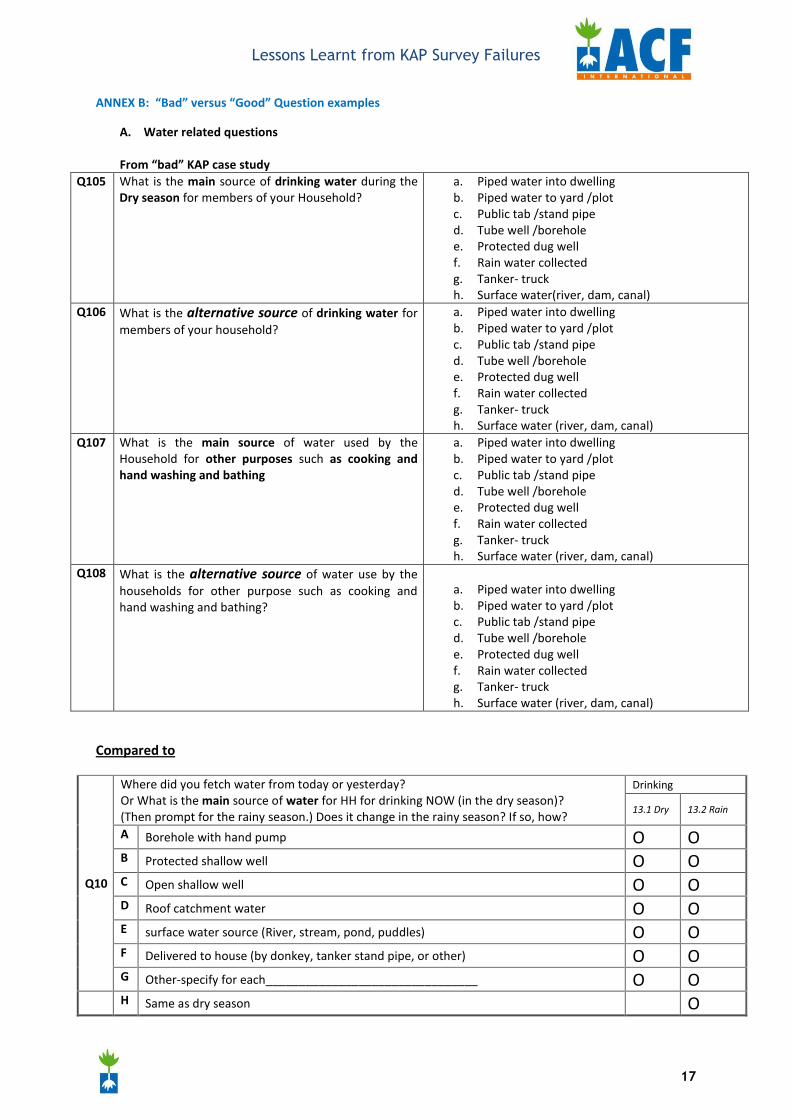
ANNEX B: “Bad” versus “Good” Question examples
A. Water related questions
From “bad” KAP case study Q105 What is the main source of drinking water during the
Dry season for members of your Household?
a. Piped water into dwelling b. Piped water to yard /plot c. Public tab /stand pipe d. Tube well /borehole e. Protected dug well f. Rain water collected g. Tanker‐ truck h. Surface water(river, dam, canal)
Q106 What is the alternative source of drinking water for members of your household?
a. Piped water into dwelling b. Piped water to yard /plot c. Public tab /stand pipe d. Tube well /borehole e. Protected dug well f. Rain water collected g. Tanker‐ truck h. Surface water (river, dam, canal)
Q107 What is the main source of water used by the Household for other purposes such as cooking and hand washing and bathing
a. Piped water into dwelling b. Piped water to yard /plot c. Public tab /stand pipe d. Tube well /borehole e. Protected dug well f. Rain water collected g. Tanker‐ truck h. Surface water (river, dam, canal)
Q108 What is the alternative source of water use by the households for other purpose such as cooking and hand washing and bathing?
a. Piped water into dwelling b. Piped water to yard /plot c. Public tab /stand pipe d. Tube well /borehole e. Protected dug well f. Rain water collected g. Tanker‐ truck h. Surface water (river, dam, canal)
Compared to
Q10
Where did you fetch water from today or yesterday? Or What is the main source of water for HH for drinking NOW (in the dry season)? (Then prompt for the rainy season.) Does it change in the rainy season? If so, how?
Drinking
13.1 Dry 13.2 Rain
A Borehole with hand pump O O B Protected shallow well O O C Open shallow well O O D Roof catchment water O O E surface water source (River, stream, pond, puddles) O O F Delivered to house (by donkey, tanker stand pipe, or other) O O G Other‐specify for each________________________________ O O
H Same as dry season O
Lessons Learnt from KAP Survey Failures
18
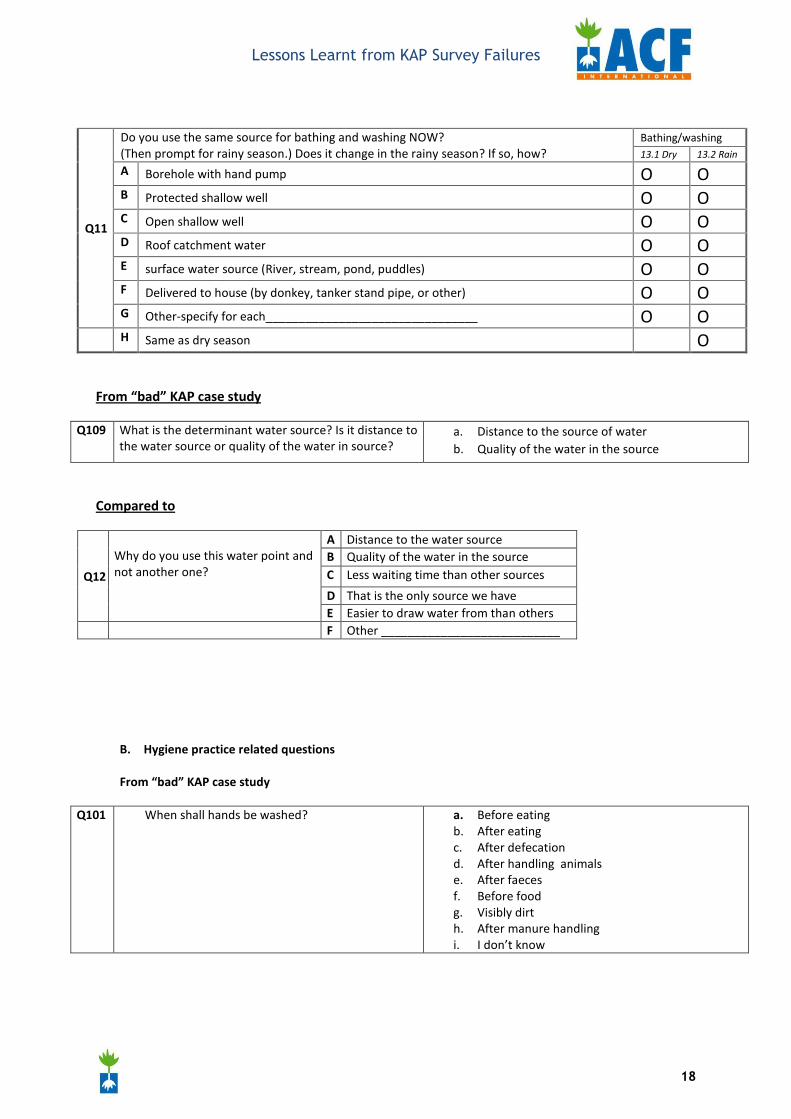
Q11
Do you use the same source for bathing and washing NOW? (Then prompt for rainy season.) Does it change in the rainy season? If so, how?
Bathing/washing 13.1 Dry 13.2 Rain
A Borehole with hand pump O O B Protected shallow well O O C Open shallow well O O D Roof catchment water O O E surface water source (River, stream, pond, puddles) O O F Delivered to house (by donkey, tanker stand pipe, or other) O O G Other‐specify for each________________________________ O O
H Same as dry season O
From “bad” KAP case study
Q109 What is the determinant water source? Is it distance to the water source or quality of the water in source?
a. Distance to the source of water b. Quality of the water in the source
Compared to
Q12
Why do you use this water point and not another one?
A Distance to the water source B Quality of the water in the source C Less waiting time than other sources
D That is the only source we have E Easier to draw water from than others
F Other ___________________________
B. Hygiene practice related questions From “bad” KAP case study
Q101 When shall hands be washed?
a. Before eating b. After eating c. After defecation d. After handling animals e. After faeces f. Before food g. Visibly dirt h. After manure handling i. I don’t know
Lessons Learnt from KAP Survey Failures
19
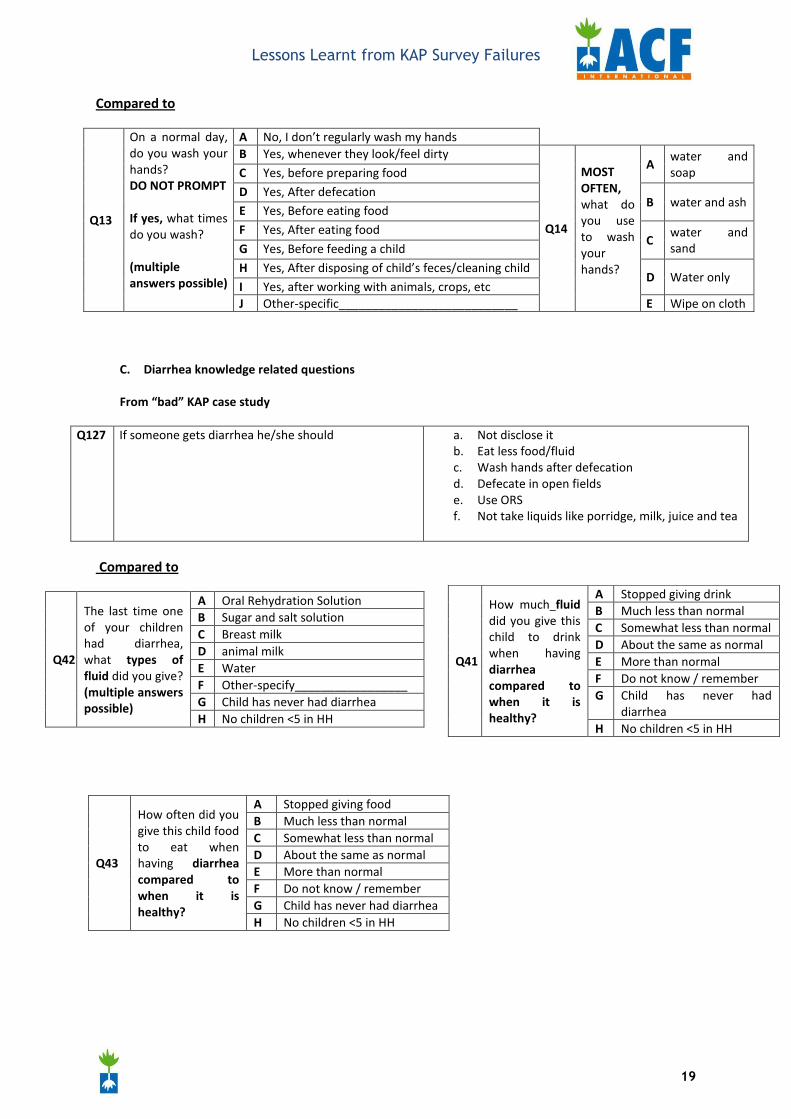
Compared to
Q13
On a normal day, do you wash your hands? DO NOT PROMPT If yes, what times do you wash? (multiple answers possible)
A No, I don’t regularly wash my hands B Yes, whenever they look/feel dirty
Q14
MOST OFTEN, what do you use to wash your hands?
A water and soap C Yes, before preparing food
D Yes, After defecation B water and ash
E Yes, Before eating food
F Yes, After eating food C
water and sand G Yes, Before feeding a child
H Yes, After disposing of child’s feces/cleaning child D Water only
I Yes, after working with animals, crops, etc J Other‐specific___________________________ E Wipe on cloth
C. Diarrhea knowledge related questions
From “bad” KAP case study
Q127 If someone gets diarrhea he/she should
a. Not disclose it b. Eat less food/fluid c. Wash hands after defecation d. Defecate in open fields e. Use ORS f. Not take liquids like porridge, milk, juice and tea
Compared to
Q42
The last time one of your children had diarrhea, what types of fluid did you give? (multiple answers possible)
A Oral Rehydration Solution B Sugar and salt solution C Breast milk D animal milk E Water F Other‐specify_________________ G Child has never had diarrhea H No children <5 in HH
Q43
How often did you give this child food to eat when having diarrhea compared to when it is healthy?
A Stopped giving food B Much less than normal C Somewhat less than normal D About the same as normal E More than normal F Do not know / remember G Child has never had diarrhea H No children <5 in HH
Q41
How much fluid did you give this child to drink when having diarrhea compared to when it is healthy?
A Stopped giving drink B Much less than normal C Somewhat less than normal D About the same as normal E More than normal F Do not know / remember G Child has never had
diarrhea H No children <5 in HH
Lessons Learnt from KAP Survey Failures
20
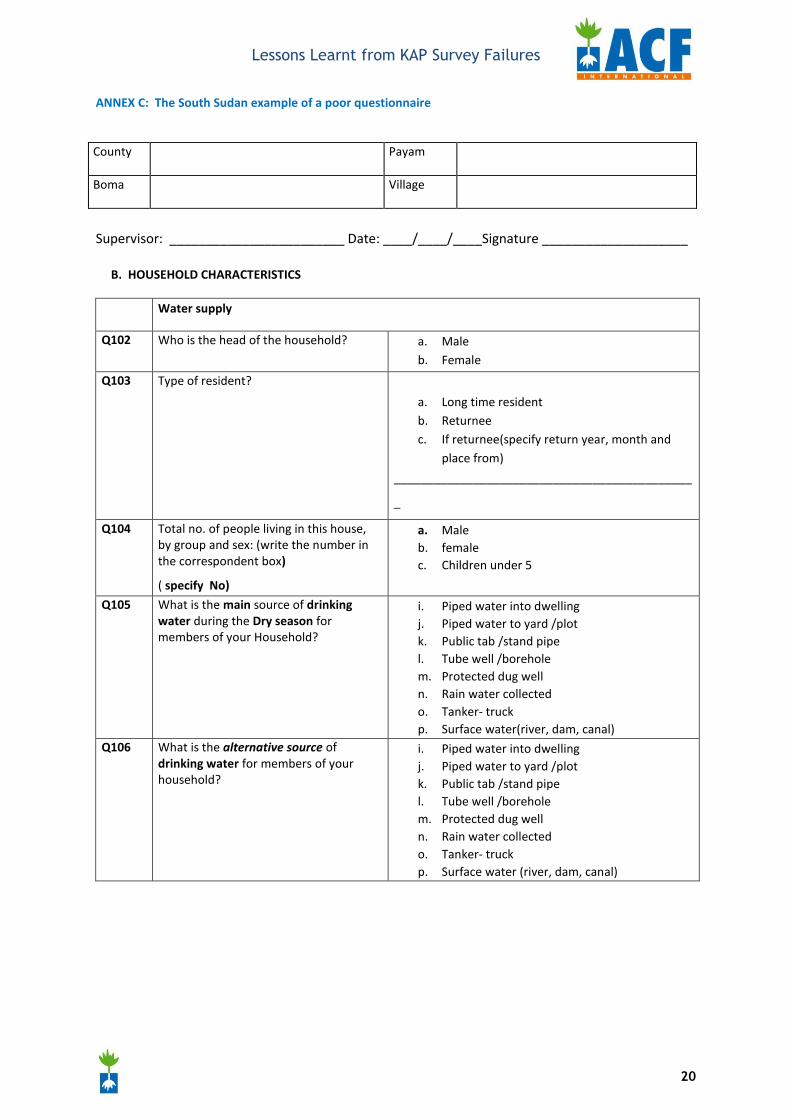
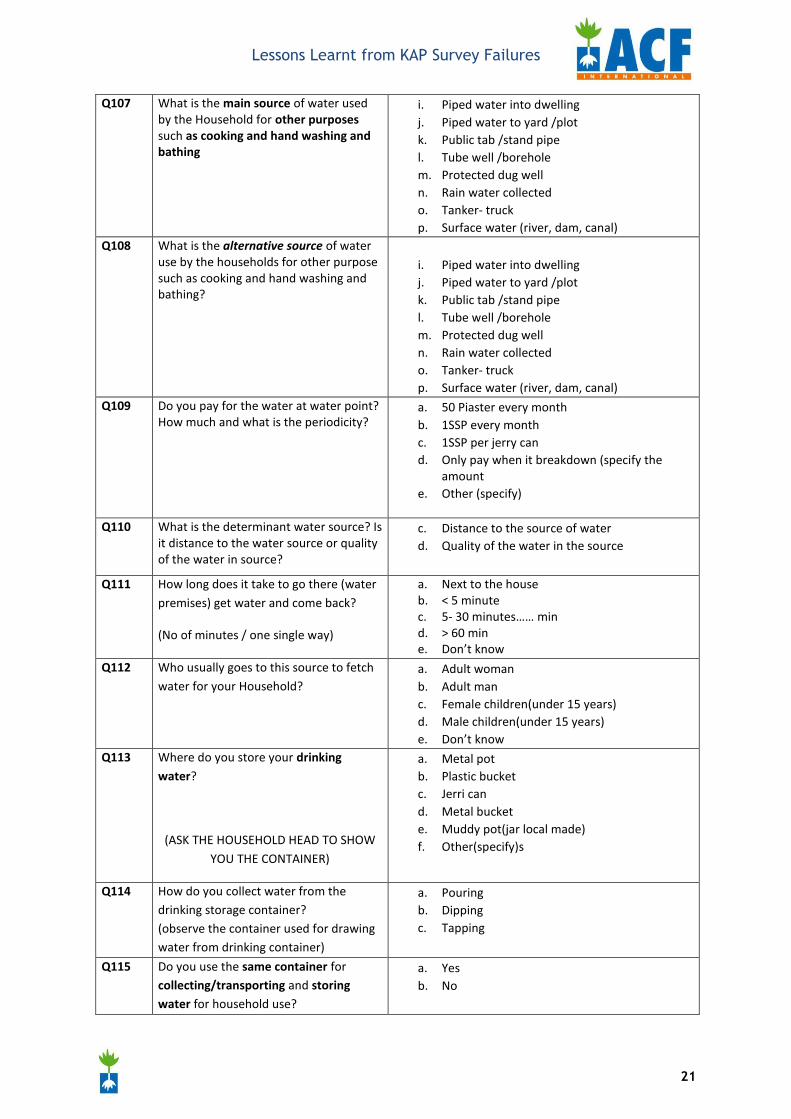
ANNEX C: The South Sudan example of a poor questionnaire
Supervisor: ________________________ Date: ____/____/____Signature ____________________
B. HOUSEHOLD CHARACTERISTICS
Water supply
Q102 Who is the head of the household? a. Male b. Female
Q103 Type of resident?
a. Long time resident b. Returnee c. If returnee(specify return year, month and
place from)
_____________________________________________
_
Q104 Total no. of people living in this house, by group and sex: (write the number in the correspondent box)
( specify No)
a. Male b. female c. Children under 5
Q105 What is the main source of drinking water during the Dry season for members of your Household?
i. Piped water into dwelling j. Piped water to yard /plot k. Public tab /stand pipe l. Tube well /borehole m. Protected dug well n. Rain water collected o. Tanker‐ truck p. Surface water(river, dam, canal)
Q106 What is the alternative source of drinking water for members of your household?
i. Piped water into dwelling j. Piped water to yard /plot k. Public tab /stand pipe l. Tube well /borehole m. Protected dug well n. Rain water collected o. Tanker‐ truck p. Surface water (river, dam, canal)
County Payam
Boma Village
Lessons Learnt from KAP Survey Failures
21
Q107 What is the main source of water used by the Household for other purposes such as cooking and hand washing and bathing
i. Piped water into dwelling j. Piped water to yard /plot k. Public tab /stand pipe l. Tube well /borehole m. Protected dug well n. Rain water collected o. Tanker‐ truck p. Surface water (river, dam, canal)
Q108 What is the alternative source of water use by the households for other purpose such as cooking and hand washing and bathing?
i. Piped water into dwelling j. Piped water to yard /plot k. Public tab /stand pipe l. Tube well /borehole m. Protected dug well n. Rain water collected o. Tanker‐ truck p. Surface water (river, dam, canal)
Q109 Do you pay for the water at water point? How much and what is the periodicity?
a. 50 Piaster every month b. 1SSP every month c. 1SSP per jerry can d. Only pay when it breakdown (specify the
amount e. Other (specify)
Q110 What is the determinant water source? Is
it distance to the water source or quality of the water in source?
c. Distance to the source of water d. Quality of the water in the source
Q111 How long does it take to go there (water premises) get water and come back?
(No of minutes / one single way)
a. Next to the house b. < 5 minute c. 5‐ 30 minutes…… min d. > 60 min e. Don’t know
Q112 Who usually goes to this source to fetch water for your Household?
a. Adult woman b. Adult man c. Female children(under 15 years) d. Male children(under 15 years) e. Don’t know
Q113 Where do you store your drinking water?
(ASK THE HOUSEHOLD HEAD TO SHOW YOU THE CONTAINER)
a. Metal pot b. Plastic bucket c. Jerri can d. Metal bucket e. Muddy pot(jar local made) f. Other(specify)s
Q114 How do you collect water from the drinking storage container? (observe the container used for drawing water from drinking container)
a. Pouring b. Dipping c. Tapping
Q115 Do you use the same container for collecting/transporting and storing water for household use?
a. Yes b. No
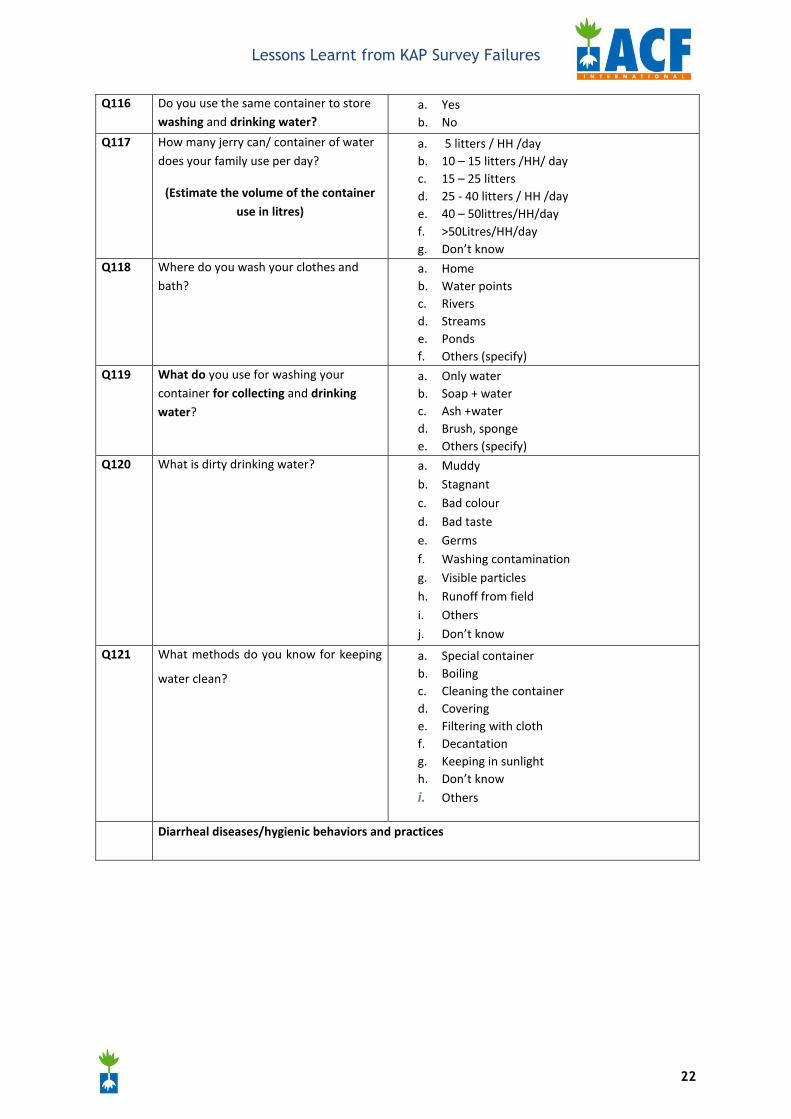
Lessons Learnt from KAP Survey Failures
22
Q116 Do you use the same container to store washing and drinking water?
a. Yes b. No
Q117 How many jerry can/ container of water does your family use per day?
(Estimate the volume of the container use in litres)
a. 5 litters / HH /day b. 10 – 15 litters /HH/ day c. 15 – 25 litters d. 25 ‐ 40 litters / HH /day e. 40 – 50littres/HH/day f. >50Litres/HH/day g. Don’t know
Q118 Where do you wash your clothes and bath?
a. Home b. Water points c. Rivers d. Streams e. Ponds f. Others (specify)
Q119 What do you use for washing your container for collecting and drinking water?
a. Only water b. Soap + water c. Ash +water d. Brush, sponge e. Others (specify)
Q120 What is dirty drinking water?
a. Muddy b. Stagnant c. Bad colour d. Bad taste e. Germs f. Washing contamination g. Visible particles h. Runoff from field i. Others j. Don’t know
Q121 What methods do you know for keeping
water clean?
a. Special container b. Boiling c. Cleaning the container d. Covering e. Filtering with cloth f. Decantation g. Keeping in sunlight h. Don’t know i. Others
Diarrheal diseases/hygienic behaviors and practices
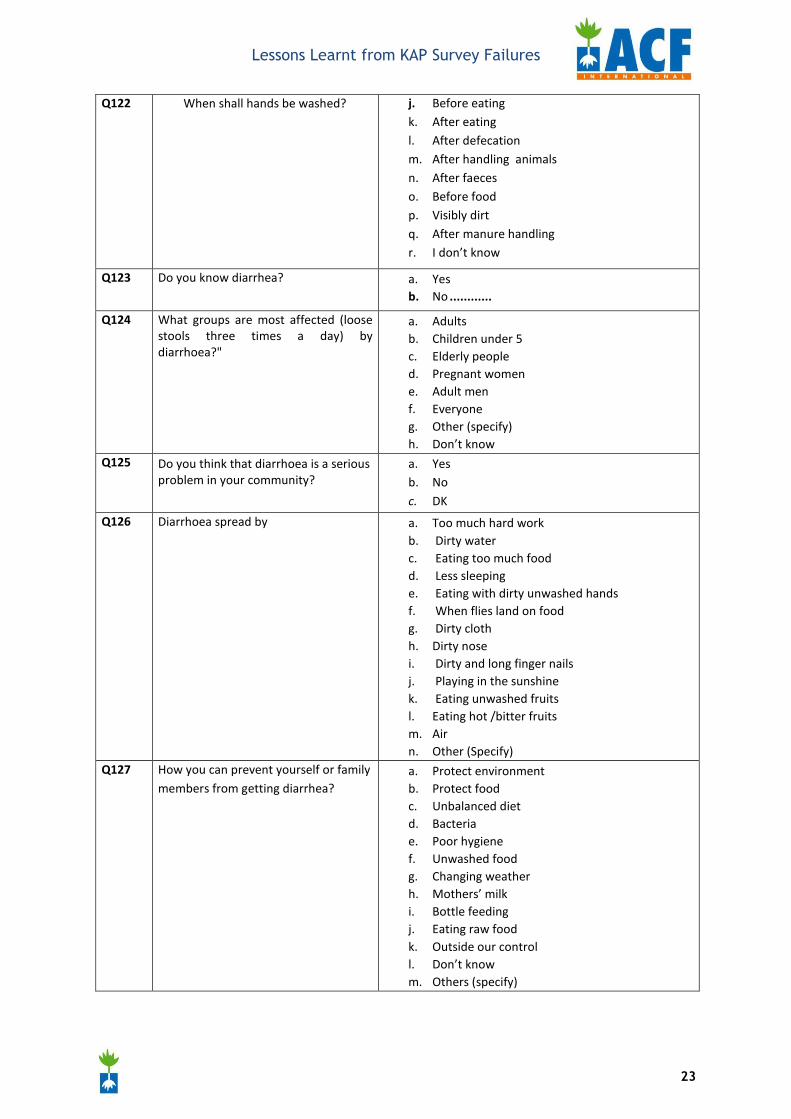
Lessons Learnt from KAP Survey Failures
23
Q122 When shall hands be washed?
j. Before eating k. After eating l. After defecation m. After handling animals n. After faeces o. Before food p. Visibly dirt q. After manure handling r. I don’t know
Q123 Do you know diarrhea? a. Yes b. No ............
Q124 What groups are most affected (loose stools three times a day) by diarrhoea?"
a. Adults b. Children under 5 c. Elderly people d. Pregnant women e. Adult men f. Everyone g. Other (specify) h. Don’t know
Q125 Do you think that diarrhoea is a serious problem in your community?
a. Yes b. No c. DK
Q126 Diarrhoea spread by
a. Too much hard work b. Dirty water c. Eating too much food d. Less sleeping e. Eating with dirty unwashed hands f. When flies land on food g. Dirty cloth h. Dirty nose i. Dirty and long finger nails j. Playing in the sunshine k. Eating unwashed fruits l. Eating hot /bitter fruits m. Air n. Other (Specify)
Q127 How you can prevent yourself or family members from getting diarrhea?
a. Protect environment b. Protect food c. Unbalanced diet d. Bacteria e. Poor hygiene f. Unwashed food g. Changing weather h. Mothers’ milk i. Bottle feeding j. Eating raw food k. Outside our control l. Don’t know m. Others (specify)
Lessons Learnt from KAP Survey Failures
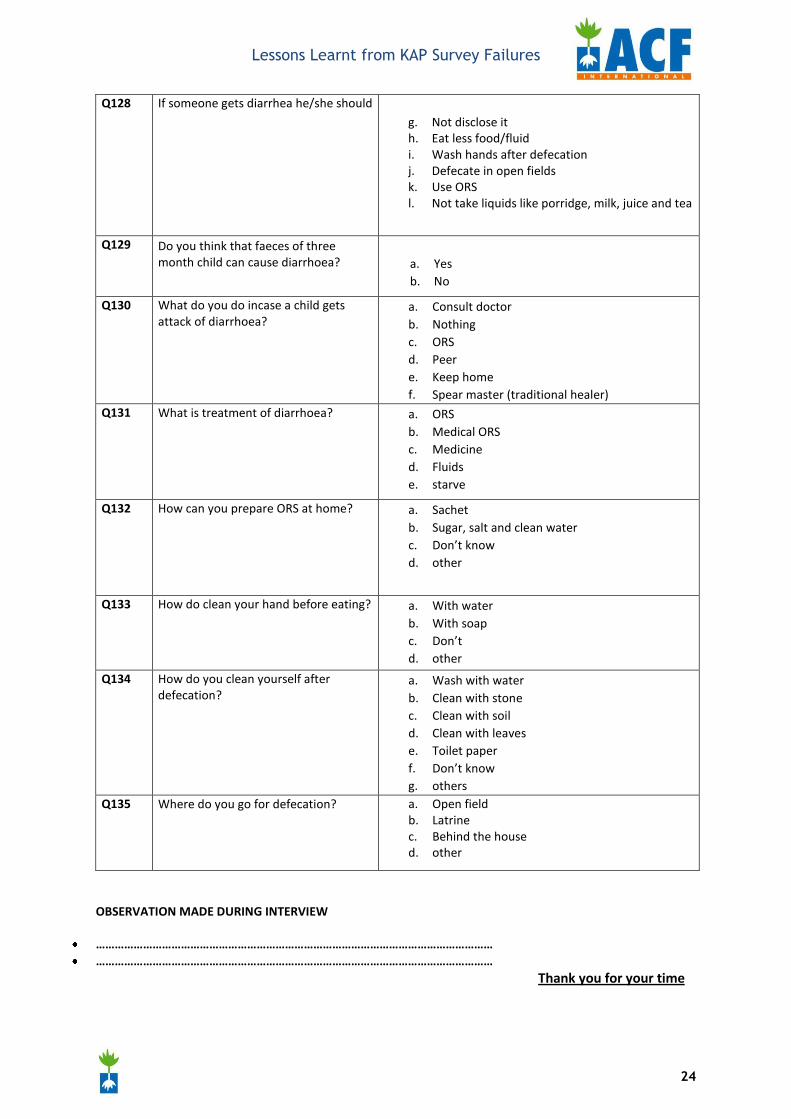
24
Q128 If someone gets diarrhea he/she should
g. Not disclose it h. Eat less food/fluid i. Wash hands after defecation j. Defecate in open fields k. Use ORS l. Not take liquids like porridge, milk, juice and tea
Q129 Do you think that faeces of three month child can cause diarrhoea?
a. Yes b. No
Q130 What do you do incase a child gets attack of diarrhoea?
a. Consult doctor b. Nothing c. ORS d. Peer e. Keep home f. Spear master (traditional healer)
Q131 What is treatment of diarrhoea? a. ORS b. Medical ORS c. Medicine d. Fluids e. starve
Q132 How can you prepare ORS at home? a. Sachet b. Sugar, salt and clean water c. Don’t know d. other
Q133 How do clean your hand before eating? a. With water b. With soap c. Don’t d. other
Q134 How do you clean yourself after defecation?
a. Wash with water b. Clean with stone c. Clean with soil d. Clean with leaves e. Toilet paper f. Don’t know g. others
Q135 Where do you go for defecation? a. Open field b. Latrine c. Behind the house d. other
OBSERVATION MADE DURING INTERVIEW
……………………………………………………………………………………………………………… ………………………………………………………………………………………………………………
Thank you for your time