conf2015 pdrieger milgen robotron iot ... - data...
TRANSCRIPT
Copyright © 2015 Splunk Inc.
Philipp Drieger Sales Engineer, Splunk
Save Energy with Splunk
MaBhias Ilgen Project Manager, Robotron
Leverage Process and Energy Data to OpImize Industrial Processes
Disclaimer
2
During the course of this presentaIon, we may make forward looking statements regarding future events or the expected performance of the company. We cauIon you that such statements reflect our current expectaIons and esImates based on factors currently known to us and that actual events or results could differ materially. For important factors that may cause actual results to differ from those contained in our forward-‐looking statements, please review our filings with the SEC. The forward-‐looking statements made in the this presentaIon are being made as of the Ime and date of its live presentaIon. If reviewed aUer its live presentaIon, this presentaIon may not contain current or
accurate informaIon. We do not assume any obligaIon to update any forward looking statements we may make.
In addiIon, any informaIon about our roadmap outlines our general product direcIon and is subject to change at any Ime without noIce. It is for informaIonal purposes only and shall not, be incorporated into any contract or other commitment. Splunk undertakes no obligaIon either to develop the features
or funcIonality described or to include any such feature or funcIonality in a future release.
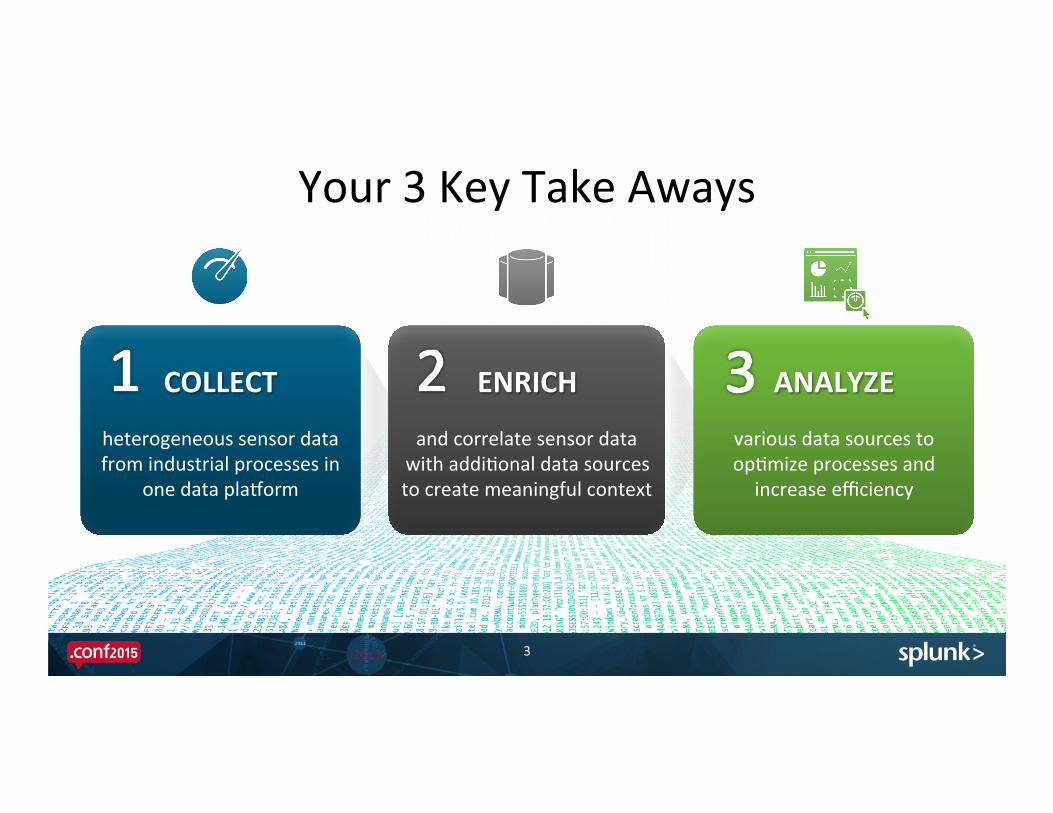
Your 3 Key Take Aways
3
ENRICH
and correlate sensor data with addiIonal data sources to create meaningful context
ANALYZE
various data sources to opImize processes and
increase efficiency
COLLECT
heterogeneous sensor data from industrial processes in
one data pla[orm

About us
4
MaBhias Ilgen (Robotron)
• Project manager and pre-‐sales engineer for business analyIcs
• Background in the area of informaIon retrieval, text -‐ and data mining
• Experience in various industry verIcals such as life-‐science healthcare, manufacturing and automoIve.
• ImplementaIon of complex IoT soluIons based on Splunk
Philipp Drieger (Splunk)
• Sales Engineer at Splunk
• Background in data visualizaIon, analyIcs and 3D soUware development
• Experience in various industry verIcals such as automoIve, transportaIon and soUware industries.
• Proven fast Ime to value with Splunk winning Deutsche Bahn hackathon

Facts about Robotron
• Methodical and technological responsibility • Comprehensive experIse of industry-‐specific business processes
• Number of employees (Robotron group): 450
Agenda
6
Splunk as a data pla[orm for industrial sensor data Bridging the gap: Combine energy and process data Use Case #1: Energy efficiency monitoring and opImizaIon Use Case #2: CondiIon monitoring and predicIve maintenance Conclusion & Outlook Q&A

Splunk as pla[orm for industrial and IoT data
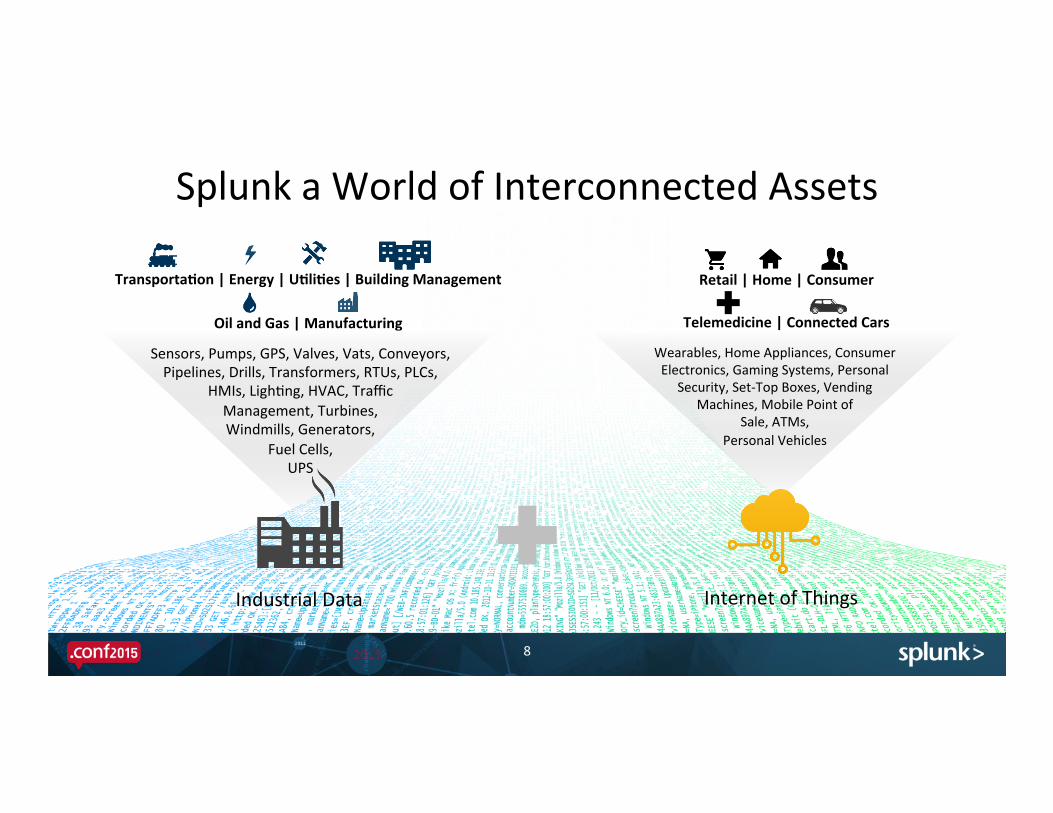
Splunk a World of Interconnected Assets
Internet of Things
Transporta5on | Energy | U5li5es | Building Management
Oil and Gas | Manufacturing Wearables, Home Appliances, Consumer Electronics, Gaming Systems, Personal
Security, Set-‐Top Boxes, Vending Machines, Mobile Point of
Sale, ATMs, Personal Vehicles
Sensors, Pumps, GPS, Valves, Vats, Conveyors, Pipelines, Drills, Transformers, RTUs, PLCs,
HMIs, LighIng, HVAC, Traffic Management, Turbines, Windmills, Generators,
Fuel Cells, UPS
8
Retail | Home | Consumer
Telemedicine | Connected Cars
Industrial Data
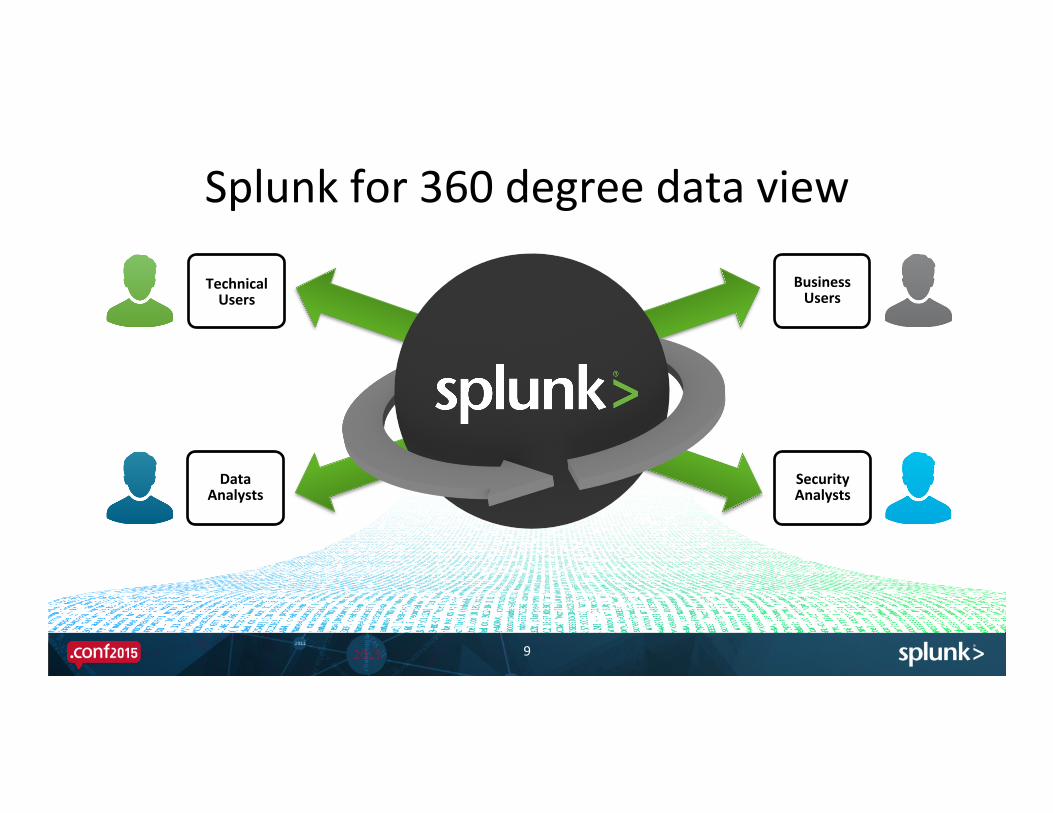
Splunk for 360 degree data view
9
Data
Analysts
Technical Users
Business Users
Security Analysts

Typical Workflow for Analyzing Sensor Data
10
COLLECT ENRICH ANALYZE
lookup data
data analyIcs
feedback loop
sensor data
middle ware
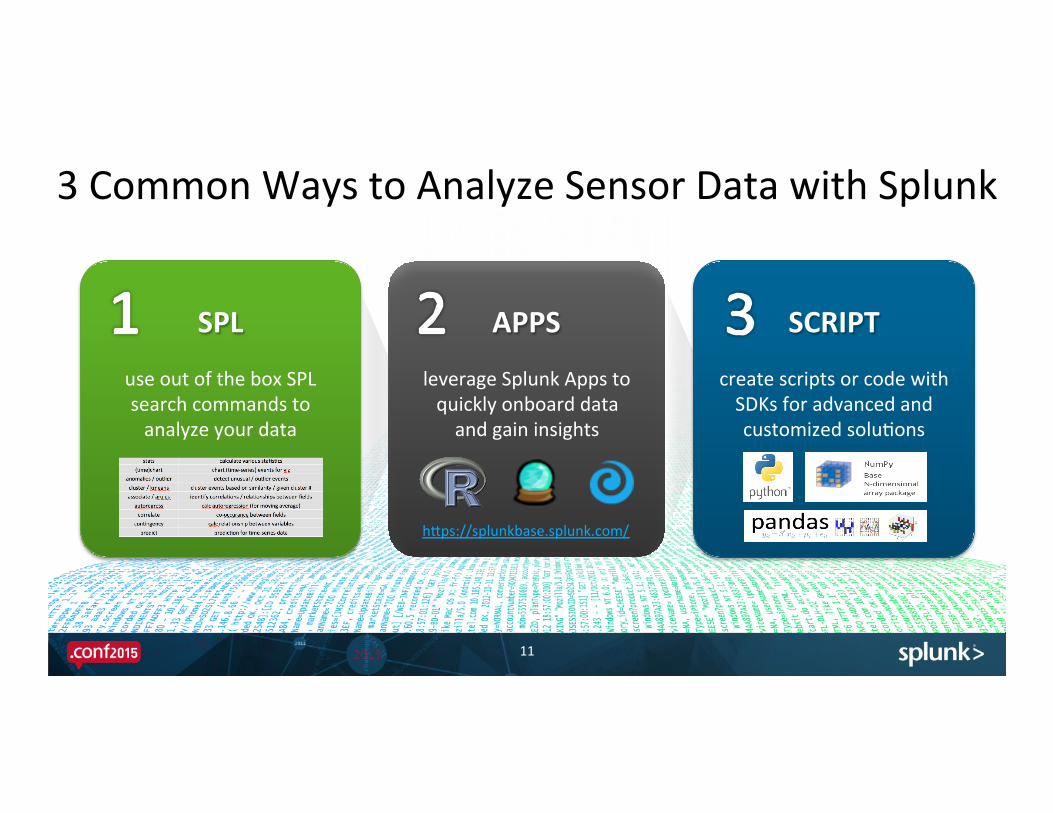
3 Common Ways to Analyze Sensor Data with Splunk
11
APPS
leverage Splunk Apps to quickly onboard data and gain insights
SCRIPT
create scripts or code with SDKs for advanced and customized soluIons
SPL
use out of the box SPL search commands to analyze your data
hBps://splunkbase.splunk.com/
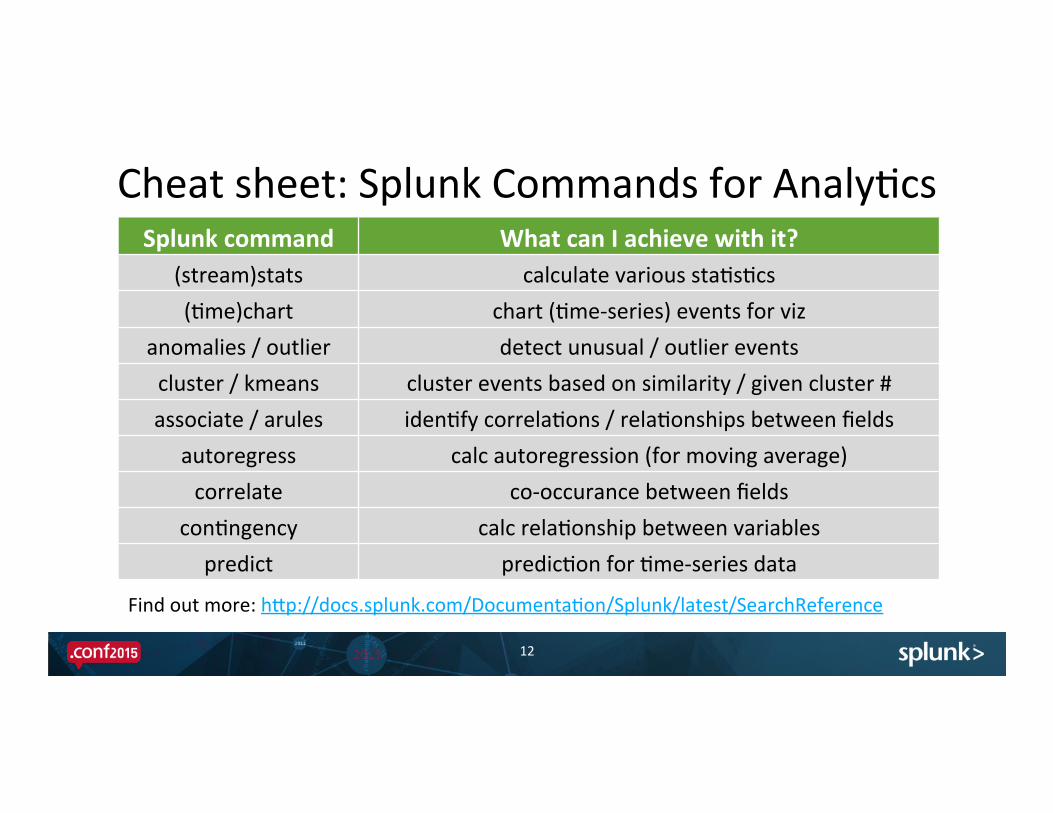
Cheat sheet: Splunk Commands for AnalyIcs
12
Splunk command What can I achieve with it? (stream)stats calculate various staIsIcs (Ime)chart chart (Ime-‐series) events for viz
anomalies / outlier detect unusual / outlier events cluster / kmeans cluster events based on similarity / given cluster # associate / arules idenIfy correlaIons / relaIonships between fields
autoregress calc autoregression (for moving average) correlate co-‐occurance between fields
conIngency calc relaIonship between variables predict predicIon for Ime-‐series data
Find out more: hBp://docs.splunk.com/DocumentaIon/Splunk/latest/SearchReference

Energy Data & Process Data
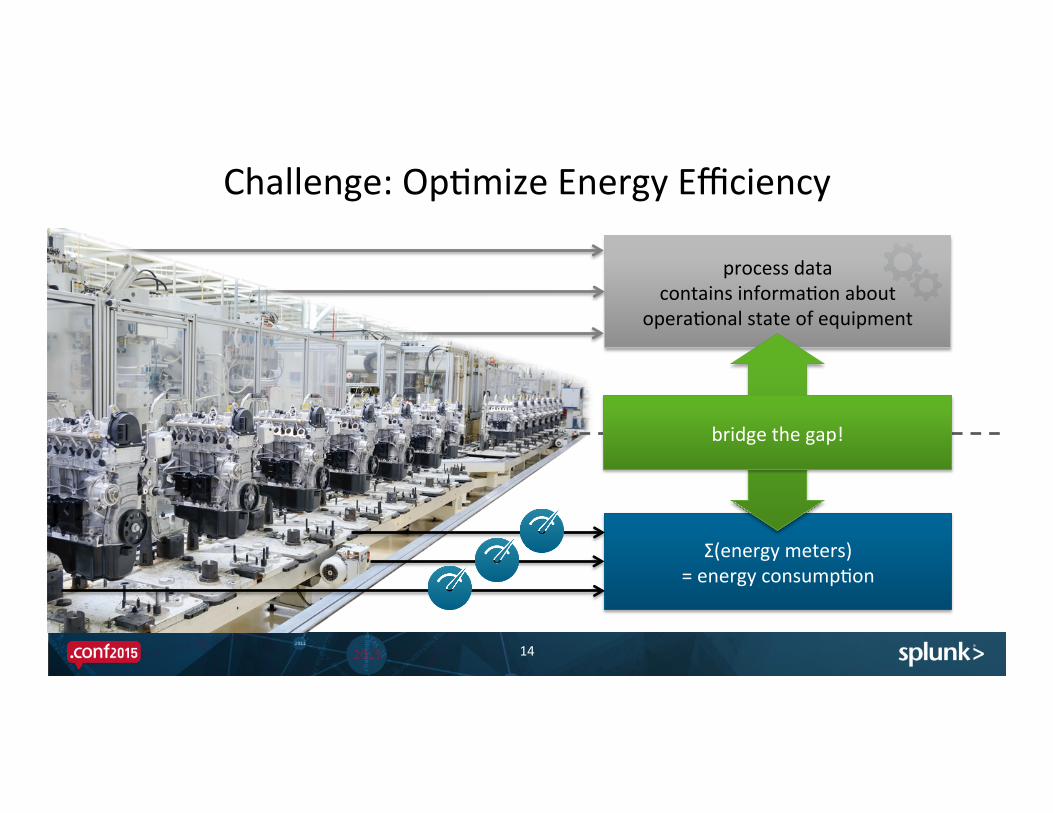
process data contains informaIon about
operaIonal state of equipment
Challenge: OpImize Energy Efficiency
14
Σ(energy meters) = energy consumpIon
bridge the gap!

What is…
15
Category Energy Data Process Data
Time Equidistant Ime series Process event based
Type Sensor data Control data, sensor data
SemanIcs Energy metrics Equipment behavior
Source Energy logger, Equipment, EDM SPS, SCADA, HMI, …
Format Variety of formats Variety of formats
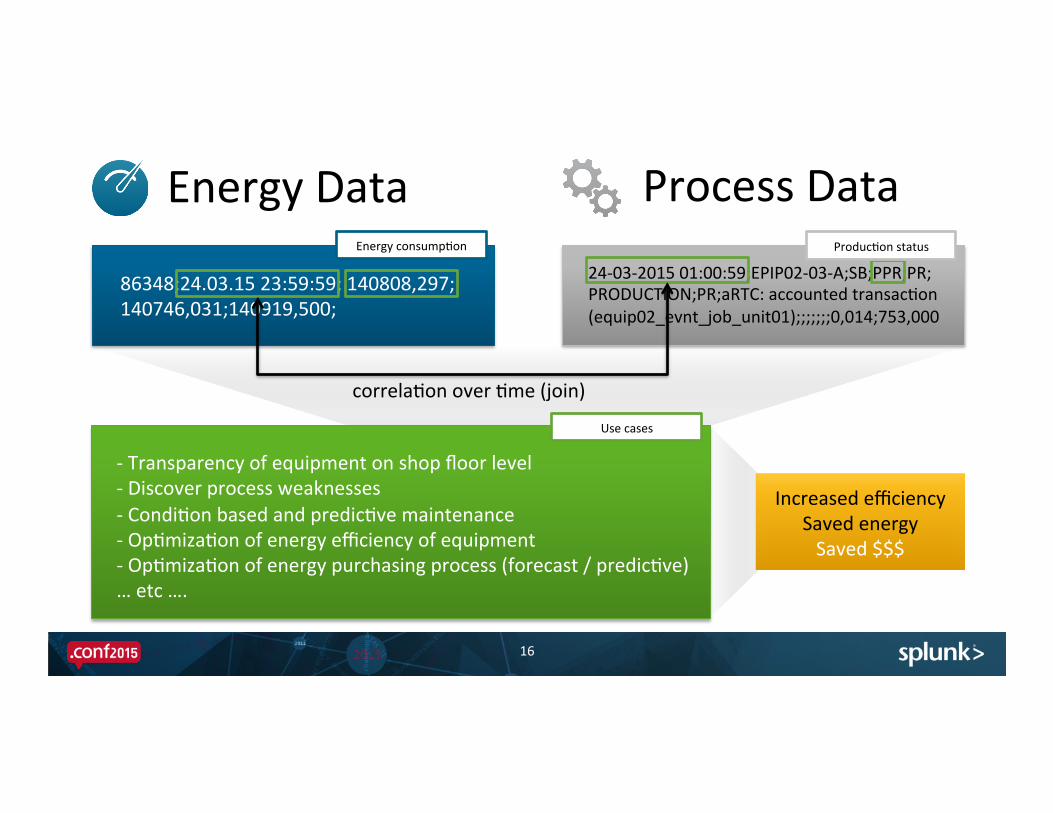
Energy Data
16
Process Data
86348;24.03.15 23:59:59; 140808,297; 140746,031;140919,500;
24-‐03-‐2015 01:00:59;EPIP02-‐03-‐A;SB;PPR;PR; PRODUCTION;PR;aRTC: accounted transacIon (equip02_evnt_job_unit01);;;;;;;0,014;753,000
correlaIon over Ime (join)
ProducIon status Energy consumpIon
-‐ Transparency of equipment on shop floor level -‐ Discover process weaknesses -‐ CondiIon based and predicIve maintenance -‐ OpImizaIon of energy efficiency of equipment -‐ OpImizaIon of energy purchasing process (forecast / predicIve) … etc ….
Increased efficiency Saved energy Saved $$$
Use cases

Energy Efficiency Monitoring & OpImizaIon
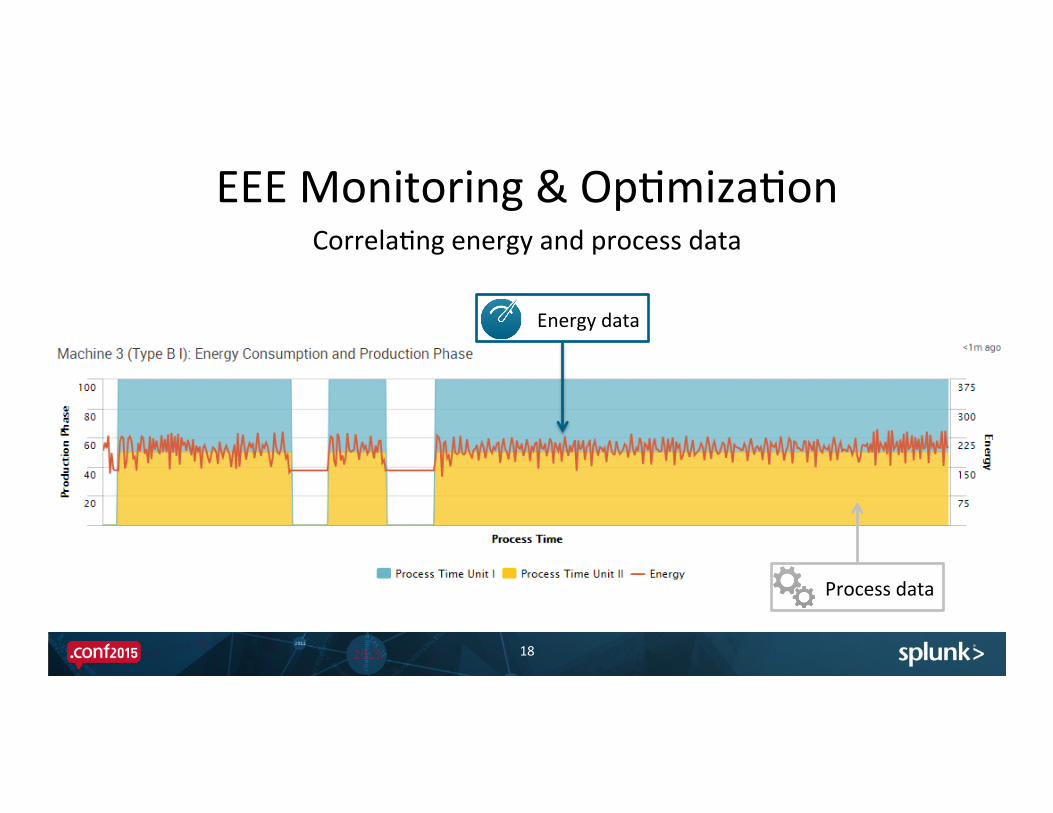
EEE Monitoring & OpImizaIon
18
CorrelaIng energy and process data
Energy data
Process data

Energy Efficiency Monitoring
OpImizaIon of energy efficiency for producIon ReducIon of energy consumpIon of non-‐value-‐adding acIviIes OpImizaIon of producIon schedule of similar equipment ReducIon of specific energy consumpIon per produced item
Energy Efficiency of Equipment (EEE) = Σ(value-‐added energy consumpIon)
Σ(total energy consumpIon)

Energy Efficiency of Equipment (EEE)
20
High Level Overview: Finding efficiency issues at a glance
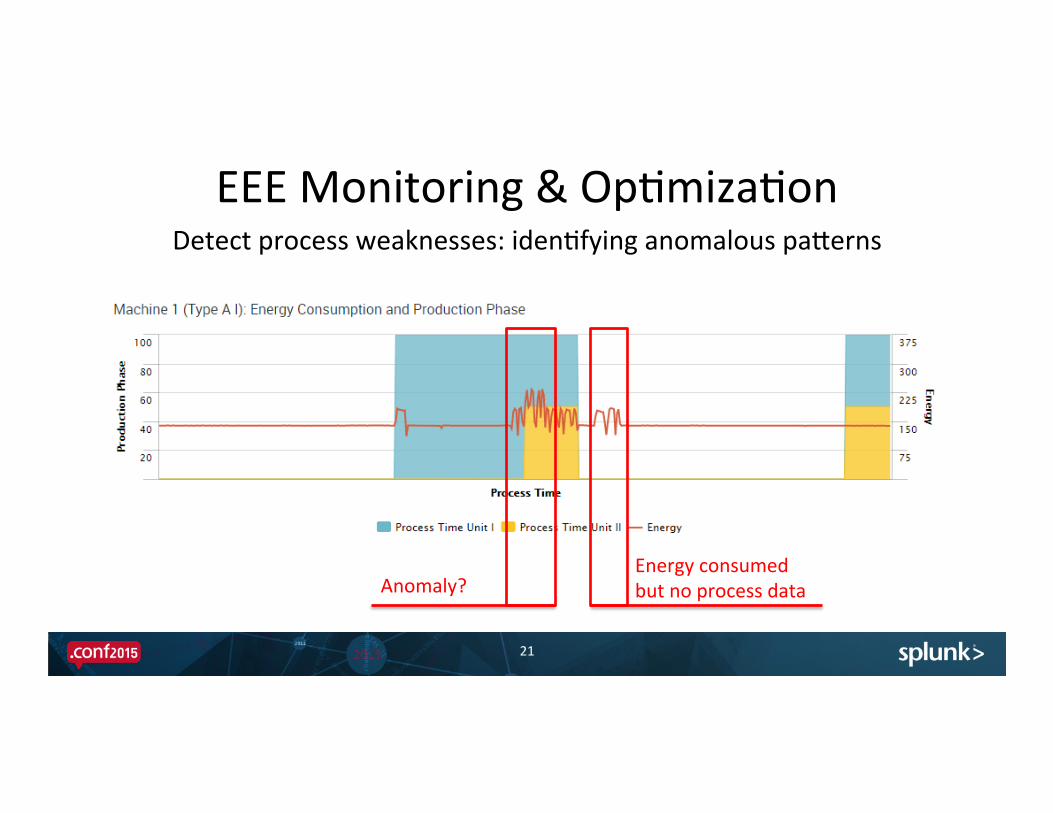
EEE Monitoring & OpImizaIon
21
Anomaly? Energy consumed but no process data
Detect process weaknesses: idenIfying anomalous paBerns
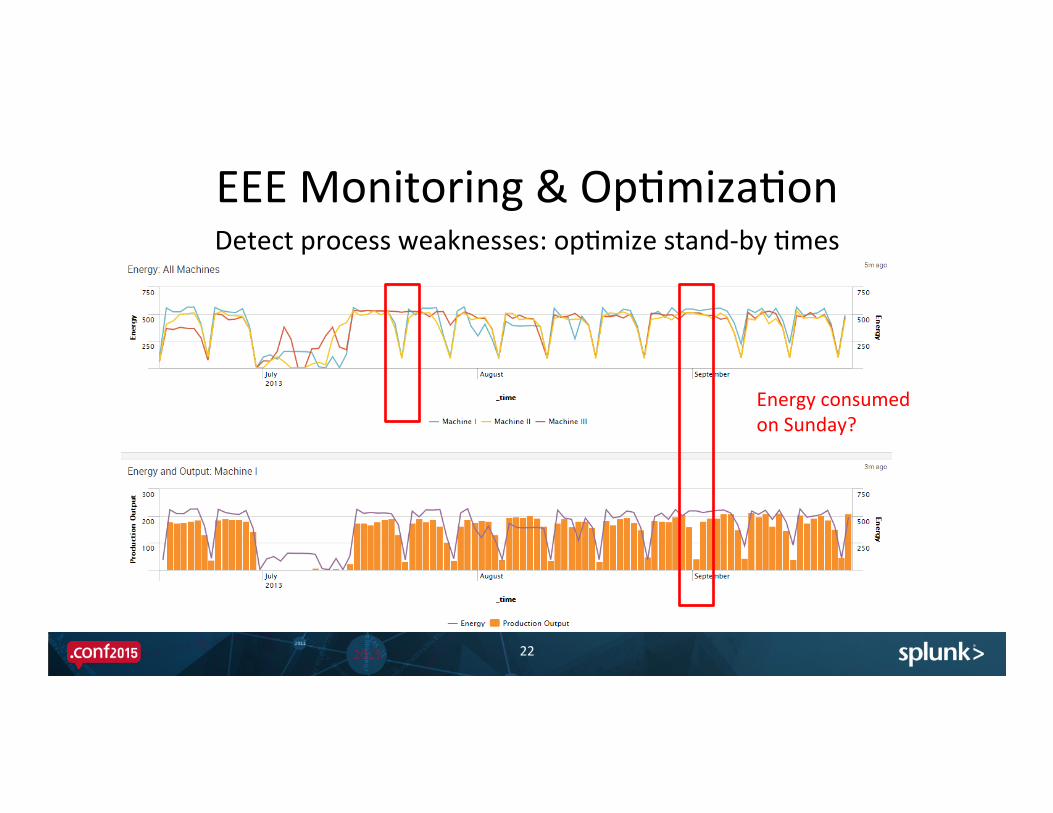
EEE Monitoring & OpImizaIon
22
Detect process weaknesses: opImize stand-‐by Imes
Energy consumed on Sunday?
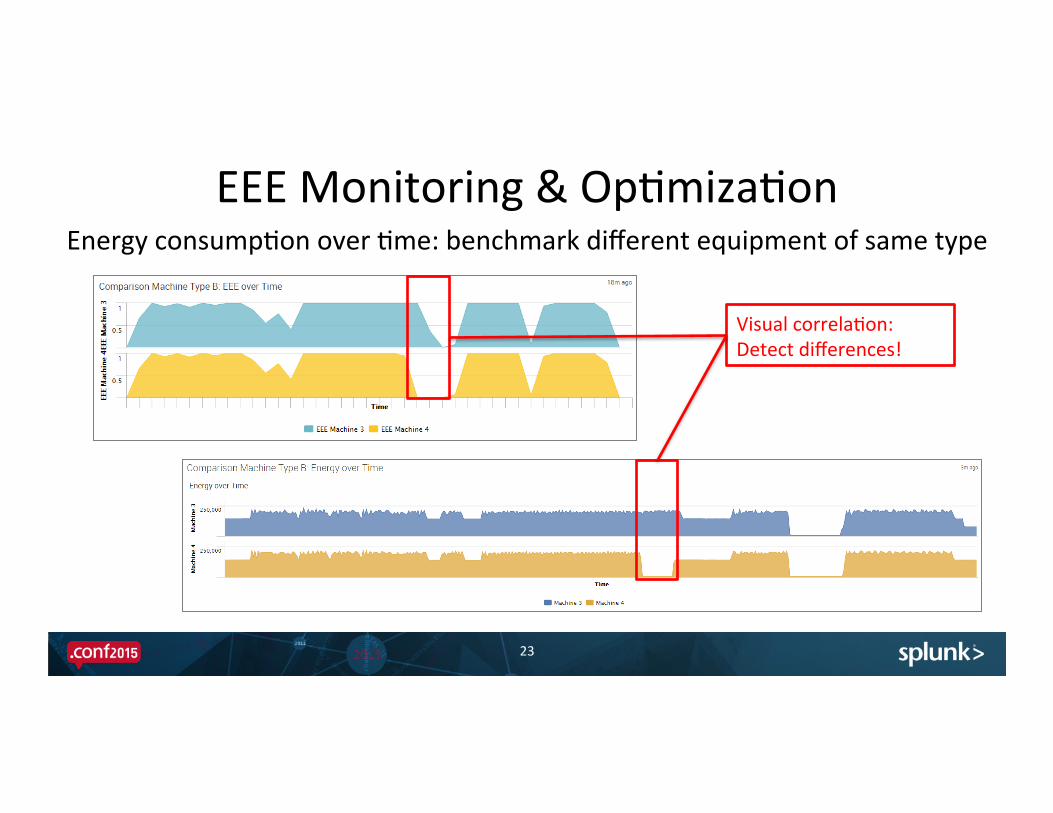
EEE Monitoring & OpImizaIon
23
Energy consumpIon over Ime: benchmark different equipment of same type
Visual correlaIon: Detect differences!
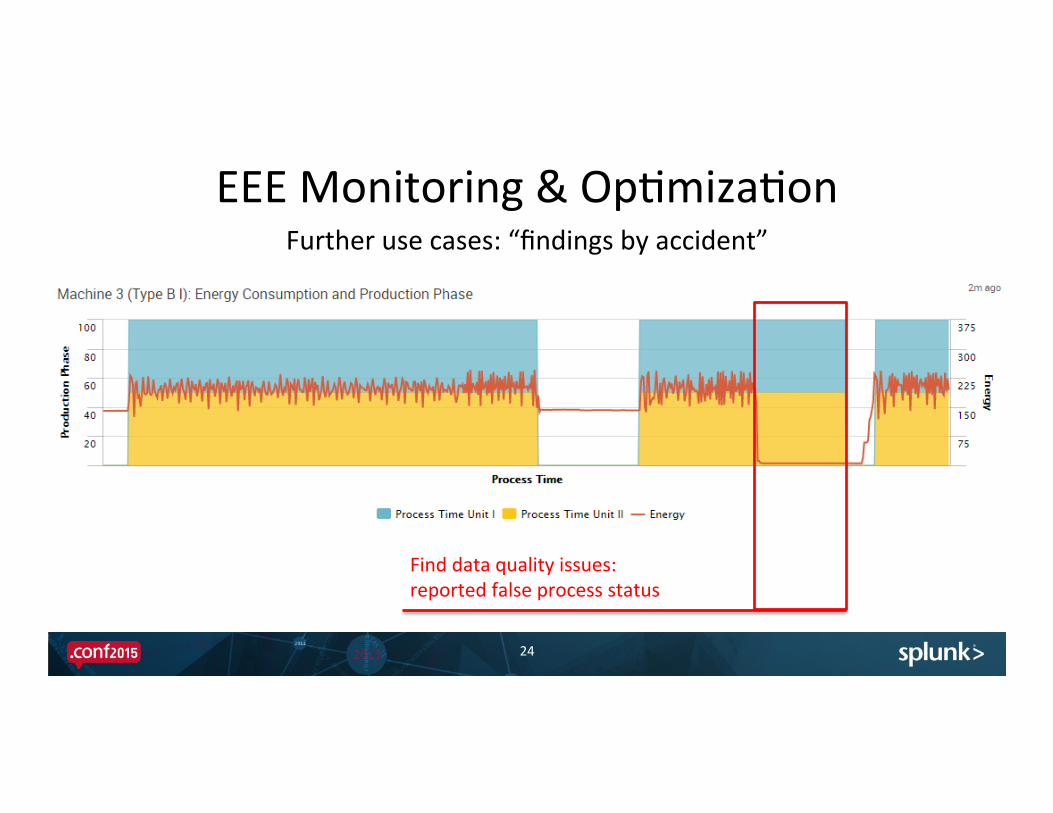
EEE Monitoring & OpImizaIon
24
Further use cases: “findings by accident”
Find data quality issues: reported false process status

Energy Savings
25
Consumed Energy saved
Lower energy consumpIon
10%
Energy consumpIon
before opImizaIon
Up to 25% per facility Repeatable opImizaIon process for similar plants
25% save Depending on local energy prices savings of 2.5M EUR are projected p.a. per assembly line

CondiIon Monitoring & PredicIve Maintenance

Energy and process data for maintenance
Energy not just a opImizaIon target – but also an influencing factor for maintenance scenarios (rapid impact factor)
Map low level process status to parIcular energy consumpIon profiles and learn normal states and boundaries from raw signal
A B C D

CondiIon Monitoring & AlerIng
28
Anomaly detecIon and proacIve monitoring
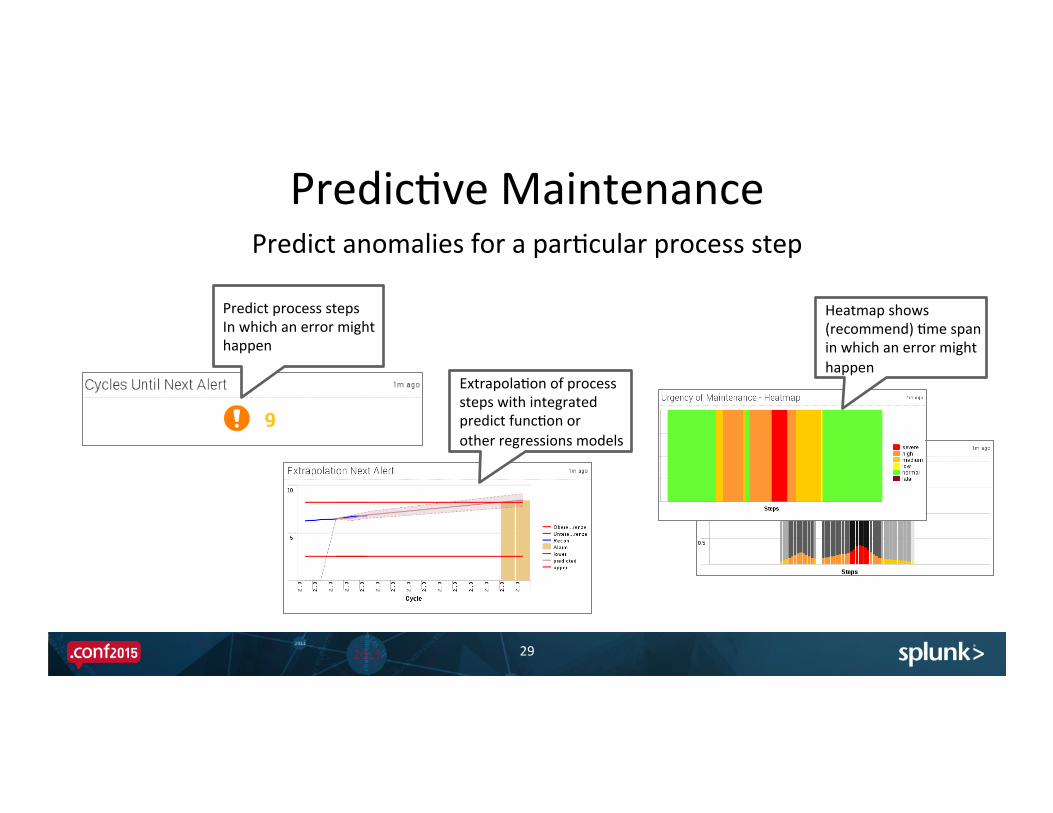
PredicIve Maintenance Predict anomalies for a parIcular process step
29
Heatmap shows (recommend) Ime span in which an error might happen
Predict process steps In which an error might happen
ExtrapolaIon of process steps with integrated predict funcIon or other regressions models

Outcome and Outlook
Summary & Outlook
31
Generic and equipment-‐independent approach No data transformaIon and model mapping in advance Applicable for “old” equipment (without parIcular sensor installaIon) Out-‐of-‐the-‐Box Splunk data models for energy and process data 360° view -‐ several kinds of visualizaIons Own Splunk commands for numeric operaIons and machine learning Enhanced Ime series forecasIng for opImizaIon of energy purchasing

Robotron Architecture for Industrial Data Analysis
32
Raw sensor data
Robotron Switching Server lookup, process data
and other machine data
data analysis using SPL, R and Python
explore connect geomap maintain analyze predict
Common InformaIon Model for IoT purposes
model
analysts security business technical

THANK YOU MaBhias Ilgen Project Manager, Robotron Dresden, Germany [email protected]
Philipp Drieger Sales Engineer, Splunk Munich, Germany [email protected]
Meet me @ IoT Pavillon!